Article

The Effect of Down-Cascade Re-Regulation on Alleviating the Flow Regime Alteration Induced by an Up-Cascade Reservoir

1
China Energy Dadu River Big Data Services Corporation Limited, Chengdu 610065, China
2
College of Environment and Resources, Yangtze University, Wuhan 430100, China
3
Department of Global Ecology, Carnegie Institution for Science, Stanford, CA 94305, USA
4
China Three Gorges Corporation, Yichang 443133, China
5
State Key Laboratory of Water Resources and Hydropower Engineering Science, Wuhan University, Wuhan 430072, China
6
China Institute of Water Resources and Hydropower Research, Beijing 100038, China
*
Author to whom correspondence should be addressed.
Water 2023, 15(12), 2166; https://doi.org/10.3390/w15122166
Submission received: 27 April 2023 / Revised: 31 May 2023 / Accepted: 2 June 2023 / Published: 8 June 2023
(This article belongs to the Section Water Resources Management, Policy and Governance)

Abstract

:
An analysis of the effect on the flow regime caused by reservoir operation is crucial to balancing the exploitation and protection of water resources. The long-term effect of this on the intraday scale and small storage capacity is considerable, but rarely analyzed. This study examines the world’s largest dual-cascade hydro-junction, the Three Gorges Dam and Gezhouba Dam junction, as a case study, adopting eight indices to characterize the reservoir’s inflow and outflow fluctuation. In doing this, we evaluate the alteration of the flow regime induced by an up-cascade reservoir and its alleviation caused by the down-cascade re-regulation. The results show: (1) an increment of the river flow fluctuation at the Three Gorges Dam, matched with hourly scale alleviation at the Gezhouba Dam; (2) a reduction (25.09~41.35%) in the quantitative indices of the river flow regime fluctuation; (3) perturbations on the power output. These findings provide references for developing methods to assess the re-regulation mechanisms in systems with upper- and lower-cascades.

1. Introduction

Reservoir facilities provide human access to water resources and induce environmental impacts by impeding the movement of aquatic organisms, changing the flow regimes, and altering the habitat [1]. In addition to providing power production [2], reservoir facilities also commonly fulfill other functions, such as flood mitigation [3] and water supply [4]. Given that the human requirement for water resources is usually regular, while the nature of river flow is random [5], a trade-off between the human regulation of reservoirs and the natural flow regime is inevitable. In recent decades, natural and anthropogenic modifications to climate drivers, in conjunction with landscape changes, have led to increasingly nonstationary flow regimes [6]. As the hydrological regime of a river can strongly influence aquatic ecosystems, human-induced changes in the river regime can threaten the structure and sustainability of aquatic communities [7]. Fortunately, re-regulation, understood in this study as the buffer capacity to temporarily store and discharge the water flow, is an effective way to alleviate alterations in the river flow regime caused by reservoir regulation [8]. This study aimed to assess the effect of re-regulation on alleviating the flow regime alteration caused by an up-cascade reservoir.
The more frequent the reservoir regulation, the more severe the alteration to the river flow. Consequently, further re-regulation could be needed to alleviate the disturbance to the river flow regime. The ecosystem impact and the re-regulation operation are affected by the combined action of climate variability and the management of upstream reservoirs [9]. With various regulation patterns of the reservoir (e.g., flood mitigation or power generation) or under different hydrological conditions (e.g., high- and low-flow), the abovementioned reaction changes. For the sake of adequately balancing the disturbed river flow via re-regulation, it is necessary to study the re-regulation mechanism of reservoirs.
As the third longest and ninth largest river on Earth, the Yangtze River serves as a link between nature and humans in China [10]. Upstream of the Yangtze River, there are at least 19,426 reservoirs with ~190 GW installed capacity [11]. The Three Gorges Dam (TGD) and Gezhouba Dam (GD) hydro-system is the largest and last hydro-junction in the Yangtze River. The TGD, as the up-cascade in the hydro-junction, dispatches the water flow as required to accomplish anthropogenic water uses (e.g., power generation, shipping, and water resource utilization [12]), while the GD, the down-cascade, is assigned to re-regulating the disturbed outflow of the TGD (i.e., alleviate the river flow fluctuation) in order to guarantee shipping flow safety and to protect the ecosystem while ensuring power generation stays within the desired ranges. The flow regime alteration and alleviation at the TGD–GD hydro-junction adequately represents the trade-offs between water use and environmental protection.
The impact of the TGD–GD hydro-junction on the hydrological regime (e.g., sediment, habitats, and streamflow) has been investigated before. Conducting a sediment budget analysis, Yang et al. [13] pointed out that, influenced by the TGD, significant erosion occurred in the downstream riverbed and led to a conversion from progradation to recession in the delta front. When assessing river habitats, the effects of dam construction on the spawning grounds of Chinese Sturgeon in the TGD are more apparent than those in the GD [14]. A multifractal detrended analysis of a long, daily streamflow series found that the streamflow fluctuated less after the construction of the GD [15]. Wang et al. [16] pointed out that the main driver of decadal lake decline across the Yangtze Plain is climate variability, not TGD regulation. Recently, a number of large reservoir clusters (including the TGD and GD) have been built upstream of the Yangtze River. The results of the study on cascaded dam development on the natural flow in the Yangtze River upstream indicated that the gap between the low- and high-flow decreases due to more reservoirs being brought into service, while the minimum and optimal ecological flow cannot be guaranteed during the fish spawning period [17].
As aforementioned, the GD is assigned to re-regulate the outflow of the TGD. With limited storage capacity, the GD is mostly simplified as a run-of-river hydropower facility that does not alter the river flow. However, in real operation, the GD functions persistently, especially in the intra-day range (mainly on the hourly scale). Reflecting on the real-life operation yields, some interesting questions arise: is it appropriate to ignore the re-regulation function of the down-cascade because of its small storage capacity? What is the long-term effect of the intra-day re-regulation on alleviating the flow regime alteration? To the best of our knowledge, the answers to these questions have not yet been thoroughly examined. Aiming at these problems, this study endeavors to assess the GD re-regulation effect on the flow regime alteration induced by the TGD, examining eight years of hourly data resulting from the real operation of the TGD–GD hydro-junction.
The main conclusions of this work are: (1) the re-regulation at the GD is noticeable at the hourly scale; (2) the contoured fluctuation is alleviated more than the quantitative fluctuation; and (3) re-regulation also partially causes perturbations on the power output. The remainder of this paper is organized as follows. Section 2 presents a description of the methods used to assess the fluctuation. Section 3 introduces a description of the case study. Section 4 and Section 5 describe the results, discussion, and conclusions of the study.

2. Methods

In order to assess the re-regulation effect on the flow regime, it is necessary to characterize the river flow fluctuation. A number of indices have been proposed throughout the last few decades that are useful for this purpose, including the Indicators of Hydrological Alteration (IHA, [18]), the Range of Variability Approach (RVA, [19]), the Richards–Baker Flashiness Index (RBF, [20]), and eco-flow metrics [21], among others. These indices can be classified into quantitative and contour [22]. The former is focused on the ordinate values, without counting the time element (i.e., the abscissa values), in terms of the first-order difference [23], peak valley difference [24], standard deviation [25], coefficient of variation [26], normalized standard deviation [27], or their combination [28]. The quantitative type does not commonly characterize the horizontal fluctuation due to neglecting the abscissa value of the fluctuant process. For example, the standard deviation values of two identical sinusoidal processes, but with different periods (e.g., one is 1 PI, the other is 2 PI), are almost the same; however, it is obvious that the one with a shorter period is more fluctuant. The latter—that is, the contour indices—takes the time element into consideration and mainly describes the shape of the process, such as its slope [29], rotation angle [30], or length [31]. The contoured type does count the horizontal fluctuation, but its calculation formula is complex; thus, it is usually employed when the variation rate or the shape of the process is concerned.
More recently, the Mei–Wang Fluctuation (MWF) index was introduced, compounding the standard deviation and rotation angle to detect the quantitative and contour variations simultaneously [22]. The MWF index has been applied in characterizing fluctuations in the power output in multi-renewable energy integration [32,33] and the variations in the flow regime in a rainfall-driven river [34]. In terms of the methods to quantify the fluctuation, the advantage is that the previous studies have proposed many indices, while the shortcoming is also apparent, which is that most studies only employ or propose one index to quantify the fluctuation.
This paper uses eight commonly used fluctuation indices, and based on hourly measured operation data, investigates the alleviation effect of reservoir re-regulation on the river flow regime. The four quantitative type indices used in the study are: standard deviation (SD, depicting the dispersion), the first-order difference (FOD, depicting the difference of adjacent points), the coefficient of variation (CV, depicting the relative dispersion), and the Richard-Baker Flashiness (RBF, depicting the relative difference of adjacent points). The four contoured-type indices used in the study are: rotation angle (RA, depicting the change of variation tendence), length (LT, depicting the length of variation process), number of inflection (NI, depicting the switch number of variation direction), and slope (SL, depicting the rate of variation change). It should be noted that there are no strict selection criteria for determining the abovementioned indices.
Taking the time series with the coordinates of N points (xi, yi) as an example, the functions of the eight indices above are introduced in Table 1 and Table 2. It should be noted that the number of the points is N, the abscissa of the time series is time, and 1 unit of abscissa means 1 day.
To formulate the process of calculating the fluctuation of the river flow, a model is built as follows:
F = f
where F is the model output corresponding to the river flow fluctuation (e.g., the symbols listed in Table 1 and Table 2), f (•) is the functions applied to calculate the fluctuation (as listed in Table 1 and Table 2), and • is the input of this model, corresponding to the coordinates where the river flow will be evaluated.
The process of calculating the river flow fluctuation is shown in Figure 1.
(1)
Quantitative type
The functions of SD, FOD, CV, and RBF are shown in Table 1.
(2)
Contoured type
The functions of RA, LT, NI, and SL are shown in Table 2.
(3)
Calculating the river flow fluctuation
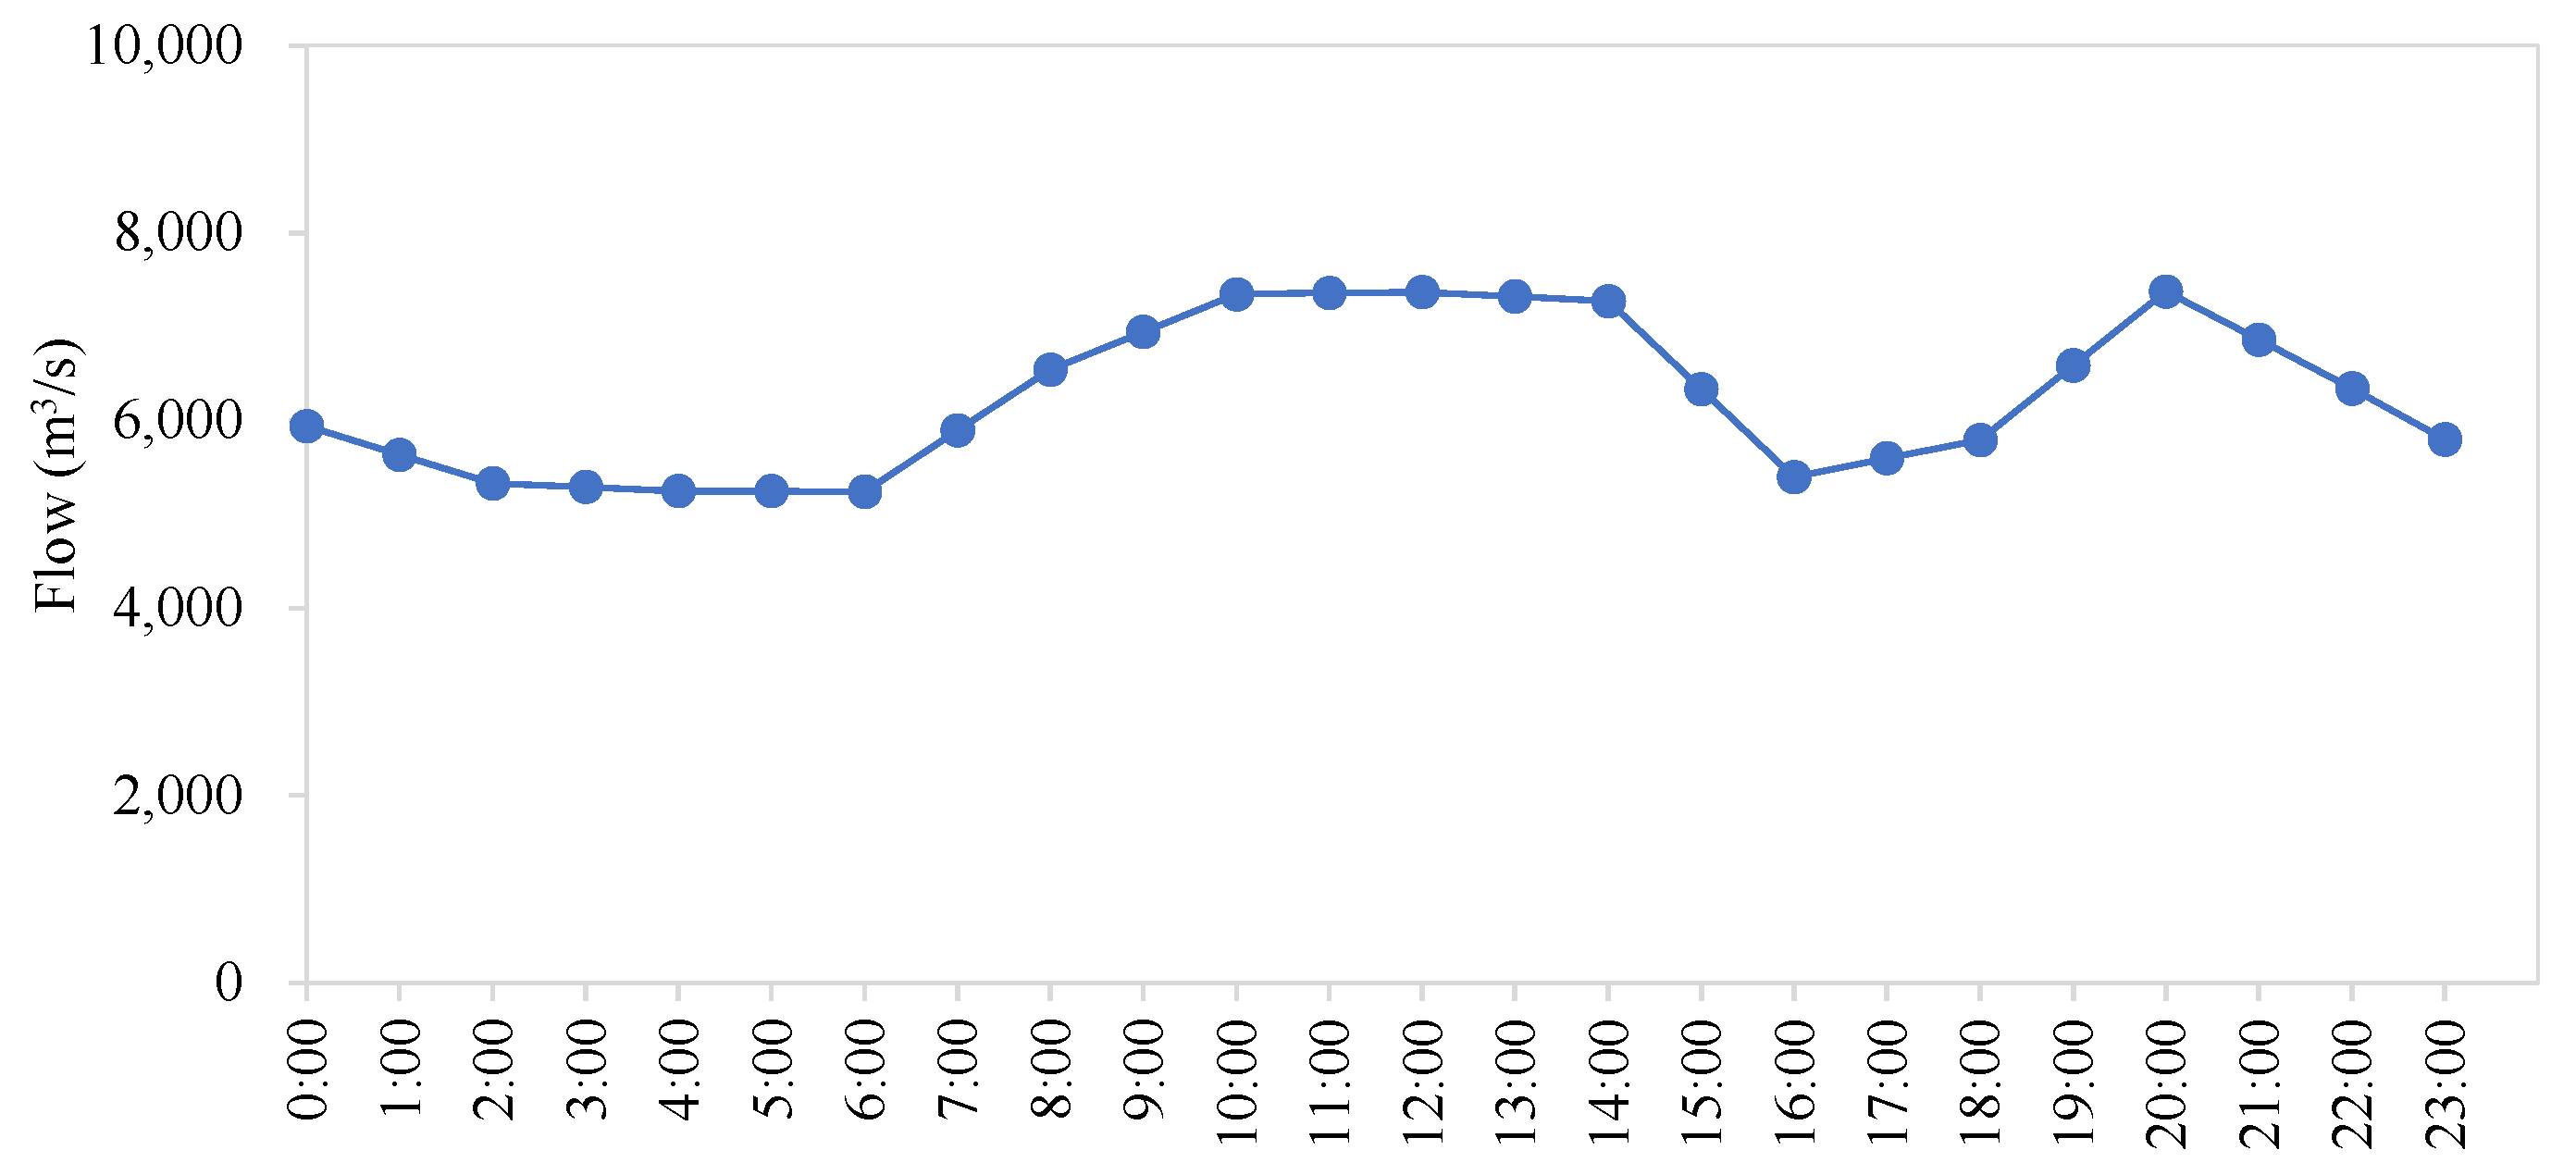
Using the hourly river flow in one day (displayed in Figure 2) as an example, and the value of (xi, yi) listed in Table 3, the fluctuation values of the river flow in Figure 2 are calculated and shown in Table 4.
River flow fluctuation is calculated based on the data of the river flow and the functions listed in Table 3.

3. Case Study

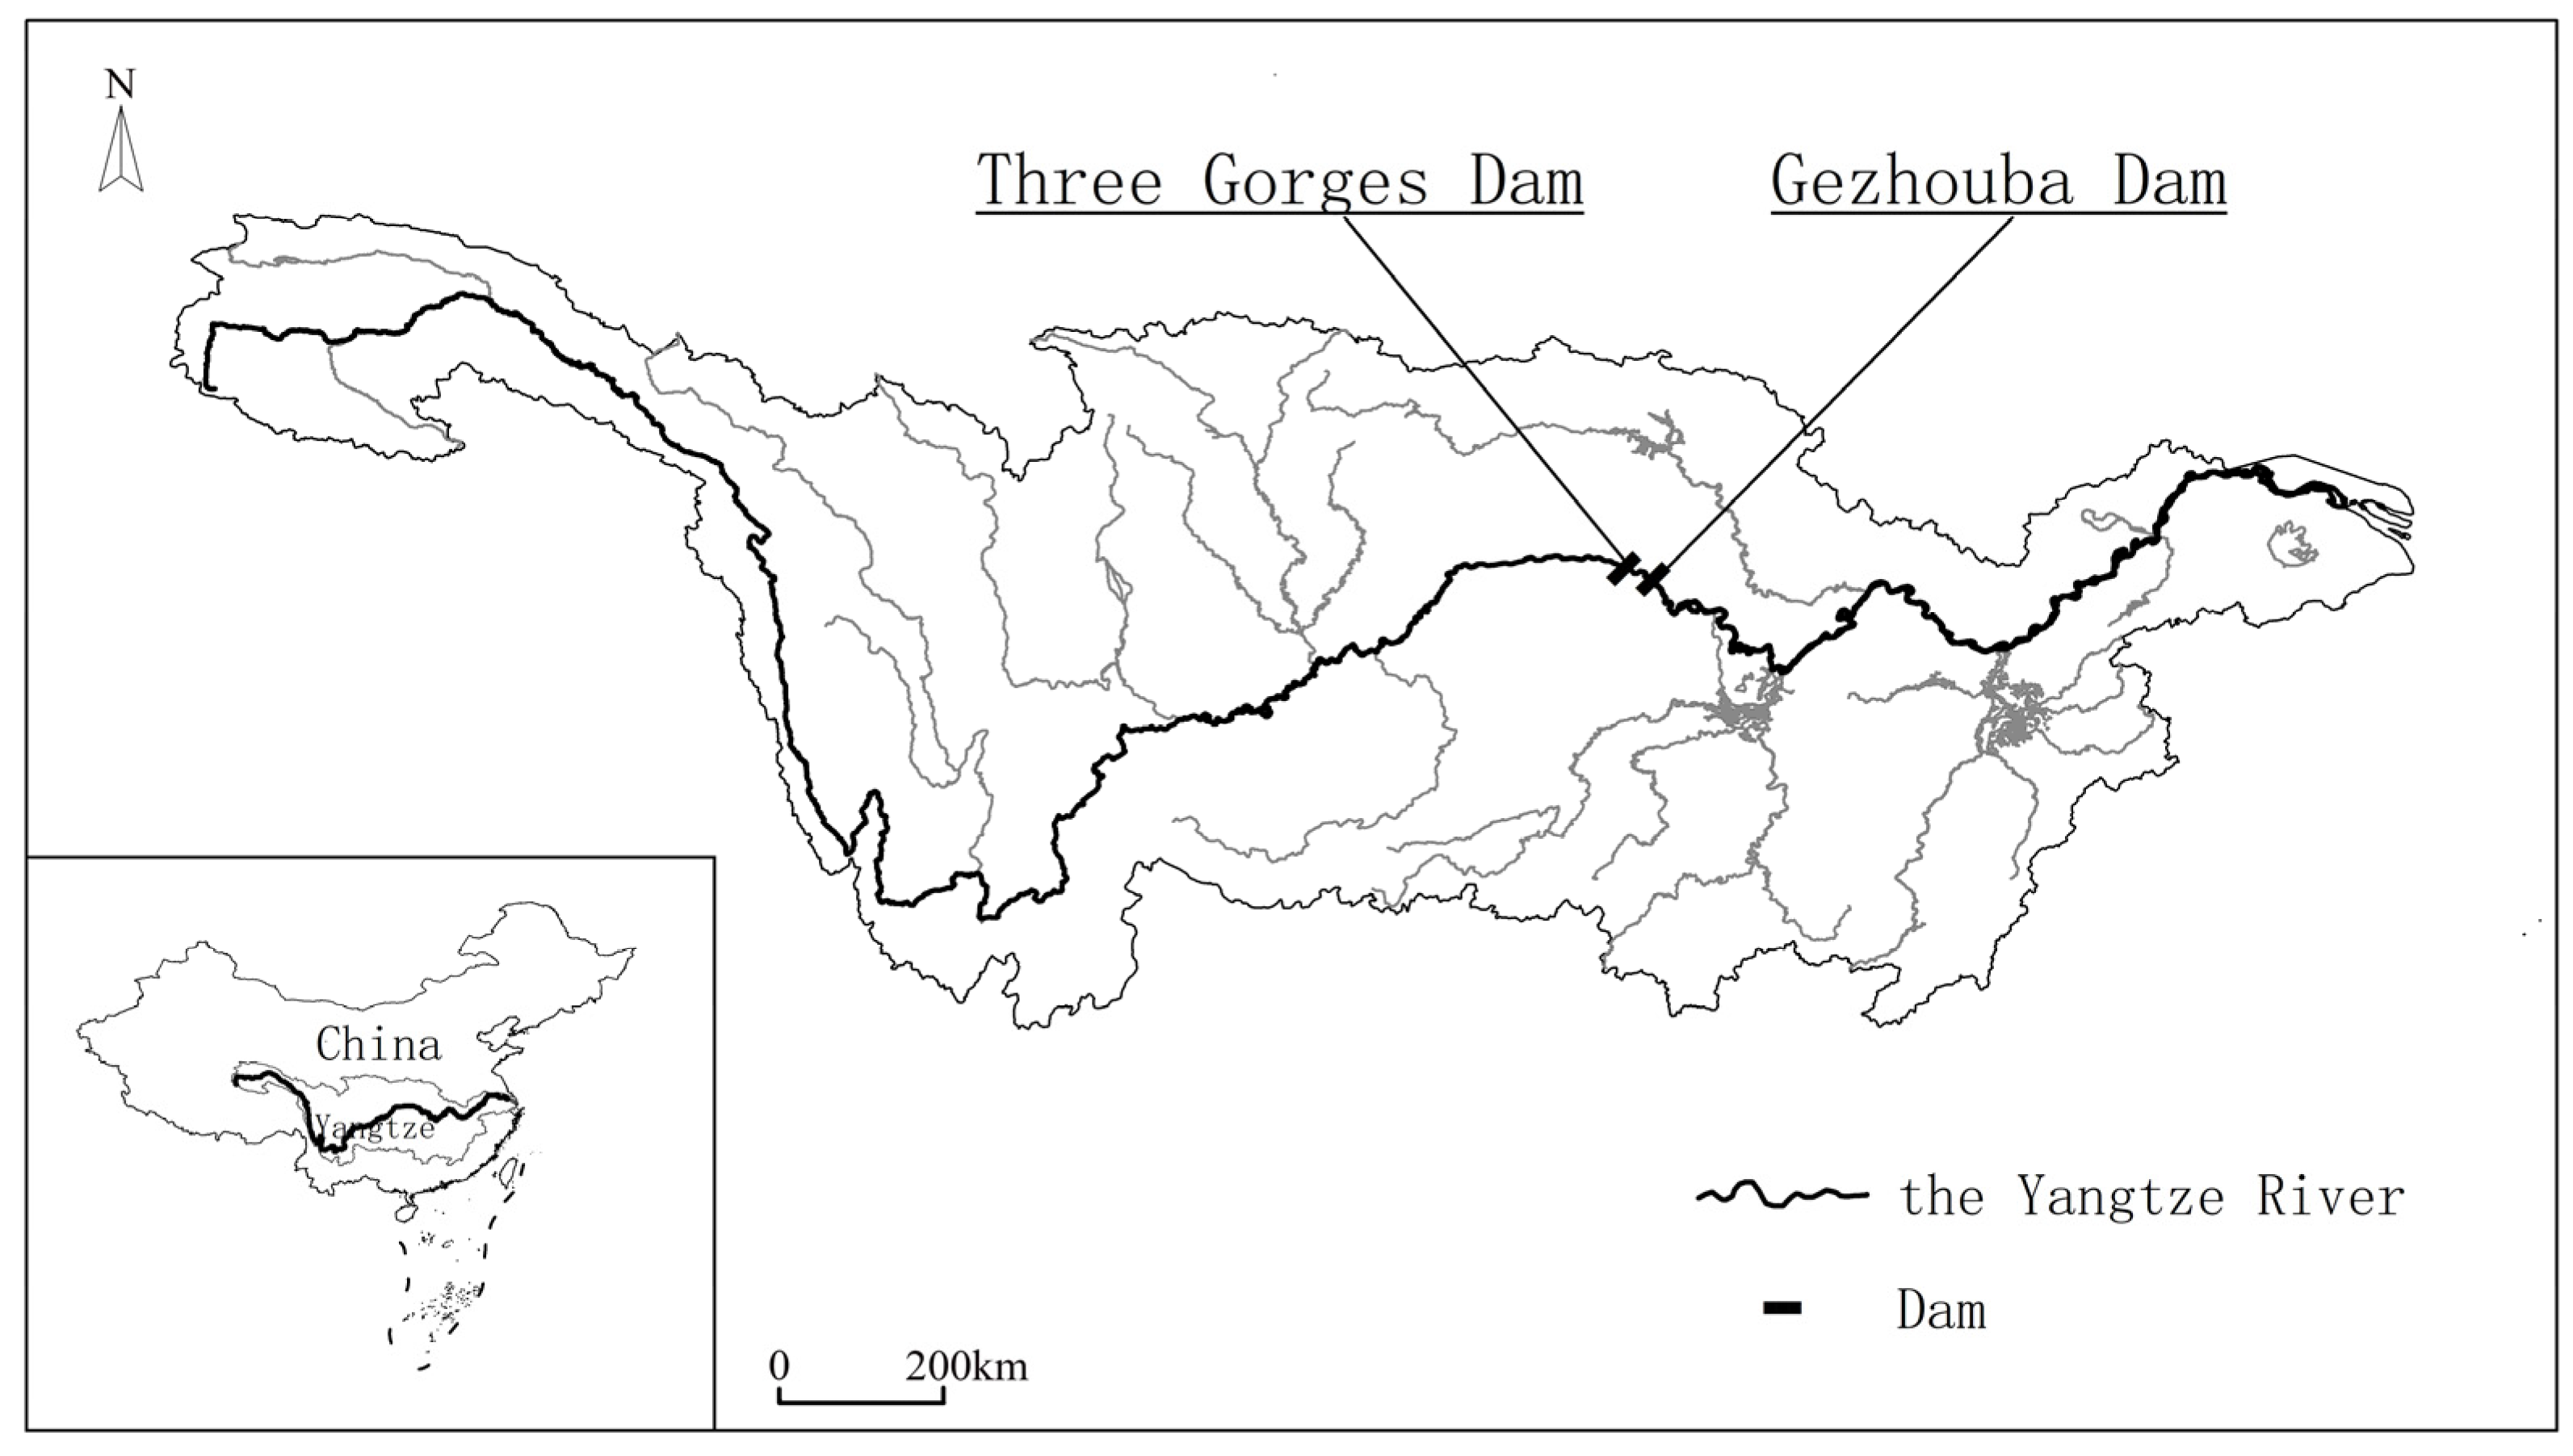
This work examines the TGD-GD hydro-junction as a case study to assess the alleviation of the down-cascade re-regulation on the flow regime alteration induced by an up-cascade reservoir. The TGD–GD hydro-junction is located upstream of the Yangtze River, as shown in Figure 3. Many features of this hydro-junction are among the top in the world, including its reservoir size (39.3 × 10⁹ m3), installed capacity (22.5 GW), sluice gates (102,500 m3/s discharge ability), ship lift (113 m elevation range), and lock (double-line five-grade). To assure the safety of shipping and the protection of the ecosystem downstream of the TGD–GD hydro-junction, the GD is used as a re-regulation facility. Limited by its re-regulation storage capacity, which is only 0.11 × 10⁹ m3, the period of re-regulation at the GD reservoir is within 1 day. The purpose of this re-regulation is to smooth the fluctuant outflow from the TGD.
The conservation storage capacity (i.e., water typically stored or withdrawn for beneficial uses [35]) of the TGD reservoir is 22.15 × 10⁹ m3 (i.e., storage between the normal pool level, 175 m, and the dead water level, 145 m). For the GD reservoir, its conservation storage capacity is 0.11 × 10⁹ m3, its normal pool level is 66 m, and its dead water level is 62 m.
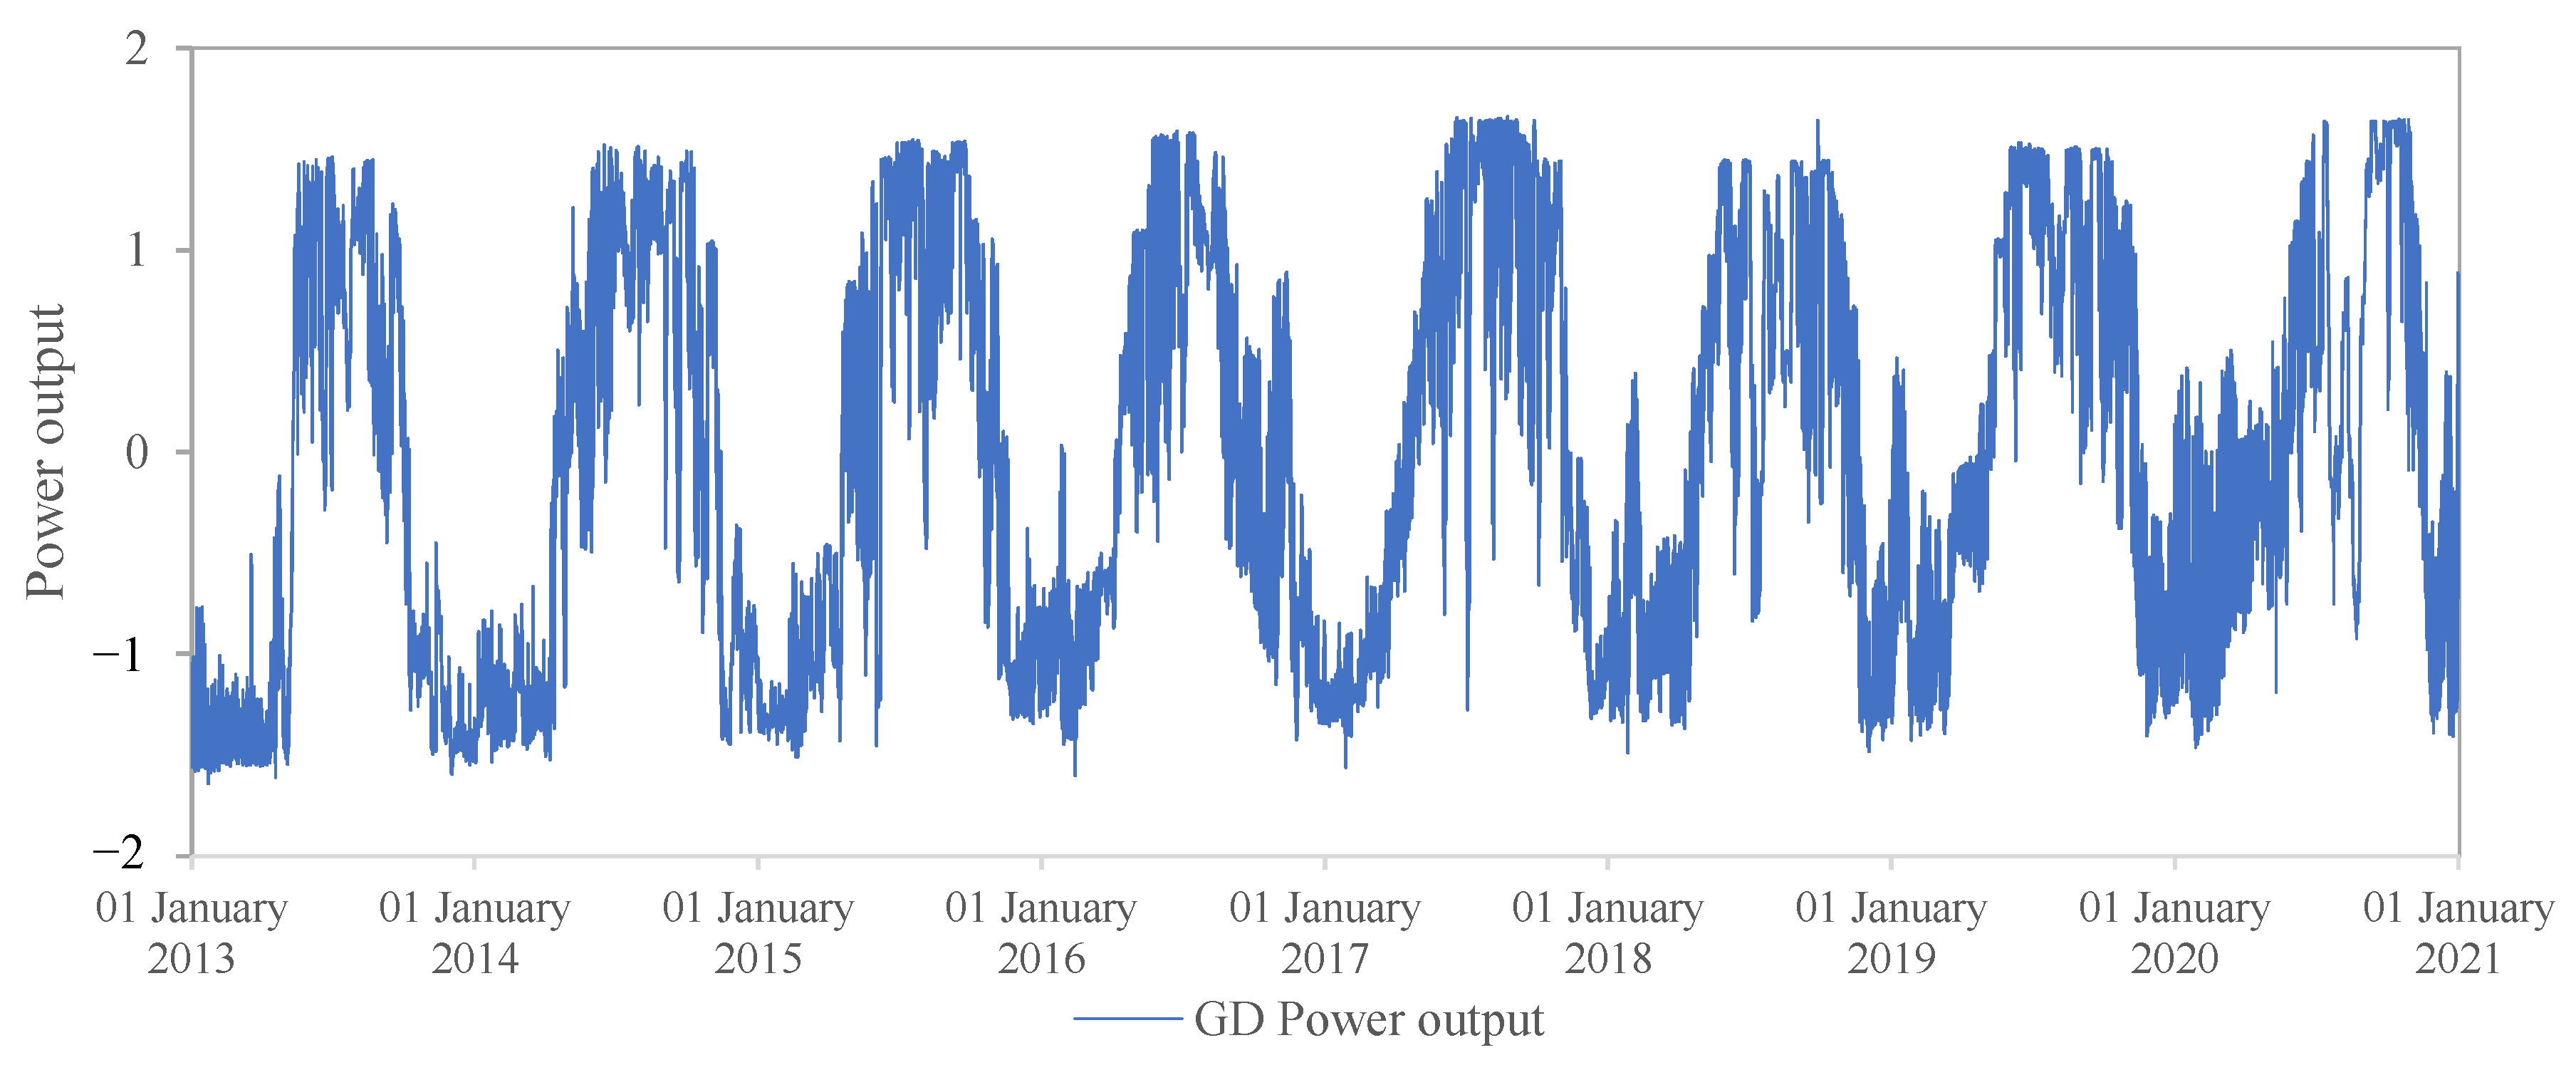
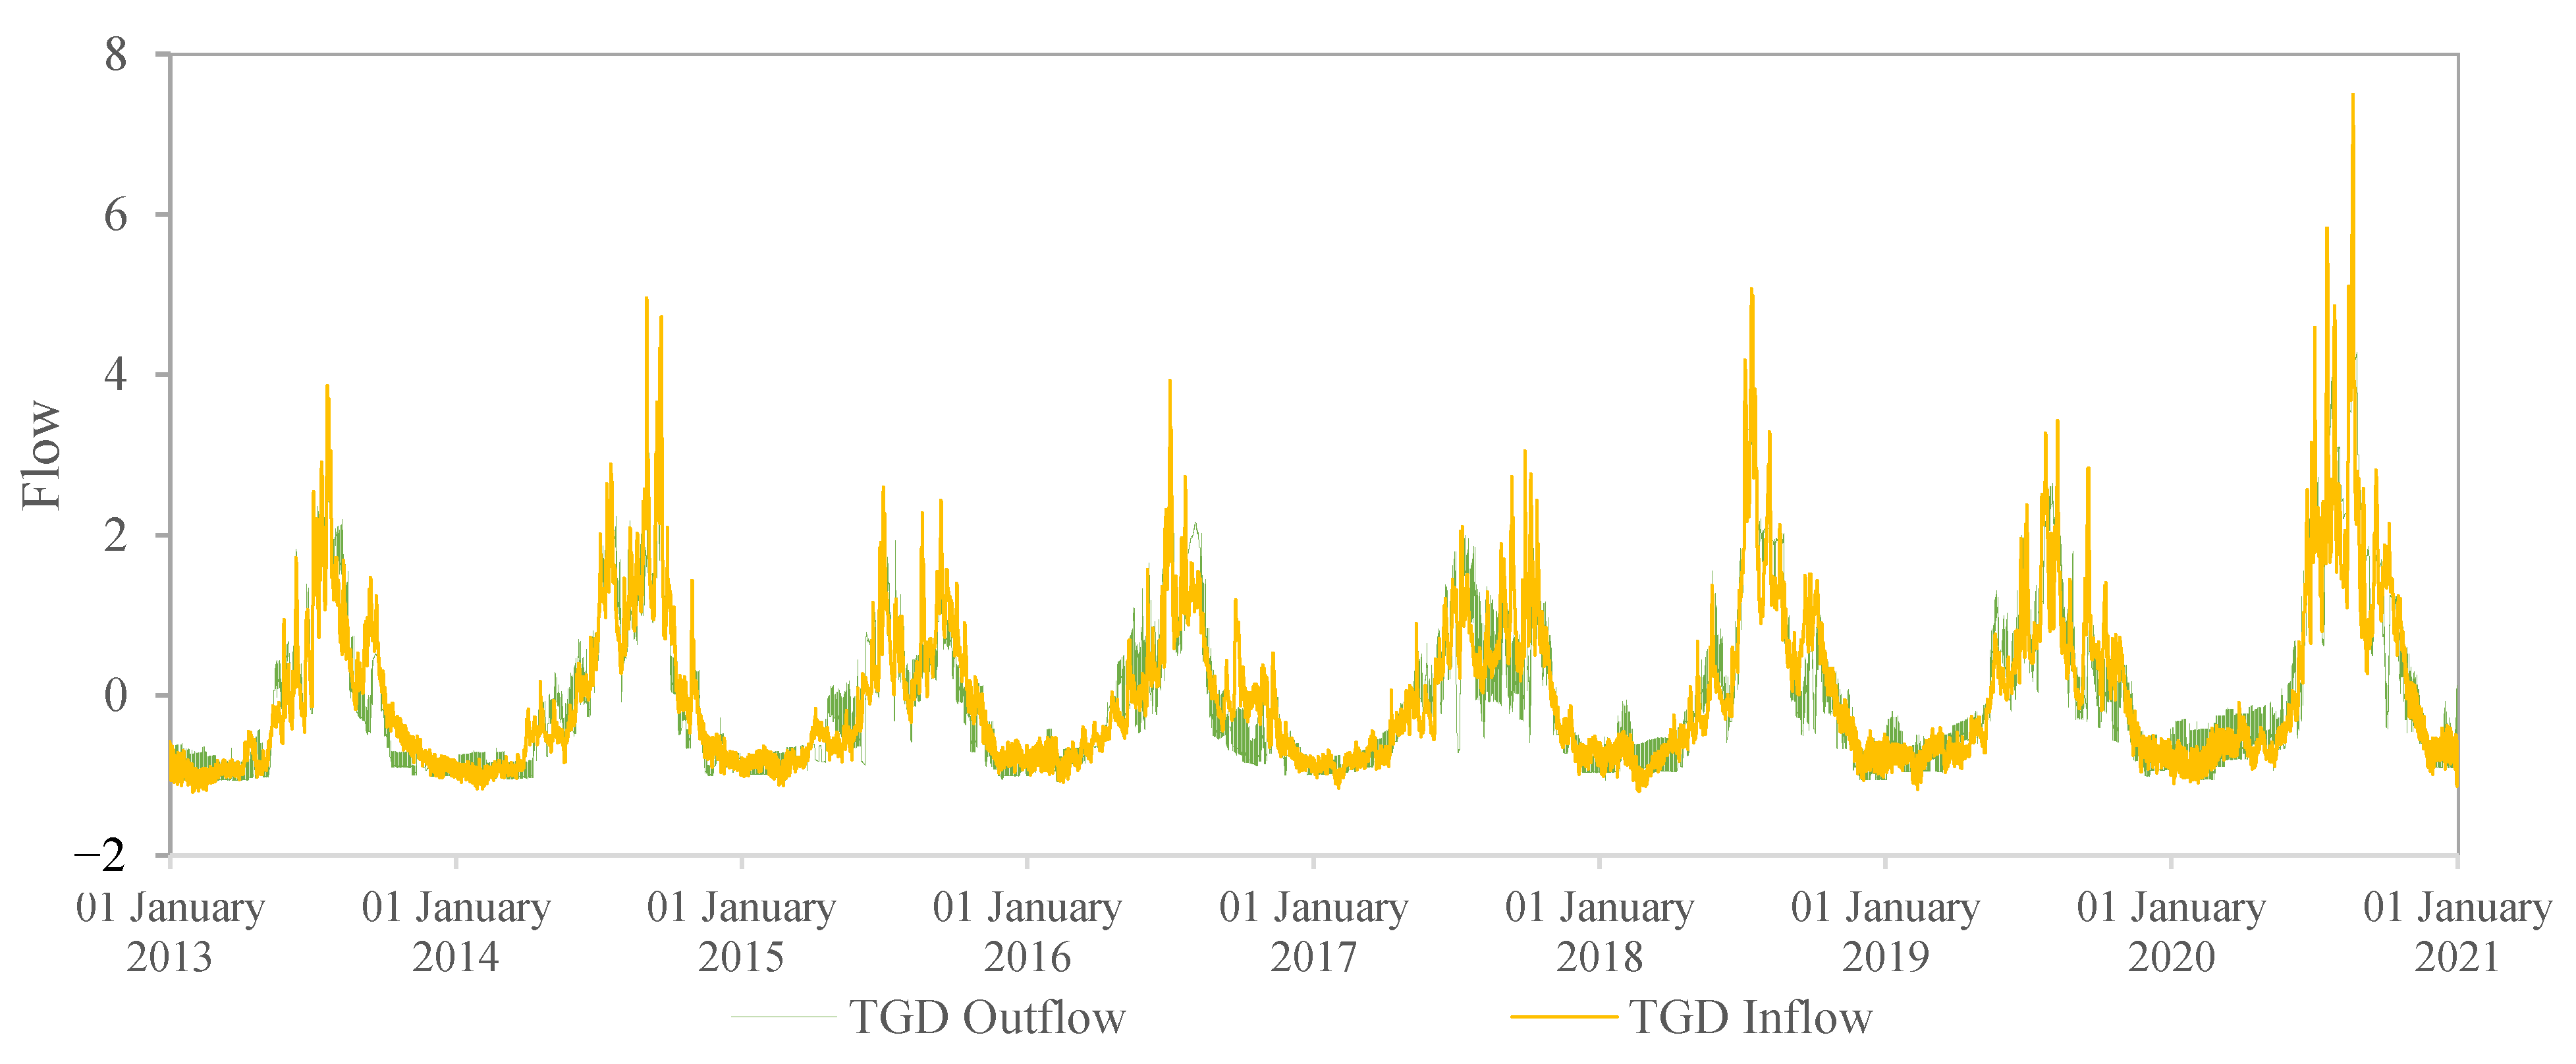
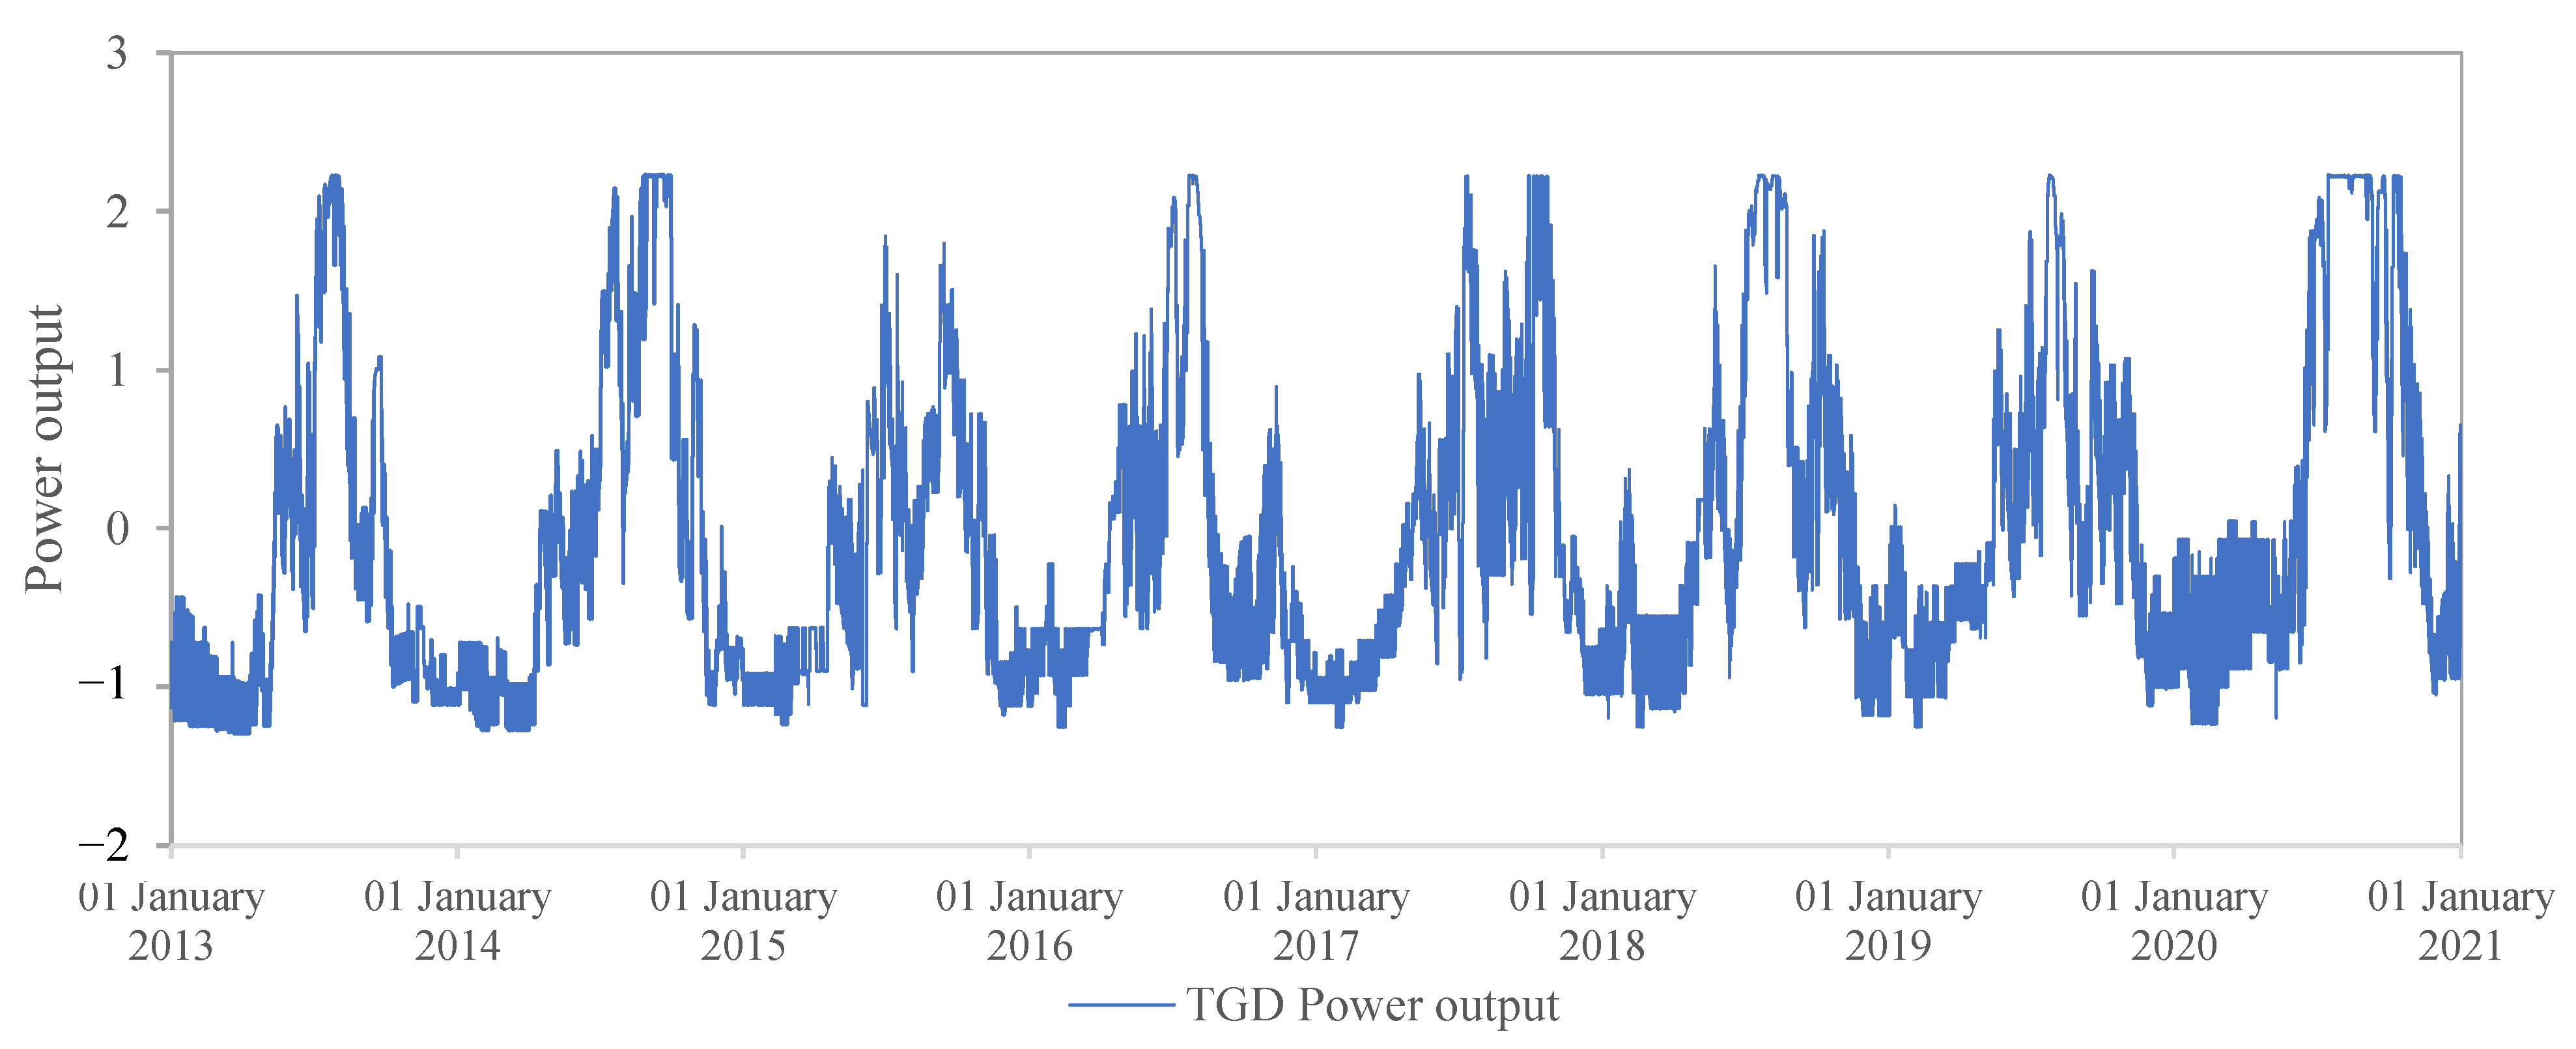
In this study, we use hourly measured operation data from 1 January 2013 to 31 December 2020, such as the inflow, outflow, water level, power output, etc. These data are presented in Appendix A. The hourly operation standardized process of the TDG–GD hydro-junction between 1 January 2013 0:00 and 31 December 2020 23:00, in terms of the inflow, outflow, power output, reservoir water level, and tailwater level, are displayed in Figure A1, Figure A2, Figure A3, Figure A4, Figure A5 and Figure A6. The inflow is calculated based on a water balance of the outflow and reservoir water level. The outflow is measured at the hydraulic equipment of the hydropower plant and floodgate. The reservoir water level is measured at the hydrological station located near the dam on the upstream side. The tailwater level is measured at the hydrological station located near the plant house.

4. Results and Discussion

4.1. Alteration of River Flow at the Up-Cascade

Commonly, the up-cascade (the TGD in this case study) is dispatched for anthropogenic water uses (e.g., power generation, water supply, etc.) by altering the natural river flow, while the down-cascade (the GD in this case study) is employed to alleviate the influence of the up-cascade operation by re-regulating the outflow from the up-cascade.
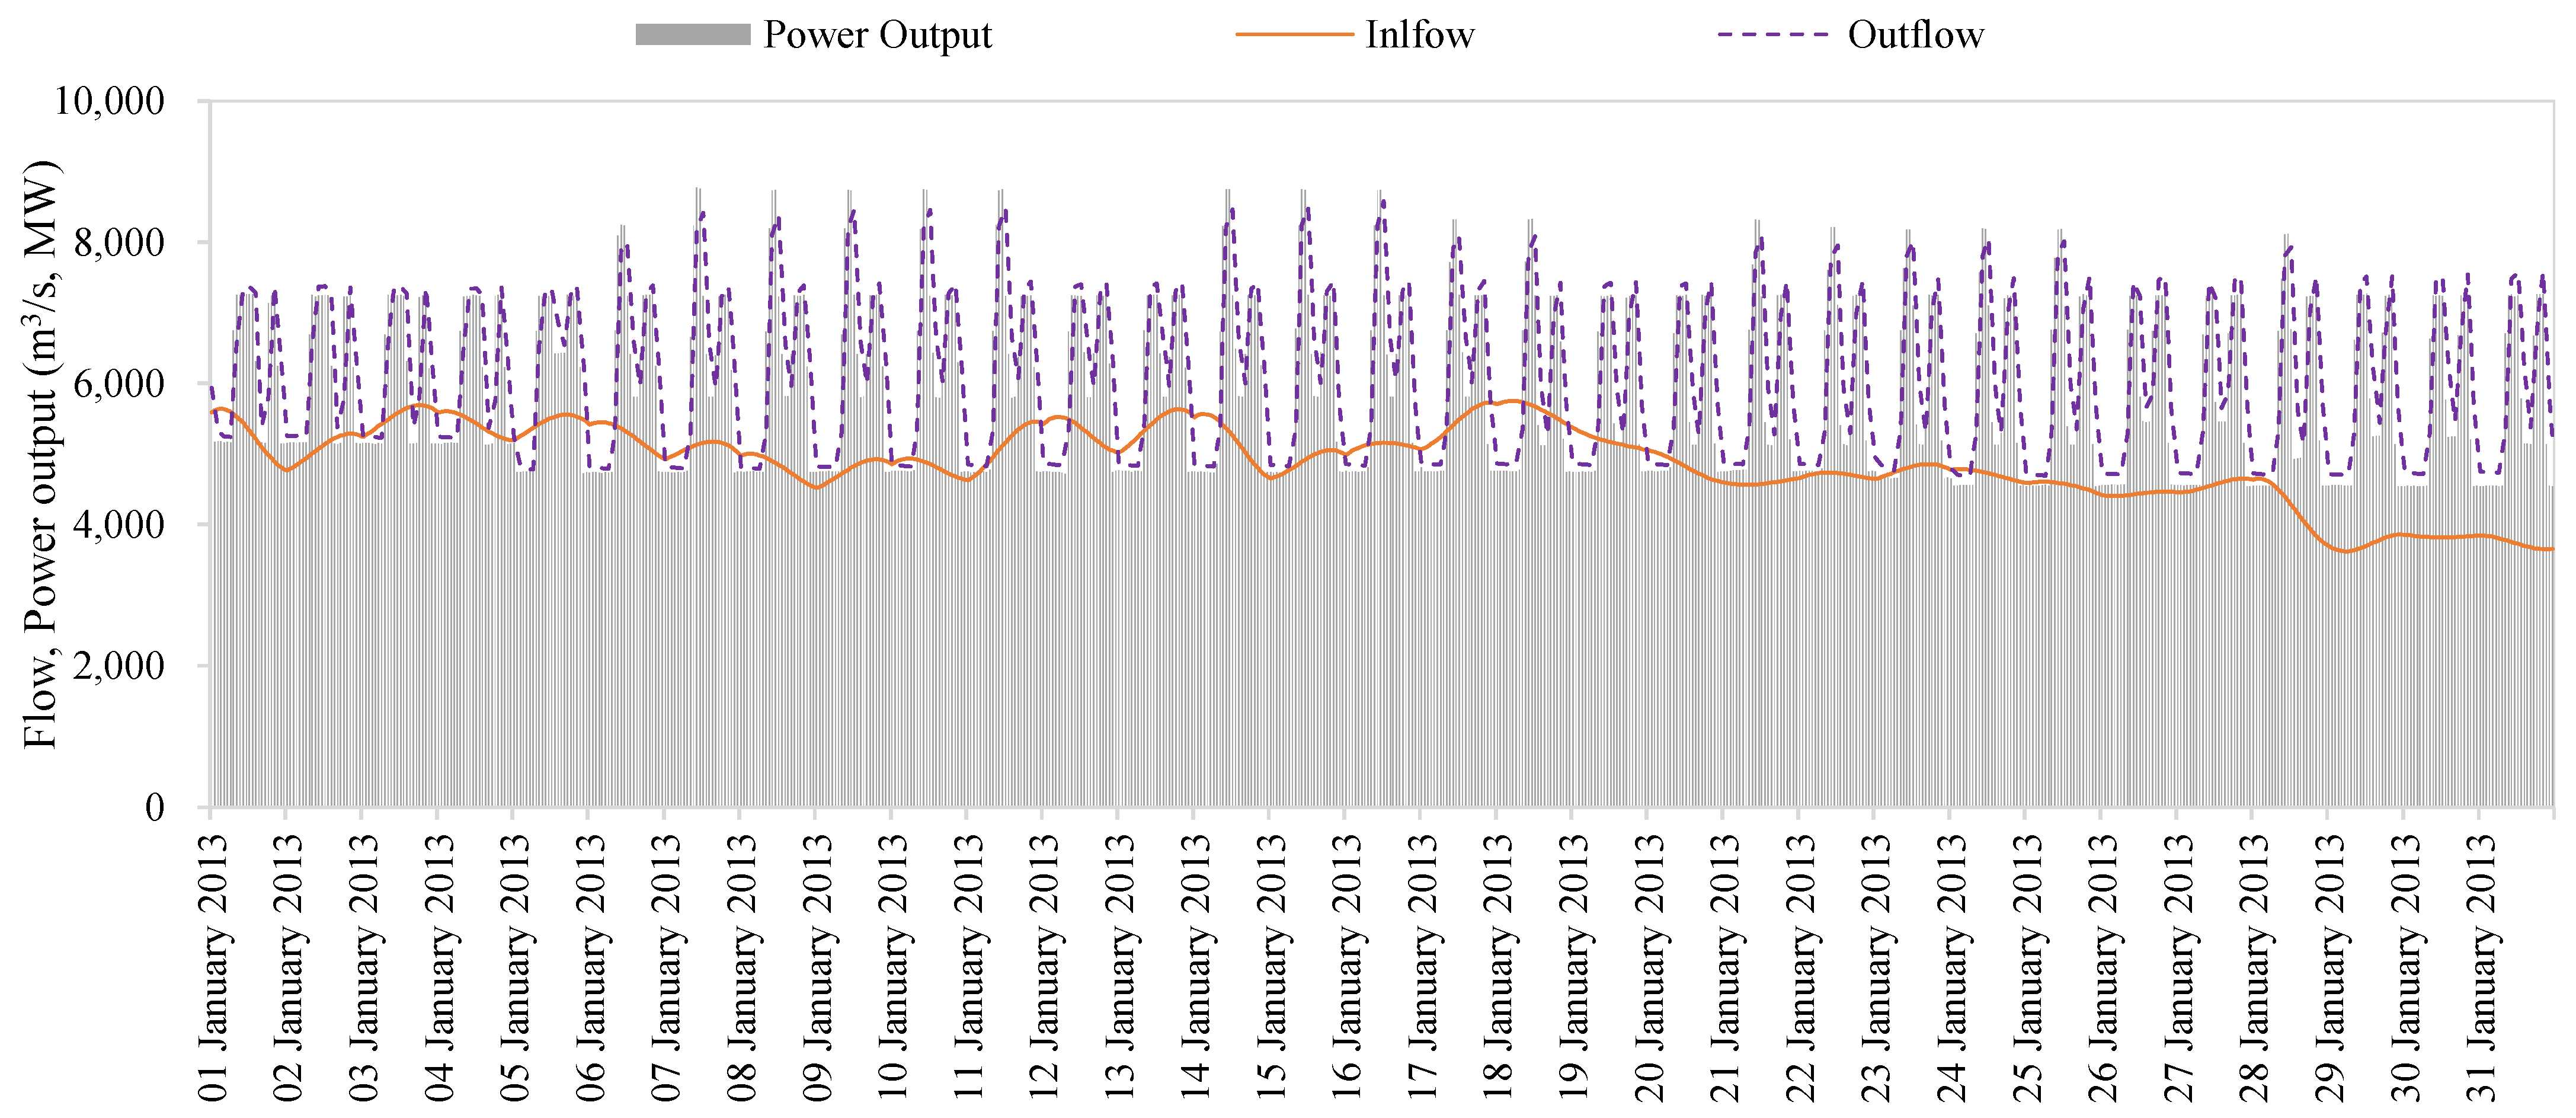
The main tasks of the TGD reservoir are flood mitigation, power generation, shipping, water resource utilization, and so forth. To demonstrate the alteration of the river flow at the TGD, the hourly operation processes of the TGD in January 2013 are shown as an example (see Figure 4). As shown in the figure, its inflow was smooth (the solid orange line), while its outflow was noticeably fluctuant (the purple dash line), which was mostly caused by power generation (its primary task, the gray columns). Similar phenomena can be found in the whole operation horizon between 2013 and 2020, as displayed in Figure A1 and Figure A2.
This provides some evidence of the linkage between alterations in the river flow caused by the TGD and highlights how the re-regulation of the down-cascade is needed to alleviate this influence on the ecosystem.

4.2. Re-Regulation of the Down-Cascade

4.2.1. Reducing the Fluctuation via Re-Regulation

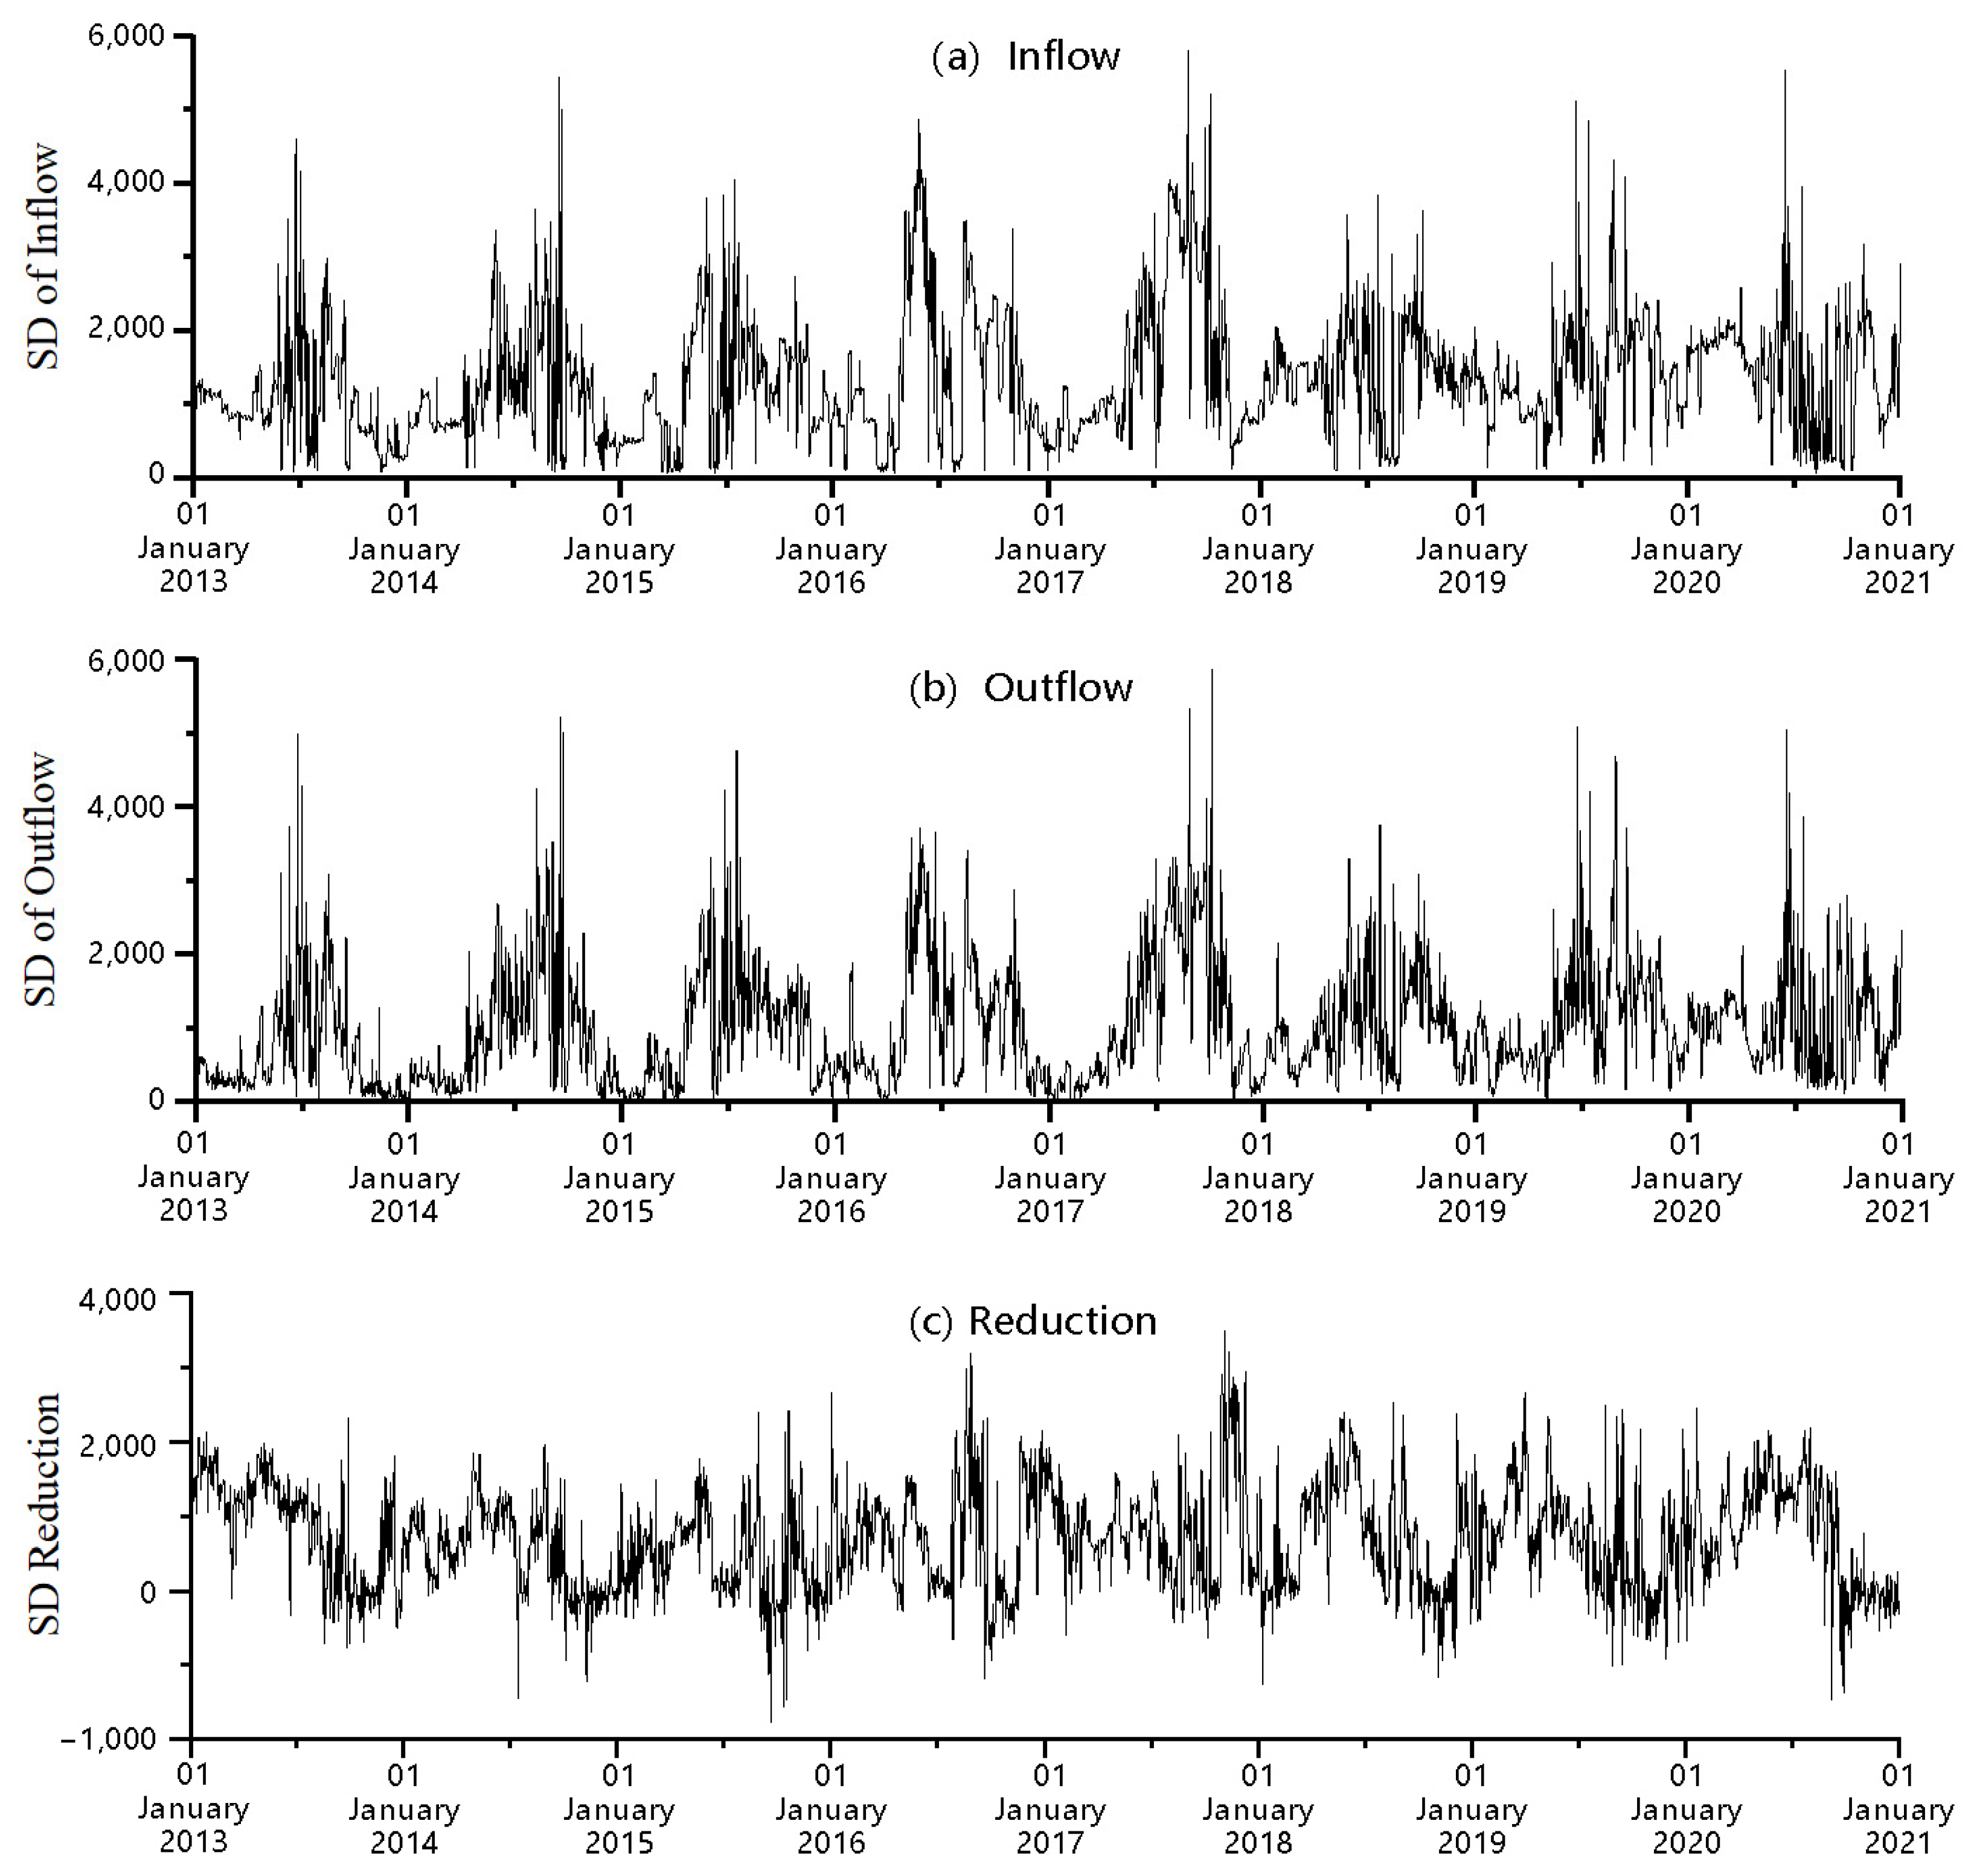
Considering that the re-regulation period of the GD is 1 day, the fluctuation is calculated based on the hourly processes of inflow/outflow between 0:00 and 23:00 every single day. Taking the SD of the inflow as an example, there is 1 SD datum on the basis of the intraday process for each day. As there are 2922 days between 1 January 2013 and 31 December 2020, the SD of the inflow/outflow consisted of 2922 data, as shown in Figure 5a,b. Similarly, there were 2922 data in the SD reduction, as displayed in Figure 5c.
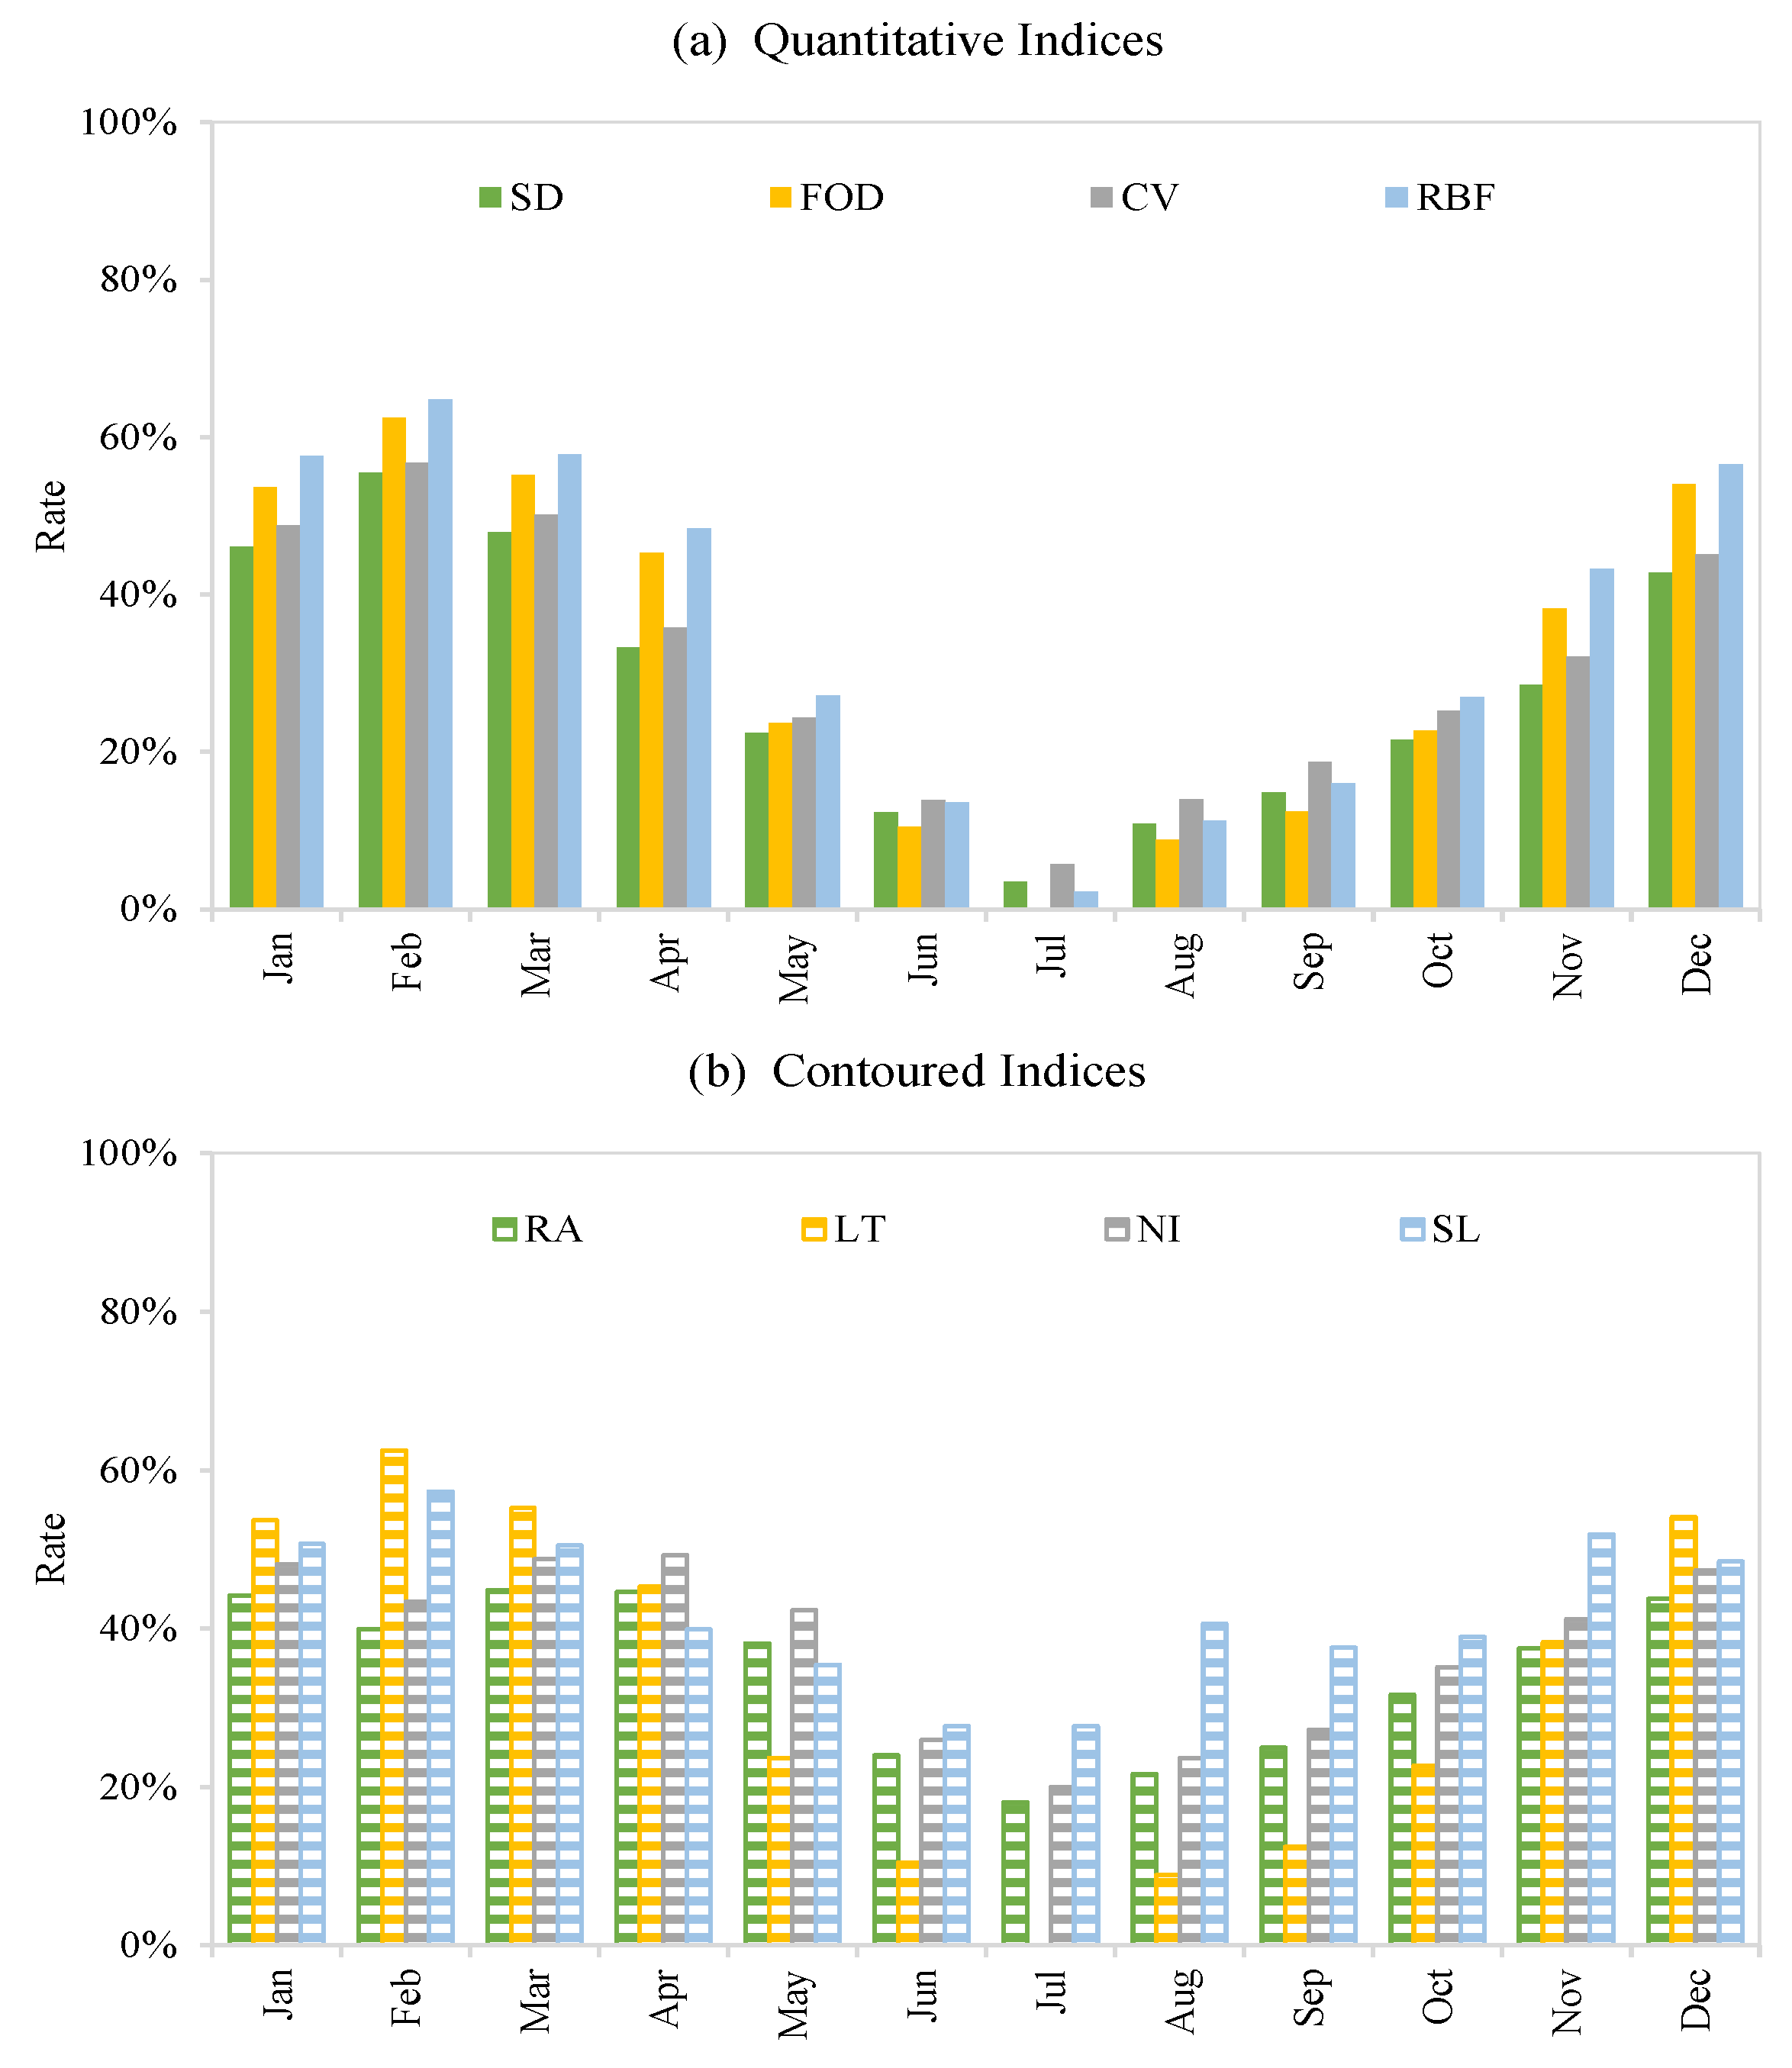
Given the limitations to directly compare the eight indices used in this study (i.e., they describe different features), this work is focused on assessing the degrees or levels of reduced fluctuation. These results are listed in Table 5 and Figure 6.
As displayed in Table 5, the apparent reduction in fluctuation is reflected in the results across the eight indices evaluated in the study. The quantitative indices are reduced by 25.09% (SD), 29.33% (FOD), 34.05% (CV), and 41.35% (RBF); the contoured indices are reduced by 34.71% (RA), 29.33% (LT), 38.07% (NI), and 41.52% (SL). These results illustrate how the re-regulation of the GD does alleviate the river flow fluctuation to a certain extent.
Figure 6 shows that between December and March (biggest in February), the reduction in the fluctuation is higher, while between June and August (smallest in July), the effect is smaller. It denotes a seasonal trend. These results, on the one hand, reflect the dynamic temporal nature of the re-regulation effect, and on the other hand, demonstrate that the impact of the alleviating fluctuation through re-regulation indeed exists. The trends of the eight fluctuation indices are similar; however, there are several differences in the details (e.g., distributions), which are discussed in the following part.

4.2.2. Distribution of Re-Regulation on Fluctuation Alleviation

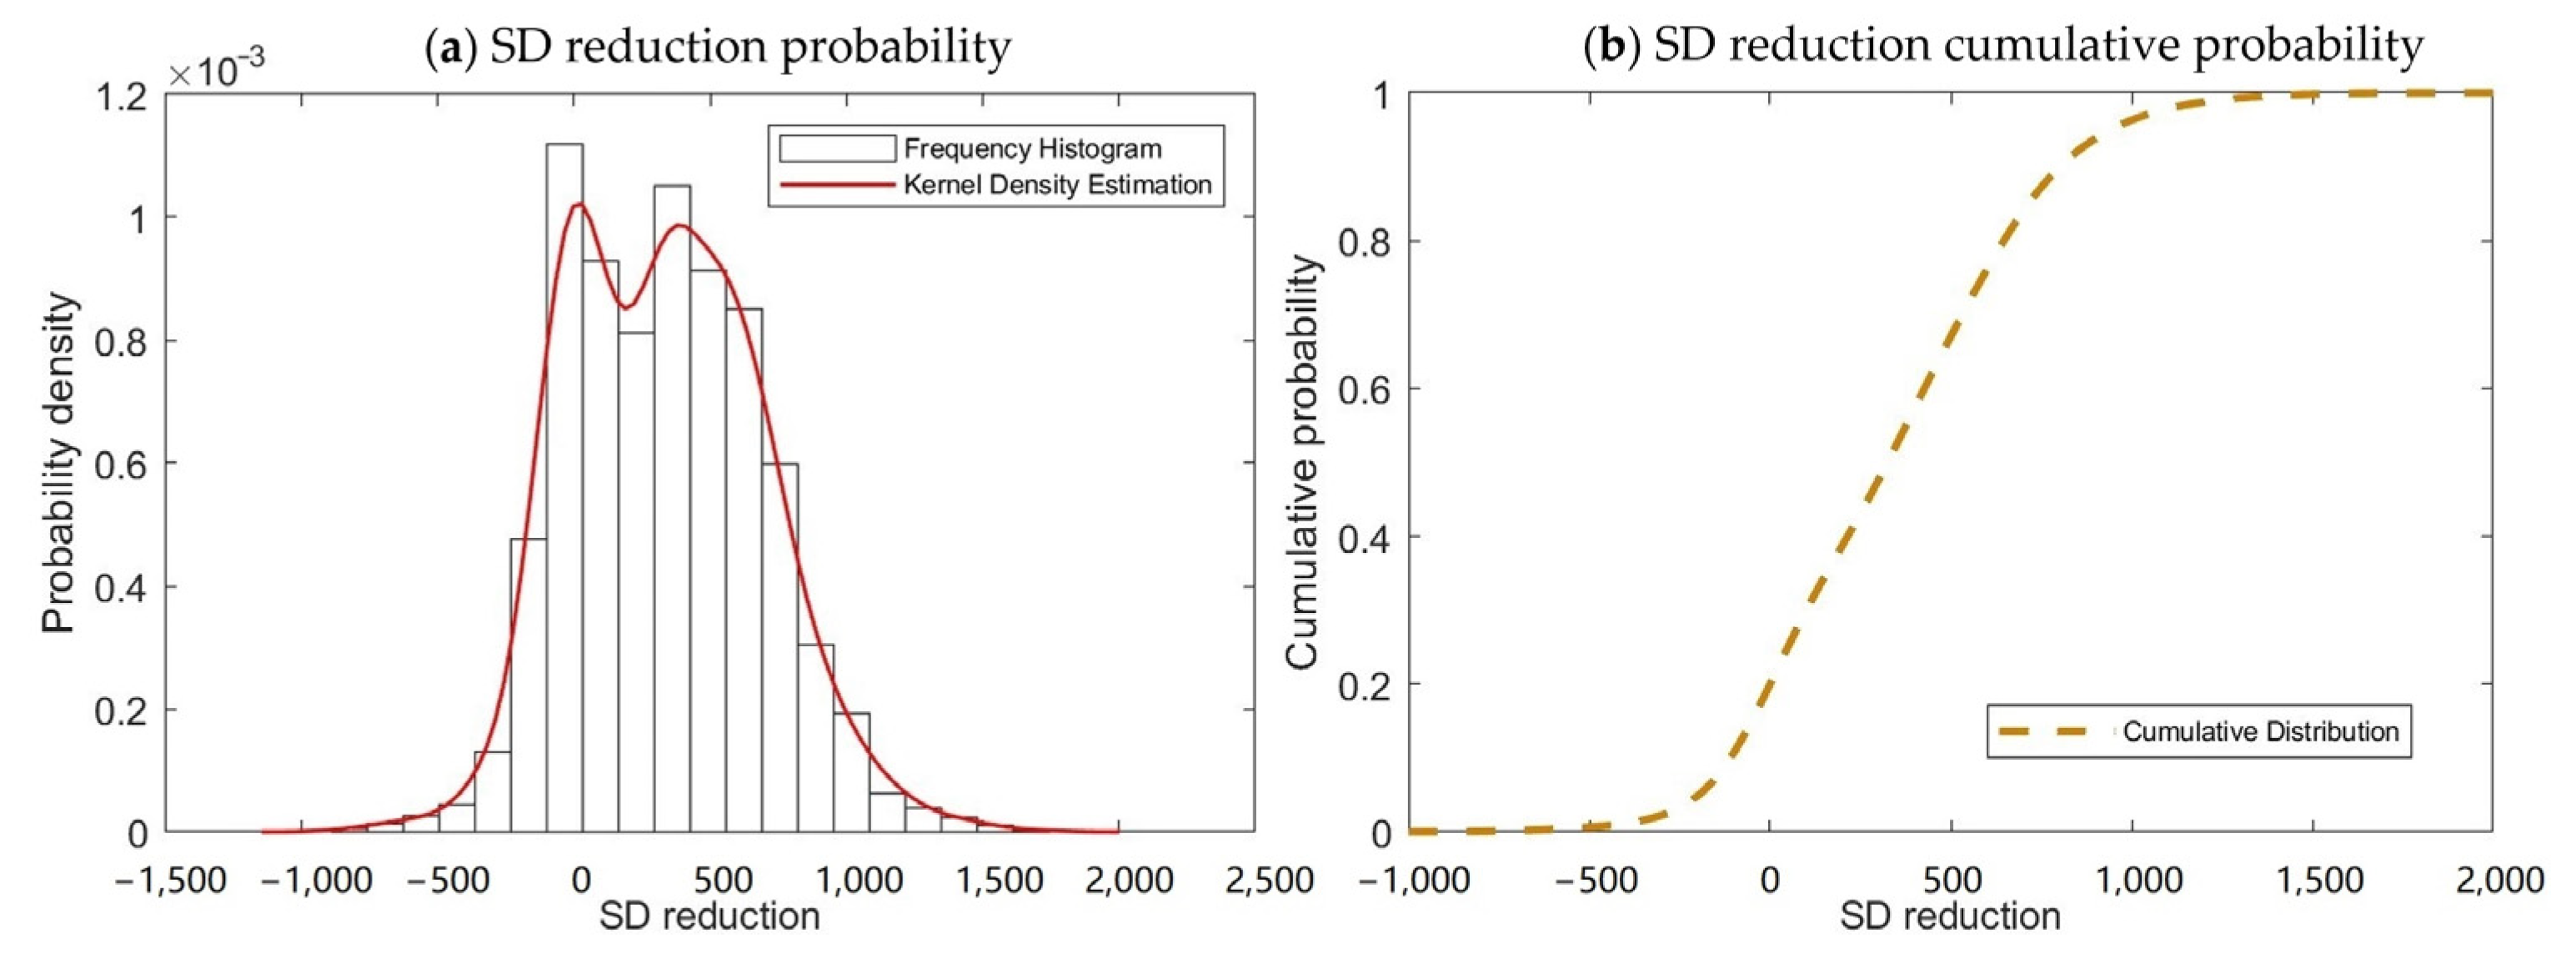
Taking the SD reduction (see Figure 5) as an example, its Kernel density estimation and the corresponding cumulative probability can be obtained, as shown in Figure 7a,b.
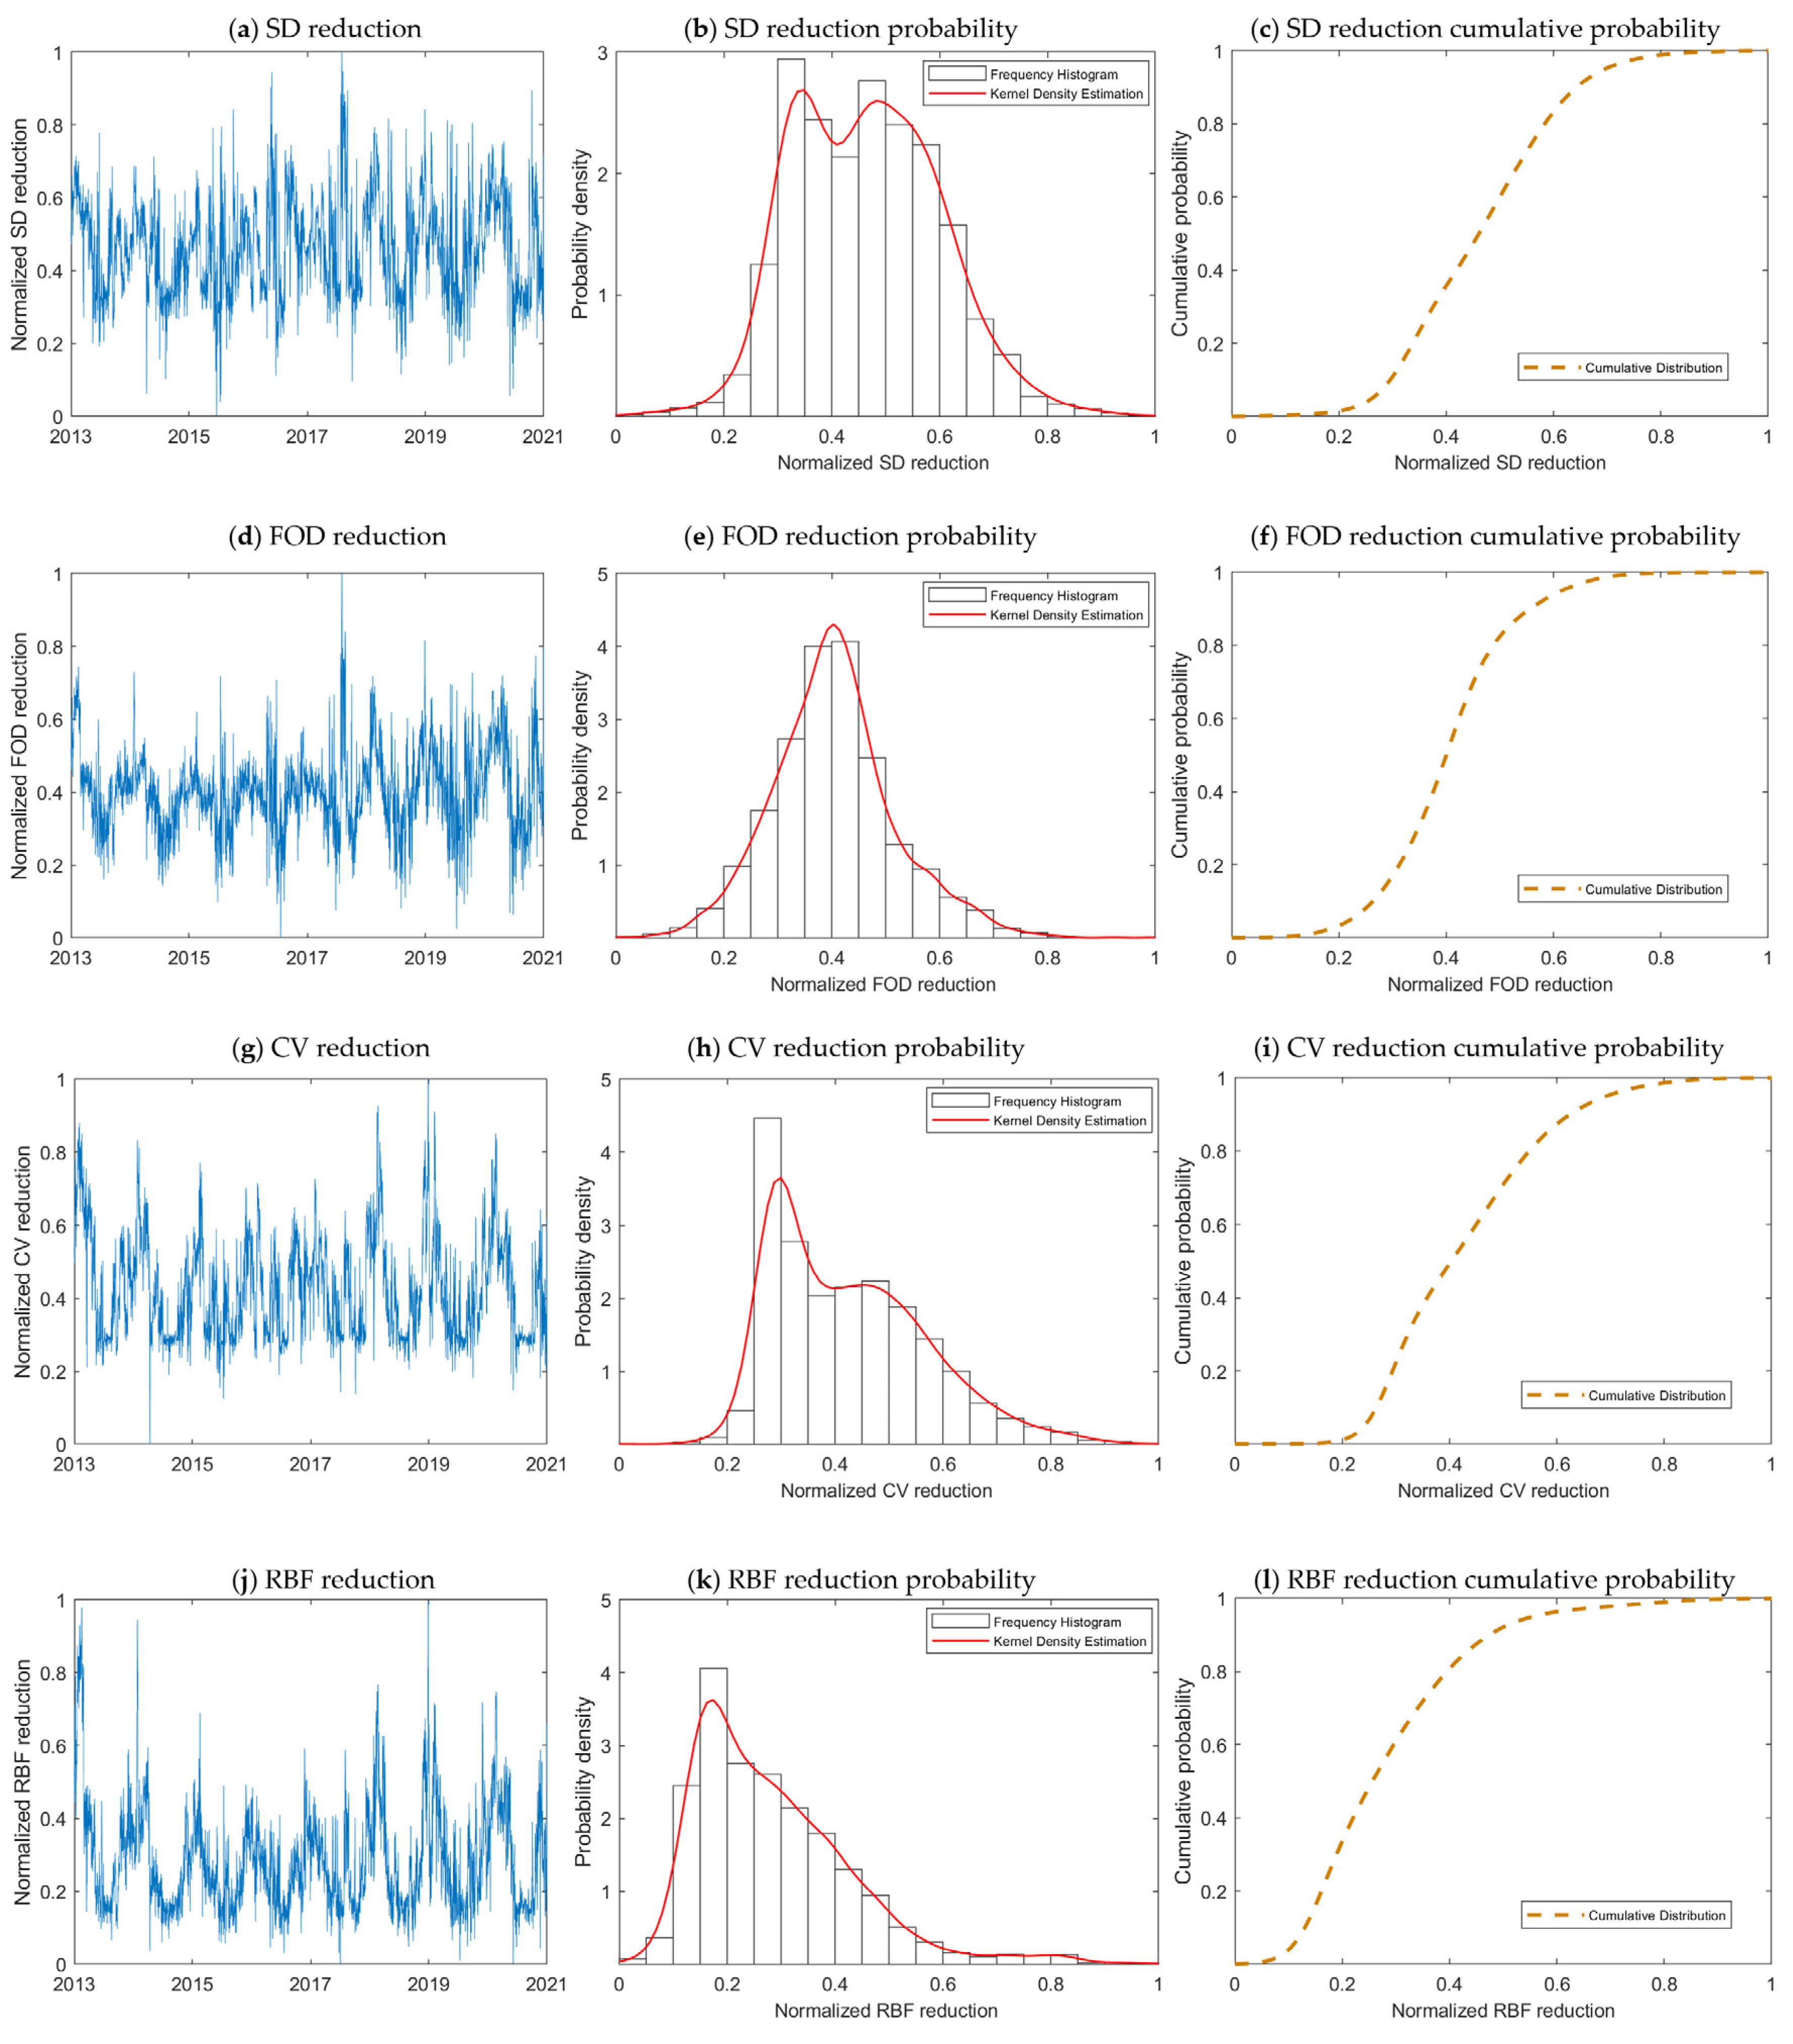
Similarly, the same results of the other seven indices’ reduction in the inflow and outflow at the GD reservoir can be obtained. The results of the fluctuation reduction are normalized and displayed in Figure 8 and Figure 9.
Figure 8 and Figure 9 show that the KDEs of the normalized FOD, RA, LT, NI, and SL reduction are symmetrical, while the ones from the other indices exhibit an asymmetric behavior. Similarly, it shows how the most prominent reduction in the inflow and outflow occurs around its mean value. In regard to the symmetrical ones, the probability of this fluctuation index reduction being larger or smaller than its mean value is basically the same. In the asymmetric ones (i.e., SD, CV, and RBF), the smaller reduction is more frequent in this study, which means that the effect of the alleviating fluctuation on this type is mostly small. It demonstrates the efficiency of the alleviating fluctuation on various types via re-regulation. The same conclusion can also be obtained from their cumulative probability curves.
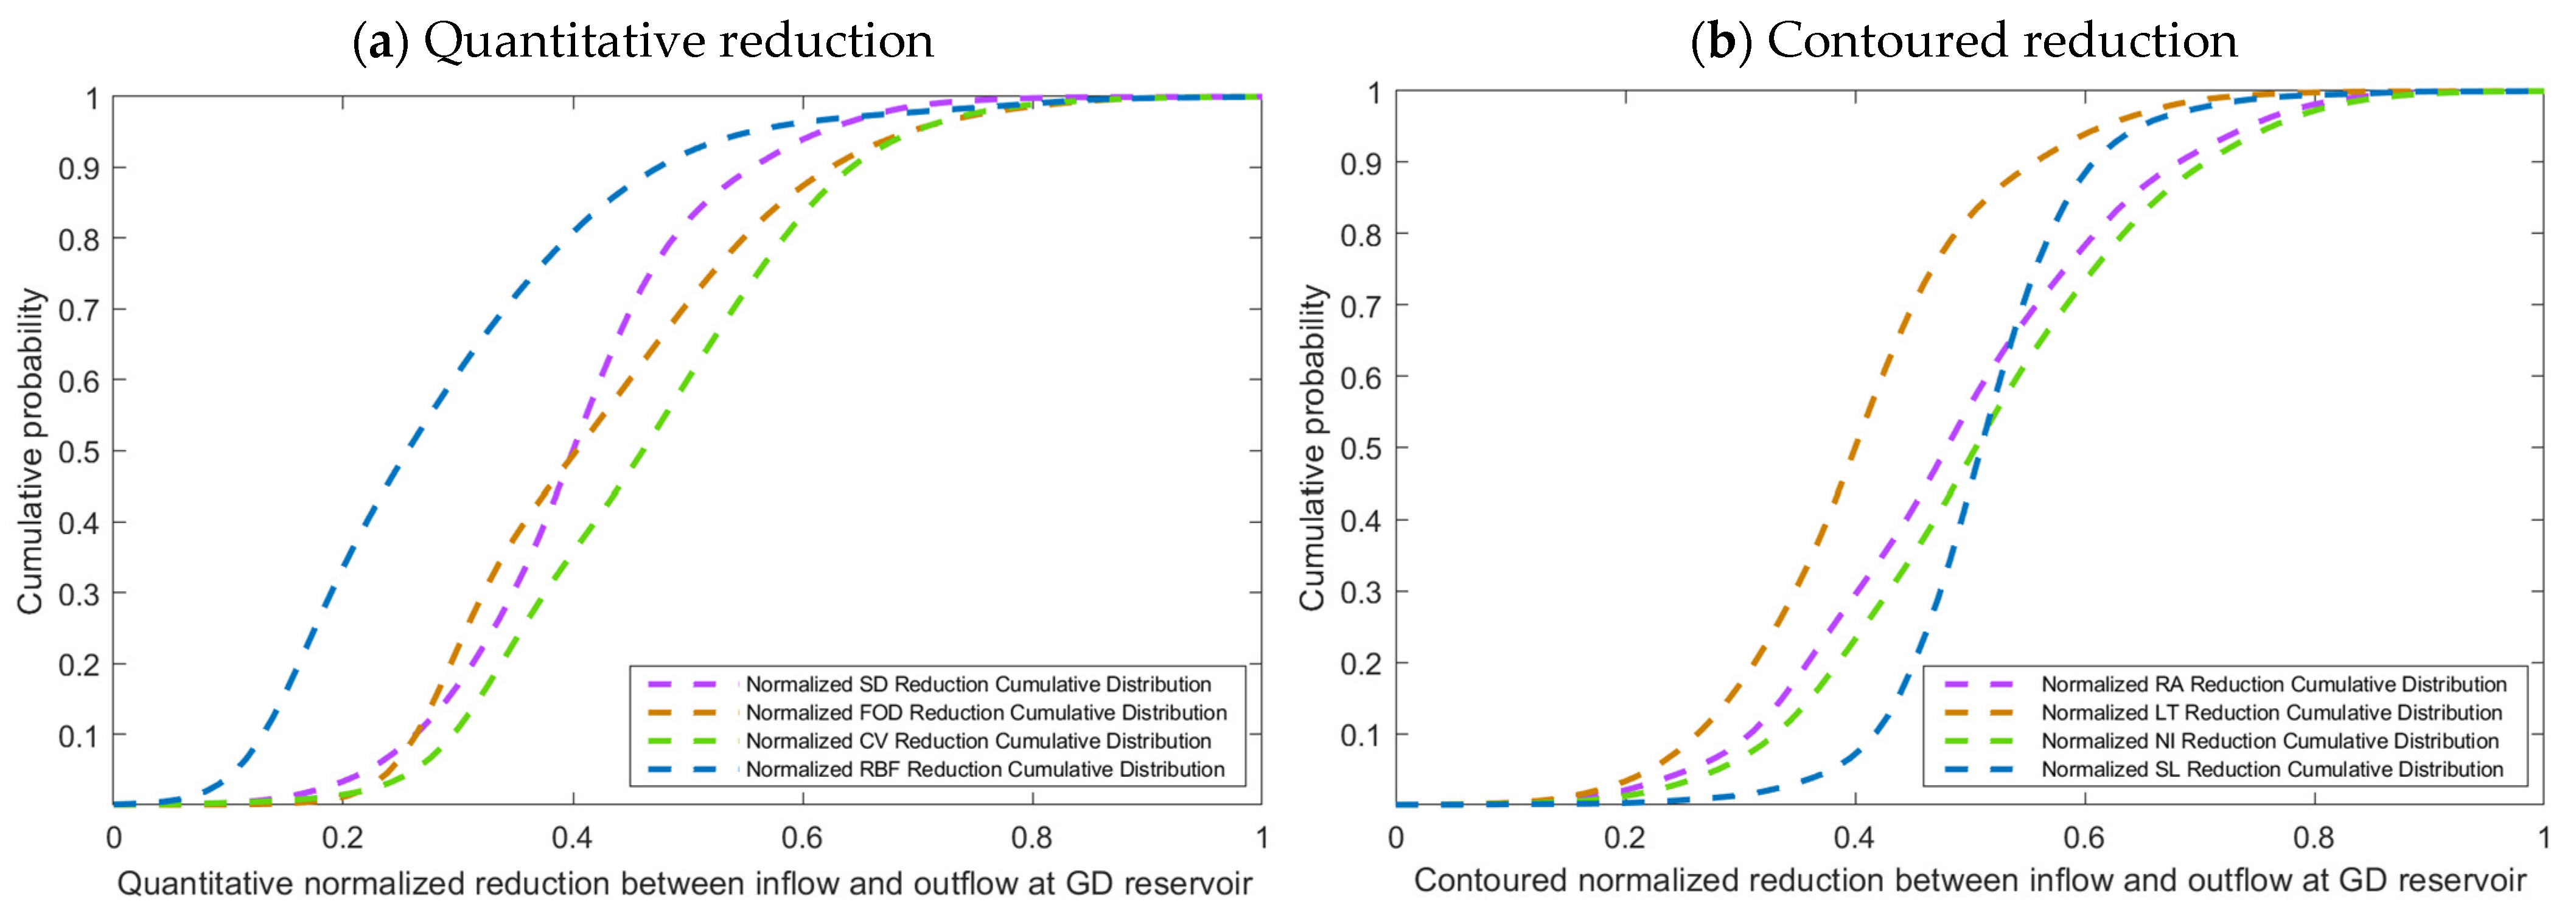
When comparing the cumulative probability curves, shown in Figure 10, it can be observed that: (1) the reduction effect of the quantitative indices is lower than that of the contoured indices; (2) the value of both the quantitative and contoured indices is concentrated in the small region. For the quantitative fluctuation reduction, 90% is under 0.47 (RBF), 0.55 (SD), 0.63 (FOD), and 0.64 (CV), while for the contoured fluctuation reduction, 90% is under 0.55 (LT), 0.60 (SL), 0.68 (RA), and 0.71 (NI). These results illustrate that the re-regulation of the GD reservoir is more functional in mitigating the contoured fluctuation (e.g., making the flow smoother), and the ability of re-regulation is small and limited.

4.2.3. Impact of Re-Regulation on Power Generation

While alleviating the runoff fluctuation for shipping safety and environmental protection is an essential task for the down-cascade, power generation is usually also an important mission. To smooth the fluctuant runoff from the up-cascade, water must be reversely dispatched at the down-cascade’s reservoir. Therefore, the water head of the hydropower plant at the down-cascade is variable. Thus, with the smoothed runoff and the varying water head, the power output of the hydropower plant at the down-cascade can be either a smoother or more fluctuant scenario (e.g., Figure 11).
In this case study, the results of the power output fluctuation varieties at the down-cascade are listed in Table 6 and Table 7. As shown in the table, RA and NI are significantly increased (218% to 249%), while LT is only slightly increased (0.3%). In contrast, the quantitative indices are all reduced (from 0.3% to 14%). This illustrates that re-regulation through the reservoir does have impacts on the power output fluctuation, which can be either positive or negative.

5. Conclusions

A hydro-junction with dual cascades is a facility that can appropriately utilize water resources by altering the water flow at the up-cascade and alleviating the influence on the environment by smoothing the runoff fluctuation at the down-cascade. In this paper, we adopted eight commonly used indices to analyze the fluctuation of the inflow and outflow of the reservoir of the largest hydro-junction system, the TGD and GD cascades. The results of the study show that the TGD (i.e., the up-cascade) causes an apparent alteration to the river flow regime, while the GD (i.e., the down-cascade) smooths the altered runoff on an hourly scale. The detailed comparisons indicate that: (1) the fluctuation reduction shows a seasonal trend; (2) the quantitative indices are reduced by 25.09–41.35%, while the contoured indices are reduced by 29.33–41.52%, and the re-regulation is more functional in mitigating the contoured fluctuation, with 90% cumulative probability; (3) the reservoir’s re-regulation also induces various impacts on the power output fluctuation.
Further research could explore new methods to quantify the fluctuation (e.g., using different indices) while identifying trade-offs between the inclusion of specific indices. Additionally, exploring the relationship between reductions in the runoff fluctuation and increments in the power output should consider the impact of the water head and the allocation of power plans among hydro-plants in greater detail.
Author Contributions

Y.W.: Conceptualization, Investigation, Data Curation, Visualization, Writing. X.W.: Conceptualization, Methodology, Writing, Reviewing and Editing. E.V.: Conceptualization, Writing, Reviewing and Editing. K.Z.: Writing and Editing. T.H.: Conceptualization, Data Curation. Y.M.: Supervision. H.W.: Supervision. All authors have read and agreed to the published version of the manuscript.

Funding

This research was funded by the Joint Funds of the National Natural Science Foundation of China [U1865201], and the Program of the National Natural Science Foundation of China [51979198 and 91647204].

Data Availability Statement

The data presented in the study are available under reasonable request to the corresponding author.

Conflicts of Interest

The authors declare no conflict of interest. The funders had no role in the design of the study; in the collection, analyses, or interpretation of data; in the writing of the manuscript; or in the decision to publish the result.

Appendix A

The hourly operation standardized process of the Three Gorges Dam-Gezhouba Dam (TDG–GD) hydro-junction between 1 January 2013 0:00 and 31 December 2020 23:00 are displayed in Figure A1, Figure A2, Figure A3, Figure A4, Figure A5 and Figure A6.
Figure A1. Hourly normalized inflow and outflow of the Three Gorges Dam (TGD) reservoir (i.e., upper reservoir).
Water 15 02166 g0a1
Figure A2. Hourly normalized power output of the Three Gorges Dam (TGD) reservoir (i.e., upper reservoir).
Water 15 02166 g0a2
Figure A3. Hourly normalized water level of the Three Gorges Dam (TGD) reservoir (i.e., upper reservoir).
Water 15 02166 g0a3
Figure A4. Hourly normalized inflow and outflow of the Gezhouba Dam (GD) reservoir (i.e., lower reservoir).
Water 15 02166 g0a4
Figure A5. Hourly normalized power output of the Gezhouba Dam (GD) reservoir (i.e., lower reservoir).
Water 15 02166 g0a5
Figure A6. Hourly normalized water level of the Gezhouba Dam (GD) reservoir (i.e., lower reservoir).
Water 15 02166 g0a6

References

  1. Chen, W.; Olden, J. Designing flows to resolve human and environmental water needs in a dam-regulated river. Nat. Commun. 2017, 8, 2158. [Google Scholar] [CrossRef] [Green Version]
  2. Lazzaro, G.; Basso, S.; Schirmer, M.; Botter, G. Water management strategies for run-of-river power plants: Profitability and hydrologic impact between the intake and the outflow. Water Resour. Res. 2013, 49, 8285–8298. [Google Scholar] [CrossRef] [Green Version]
  3. Schwanenberg, D.; Fan, F.; Naumann, S.; Kuwajima, J.; Montero, R.; dos Reis, A. Short-Term Reservoir Optimization for Flood Mitigation under Meteorological and Hydrological Forecast Uncertainty. Water Resour. Manag. 2015, 29, 1635–1651. [Google Scholar] [CrossRef] [Green Version]
  4. Ji, Y.; Lei, X.; Cai, S.; Wang, X. Hedging Rules for Water Supply Reservoir Based on the Model of Simulation and Optimization. Water 2016, 8, 249. [Google Scholar] [CrossRef] [Green Version]
  5. Grill, G.; Lehner, B.; Thieme, M.; Geenen, B.; Tickner, D.; Antonelli, F.; Babu, S.; Borrelli, P.; Cheng, L.; Crochetiere, H.; et al. Mapping the world’s free-flowing rivers. Nature 2019, 569, 215–221. [Google Scholar] [CrossRef]
  6. Botter, G.; Basso, S.; Rodriguez-Iturbe, I.; Rinaldo, A. Resilience of river flow regimes. Proc. Natl. Acad. Sci. USA 2013, 110, 12925–12930. [Google Scholar] [CrossRef] [Green Version]
  7. Wang, Y.; Rhoads, B.; Wang, D. Assessment of the flow regime alterations in the middle reach of the Yangtze River associated with dam construction: Potential ecological implications. Hydrol. Process. 2016, 30, 3949–3966. [Google Scholar] [CrossRef]
  8. Anindito, Y.; Haas, J.; Olivares, M.; Nowak, W.; Kern, J. A new solution to mitigate hydropeaking? Batteries versus re-regulation reservoirs. J. Clean. Prod. 2019, 210, 477–489. [Google Scholar] [CrossRef]
  9. Ferrazzi, M.; Vivian, R.; Botter, G. Sensitivity of Regulated Streamflow Regimes to Interannual Climate Variability. Earth’s Future 2019, 7, 1206–1219. [Google Scholar] [CrossRef] [Green Version]
  10. Chen, Z.; Li, J.; Shen, H.; Wang, Z. Yangtze River of China: Historical analysis of discharge variability and sediment flux. Geomorphology 2001, 41, 77–91. [Google Scholar] [CrossRef]
  11. Sun, H.; Wang, D.; Wu, Y.; Jing, L.; Liu, W. Analysis for the Effect of Hydropower and Water Conservancy Engineering on Basin Eco-environment in the Upper Yangtze River. Environ. Prot. 2017, 45, 37–40. [Google Scholar]
  12. Jiang, C.; Zhang, Q.; Luo, M. Assessing the effects of the Three Gorges Dam and upstream inflow change on the downstream flow regime during different operation periods of the dam. Hydrol. Process. 2019, 33, 2885–2897. [Google Scholar] [CrossRef]
  13. Yang, S.; Zhang, J.; Xu, X. Influence of the Three Gorges Dam on downstream delivery of sediment and its environmental implications, Yangtze River. Geophys. Res. Lett. 2007, 34, L10401. [Google Scholar] [CrossRef]
  14. Wang, Y.; Xia, Z.; Wang, D. A transitional region concept for assessing the effects of reservoirs on river habitats: A case of Yangtze River, China. Ecohydrology 2012, 5, 28–35. [Google Scholar] [CrossRef]
  15. Zhou, Y.; Zhang, Q.; Singh, V. Fractal-based evaluation of the effect of water reservoirs on hydrological processes: The dams in the Yangtze River as a case study. Stoch. Environ. Res. Risk Assess. 2014, 28, 263–279. [Google Scholar] [CrossRef]
  16. Wang, J.; Sheng, Y.; Wada, Y. Little impact of the Three Gorges Dam on recent decadal lake decline across China’s Yangtze Plain. Water Resour. Res. 2017, 53, 3854–3877. [Google Scholar] [CrossRef] [Green Version]
  17. Wang, Y.; Zhang, N.; Wang, D.; Wu, J.; Zhang, X. Investigating the impacts of cascade hydropower development on the natural flow regime in the Yangtze River, China. Sci. Total Environ. 2018, 624, 1187–1194. [Google Scholar] [CrossRef]
  18. Richter, B.; Baumgartner, J.; Powell, J.; Braun, D. A method for assessing hydrologic alteration within ecosystems. Conserv. Biol. 1996, 10, 1163–1174. [Google Scholar] [CrossRef] [Green Version]
  19. Richter, B.; Baumgartner, J.; Wigington, R.; Braun, D. How much water does a river need? Freshw. Biol. 1997, 37, 231–249. [Google Scholar] [CrossRef] [Green Version]
  20. Baker, D.; Richards, R.; Loftus, T.; Kramer, J. A new flashiness index: Characteristics and applications to midwestern rivers and streams. J. Am. Water Resour. Assoc. 2004, 40, 503–522. [Google Scholar] [CrossRef]
  21. Gao, B.; Yang, D.; Zhao, T.; Yang, H. Changes in the eco-flow metrics of the Upper Yangtze River from 1961 to 2008. J. Hydrol. 2012, 448, 30–38. [Google Scholar] [CrossRef]
  22. Wang, X.; Mei, Y.; Cai, H.; Cong, X. A New Fluctuation Index: Characteristics and Application to Hydro-Wind Systems. Energies 2016, 9, 114. [Google Scholar] [CrossRef] [Green Version]
  23. Ikegami, T.; Urabe, T.; Saitou, T.; Ogimoto, K. Numerical definitions of wind power output fluctuations for power system operations. Renew. Energy 2018, 115, 6–15. [Google Scholar]
  24. Wu, F.; Wang, J.; Sun, Z.; Wang, T.; Chen, L.; Han, X. An Optimal Wavelet Packets Basis Method for Cascade Hydro-PV-Pumped Storage Generation Systems to Smooth Photovoltaic Power Fluctuations. Energies 2019, 12, 4642. [Google Scholar] [CrossRef] [Green Version]
  25. Wolff, M.; Schmietendorf, K.; Lind, P.; Kamps, O.; Peinke, J.; Maass, P. Heterogeneities in electricity grids strongly enhance non-Gaussian features of frequency fluctuations under stochastic power input. Chaos 2019, 29, 103149. [Google Scholar] [CrossRef] [PubMed] [Green Version]
  26. Huang, F.; Chen, Q.H.; Li, F.; Zhang, X.; Chen, Y.Y.; Xia, Z.Q.; Qiu, L.Y. Reservoir-Induced Changes in Flow Fluctuations at Monthly and Hourly Scales: Case Study of the Qingyi River, China. J. Hydrol. Eng. 2015, 20, 05015008. [Google Scholar] [CrossRef]
  27. Srivastava, P.; Sharan, M.; Kumar, M. Development of observation-based parameterizations of standard deviations of wind velocity fluctuations over an Indian region. Theor. Appl. Climatol. 2020, 139, 1057–1077. [Google Scholar] [CrossRef]
  28. Fabris, L.; Lazzaro, G.; Buddendorf, W.B.; Botter, G.; Soulsby, C. A general analytical approach for assessing the effects of hydroclimatic variability on fish habitat. J. Hydrol. 2018, 566, 520–530. [Google Scholar] [CrossRef]
  29. Sauterleute, J.; Charmasson, J. A computational tool for the characterisation of rapid fluctuations in flow and stage in rivers caused by hydropeaking. Environ. Model. Softw. 2014, 55, 266–278. [Google Scholar] [CrossRef]
  30. Ge, H.; Guo, Q.; Sun, H.; Wang, B.; Zhang, B.; Wu, W. A Load Fluctuation Characteristic Index and Its Application to Pilot Node Selection. Energies 2014, 7, 115–129. [Google Scholar] [CrossRef] [Green Version]
  31. Gustafson, D.; Carr, K.; Green, T.; Gustin, C.; Jones, R.; Richards, R. Fractal-based scaling and scale-invariant dispersion of peak concentrations of crop protection chemicals in rivers. Environ. Sci. Technol. 2004, 38, 2995–3003. [Google Scholar] [CrossRef] [PubMed]
  32. Wang, X.; Virguez, E.; Kern, J.; Chen, L.; Mei, Y.; Patino-Echeverri, D.; Wang, H. Integrating wind, photovoltaic, and large hydropower during the reservoir refilling period. Energy Convers. Manag. 2019, 198, 111778. [Google Scholar] [CrossRef]
  33. Zhang, X.; Ma, G.; Huang, W.; Chen, S.; Zhang, S. Short-Term Optimal Operation of a Wind-PV-Hydro Complementary Installation: Yalong River, Sichuan Province, China. Energies 2018, 11, 868. [Google Scholar] [CrossRef] [Green Version]
  34. Wang, X.; Virguez, E.; Chen, L.; Duan, K.; Dong, Q.; Ma, H.; Mei, Y.; Wang, H. New Index for Runoff Variability Analysis in Rainfall Driven Rivers in Southeastern United States. J. Hydrol. Eng. 2019, 24, 05019031. [Google Scholar] [CrossRef]
  35. Committee on Hydropower Intakes. Glossary of Hydropower Terms. In Guidelines for Design of Intakes for Hydroelectric Plants; ASCE Library: Reston, VA, USA, 2014. [Google Scholar]
Figure 1. Flowchart of calculation of the river flow fluctuation.
Water 15 02166 g001
Figure 2. Hourly outflow of TGH reservoir on 1 January 2013.
Water 15 02166 g002
Figure 3. Geographical location of the Three Gorges Dam (TGD)–Gezhouba Dam (GD) hydro-junction.
Water 15 02166 g003
Figure 4. Hourly Power output, inflow, and outflow of the TGD reservoir in January 2013.
Water 15 02166 g004
Figure 5. SD of inflow and outflow and their reduction at the GD reservoir.
Water 15 02166 g005
Figure 6. Rates of mean fluctuation reductions in each month.
Water 15 02166 g006
Figure 7. Frequency, Kernel density estimation, and cumulative probability of the standard deviation reduction in inflow and outflow at the GD reservoir.
Water 15 02166 g007
Figure 8. Frequency, Kernel density estimation, and cumulative probability of normalized SD, FOD, CV, and RBF reduction in inflow and outflow at the GD reservoir.
Water 15 02166 g008
Figure 9. Frequency, Kernel density estimation, and cumulative probability of normalized RA, LT, NI, and SL reduction in inflow and outflow at the GD reservoir.
Water 15 02166 g009
Figure 10. Cumulative probability of normalized indices reduction in inflow and outflow at the GD reservoir.
Water 15 02166 g010
Figure 11. Scenarios of power output at down-cascade hydropower (power output process in re-regulation mode is the measured data at the GD, power output in run-of-river mode is the simulated data using fixed water head).
Water 15 02166 g011
Table 1. Functions of quantitative type.
IndicesSymbolFunction
Standard Deviation (SD) α S D α S D = 1 N i = 1 N ( y i y ¯ ) 2
First Order Difference (FOD) α F O D α F O D = 1 N 1 i = 1 N 1 | y i + 1 y i |
Coefficient of Variation (CV) α C V α C V = 1 N i = 1 N ( y i y ¯ ) 2 / y ¯
Richard-Baker Flashiness (RBF) α R B F α R B F = i = 2 N 1 0.5 ( | y i + 1 y i | + | y i y i 1 | ) / i = 1 N y i
Note: With the coordinates of points (xi, yi), and according to the functions listed above, the quantitative-type fluctuation indices can be obtained.
Table 2. Functions of contoured type.
IndicesSymbolFunction
Rotation Angle (RA) β R A β R A = 1 N i = 1 N ( exp ( θ i ) 1 )
θ i = { i = 1   o r   N , arctan | k i | 2 i N 1 , | arctan k i arctan k i 1 |
k i = { 1 i N 1 ,         y i + 1 y i x i + 1 x i i = N ,                 y N y N 1 x N x N 1
Length (LT) β L T β L T = 1 N 1 i = 1 N 1 ( x i + 1 x i ) 2 + ( y i + 1 y i ) 2
Number of Inflexion (NI) β N I β N I = 1 N 2 i = 2 N 1 δ i
δ i = { 0 ,   if   k i × k i 1 > 0 1 ,   if   k i × k i 1 < 0
Slope (SL) β S L β S L = 1 N 1 i = 1 N 1 k i
Note: With the coordinates of points (xi, yi), and according to the functions listed above, the contoured-type fluctuation indices can be obtained.
Table 3. Data of the hourly river flow.
i123456789101112
xi0.000 0.042 0.083 0.125 0.167 0.208 0.250 0.292 0.333 0.375 0.417 0.458
yi593856365333529152495246524458946544694873517362
i131415161718192021222324
xi0.500 0.542 0.583 0.625 0.667 0.708 0.750 0.792 0.833 0.875 0.917 0.958
yi737273247275633753985596579365877381686263425799
Note: In this study the time series starts from 1 January 2013, which is the origin point of x-axis.
Table 4. Fluctuation values of the hourly river flow.
Quantitative IndicesContoured Indices
ItemsSDFODCVRBFRALTNISL
Fluctuation796.19 348.35 0.13 0.05 3.99 363.50 0.17 −144.52
Unitm3/sm3/s--rad--m3/(s·day)
Note: The unit of the fluctuation indices is decided by the functions and the units of x-axis and y-axis. In the following part, the unit does not influence the comparison and discussion, thus, it is not marked for the concise.
Table 5. Rates of mean fluctuation reductions.
Quantitative IndicesContoured Indices
ItemsSDFODCVRBFRALTNISL
Inflow13383780.1150.0315.643940.238974
Outflow10032670.0760.0183.692780.147570
Reduction3351110.0390.0131.951160.091404
Rate25.09%29.33%34.05%41.35%34.71%29.33%38.07%41.52%
Note: The mean fluctuation is the average value of fluctuation during the whole period; reduction = inflow − outflow; rate = reduction/inflow.
Table 6. Rates of mean fluctuation increments in the power output calculated using quantitative indices.
ItemRun-of-RiverRe-RegulationIncrementRate
SDFODCVRBFSDFODCVRBFSDFODCVRBFSDFODCVRBF
Fluctuation13232.10.0750.01711332.00.0580.015−19−0.1−0.017−0.002−14%−0.3%−22%−11%
Note: The fluctuation in the hydropower output in the run-of-river mode was used as the background value, while the fluctuation in the hydropower output in the re-regulation mode was used as the comparative value; increment = comparative value − background value; rate = increment/background value. It should be noted that: (1) the GD reservoir operates in the re-regulation mode, while the run-of-river mode is a hypothesis; (2) the hydropower output in the run-of-river mode is calculated based on the real results of GD reservoir operation, such as the inflow and output coefficients.
Table 7. Rates of mean fluctuation increments in the power output calculated using contoured indices.
ItemRun-of-RiverRe-RegulationIncrementRate
RALTNISLRALTNISLRALTNISLRALTNISL
Fluctuation2.997330.1211019.528330.423506.53300.302−52218%0%249%−51%
Disclaimer/Publisher’s Note: The statements, opinions and data contained in all publications are solely those of the individual author(s) and contributor(s) and not of MDPI and/or the editor(s). MDPI and/or the editor(s) disclaim responsibility for any injury to people or property resulting from any ideas, methods, instructions or products referred to in the content.