Case Report

Numerical Evaluation of Large-Scale Groundwater Extraction in Groundwater System at Wellfields in the Namwon Area of Jeju Island, South Korea

1
School of Earth and Environmental Sciences, Seoul National University, 1 Gwanak-ro, Gwanak-gu, Seoul 08826, Republic of Korea
2
School of Ocean and Earth Sciences, Jeju National University, 102 Jejudaehak-ro, Jeju City 63243, Republic of Korea
3
Jeju Groundwater Research Center, Jeju Research Institute, 253 Ayeon-ro, Jeju City 63147, Republic of Korea
*
Author to whom correspondence should be addressed.
Water 2023, 15(12), 2151; https://doi.org/10.3390/w15122151
Submission received: 11 April 2023 / Revised: 16 May 2023 / Accepted: 29 May 2023 / Published: 7 June 2023
(This article belongs to the Section Hydrogeology)

Abstract

:
A regional water supply system in Jeju Island, South Korea, comprising 23 wellfields with 5 to 10 groundwater extraction wells (20–100 m spacing), provides water to the residents of the island. Regular large-scale groundwater pumping and excessive extraction in these wellfields have resulted in a decrease in groundwater levels. Using a numerical model, we aimed to assess the effect of large-scale groundwater extraction at four wellfields in Namwon, located in the southeastern part of the island. The numerical model estimated an approximately 0.16–0.21 m decline in water levels, which is consistent with field observations. Minor declines are inherently influenced by the regional hydrogeological setting of the study area, which involves high precipitation rates and a groundwater flow system that facilitates rapid groundwater replenishment. However, the model also shows that the decrease in groundwater levels is expected to intensify to 0.20–0.77 m in cases of extreme drought periods and increasing rates of groundwater pumping. In addition, this study suggests that sufficient well and wellfield separation distances should be considered to prevent well interference effects in areas, such as the western part of the island, with increased decline in water levels due to groundwater extraction.

1. Introduction

Groundwater is an essential resource for drinking, irrigation, and industrial water worldwide [1]. However, owing to the increase in water demand due to rapid population growth, agricultural activities, and industrial operations, groundwater depletion has become a global issue [2,3,4,5,6,7,8,9,10]. The global rate of groundwater withdrawal has increased from 312 km3/year in the 1960s to 959 km3/year in 2017 [8,11]. As a result, rapid rates of groundwater depletion (0.6–40.0 mm/year) have been estimated for major aquifers worldwide [12].
A declining trend in groundwater levels was also observed on Jeju Island, which is the largest island in Korea. In 2009, decreasing trends in water levels were estimated in 32% of the 94 monitoring wells [13]. However, in 2021, half of these wells showed a decreasing trend [14]. Recently, various factors, such as an increase in the number of residents and tourists, increased land use, and climate change, have negatively affected the groundwater levels in Jeju Island [15,16]. As the residents of Jeju Island rely on groundwater resources for approximately 96% of their total water use [15], ensuring groundwater sustainability even in the presence of these threats is of importance for the island.
To supply drinking water to residents in Jeju Island, the regional water supply system (RWSS) was first constructed in the eastern part in 1996. The total groundwater extraction rate at the 23 wellfields in Jeju Island was 2.40 × 10⁸ m3/year in 2020 [15], with 29% of the total extraction rate coming from groundwater wells in the island (6.96 × 10⁷ m3/year). Designed to withdraw a large amount of groundwater, each wellfield of the RWSS is composed of 5 to 10 pumping wells, with an average pumping rate of 2000 m3/day at each well and well separation distances of 20–100 m. When the wells are located close within the radius of influence of the pumping, a larger drawdown of the water level is expected due to hydraulic interference effects [17]. In addition, groundwater levels decreased up to 4 m due to a reduction in precipitation during drought periods [16], causing shortages in the drinking and irrigation water supply on the island. Therefore, in the circumstance that Jeju residents rely on the RWSSs for their water supply, establishing strategies for the sustainable management of the RWSSs based on a proper evaluation of groundwater level is necessary.
Pumping large amounts of groundwater can cause significant problems such as groundwater depletion, land subsidence, seawater intrusion in the case of coastal areas, and groundwater pollution [12,18,19,20]. Abundant previous studies have evaluated general groundwater flow fields and assessed the impact of hydrological stresses on the subsurface aquifer system using groundwater numerical models [20,21,22,23,24,25]. Nastev et al. [24] simulated the regional groundwater flow system of southwestern Quebec, Canada, and quantified a water budget for the regional aquifer using a numerical model. In order to maintain the sustainability of groundwater resources against groundwater extractions, Ebraheem et al. [21], Pétré et al. [25], Qian et al. [10], and Muñoz et al. [23] simulated various scenarios of groundwater extraction at wellfields and evaluated optimal groundwater exploitation scenarios. Furthermore, in terms of groundwater contamination at wellfields, Cousquer et al. [26], Janža [20], and Mercurio et al. [22] also evaluated the optimization of wellfield management plans through numerical modeling to ensure a safe drinking water supply. Under the concern of increasing abnormal climate, such as extreme droughts [27,28], negatively impacting on water resources [29], the establishment of groundwater management plans against the large-scale groundwater extractions are needed.
Under the circumstances of declining groundwater levels and climate change on Jeju Island, the impact of large-scale groundwater extraction at the RWSS on the aquifer system needs to be assessed to maintain groundwater resource. Therefore, this study aimed to evaluate changes in groundwater levels caused by the operation of the RWSS using numerical modeling approaches. The study examined the Sinheung and Uigwi RWSSs in the Namwon region, southeastern Jeju Island, which is characterized by large amounts of extracted groundwater (10,370–10,663 m3/day at each wellfield; according to the Water Resources Headquarters of Jeju Special Self-Governing Province). This study aimed to (1) develop a 3-D groundwater numerical model considering the operation of the RWSSs, (2) quantify the effect of groundwater extraction at RWSSs on groundwater level changes, and (3) predict changes in groundwater levels caused by various conditions, such as changes in groundwater extraction rates, drought conditions, and adjustment of separation distances between wells or wellfields. Our findings have implications for managing RWSSs to ensure groundwater sustainability in Jeju Island.

2. Materials and Methods

2.1. Study Area Description

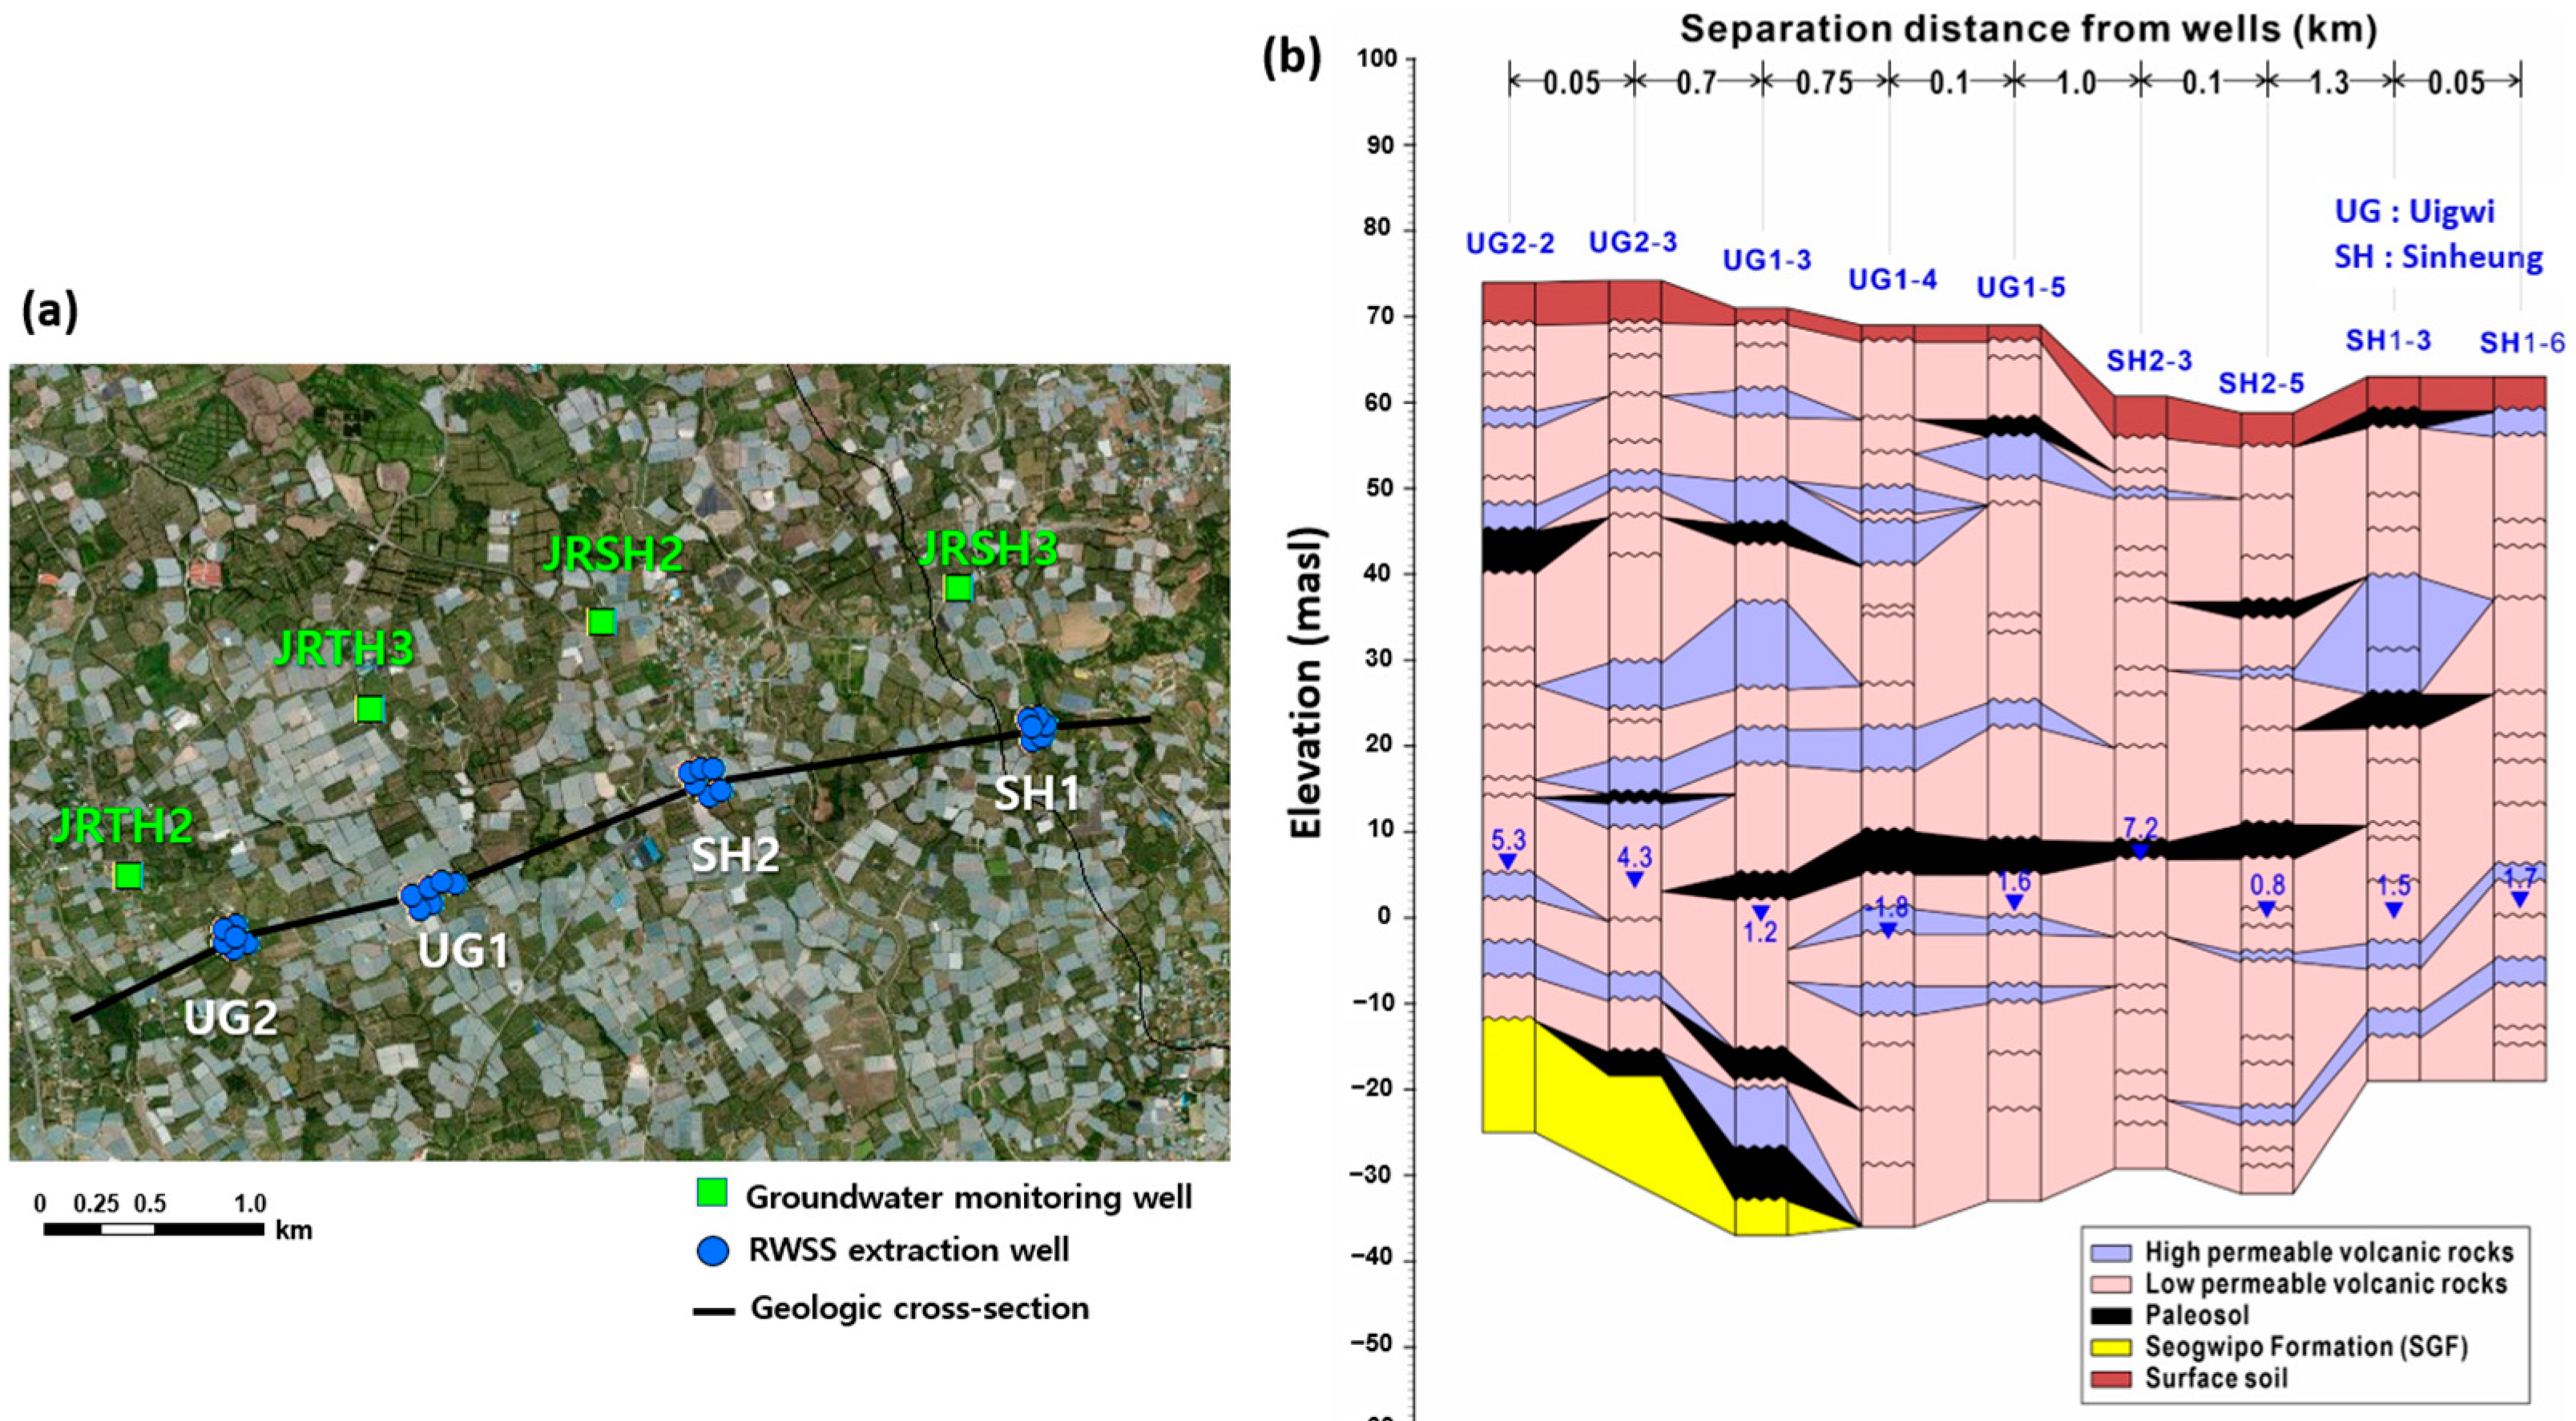
Four RWSSs (Sinheung 1, SH1; Sinheung 2, SH2; Uigwi 1, UG1; and Uigwi 2, UG2) are situated 60–76 masl on Namwon, the southeastern part of Jeju Island (Figure 1 and Figure 2, Table 1). UG1, UG2, and SH2 were developed on the eastern side of the Namwon Watershed, whereas SH1 was constructed on the western boundary of the Pyoseon Watershed (Figure 1b). In addition, the distances between the RWSSs and corresponding coastlines range from 2.0–3.3 km, and influences of seawater intrusion due to groundwater extractions at the wellfields did not occur, showing a low level of Cl (6.5–7.7 mg/L; [30]). A wellfield consisting of six pumping wells was developed at each RWSS.
A total of 24 wells were distributed in the study area with depths of 82–105 m (Table 1). As shown in Figure 1c, pumping wells for each wellfield were installed very close to each other, with an average well separation distance of 62 ± 22 m (35–122 m). To extract large amounts of groundwater, a maximum withdrawal rate of 60,000 m3/month is permitted for all extraction wells. The actual withdrawal rates recorded from 2010 to 2020 ranged from 40,963 to 51,209 m3/month, which is 69–85% of the permitted rates (Table 1; according to the Water Resources Headquarters of Jeju Special Self-Governing Province). Annually, 12.75 million m3 of groundwater is extracted at the four wellfields (3.11 million m3/year from SH1, 3.29 million m3/year from SH2, 3.14 million m3/year from UG1, and 3.20 million m3/year from UG2). There has been no distinct difference in the groundwater pumping rates among the four wellfields.
A geological map of the study area and a cross-section across the RWSS wells (UG2-2 through SH1-6) are shown in Figure 2. Surface soil, volcanic rocks, paleosols, and the Seogwipo Formation (SGF) are the main geological units underlying the study area. As Jeju Island was created by volcanic activities, the major geologic unit in the study area is volcanic rock. The volcanic rocks are hydrogeologically characterized by high- and low-permeability layers based on the development of clinkers, scorias, and fracture zones. The highly permeable layers in volcanic rocks may act as main channels of groundwater flow. Paleosols were created during the intermission periods of volcanic eruptions and consist mainly of clay, which has low permeability. Interbeds of permeable volcanic rocks and paleosols are observed in all extraction wells (Figure 2b). Underlying the volcanic rocks and paleosol layers, the SGF is composed of silt, sand, and shell fossils. The SGF also acts as a low-permeability layer, and it determines the type of groundwater in Jeju Island [31]. It is present at elevations of −30 to −10 m in UG2-2, UG2-3, and UG1-3. Groundwater levels in the wells in the cross-section vary from −1.8–7.2 masl, showing a possibility of higher water levels in UG2-2, UG2-3, and SH2-3 than those in the other wells (Figure 2b). Although UG1 and UG2 are located close (separation distance of ~0.7 km), the main causes for the different groundwater levels at these RWSSs are assumed to be (1) the confining condition controlled by the paleosol, and (2) the depth at which the SGF is present.
The average precipitation of the Tosan 1 weather station located near the RWSS in the study area (Figure 1b) was recorded as 2348.1 mm (1992–2020), which is higher than that of Jeju Island (1679.5 mm; average rate at Jeju, Seongsan, Seogwipo, and Gosan weather stations; [32]). The eastern and southern parts of the island usually receive greater amounts of precipitation than the other parts [33]. Since Korea is influenced by the monsoon climate, 71.2% of the annual precipitation amount is concentrated during the wet season (April–October), with the remaining 28.8% of precipitation occurring during the dry season (November–March). The precipitation rates also showed annual variations; in particular, only 60% and 80% of the average annual precipitation was recorded in the drought periods of 2013 and 2017, respectively. Groundwater recharge rates in the study area were estimated as 46.4% and 52.4% for the Namwon and Pyoseon watersheds [34], respectively. Similar to the spatial variation in precipitation, groundwater recharge rates in the study area also showed higher values than those of the entire Jeju Island (45.8%; [34]).

2.2. Numerical Model Construction

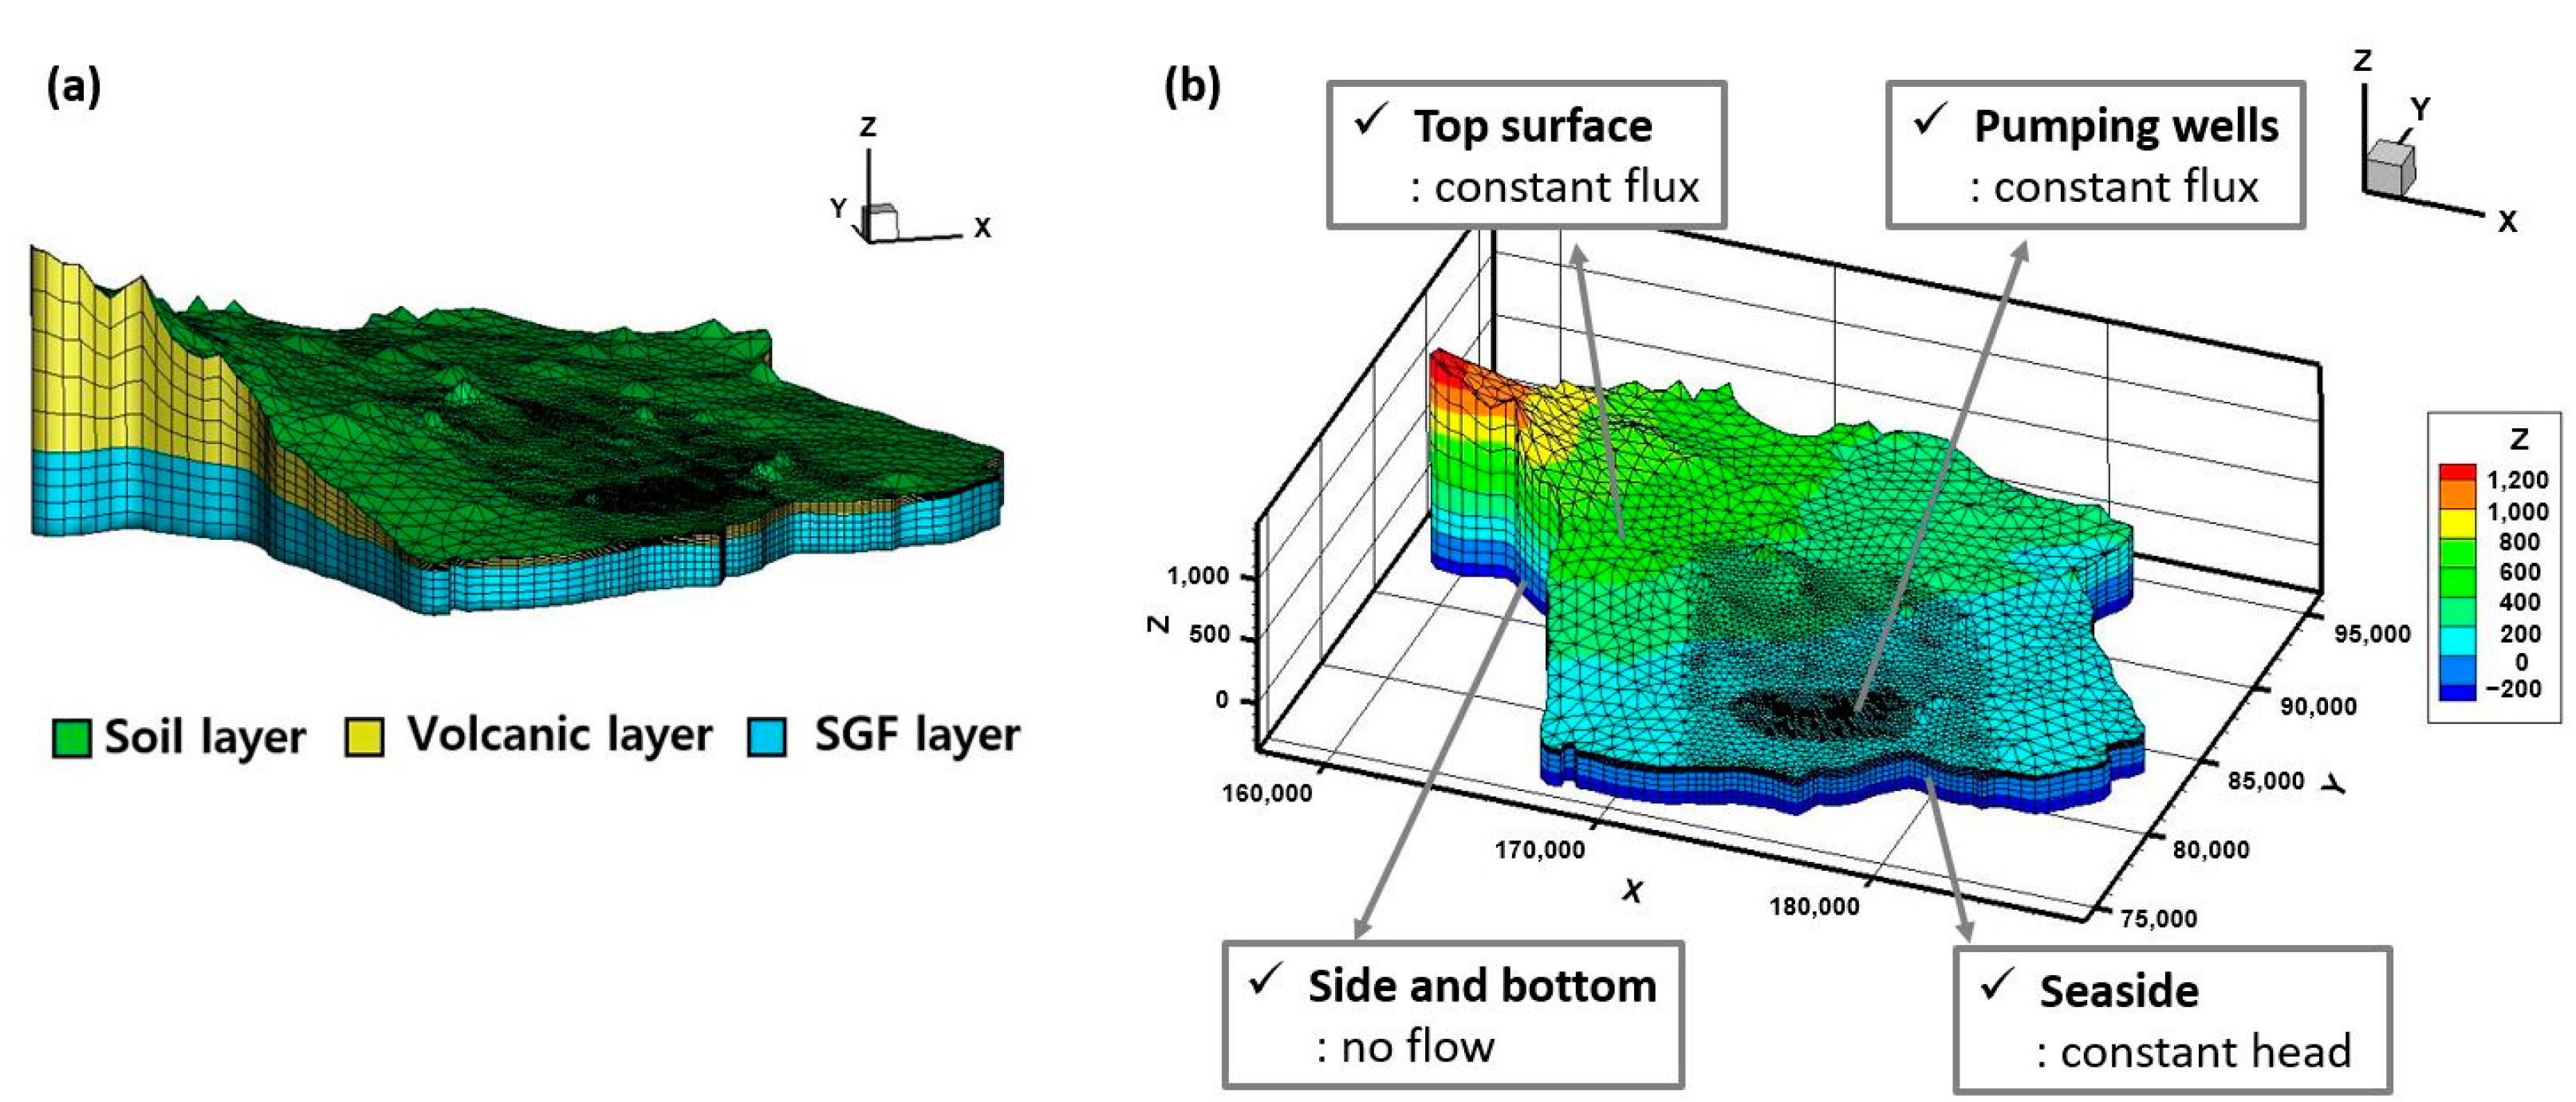
To quantify the effect of large-scale groundwater extraction at Namwon wellfields on the groundwater system, we constructed a three-dimensional (3-D) groundwater flow model using the modeling interface of HydroGeoSphere [35]. A combined watershed boundary of Namwon and Pyoseon, with a total area of 342 km2 (Figure 3), was used as the boundary of the model domain. A finite triangular mesh was created across the domain; the mesh size was refined to cover close separation distances between the extraction wells. The top elevation of the 3-D model domain was set using the digital elevation model data, whereas the bottom elevation was uniformly assigned as −300 masl. Although the hydrogeology of the study area has heterogeneous characteristics (Figure 2b), for the purpose of model efficiency, we simplified the hydrogelogical layers of the 3-D model consisting of top soil, volcanic, and SGF layers (Figure 3a), based on the geological logs [36,37]. The numbers of nodes and elements in our model were 48,912 and 88,815, respectively.
To analyze the characteristics of water level fluctuations caused by groundwater extraction at the RWSSs, a pseudo-steady-state flow condition was simulated. To execute the pseudo-steady-state flow model, temporal boundary conditions (BCs), such as recharge and pumping rates of the RWSSs, were applied. At the southern coastal boundary, a fixed-head BC was applied for a constant head of 0 m. Based on the determination of outer boundaries of the model domain as the watershed boundaries, no-flow BCs were assigned to the left and right sides of the model domain (Figure 3b). Since the modeled area was characterized by large variations in altitude (0–1268 masl), significant differences in precipitation were observed depending on the altitude. Hence, to simulate variations in the groundwater recharge amount according to the elevation differences in our model, an altitude-varying recharge rate BC was applied on the top surface by calculating the average precipitation amounts at every 200 m altitude based on the linear relationship between precipitations and altitudes (Figure S1). Then, an average groundwater recharge rate of 49.4% [34] was assigned for the recharge rate BC. At the pumping well nodes from the four RWSSs, constant pumping BCs were applied at the 24 withdrawal wells using the average pumping rate from 2010 to 2020 provided by the Water Resources Headquarters of Jeju Special Self-Governing Province. In addition, 39 groundwater wells for agricultural use were set by the pumping BC nodes by applying uniform pumping rates at each well (78.49–626.55 m3/day; according to the Jeju headquarters of Korea Rural Community Corporation).
The hydrogeological properties, such as porosity, hydraulic conductivity, and specific storage, of each geological layer used in our model are listed in Table 2. As heterogeneous hydrogeological features were not considered in our numerical model, the same values of model parameters were used for each geological layer. The model parameters were assigned based on a previous study [38,39], while the values for hydraulic conductivity were determined using model calibration processes. To obtain a reasonable match between the simulated and observed heads, the hydraulic conductivity of each geological layer was adjusted. For calibrating the steady-state flow model, a long-term groundwater level monitoring data from a total of 19 wells (Figure 1b) were used as observation head data by averaging the groundwater levels from 2010 to 2020.

2.3. Model Scenarios

2.3.1. Groundwater Extraction at the RWSS

To provide water to Jeju residents, a large amount of groundwater has been extracted at Namwon wellfields over the last two decades. The prolonged extraction of groundwater at the wellfields would alter groundwater levels and flow fields. Therefore, the present condition of RWSS operations was considered as the base case in assessing the effects of groundwater extraction, using numerical modeling approaches. The initial case prior to the operation of the RWSS was reversely simulated by removing pumping rate BCs at the wellfield nodes of the base case. Subsequently, the differences in the modeled flow fields between the two cases were evaluated. The spatial distribution of the water level drawdowns caused by groundwater extraction at the wellfields was analyzed. In addition, to consider future increases in water demand, we simulated increasing pumping cases by applying pumping rates that are 1.5 and 2.0 times of the current rates.

2.3.2. Drought Conditions

A previous study by Song et al. [40] predicted that droughts on Jeju Island would intensify in the future. In addition, the water demand on the RWSSs would increase during drought periods, along with decreases in the groundwater levels as the amount of groundwater recharge decreases [15]. Our study accounted for these conditions, assuming that the reduced recharge rate in 2013 would be consistent with the drought case simulation because the annual amount of precipitation in 2013 was only 60% of the average amount of precipitation in the study area. In addition, considering the increasing water demands during the drought periods, the groundwater pumping rates at the RWSSs was also increased by 1.5 and 2.0 times of the present rates to simulate the drought cases. Through the drought scenario, the increase in water demand due to drought and the resulting change in water level were predicted.

2.3.3. Adjustment of Well Separation Distances

According to the Jeju Special Self-Governing Province Groundwater Management Ordinance, Article 8 (Ordinance on Restrictions on Permission for Groundwater Development and Use) limits further operations in areas within a radius of 250 m from existing sites for groundwater development. However, when two or more groundwater development and utilization facilities are installed in the same place of business, groundwater development is allowed. Therefore, there is no restriction on the minimum separation distance between the extraction wells in a wellfield at the RWSS. Since the drawdown of water levels is expected to intensify for wells located close to each other [17], the separation distance between each extraction well was increased to 250 m in the simulation. We also modeled the increasing separation distance among the four wellfields (UG1, UG2, SH1, and SH2), owing to their close distance with each other.

3. Results

3.1. Groundwater Flow Model Results

The 3-D groundwater flow model was calibrated using a trial-and-error method to obtain high correlations between the simulated and observed heads. Figure 4a presents 1:1 plots of the observed and simulated heads for all 19 monitoring wells in the modeled area. The results of the calibrated model showed a high coefficient of determination (R2) of 0.92, indicating that our numerical model could considerably simulate the regional groundwater flow fields in the study area. In addition, around the wellfields (groundwater extraction and upstream monitoring wells), a high value of R2 (0.98) between the observed and simulated heads (Figure 4b) also indicated that our model sufficiently characterized the groundwater flow fields in the vicinity of the Namwon wellfields. A possibility of simulated heads being lower than the observed heads is shown in Figure 4a,b, implying that geologically heterogeneous features at the local scale would cause differences in the spatial distribution of water levels in the study area. Based on the regional distribution of groundwater heads (Figure 4c), groundwater flows from the western mountainous area (higher heads) towards the coastal area (lower heads).

3.2. Model Scenario Results

3.2.1. Operation of the RWSS

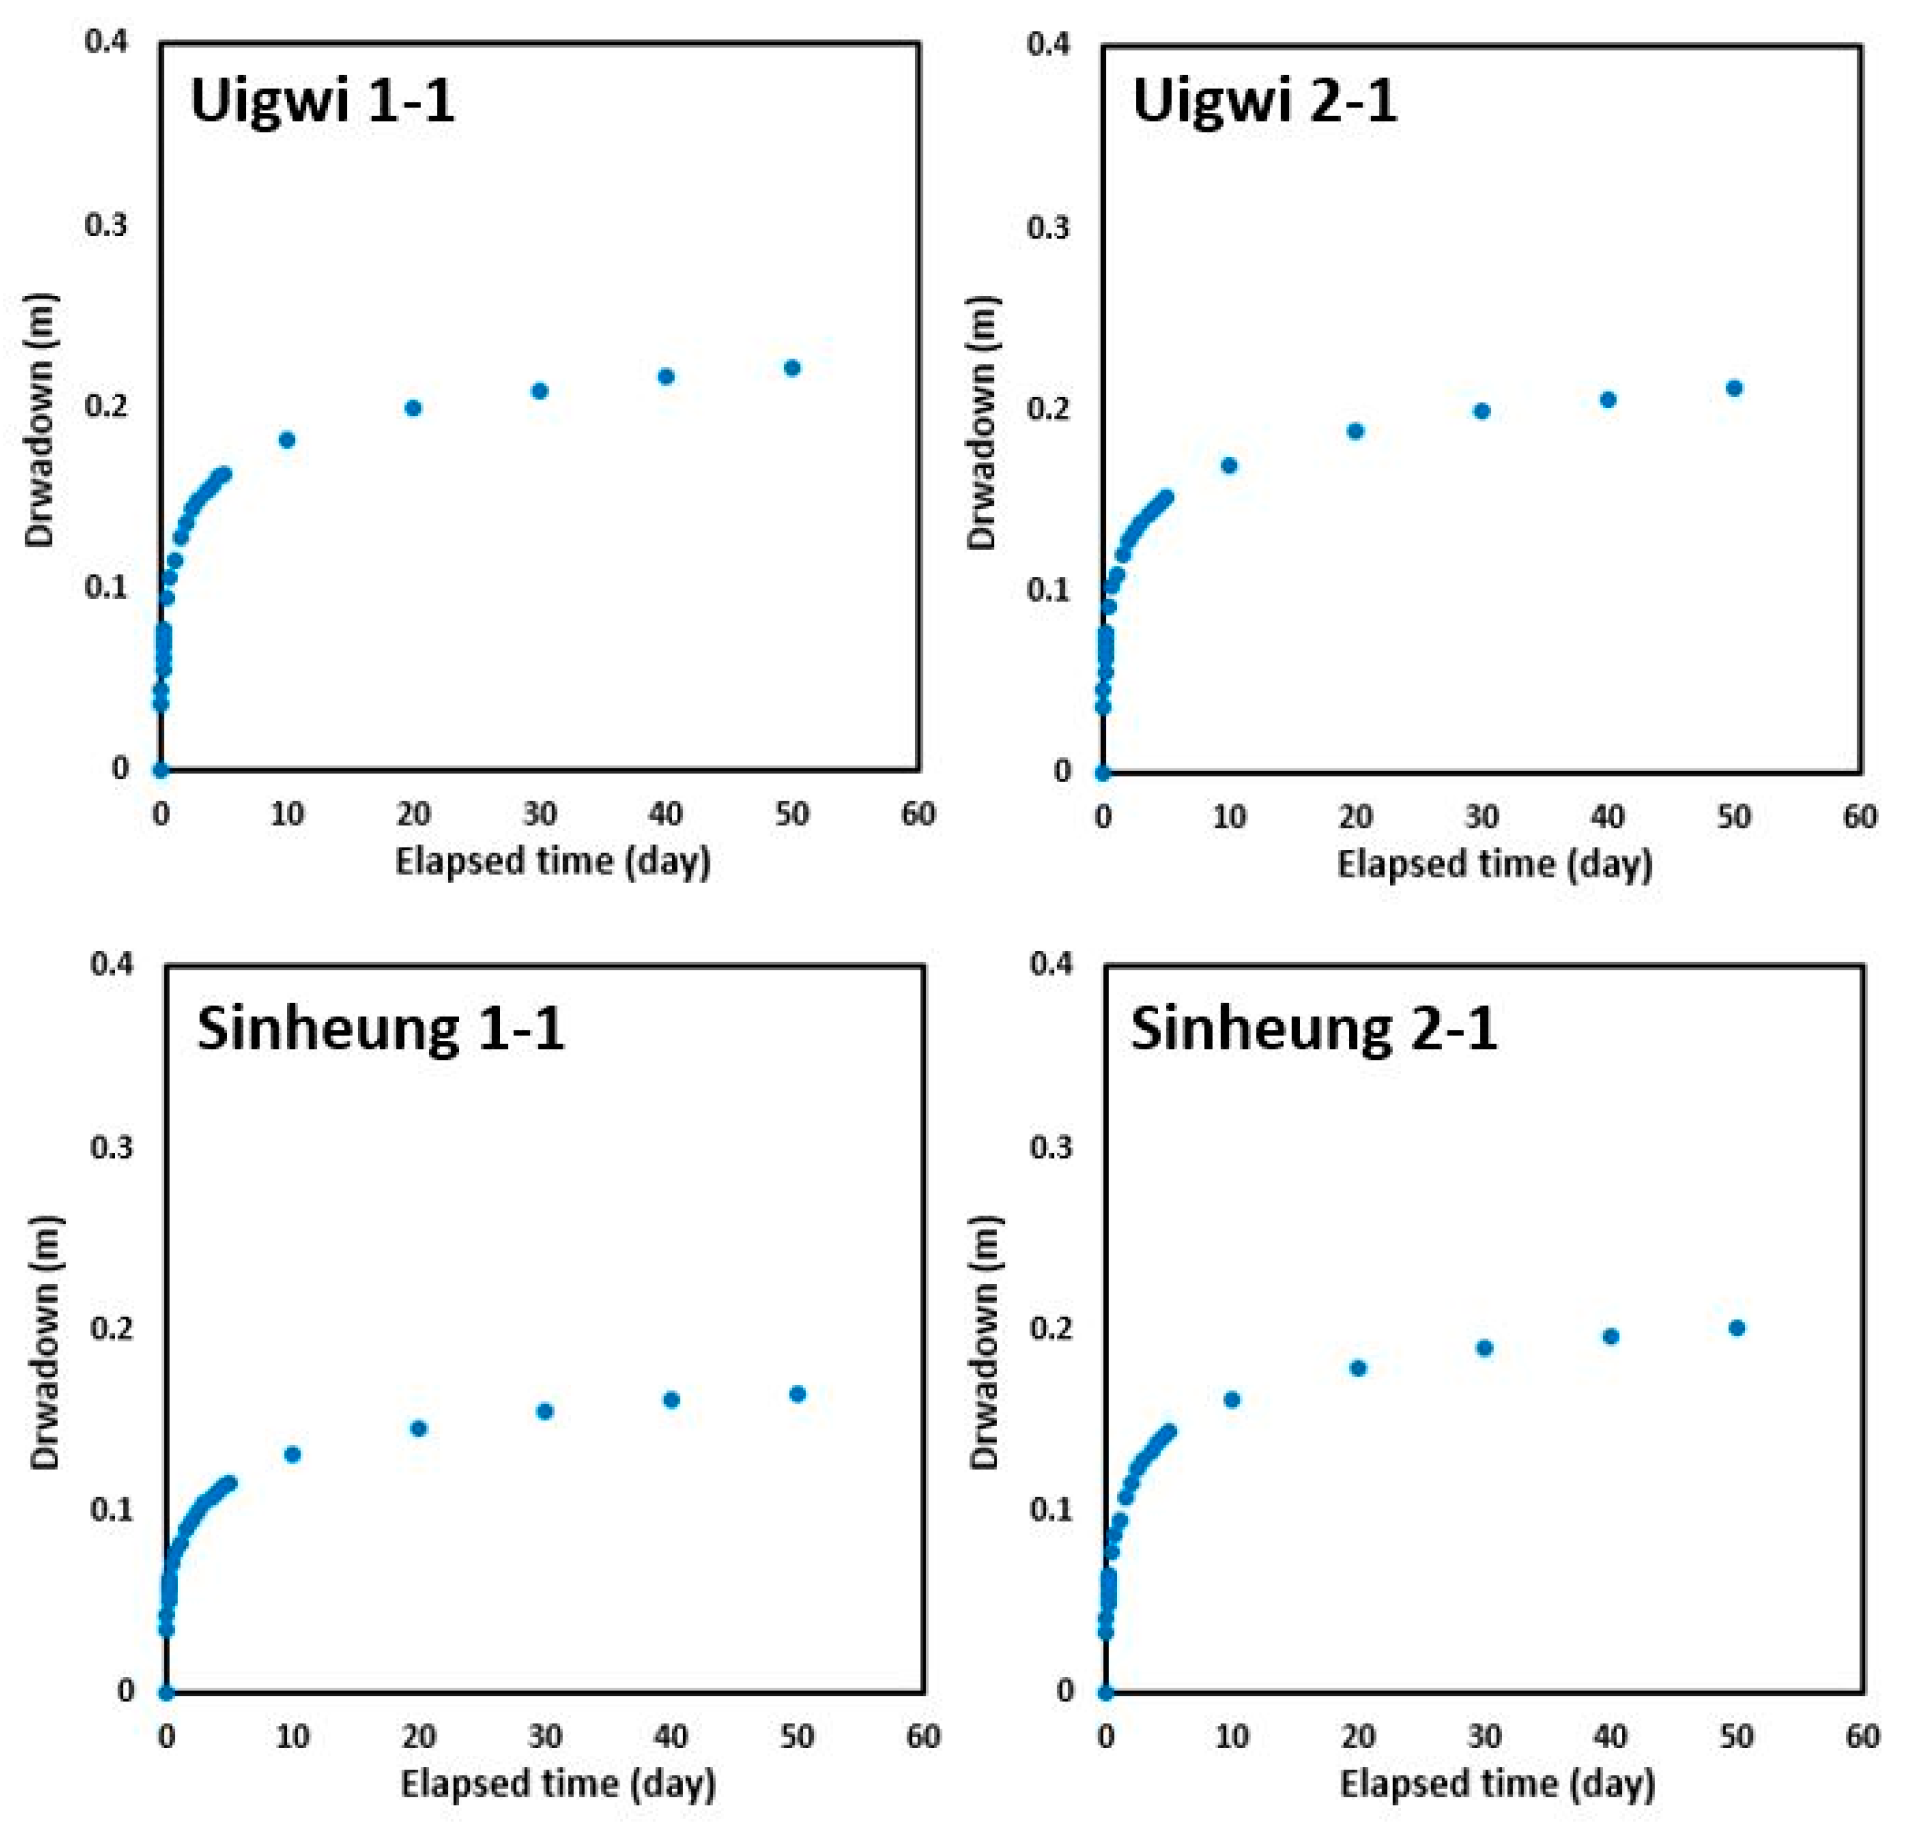
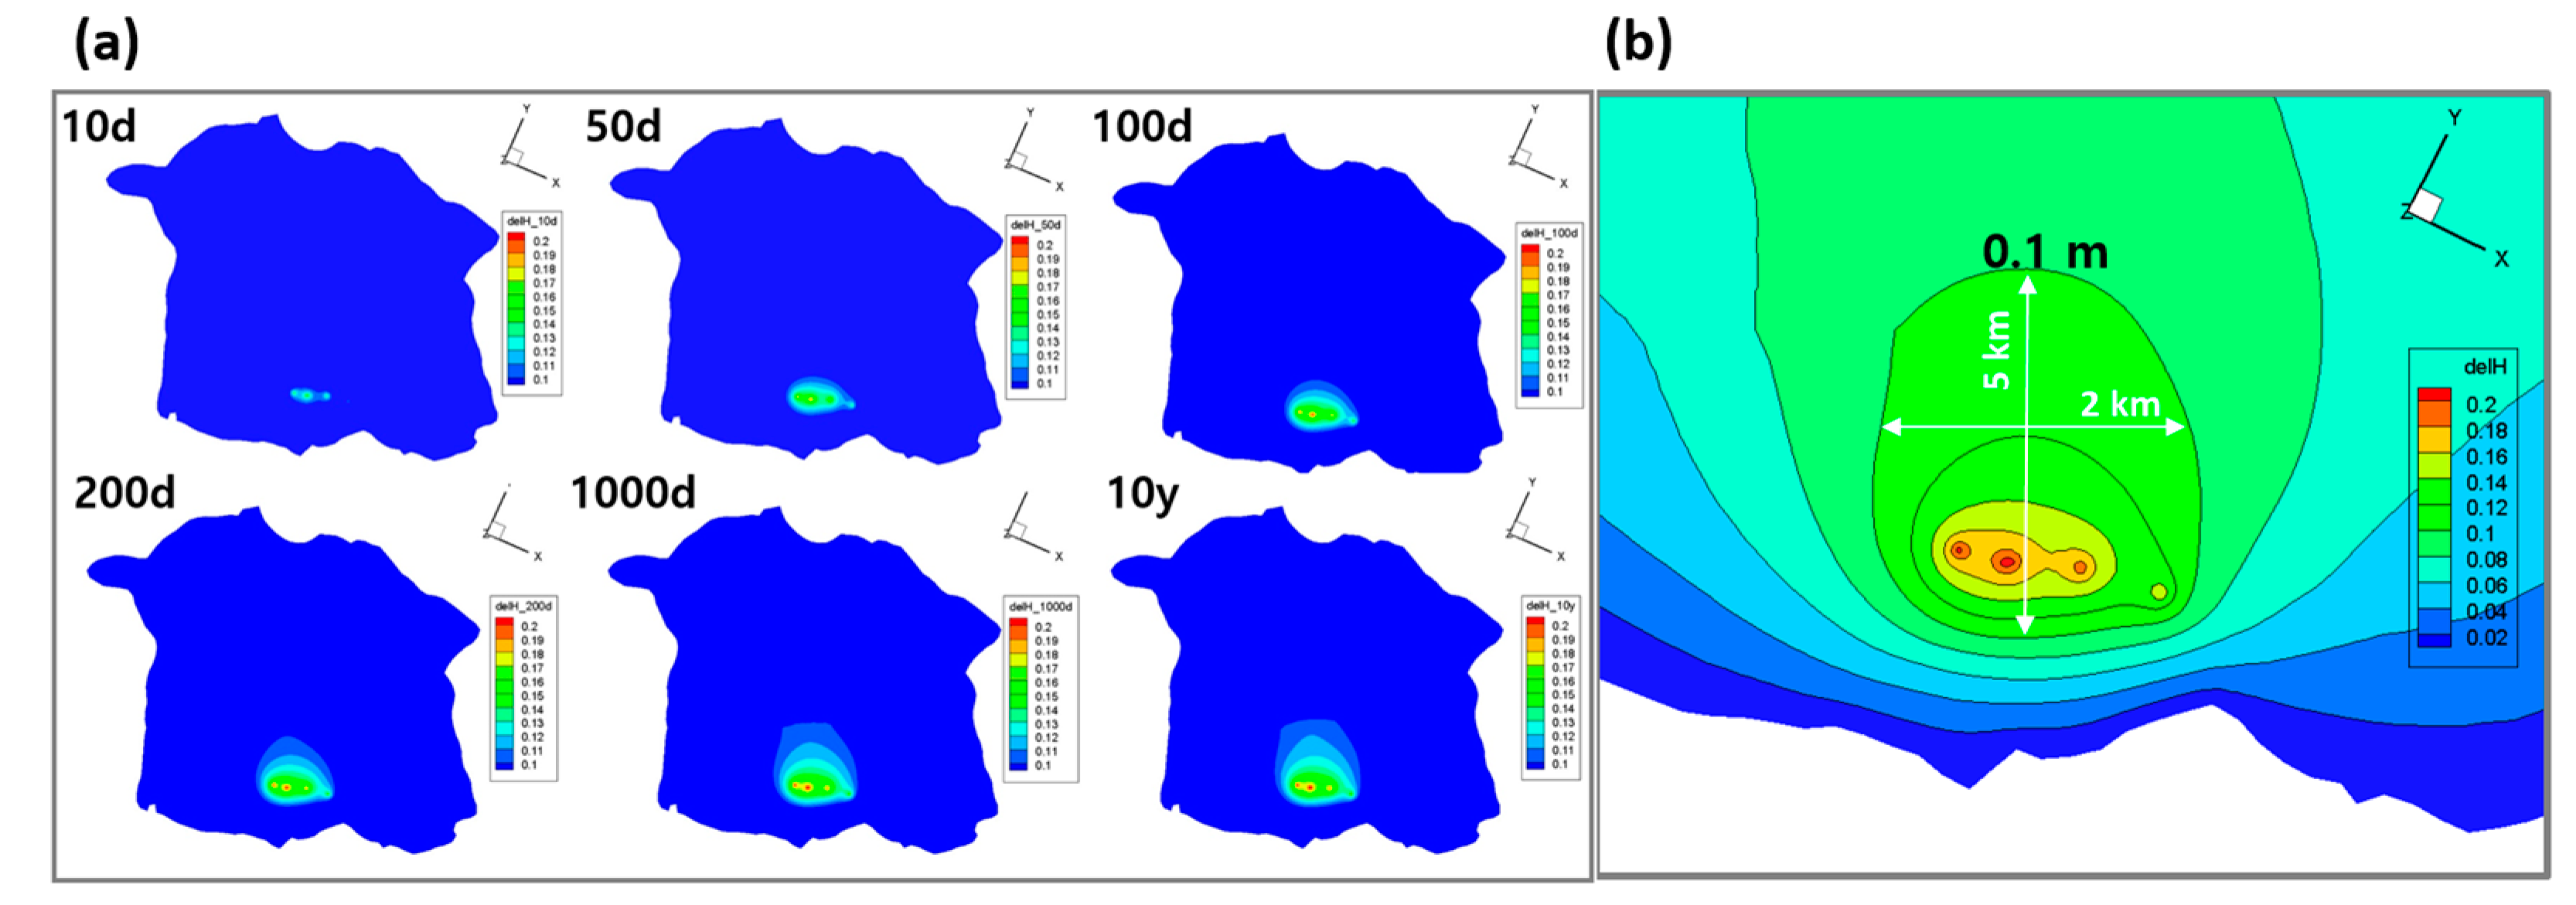
Due to the pumping of groundwater at the Namwon wellfields, decreases in the water levels at four extraction wells were estimated to range from 0.16 to 0.21 m (Figure 5). Although a large amount of groundwater was extracted from the wellfields, no significant decrease in the water level was computed in our numerical model. Even though six extraction wells were located at each wellfield, the changes in drawdown for only one extraction well are provided in Figure 5, as all extraction wells at each wellfield showed similar drawdown values (Table 3). The simulated drawdowns at the extraction wells from different wellfields show similar shapes (Figure 5), which is a limitation of our study involved by the simplification of hydrogeological settings in the model. Temporal variations and spatial distributions of groundwater level changes before and after the initiation of RWSS pumping events are shown in Figure 6a. With time, regions of the head drawdown have increased as the water level decreased. The boundary of 0.1 m water level decrease was simulated to a length of 5 km and a width of 2 km, with distances of 4.76 km north, 1.28 km west, and 516 m east of the wellfields (Figure 6b).
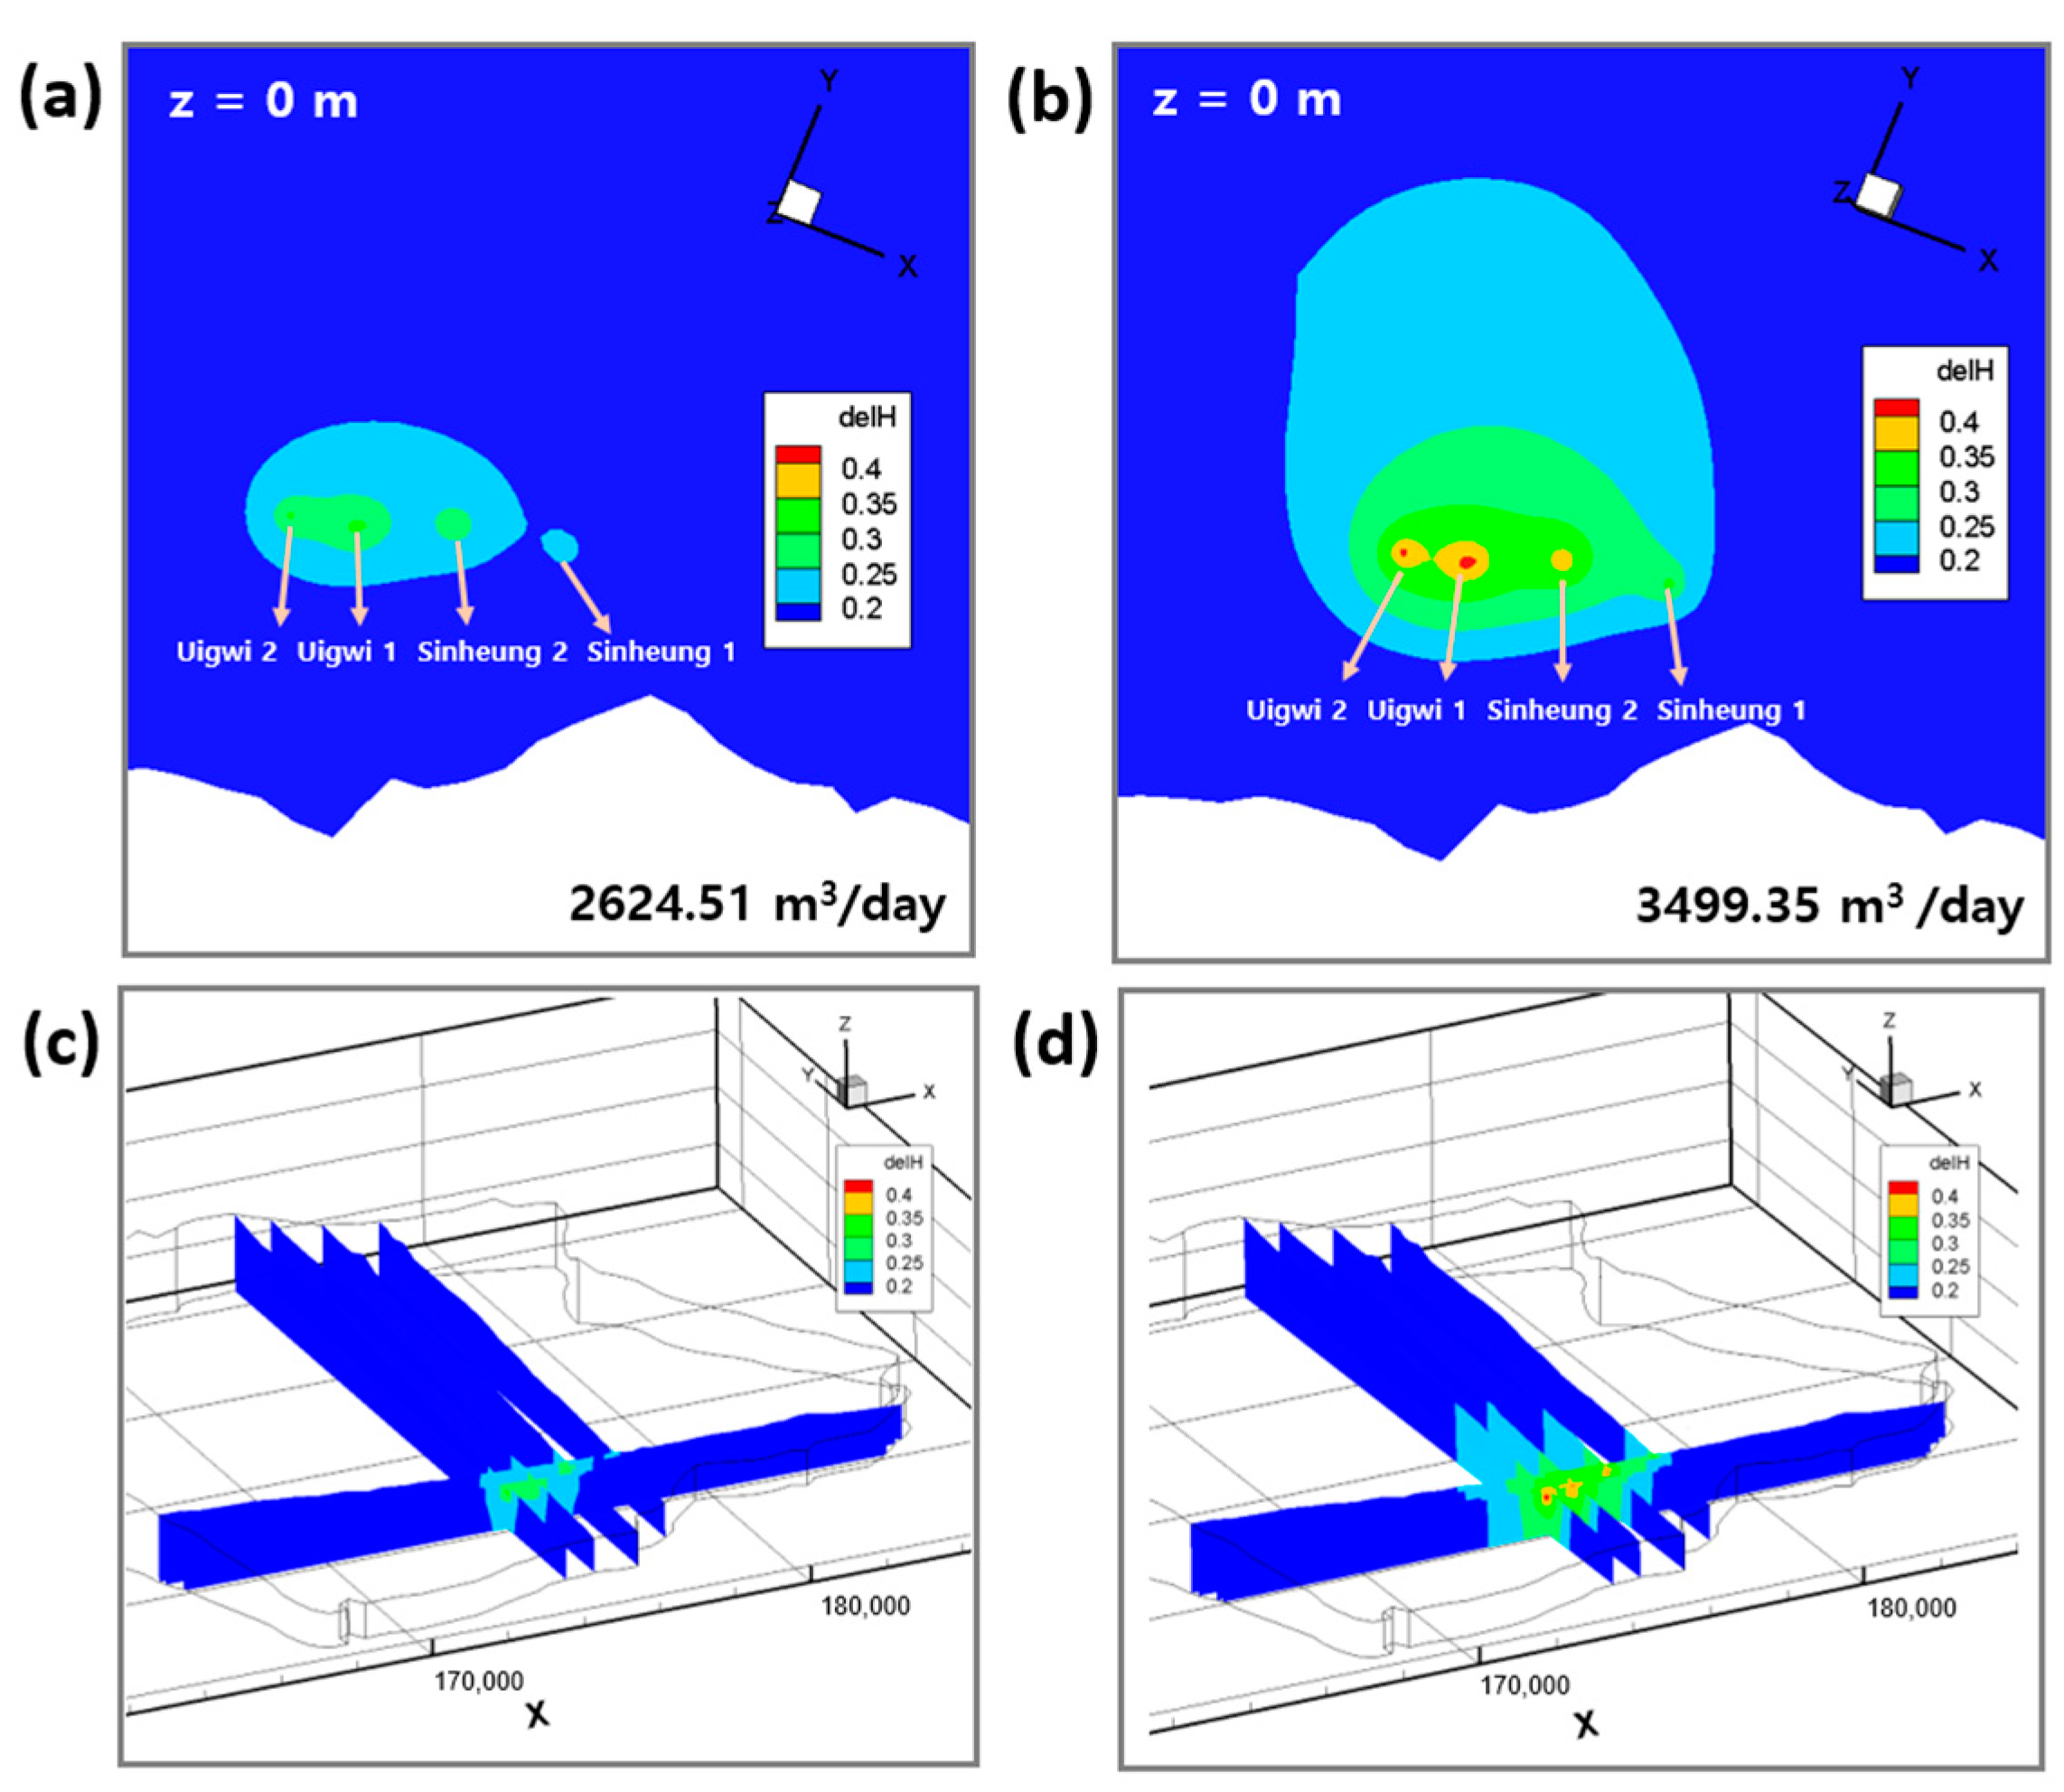
Figure 7 shows the results of the model for cases of increased groundwater extraction rate at 1.5 and 2 times of present extraction rates. Moreover, the water levels decreased by approximately 0.29–0.38 m upon increasing the pump rate 1.5 times. When the amount of pumped water was doubled, a maximum water level decrease (0.38–0.51 m) was observed at the extraction wells. Even though the groundwater extraction rates increased, the water levels at the extraction wells did not decrease significantly.

3.2.2. Drought Condition

Drought case models were performed to determine the possible extent of the decline of the groundwater table due to the operation of the RWSS during drought periods. In drought conditions (60% of the present recharge rate) with present pumping rates, the groundwater levels at the extraction wells drops to 1.63–2.33 m, showing a decline of water levels (0.47–0.54 m) against the present recharge conditions (Figure 8). A reduction in recharge amounts due to drought conditions would decrease the groundwater levels, deteriorating the supply of public water from the RWSS in the study area. In addition, if water demands on the RWSS would increase during the drought periods, increasing groundwater extraction would significantly decrease the water levels to 1.54–2.21 m and 1.44–2.08 m with 1.5- and 2-times increased pumping rates, respectively.

3.2.3. The Adjustment of the Separation Distances

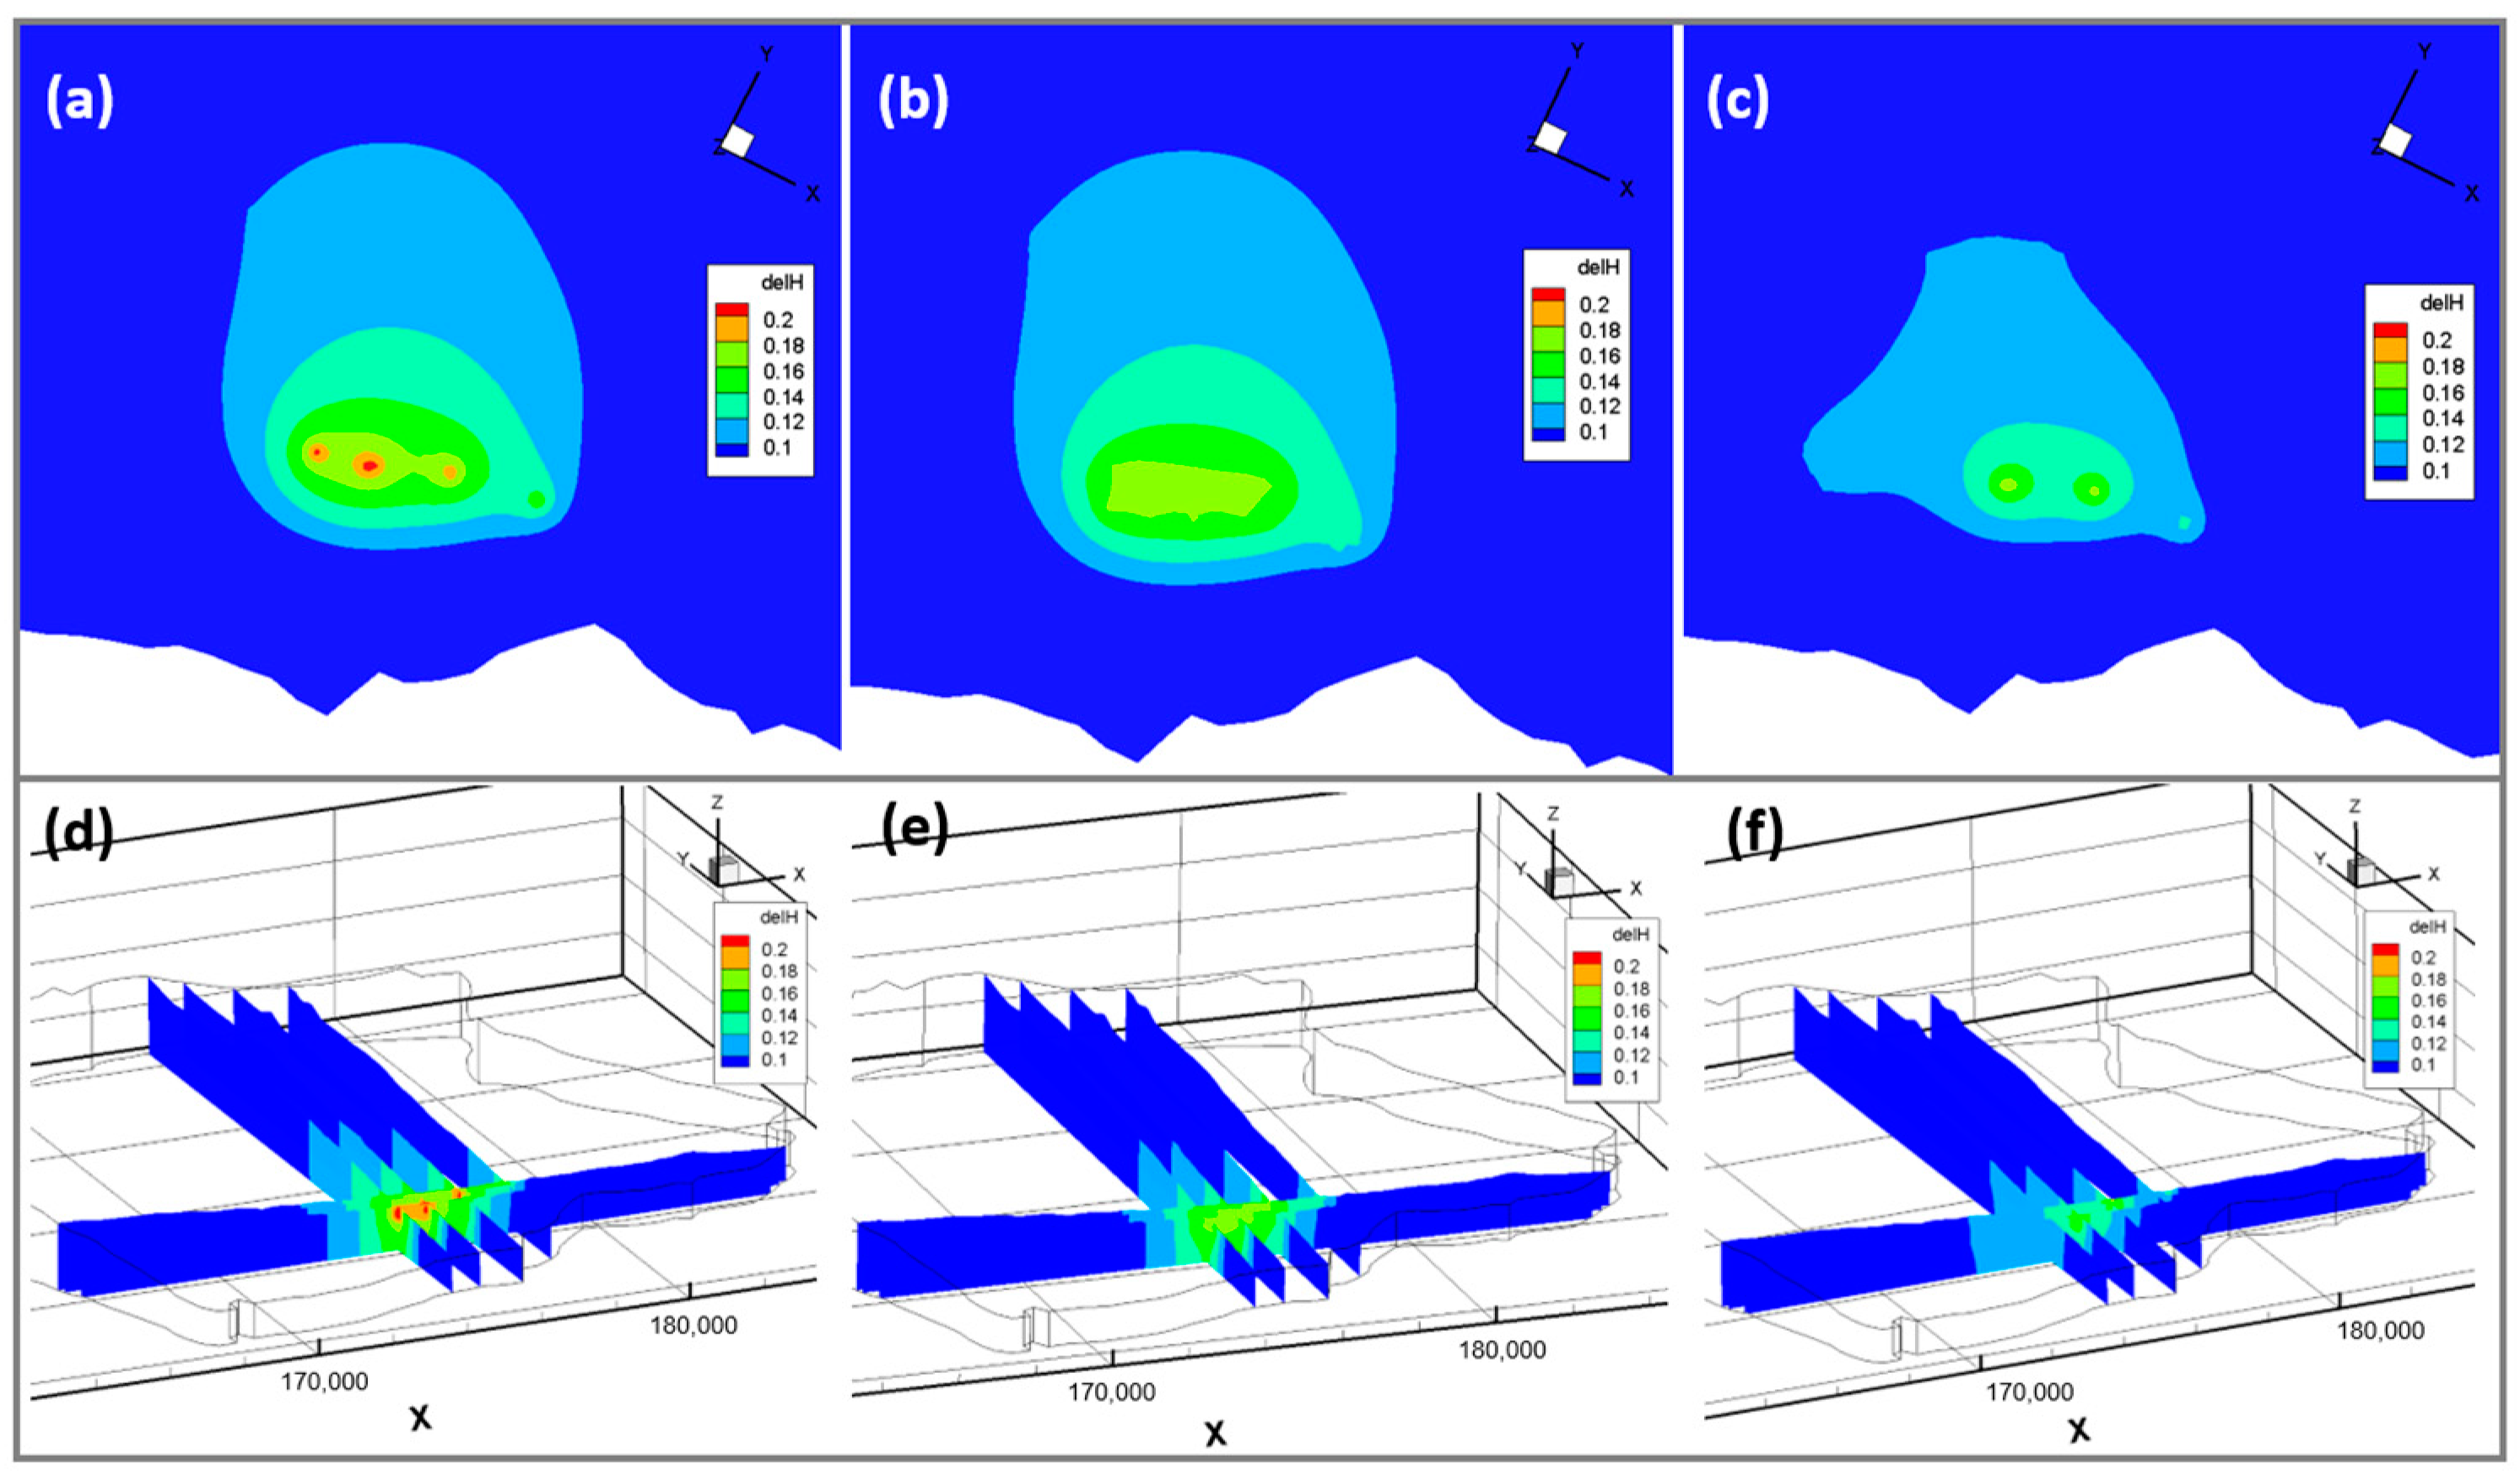
In Figure 9, three simulation results are shown: (1) the present case (Figure 9a), (2) the separation distances between extraction wells increased to 250 m (Figure 9b), and (3) the distance among the four wellfields (UG1, UG2, SH1, and SH2) increased by 250 m with the same separation distances from the extraction wells as in the present case. Comparing the present operating conditions (Figure 9a), the intensity of the groundwater decline at the extraction wells was reduced only by increasing the separation distance between the pumping wells (Figure 9b) and wellfields (Figure 9c). In Figure 9b, water level declines were reduced by 0.03–0.04 m, which is 15.79–21.05% of the present case, and the declines ranged from 0.05 to 0.07 m (26.31–36.84% from the present case) for the latter case (Figure 9c). Based on the modeled results of increasing separation distances, well interference effects were expected to be lowered by 15.78–36.84% of the decline in water levels due to the current groundwater extraction rates at the wellfields.

4. Discussion

Despite the large amount of groundwater extracted at the Namwon wellfields, decreases in water levels at the 24 pumping wells were estimated and ranged from 0.16 m to 0.21 m in our numerical model. Table 3 compared the groundwater level drop in the actual RWSS measured in the groundwater impact survey report for the study area in 2005 and the groundwater level drop predicted through the model simulation in this study. In this table, the simulated water levels showed comparable results to the actual levels produced by the RWSS operation, except for several extraction wells that showed increased water level declines due to the heterogeneity of geological characteristics [41]. Even with large-scale groundwater extraction at the RWSSs in Namwon, the groundwater levels tend to decrease slightly. These minor responses to water levels may have been influenced by the hydrogeological features of the study site. The Namwon RWSSs are situated in the southeastern part of Jeju Island, which is characterized by abundant annual precipitation and high groundwater flow velocities [34]. These hydrogeological characteristics resulted in groundwater residence times of 18 years [42]. Based on the abovementioned reasons, groundwater tends to replenish easily in the aquifer system in the study area, which ensures minor declines in groundwater levels despite increased groundwater extraction amounts.
For the wellfields of RWSSs in the western part of the island, changes in groundwater levels due to groundwater extraction were evaluated using deep learning [43]. In contrast to the results from this study, declines in the water levels by groundwater pumping at the wellfields in the western part were estimated as a 20% decrease in water levels compared to those in the no-pumping cases. The western part of Jeju Island is characterized by low precipitation rates and deep layers of low-permeability SGF, which resulted in long groundwater residence times (average of 27 years; [42]). The circulation system of the aquifer in western Jeju resulted in increased responses of groundwater level changes to the operations of RWSS compared to those in Namwon, southeastern Jeju Island.
Under the circumstances showing overall tendencies of groundwater level declines across Jeju Island [14], proper management of the RWSSs is needed to prevent the acceleration of water level declines. Even though our numerical model results showed insignificant changes in water levels due to groundwater extractions at the Namwon wellfields, increasing the pumping rates and drought case simulation predicted intensified decreases in groundwater levels. Particularly for the western part of Jeju Island, which showed increased hydrologic responses to pumping events, lowering the groundwater extraction amounts at the RWSS by using alternative water resources should be considered. In addition, our study suggests that increasing the separation distances between each extraction wells at the wellfields of the newly developed RWSS can also minimize the interference effects.
As we simplified the complex hydrogeology around the wellfields of the study area to the numerical model, our model had a limitation in capturing locally variable responses of water level decline at well-scale. To fully capture the heterogeneous feature of changes in groundwater level at the wellfields in the numerical model, further studies on in-depth assessment of the hydrogeological heterogeneity at each extraction well is firstly needed, such as the studies by [44,45]. In addition, development of a 3-D geological model coupled with the groundwater flow model would improve the assessment of the groundwater system by simulating the heterogeneity in hydrogeological features [46,47].

5. Conclusions

This study evaluated the impact of large-scale groundwater extraction on the groundwater system at Namwon wellfields of the RWSS located in the southeastern part of Jeju Island. A 3-D groundwater flow model was used to quantitatively evaluate the water level declines due to groundwater usage at the wellfields. Model scenarios of (1) increasing extraction rates, (2) extreme drought conditions, and (3) adjustment of separation distances between wells and wellfields were simulated. The results of numerical modeling showed that minor declines in the water levels due to large-scale groundwater pumping were estimated as 0.16–0.21 m, which were similar to the observed ranges in the fields. The southeastern part of Jeju Island is characterized by high precipitation rates and a rapid groundwater flow system, which reduces the decline in water level even with the excessive amount of groundwater uses in the RWSSs. However, in cases of increasing water demands and extreme drought periods, intensified decreases in water levels to 0.56–0.79 m were expected based on the scenario modeling results. Extending well or wellfield separation distances to 250 m reduced the decrease in water level by 15.78–36.84% in the present condition, and this suggests that well interference effects would be relieved by adjusting well separation distances. Therefore, considering proper separation distances at wellfields will minimize well interference in newly developed wellfields with large-scale groundwater extraction, especially in western Jeju, which showed insufficient groundwater replenishment due to hydrogeological characteristics (e.g., lower precipitation rates and slow groundwater flow system). This study implies that the operation of RWSS in Namwon is sustainable under the present conditions; however, in the case of future increasing groundwater usage and abnormal climate conditions, continuous groundwater level monitoring around the wellfields and evaluation of the operation of RWSS in other regions of Jeju Island are needed. Also, this study can be applied to other countries that have suffered from groundwater depletion due to excessive extraction of groundwater.

Supplementary Materials

The following supporting information can be downloaded at: https://www.mdpi.com/article/10.3390/w15122151/s1, Figure S1: A relation between elevation of the weather station and average annual precipitation rate in the study area.

Author Contributions

H.J.K.: analysis and writing—original draft preparation; E.-H.K.: writing—review and editing and supervision; C.-S.K.: analysis and visualization; W.-B.P.: data curation and conceptualization; M.-C.K.: conceptualization and formal analysis. All authors have read and agreed to the published version of the manuscript.

Funding

This work was studied with the support of Jeju Green Environment Center in 2023.

Data Availability Statement

Groundwater extraction data at the regional water supply system are provided by the Jeju Water Supply and Sewerage Headquarters. Data available on request due to restrictions due to privacy.

Conflicts of Interest

The authors declare no conflict of interest.

References

  1. Margat, J.; Van der Gun, J. Groundwater around the World: A Geographic Synopsis; CRC Press: Boca Raton, FL, USA, 2013. [Google Scholar]
  2. Bartolino, J.R. Ground-water depletion across the nation. In Open File Report USGS Fact Sheet-103-03; US Geological Survey: Reston, VA, USA, 2003. [Google Scholar]
  3. Jasechko, S.; Perrone, D. Global groundwater wells at risk of running dry. Science 2021, 372, 418–421. [Google Scholar] [CrossRef] [PubMed]
  4. Jia, X.; O’Connor, D.; Hou, D.; Jin, Y.; Li, G.; Zheng, C.; Ok, Y.S.; Tsang, D.C.; Luo, J. Groundwater depletion and contamination: Spatial distribution of groundwater resources sustainability in China. Sci. Total Environ. 2019, 672, 551–562. [Google Scholar] [CrossRef] [PubMed]
  5. Korus, J.T.; Burbach, M.E. Analysis of aquifer depletion criteria with implications for groundwater management. Great Plains Res. 2009, 19, 187–200. [Google Scholar]
  6. Rodell, M.; Velicogna, I.; Famiglietti, J.S. Satellite-based estimates of groundwater depletion in India. Nature 2009, 460, 999–1002. [Google Scholar] [CrossRef] [PubMed] [Green Version]
  7. Scanlon, B.R.; Faunt, C.C.; Longuevergne, L.; Reedy, R.C.; Alley, W.M.; McGuire, V.L.; McMahon, P.B. Groundwater depletion and sustainability of irrigation in the US High Plains and Central Valley. Proc. Nat. Acad. Sci. USA 2012, 109, 9320–9325. [Google Scholar] [CrossRef] [Green Version]
  8. Wada, Y.; Van Beek, L.P.; Van Kempen, C.M.; Reckman, J.W.; Vasak, S.; Bierkens, M.F. Global depletion of groundwater resources. Geophy. Res. Lett. 2010, 37, 71. [Google Scholar] [CrossRef] [Green Version]
  9. Ebraheem, A.M.; Riad, S.; Wycisk, P.; Seif El Nasr, A.M. Simulation of present and future groundwater extraction from the non-replenished Nubian Sandstone Aquifer, SW Egypt. Environ. Geol. 2002, 43, 188–196. [Google Scholar]
  10. Qian, J.; Zhou, X.; Zhan, H.; Dong, H.; Ma, L. Numerical simulation and evaluation of groundwater resources in a fractured chalk aquifer: A case study in Zinder well field, Niger. Environ. Earth Sci. 2014, 72, 3053–3065. [Google Scholar] [CrossRef]
  11. Geldenhuys, I. Making the invisible visible. J. S. Afr. Inst. Min. Metall. 2022, 122, 6. [Google Scholar]
  12. Famiglietti, J.S. The global groundwater crisis. Nat. Clim. Chang. 2014, 4, 945–948. [Google Scholar] [CrossRef] [Green Version]
  13. Choi, H.M.; Lee, J.Y. Parametric and Non-parametric Trend Analyses for Water Levels of Groundwater Monitoring Wells in Jeju Island. J. Soil Groundw. Environ. 2009, 14, 41–50. [Google Scholar]
  14. Jeju Groundwater Research Center. A Study on Causes of Declines of the Groundwater Level and Response Plans; Jeju Research Institute: Jeju City, Republic of Korea, 2021. [Google Scholar]
  15. Jeju Special Self-Governing Province. Basic Plan for Integrated Water Management in Jeju Special Self-Governing Province (2023–2032); Jeju Special Self-Governing Province: Jeju City, Republic of Korea, 2022. [Google Scholar]
  16. Park, W.B.; Kang, B.R.; Kim, J.M. Improvement of Water Management System for Sustainable Groundwater Resources in the Age of Climate Crisis; Issue Brief, 365; Jeju Research Institute: Jeju City, Republic of Korea, 2022. [Google Scholar]
  17. Baut, V. Aquifer Hydraulics: A Comprehensive Guide to Hydrogeologic Data Analysis; A Wiley-Interscience Publication; John Wiley & Sons, Inc.: Hoboken, NJ, USA, 1998. [Google Scholar]
  18. Alfarrah, N.; Walraevens, K. Groundwater overexploitation and seawater intrusion in coastal areas of arid and semi-arid regions. Water 2018, 10, 143. [Google Scholar] [CrossRef] [Green Version]
  19. Erban, L.E.; Gorelick, S.M.; Zebker, H.A. Groundwater extraction, land subsidence, and sea-level rise in the Mekong Delta, Vietnam. Environ. Res. Lett. 2014, 9, 84010. [Google Scholar] [CrossRef]
  20. Janža, M. Optimization of well field management to mitigate groundwater contamination using a simulation model and evolutionary algorithm. Sci. Total Environ. 2022, 807, 150811. [Google Scholar] [CrossRef]
  21. Ebraheem, A.M.; Garamoon, H.K.; Riad, S.; Wycisk, P.; Seif El Nasr, A.M. Numerical modeling of groundwater resource management options in the East Oweinat area, SW Egypt. Environ. Geol. 2003, 44, 433–447. [Google Scholar] [CrossRef]
  22. Mercurio, J.W.; Beljin, M.S.; Maynard, J.B.J. Groundwater models and wellfield management: A case study. Environ. Eng. Policy 1998, 1, 155–164. [Google Scholar] [CrossRef]
  23. Muñoz, J.F.; Fernández, B.; Escauriaza, C. Evaluation of groundwater availability and sustainable extraction rate for the Upper Santiago Valley Aquifer, Chile. Hydrogeol. J. 2003, 11, 687–700. [Google Scholar] [CrossRef]
  24. Nastev, M.; Rivera, A.; Lefebvre, R.; Martel, R.; Savard, M. Numerical simulation of groundwater flow in regional rock aquifers, southwestern Quebec, Canada. Hydrogeol. J. 2005, 13, 835–848. [Google Scholar] [CrossRef]
  25. Pétré, M.A.; Rivera, A.; Lefebvre, R. Numerical modeling of a regional groundwater flow system to assess groundwater storage loss, capture and sustainable exploitation of the transboundary Milk River Aquifer (Canada–USA). J. Hydrol. 2019, 575, 656–670. [Google Scholar] [CrossRef]
  26. Cousquer, Y.; Pryet, A.; Delbart, C.; Valois, R.; Dupuy, A. Adaptive optimization of a vulnerable well field. Hydrogeol. J. 2019, 27, 1673–1681. [Google Scholar] [CrossRef]
  27. Li, J.; Wang, Z.; Wu, X.; Xu, C.Y.; Guo, S.; Chen, X. Toward Monitoring Short-Term Droughts Using a Novel Daily Scale, Standardized Antecedent Precipitation Evapotranspiration Index. J. Hydrometeorol. 2020, 21, 891–908. [Google Scholar] [CrossRef] [Green Version]
  28. Xu, L.; Chen, N.; Zhang, X. Global drought trends under 1.5 and 2 °C warming. Int. J. Climatol. 2019, 39, 2375–2385. [Google Scholar] [CrossRef]
  29. Hughes, J.D.; Petrone, K.C.; Silberstein, R.P. Drought, groundwater storage and stream flow decline in southwestern Australia. Geophys. Res. Lett. 2012, 39, L03408. [Google Scholar] [CrossRef]
  30. Park, W.B.; Kang, B.R.; Koh, E.H. Protecting Regional Water Supply System for a Safe and Secure Water Supply; Policy Research 2021; Jeju Research Institute: Jeju City, Republic of Korea, 2021. [Google Scholar]
  31. Koh, G.W. Characteristics of the Groundwater and Hydrogeologic Implication of the Seoquipo Formation in Cheju Island. Ph.D. Thesis, Busan National University, Busan, Republic of Korea, 1997. (In Korean). [Google Scholar]
  32. Korea Meteorological Administration (KMA). 2021. Available online: https://www.kma.go.kr/ (accessed on 14 May 2021).
  33. Koh, E.H.; Lee, E.; Lee, K.K. Application of geographically weighted regression models to predict spatial characteristics of nitrate contamination: Implications for an effective groundwater management strategy. J. Environ. Manag. 2020, 268, 110646. [Google Scholar] [CrossRef] [PubMed]
  34. Jejudo. Report on the Overall Investigation of Hydrogeology and the Groundwater Resource in Jeju Island (III); Jeju Provincial Government: Jeju City, Republic of Korea, 2003.
  35. Therrien, R.; Sudicky, E.A.; McLaren, R. Hydrogeosphere: A Three-Dimensional Numerical Model Describing Fully-Integratedsubsurface and Surface Flow and Solute Transport; Groundwater Simulations Group, University of Waterloo: Waterloo, ON, Canada, 2010. [Google Scholar]
  36. Jeju Water Resources Management Office. Data Collection Book of Geological Logs of Jeju Island; Jeju Special Self-Governing Province: Jeju City, Republic of Korea, 2001. [Google Scholar]
  37. Jeju Water Resources Management Office. Data Collection Book of Geological Logs of Jeju Island (II); Jeju Special Self-Governing Province: Jeju City, Republic of Korea, 2012. [Google Scholar]
  38. Domenico, P.A.; Schwartz, F.W. Physical and Chemical Hydrogeology; John Wiley and Sons: New York, NY, USA, 1990; 824p. [Google Scholar]
  39. Anderson, M.P.; Woessner, W.W. Applied Groundwater Modeling—Simulation of Flow and Advective Transport; Academic Press, Inc.: San Diego, CA, USA, 1992; 381p. [Google Scholar]
  40. Song, S.H.; Yoo, S.H.; Bae, S.J. Regional drought assessment considering climate change and relationship with agricultural water in Jeju Island. J. Environ. Sci. Int. 2013, 22, 625–638. [Google Scholar] [CrossRef] [Green Version]
  41. Jeju Metropolitan Water Resources Management Headquarters. Groundwater Impact Survey for Jeju Island Multi-Regional Water Supply Phase 1 Water Source Period Extension Permit; Jejudo: Jeju City, Republic of Korea, 2005. [Google Scholar]
  42. Jejudo. Report on the Overall Investigation of Hydrogeology and the Groundwater Resource in Jeju Island (I); Jeju Provincial Government: Jeju City, Republic of Korea, 2001.
  43. Park, W.B.; Kang, B.R.; Kim, M.C.; Kim, G.P. Analysis on the Influence of Groundwater Level Variation by Large-Scale Groundwater Pumping: The Case of Daejeong-Hangyeong Basin; Policy Research 2020; Jeju Research Institute: Jeju City, Republic of Korea, 2020. [Google Scholar]
  44. Zhan, C.; Dai, Z.; Yang, Z.; Zhang, X.; Ma, Z.; Thanh, H.V.; Soltanian, M.R. Subsurface sedimentary structure identification using deep learning: A review. Earth-Sci. Rev. 2023, 239, 104370. [Google Scholar] [CrossRef]
  45. Wu, Q.; Xu, H.; Zou, X. An effective method for 3D geological modeling with multi-source data integration. Comput. Geosci. 2005, 31, 35–43. [Google Scholar] [CrossRef]
  46. Hassen, I.; Gibson, H.; Hamzaoui-Azaza, F.; Negro, F.; Rachid, K.; Bouhlila, R. 3D geological modeling of the Kasserine Aquifer System, Central Tunisia: New insights into aquifer-geometry and interconnections for a better assessment of groundwater resources. J. Hydrol. 2016, 539, 223–236. [Google Scholar] [CrossRef]
  47. Quiroga, E.; Bertoni, C.; Van Goethem, M.; Blazevic, L.A.; Ruden, F. A 3D geological model of the horn of Africa: New insights for hydrogeological simulations of deep groundwater systems. J. Hydrol. Reg. Stud. 2022, 42, 101166. [Google Scholar] [CrossRef]
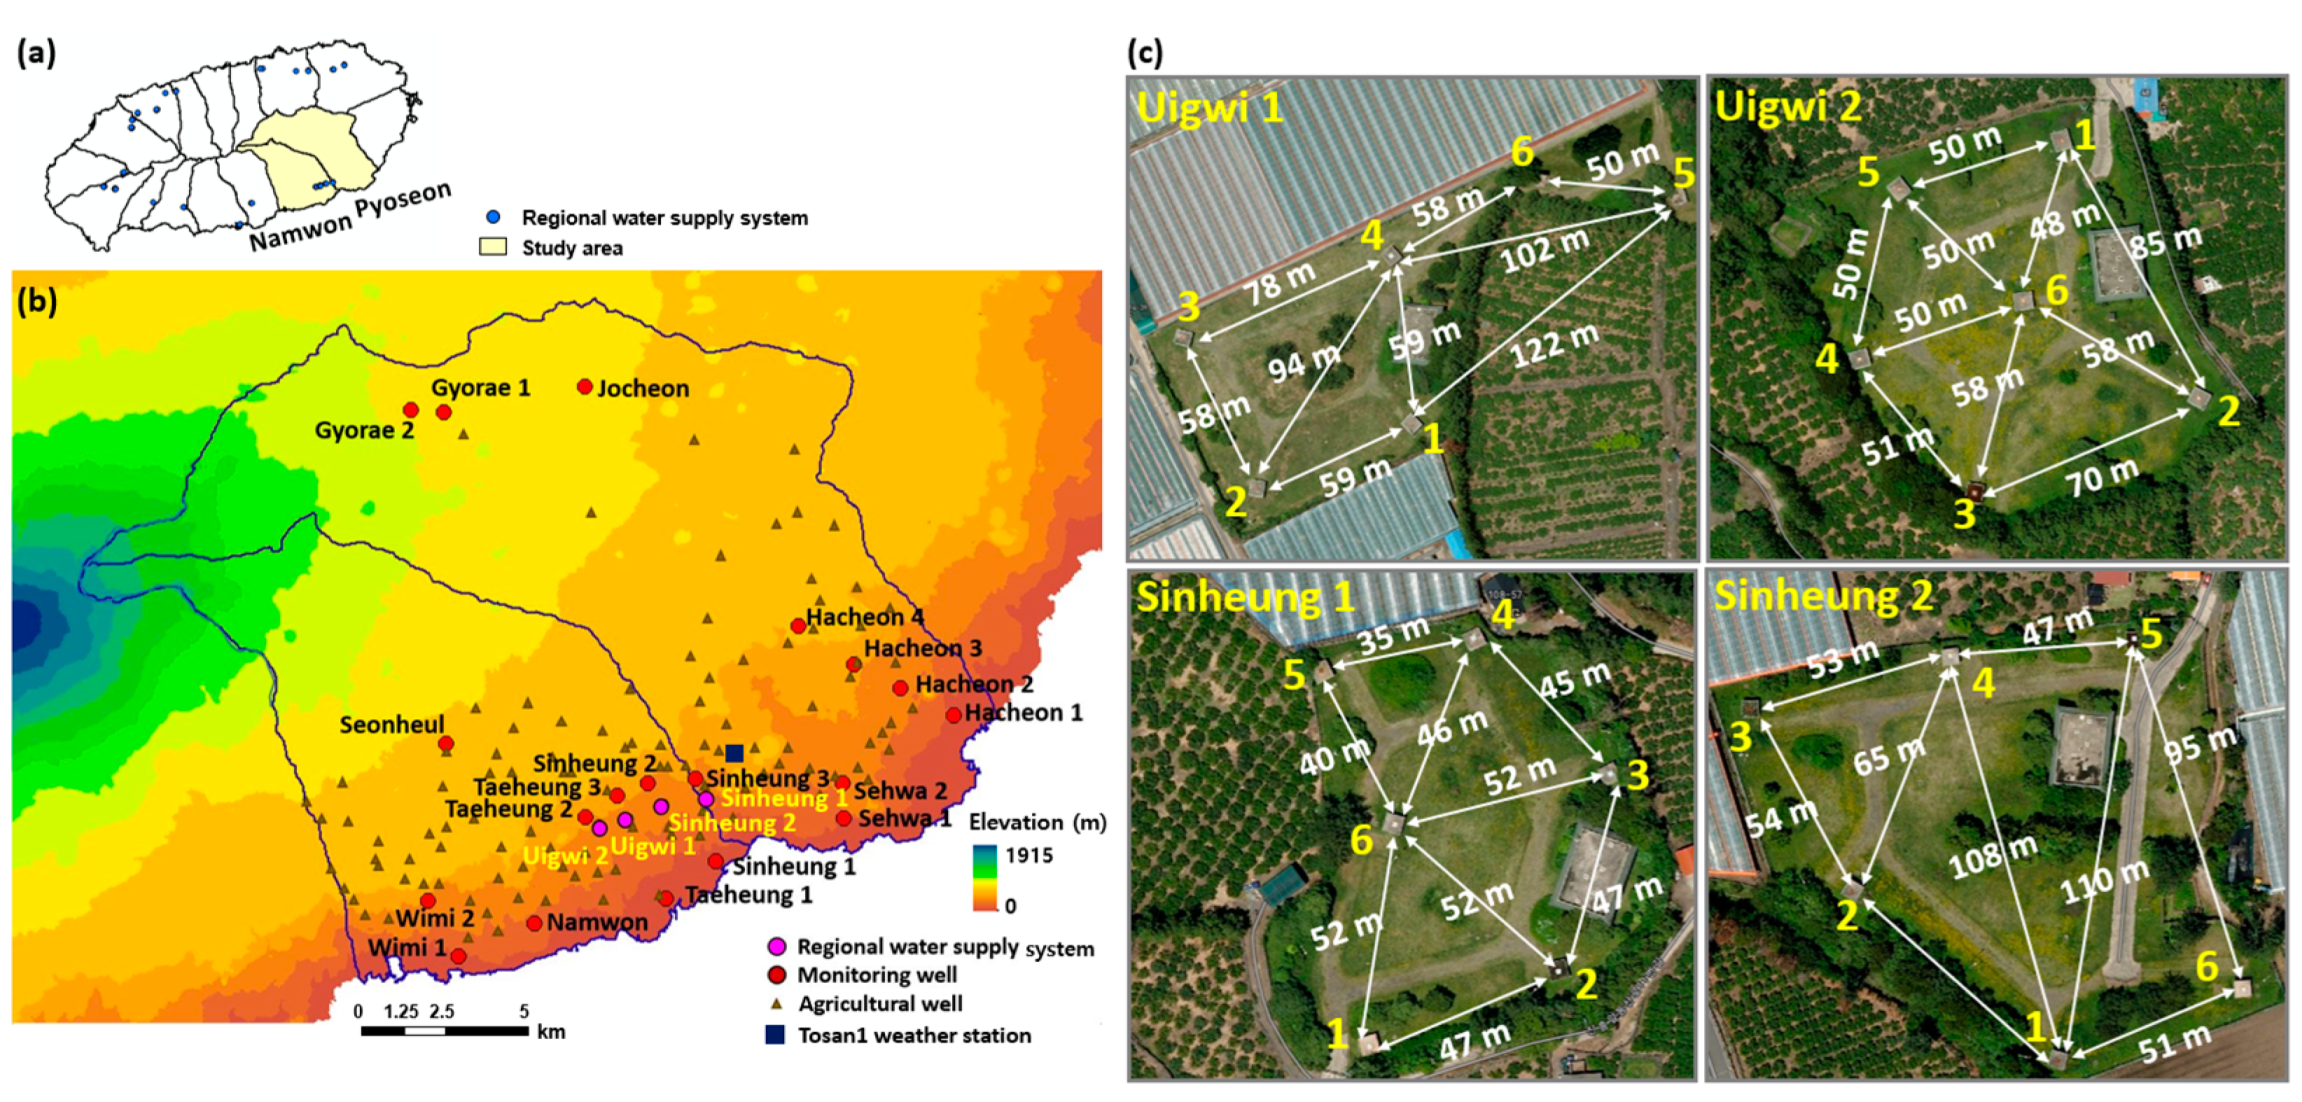
Figure 1. Location map of (a) Jeju Island, (b) the study area showing the Namwon wellfields (Uigwi 1–2 and Sinheung 1–2) of the regional water supply system, groundwater wells for water level monitoring and agricultural water use, and Tosan 1 weather station, and (c) the six extraction wells for each wellfield with the corresponding separation distances between wells.
Water 15 02151 g001
Figure 2. (a) Location map of the extraction wells of the regional water supply system (RWSS) and a geologic cross-section, and (b) the geologic cross-section.
Water 15 02151 g002
Figure 3. Domain of the numerical model for the study area (a) with hydrogeological layers and (b) boundary conditions used for simulation.
Water 15 02151 g003
Figure 4. Calibration results of the groundwater flow model. 1:1 plots of the observed and simulated heads at groundwater level monitoring wells (a) for the entire study area (R2 = 0.9165), (b) around the Namwon wellfields (R2 = 0.9861), and (c) the spatial distribution of the simulated head at z-axis (z = 0 masl).
Water 15 02151 g004
Figure 5. Drawdowns of the water levels at Uigwi 1-1, Uigwi 2-1, Sinheung 1-1, and Sinheung 2-1 extraction wells, due to pumping of groundwater at wellfields of the regional water supply system, obtained from the numerical model.
Water 15 02151 g005
Figure 6. Distribution of groundwater level drop due to groundwater pumping from RWSS (a) change in groundwater level drop over time and (b) contour map of 0.1 m drawdowns around the Namwon wellfields.
Water 15 02151 g006
Figure 7. Distribution of the simulated head drawdowns around Namwon wellfields with increased groundwater extraction at (a) 1.5 and (b) 2.0 times of present extraction rates and (c,d) showing the cross-section of each wellfield (Uigwi 1-1, Uigwi 2-1, Sinheung 1-1, and Sinheung 2-1) for (a,b).
Water 15 02151 g007
Figure 8. Simulated groundwater levels at the four extraction wells (UG1, UG2, SH1, and SH2) in the Namwon wellfields under model scenarios of different recharge (base condition: present recharge; drought condition: 60% of present recharge) and pumping rates (×1, ×1.5, and ×2 of current pumping rate Q). Numbers next to bars indicate groundwater levels.
Water 15 02151 g008
Figure 9. Scenario modeling results of adjusting the separation distances of wells. The simulated head drawdowns around the Namwon wellfields with (a) the current separation distances, increasing the separation distances to 250 m between (b) each extraction well and (c) each wellfield, and (df) diagrams showing cross-sections in each wellfield for (ac).
Water 15 02151 g009
Table 1. Information on the regional water supply system wells in the study area.
Wellfield IDNo. of WellElevationWell DepthWater LevelWithdrawal Permit RateExtraction Rate
(2010–2020)
(masl)(m)(masl)(m3/Month)(m3/Month)
Sinheung 1
(SH1)
161821.5360,00047,392
260821.2160,00040,963
360821.2260,00044,692
461821.2260,00048,138
562821.3460,00046,324
661821.8160,00045,872
Sinheung 2
(SH2)
165900.9960,00048,545
265901.4660,00046,837
365901.4760,00050,274
461901.5160,00049,907
563901.2960,00047,083
665900.8060,00045,062
Uigwi 1
(UG1)
1681011.1060,00045,190
2681031.6660,00048,494
3711051.3560,00043,781
4691051.4860,00051,209
5691041.1960,00042,703
6671021.4560,00042,291
Uigwi 2
(UG2)
175905.8860,00045,598
273955.6760,00046,789
373955.3860,00048,121
476995.2960,00048,528
575935.4060,00049,219
674905.8460,00045,678
Table 2. Hydraulic properties of each hydrogeological layer in the numerical model.
Geologic LayersPorosity *Hydraulic Conductivity (m/s)Specific Storage *
KxKyKz(1/m)
Top soil0.22.0 × 10−52.0 × 10−54.0 × 10−65.0 × 10⁻⁴
Volcanic rocks0.39.0 × 10−59.0 × 10−51.8 × 10−55.0 × 10⁻⁴
SGF0.19.0 × 10−69.0 × 10−61.8 × 10−63.5 × 10⁻⁶
Note: [38]; * [39].
Table 3. Comparison between the drawdowns of the groundwater levels measured at the fields in 2005 and the simulated drawdowns in our numerical model.
Wellfield IDNo. of WellDrawdown of Groundwater Level
in the Survey
(2005)
Drawdown of Groundwater Level
in the Model
(m)(m)
Sinheung 1
(SH1)
10.200.21
2-0.21
30.200.21
40.400.21
51.800.21
62.000.21
Sinheung 2
(SH2)
10.100.20
20.200.20
30.100.20
40.200.20
5-0.20
60.100.20
Uigwi 1
(UG1)
1-0.16
20.200.16
30.100.16
4-0.16
56.900.16
60.200.16
Uigwi 2
(UG2)
1-0.19
20.200.19
32.000.19
4-0.18
53.200.19
60.200.19
Disclaimer/Publisher’s Note: The statements, opinions and data contained in all publications are solely those of the individual author(s) and contributor(s) and not of MDPI and/or the editor(s). MDPI and/or the editor(s) disclaim responsibility for any injury to people or property resulting from any ideas, methods, instructions or products referred to in the content.