Article

Integrated Soundness Assessment of Agricultural Reservoirs Based on Water Quantity and Quality

1
Daejeon Sejong Research Institute, 37 Jeonmin-ro, Yuseong-gu, Daejeon 30147, Republic of Korea
2
Department of Agricultural and Rural Engineering, Chungbuk National University, 1 Chungdae-ro, Seowon-gu, Cheongju 28644, Republic of Korea
3
Inc. Usuan BT, 135, Munjeong-ro 170beon-gil, Seo-gu, Daejeon 35250, Republic of Korea
4
Department of Civil Engineering, Chungbuk National University, 1 Chungdae-ro, Seowon-gu, Cheongju 28644, Republic of Korea
*
Author to whom correspondence should be addressed.
Water 2023, 15(11), 2131; https://doi.org/10.3390/w15112131
Submission received: 13 May 2023 / Revised: 30 May 2023 / Accepted: 31 May 2023 / Published: 3 June 2023
(This article belongs to the Section Water, Agriculture and Aquaculture)

Abstract

:
For the first time, the results of a comprehensive assessment study on agricultural reservoirs in Korea were obtained. In this study, four agricultural reservoirs in Korea, namely, Songgo, Idam, Nohong, and Jukryang reservoirs, were investigated to establish a quantitative assessment system based on the water quantity and quality of the agricultural reservoirs, and present ratings. The research method involves selecting an indicator framework to evaluate water quantity and quality, using the statistical package for the social sciences statistics analysis program to verify compliance with standards and suitability of the indicator system, and selecting the final indicators to calculate their weights. The Jukryang and Nohong reservoirs have good water quality based on the average grade whereas the Songgo and Idam reservoirs have water quality that requires improvement as per Korean agricultural water standards. The weights of 0.5 were applied to water quantity and quality. Comparison between the entropy method and the principal component analysis showed that the former is suitable as it showed a smaller deviation from the average than the latter one. Thus, the Jukryang reservoir showed the highest integrated soundness index, while the Songgo reservoir showed a lower index. Analysis of all reservoirs might help in establishing a rating system with absolute standards to provide grounds for agricultural reservoirs and diagnose the condition of reservoirs.

1. Introduction

In Korea, different authorities manage rivers depending on their use. Flood control, power generation, and disaster prevention is managed by regional flood control offices, the Ministry of environment, and the Ministry of interior and safety, respectively. To overcome this issue, the Water Management Act was enacted in June 2019, and the integrated national water management policies centered around the Ministry of Environment were enforced [1]. These policies are designed to centralize all the distributed authorities of water management into the Ministry of Environment and consider all factors affecting water management within the area, thereby establishing a consistent system to centrally manage water quantity and quality for environmental preservation.
Several indices and assessment methods have been reported to evaluate rivers; however, they have been diagnosed only for specific purposes, such as regulation, flood control [2], environment preservation [3], and waterfront management in fragments. Therefore, it is important to establish a comprehensive and quantitative system to evaluate and manage the results quantitatively. Accordingly, some assessments have been recently conducted on rivers [2]. Some indices have been developed to monitor the health of water bodies only on the basis of water quality [4,5] and others on the basis of water quantity [6]. However, there has been no comprehensive assessment of agricultural reservoirs that considers the combined impact of water quality and quality. The Ministry of Environment continued to assess rivers partially, but no studies seem to have been conducted for a comprehensive assessment of aquatic ecology, waterfront environment, and water quality. The basic unit for comprehensive water management is the river, and water management by the river starts with reservoirs, but all the existing assessments of agricultural reservoirs have been conducted only for a particular purpose. Agricultural reservoirs, as a critical facility, make a significant contribution to farm production. However, they lack tools or methods to draw comprehensive information.
Thus, this study aims to establish an assessment system by indexing and standardizing, considering the water quantity and quality of agricultural reservoirs, calculating weight, and quantifying them into ratings to present quantitative ratings after evaluating actual reservoirs in Korea. The assessment results will help define the functions and roles of agricultural water in a comprehensive water management system and introduce objective data regarding agricultural water. In addition, they will form a foundation for efficient water resource management in the future.

2. Literature Review

2.1. Water Quantity and Quality Diagnosis

River soundness diagnoses started primarily from the perspectives of biology and ecology. Traditionally, it has been used for a comprehensive assessment of the soundness of rivers regarding hydrology, biology, and ecology instead of evaluating rivers by indirect methods through physical, chemical, and biological indicators. Major factors that determine the soundness of a river include energy sources, chemical variables, flow regime, habitat structure, and biotic factors, as mentioned by Karr [7]. In addition, rivers were classified into natural rivers and modified rivers, which were altered by multiple factors caused by human activity.

2.2. Indicator and Index

The “indicator” can be expressed as a numerical representation of direction, purpose, or standards, and the term is generally interpreted as a method that directly expresses various aspects of a certain topic. Furthermore, it is a representative value that may most effectively describe the status quo among all observed values of different traits, usually utilizing variables in the form of a ratio. Examples include the unemployment rate and the economic growth rate in which comparisons can be made with respect to the geographical location and time period.
Index refers to the percentage of a quantity that fulfills a given criterion. It is a method of defining an index using different measurement units or aggregating two or more indicators that are not scientifically related. Indicators and indexes can be used to review current status and changing trends to improve availability.
Indicators and indexes may be defined in several ways, depending on their purpose. When applied to situations regarding water resources, indicators are seen as the representative value that combines one or more proxy variables to describe the status quo most effectively among all the observed values. Proxy variables are used for different purposes (regulation, flood control, environment). An index refers to a simple representation of a number or words through the aggregation of two or more indicators that use different measurement units or do not have scientific relationships.

2.3. Index Selection Standards and Detailed Indicators

This study aims to establish and apply a comprehensive assessment system that considers both water quantity and quality, which requires data construction on water quantity and quality indicators. Indicators are data extracted to briefly describe changes in a particular subject, helping observe complex changes in the status quo in an understandable framework and assisting informed political decisions to guide these changes in a desirable direction. Therefore, it is important to select the right indicators that may definitively represent the status quo based on clear standards. Table 1 shows the criteria for selecting indicators of water quantity and quality.
For the quantity characteristics, factors that have sensitive influences on the reservoir environment and aquatic ecosystem in terms of hydrology were selected to establish data for each indicator. The selected indicators include high flow, low flow, zero flow, variability, and seasonality. To establish the data for each indicator, the flow stress ranking hydrology indexing method was used, which is an indexed method that defines water stress as the difference in the fluctuation of current and unimpacted flows caused by extractions and impoundments at waterfronts. Current and unimpacted flows were calculated using current flow data in rivers and natural flows simulated by the Tank model. Sugawara first developed the Tank model in 1961 to conceptualize the precipitation–flow relationship in a single linear system model of the Tank. The model conceptualizes surface runoff, interflow, and base flow for each component. In Korea, this model has been used for both reservoir water analysis and flood analysis, especially for the Geumgang River area and major International Hydrological Program areas since 1970. The model is highly rated in low-flow analysis as explained in previous literature [9].
For the current flow, the basic data were calculated and established by collecting the daily flow data from the rural infrastructure management system (RIMS) and calculating the simulated flows using the Tank model. In addition, Table 2 shows detailed indicators selected to assess quantitative soundness, and the formulas are mentioned in previous literature [10].
For the water quality characteristics, indicators that can represent the soundness of reservoirs through classification by natural and social/economic factors were selected. The natural factors that can represent the soundness of reservoir were selected from items specified in the environmental water quality standards of the Ministry of Environment, and the social and economic factors were the monthly satisfaction rate of water quality items against the target water quality standards of the Ministry of Environment. Hence, Chemical Oxygen Demand (COD), Total Nitrogen (TN), Total Phosphor (TP), Dissolved Oxygen (DO), Suspended Solids (SS), and Total Organic Carbon (TOC) were selected as the indicators. The data for each indicator were established by averaging water quality data on the quarterly from the Water Environment Information System. Table 3 describes the details of the selected indicators.

2.4. Normalization and Standardization

Among a range of methods to standardize indicators, Z-score, re-scaling, and category scaling are mainly used in Korea.
First, the Z-score method is one of the average scores that use the average and standard deviation to indicate the relative location of the original score. It indicates how many times the standard deviation of the data is away from the average in the form of the standardized random variable Z. If the Z-score value is negative (lower than average value), then data require additional processing.
Second, the rescaling method is also called transfer within upper limits. Its basic methodology is similar to that of the Z-score, but it converts the locations into values between 0 and 1 within the range of the data value (maximum value–minimum value) instead of the standard deviation. The rescaling method can distort the results if the data contain unreliable anomalies. The detailed methodology for the standardized calculation of indicators has been presented in previous literature [11].

2.5. Factor Analysis

Factor analysis deals with the correlations between different variables to describe the common dimension that forms the basis of those variables [12]. R-type factor analysis extracts different variables into a small number of common chief factors, and exploratory factor analysis is used to extract critical factors when researchers do not know the underlying factors. Principal Component Analysis (PCA) narrows down the variables with the total variance as 1 to extract a small number of critical factors.
Factor analysis is a series of processes used to examine influences between originally selected indicators to verify whether they qualify as indicators for the comprehensive assessment. Basically, such analysis divides all factors into common and unique ones, and each factor affects indicator variables differently. The size of a factor impact on an indicator variable is measured by the size of the covariance that affects the indicator variable and is called factor loading. The amount of variance of each factor is called the eigenvalue, the bigger the eigenvalue, the more important the factor. Generally, the eigenvalue is set to 1 to extract the factors. Communality is a variance that can be explained by these common factors out of the total variance of an indicator variable, which equals the sum of the squares of the factor loading for the common factors from the given indicator variables. Indicator variables with a communality of 0.5 or higher can be used to establish the factor model. Furthermore, the suitability of the correlation matrix for factor analysis should be verified, which is called the test of sphericity. In this study, the Kaiser–Meyer–Olkin (KMO) goodness-of-fit and Bartlett’s unit matrix [13] were used in the test of sphericity. Typically, a KMO value of 0.5 or higher is considered explanatory, and if the p-value (significance probability) is below 0.05, the null hypothesis that the correlation matrix has an inconsistent curve is rejected, leading to a consistent curve.
This study used standardized values with the International Business Machines Corporation (IBM) Statistical Package for the Social Sciences (SPSS) statistics program [14] to extract factors and conduct factor analysis. For the extraction, PCA was used by selecting an eigenvalue of 1 or higher to determine the number of factors and calculating the initial factor loading. For factor rotation, VARIMAX rotation was applied. This rotation method is the most popular standard and the most common practice. When converting a factor matrix with logic to maximize the factor variance, it finds a way to rotate bigger values even bigger, while rotating smaller values even smaller, based on the column of the matrix.

2.6. Reliability Analysis

The reliability coefficient refers to the probability of reliability, and it is classified into test-retest reliability, parallel-form reliability, split-half reliability, internal consistency reliability, etc. This study used the internal consistency reliability estimation method to obtain the Cronbach α coefficient.
Internal consistency reliability involves configuring multiple questions to test a certain concept, determining whether the questions are measured with the same concept. The higher the correlation, the higher the reliability. The purpose of the reliability analysis that measures internal consistency is to calculate the Cronbach α coefficient using Equation (1):
α = n n 1 ( 1 s i 2 s x 2 )
where n is the number of questions; s i 2 is the variance of the question scores; s x 2 is the variance of the total score. The Cronbach coefficient is between 0 and 1; the higher the value, the higher the reliability.

3. Materials and Methods
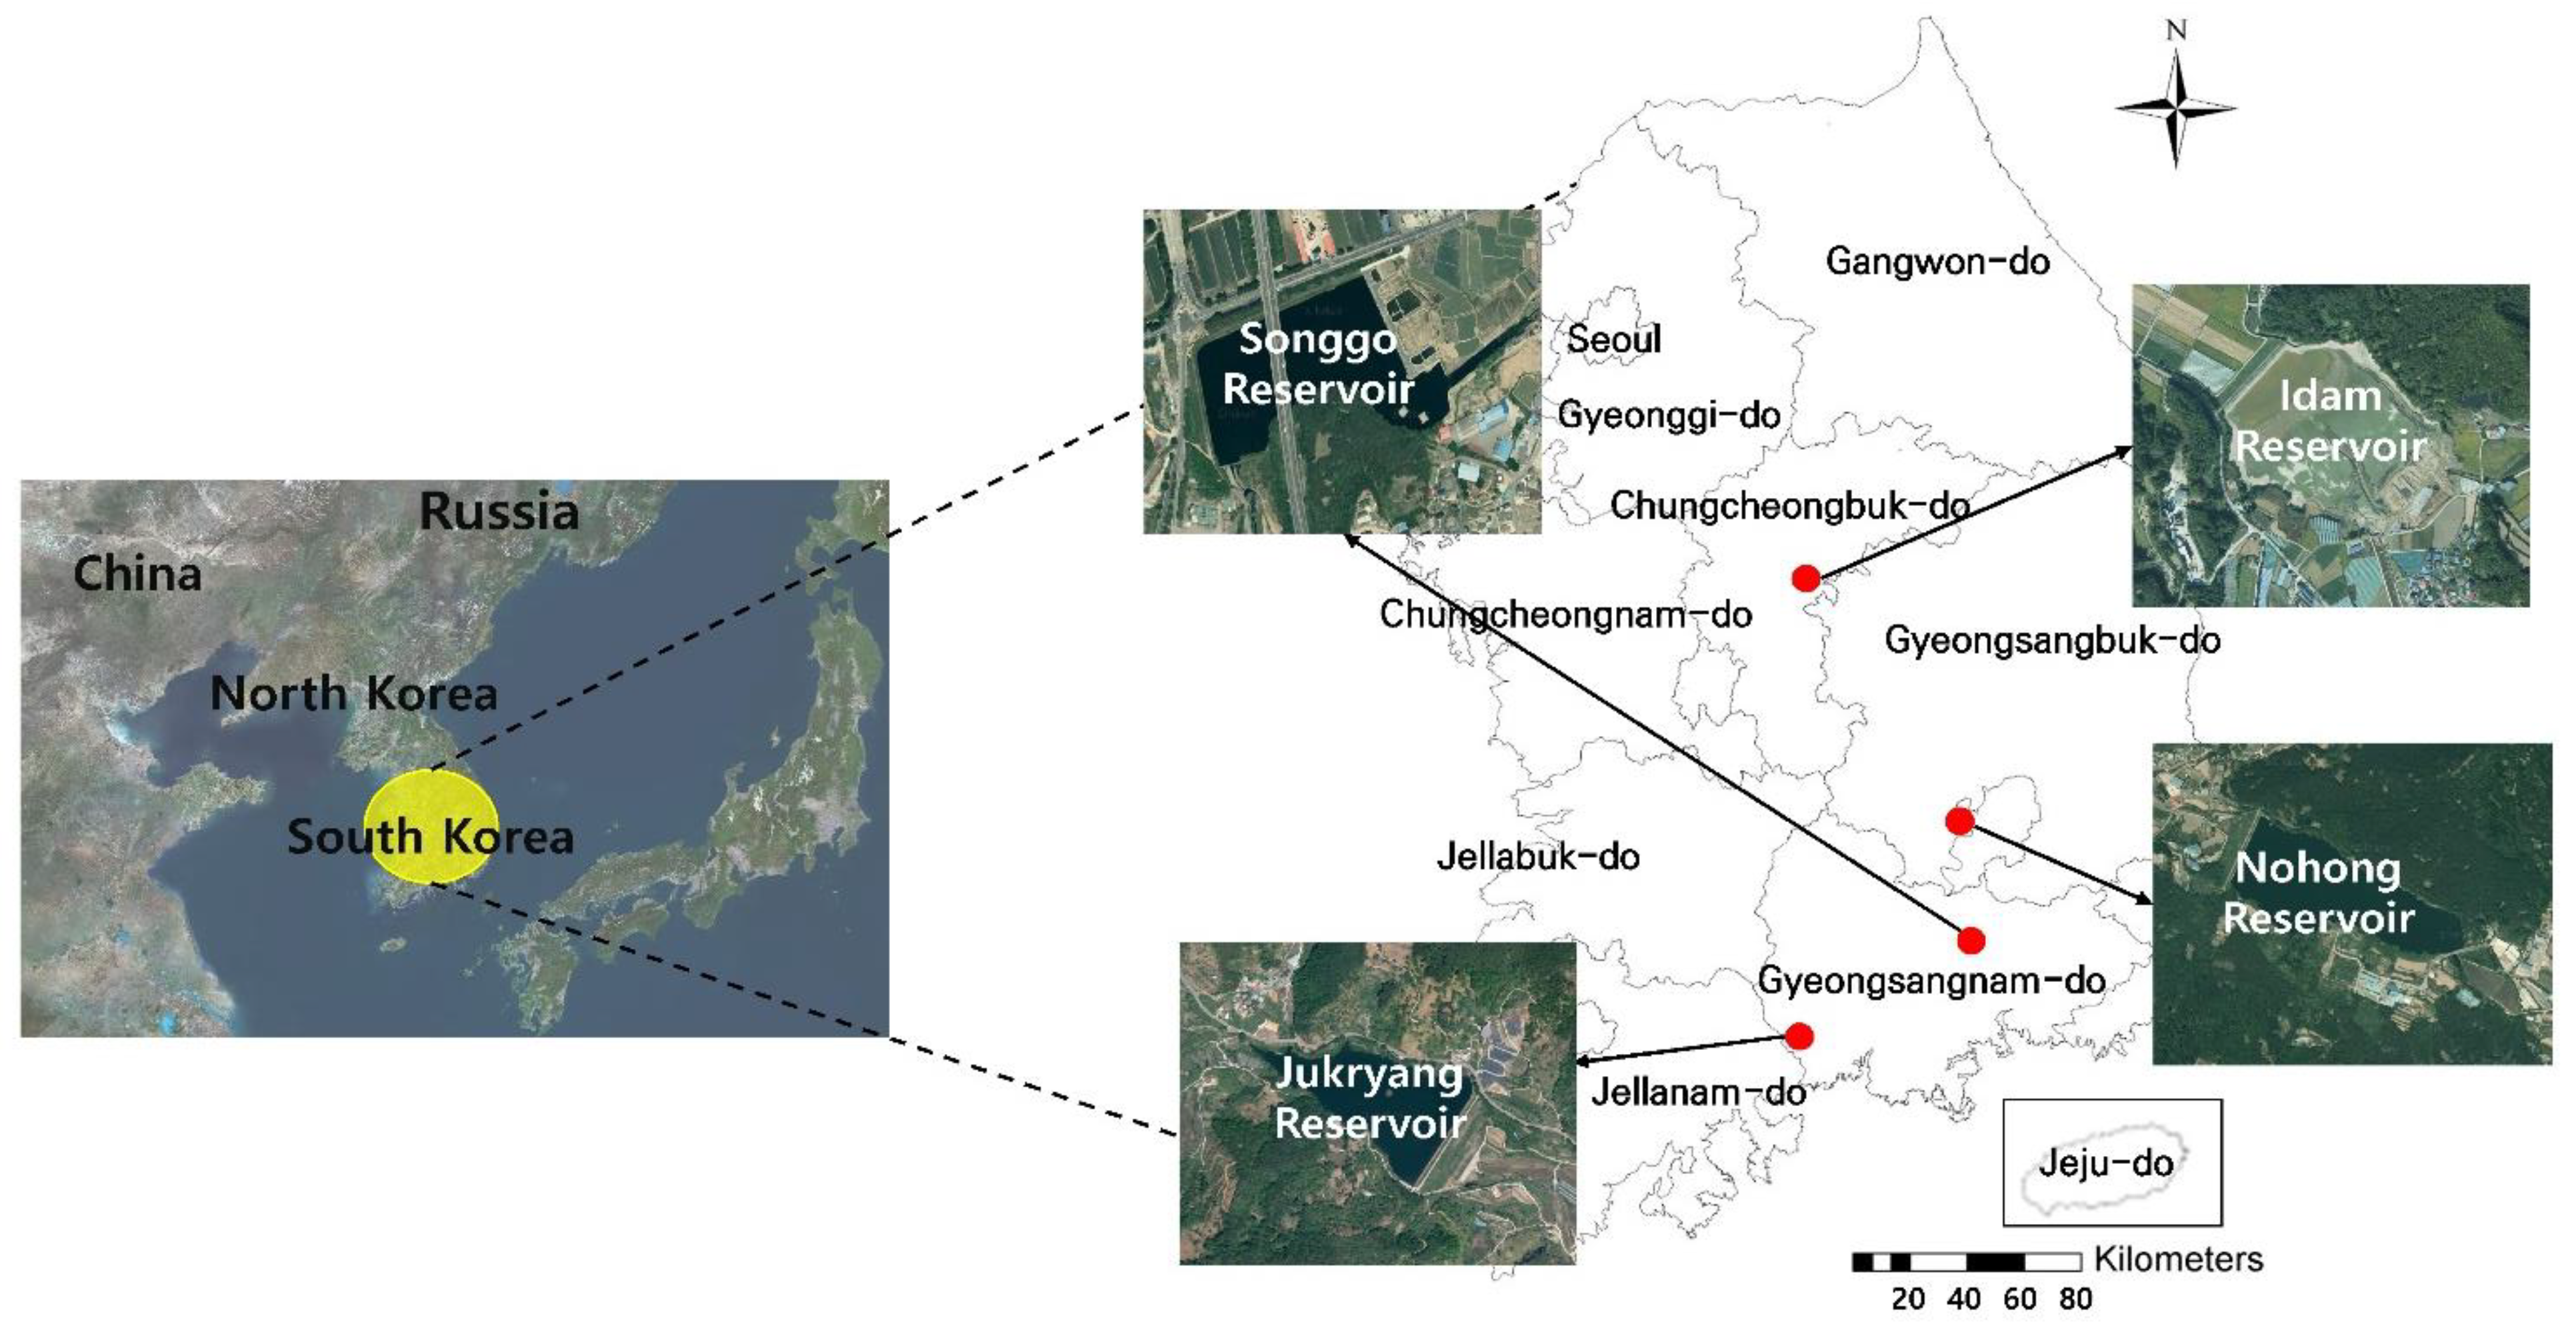
3.1. Study Area

The subject agricultural reservoirs were selected because rivers near the reservoirs are managed by the Korea Rural Community Corporation and equipped with water gauges, allowing the establishment of flow data, and then they were narrowed down to those of which the water quality information is being provided. Currently, water quality is rated based on TOC, ranging from Grade 2 or lower (good) to over Grade 8 (poor). Based on the ratings, among the reservoirs within the water quality monitoring network of the Water Environment Information System, reservoirs with fair water quality of Grade 5 or lower (Nohong and Jukryang reservoirs) and those with poor water quality of above Grade 5 (Songgo and Idam reservoirs) were selected and compared. Figure 1 and Table 4 below show the locations and the data for the subject reservoirs.

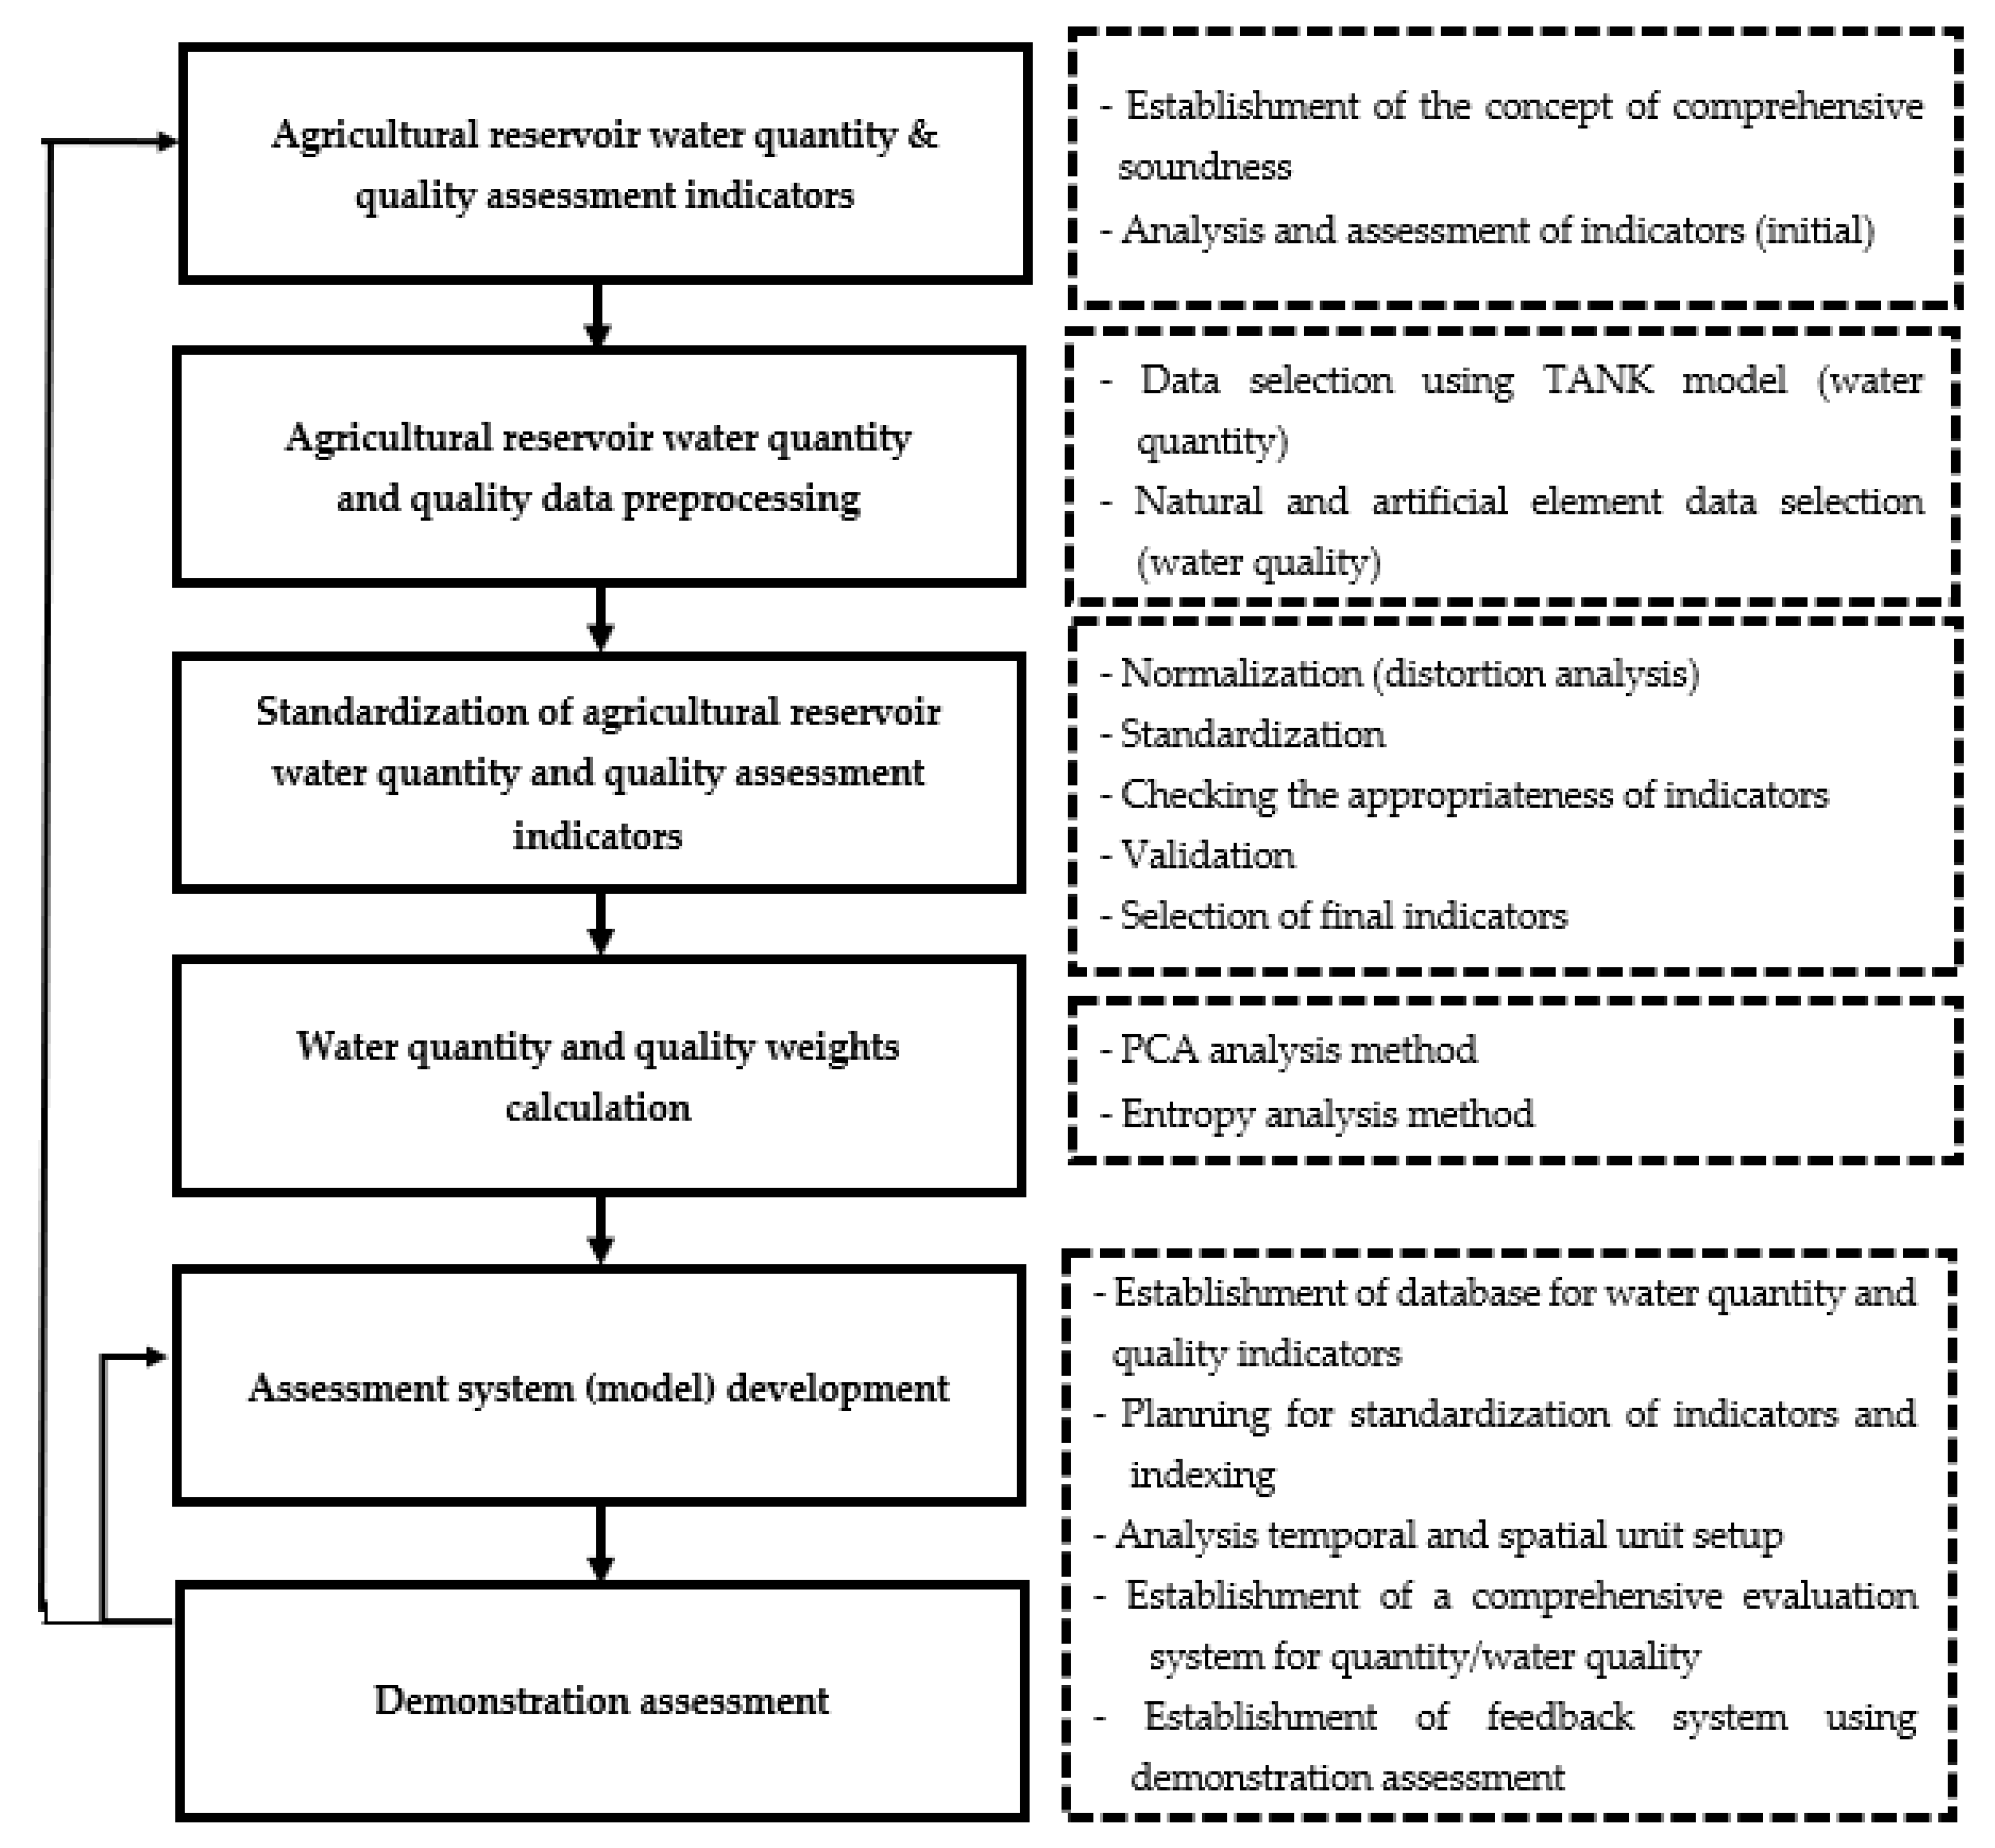
3.2. Research Methods

This study aims to define the condition of rivers based on the concept of water stress as defined by Falkenmark [15]—ecological and human values by water quantity and quality soundness and the influencing factors that affect agricultural reservoirs as stress to evaluate the resulting soundness of water usage by men and the water quality system of the reservoirs.
Accordingly, the four reservoirs managed by the Korea Rural Community Corporation were assessed for the soundness of water quantity and quality and comprehensive soundness. First, the assessment indicators (initial) and the data for each indicator were established. To analyze data distortion and secure normality, these data were normalized before the standardization of the analysis units and data. Furthermore, the indicators were reviewed for suitability, and factor analysis and reliability tests were conducted to select them as final indicators. In the process, the IBM SPSS Statistics program, commonly used for statistical analysis, data mining, etc., was used. Once the final indicators were determined, their weights were calculated through principal component and entropy weight methods using mathematical methodology rather than a survey with experts, which can contain subjective opinions. The indexes were calculated with the weights applied and rated in five grades for more objective and easier understanding. Figure 2 below shows the research methods in the form of the study flow chart.
The assessment indicators (initial) for water quantity and quality of agricultural reservoirs were selected, data were established, normalized, and standardized, and the suitability of the indicators was verified. The IBM SPSS program was used to conduct statistical analysis, and the natural logarithm was applied to the values with a distortion level of 1 or higher, whereas the common logarithm was applied to the values with a distortion level of −1 or lower for the log transform. After calculating the indexes, all of them must be unidirectional for rating, but some have inverse relations; thus, the indicator values that had gone through normalization were standardized. Among the various standardization methods, Z-Score, re-scaling, and category scaling are mainly used in Korea. In this study, the maximum–minimum value standardization method was used, which was introduced by Kim et al. [16]. In the forward direction, a higher indicator value indicates more soundness, while a higher indicator value indicates less soundness in the reverse direction.
This study used standardized values with the SPSS program to extract factors and conduct the analysis. The extraction was conducted using the PCA method, and a scree plot and eigenvalue of 1 or higher were selected to determine the number of factors and calculate initial factor loading. Factor rotation was analyzed using the Varimax method.
For weight calculation, the Analytic Hierarchy Process (AHP), PCA [17], and entropy methods are commonly used, but recently, objective factor analysis and entropy methods have been used more than the AHP method which reflects the experts subjective views.
PCA is a method to reduce the dimensions of different variables correlated with each other, creating a smaller number of new variables. The entropy weight calculation method applies the information theory, which is relatively easier for decision makers to understand a range of decision issues containing much information on alternatives or properties for estimation. Information theory is a method to identify properties with a high level of cohesion based on the frequency of each characteristic and to apply a higher weight to them. It provides information on the signal in numbers in a certain system; hence, as entropy increases, uncertainty decreases.
Accordingly, the PCA and entropy methods were applied and compared to calculate the weights. Out of the two methods, a method that had a smaller deviation from the average was used to apply the weight. Furthermore, the same weight of 0.5 was applied to water quantity and quality.
An index evaluation was conducted for the water quantity and quality properties to calculate the soundness index for each characteristic. The comprehensive soundness index was calculated by adding water quantity soundness and water quality soundness, each of which was calculated by multiplying the standardized indicator value by the weight of each indicator. Ratings were based on the equal interval method specified by the Ministry of Land, Transport and Maritime Affairs [18].

4. Results

4.1. Data Building for Assessment Indicator Selection

The indicators of the water quantity characteristic comprise five items—high flow, low flow, zero flow, variability, and seasonality from 2014 to 2019. Table 5 shows the yearly indicators of the water quantity characteristics.
Indicators for the water quality characteristics are assessable indicators with natural elements and artificial elements distinguished from each other, comprising DO, COD, SS, TN, TP, and TOC. The database was built from the yearly average water quality at the representative spot in each reservoir. Table 6 shows the data for water quality characteristics from 2014 to 2019.

4.2. Indicator Normalization and Standardization

Indicator normalization verifies original data distribution through statistical analysis of collected data and standardizes the data that can be considered normal distribution. In addition, a logarithm was applied to the data showing distorted distribution, maximizing its normality. Table 7 shows changes in skewness identified through the normality review of the water quantity characteristics, while Table 8 shows changes in skewness identified through the normality review of the water quality characteristics.
For water quantity, the skewness value for zero flow is −1.651, which is lower than -1.0; therefore, a common logarithm was used to convert the data. For water quality, the skewness values for SS and TP are 1.274 and 1.173, respectively, both of which are over 1.0; hence, a natural logarithm was used to convert the data.
The indicators were standardized using the minimum–maximum standardization method. Table 9 and Table 10 show the standardization results for the water quantity and quality properties from 2014 to 2019.

4.3. Indicator Selection

The suitability of indicators must be verified to select them. Suitability was tested through the KMO suitability test and Bartlett’s unit matrix test. Following the suitability test for water quantity, the KMO value was 0.575, and Bartlett’s unit matrix value was p < 0.001, which are suitable for factor analysis. Table 11 shows the suitability test results for water quantity and quality.
The communality test showed the extraction values for water quantity and quality of 0.5 or higher, which are suitable for factor analysis. The communality test results for water quantity and quality are shown in Table 12 and Table 13.
The PCA method was used to extract factors for factor analysis. Only the factors with an eigenvalue over 1 were extracted for analysis using the Varimax method to determine the number of factors.
The analysis for water quantity and quality showed two principal components for water quantity, which accounts for 73.36%, and two principal components for water quality, which account for 89.90%. Details are shown in Table 14 and Table 15.
The rotated component matrix represents correlations between indicators and factor components; its baseline is ±0.4 or higher. For water quantity, the first component showed low flow, zero flow, and variability, whereas the second component showed high flow and seasonality. The first component showed COD, SS, TP, and TOC for water quality, and the second component showed DO and TN. The results are shown in Table 16 and Table 17, demonstrating that water quantity and quality are grouped into two components.

4.4. Calculations with Weights Applied

After the indicator standardization and final indicator selection, the weights should be calculated and applied considering the effects of factors between indicators. In this study, all the weights were calculated using both the entropy method and the PCA method, and then a method with less standard deviation from the average was selected. This is because the weights for the comprehensive reservoir soundness assessment should be determined so that each indicator’s effect on the comprehensive index is equal. Figure 3 shows the comparison of weight calculation through the entropy method and the principal component method, which demonstrates that the weights calculated with entropy analysis are distributed more evenly—throughout the respective indicators—than those calculated with the method of PCA.
Furthermore, for the comprehensive soundness assessment, both water quantity and quality weights were set to 0.5. The calculated entropy weights are shown in Table 18. The results have the highest weight in water quantity and the lowest in water quality. In water quantity, zero flow showed the highest of 0.1171, and SS showed the lowest of 0.0668. In water quality, the highest value was 0.0961 in TP, while in water quantity, the lowest value was 0.0774 in low flow.

4.5. Index Calculation and Rating

Comprehensive soundness indexes are calculated by adding the indexes of water quantity and quality: the higher the index, the more sound the reservoir, while the lower the index, the less sound the reservoir. Table 19 shows the comprehensive soundness of each reservoir from 2014 to 2019.
The water quantity indexes were more uniform than the water quality indexes. The Songgo and Nohong reservoirs showed generally lower indexes, the Idam reservoir showed moderate indexes for water quantity, and the Jukryang reservoir generally showed the highest indexes for water quantity. The highest index for water quantity (0.3558) belonged to the Songgo reservoir in 2015, while the lowest index (0.1773) also belonged to the Songgo in 2014. The Songgo reservoir showed the biggest fluctuation in the water quantity indexes, indicating more water quantity changes.
Indexes for water quality showed greater differences among them. The highest index of 0.4708 was in the Jukryang reservoir in 2016, while the lowest of 0.0790 was in the Idam reservoir. The Songgo and Idam reservoirs are subject to water quality improvement and generally showed lower water quality indexes. However, the indexes for the Nohong reservoir were moderate. Furthermore, the Jukryang reservoir had the highest water quality indexes in all years. On average, the Idam reservoir showed good indexes in water quantity but low indexes in water quality, whereas the Nohong reservoir showed good indexes in water quality but low indexes in water quantity.
Comprehensive soundness indexes are the sum of water quantity and quality indexes. Accordingly, the Songgo reservoir, in which both water quantity and quality indexes were low, also showed relatively lower indexes in comprehensive soundness. The comprehensive soundness indexes for the Nohong reservoir gradually declined over time. The Jukryang reservoir, which had higher water quantity and quality indexes, showed the highest indexes in terms of the comprehensive soundness of water quantity and quality.
The calculated indexes were rated based on the criteria shown in Table 20, and the resulting rates are stated in Table 21. Grade 1 means very good, while Grade 5 means very poor.
For water quantity, the Songgo reservoir was rated Grade 5 in 2014 and 2019, implying poor water quantity, and also showed a substantial difference between 2014 and 2019. The ratings of the Idam reservoir improved over time, while the Nohong reservoir showed relatively poor ratings until 2019. The Jukryang reservoir had fair ratings; however, the ratings deteriorated over time.
For water quality, the Songgo and Idam reservoirs had poor ratings with more variations in the ratings. However, the Jukryang and Nohong reservoirs generally showed better ratings with fewer variations. This is because the water quality of the two reservoirs has improved gradually as part of Korea Rural Community Corporation’s water quality management efforts.
Only the Idam reservoir showed improved ratings in the comprehensive soundness, while others showed similar or worse ratings compared to the past. Nevertheless, the Jukryang reservoir showed the best ratings of all the reservoirs.
Figure 4 shows graphs of changes in temporal and spatial traits of each reservoir from 2014 to 2019. The points below the red dotted line indicate that the ratings improved from 2014 to 2019, and those above the line indicate that the ratings degraded from 2014 to 2019. The soundness ratings of each reservoir were evaluated by considering Grade 1–3 good and Grade 4–5 poor.
This study conducted a comprehensive assessment of water quantity and quality for agricultural reservoirs to determine soundness ratings for each reservoir.
This study was conducted on agricultural reservoirs, which is as valuable as the first attempt to comprehensively assess reservoirs. However, it has limitations that the subjects were limited to four agricultural reservoirs out of approximately 3400 reservoirs managed by Korea Rural Community Corporation. There were some difficulties in obtaining data of many reservoirs because this study required both water quantity and water quality data. In addition, they were graded by relative ratings, which can cause the grades to vary depending on which reservoir the indexing and grading were performed. In other words, this study classified the Jukryang reservoir as good, but if it is analyzed with other reservoirs with better water quality than the Jukryang reservoir, it may be classified poorly because the grades could not be rated based on absolute but relative criteria. When all reservoirs have been analyzed through multiple processes, such as this study, the ratings can be performed based on absolute criteria.

5. Conclusions

This study established an assessment system of water quantity and quality for agricultural reservoirs from 2014 to 2019, using the results to perform quantitative evaluation, establish basic data on water quantity and quality, and conduct statistical analysis through the SPSS program. The appropriate indexing system was finally selected, and then weights were calculated for indexing, and the indexes were rated to assess comprehensive soundness. The results of the analysis are as follows:
  • As for the water quantity data, based on the natural flows obtained from the flow data of the RIMS system and the Tank model, the formula of each indicator was applied to obtain five indicators—high flow, low flow, zero flow, variability, and seasonality. For the water quality data, the averages of quarterly water quality data were taken to use six indicators—DO, COD, SS, TN, TP, and TOC.
  • The indicators were selected as final indicators by reviewing their suitability using the SPSS statistics analysis program. According to the suitability review of the standardized data, the KMO values for water quantity and water quality were 0.575 and 0.653, respectively. Bartlett’s unit matrix test results showed p < 0.05 for water quantity and quality, which were considered suitable for factor analysis. Communality also showed 0.5 or higher for both, which represents the variables well.
  • The weights were calculated using both entropy and PCA. Based on the average with all weights equal, weights with less deviation from the average were selected for the application. Thus, entropy weights were applied.
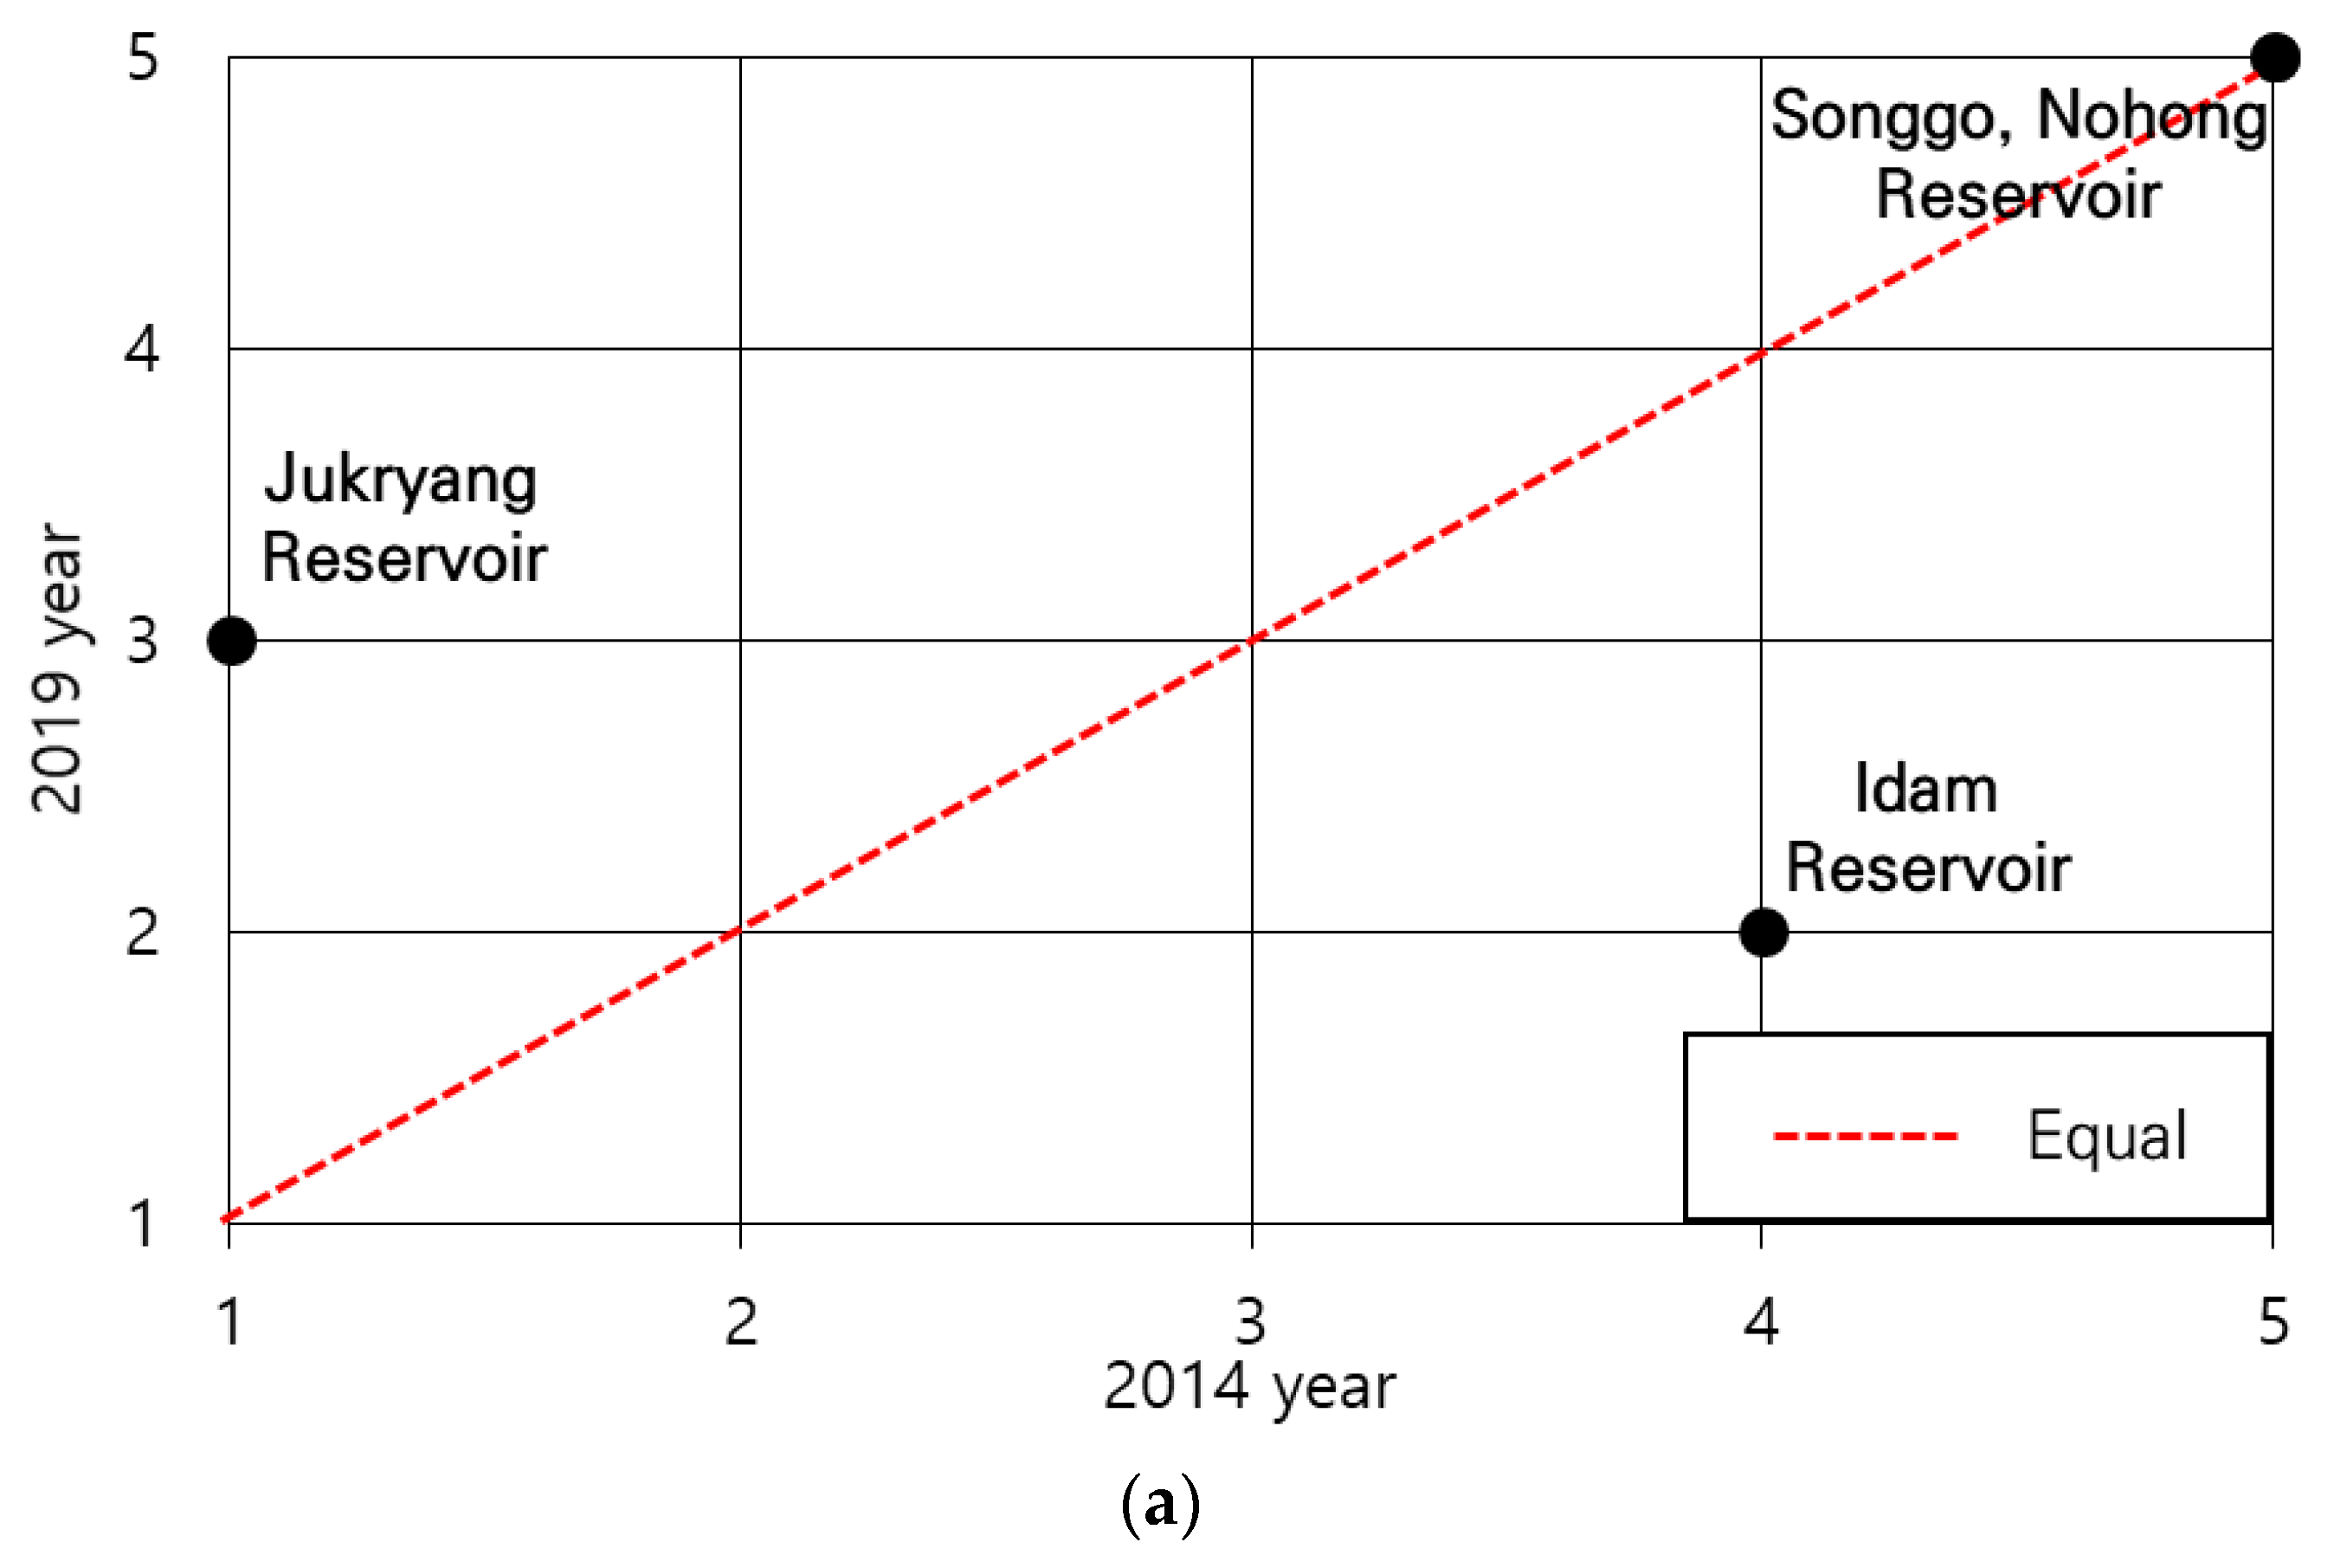
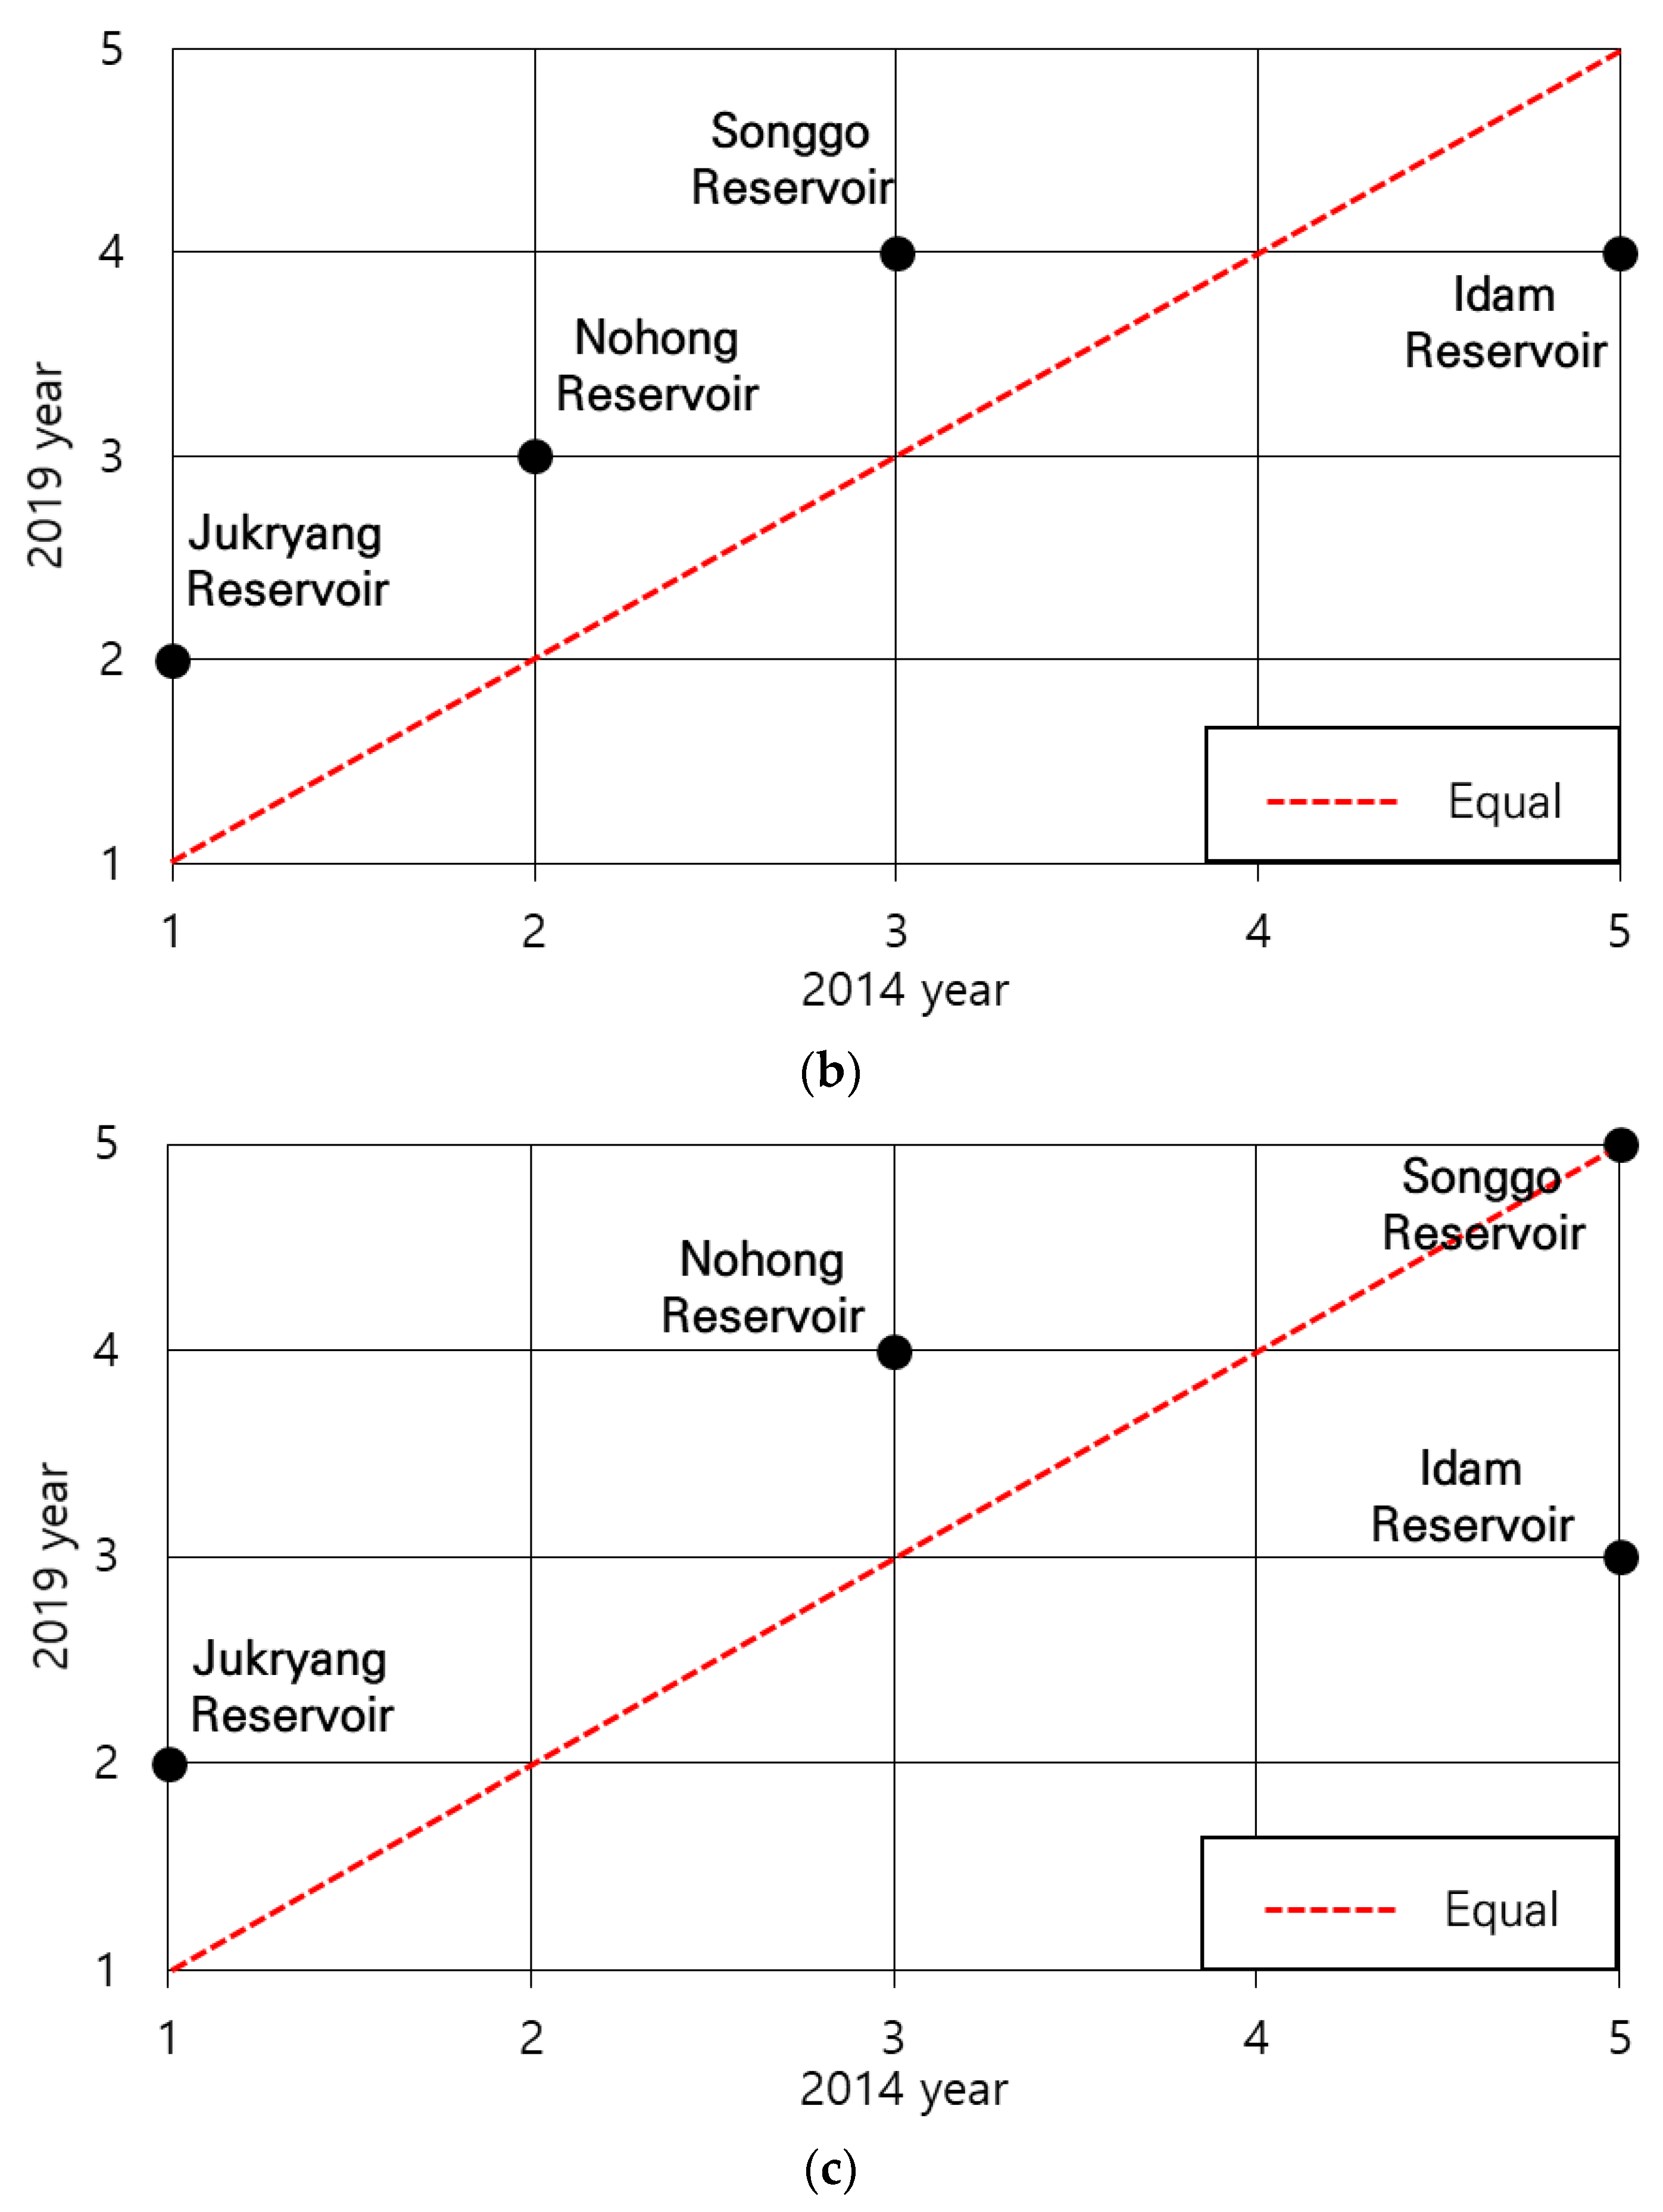
  • Indexes for water quantity and quality were calculated by multiplying the standardized values by the entropy weights. Comprehensive soundness indexes were calculated by adding water quantity and quality indexes. Therefore, the Jukryang reservoir showed the highest comprehensive soundness indexes, and the Songgo reservoir showed generally low indexes. Ratings based on the yearly indexes resulted in the Jukryang reservoir having the best grade and the Songgo reservoir having the poorest grade. The Jukryang and Nohong reservoirs were classified as good based on the average grade, while the Songgo and Idam reservoirs were considered poor in the average grade.
The conclusions of this study are expected to contribute to efficient improvement and management of reservoirs by clearly distinguishing between the reservoirs with poorer soundness and those with better soundness, as well as to provide basic data for agricultural reservoirs and assist in reservoir soundness diagnosis. Periodical comprehensive assessment of water quantity and quality for agricultural reservoirs hereafter will provide tools to help plan and validate the results.

Author Contributions

Conceptualization, S.L.; methodology, S.L. and S.M.; software, S.L. and E.H.; validation, S.L., S.M. and H.P.; formal analysis, D.K. and E.H.; investigation, S.L. and E.H.; resources, D.K. and H.P.; writing—original draft preparation, S.L. and S.M.; writing—review and editing, H.P. and E.H.; visualization, S.L. and D.K.; supervision, S.L. and S.M.; project administration, S.L. and S.M. All authors have read and agreed to the published version of the manuscript.

Funding

This research was funded by the Korea Agency for Infrastructure Technology Advancement (KAIA) by the Ministry of Land, Infrastructure and Transport, under grant number RS-2021-KA161134.

Data Availability Statement

Not applicable.

Conflicts of Interest

The authors declare no conflict of interest.

References

  1. Lee, Y. A Study on the Law of the Framework Act on Water Management. Water Future 2019, 3, 48–52. [Google Scholar]
  2. Deng, X.; Xu, Y.; Zhai, L.; Liu, Y.; Li, Y. Establishment and Application of the Index System for Urban River Health Assessment. Shengtai Xuebao/Acta Ecol. Sin. 2014, 34, 993–1001. [Google Scholar] [CrossRef]
  3. Pont, D.; Hugueny, B.; Rogers, C. Development of a Fish-Based Index for the Assessment of River Health in Europe: The European Fish Index. Fish. Manag. Ecol. 2007, 14, 427–439. [Google Scholar] [CrossRef]
  4. Lencha, S.M.; Tränckner, J.; Dananto, M. Assessing the Water Quality of Lake Hawassa Ethiopia—Trophic State and Suitability for Anthropogenic Uses—Applying Common Water Quality Indices. Int. J. Environ. Res. Public Health 2021, 18, 8904. [Google Scholar] [CrossRef] [PubMed]
  5. Shi, R.; Zhao, J.; Shi, W.; Song, S.; Wang, C. Comprehensive Assessment of Water Quality and Pollution Source Apportionment in Wuliangsuhai Lake, Inner Mongolia, China. Int. J. Environ. Res. Public Health 2020, 17, 5054. [Google Scholar] [CrossRef] [PubMed]
  6. Joseph, N.; Preetha, P.P.; Narasimhan, B. Assessment of Environmental Flow Requirements Using a Coupled Surface Water-Groundwater Model and a Flow Health Tool: A Case Study of Son River in the Ganga Basin. Ecol. Indic. 2021, 121, 107110. [Google Scholar] [CrossRef]
  7. Karr, J.R.; Rossano, E.M. Applying Public Health Lessons to Protect River Health. Ecol. Civ. Eng. 2001, 4, 3–18. [Google Scholar] [CrossRef]
  8. K-Water. Study on the Development a System for Evaluating the Health of the Rivers Comprehensively; Korea Water Resources Association: Deajeon, Republic of Korea, 2017. [Google Scholar]
  9. Sugawara, M. On the Analysis of Runoff Structure about Several Japanese Rivers. Jpn. J. Geophys. 1961, 2, 4. [Google Scholar]
  10. Korea Rural Community Corporation. Establishment of Water Environment Assessment System Considering Water Quantity and Quality of Agricultural Reservoirs; Korea Rural Community Corporation: Naju-si, Republic of Korea, 2020. [Google Scholar]
  11. Nardo, M.; Saisana, M.; Saltelli, A.; Tarantola, S.; Hoffman, A.; Giovannini, E. Handbook on Constructing Composite Indicators: Methodology and User Guide; OECD Statistics Working Papers; OECD: Paris, France, 2005. [Google Scholar]
  12. Yalcin, I.; Amemiya, Y. Nonlinear Factor Analysis as a Statistical Method. Stat. Sci. 2001, 16, 275–294. [Google Scholar] [CrossRef]
  13. Yilmaz, V.; Buyukyildiz, M. Factor Analysis of Surface Water Quality Parameters for the Rivers of Turkey. Fresenius Environ. Bull. 2015, 24, 113–123. [Google Scholar]
  14. Wagner, W.E. Using IBM SPSS Statistics for Research Methods and Social Science Statistics; SAGE Publishing: New York, NY, USA, 2015. [Google Scholar]
  15. Falkenmark, M. Global Water Issues Confronting Humanity. J. Peace Res. 1990, 27, 177–190. [Google Scholar] [CrossRef]
  16. Kim, D.Y.; Park, S.H.; Song, C.M. Evaluation of Water Social Service and Comprehensive Water Management Linked with Integrated River Evaluation. Water 2021, 13, 706. [Google Scholar] [CrossRef]
  17. Richman, M.B. Rotation of Principal Components. J. Climatol. 1986, 6, 293–335. [Google Scholar] [CrossRef]
  18. Choi, S.J.; Lee, D.R.; Baeck, S.H.; Hong, S.J.; Kang, S.K. Study on Development of River Synthesis Management Index; Korea Water Resources Association: Deajeon, Republic of Korea, 2012. [Google Scholar]
Figure 1. Locations of the reservoirs in study area (‘do’ indicates the name of province).
Water 15 02131 g001
Figure 2. Study flow chart.
Water 15 02131 g002
Figure 3. Comparison of calculated weights: (a) Calculated weights in the water quantity characteristics for each indicator; (b) Calculated weights in the water quality characteristics for each indicator.
Water 15 02131 g003
Figure 4. Temporal distribution of each reservoir: (a) water quantity; (b) water quality; (c) comprehensive soundness characteristics.
Water 15 02131 g004aWater 15 02131 g004b
Table 1. Criteria for indicator selection [8].
PropertiesCriteria for Indicator Selection
Relevancy and RepresentativenessIndicators that are highly relevant and can represent the subject matter to review or evaluate
QuantificationIndicators that can be quantified by quantitative measurement
Periodicity and SimplicityIndicators that constantly provide data through periodic measurements and of which the data can be collected easily
Objectivity and ReliabilityIndicators that can gain reliability through objective data production and processing
Policy Associations and ApplicabilityIndicators that are associated with existing policies and applicable to policies
OthersPrediction of changes, comprehensive information provision, representativeness of the class, etc.
Table 2. Detailed indicators selected for quantitative soundness assessment.
IndicatorsDescriptions
High Flow
  • High flow induced transfer, deposit, and changes, disturbing the ecosystem
  • Difference between current flows and natural flows
  • Average of the lowest flow and the second lowest flow of the year
Low Flow
  • The bigger the differences in low flows and the longer the period, the more stress is caused to the river habitats and biodiversity
  • Difference between current flows and natural flows
  • Average of the months with the lowest flow and the second lowest flow of the year
Zero Flow
  • Aquatic ecosystem destruction and water quality deterioration due to ephemeral rivers and creeks
  • Defined with the yearly exceedance probability of 99.5%
Variability
  • Critical indicator for changes in ecosystem due to flow fluctuation
  • Monthly flow variability
Seasonality
  • As biological productivity decreases during the reserve season but increases during the flood season, it is a significant indicator of changes in the aquatic ecosystem
  • Changes in the highest monthly flow and the lowest monthly flow of the year
Table 3. Details of the indicators selected for water quality soundness assessment.
IndicatorsDescriptions
CODPhysicochemical indicator for water pollution, influencing factor of organic pollution
TNFactor of nutrient substance pollution and eutrophication
TPFactor of nutrient substance pollution and eutrophication
DODissolved oxygen in the water, indicator for pollution level
SSParticulate solids in the water, indicator for pollution level
TOCTotal dissolved organic carbon in the water, indicator to verify uncertain factors underlying COD and BOD tests
Table 4. Reservoir data used in this study.
ReservoirsWaterfront Area (ha)Benefited Area (ha)Total Impoundment (1000 m3)Effective Storage (1000 m3)
Songgo500.062.5144.6143.6
Idam535.0118.0649.0644.0
Nohong502.073.01153.31153.3
Jukryang450.0133.11264.71237.0
Table 5. Indicators of the water quantity characteristics for each reservoir.
YearReservoirHigh FlowLow FlowZero FlowVariabilitySeasonality
2014Songgo0.97270.34150.75410.68150.5850
Idam0.96170.90440.96170.85130.6650
Nohong0.73220.41530.40440.04220.3750
Jukryang0.94810.44261.00000.34090.3750
2015Songgo0.94810.77601.00000.64640.3750
Idam0.95630.97271.00000.70490.5400
Nohong0.98360.45360.45360.01990.3750
Jukryang0.77870.86341.00000.29910.3750
2016Songgo0.84150.87161.00000.70910.4150
Idam0.97270.88801.00000.53420.5400
Nohong0.78960.75410.75410.06600.3300
Jukryang0.74320.99730.99450.79980.2500
2017Songgo0.89340.81150.98910.67070.6650
Idam0.90980.79780.86340.45270.5400
Nohong0.96990.57100.10380.18690.2900
Jukryang0.86340.87430.97810.69100.6250
2018Songgo0.88800.83881.00000.66000.4200
Idam0.92900.88251.00000.76620.4200
Nohong0.74860.87430.54100.11170.4200
Jukryang0.97270.65850.98360.65070.4550
2019Songgo0.86610.64750.97270.93990.4150
Idam0.95900.84701.00000.49530.5850
Nohong0.79230.59290.13660.17620.4550
Jukryang0.90710.67490.99450.40920.4550
Table 6. Indicators of the water quality characteristics for each reservoir (unit: mg/L).
YearReservoirDOCODSSTNTPTOC
2014Songgo11.67508.45006.42503.78800.37404.7750
Idam6.300013.075022.47501.86200.16107.4000
Nohong10.02506.20004.82501.28100.02403.8250
Jukryang10.15003.15002.92501.17700.01501.8250
2015Songgo11.400011.15009.42503.75800.40506.0500
Idam9.125012.725014.20002.00100.10206.6250
Nohong5.50006.95003.95000.64300.02003.9500
Jukryang10.97503.05002.40001.13900.01401.5000
2016Songgo6.375010.50008.92503.30400.32505.7000
Idam8.225012.500027.77501.86900.09205.9250
Nohong6.40006.60003.82501.13000.02104.1500
Jukryang11.42502.90002.27501.18800.01201.3000
2017Songgo10.575014.250018.32504.02600.29007.5750
Idam12.000012.300017.85002.14600.08705.6000
Nohong8.22506.75005.47500.79600.03103.9500
Jukryang6.20003.40006.22501.13700.02101.5500
2018Songgo12.225010.90009.47503.72800.20805.7000
Idam9.025010.200010.72502.87400.09105.0500
Nohong6.80006.60003.85001.45600.02504.5250
Jukryang6.92503.25001.92501.34900.01001.7250
2019Songgo9.77508.60009.57504.03700.28604.9500
Idam9.831012.900013.13102.47600.08905.8880
Nohong6.20007.33303.63301.62100.02104.6330
Jukryang7.13302.73301.93301.15600.01001.5330
Table 7. Changes in skewness identified through the normality review of the water quantity characteristics.
IndicatorsHigh FlowLow FlowZero FlowVariabilitySeasonality
Before Conversion−0.667−0.769−1.651−0.3990.353
After Conversion−0.667−0.7690.686−0.3990.353
Table 8. Changes in skewness identified through the normality review of the water quality characteristics (unit: mg/L).
IndicatorsDOCODSSTNTPTOC
Before Conversion0.011−0.0591.2740.6761.173−0.332
After Conversion0.011−0.0590.0870.6760.214−0.332
Table 9. Standardized results of the water quantity characteristics for each reservoir.
YearReservoirHigh FlowLow FlowZero FlowVariabilitySeasonality
2014Songgo0.95630.00010.28050.28150.1928
Idam0.91270.85800.65190.09670.0001
Nohong0.00010.11150.08920.97610.6988
Jukryang0.85710.15421.00000.65110.6988
2015Songgo0.85710.66261.00000.31960.6988
Idam0.88890.96341.00000.25540.3012
Nohong1.00000.17100.10831.00000.6988
Jukryang0.18650.79541.00000.69670.6988
2016Songgo0.43650.80921.00000.25110.6024
Idam0.95630.83361.00000.44130.3012
Nohong0.23020.62900.28050.95000.8072
Jukryang0.04371.00000.91000.15221.0000
2017Songgo0.63890.71600.83540.29240.0001
Idam0.70630.69620.40360.52930.3012
Nohong0.94440.34960.00010.81850.9036
Jukryang0.51980.81220.74190.27070.0964
2018Songgo0.61900.75881.00000.30430.5904
Idam0.78170.82601.00000.18910.5904
Nohong0.06750.81220.14610.90000.5904
Jukryang0.95630.48240.78800.31410.5060
2019Songgo0.53170.46720.70970.00010.6024
Idam0.90080.77101.00000.48370.1928
Nohong0.23810.38320.00820.83040.5060
Jukryang0.69440.50840.91000.57720.5060
Table 10. Standardized results of the water quality characteristics for each reservoir (unit: mg/L).
YearReservoirDOCODSSTNTPTOC
2014Songgo0.91820.50360.54850.07340.02150.4462
Idam0.11900.10200.07930.64080.24920.0279
Nohong0.67290.69900.65570.81200.76350.5976
Jukryang0.69140.96380.84330.84270.89050.9163
2015Songgo0.87730.26920.40490.08220.00010.2430
Idam0.53900.13240.25130.59990.37250.1514
Nohong0.00010.63380.73071.00000.81270.5777
Jukryang0.81410.97250.91740.85390.90910.9681
2016Songgo0.13010.32560.42530.21600.05950.2988
Idam0.40520.15190.00010.63880.40040.2629
Nohong0.13380.66420.74280.85650.79950.5458
Jukryang0.88100.98550.93740.83940.95071.0000
2017Songgo0.75460.00010.15580.00320.09020.0001
Idam0.96650.16930.16560.55720.41550.3147
Nohong0.40520.65120.60840.95490.69430.5777
Jukryang0.10410.94210.56030.85440.79950.9602
2018Songgo1.00000.29090.40290.09100.18000.2988
Idam0.52420.35170.35650.34270.40340.4024
Nohong0.19330.66420.74030.76050.75240.4861
Jukryang0.21190.95511.00000.79201.00000.9323
2019Songgo0.63570.49060.39900.00010.09400.4183
Idam0.64400.11720.28070.45990.40940.2688
Nohong0.10410.60060.76210.71180.79950.4688
Jukryang0.24281.00000.99840.84891.00000.9629
Table 11. Suitability test for factor analysis.
Water QuantityKMO Measurement0.575
Bartlett’s Unit Matrix TestApproximate Chi-Square32.549
p (Significance Probability)0.000
Water
Quality
KMO Measurement0.653
Bartlett’s Unit Matrix TestApproximate Chi-Square179.787
p (Significance Probability)0.000
Table 12. Communality values extracted for the water quantity characteristics.
IndicatorHigh FlowLow FlowZero FlowVariabilitySeasonality
Extracted Value0.7900.7910.7520.7590.576
Table 13. Communality values extracted for the water quality characteristics.
IndicatorDOCODSSTNTPTOC
Extracted Value0.8790.9530.8730.8240.9130.947
Table 14. Total variance explained for the water quantity characteristics.
ComponentInitial EigenvalueSum of Squares for ExtractionSum of Squares for Rotation
TotalVariance (%)Accumulate Sum (%)TotalVariance (%)Accumulate Sum (%)TotalVariance (%)Accumulate Sum (%)
12.3747.4547.452.3747.4547.452.0941.6941.69
21.3025.9173.361.3025.9173.361.5831.6773.36
30.7114.0987.46
40.387.5494.99
50.255.01100.00
Table 15. Total variance explained for the water quality characteristics.
ComponentInitial EigenvalueSum of Squares for ExtractionSum of Squares for Rotation
TotalVariance (%)Accumulate Sum (%)TotalVariance (%)Accumulate Sum (%)TotalVariance (%)Accumulate Sum (%)
14.2871.3371.334.2871.3371.333.8163.4963.49
21.1118.4889.801.1118.4889.801.5826.3189.80
30.437.1696.96
40.132.1299.08
50.040.7399.80
60.010.20100.00
Table 16. Rotated component matrix for the water quantity characteristics.
IndicatorHigh FlowLow FlowZero FlowVariabilitySeasonality
Component 1−0.0490.8720.8410.7510.224
Component 2−0.8870.174−0.2120.4420.752
Table 17. Communality values explained for the water quality characteristics (unit: mg/L).
IndicatorDOCODSSTNTPTOC
Component 1−0.0120.9660.9270.6190.8330.970
Component 2−0.9380.1410.1130.6640.4690.076
Table 18. Entropy weight calculation results.
Characteristics WeightIndicatorEntropy WeightIndicator Ratings
Water Quantity0.5High Flow0.09854
Low Flow0.074410
Zero Flow0.11711
Variability0.11012
Seasonality0.10003
Water Quality0.5DO0.09166
COD0.08438
SS0.066811
TN0.08447
TP0.09615
TOC0.07709
Table 19. Comprehensive soundness indexes for each reservoir.
YearReservoirWater QuantityWater QualityTotal
2014Songgo0.177270.233370.41064
Idam0.240670.078970.31965
Nohong0.196070.343070.53914
Jukryang0.354480.430070.78455
2015Songgo0.355820.172270.52808
Idam0.334500.155770.49027
Nohong0.303810.291530.59534
Jukryang0.341170.456010.79718
2016Songgo0.308130.126550.43468
Idam0.351940.137430.48938
Nohong0.287590.297190.58478
Jukryang0.301990.470820.77281
2017Songgo0.246170.090740.33692
Idam0.256970.208550.46553
Nohong0.299460.308930.60839
Jukryang0.237900.346170.58406
2018Songgo0.327000.204650.53166
Idam0.335350.200640.53598
Nohong0.242280.288660.53094
Jukryang0.307470.406230.71370
2019Songgo0.230450.191510.42196
Idam0.335650.174480.51013
Nohong0.194920.275590.47050
Jukryang0.326860.419040.74590
Table 20. Rating criteria.
Rating Section (%)Grade
84.0–100.01
67.5–84.02
32.5–67.53
16.0–32.54
0.0–16.05
Table 21. Comprehensive soundness ratings for each reservoir.
YearReservoirWater QuantityWater QualityComprehensive Ratings
2014Songgo535
Idam455
Nohong523
Jukryang111
2015Songgo143
Idam243
Nohong332
Jukryang211
2016Songgo354
Idam154
Nohong333
Jukryang311
2017Songgo455
Idam334
Nohong332
Jukryang423
2018Songgo333
Idam233
Nohong433
Jukryang322
2019Songgo545
Idam243
Nohong534
Jukryang322
Disclaimer/Publisher’s Note: The statements, opinions and data contained in all publications are solely those of the individual author(s) and contributor(s) and not of MDPI and/or the editor(s). MDPI and/or the editor(s) disclaim responsibility for any injury to people or property resulting from any ideas, methods, instructions or products referred to in the content.

