Article

Modeling the Effect of Hyporheic Flow on Solute Residence Time Distributions in Surface Water

1
Department of Civil and Environmental Engineering, Yonsei University, 50 Yonsei-ro, Seodaemun-gu, Seoul 03722, Republic of Korea
2
Department of Civil and Environmental Engineering, Hankyong National University, 327 Jungang-ro, Anseong-si 17579, Republic of Korea
*
Author to whom correspondence should be addressed.
Water 2023, 15(11), 2038; https://doi.org/10.3390/w15112038
Submission received: 4 May 2023 / Revised: 24 May 2023 / Accepted: 25 May 2023 / Published: 27 May 2023
(This article belongs to the Special Issue Advances in River Mixing Analysis)

Abstract

:
Understanding the dynamics of hyporheic flow is important for managing water resources, since this interfacial flow exchange affects the fate and transport of contaminants in rivers. This study numerically quantifies the effect of hyporheic exchange on solute residence times in surface water systems by simulating solute transport in unified turbulent open-channel and hyporheic zone systems. Interfacial hyporheic fluxes (qint) increase with increased Reynolds number (Re) that produces an enhanced bottom pressure gradient over the ripple bed. Heavy-tailed breakthrough curves emerge when hyporheic flow is considered in transport simulation. This reveals that hyporheic flow is a dominant driver of non-Fickian transport in surface water as this interfacial flow exchange delays solute transport with slow porewater flows. Furthermore, the increase in Re extends the longitudinal spreading of solute tracers because a higher surface flow velocity intensifies the magnitude of hyporheic flow and associated storage effects. This can be confirmed by the ratio of the maximum residence time to the peak arrival time that increases with the increase in Re, following a power-law relationship with both Re and qint.

1. Introduction

Interfacial flow exchange between surface water and subsurface water is defined as hyporheic exchange [1], which commonly occurs in various aquatic environments such as rivers, lakes, coasts, and oceans. Hyporheic flow is a major hydraulic factor that affects both water quality and ecology by controlling the kinetics of dissolved oxygen, nitrogen, and carbon, and providing habitats for microorganisms [2]. In particular, a hyporheic zone is known as a key source of greenhouse gas production and emission in rivers. This is because nitrate (NO3) transforms to nitrous oxide (N2O) via incomplete denitrification once they enter the hyporheic zone with flow exchange at the sediment–water interface (SWI) [3]. Also, the characteristics of hyporheic flow are important in river restoration and management since hyporheic flow acts as a source of baseflow in freshwater systems, directly affecting the distribution of riparian vegetation in floodplains, groundwater recharge, and water level variation [4].
Solute exchange occurs actively at the SWI while solutes transport downstream when hazardous chemical substances are introduced into rivers through accidental pollution spills. This exchange can be influenced by various factors such as the hydrodynamic conditions of the river and the sediment properties. Flow characteristics of the hyporheic zone, which feature slow flow velocity compared to a surface water flow, would be considered important controlling factors of residence time distributions in the surface water [5]. As a result, hyporheic flow features non-Fickian transport manifested as an elevated concentration in a falling limb of breakthrough curves (BTCs), as depicted in Figure 1. Therefore, understanding the mechanism of hyporheic exchange is crucial for assessing and managing the environmental impacts of pollution spills in surface water systems.
Nevertheless, in conventional transient storage models based on one-dimensional (1D) advection–dispersion equations [6], which are generally used to predict water quality in rivers, the effect of the hyporheic zone is not physically distinguished from other storage effects (vegetation, dead zone, recirculation flow, etc.). In this 1D model, the storage effect is simplified with model parameters estimated with BTCs of tracer tests such as the magnitude of storage zone area and exchange coefficient. Thus, it has limitations to advancing our mechanistic understanding on the effect of the hyporheic zone on solute residence time distributions [7].
The structure and magnitude of flow in the hyporheic zone are determined by various hydraulic and topographical factors of rivers, such as surface water velocity, water depth, and shape and permeability of the riverbed [8]. Previous studies experimentally showed that the geometric structure of the riverbed surface has a dominant effect on mechanisms of hyporheic flow [9,10]. Relevant studies have focused on investigating hyporheic flow characteristics inside the ripple bed ubiquitous in natural water systems of rivers, oceans, and lakes [11]. The turbulent flow on the ripple bed generates a flow separation phenomenon near the bed surface. In the ripple bed, due to the Bernoulli effect, the areas of high pressure and low pressure form on the upstream and downstream sides of the crest at the bed surface, respectively. Consequently, a local pressure gradient develops along the riverbed surface [9]. This bottom pressure gradient results in two-dimensional (2D) downwelling and upwelling flow motion inside the sediment, which causes flow and mass exchange across the SWI (Figure 1), thereby significantly controlling the solute exchange mechanism and resulting residence times. As aforementioned, the hyporheic zone is a major emission pathway of greenhouse gases in rivers. Ahn et al. [12] experimentally illustrated that the shape of the riverbed is directly ascribed to the hydraulic process triggering N2O emission. Especially at the crest of the ripple, where hyporheic exchange fluxes increase with a large pressure gradient, the amount of the N2O emission was about three times larger than the emission from the flat riverbed.
Most previous research works were mainly leveraged on numerically analyzing the sensitivity of momentum fluxes associated with hyporheic exchange to hydraulic and topographical factors such as surface flow velocity and bed shape [13,14,15,16,17]. Cardenas and Wilson [13] simulated flow along and across the SWI between surface water and an underlying sediment bed, suggesting the coupled modeling approach of 2D Reynolds-averaged Navier–Stokes (RANS) equations and Darcy’s law, which is widely used for hyporheic flow simulation. Ren et al. [14] adopted the method of Cardenas and Wilson [13] for simulating hyporheic flow at the system of turbulent flows over the ripple, and they showed that flow velocity and ripple wavelength exert a noticeable impact on the hyporheic exchange flux. Liu et al. [15] quantified the impact of sediment heterogeneity represented by spatial patterns of hydraulic conductivity on solute transport in the hyporheic zone. They showed that heterogeneous sediments of high sorptive ability compress the mixing zone and resend more solute mass to the surface water than homogeneous sediments. Lee et al. [16] studied how fractal properties of bed topography influences hyporheic exchange, revealing that hyporheic exchange flux is sensitive to the roughness of the bed surface and thus impacts BTCs. Ren and Zhao [17] conducted a numerical flow simulation with a variation of the length to crest ratio of the ripple bed, and they revealed that ripple shape affects bottom pressure distributions, upwelling and downwelling flow structures at the SWI, and velocity distributions in the subsurface stagnation zone. Despite the importance of hyporheic flow on solute residence time distributions characterized by BTCs, the previous studies still do not sufficiently quantify the contribution of hyporheic flow to BTCs in surface water.
Several researchers studied the solute transport process in the hyporheic zone (shallow groundwater region) [18,19,20,21]. Hester et al. [18] simulated conservative solute within shallow riverbed sediments. They noticed upwelling flow from deeper groundwater and downwelling flow from surface water through hyporheic flow. The simulation results showed only 12.7% or less tracer mass upwelling from deeper groundwater transported across into hyporheic flow paths originating from surface water, remarking that the mixing-dependent reaction could be localized with a small mixing zone. Wang et al. [19] investigated the transverse hyporheic flow in the compound channel consisting of the main river channel and floodplain. They demonstrated that the shape of the 2D compound bedform impacts hyporheic exchange fluxes across the SWI and solute residence times inside the hyporheic zone. Houzé et al. [20] combined field experiments and numerical simulations for investigating the mixing process in the hyporheic zone. They revealed that groundwater discharge and the saturated hydraulic conductivity of the riverbed control the mixing within the hyporheic zone. Lee et al. [21] investigated how cobble spacing and embeddedness affect near-bed hydrodynamics and hyporheic fluxes by three-dimensional (3D) RANS simulation. They showed that hyporheic exchange increases with the cobble spacing, as well as the protrusion ratio, and that the travel time of the solute increases as the spacing decreases with the solute transport simulation in porous media. However, prior studies simulated solute transport in the hyporheic zone without considering the solute exchange between the surface water (turbulent flow) region and subsurface water region. Hence, the effect of hyporheic flow on solute transport in turbulent open-channel flows, such as rivers and streams, remains largely unknown.
The goal of this study was to numerically quantify the effect of hyporheic exchange on BTCs measured in the surface water overlying the ripple bed. Turbulent open-channel flow and hyporheic zone flow were simulated by varying surface water velocity, which is known as a crucial factor on hyporheic exchange flux, by employing the method of Cardenas and Wilson [13], which incorporates 2D RANS equations with Darcy’s law. With the simulated flow fields, 2D solute transport simulation was performed in the unified systems of the turbulent open channel and underlying hyporheic zone to consider the combined effect of interfacial turbulent mixing and hyporheic exchange on BTCs. Also, solute transport over the impermeable bed in the absence of hyporheic exchange is simulated for quantifying the effect of hyporheic exchange on BTCs by comparing them with the simulation cases, which consider the effect of hyporheic exchange on solute transport.

2. Methods

2.1. Coupled Simulation Model of Surface Water and Groundwater

Cardenas and Wilson [13] proposed a numerical approach for hyporheic flow simulation by coupling 2D RANS equations and Darcy’s law. As shown in Figure 2, the hyporheic zone was simulated using the bottom pressure distribution obtained from the RANS simulation as a boundary condition to reproduce the bottom pressure gradient distribution across the ripple of the riverbed and associated hyporheic flow. This method is widely used for simulating hyporheic flow by considering the characteristics of the turbulent open-channel flow and the shape of the riverbed simultaneously [10,16,22,23].
According to the method of Cardenas and Wilson [13], the 2D turbulent flow of surface water is first simulated with the continuity equation and the RANS equation as follows:
U i x i = 0
U i t + U j U i x j = 1 ρ p x i + x j [ ν ( U i x j + U j x i ) ] x j u i u j ¯
where Ui and Uj are the time-averaged velocity components in the xi and xj directions, respectively; t is the time; p is the fluid pressure; ρ is the density of the fluid; ν is the kinematic viscosity of the fluid; ui and uj are the fluctuating velocity vectors in the xi and xj directions, respectively; and u i u j ¯ is Reynolds stress, which is a product of the Reynolds decomposition defined as:
u i u j ¯ = ν t ( U i x j + U j x i ) + 2 3 k δ i j
where νt is the turbulent eddy viscosity; k is the turbulent kinetic energy; and δij is the Kronecker delta. As previously mentioned, the riverbed in nature is generally characterized as the ripple bed, and flow separation with a recirculation region near the rippled bed is developed by the adverse pressure gradient generated from the viscous flow near the bed [24]. Therefore, the SST k-omega model [25] was used to calculate νt of Equation (3), which shows strong advantages for simulating the adverse pressure gradient flows of pressure-induced flow separation [26]. SST k-omega closure scheme models νt as:
ν t = a 1 k max ( a 1 ω , S F 2 )
where ω is the specific dissipation rate; a1 is the closure coefficient; S is the absolute value of the vorticity; and F2 is the blending function. To close Equation (4), additional transport equations are given as:
k t + U j k x j = P k β * k ω + x j [ ( ν + σ k ν t ) k x j ]
ω t + U j ω x j = α S 2 β ω 2 + x j [ ( ν + σ ω ν t ) ω x j ] + 2 ( 1 F 1 ) σ ω 2 1 ω k x i ω x i
where α, β, β*, σk, σω, and σω2 are the empirical closure constants, and the values are used as Menter (1993) suggested [25]; and F1 and Pk are the auxiliary relations. All the parameters and relations used in the SST k-omega model are summarized in Table 1.
To calculate 2D steady-state hyporheic velocity fields, hyporheic flow is assumed as water flowing through the porous media using Darcy’s law given as:
q i x i = 0
q i = k p μ p x i
where qi is the Darcy flow velocity, kp is the permeability of the soil, and μ is the dynamic viscosity of water.

2.2. Solute Transport Simulation Model

Solute transport is simulated by incorporating the flow simulation results with a 2D advection–diffusion equation for surface water regions and an advection–dispersion equation for groundwater regions, respectively. For the surface water, the solute concentration is calculated as:
C t + U i C x i = x i ( D t C x i )
where C is the solute concentration; Dt is the turbulent diffusivity defined as νt/SCt; SCt is the turbulent Schmidt number. Following the previous studies [27], SCt is set as 0.7, which showed a good agreement with experimental data.
The solute concentration in groundwater regions including the hyporheic zone is calculated with the 2D advection–dispersion equation given as:
C t + q i C x i = x i ( ( D m + D i j ) C x i )
where Dm is the molecular diffusion coefficient and Dij is the mechanical dispersion coefficient tensor. Mechanical dispersion is a hydrodynamic diffusion process originating from the porous media flow structure and can be defined as follows [28]:
D x x = D L q x 2 q 2 + D V q y 2 q 2
D x y = D y x = ( D L D V ) q x q y q 2
D y y = D V q x 2 q 2 + D L q y 2 q 2
where q is defined as q x 2 + q y 2 ; DL and DV are the longitudinal and vertical dispersion coefficients, respectively. The values of DL and DV vary depending on the flow characteristics through porous media. In this study, the longitudinal diffusivity is assumed as 0.05 m and DV as a tenth of DL [16,29,30]. The adsorption process occurring in the riverbed is neglected, assuming that the solute tracers are non-adhesive.

3. Results and Discussion

3.1. Results of Model Validation Cases

The aforementioned flow model was first validated by comparing simulation results with the experimental data of Janssen et al. [10]. The experiment was conducted in a 2 m long and 0.3 m wide flume with a 1.5 m long test section. The bottom of the channel was shaped with seven identical current-type ripples with 0.02 m height, 0.2 m length consisting of 0.15 m front crest distance, and 0.05 m back crest distance on the 0.09 m sand depth, as described in Figure 2. They performed flow measurements in the flow condition of 0.1 m water depth and mean longitudinal flow velocities (U0) of 0.07 m/s and 0.12 m/s. This experiment confirmed flow separation zones developed over the surface of the ripple bed by observing the backward flow motion near the bed. The permeability of the channel bed was 1.5 × 10⁻¹¹ m2 which corresponds to the mean grain size of 0.174 mm with a standard deviation of 1.5 mm.
Figure 2 explains that the boundary conditions for the 2D RANS simulation of surface water are set up with an inlet mean velocity of 0.07 m/s and 0.12 m/s and outlet pressure boundary condition. For the inlet boundary condition of velocity and turbulence variables, the Dirichlet boundary condition was applied. The inlet velocity is uniformly distributed at the inlet section, depending on the flow condition (U0 = 0.07 and 0.12 m/s). The turbulence variable of SST k-omega model at the inlet boundary is given as:
k = 3 2 ( U 0 I ) 2
ω = C μ 1 4 k l
where I is the turbulent intensity; and l is the turbulent length scale. I and l is assumed as 5% of the mean velocity magnitude and 7% of the flow depth, respectively [31].
The symmetry boundary condition is imposed on the water surface to consider it as a rigid lid because the flow conditions of the experiment result in a Froude number smaller than 0.15, and the no-slip bottom condition is applied for velocity. The turbulence variables were set to the wall functions at the bottom. The zero gradient condition is imposed on k at the bottom contiguous cells. The wall function for ω can be defined as:
ω p = ω 2 v i s + ω 2 log
where ω is the centroid value in cells adjacent to solid walls; ω are the values for viscous and log-layer, respectively, described as:
ω v i s = 6 ν β 1 d 2
ω log = U * C μ 1 / 4 κ d
where u* is the shear velocity; κ is the von Karman constant set to 0.41; and d is the distance from the solid bottom. For the outlet boundary conditions, both velocity and turbulence variables were set to the zero gradient boundary condition. For pressure, the zero-gradient condition was applied to all boundaries except the outlet section.
For groundwater (hyporheic) flow simulated with Darcy’s law, the bottom pressure distribution obtained from the RANS simulation was used as the boundary condition at the SWI with the zero-gradient boundary for the inlet and outlet, and the no-slip boundary condition was set up for the bottom. The simulation domain wasp discretized with 20,000 structured cells for surface water and groundwater domains, respectively, with 400 (longitudinal) × 50 (vertical) grid resolution. For accurately reproducing the flow separation near the ripple bed, the dimensionless wall height y+ ( = y p u * / ν ) was less than 1.0 [16,22], where yp is the distance from the channel bed to the center of the first grid cell; and u* is the shear velocity. The time step of the simulation is set to the Courant number less than 0.4.
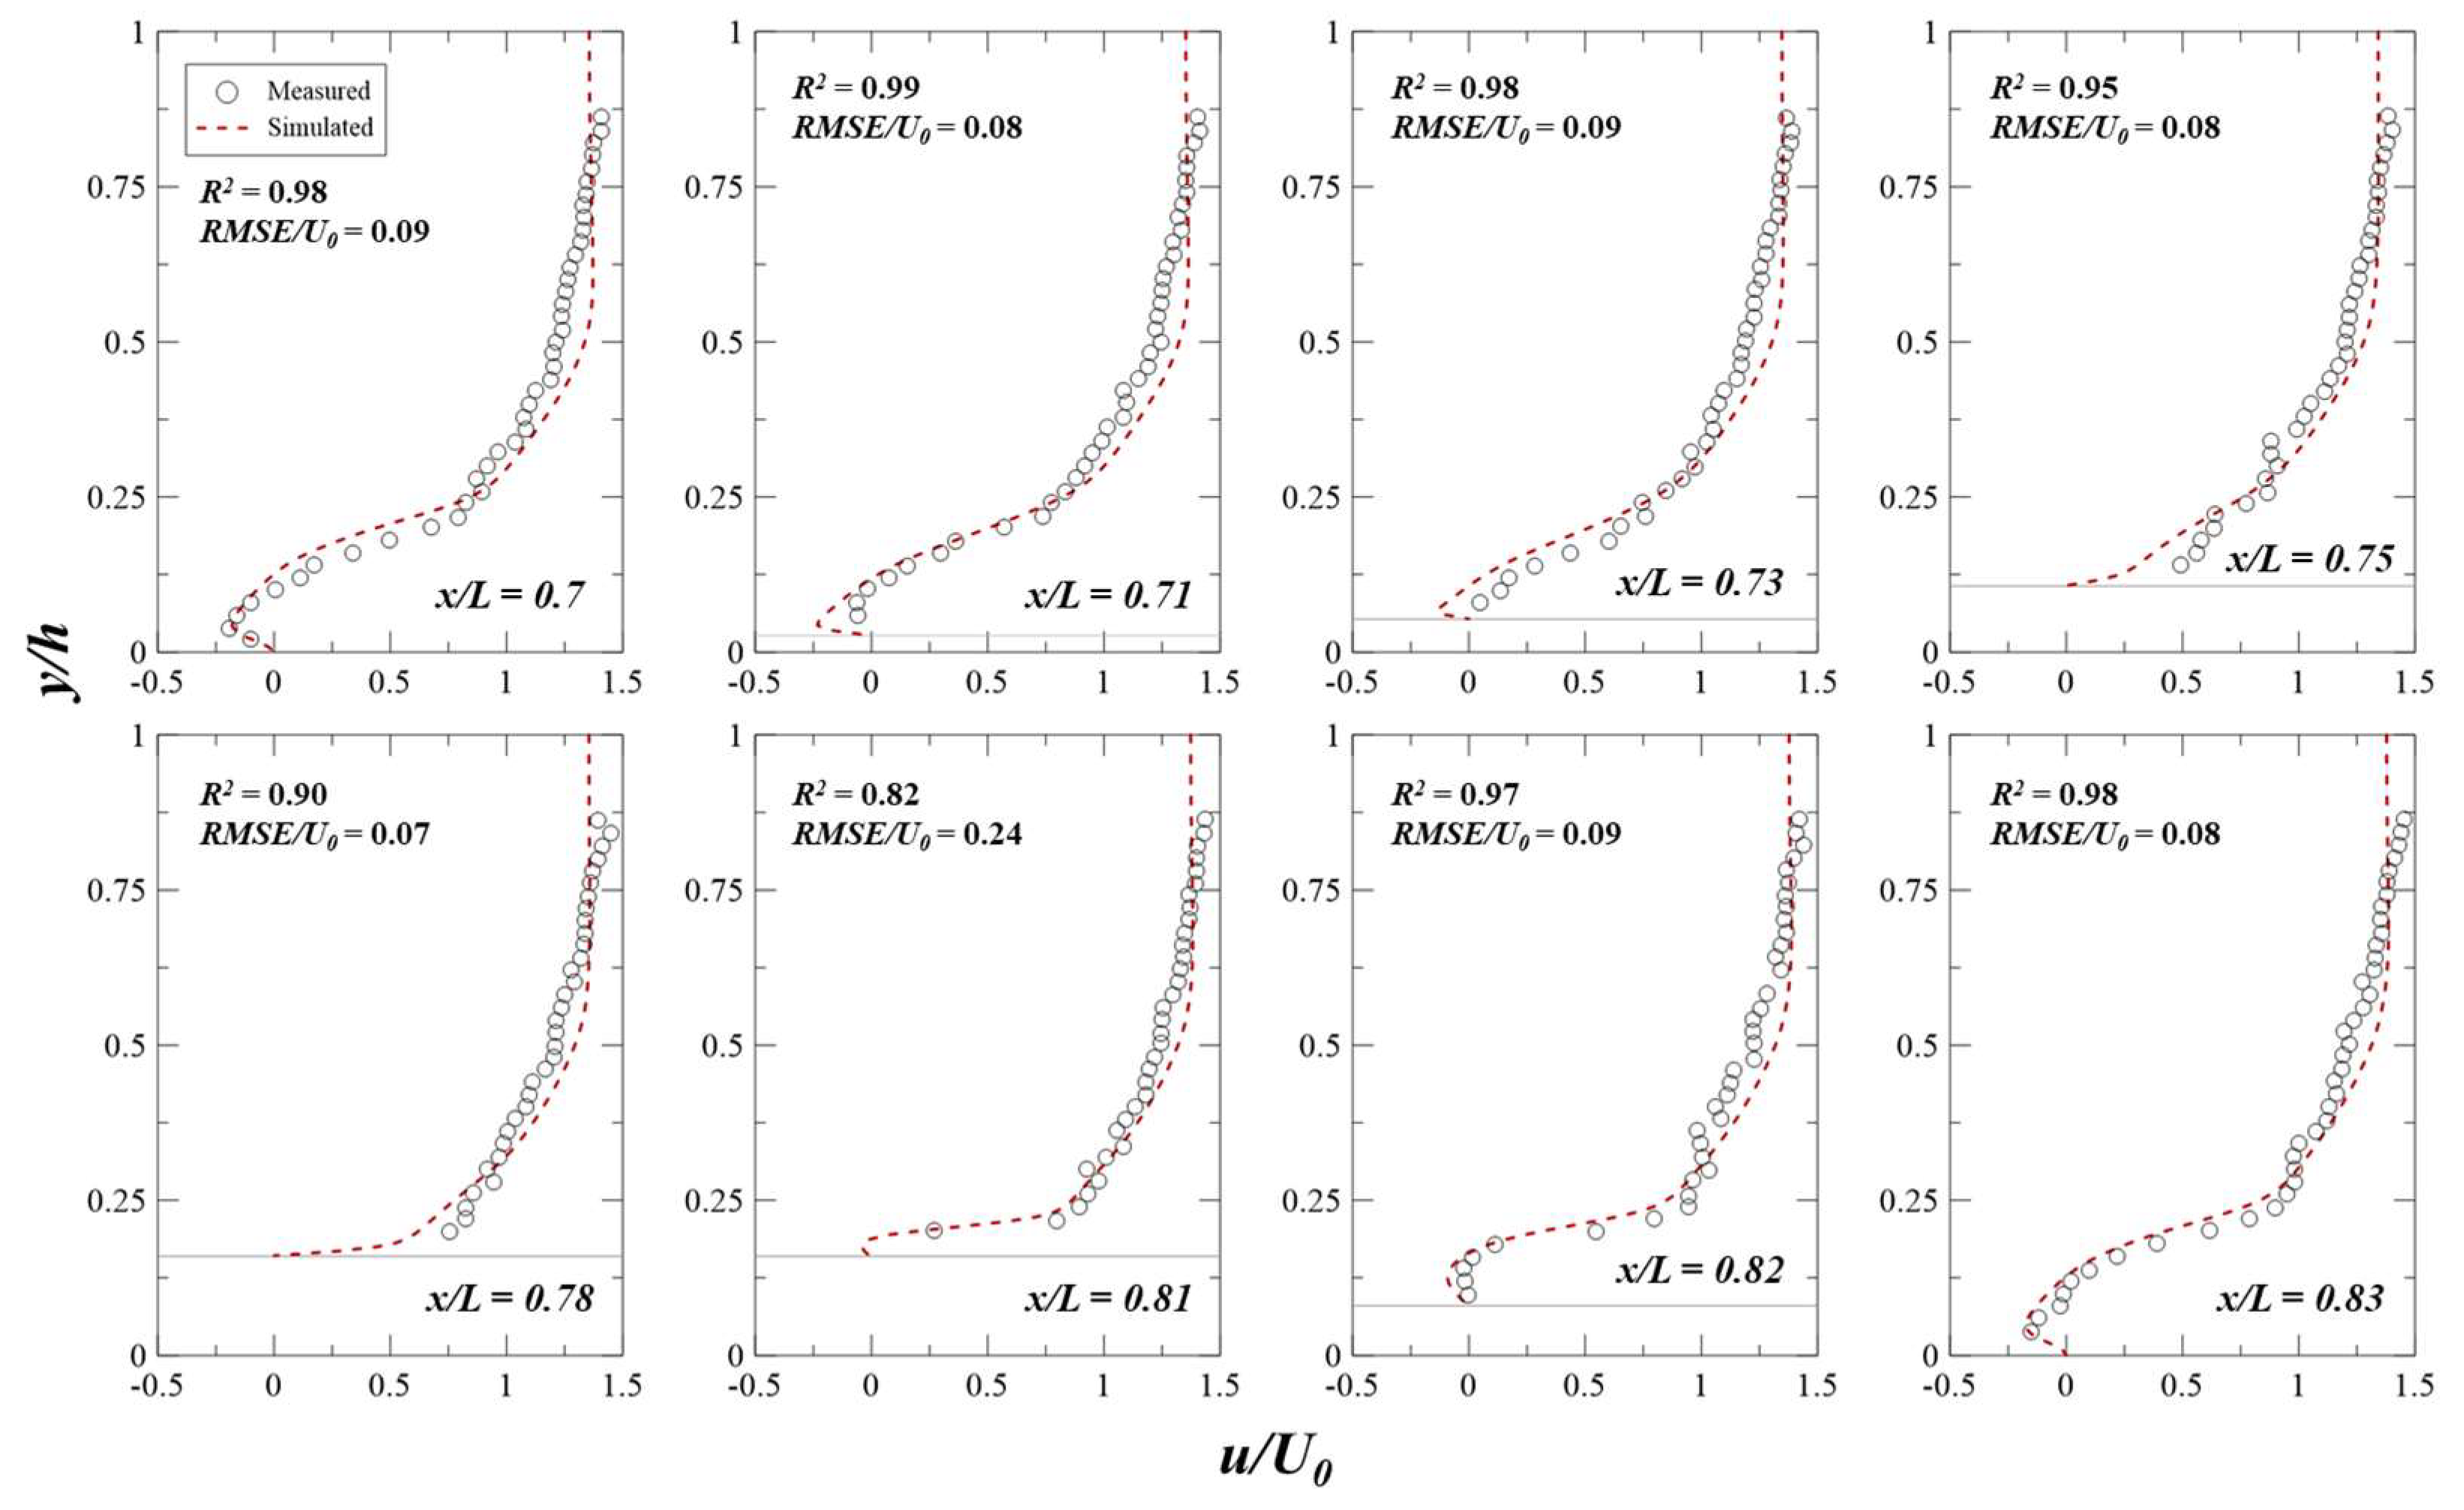
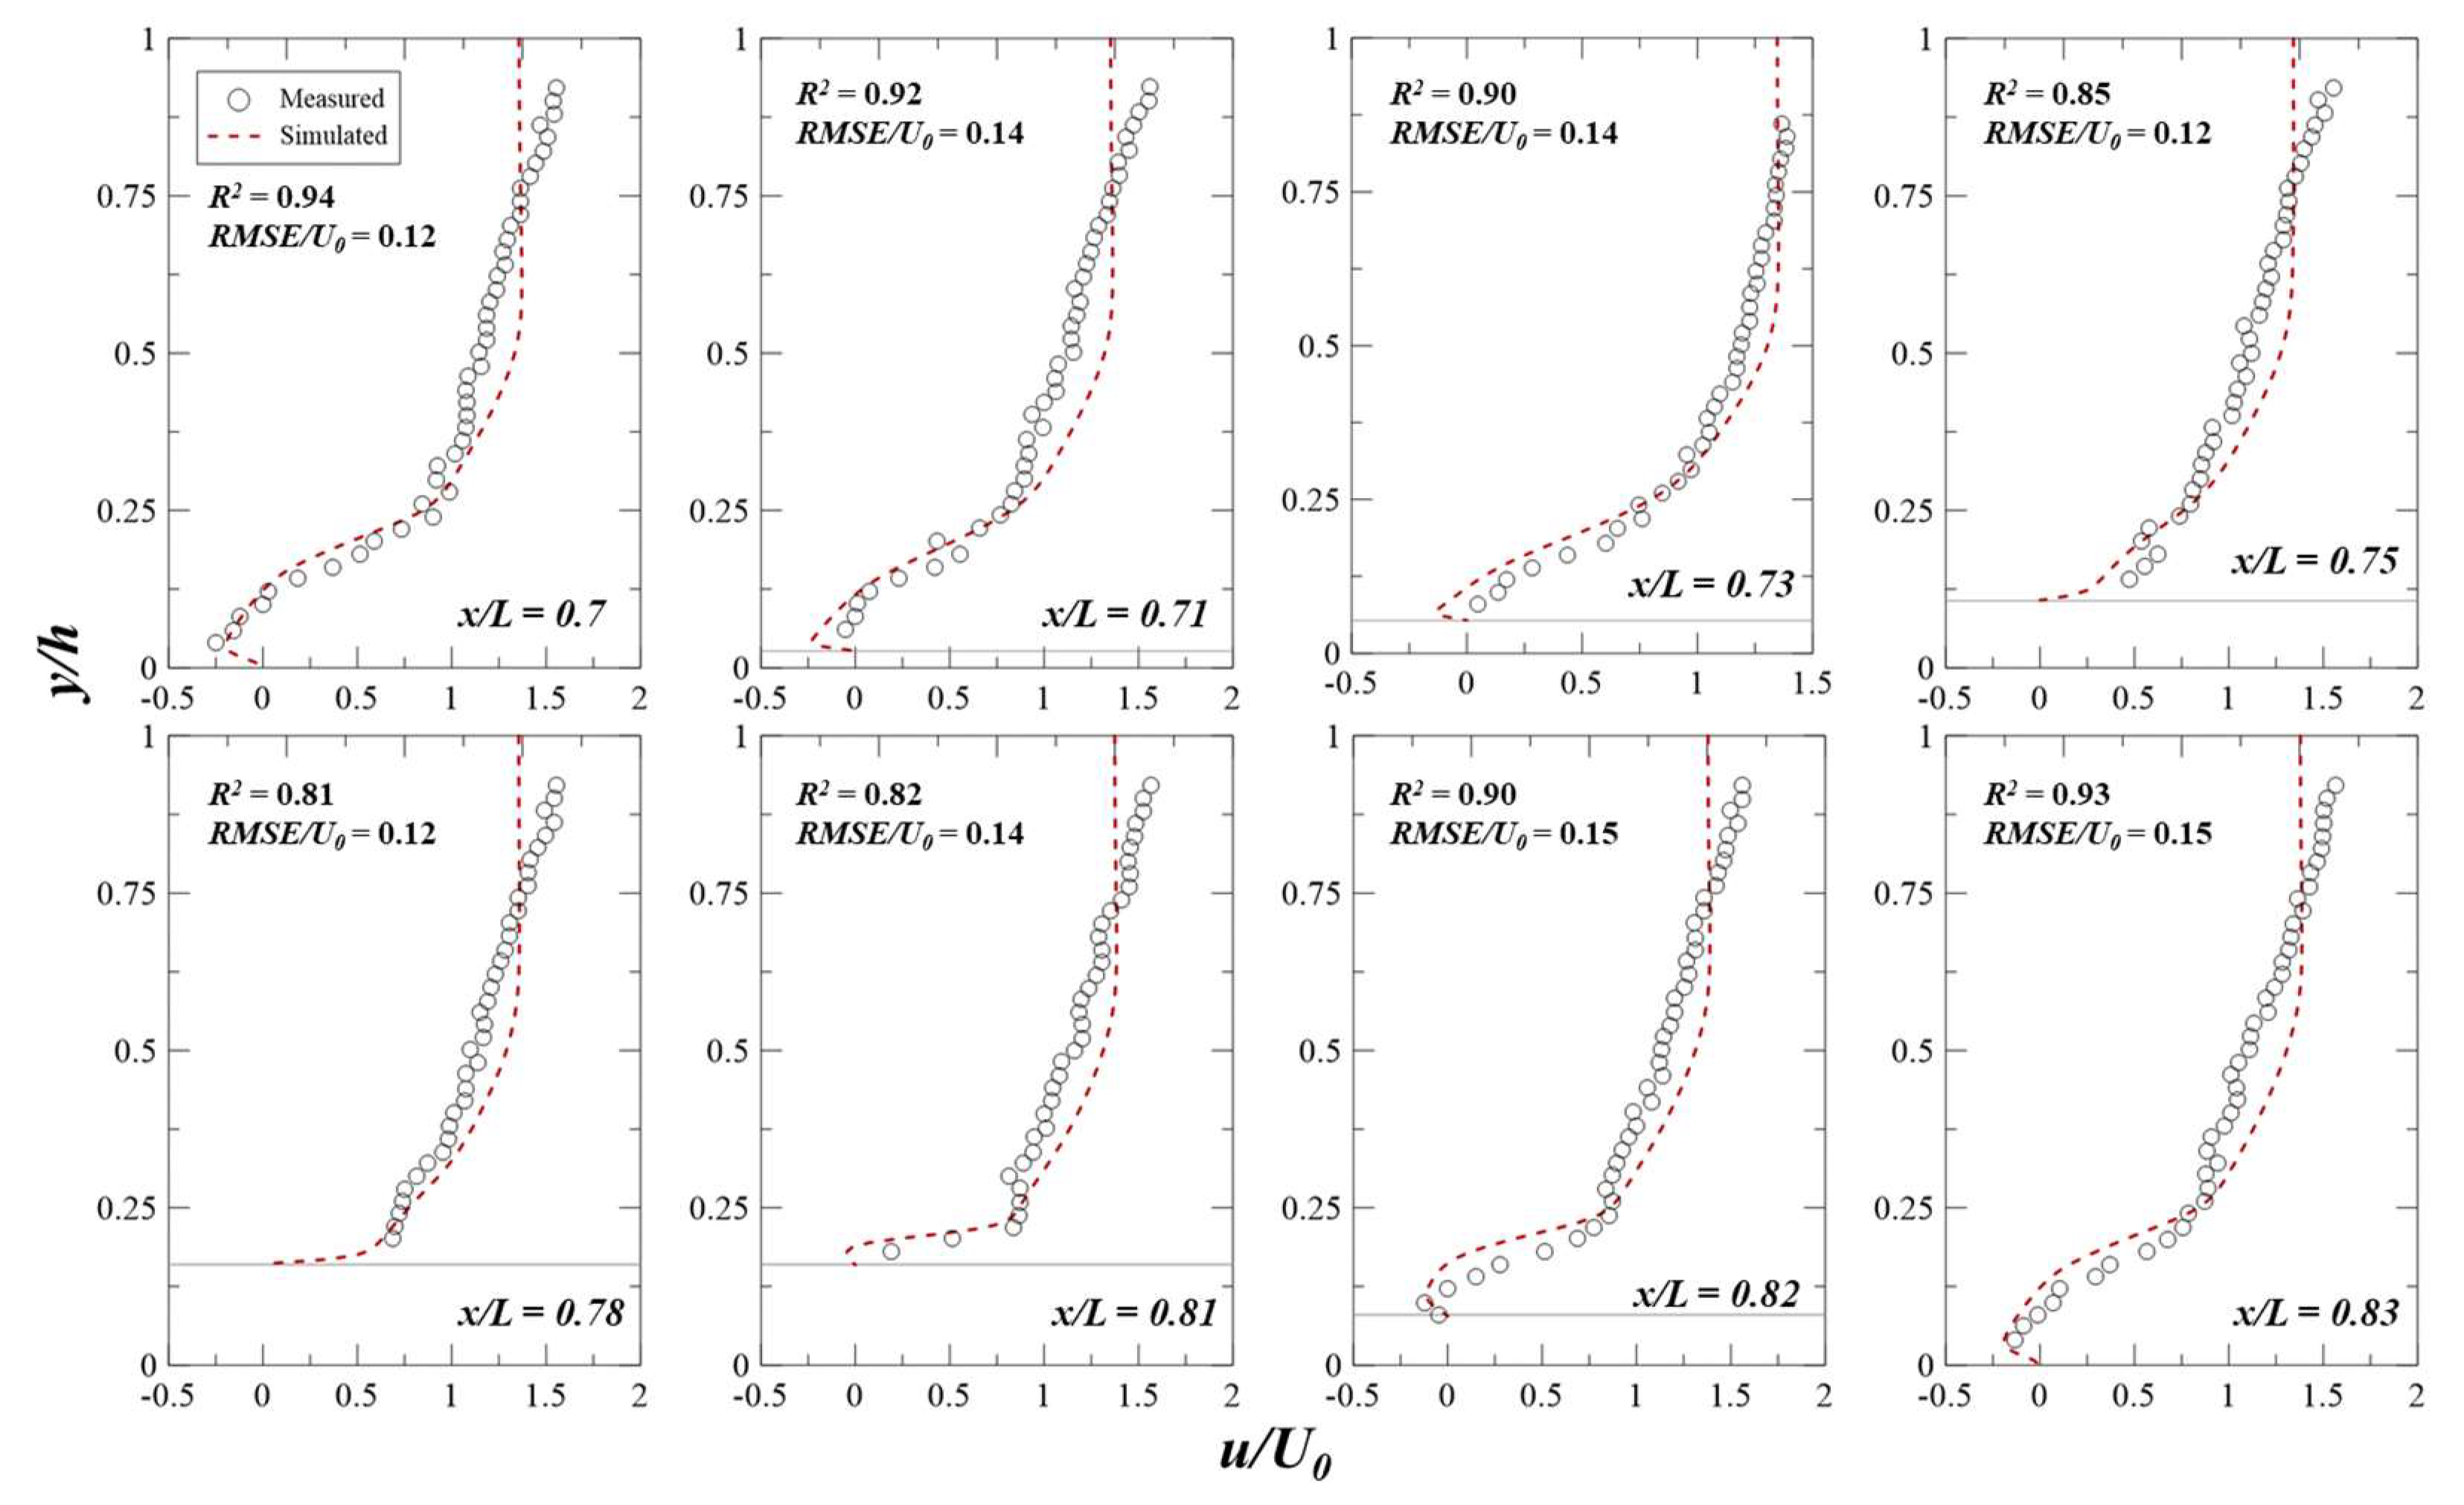
The experiment of Janssen et al. [10] measured vertical profiles of longitudinal velocity and bottom pressure distribution. The simulation results with the measured velocity and pressure distribution are shown in Figure 3, Figure 4 and Figure 5. Figure 3 and Figure 4 show that the surface water simulations adequately reproduce the longitudinal velocity distribution with the determination of coefficient (R2) and normalized root mean square error (RMSE/U0) ranging from 0.81–0.99 and 0.07–0.24, respectively, accurately generating the backward flow patterns near the bed after flow passing the crest for both of the validation cases with U0 = 0.07 m/s and U0 = 0.12 m/s. This indicates that the flow model effectively captures the flow separation near the bed due to the ripple structure. In the high discharge case (U0 = 0.12 m/s), the simulated velocity profiles show some discrepancies with the observation data near the water surface. This might be due to the limited length of the experimental flume to reach the fully developed flow condition in the measurement section [10]. Nevertheless, the RANS simulation reasonably resolves the general pattern of longitudinal velocities and the recirculating flows over the ripple bed.
The bottom pressure distribution simulated with the RANS model is used for the boundary condition to simulate hyporheic flow in the groundwater region so that the bottom pressure gradient determines the magnitude and structure of hyporheic flow. Figure 5 presents the comparison between the simulation and observation for the bottom pressure, and it shows that the surface water model successfully simulates the overall patterns of adverse pressure gradients emerging between the crests of the ripple bed. The high discharge case shows a pressure peak larger than that of the low discharge case, thereby inducinga strong pressure gradient. Moreover, the minimum pressure can be observed at the crest region where the flow starts to separate due to the ripple bed.

3.2. Results of Study Cases for Flow Simulation

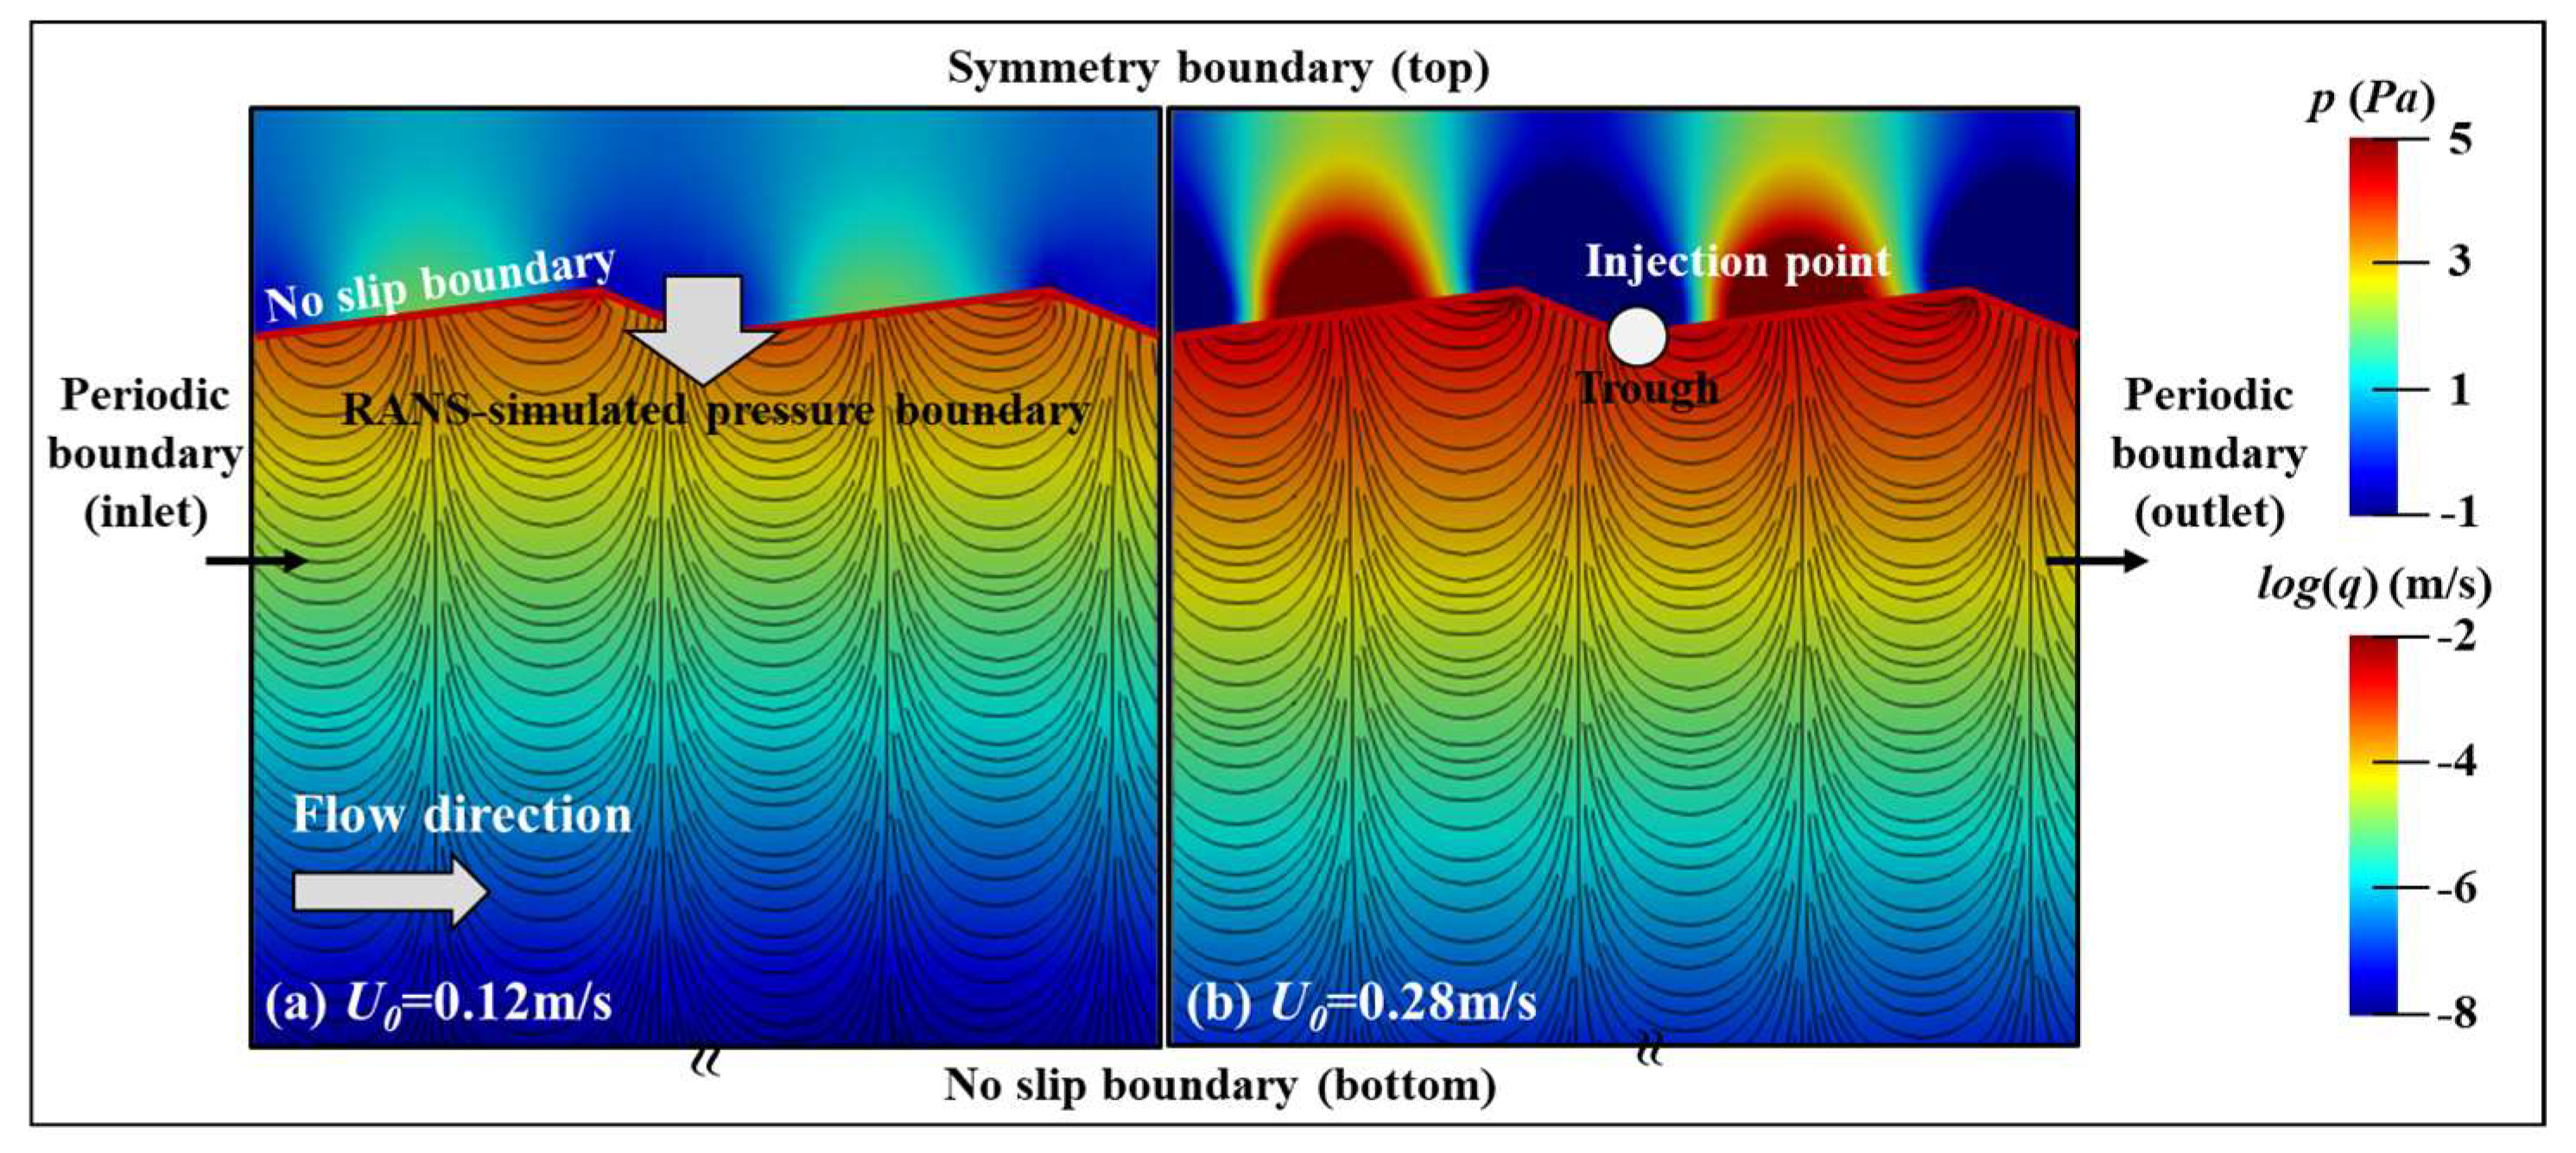
In the validation cases, the fully developed flow condition cannot be obtained due to the short computational domain for high discharge cases. Hence, the computational domain is simplified, imposing the periodic boundary condition on the inlet and outlet for the coupled flow simulation of surface water and groundwater regions, as shown in Figure 6. With the periodic boundary condition, the two boundary faces are physically connected so that the computational domain can be approximated as an infinitely long flume.
For study cases, a wide range of the inlet mean velocity is investigated with 0.12 m/s, 0.28 m/s, 0.36 m/s, 0.44 m/s, and 0.52 m/s, which corresponds to fluid Reynolds number (Re = U0h/ν) of 12,000, 28,000, 36,000, 44,000, and 52,000, respectively. Other conditions such as water depth and shape of ripple are set identical to the experimental condition of Janssen et al. [10]. Ren and Zhao [17] revealed that hyporheic flow structures change depending on the location (thickness) of the bottom boundary (no-slip condition) in the sediment (groundwater) layer under the identical flow and topographic condition to that of the Janssen et al. [10] experiment. They found that the effect of the bottom boundary condition in the sediment layer becomes insignificant when the thickness of the sediment layer exceeds 0.7 m. To minimize the effect of the bottom boundary condition on flow and solute transport simulations, the thickness of the sediment bed is set as 0.7 m. Here, the permeability is set as kp = 1 × 10⁻⁸ m2 corresponding to coarse sand.
With the above computational setup, hyporheic flow fields are simulated, and the hyporheic flux across the SWI is calculated from the simulation results, which is known as interfacial hyporheic flux (qint). The detailed computation process of qint can be found in Cardenas and Wilson (2006) [32]. Figure 6 shows the pressure distribution in the surface water region and hyporheic flow flux in the subsurface region. The maximum pressure is found in the center of the upstream slope, and the minimum pressure is observed near the crest. This pressure gradient generates 2D upwelling and downwelling flow patterns inside the hyporheic zone.
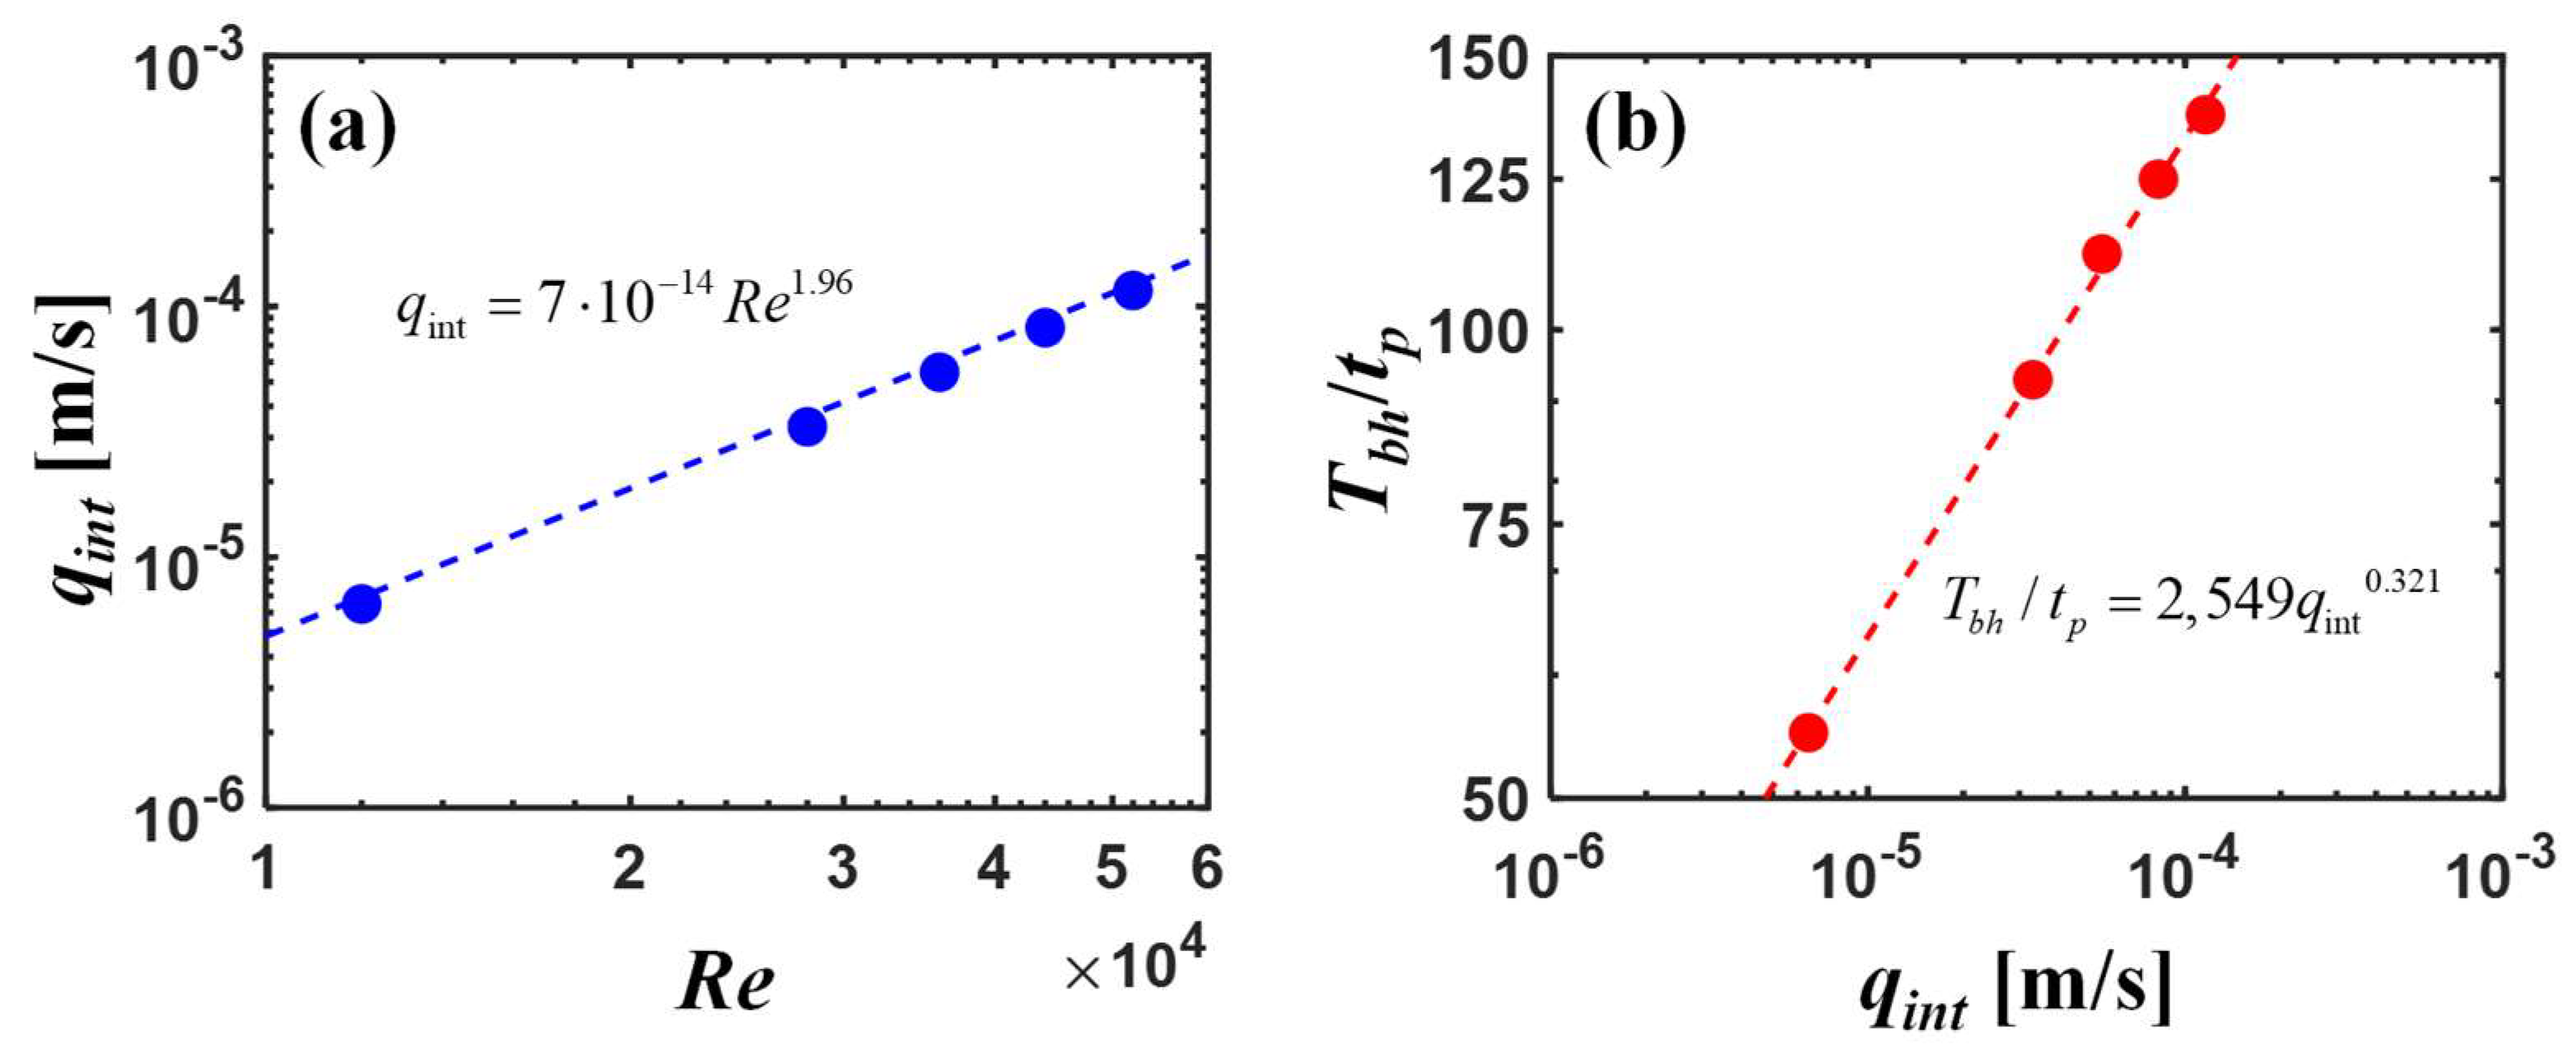
Figure 7a shows that qint increases about 20 times with increasing Re in the range of 12,000–52,000, and their relationship is fitted to the power-law relationship with a coefficient of determination (r2) greater than 0.99. This result is matched with the finding of the previous study [13] as the increased flow velocity causes the enhanced bottom pressure gradient, which produces a stronger hyporheic flux. Furthermore, the simulation results demonstrate that the power-law relationship between qint and Re is valid in the high discharge cases with Re larger than 25,000.

3.3. Results of Study Cases for Transport Simulation

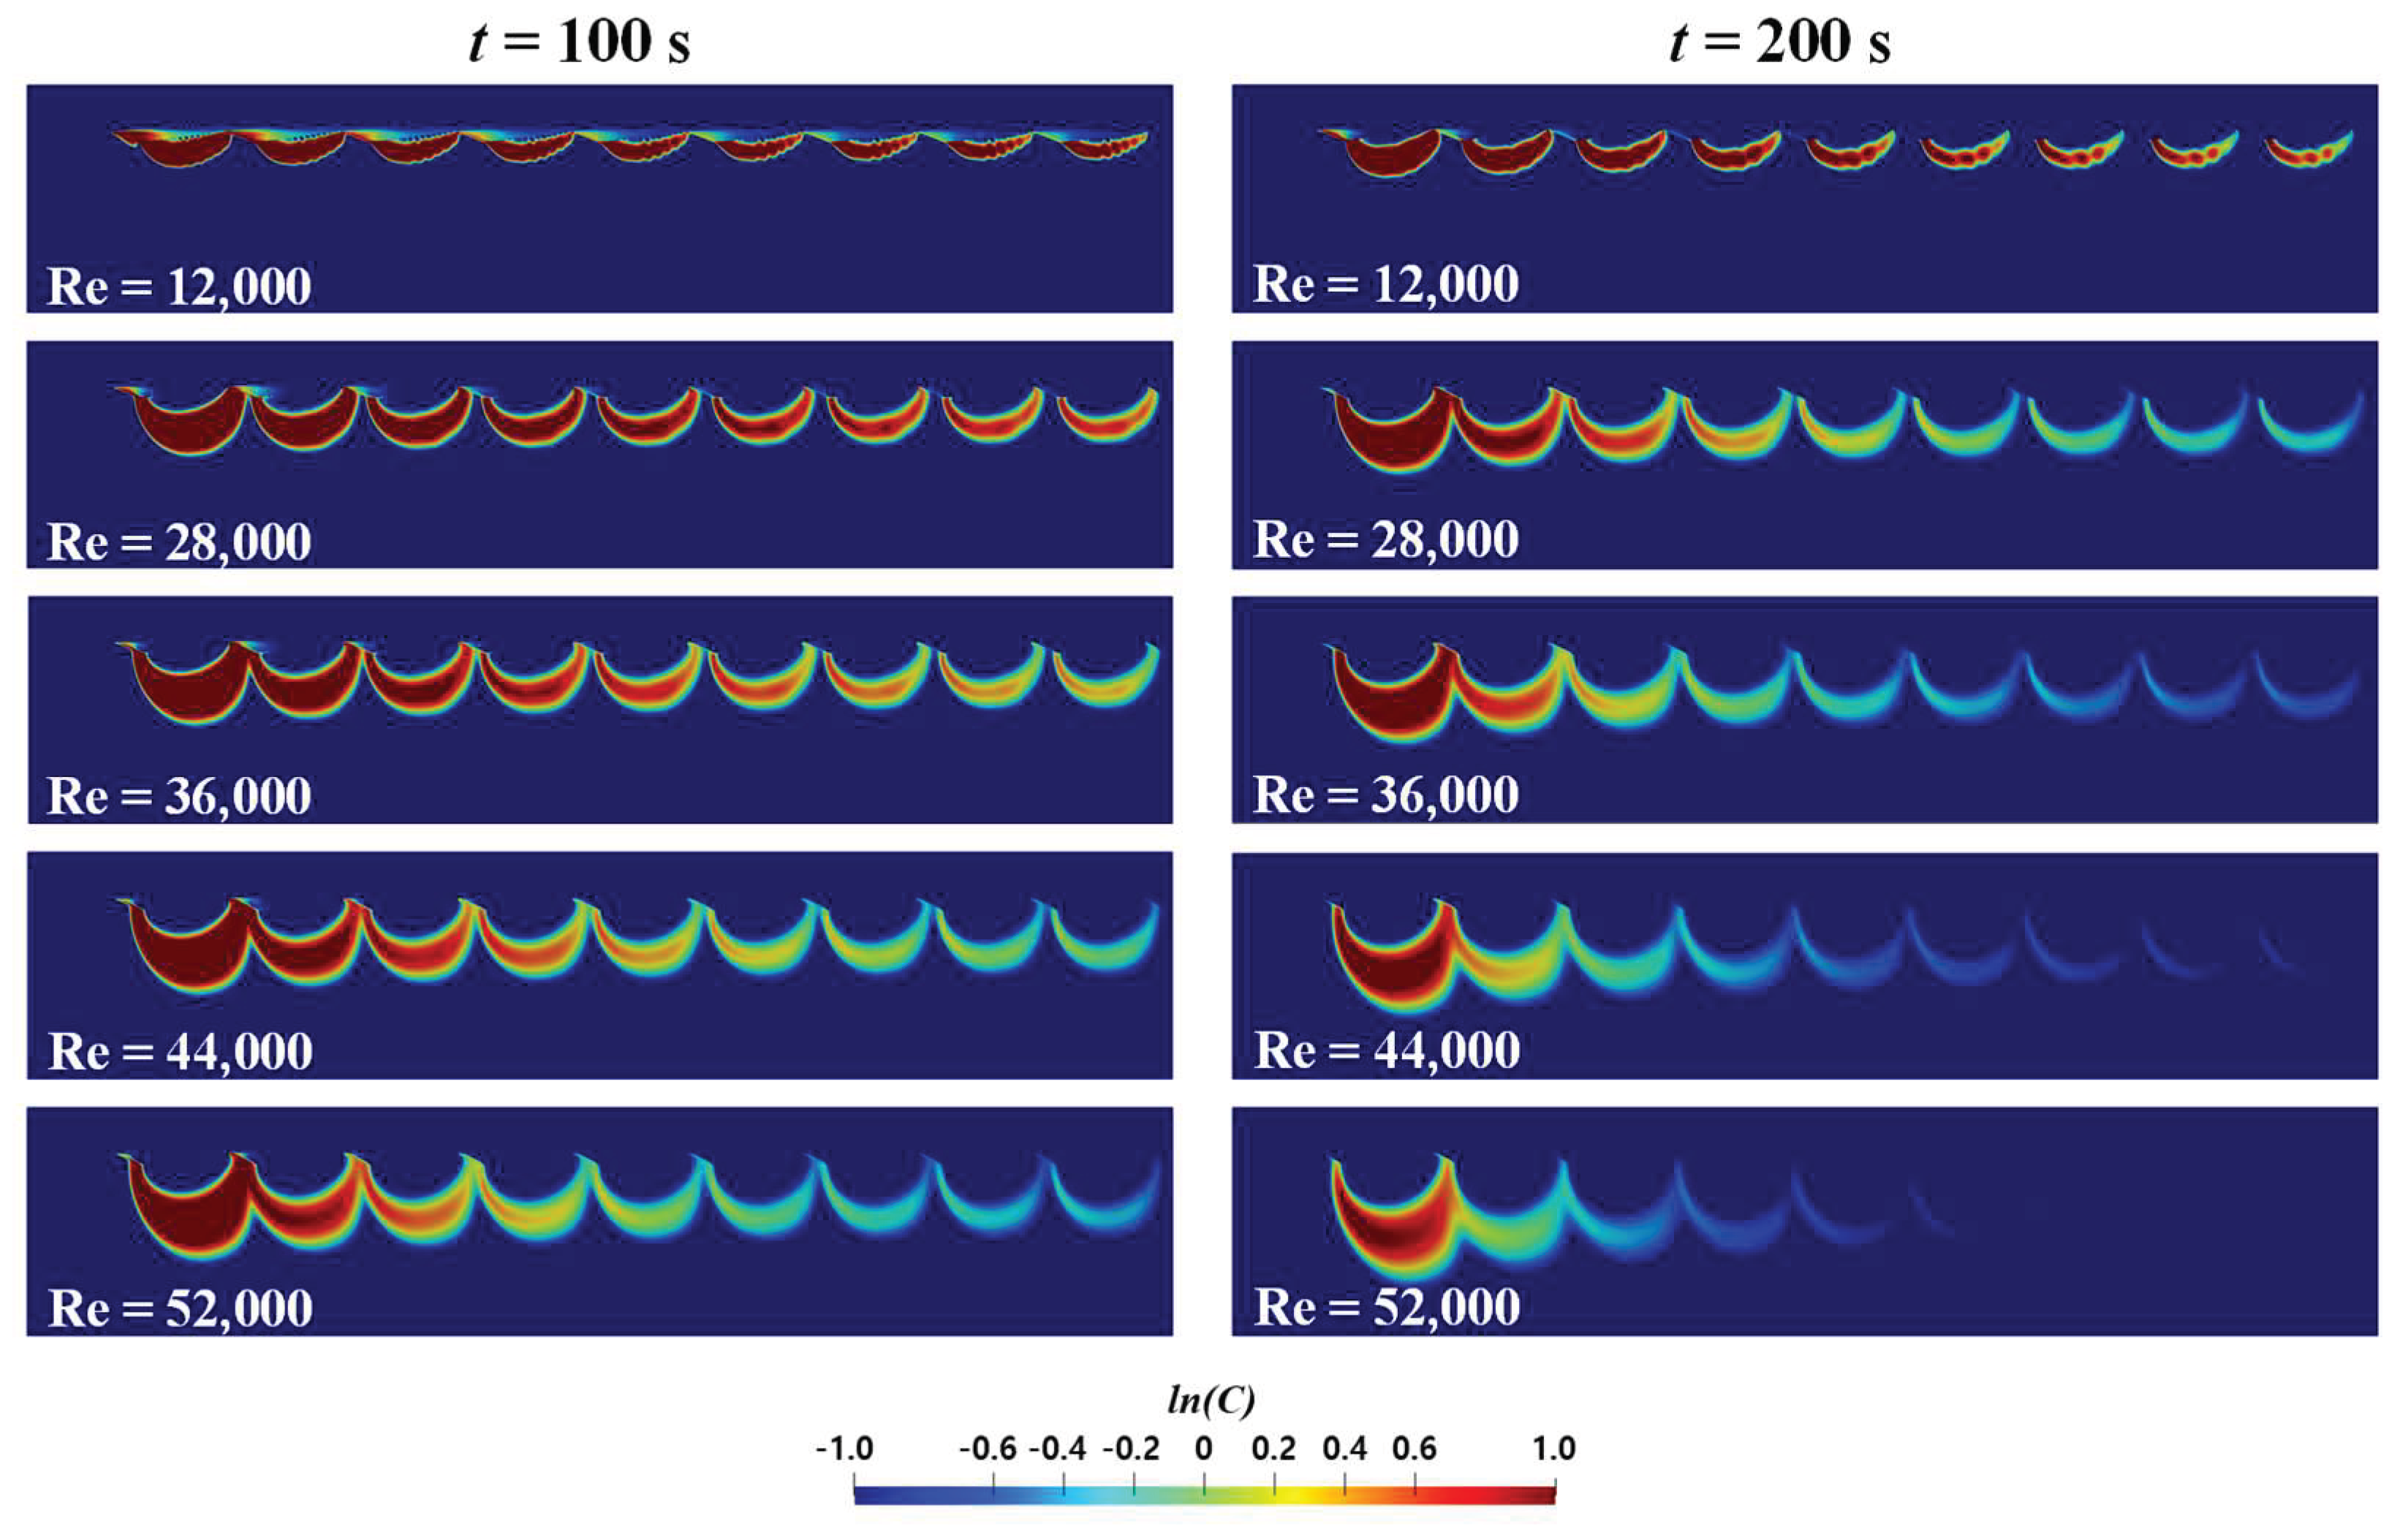
Solute transport is simulated by coupling the 2D advection-diffusion equation (Equation (9)) for the surface water region and the 2D advection-dispersion equation (Equation (10)) for the subsurface water region with the simulated velocity and turbulent eddy viscosity fields, which are used for simulating turbulent diffusive transport in the surface water for the study cases. To allow solute tracers to travel with the hyporheic flow for a sufficient duration, the simulated flow fields are projected into a 2-m straight channel by repeating the flow patterns uniformly downstream. The solute tracers are then injected at the trough of the second ripple, which is located 0.2 m away from the inlet boundary, as shown in Figure 6. In order to highlight the impact of hyporheic flow on solute transport, the tracers are injected as a point source at the SWI. The molecular diffusion coefficient Dm is set as Sodium Iodide (NaI) is generally used for the solute tracer. Figure 8 shows simulated concentration maps of the study cases at the time step of t = 100 and 200 s. The increase in Re, which leads to stronger subsurface flow (Figure 6) and dispersion inside the hyporheic zone, causes the tracers not only to penetrate deeper into the subsurface flow region but also to diffuse more actively owing to the combined effect of enhanced interfacial hyporheic flux (Figure 7a) and hydrodynamic dispersion.
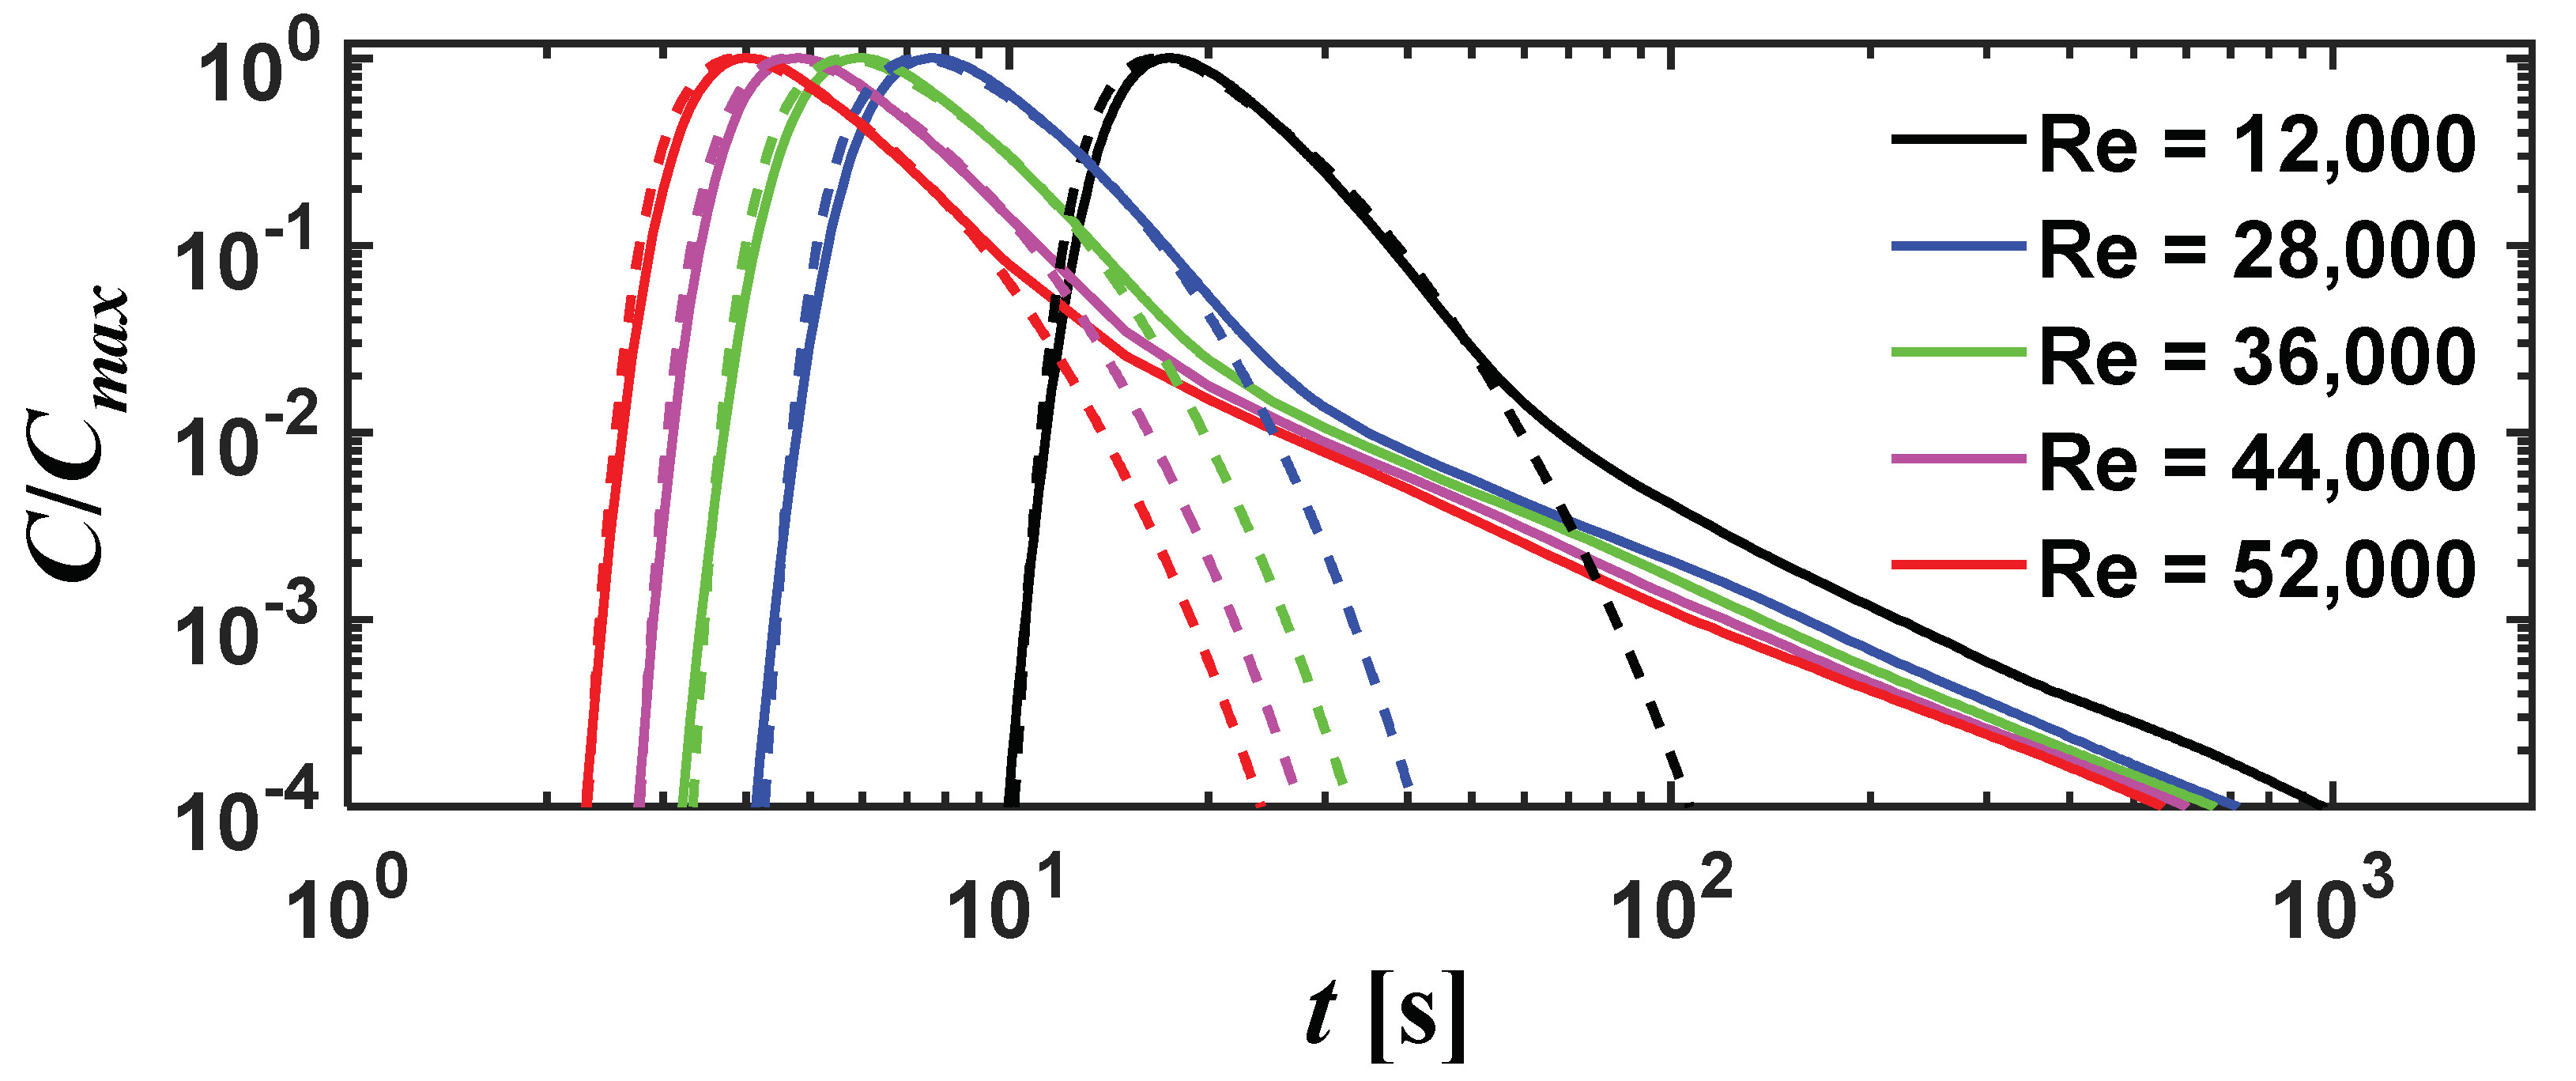
To observe the impact of hyporheic flow on tracer residence times, 1D BTCs are generated by measuring the arrival times of the tracers that pass the outlet of the surface water layer only and plotting normalized concentrations as a function of the arrival time (Figure 9). As aforementioned, solute transport is simulated for both permeable bed (study cases with hyporheic flow) and impermeable bed (study cases without hyporheic flow). According to Figure 9, the study cases with hyporheic flow (solid lines) produce larger longitudinal spreading of solute clouds compared to that of the study cases without hyporheic flow (dotted lines) because the former cases allow the tracers to transport with slow porewater velocities inside the hyporheic zone. As a result, all the study cases with hyporheic flow exhibit strong late-time tailing behavior, which is a characteristic feature of Non-Fickian transport due to the storage effect of the hyporheic zone. This evidently suggests that hyporheic flow is the primary driver of Non-Fickian transport, inducing the elevated concentration in the falling limb of the BTCs.
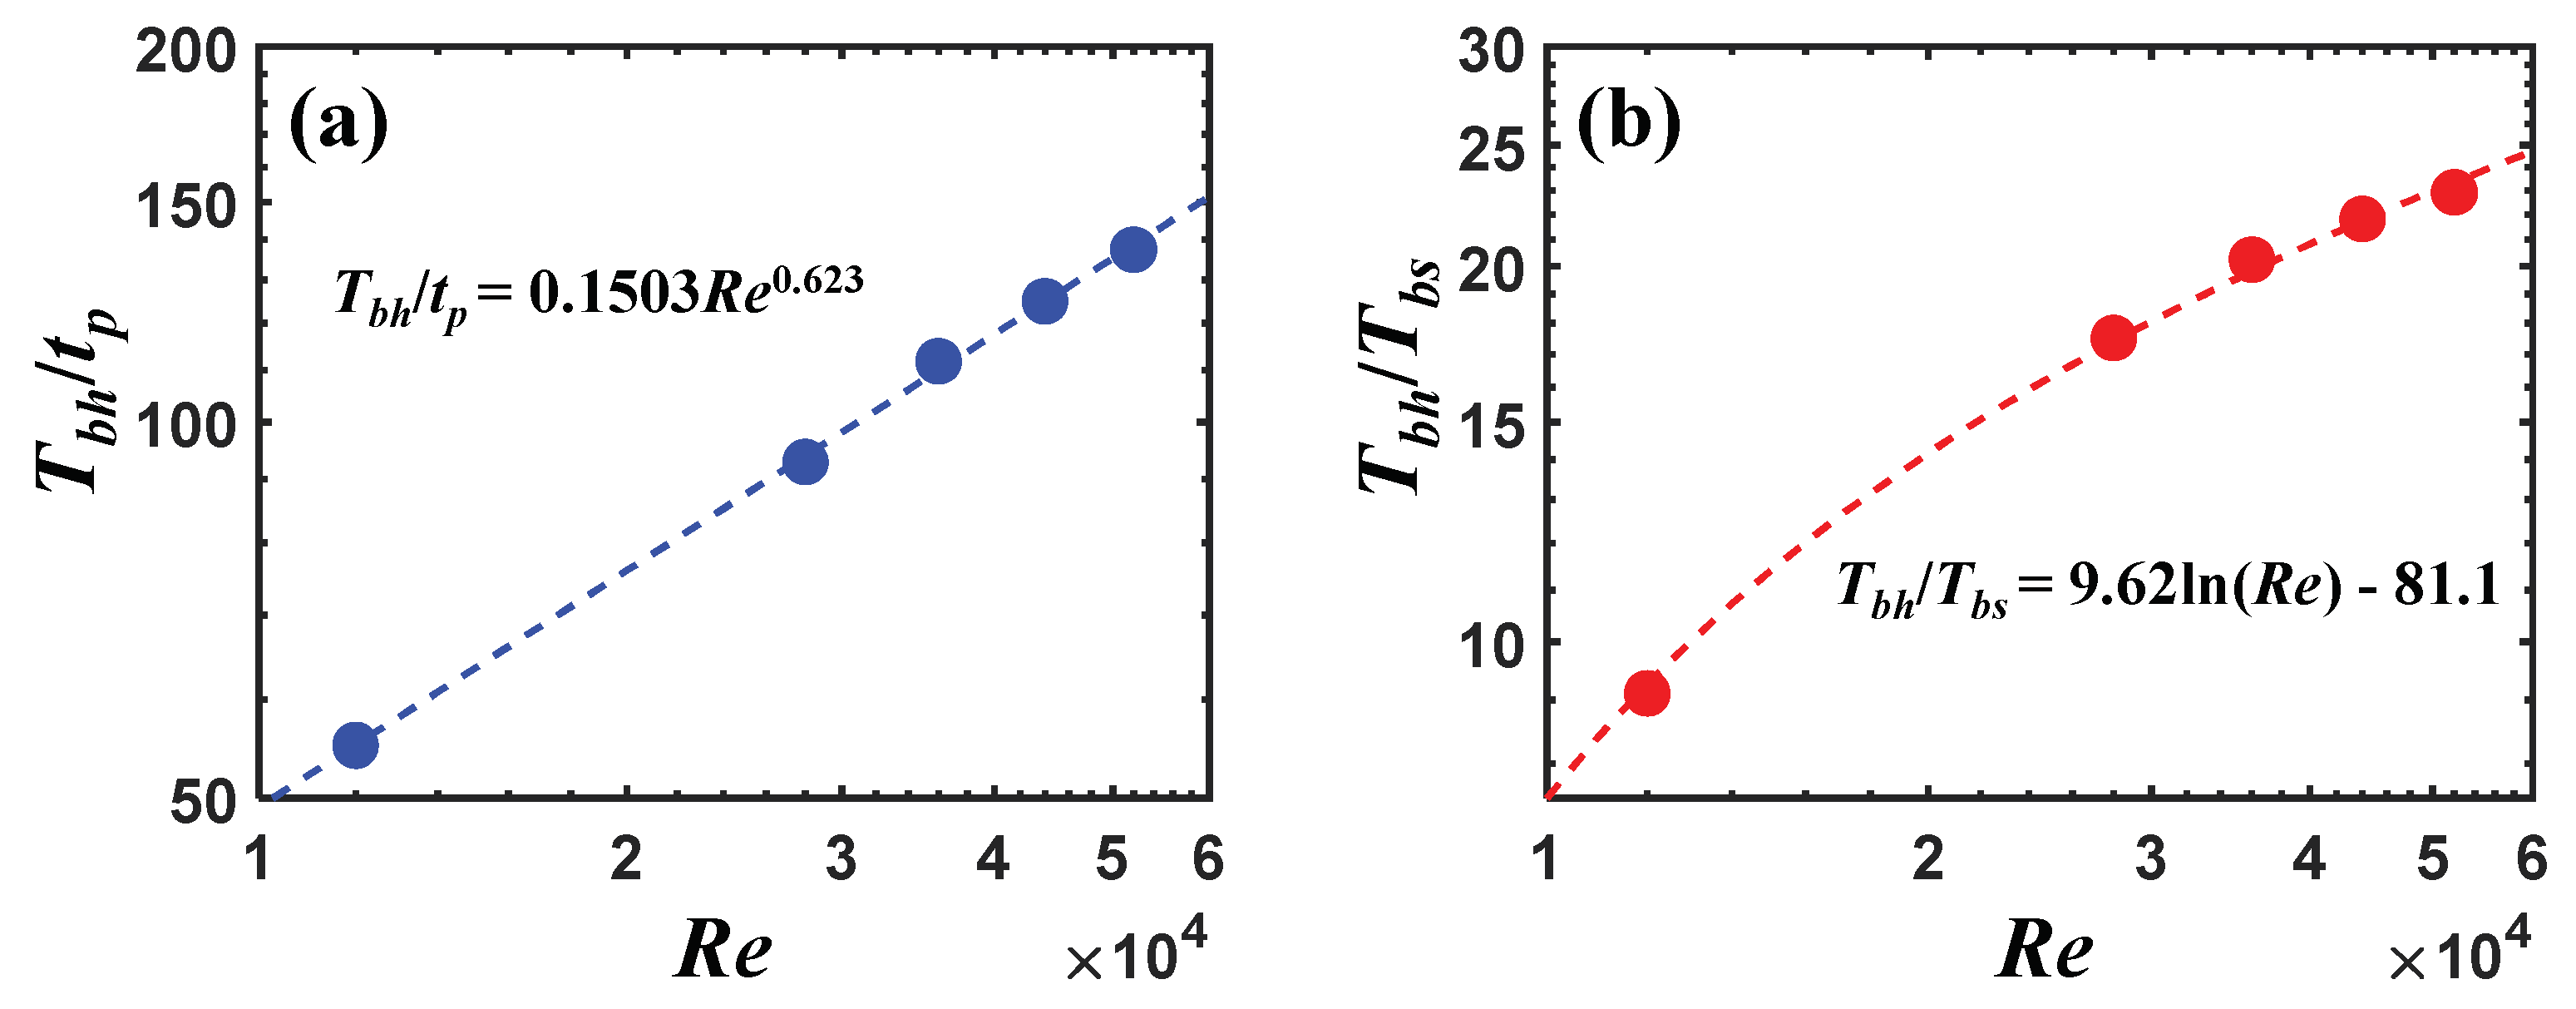
To quantitatively evaluate the effect of Re on non-Fickian transport behaviors driven by hyporheic flow, the relationship between Re and residence time distribution is characterized by some BTC parameters of peak arrival time (tp), maximum residence time with the hyporheic flow (Tbh), and maximum residence time without hyporheic flow (Tbs) determined from the BTCs (Figure 9). Figure 10a presents the ratio of maximum residence time to peak arrival time (Tbh/tp), which can be used as an indicator of the degree of non-Fickian transport behavior [33], for the study cases with hyporheic flow. This figure explains that the increase in Re exacerbates the elongation of the BTC tailing as the tracers travel with longer flow paths and thus longer travel time by actively delivering the tracers into the deeper sediment bed with the stronger hyporheic flow, as visualized in Figure 8. The relationship between Re and Tbh/tp follows a power-law function with a scaling exponent of about 0.62, and Tbh/tp increased more than twice with increasing Re. Figure 7b could help explain this trend, showing that Tbh/tp also has a power-law relationship with interfacial hyporheic flux (qint) increasing with the increase in Re. Additionally, Tbh/Tbs is plotted against Re in Figure 10b, and this figure shows that Tbh/Tbs characterizing the contribution of hyporheic flow on the BTCs increases 2.5 times, revealing that the storage effect of hyporheic zone is intensified as Re increases. Also, this BTC parameter has the logarithmical relationship with increasing Re. From this finding, it can be inferred that the relative increase in Tbh to Tbs gradually decreases and reaches saturation, indicating the effect of hyporheic flow-controlled mixing is reduced with increasing Re. Notice that Tbs is mainly determined by flow characteristics of the flow separation zone near the troughs of the ripple bed, where the recirculating flow traps the tracers and thus delays their residence times (Figure 1).

4. Conclusions

This study numerically quantified the role of hyporheic flow on late-time tailing behaviors of BTCs in turbulent surface-water flow overlying the ripple bed using the integrated 2D solute transport model, considering the complex interplay between turbulent mixing and hyporheic exchange at the SWI. The key findings from this work can be summarized as:
  • The power-law relationship between qint and Re was valid in fast flow conditions with Re larger than 25,000. The faster surface-water velocity resulted in a stronger bottom pressure gradient, thereby producing a stronger hyporheic flux.
  • Study cases with hyporheic flow exhibited strong late-time tailing in BTCs, which is driven by the storage effect of hyporheic zones. In contrast, when the hyporheic flow was not considered in transport simulation, the BTC tailing behavior was notably weakened. This indicates that hyporheic exchange has a substantial control on non-Fickian transport in surface water.
  • The increase in Re yielded the extended BTC tailing as indicated by larger Tbh/tp, which had a power-law relationship with both Re and qint. This phenomenon occurred because the stronger hyporheic flow delivers and diffuses solute tracers into the deeper sediment bed, causing the tracers to travel a longer flow path within the hyporheic zone.
In consequence, the present work elucidated that hyporheic flow substantially impacts solute residence time distributions in surface water since the mechanism of interfacial flow and mass exchange determine the shape of falling limbs in BTCs, delaying residence times via storage effects of hyporheic zones. Some papers reported that the pore structure of hyporheic zones is strongly linked to interfacial momentum exchange [34] as well as BTC tailing behaviors, generating pore-scale flows like a vortex and referential flow pathway, which can delay or shorten tracer residence times [35]. Therefore, the important next step of this study will investigate the contribution of pore-scale flow to residence time distributions by incorporating the simulation results of this study with pore-scale simulation. Also, the solute transport model should be advanced in future studies by including the adsorption and desorption process inside the hyporheic zone, which can play a factor in delaying solute transport and thus inducing non-Fickian behaviors [23].

Author Contributions

Conceptualization and methodology, J.S.K.; simulation, J.S.K.; writing—original draft preparation, J.S.K. and S.H.J.; writing—review and editing, J.S.K. and S.H.J.; visualization, J.S.K. and S.H.J.; funding acquisition, S.H.J. All authors have read and agreed to the published version of the manuscript.

Funding

This research was funded by Basic Science Research Program through the National Research Foundation of Korea (NRF), Ministry of Education (2021R1A6A3A01088484).

Data Availability Statement

Data used in this study can be received upon request.

Acknowledgments

The authors acknowledge support from Civil and Environmental Engineering Research Center at Hankyong National University, Anseong-si, Korea.

Conflicts of Interest

The authors declare no conflict of interest.

References

  1. Findlay, S. Importance of surface-subsurface exchange in stream ecosystems: The hyporheic zone. Limnol. Oceanogr. 1995, 40, 159–164. [Google Scholar] [CrossRef]
  2. Boulton, A.J.; Findlay, S.; Marmonier, P.; Stanley, E.H.; Valett, H.M. The functional significance of the hyporheic zone in streams and rivers. Annu. Rev. Ecol. Syst. 1998, 29, 59–81. [Google Scholar] [CrossRef]
  3. Marzadri, A.; Tonina, D.; Bellin, A. Morphodynamic controls on redox conditions and on nitrogen dynamics within the hyporheic zone: Application to gravel bed rivers with alternate-bar morphology. J. Geophys. Res. Biogeosci. 2012, 117. [Google Scholar] [CrossRef]
  4. Harvey, J.; Gooseff, M. River corridor science: Hydro-logic exchange and ecological consequences from bedforms to basins. Water Resour. Res. 2015, 51, 6893–6922. [Google Scholar] [CrossRef]
  5. Haggerty, R.; Wondzell, S.M.; Johnson, M.A. Power law residence time distribution in the hyporheic zone of a 2nd order mountain stream. Geophys. Res. Lett. 2002, 29, 18. [Google Scholar] [CrossRef]
  6. Runkel, R.L.; Chapra, S.C. An efficient numerical solution of the transient storage equations for solute transport in small streams. Water Resour. Res. 1993, 29, 211–215. [Google Scholar] [CrossRef]
  7. Kim, J.S.; Seo, I.W.; Baek, D.; Kang, P.K. Recirculating flow-induced anomalous transport in meandering open-channel flows. Adv. Water Resour. 2020, 141, 103603. [Google Scholar] [CrossRef]
  8. Norman, F.A.; Cardenas, M.B. Heat transport in hy- porheic zones due to bedforms: An experimental study. Water Resour. Res. 2014, 50, 3568–3582. [Google Scholar] [CrossRef]
  9. Packman, A.I.; Salehin, M.; Zaramella, M. Hyporheic exchange with gravel beds: Basic hydrodynamic interactions and bedform-induced advective flows. J. Hydraul. Eng. 2004, 130, 647–656. [Google Scholar] [CrossRef]
  10. Janssen, F.; Cardenas, M.B.; Sawyer, A.H.; Dammrich, T.; Krietsch, J.; de Beer, D. A comparative experimental and multiphysics computational fluid dynamics study of coupled surface—Subsurface flow in bed forms. Water Resour. Res. 2012, 48. [Google Scholar] [CrossRef]
  11. Ribberink, J.S.; Al-Salem, A.A. Sediment transport in oscillatory boundary layers in cases of rippled beds and sheet flow. J. Geophys. Res. Ocean. 1994, 99, 12707–12727. [Google Scholar] [CrossRef]
  12. Ahn, M.; Kim, Y.; Ji, U.; Gu, J.; Ko, J.; Bae, I.; Kang, H. Measurement and analysis of nitrous oxide emissions over time around a dune in the experimental flume. J. Korean Soc. Environ. Eng. 2019, 41, 228–234. [Google Scholar] [CrossRef]
  13. Cardenas, M.B.; Wilson, J.L. Dunes, turbulent eddies, and interfacial exchange with permeable sediments. Water Resour. Res. 2007, 43. [Google Scholar] [CrossRef]
  14. Ren, J.; Wang, X.; Zhou, Y.; Chen, B.; Men, L. An analysis of the factors affecting hyporheic exchange based on numerical modeling. Water 2019, 11, 665. [Google Scholar] [CrossRef]
  15. Liu, Y.; Wallace, C.D.; Zhou, Y.; Ershadnia, R.; Behzadi, F.; Dwivedi, D.; Xue, L.; Soltanian, M.R. Influence of streambed heterogeneity on hyporheic flow and sorptive solute transport. Water 2020, 12, 1547. [Google Scholar] [CrossRef]
  16. Lee, A.; Aubeneau, A.F.; Cardenas, M.B. The sensitivity of hyporheic exchange to fractal properties of riverbeds. Water Resour. Res. 2020, 56. [Google Scholar] [CrossRef]
  17. Ren, J.; Zhao, B. Model-based analysis of the effects of rippled bed morphologies on hyporheic exchange. J. Hydrol. Eng. 2020, 25. [Google Scholar] [CrossRef]
  18. Hester, E.T.; Young, K.I.; Widdowson, M.A. Mixing of surface and groundwater induced by riverbed dunes: Implications for hyporheic zone definitions and pollutant reactions. Water Resour. Res. 2013, 49, 5221–5237. [Google Scholar] [CrossRef]
  19. Wang, N.; Zhang, C.; Xiao, Y.; Jin, G.; Li, L. Transverse hyporheic flow in the cross-section of a compound river system. Adv. Water Resour. 2018, 122, 263–277. [Google Scholar] [CrossRef]
  20. Houzé, C.; Durand, V.; Mügler, C.; Pessel, M.; Monvoisin, G.; Courbet, C.; Noûs, C. Combining experimental and modelling approaches to monitor the transport of an artificial tracer through the hyporheic zone. Hydrol. Process. 2022, 36. [Google Scholar] [CrossRef]
  21. Lee, A.; Aubeneau, A.F.; Cardenas, M.B.; Liu, X. Hyporheic exchange due to cobbles on sandy beds. Water Resour. Res. 2022, 58. [Google Scholar] [CrossRef]
  22. Chen, X.; Cardenas, M.B.; Chen, L. Three dimensional versus two-dimensional bed form induced hyporheic exchange. Water Resour. Res. 2015, 51, 2923–2936. [Google Scholar] [CrossRef]
  23. Jin, G.; Zhang, Z.; Li, R.; Chen, C.; Tang, H.; Li, L.; Barry, D.A. Transport of zinc ions in the hyporheic zone: Experiments and simulations. Adv. Water Resour. 2020, 146. [Google Scholar] [CrossRef]
  24. Motamedi, A.; Afzalimehr, H.; Singh, V.P.; Dufresne, L. Experimental study on the influence of dune dimensions on flow separation. J. Hydrol. Eng. 2014, 19, 78–86. [Google Scholar] [CrossRef]
  25. Menter, F.R. Zonal two-equation k-ω turbulence model for aerodynamic flows. In Proceedings of the AIAA 24th Fluid Dynamic Conference, Orlando, FL, USA, 6–9 July 1993. [Google Scholar]
  26. Argyropoulos, C.D.; Markatos, N.C. Recent advances on the numerical modelling of turbulent flows. Appl. Math. Model. 2015, 39, 693–732. [Google Scholar] [CrossRef]
  27. Tominaga, Y.; Stathopoulos, T. Turbulent Schmidt numbers for CFD analysis with various types of flowfield. Atmos. Environ. 2007, 41, 8091–8099. [Google Scholar] [CrossRef]
  28. Alavian, V. Dispersion tensor in rotating flows. J. Hydraul. Eng. 1986, 112, 771–777. [Google Scholar] [CrossRef]
  29. Moltyaner, G.L.; Killey, R.W.D. Twin lake tracer tests: Transverse dispersion. Water Resour. Res. 1988, 24, 1628–1637. [Google Scholar] [CrossRef]
  30. Cardenas, M.B.; Wilson, J.L.; Haggerty, R. Residence time of bedform-driven hyporheic exchange. Adv. Water Resour. 2008, 31, 1382–1386. [Google Scholar] [CrossRef]
  31. Versteeg, H.K.; Malalasekera, W. An Introduction to Computational Fluid Dynamics: The Finite Volume Method; Pearson Education: London, UK, 2007. [Google Scholar]
  32. Cardenas, M.B.; Wilson, J.L. The influence of ambient groundwater discharge on exchange zones induced by current–bedform interactions. J. Hydrol. 2006, 331, 103–109. [Google Scholar] [CrossRef]
  33. Drummond, J.D.; Covino, T.P.; Aubeneau, A.F.; Leong, D.; Patil, S.; Schumer, R.; Packman, A.I. Effects of solute breakthrough curve tail truncation on residence time estimates: A synthesis of solute tracer injection studies. J. Geophys. Res. Biogeosci. 2012, 117. [Google Scholar] [CrossRef]
  34. Shen, G.; Yuan, J.; Phanikumar, M.S. Quantifying the effects of bed roughness on transit time distributions via direct numerical simulations of turbulent hyporheic exchange. Water Resour. Res. 2022, 58, e2021WR030503. [Google Scholar] [CrossRef]
  35. Kim, J.S.; Kang, P.K. Anomalous transport through free-flow-porous media interface: Pore-scale simulation and predictive modeling. Adv. Water Resour. 2020, 135, 103467. [Google Scholar] [CrossRef]
Figure 1. Conceptual diagrams of bedform-induced hyporheic exchange and resulting tracer transport and breakthrough curves.
Water 15 02038 g001
Figure 2. Boundary conditions used for the coupled open channel flow–groundwater flow simulation of an experimental flume of Janssen et al. [10].
Water 15 02038 g002
Figure 3. Comparison of the simulated longitudinal velocity profiles against observations of Janssen et al. [10] for the U0 = 0.07 m/s case.
Water 15 02038 g003
Figure 4. Comparison of the simulated longitudinal velocity profiles against the observations of Janssen et al. [10] for the U0 = 0.12 m/s case.
Water 15 02038 g004
Figure 5. Comparison of the simulated bottom pressure distribution for (a) U0 = 0.07 m/s; (b) U0 = 0.12 m/s against the observation of Janssen et al. [10].
Water 15 02038 g005
Figure 6. Simulation domains with boundary conditions for study cases, and simulated open channel pressure and groundwater (hyporheic) velocity magnitude fields for (a) U0 = 0.12 m/s; (b) U0 = 0.28 m/s. Solid lines represent hyporheic flow patterns.
Water 15 02038 g006
Figure 7. Relationships between (a) Reynolds number (Re) and interfacial hyporheic flux (qint) and (b) qint and ratio of maximum residence time with the hyporheic flow (Tbh) to peak arrival time (tp), which are obtained from solute transport simulation.
Water 15 02038 g007
Figure 8. Simulated concentration distributions for study cases with hyporheic flow at t = 100 s (left) and at t = 200 s (right).
Water 15 02038 g008
Figure 9. Breakthrough curves measured at the outlet of the surface water layer for study cases with hyporheic flow (solid lines) and without hyporheic flow (dotted lines).
Water 15 02038 g009
Figure 10. Relationships between Reynolds number (Re) and (a) ratio of maximum residence time to peak arrival time (Tbh/tp) and (b) ratio of maximum residence time with hyporheic flow to maximum residence time without hyporheic flow (Tbh/Tbs).
Water 15 02038 g010
Table 1. Parameters and relations of an SST k-omega model used in this study.
ParameterValue or Relation
S 2 S i j S i j
F1 tanh [ { max ( 2 k β * ω y , 500 ν y 2 ω ) } 2 ]
F2 min ( τ i j U i x j , 10 β * k ω )
Pk tanh ( [ min { max ( k β * ω y , 500 ν y 2 ω ) , 4 σ ω 2 k C D k ω y 2 } ] 4 )
CD max ( 2 ρ σ ω 2 1 ω k x i ω x i , 10 10 )
φ φ 1 F 1 + φ 2 ( 1 F 1 )
α, α10.55
α20.44
β, β10.075
β20.0828
β*0.09
σk10.85
σk21.0
σω10.5
σω20.856
Disclaimer/Publisher’s Note: The statements, opinions and data contained in all publications are solely those of the individual author(s) and contributor(s) and not of MDPI and/or the editor(s). MDPI and/or the editor(s) disclaim responsibility for any injury to people or property resulting from any ideas, methods, instructions or products referred to in the content.