Abstract
Affected by natural factors and human activities, seawater intrusion has become a geo-environmental problem, significantly impacting human production and life. Seawater intrusion weakens coastal areas’ geo-environmental carrying capacity, limiting industry and commerce development potential. On the other hand, it may provide convenient deep seawater resources for coastal aquaculture development. Therefore, how to quantitatively analyze seawater intrusion’s process, scope, and influencing factors has become a hotspot for hydrogeological researchers. This study uses chemical sampling analysis, environmental isotope, fixed-point, and geophysical methods to monitor long-term seawater intrusion in the southern coastal plain of Laizhou Bay. According to the monitoring data, the chemical type of fresh groundwater changes from Ca·Mg-HCO3 to Na-HCO3·Cl, Na·Ca-HCO3·Cl from south to north, and the changing trend of brackish groundwater is from Mg·Na·Ca-HCO3, Mg·Ca-HCO3 to Na-Cl·HCO3, Na·Mg-Cl. Saline groundwater is mainly of the Na-Cl and Na·Mg-Cl type. Brine is of the Cl-Na type. The relationship between 18O, 2H, and Cl− shows that groundwater was affected by evaporation, dissolution, and mixing in the runoff process. The relationship between water level and TDS in monitoring wells at different locations and depths confirms the existence of seasonal variations and layered intrusion phenomena in groundwater recharge sources. From July 2018 to December 2019, the south intrusion and north retreat rates were approximately 213.3 m/a and 105.9 m/a, respectively. From August 2016 to December 2019, the seawater intrusion front on the Dawangdong profile generally retreated northward at approximately 27 m/a. The results of this study can provide a scientific basis for the utilization of groundwater in local production and life. Comparative analysis and mutual verification of multiple monitoring methods can provide basic ideas for constructing a multi-source monitoring system for seawater intrusion.
1. Introduction
From a global perspective, coastal zones are the most economically developed and densely populated regions [1,2]; approximately 60% of the world’s population is widely concentrated within 60 km of a coastal zone [3,4]. Affected by the combined effects of climate change and human activities, coastal areas face ecological and environmental problems, including seawater intrusion [5,6,7,8]. The core of the meaning of seawater intrusion is caused by human activity or climate change [9,10]. The most typical intrusion process is the excessive exploitation of groundwater, which causes the hydrodynamic imbalance of the aquifer and causes the brackish–freshwater transition zone to move inland [11,12]. Seawater intrusion can cause immediate economic losses or problems, such as crop yield loss and industrial water shortages. It will also lead to potential adverse effects on the ecological environment [13,14]. For instance, seawater intrusion will lead to soil salinization in coastal areas, changing soil and vegetation’s nitrogen content. Changes in the nitrogen cycle may trigger the decline of some vegetation species and the degradation of ecological functions [15,16,17]. Concurrently, seawater intrusion can provide convenient deep seawater resources with relatively stable hydration properties for coastal aquaculture [18]. Due to these reasons, based on the dual impact of seawater intrusion on human production and life, the investigation, monitoring, evaluation, prediction, and mechanism of its process have become an essential scientific research topic in the fields of earth science and ecological environment science [7,19,20].
The monitoring target of seawater intrusion is the change in the intrusion transition zone or interface, with indirect reflection factors including changes in vegetation cover, degree of soil salinity, etc., and direct reflection factors including the chemical characteristics of groundwater, groundwater table (or water head), etc. [21,22]. Monitoring methods mainly include the Water Chemical Sampling Analysis Method, Isotope Hydrogeochemical Method, Fixed-point Well Monitoring Method, and Geophysical Monitoring Method (Table 1) [23,24,25,26,27]. The water chemical sampling analysis method is divided into a single index method and a comprehensive index method, which can directly reflect the quality of groundwater [28]. The principle is that chloride ions exist stably, and the mass concentration is significantly different, similar to total dissolved solids (TDS) [29]. This method can quickly identify seawater intrusion based on mastering the hydrogeological conditions of the study area. Maged et al. effectively evaluated the water resources in areas affected by seawater intrusion, such as Mecca, through multiple water quality indices, GIS methods, and partial least squares regression models [30,31]. With the development of hydrogeochemical isotopic technology, using environmental isotope tracing, such as stable or radioactive isotopes, to monitor seawater intrusion has become an effective method. This method is often combined with the water chemical sampling analysis method. Liu et al. (2016), Maurya et al. (2019), and Qi et al. (2019) [32,33,34] analyzed the degree of intrusion in different regions by identifying the direction of seawater intrusion and other sources of salinity in the aquifer using data such as groundwater δ18O, δ2H, and water–chemical–ion ratio. The fixed-point well monitoring method refers to drilling wells or relying on existing wells, placing automatic monitor instruments, or regularly taking water samples for testing, which have the advantage of monitoring seawater intrusion at different times and depths in a long sequence. Du et al. (2015) and Lim et al. (2013) [35,36] analyzed the current situation and dynamic change characteristics of seawater intrusion in multiple regions and explored the influence of hydrogeological conditions and groundwater flow system characteristics on seawater intrusion, using data from one-hole multi-layer (different depths) and various groups of one-hole single-layer monitoring wells, respectively. The principle of the geophysical method is that seawater and fresh groundwater have apparent differences in electrical conductivity and magnetic permeability [37,38,39,40,41]. The electromagnetic signal passing through the transition zone between seawater and fresh groundwater will display an abnormal electromagnetic signal, thereby determining the location of the seawater intrusion interface. This method is often combined with the water chemical sampling analysis method to optimize the correction of geophysical parameters [23]. Abdulameer et al. (2018), Wang et al. (2022), and Song et al. (2014) [37,39,40] used a high-density resistivity method or audio magneto telluric, combined with water chemical data or borehole lithology data by setting up multiple monitoring profiles, to accurately delineate the seawater intrusion interface in different regions, and the seawater intrusion status was evaluated. In addition, Alfaifi et al. (2019), El-Kaliouby (2020), Nicolodi et al. (2018), and Yang et al. (2013) [19,42,43,44] applied various methods, such as the time-domain electromagnetic method (TDEM), aerial remote sensing electromagnetic method, seismic refraction tomography, etc., combined with water chemical data, to analyze the interface, depth, and extent of seawater intrusion in many regions, and discussed the factors that affect seawater intrusion, such as excessive groundwater extraction, coastal sediment lithology, etc.

Table 1.
Comparison of seawater intrusion monitoring methods.
However, most of the above studies used a single method, and more comparative analysis must be carried out using multiple monitoring methods. Based on this, this study uses multiple monitoring methods (including the Water Chemical Sampling Analysis Method, Isotope Hydrogeochemical method, Fixed-point Well Monitoring Method, and Geophysical Monitoring Method) to analyze the situation of seawater intrusion on the southern coastal plain of Laizhou Bay and understand the impact of human activities and seasonal groundwater recharge. We reveal the influencing factors and processes and compare the suitability of monitoring methods to provide an applicability analysis of the above monitoring methods for the construction of a multi-source monitoring system for seawater intrusion.
2. Study Area
The study area is divided into Shouguang County, Changyi County, and Hanting District (Figure 1). It is located on the south bank of Laizhou Bay. The east is adjacent to Qingdao and Yantai City, and the west is adjacent to Zibo City and Dongying City. It is located between 36°41′~37°19′ north latitude and 118°32′~119°10′ longitude. It is classified as a warm temperate continental monsoon climate. The average annual precipitation is 560–660 mm, and the average yearly temperature is 12.3 °C. The total number of rivers is more than 100, each of which is a rain-fed river in the monsoon region, divided into a six-way groundwater aquifer system: Xiaoqing River, Mi River, Bailang River, Wei River, Jiaolai River, and Yu River. The average annual surface runoff volume is 17.0 × 10⁹ m3. The study area is high in the south and low in the north, with an elevation between 2 and 7 m. The geomorphic types of the study area mainly include coastal plains, beaches, and shallow seas [45]. The coastal area of the study area is a typical silt shale coast in the north of China. It is mainly composed of silt, with an area of about 400 km2 and a total length of 140 km.
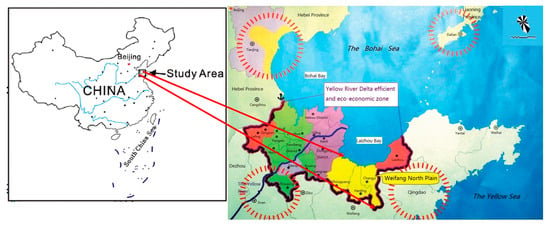
Figure 1.
Location and range diagram of the study area.
The study area belongs to the fault subsidence settlement area and deposits a set of Minghu town shale. During the Late Pleistocene and Holocene, a group of thick marine sands was deposited due to the influence of three sea transgressions. Most of the area is covered by Quaternary loose deposits with a maximum thickness reaching up to 400 m [46]. Since the Mesozoic, the tectonic movement in the study area has mainly been fault-block motion. The fault tectonic is relatively developed, including the northeast and north-northeast faults. The Yimu fault zone and its derived tectonic control, tectonic engender, development, magmatic activity, and mineralization of the study area were investigated (Figure 2a). According to the change in the hydrogeological characteristics in the horizontal and vertical directions, Gao et al. (2020), and Hu et al. (2020) [9,18] divided the soil area of Laizhou Bay into six water and geological zones: the bedrock fissures freshwater area, unconsolidated rock pore freshwater area, fresh–salty two-layer structure porewater area, fresh–salty–fresh three-layer structure porewater area, salty–fresh two-layer structure porewater area, and salty–brine pore water of the south coast (Figure 2b).
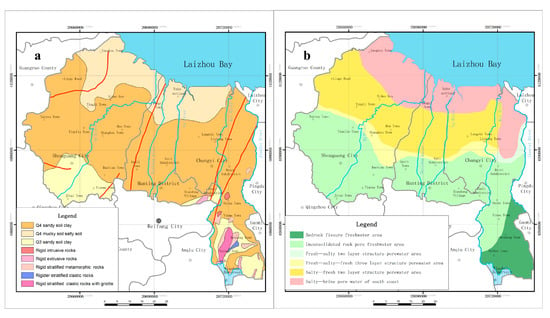
Figure 2.
(a) Geological map of the study area. (b) Hydrogeological map of the study area.
3. Method
In this study, seawater intrusion is a general term for both seawater intrusion and saline groundwater intrusion; the difference between the above two concepts is that the main body of the former is modern seawater, while the latter is ancient seawater (saline water or brine formed by the retention of ancient seawater in the stratum), respectively. Based on the geological and environmental conditions, groundwater flow system, and human activities in the research area, we analyzed the process of seawater intrusion and its influencing factors. The methodology flowchart of this study is shown in Figure 3.
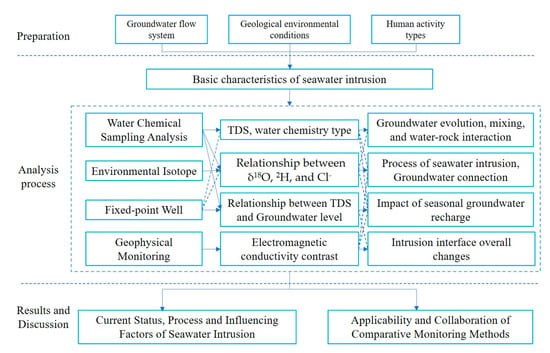
Figure 3.
The methodology flowchart of this study.
The water samples for this study were collected in the southern coastal plain of Laizhou Bay from June to July 2018 (Table 2). Sixty-four samples were collected, including one seawater sample, seven surface water samples, and fifty-six groundwater samples. According to the criteria defined by and specification documents, groundwater samples were divided into four types based on the TDS: fresh groundwater (TDS < 1 g/L), brackish groundwater (1 g/L < TDS < 3 g/L), saline groundwater (3 g/L < TDS < 50 g/L), and brine (50 g/L < TDS). Detailed field information, sampling methods, and hydrochemistry analyses are summarized in [47,48]. The automatic monitoring point and electromagnetic profile are shown in Figure 4.

Table 2.
Hydrochemistry and isotope compositions of water samples.
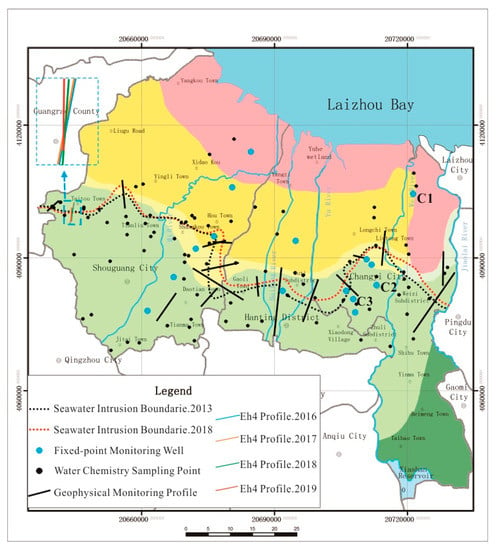
Figure 4.
Multiple monitoring method deployment and seawater intrusion boundaries of the study area.
3.1. Water Chemical Sampling Analysis Method
The water samples were tested by Inductively Coupled Plasma Optical Emission Spectrometry (ICP-OES, Optima 8300, PerkinElmer, Waltham, MA, USA, precision ± 0.2‰) for the content of various water chemical ions. A multi-parameter instrument (SX836, Shanghai Sanxin, Shanghai, China) was used to measure water temperature (measurement range: 0~100 °C, resolution: 0.1 °C), conductivity (measurement range: 0~200 mS/cm, resolution: 0.01/0.1 mS/cm), and pH (measurement range: −2.00~19.99 pH, resolution: 0.01 pH). TDS was tested using a Geothermal Blast Drying Oven (DGG-101-1, Tianyu, Tianjin, China, precision ± 1 °C) at 180 °C and a Laboratory Electronic Analytical Balance (XPR504S/AC, Mettler Toledo, Zurich, Switzerland, precision 0.1 mg).
3.2. Environmental Isotope Method
The 18O in the water sample was replaced with standard CO2 in a glass vacuum equilibrium system (room temperature 25 °C); the generated CO2 was extracted and collected using a refrigerant (prepared with absolute ethanol and liquid nitrogen, boiling point −78 °C). The 2H in the water sample was converted into hydrogen at high temperature (850 °C) using metallic chromium as a reducing agent, and the hydrogen was absorbed by activated carbon at a low temperature. The collected and generated CO2 and hydrogen were then sent for Thermal Conversion/Elementary Analyzer-Gas Isotope Ratio Mass Spectrometry Analysis (TC/EA-IRMS, MAT253, Thermo Fisher, Waltham, MA, USA, precision ± 0.2‰, State Key Laboratory of Biogeology and Environmental Geology, China University of Geosciences, Wuhan). Results were normalized to V-SMOW with a precision of ±1.0‰ for δ2H and 0.1‰ for ±δ18O, respectively [49].
3.3. Fixed-Point Well Monitoring Method
The monitoring profile is composed of wells C1, C2, and C3. The monitoring instrument is a water level, temperature, and conductivity three-parameter self-recording instrument (CTD-Diver, DI273, SaiNuoXin, Beijing, China, water table precision ±5 cm, electrical conductivity precision ±1% ms/cm). C1 and C2 are fixed-depth single-hole monitoring wells with a depth of 38 m and 30 m, located in the brackish groundwater and the saline groundwater areas; the dynamic type of groundwater is runoff extraction and weak runoff exploitation, respectively. C3 is a single-hole multi-layer monitoring well (including C3-1, C3-2, and C3-3) located in the seawater–fresh groundwater transition area. C3-1 is a shallow groundwater well with a depth of 36 m, and the dynamic type of groundwater at this depth is precipitation–runoff–extraction. C3-2 is a medium–deep groundwater well with a depth of 74 m, and the active type of groundwater at this depth is runoff extraction. C3-3 is a deep groundwater well with a depth of 149 m, and the dynamic type of groundwater at this depth is weak runoff extraction.
3.4. Geophysical Monitoring Method
This study used the audio-frequency magneto telluric method to continuously monitor the changes in seawater intrusion of Dawangdong profiles from 2016 to 2019 (EH4 conductivity imaging system, Geometrics and EMI, San Jose, CA, USA). The horizontal resolution is related to the electrode spacing. In this study, the electrode spacing was 50 m, and the electric field strength at the measuring points of electrodes was greater than 0.01 µV/m, while the magnetic field strength was more significant than 0.01 mGamma. The range and variation characteristics of seawater intrusion were analyzed. The Dawangdong monitoring profile was located east of Dawang Town and south of Taitou Town. The profile point distance was 50 m. The profile angle was 11° from 2016 to 2017. Due to the limitation of field construction conditions, the monitoring profile angle was slightly adjusted from 2018 to 2019, 4° and 0°, respectively. There were three frequency ranges of 10 Hz~1 KHz, 500 Hz~3 KHz, and 750 Hz~96 KHz for monitoring work [23,35]. Data quality assurance methods included the uniform distribution of 5% of the inspection points. The apparent resistivity calculated at the inspection points was consistent with the evident resistivity curve shape of the original measurement point. The pronounced resistivity curve obtained from a single measurement point was continuous and smooth, without sharp points; the data quality was evaluated by the coherence degree of the entire information vector and the coherence degree of the whole information vector of 90% of the frequency points above 0.5.
4. Results and Discussion
4.1. Water Chemical Sampling Monitoring Results and Discussion
According to the water chemical samples test data (Table 1) and previous research results, the downside of seawater intrusion is insignificant with TDS < 2 g/L, while the impact of TDS over 2 g/L is significant [34,35]. The seawater intrusion boundary on the southern coastal plain of Laizhou Bay was delineated as TDS > 2 g/L, and the TDS contour map (Figure 4) was drawn by interpolation in the geographic information platform (MAPGIS 6.7). The monitoring results show that the boundary distribution in 2013 and 2018 is similar and generally located in the south of Taitou Town–north of Tianliu Town–Hou Town–Gudi Town–north of Liutong Town. In five years, the boundary generally retreated northward. More specifically, the northern part of Tianliu Town, the east of Hou Town, and the eastern part of Liutong Town moved northward, and other areas moved slightly southward or were relatively stable.
Based on the water chemical samples test data (Table 1), Origin 2021 software was used to create a Piper diagram of groundwater and surface water (Figure 5). From Figure 5, there are apparent differences in the water chemical components of different water bodies, arranged in a wide strip from left to right. The left-end member of the strip is groundwater and rainwater. The right end members are brine and seawater, reflecting different water bodies’ hadrochemical evolution and action process. The surface water is connected with rainwater (on the left) and seawater (on the right). It is affected by mixing and evaporation-concentration, showing a clear pattern of change from south to north. The mixing line of surface water and seawater should be straight in theory [50,51]. Still, it is a relatively smooth continuous curve with similar chemical composition distribution characteristics to groundwater. This shows that surface water is significantly related to groundwater recharge and discharge. At the estuary, the surface water is subjected to a particular upstream effect of seawater [24,28,52].
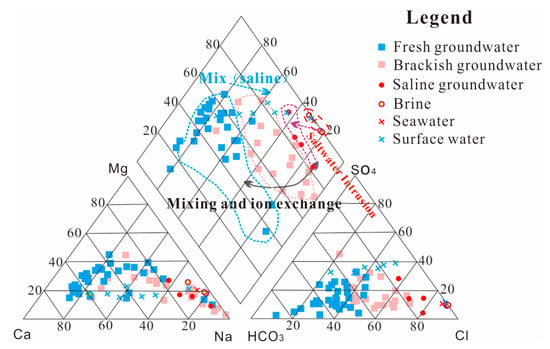
Figure 5.
Piper diagram of groundwater and surface water of the study area.
The variation characteristics of groundwater chemical composition along the process show that it is controlled by mixing and water–rock interactions. Affected by leaching and cationic alternating adsorption [11,21], the chemical type of fresh groundwater changes from Ca·Mg-HCO3 to Na-HCO3·Cl, Na·Ca-HCO3·Cl from south to north, and the changing trend of brackish groundwater is from Mg·Na·Ca-HCO3, Mg·Ca-HCO3 to Na-Cl·HCO3, Na·Mg-Cl. Saline groundwater is mainly of the Na-Cl and Na·Mg-Cl type. Brine is of the Cl-Na type. The distribution characteristics of various ion contents in shallow groundwater show noticeable differences among geomorphic units and exhibit certain regularity. Along the sampling profile of groundwater from south to north, the concentration of various ions in groundwater fluctuates. Among them, the ion HCO3 concentration shows a trend of slow increase followed by a slight decrease. In mountainous and alluvial plains, the concentrations of various ions in groundwater are relatively low and deliver a slow-increasing trend, while they increase sharply in estuarine plains. The distribution of different groundwater bodies along the route shows a wide band-like distribution. There is no SO4-type water in many groundwater chemical types, indicating that the mixing effect of groundwater with different salinity is strong. Furthermore, in some relatively low-lying areas in the shallow groundwater at the foot of the mountain, there is a relatively high Cl-content phenomenon, indicating that this area is significantly affected by evaporation and concentration.
4.2. Environmental Isotope Method Results and Discussion
In this study, the correlation between 18O, 2H, and Cl− was observed to analyze the process of seawater intrusion and the hydraulic connection between different water bodies, using the software Origin 2021 to create a diagram of the correlation between δ18O, 2H, and Cl− (Figure 6).
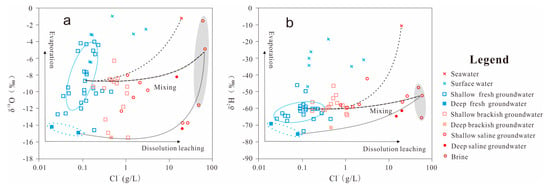
Figure 6.
Diagram of correlation between δ18O (a), 2H (b), and Cl− values in groundwater and surface water.
The values of shallow fresh groundwater range from −11.3‰ to −4.2‰ for δ18O and from −73.6‰ to −46‰ for 2H; the values of deep fresh groundwater range from −11.3‰ to −4.2‰ for δ18O and from −75.4‰ to −58.9‰ for 2H; the values of shallow brackish groundwater range from −14.9‰ to −6.3‰ for δ18O and from −66.3‰ to −46.5‰ for 2H; the values of deep brackish groundwater range from −15.5‰ to −9.6‰ for δ18O and from −71.3‰ to −60.8‰ for 2H; the values of saline groundwater range from −14.4‰ to −6.6‰ for δ18O and from −64.6‰ to −52.6‰ for 2H; the values of surface water range from −5.6‰ to −1.2‰ for δ18O and from −49.7‰ to −19.6‰ for 2H. The relationship between δ18O, 2H, and Cl− shows that the groundwater was affected by various evaporation, dissolution, and mixing in the runoff process. Fresh groundwater was affected by evaporation, resulting in a noticeable change of δ2H and δ18O; brackish groundwater and saline groundwater were significantly affected by dissolution and mixing; brine was affected by evaporation-concentration and mixing [34]. As described above, deep groundwater to brine water conformed to a gradual mixing pattern from south to north. In contrast, the mixing pattern of shallow groundwater to brine water was more complex, reflecting that atmospheric precipitation, surface water, and irrigation water influence the recharge sources for shallow groundwater. From the endpoint-element mixing model analysis, fresh groundwater, brackish groundwater, and saline groundwater samples were relatively evenly distributed on the mixing trend line of shallow fresh groundwater–seawater and shallow fresh groundwater-brine, indicating that the shallow freshwater was affected by both brine and seawater intrusion [6,53]. On the trend line of mixing deep fresh groundwater–seawater and deep fresh groundwater–brine, there were sample points of fresh groundwater, brackish groundwater, and saline water. However, the sample points of brackish groundwater were mainly concentrated near the mixing line between fresh water and seawater, indicating that deep groundwater tends to mix more with seawater first and is more affected by seawater intrusion [54]. The deep saline and shallow saline groundwater samples showed a relatively obvious approach, indicating that in some areas, the hydraulic relationship between them is caused by string mining, etc. [55].
4.3. Fixed-Point Wells Monitoring Results and Discussion
The monitoring well’s TDS and water level data were analyzed and mapped using the software Grapher 10. The monitoring well C1 was located in the brackish groundwater area. The monitoring data show that the dynamic type of groundwater was runoff extraction (Figure 7).
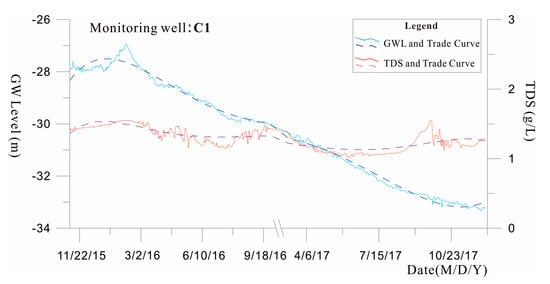
Figure 7.
Diagram of correlation between groundwater level and TDS variation in well C1.
During the monitoring period, the groundwater table showed a declining trend, with an average annual decline of more than 3 m, and the TDS was slightly greater than 1 g/L, with a slight change. The more obvious groundwater table rise period appeared in January 2017, and the TDS increased somewhat. According to the TDS and groundwater table correlation, the curve can be divided into two stages; before August 2017, when the groundwater table declined, TDS was positively correlated with the groundwater table, indicating that this area mainly received the lateral recharge of fresh groundwater from the southern region. After August 2017, TDS was negatively correlated with the groundwater table, and the influence of northern seawater intrusion on this area gradually emerged [56].
The monitoring well C2 was severely affected by seawater intrusion in the saline groundwater area. The monitoring data show that the dynamic type of groundwater was weak runoff-exploitation (Figure 8). During the monitoring period, the change in the groundwater table was affected by extraction, and no seasonal variations were observed. The main reason for the lack of obvious seasonal changes was that the salinity here needed to be lowered for agricultural irrigation, mainly for fish farming and the chemical industry [57]. Before March 2017, TDS increased slightly with the groundwater table fluctuation and was relatively stable at approximately 16–17 g/L, indicating a stable saline groundwater or brine recharge source. After March 2017, the TDS and groundwater table showed a significant negative correlation. TDS rose significantly with the fluctuation of the groundwater table; the reason is that the continuous extraction of brackish groundwater caused the lowering of the groundwater level here, breaking the hydraulic balance with the northern saline water, and higher salinity brine from the north began to invade and replenish it [58,59,60].
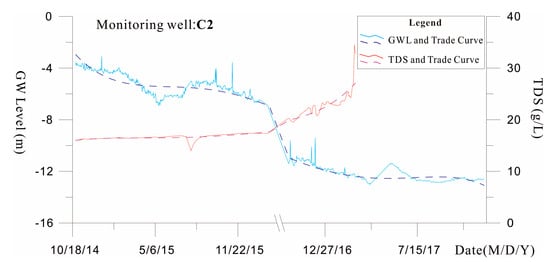
Figure 8.
Diagram of correlation between groundwater level and TDS variation in well C2.
The single-hole multi-layer monitoring well C3 was located in the seawater–fresh groundwater transition area. C3-1 is a shallow groundwater well, and the monitoring data show that the dynamic type of groundwater at this depth was precipitation–runoff–extraction (Figure 9a). TDS showed a trend of slightly increasing at the beginning, declining in the middle, and increasing and fluctuating at the end. The groundwater table was in a significant decline stage, and there was a phenomenon of slight decrease followed by a slow recovery in TDS; TDS increased from 1.5 g/L to 0.7 g/L and then expanded to approximately 1 g/L. This indicates that the groundwater was primarily replenished by the runoff of fresh water from the south. Before August 2014, the shallow fresh groundwater was weakly affected by seawater intrusion from the northern region and mainly received fresh groundwater from the southern region. After August 2014, the groundwater table declined, the influence of seawater intrusion was evident, and the increase in saline groundwater recharge in the north led to an increase in TDS. C3-2 is a medium–deep groundwater well. The monitoring data show that the dynamic type of groundwater at this depth was runoff extraction (Figure 9b). The groundwater table change was significantly affected by extraction. During the monitoring period, except for the relatively apparent recovery of the groundwater table in July 2018, the other period maintained a relatively stable decline. The groundwater table generally showed a declining trend. The TDS was significantly positively correlated with the change in the groundwater table, indicating that this area is in the regional groundwater circulation system. The groundwater was mainly recharged by fresh groundwater in the southern region. C3-3 is a deep groundwater well, and the data show that the dynamic type of groundwater at this depth was weak runoff–extraction (Figure 9c). The groundwater table change was affected by extraction, with TDS slightly less than 0.5 g/L, and it was not affected by seawater intrusion. Due to the influence of sedimentary structure and groundwater exploitation, this area has layered seawater intrusion.
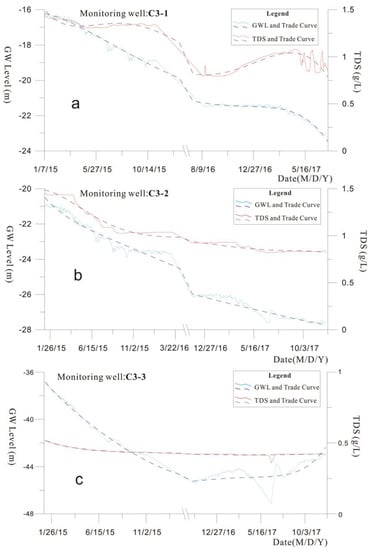
Figure 9.
Diagram of correlation between groundwater level and TDS variation in wells C3-1 (a), C3-2 (b), and C3-3 (c).
4.4. Geophysical Monitoring Results and Discussion
We interpolated the resistivity in the software Sufer 12 and obtained a contour profiles map of resistivity values. From the comparison of monitoring profiles (Figure 10), the resistivity contour of the shape is stable and continuous. The resistivity shows a trend of high in the south and low in the north, consistent with the distribution characteristics of saline groundwater and fresh groundwater in the striatum [29,61,62]. According to previous experience and the results of comparative field experiments [21,63,64,65,66], it was determined that the seawater intrusion interface was delineated with a resistivity value of 8–10 Ω·m. The monitoring data show that in August 2019, the seawater intrusion front was located near the 2050 m, determined by the resistivity anomaly interpretation. In October 2017, the seawater intrusion front retreated northward by about 100 m to the vicinity of the 2150 m, with a rate of approximately 85.7 m/a. From July 2018 to December 2019, the seawater intrusion front first showed the characteristics of intrusion to the south and then retreated to the north. Considering the effect of the profile offset angle, the south intrusion and north retreat rates were approximately 213.3 m/a and 105.9 m/a, respectively. From the long-term monitoring data, from August 2016 to December 2019, the seawater intrusion front on the Dawangdong profile retreated northward at approximately 27 m/a.
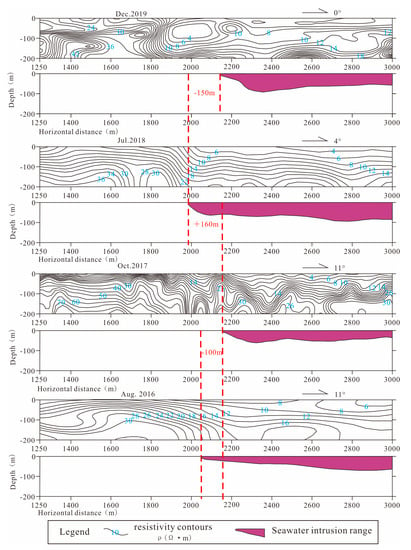
Figure 10.
The audio-frequency magneto telluric monitoring date interpretation of seawater intrusion extent comparison.
4.5. Theoretical Implications
Based on the analysis of the results obtained from the above monitoring methods, the water chemical sampling analysis method and the geophysical monitoring method can be used in combination. After obtaining the approximate range and degree of regional seawater intrusion through the water chemical sampling analysis method, further use of geophysical monitoring methods can accurately delineate the boundary between saline and fresh groundwater, determine the burial depth of the top and bottom plates of aquifers containing saline or fresh water, and study the spatial evolution of underground saline and fresh groundwater bodies [67,68]. The advantage of the cross is that the seawater intrusion interface can be described quickly and accurately, and the degree of seawater intrusion can be determined. After understanding the groundwater flow system, the fixed-point well monitoring method can monitor the long-sequence dynamic characteristics of seawater intrusion at specific points, which can analyze the effect and the response of dynamic groundwater changes on seawater intrusion. This also helps confirm how seawater intrusion is determined by the water chemical sampling analysis method [69]. Combined with the geophysical monitoring method, it can verify the accuracy of the scoping of seawater intrusion. The combination of the environmental isotope method and the water chemical sampling analysis method can analyze and monitor the influencing factors of seawater intrusion. It can clarify the interconnectedness of different water bodies in the intrusion process [70].
4.6. Practical Implications
Based on analyzing the factors and processes affecting seawater intrusion, local authorities must manage groundwater resources in the following aspects: strengthen the management of water resources in the coastal plain area, strictly prohibit deep well drilling in areas where seawater intrusion occurs, precisely control new well drilling, and strictly control groundwater exploitation for irrigation except for human and livestock use [71,72]. Large-scale industrial projects that consume water cannot be built in areas where seawater intrusion occurs. For existing large-scale industrial projects in these areas, a method of centralized water supply from a distance should be adopted instead of exploiting local groundwater.
5. Conclusions
This study conducted a comprehensive analysis of seawater intrusion on the south coast of Laizhou Bay using multiple monitoring methods. From the general study area, the effect of different water bodies on seawater intrusion was analyzed based on the theory of the mixing effect of other water bodies and the water chemistry in groundwater aquifer systems. By combining the water chemical sampling analysis method and the environmental isotope method, the type and extent of seawater intrusion were assessed from a macro perspective. The northern and southern profiles of the study area were selected for fixed-point well monitoring and geophysical monitoring methods, respectively, and the effects of human activities such as groundwater extraction, aquaculture, and hydrogeological conditions on seawater intrusion were investigated. The annual rate of seawater intrusion was quantitatively assessed, and the seawater intrusion front generally showed a trend of retreating backward, with a rate of approximately 27 m/a.
The results show that seawater intrusion vigorously mixes with saline groundwater on the southern coastal plain of Laizhou Bay. Due to the influence of hydrogeological conditions and groundwater extraction, layered seawater intrusion exists. In layered intrusion, shallow fresh groundwater is subject to both saline groundwater mixing and seawater intrusion, while deep freshwater is mainly affected by seawater intrusion. In some areas, shallow saline groundwater is hydraulically connected to deep salty groundwater due to string mining.
Although multiple research methods were used to analyze regional seawater intrusion from various angles in this study, this analysis was based on a detailed geological background. When the geological background conditions of the study area are unclear, the use of the geophysical monitoring method and the fixed-point well monitoring method are limited, and it is necessary to determine the transition zone of seawater intrusion through the water chemical sampling analysis method. However, a high-precision, long-sequence air-ground-well integrated monitoring system has yet to be established in a typical research study. Multi-source monitoring information must be integrated in a true sense to realize the complementary advantages of different monitoring technologies. Therefore, the combined analysis of data from direct and indirect monitoring methods is an idea that deserves further investigation to determine the current status of seawater intrusion.
6. Outlook
With the continuous development of technologies for seawater intrusion monitoring, the three-dimensional integrated monitoring technology of air-ground-wells, which combines multiple methods and integrates multi-source information, was adopted. Taking into account the optimization of monitoring layout and schemes, the continuous improvement of seawater intrusion modeling accuracy using multi-source information has become an important development direction [68,73,74]. For example, high-precision Earth gravity satellite data can be used to decipher the seawater intrusion transition zone and thus more accurately deploy water chemistry sampling holes. The future use of remote sensing, water chemistry, monitoring wells stratified monitoring, and other multi-source techniques means that building a monitoring network [75,76], combined with numerical simulation techniques, is a method of seawater intrusion identification and evaluation of the technical route of direction worth further investigation.
Author Contributions
Conceptualization and design, H.L. and L.G.; methodology, acquisition, and analysis of data, H.L. and L.G.; validation, C.M. and Y.Y.; writing—original draft preparation, H.L.; funding acquisition, H.L. and C.M. All authors have read and agreed to the published version of the manuscript.
Funding
This study was supported by China Geological Survey Projects, grant number 12120113003800, DD20221727.
Data Availability Statement
The data supporting this study’s findings are available on request from the corresponding author. The data are not publicly available due to privacy or ethical restrictions. Therefore, they are available from the corresponding author upon reasonable request.
Acknowledgments
The authors thank Zhang Chengyi for her modification of the language structure.
Conflicts of Interest
The authors declare no conflict of interest. The funders had no role in the study’s design; in the collection and analyses of data; in the writing of the manuscript; or in the decision to publish the results.
References
- He, J.; Mai, T.H.T. The Circular Economy: A Study on the Use of Airbnb for Sustainable Coastal Development in the Vietnam Mekong Delta. Sustainability 2021, 13, 7493. [Google Scholar] [CrossRef]
- Werner, A.D.; Bakker, M.; Post, V.E.A.; Vandenbohede, A.; Lu, C.; Ataie-Ashtiani, B.; Simmons, C.T.; Barry, D.A. Seawater Intrusion Processes, Investigation, and Management: Recent Advances and Future Challenges. Adv. Water Resour. 2013, 51, 3–26. [Google Scholar] [CrossRef]
- Barlow, P.M.; Reichard, E.G. L’intrusion d’eau Salée Dans Les Régions Côtières d’Amérique Du Nord. Hydrogeol. J. 2010, 18, 247–260. [Google Scholar] [CrossRef]
- Gogoberidze, G. Tools for Comprehensive Estimate of Coastal Region Marine Economy Potential and Its Use for Coastal Planning. J. Coast. Conserv. 2012, 16, 251–260. [Google Scholar] [CrossRef]
- Garing, C.; Luquot, L.; Pezard, P.A.; Gouze, P. Geochemical Investigations of Saltwater Intrusion into the Coastal Carbonate Aquifer of Mallorca, Spain. Appl. Geochem. 2013, 39, 1–10. [Google Scholar] [CrossRef]
- Maosheng, G.; Yongming, L. Zone, Change of Groundwater Resource and Prevention and Control of Seawater Intrusion in Coastal. Coast. Sci. Sustain. Dev. 2016, 31, 1197–1203. (In Chinese) [Google Scholar] [CrossRef]
- Sun, M.; Wang, T.; Xu, X.; Zhang, L.; Li, J.; Shi, Y. Ecological Risk Assessment of Soil Cadmium in China’s Coastal Economic Development Zone: A Meta-Analysis. Ecosyst. Health Sustain. 2020, 6, 1733921. [Google Scholar] [CrossRef]
- Samani, S. Assessment of Groundwater Sustainability and Management Plan Formulations through the Integration of Hydrogeological, Environmental, Social, Economic and Policy Indices. Groundw. Sustain. Dev. 2021, 15, 100681. [Google Scholar] [CrossRef]
- Hu, X.; Gao, L.; Ma, C.; Hu, X. Land Use Zoning of Weifang North Plain Based on Ecological Function and Geo-Environmental Suitability. Bull. Eng. Geol. Environ. 2020, 79, 2697–2719. [Google Scholar] [CrossRef]
- Sekar, S.; Perumal, M.; Roy, P.D.; Ganapathy, M.; Senapathi, V.; Yong Chung, S.; Elzain, H.E.; Duraisamy, M.; Kamaraj, J. A Review on Global Status of Fresh and Saline Groundwater Discharge into the Ocean. Environ. Monit. Assess. 2022, 194, 915. [Google Scholar] [CrossRef]
- Xue, L.; Siyuan, Y. Progress in Seawater Intrusion. Mar. Geol. Quat. Geol. 2016, 36, 211–217. (In Chinese) [Google Scholar]
- Sharan, A.; Lal, A.; Datta, B. A Review of Groundwater Sustainability Crisis in the Pacific Island Countries: Challenges and Solutions. J. Hydrol. 2021, 603, 127165. [Google Scholar] [CrossRef]
- Tully, K.L.; Weissman, D.; Wyner, W.J.; Miller, J.; Jordan, T. Soils in Transition: Saltwater Intrusion Alters Soil Chemistry in Agricultural Fields. Biogeochemistry 2019, 142, 339–356. [Google Scholar] [CrossRef]
- Han, D.; Currell, M.J. Review of Drivers and Threats to Coastal Groundwater Quality in China. Sci. Total Environ. 2022, 806, 150913. [Google Scholar] [CrossRef]
- Noto, A.E.; Shurin, J.B. Early Stages of Sea-Level Rise Lead to Decreased Salt Marsh Plant Diversity through Stronger Competition in Mediterranean-Climate Marshes. PLoS ONE 2017, 12, e0169056. [Google Scholar] [CrossRef]
- Gao, L.; Ma, C.; Wang, Q.; Zhou, A. Sustainable Use Zoning of Land Resources Considering Ecological and Geological Problems in Pearl River Delta Economic Zone, China. Sci. Rep. 2019, 9, 16052. [Google Scholar] [CrossRef]
- Carvalho, A.B.; Inácio de Moraes, G. The Brazilian Coastal and Marine Economies: Quantifying and Measuring Marine Economic Flow by Input-Output Matrix Analysis. Ocean Coast. Manag. 2021, 213, 105885. [Google Scholar] [CrossRef]
- Gao, L.; Hu, X.; Ma, C.; Kuang, H.; Qi, H.; He, Z. Geoenvironmental Risk Evaluation of High-Efficiency Eco-Economic Zone in Weifang City, China. Nat. Hazards Rev. 2020, 21, 05020005. [Google Scholar] [CrossRef]
- El-Kaliouby, H. Mapping Sea Water Intrusion in Coastal Area Using Time-Domain Electromagnetic Method with Different Loop Dimensions. J. Appl. Geophys. 2020, 175, 103963. [Google Scholar] [CrossRef]
- Zhang, Y.; Wang, X.; Xue, Y.; Zou, C.; Luo, M.; Li, G.; Li, L.; Cui, L.; Li, H. Advances in the Study of Submarine Groundwater Discharge (SGD) in China. Sci. China Earth Sci. 2022, 65, 1948–1960. [Google Scholar] [CrossRef]
- Yunzhang, H.; Hong, L.; Ying, L.; Peixin, S.; Jilong, Y.; Ziyuan, H.; Hongwei, L. Hydrogeochemical Recognization of Seawater Intrusion Process at the Typical Profile in Laizhou Bay. Geol. Surv. Res. 2015, 38, 41–50. (In Chinese) [Google Scholar]
- Xiong, G.; Chen, G.; Wu, J.; Fu, T.; Yang, Y.; Xu, X.; Zhu, X.; Yu, H.; Liu, S.; Gao, M.; et al. Seawater Intrusion-Retreat Processes and Groundwater Evolution in Intruded Coastal Aquifers with Land Reclamation: A Case Study of Eastern Jiangsu, China. Lithosphere 2021, 2021, 1308487. [Google Scholar] [CrossRef]
- Gurunadha Rao, V.V.S.; Rao, G.T.; Surinaidu, L.; Rajesh, R.; Mahesh, J. Geophysical and Geochemical Approach for Seawater Intrusion Assessment in the Godavari Delta Basin, A.P., India. Water. Air. Soil Pollut. 2011, 217, 503–514. [Google Scholar] [CrossRef] [PubMed]
- Bo, L.; Shuya, H.; Quansheng, Z. Chemical Characteristics of Groundwater in Coastal Seawater Intrusion Area of Laizhou Bay. Glob. Geol. 2020, 39, 971–977. [Google Scholar]
- Niculescu, B.M.; Andrei, G. Application of Electrical Resistivity Tomography for Imaging Seawater Intrusion in a Coastal Aquifer. Acta Geophys. 2021, 69, 613–630. [Google Scholar] [CrossRef]
- Satish Kumar, V.; Dhakate, R.; Amarender, B.; Sankaran, S. Application of ERT and GPR for Demarcating the Saline Water Intrusion in Coastal Aquifers of Southern India. Environ. Earth Sci. 2016, 75, 393. [Google Scholar] [CrossRef]
- Sherif, M.; El Mahmoudi, A.; Garamoon, H.; Kacimov, A.; Akram, S.; Ebraheem, A.; Shetty, A. Geoelectrical and Hydrogeochemical Studies for Delineating Seawater Intrusion in the Outlet of Wadi Ham, UAE. Environ. Geol. 2006, 49, 536–551. [Google Scholar] [CrossRef]
- Xiaoni, Z.; Zhenxing, W.; Qingzhuang, M.; Bing, Z. Study the Shallow Groundwater Chemical Characteristics in the Typical Area of Zhanghe Catchment Basin. Geol. Surv. Res. 2020, 43, 265–270. (In Chinese) [Google Scholar]
- Giménez-Forcada, E. Use of the Hydrochemical Facies Diagram (HFE-D) for the Evaluation of Salinization by Seawater Intrusion in the Coastal Oropesa Plain: Comparative Analysis with the Coastal Vinaroz Plain, Spain. HydroResearch 2019, 2, 76–84. [Google Scholar] [CrossRef]
- El Osta, M.; Masoud, M.; Alqarawy, A.; Elsayed, S.; Gad, M. Groundwater Suitability for Drinking and Irrigation Using Water Quality Indices and Multivariate Modeling in Makkah Al-Mukarramah Province, Saudi Arabia. Water 2022, 14, 483. [Google Scholar] [CrossRef]
- Masoud, M.; El Osta, M.; Alqarawy, A.; Elsayed, S.; Gad, M. Evaluation of Groundwater Quality for Agricultural under Different Conditions Using Water Quality Indices, Partial Least Squares Regression Models, and GIS Approaches. Appl. Water Sci. 2022, 12, 244. [Google Scholar] [CrossRef]
- Liu, Q.; Li, F.; Li, J.; Luo, B.; Huang, C. Geochemical and Isotopic Evidence of Shallow Groundwater Salinization in a Reclaimed Coastal Zone: The Yellow River Delta, China. Environ. Earth Sci. 2016, 75, 1107. [Google Scholar] [CrossRef]
- Maurya, P.; Kumari, R.; Mukherjee, S. Hydrochemistry in Integration with Stable Isotopes (Δ18O and ΔD) to Assess Seawater Intrusion in Coastal Aquifers of Kachchh District, Gujarat, India. J. Geochem. Explor. 2019, 196, 42–56. [Google Scholar] [CrossRef]
- Qi, H.; Ma, C.; He, Z.; Hu, X.; Gao, L. Lithium and Its Isotopes as Tracers of Groundwater Salinization: A Study in the Southern Coastal Plain of Laizhou Bay, China. Sci. Total Environ. 2019, 650, 878–890. [Google Scholar] [CrossRef]
- Dong, D.; Hongwei, L.; Zhitao, L.; Yunqing, M.; Xueqin, Z. Construction of Sea(Salt)Water Intrusion Monitoring Techniques and Methods System in South Bank of Laizhou Bay. Environ. Geol. 2015, 31, 49–53. [Google Scholar]
- Lim, J.W.; Lee, E.; Moon, H.S.; Lee, K.K. Integrated Investigation of Seawater Intrusion around Oil Storage Caverns in a Coastal Fractured Aquifer Using Hydrogeochemical and Isotopic Data. J. Hydrol. 2013, 486, 202–210. [Google Scholar] [CrossRef]
- Abdulameer, A.; Thabit, J.M.; AL-Menshed, F.H.; Merkel, B. Investigation of Seawater Intrusion in the Dibdibba Aquifer Using 2D Resistivity Imaging in the Area between Al-Zubair and Umm Qasr, Southern Iraq. Environ. Earth Sci. 2018, 77, 619. [Google Scholar] [CrossRef]
- Folch, A.; del Val, L.; Luquot, L.; Martínez-Pérez, L.; Bellmunt, F.; Le Lay, H.; Rodellas, V.; Ferrer, N.; Palacios, A.; Fernández, S.; et al. Combining Fiber Optic DTS, Cross-Hole ERT and Time-Lapse Induction Logging to Characterize and Monitor a Coastal Aquifer. J. Hydrol. 2020, 588, 125050. [Google Scholar] [CrossRef]
- Xili, S.; Peng, S.; Yangfang, S.; Xiangfeng, G. Significance of Seawater Intrusion Interface Divisionin Jijia Area in Yantai City of Shandong Province. Shandong L. Resour. 2014, 30, 58–60. (In Chinese) [Google Scholar]
- Weiping, W.; Chengping, W.; Yongjun, Z.; Shengjun, L.; Xunbiao, M. Application of Airborne Electromagnetic Method in Hydrogeological Survey. Geol. Surv. China 2022, 9, 113–121. (In Chinese) [Google Scholar] [CrossRef]
- Ayolabi, E.A.; Folorunso, A.F.; Odukoya, A.M.; Adeniran, A.E. Mapping Saline Water Intrusion into the Coastal Aquifer with Geophysical and Geochemical Techniques: The University of Lagos Campus Case (Nigeria). SpringerPlus 2013, 2, 433. [Google Scholar] [CrossRef]
- Alfaifi, H.; Kahal, A.; Albassam, A.; Ibrahim, E.; Abdelrahman, K.; Zaidi, F.; Alhumidan, S. Integrated Geophysical and Hydrochemical Investigations for Seawater Intrusion: A Case Study in Southwestern Saudi Arabia. Arab. J. Geosci. 2019, 12, 372. [Google Scholar] [CrossRef]
- Nicolodi, J.L.; Asmus, M.; Turra, A.; Polette, M. Evaluation of Coastal Ecological-Economic Zoning (ZEEC) in Brazil: Methodological Proposal. Desenvolv. Meio Ambient. 2018, 44, 378–404. [Google Scholar] [CrossRef]
- Xueming, Y.; Yongjun, S.; Dong, D.; Jan, F.; Xing, L. The Application of The Audio Ferquency Magnetotelluric Method to The Dynamic Monitoring of Seawater. Geophys. Geochem. Explor. 2013, 37, 301–305. (In Chinese) [Google Scholar]
- Chen, S.m.; Liu, H.W.; Liu, F.T.; Miao, J.J.; Guo, X.; Zhang, Z.; Jiang, W.J. Using Time Series Analysis to Assess Tidal Effect on Coastal Groundwater Level in Southern Laizhou Bay, China. J. Groundw. Sci. Eng. 2022, 10, 292–301. [Google Scholar] [CrossRef]
- Guanquan, C. Study on The Impact Mechanism and Early Waring Evaluation of Seawater Instrusion in Laizhou Bay Area; East China Normal University: Shanghai, China, 2013. (In Chinese) [Google Scholar]
- He, Z.; Ma, C.; Zhou, A.; Qi, H.; Liu, C.; Cai, H.; Zhu, H. Using Hydrochemical and Stable Isotopic (Δ2H, Δ18O, Δ11B, and Δ37Cl) Data to Understand Groundwater Evolution in an Unconsolidated Aquifer System in the Southern Coastal Area of Laizhou Bay, China. Appl. Geochem. 2018, 90, 129–141. [Google Scholar] [CrossRef]
- China Geological Survey. Handbook of Hydrogeology; Geology Press: Bath, UK, 2012. (In Chinese) [Google Scholar]
- Yunde, L.; Yiqun, G.; Tingting, Y.; Cunfu, L.; Aiguo, Z. Online Simultaneous Determination of ΔD and Δ18O in Micro-Liter Water Samples by Thermal Conversion/Elemental Analysis-Isotope Ratio Mass Spectrometry. Rock Miner. Anal. 2010, 29, 643–647. (In Chinese) [Google Scholar] [CrossRef]
- Şen, Z. Practical and Applied Hydrogeology; Elsevier: Amsterdam, The Netherlands, 2015; ISBN 9780128000755. [Google Scholar]
- Siemon, B.; Steuer, A.; Deus, N.; Elbracht, J. Comparison of Manually and Automatically Derived Fresh-Saline Groundwater Boundaries from Helicopter-Borne Em Data at the Jade Bay, Northern Germany. E3S Web Conf. 2018, 54, 00032. [Google Scholar] [CrossRef]
- Dan, L. Comparison of Indicators for the Assessment of Saltwater Intrusion in Coastal Aquifers—Taking Aquifers in Pearl River Estuary as an Example. Mar. Environ. Sci. 2020, 39, 16–23. (In Chinese) [Google Scholar] [CrossRef]
- Sun, Q.; Gao, M.; Wen, Z.; Hou, G.; Dang, X.; Liu, S.; Zhao, G. Hydrochemical Evolution Processes of Multiple-Water Quality Interfaces (Fresh/Saline Water, Saline Water/Brine) on Muddy Coast under Pumping Conditions. Sci. Total Environ. 2023, 857, 159297. [Google Scholar] [CrossRef]
- Han, D.; Cao, G.; McCallum, J.; Song, X. Residence Times of Groundwater and Nitrate Transport in Coastal Aquifer Systems: Daweijia Area, Northeastern China. Sci. Total Environ. 2015, 538, 539–554. [Google Scholar] [CrossRef]
- Thorn, P. Groundwater Salinity in Greve, Denmark: Determining the Source from Historical Data. Hydrogeol. J. 2011, 19, 445–461. [Google Scholar] [CrossRef]
- Jinjie, M. Dynamic Monitoring and Evolution Study of Saline Intrusion at South Coast of Laizhou Bay; China University of Geosciences: Beijing, China, 2014. [Google Scholar]
- MA, J.; Wei, L.; Xiong, J.; Wu, C.; Zhou, Z.; Zhu, S. Study on the Response of Groundwater Exploitation and Tidal Effects in Coastal Zones to Seawater Intrusion. In Proceedings of the 8th International Conference on Water Resource and Environment, Xi’an, China, 1–4 November 2022. (In Chinese). [Google Scholar]
- Sen, L. The Evolution of Ground-Saline Water and Process Mechanism of Saline Water Intrusion in Southern Laizhou Bay; China University of Geosciences: Wuhan, China, 2018. [Google Scholar]
- Nonner, J.C.; Nonner, J. Introduction to Hydrogeology; CRC Press: Boca Raton, FL, USA, 2002; ISBN 9780367805845. [Google Scholar]
- Sakai, T.; Omori, K.; Oo, A.N.; Zaw, Y.N. Monitoring Saline Intrusion in the Ayeyarwady Delta, Myanmar, Using Data from the Sentinel-2 Satellite Mission. Paddy Water Environ. 2021, 19, 283–294. [Google Scholar] [CrossRef]
- Subrahmanyam, B.; Trott, C.B.; Murty, V.S.N. Detection of Intraseasonal Oscillations in SMAP Salinity in the Bay of Bengal. Geophys. Res. Lett. 2018, 45, 7057–7065. [Google Scholar] [CrossRef]
- Bouderbala, A.; Remini, B. Geophysical Approach for Assessment of Seawater Intrusion in the Coastal Aquifer of Wadi Nador (Tipaza, Algeria). Acta Geophys. 2014, 62, 1352–1372. [Google Scholar] [CrossRef]
- Hisby, K. Features and Evaluation of Sea/Saltwater Intrusion in Southern Laizhou Bay. J. Groundw. Sci. Eng. 2016, 4, 141–148. [Google Scholar] [CrossRef]
- Yuhai, H. Research and Application of High-Density Resistance Method in Seawater Invasion Investigation of Laizhou Bay. Mar. Environ. Sci. 2016, 35, 301–305. (In Chinese) [Google Scholar] [CrossRef]
- Guanabara, E.; Ltda, K.; Guanabara, E.; Ltda, K. Application of Geophyscial Mehtods to Detecting Sea Water or Saline Water Intrusion:A Case Study of Alluvial-Proluvial Fan of Laizhou Bay. Mar. Geol. Front. 2016, 32, 58–64. (In Chinese) [Google Scholar]
- Abdalla, O.A.E.; Ali, M.; Al-Higgi, K.; Al-Zidi, H.; El-Hussain, I.; Al-Hinai, S. Rate of Seawater Intrusion Estimated by Geophysical Methods in an Arid Area: Al Khabourah, Oman. Hydrogeol. J. 2010, 18, 1437–1445. [Google Scholar] [CrossRef]
- Heydarizad, M.; Pumijumnong, N.; Mansourian, D.; Anbaran, E.D.; Minaei, M. The Deterioration of Groundwater Quality by Seawater Intrusion in the Chao Phraya River Basin, Thailand. Environ. Monit. Assess. 2023, 195, 424. [Google Scholar] [CrossRef]
- Fu, T.; Zhang, Y.; Xu, X.; Su, Q.; Chen, G.; Guo, X. Assessment of Submarine Groundwater Discharge in the Intertidal Zone of Laizhou Bay, China, Using Electrical Resistivity Tomography. Estuar. Coast. Shelf Sci. 2020, 245, 106972. [Google Scholar] [CrossRef]
- Xu, Z.; Tong, J.; Hu, B.X.; Yan, Z. Mapping and Monitoring Seasonal and Tidal Effects on the Salt-Freshwater Interface Using Electrical Resistivity Tomography Techniques. Estuar. Coast. Shelf Sci. 2022, 276, 108051. [Google Scholar] [CrossRef]
- Qi, H.; Ma, C.; He, Z.; Hu, X. Review of Hydrogeochemical and Environmental Isotope Approaches in Groundwater Salinization Study. Saf. Environ. Eng. 2018, 25, 97–105. (In Chinese) [Google Scholar]
- Guo, X.; Ma, C.; Hu, X.; Hu, X.; Yan, W. Application of Groundwater Functional Zoning to Coastal Groundwater Management: A Case Study in the Plain Area of Weifang City, China. Environ. Earth Sci. 2019, 78, 525. [Google Scholar] [CrossRef]
- Zeng, X.; Wu, J.; Wang, D.; Zhu, X. Assessing the Pollution Risk of a Groundwater Source Field at Western Laizhou Bay under Seawater Intrusion. Environ. Res. 2016, 148, 586–594. [Google Scholar] [CrossRef]
- Fan, Y.; Lu, W.; Miao, T.; Li, J.; Lin, J. Optimum Design of a Seawater Intrusion Monitoring Scheme Based on the Image Quality Assessment Method. Water Resour. Manag. 2020, 34, 2485–2502. [Google Scholar] [CrossRef]
- Zghibi, A.; Mirchi, A.; Zouhri, L.; Taupin, J.D.; Chekirbane, A.; Tarhouni, J. Implications of Groundwater Development and Seawater Intrusion for Sustainability of a Mediterranean Coastal Aquifer in Tunisia. Environ. Monit. Assess. 2019, 191, 696. [Google Scholar] [CrossRef] [PubMed]
- Mengya, S.; Bin, S.; Rui, H.; Suping, L.; Chenxi, F.; Zhuo, C. Preliminary Study on Monitoring the Salinity of Seawater with Fiber Bragg Grating. Geol. J. China Univ. 2019, 25, 125–130. (In Chinese) [Google Scholar] [CrossRef]
- Samani, S.; Kardan Moghaddam, H. Optimizing Groundwater Level Monitoring Networks with Hydrogeological Complexity and Grid-Based Mapping Methods. Environ. Earth Sci. 2022, 81, 453. [Google Scholar] [CrossRef]
Disclaimer/Publisher’s Note: The statements, opinions and data contained in all publications are solely those of the individual author(s) and contributor(s) and not of MDPI and/or the editor(s). MDPI and/or the editor(s) disclaim responsibility for any injury to people or property resulting from any ideas, methods, instructions or products referred to in the content. |
© 2023 by the authors. Licensee MDPI, Basel, Switzerland. This article is an open access article distributed under the terms and conditions of the Creative Commons Attribution (CC BY) license (https://creativecommons.org/licenses/by/4.0/).