Article

The Effect of Nitrate-Contaminated Drinking Water and Vegetables on the Prevalence of Acquired Methemoglobinemia in Beit Lahia City in Palestine

1
Department of Toxicology, Faculty of Pharmacy, Near East University, 99138 Nicosia, Turkey
2
Environmental Engineering Department, Islamic University of Gaza, Gaza 1075, Palestine
3
Department of Pharmacy, Faculty of Medicine and Health Sciences, University of Palestine, Gaza 1075, Palestine
*
Author to whom correspondence should be addressed.
Water 2023, 15(11), 1989; https://doi.org/10.3390/w15111989
Submission received: 12 April 2023 / Revised: 12 May 2023 / Accepted: 17 May 2023 / Published: 24 May 2023
(This article belongs to the Section Water Quality and Contamination)

Abstract

:
Nitrates significantly impact human health and the environment. Drinking water and vegetables are considered the main sources of exposure to exogenous nitrates for humans. This study aimed to estimate and assess the health hazards from nitrate contamination present in drinking water and vegetables for infants in the north of the Gaza Strip. A total of 252 samples were collected from groundwater and drinking water, and 15 vegetable samples were analyzed with a spectrophotometer. In addition, an ELISA kit was used to determine methemoglobin in 87 infant blood samples. According to the findings of this study, the nitrate concentration in groundwater was in the range from 58.3 mg/L to 178.4 mg/L. Meanwhile, the nitrate levels in drinking water were found to be between 10 and 17 mg/L. As for vegetables, carrots (237.20 ± 53.23 mg kg−1), potatoes (246.80 ± 81.42 mg kg−1), and zucchini (275.86 ± 58.87 mg kg−1) had varying nitrate concentrations. Lastly, the study revealed that methemoglobinemia was present in 32.2% of infant samples in the study area. This study concluded that 97% of groundwater in desalination plants exceeded WHO guidelines (>50 mg/L), and the values of nitrates in drinking water showed the existence of nitrate contamination. Among vegetables, zucchini has the highest nitrate content. Exposure to drinking water and vegetables contaminated with nitrate increased the percentage of methemoglobin levels in infants.

1. Introduction

The issue of water pollution is a significant challenge affecting human health and the environment in many countries [1]. Nitrate (NO3) is a relatively non-toxic ubiquitous ion in the environment, but its metabolites, nitrite, nitric oxide, and N-nitroso compounds make nitrate of regulatory importance because of their potential adverse health consequences [2,3]. Human exposure to nitrate is predominately exogenous through vegetables, other foods, and water but is also formed endogenously to a limited extent [4].
The exact nitrate level in water is important to determine the contribution of water and food to nitrate intake in humans [5]. Vegetables, frequently cultivated with pesticides, herbicides, and fertilizers, are considered the primary source of nitrate in places with low nitrate levels (10 mg/L). Conversely, in locations where nitrate concentrations surpass 50 mg/L, the average person’s nitrate intake from drinking water may constitute up to 14–20% of their total intake [6,7]. It is noteworthy that groundwater serves as the primary source of drinking, agricultural, and household water [8]. In many countries, groundwater is the only source of drinking water and accounts for 20% of the world’s freshwater resources [9]. Nitrate contamination can be categorized into two types: point and non-point sources. The leading cause of non-point pollution that negatively impacts the quality of groundwater is the immoderate application of agricultural fertilizers [10]. This is due to the widespread use of synthetic and organic nitrogen-rich fertilizers. Furthermore, septic tank outflows, industrial and domestic waste, and animal manure all contribute to the enrichment of groundwater with NO3 [11].
Excessive nitrate can directly and acutely harm neonates and infants by causing methemoglobinemia (blue baby syndrome), a life-threatening condition that leads to cyanosis, shortness of breath, dizziness, headaches, seizures, coma, and even death [12]. The pathophysiological process that underlies this association is based on the reduction of nitrate to nitrite by bacteria that colonize the oral cavity of infants. As nitrite bonds to hemoglobin, methemoglobin is formed, significantly decreasing the oxygen-carrying capacity of red blood cells [13].
N O 2 + o x y H b ( F e 2 + ) m e t H b ( F e 3 + ) + N O 3
Infants have lower levels of methemoglobin reductase in their erythrocytes and are consequently more vulnerable to these agents than adults. However, all age groups are at risk, given sufficient exposure [14]. Moreover, clinically significant methemoglobinemia can also be caused by systemic acidosis in infants suffering from diarrhea and dehydration [15].
The most significant issues with water quality in the Gaza Strip are high salinity and nitrate levels [16]. Due to the extensive use of fertilizers in the Gaza Strip, groundwater is contaminated with nitrate levels up to 300 mg/L [17]. In more than 90.6% of Gaza Governorate municipal wells in 2018, the nitrate level was higher than the WHO standard [18]. In the Gaza Strip, a previous study [19] was conducted to investigate the association between nitrate concentrations in drinking water and infant methemoglobin (MetHb) levels in Gaza. The study involved 338 infants from three different areas in the Gaza Strip, Palestine, where mean nitrate concentrations were 124 mg/L (range 71–248 mg/L) in Jabaliya, 119 mg/L (range 18–244 mg/L) in Gaza City and 195 mg/L (18–440 mg/L) in Khan-Younis. The researchers found that families who used tap water had the highest proportion (68.9%) of infants with MetHb levels exceeding 5%, while families using treated or filtered water had a lower proportion of infants with elevated MetHb levels, about 20%. Therefore, the study suggests a link between nitrate levels in drinking water and MetHb levels in infants. There is a lack of information and a database about the nitrate level of vegetables in Palestine. This is necessary to assess the health risks to infants due to nitrate intake based on acceptable daily intake and the health risk index; the nitrate levels in drinking and groundwater must be measured. The purpose of this study was to estimate and assess health risks to infants in the north of the Gaza Strip of nitrate concentration hazards in drinking water and vegetables.

2. Materials and Methods

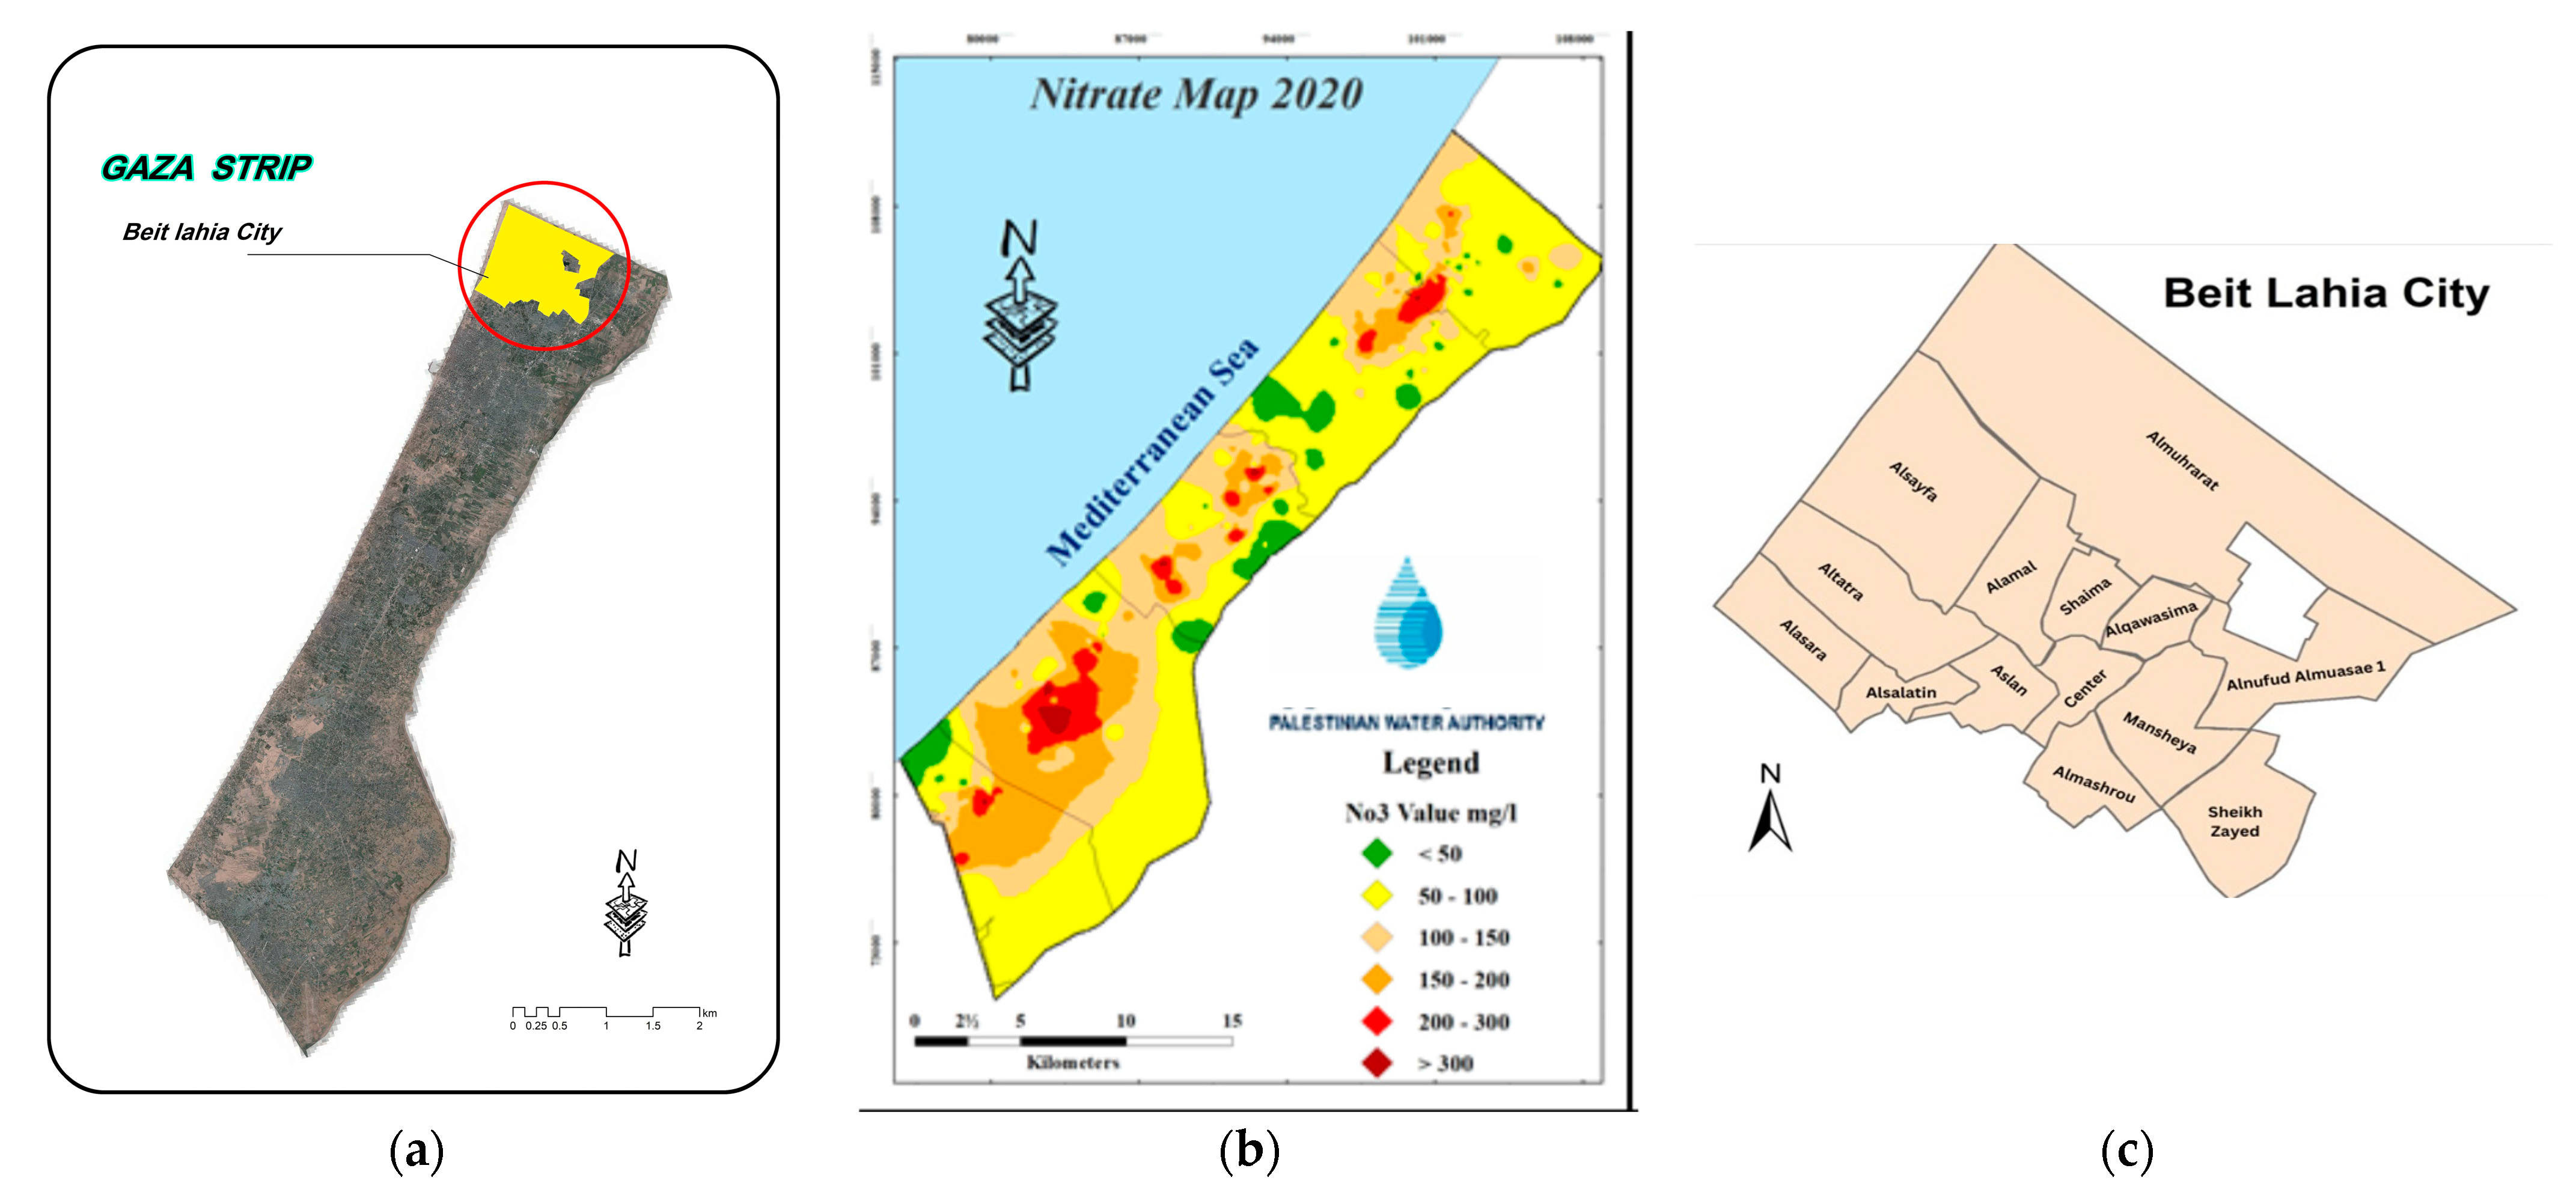
2.1. Description of the Study Area

The study was conducted in Beit Lahia City, which is situated roughly 7 km north of Gaza City (Figure 1a). This city is adjacent to the Mediterranean Sea to the west. It covers an area of about 14.699 km2 and has a population of 104,828 [20]. The area is a semi-rural region with an interior Mediterranean climate. Previous reports and research show nitrate concentrations in municipal wells greater than WHO guidelines for drinking water in Beit Lahia City. The main reason for selecting this area is due to the infants in Beit Lahia City receiving their healthcare at different clinics: Al-Shaimaa and Al-Atatra primary healthcare centers, UNRWA clinics, and private clinics. Study samples were collected from the Al-Shaimaa and Al-Atatra primary healthcare centers. The infant (1–12 months) population in Beit Lahia is 2694, and approximately 450 children come to the clinic every month for vaccination. The samples were collected voluntarily from infants living in the same area, and drinking water and vegetable samples were collected from the same region. Other regions in the Gaza Strip consume vegetables from their farms. The nitrate concentration map for 2020 in Figure 1b shows that most Gaza Strip areas have NO3 levels higher than the WHO limit (50 mg/L). These levels range from 100 to 200 mg/L, and the percolation of the wastewater from the sewerage, mainly located beneath residential areas, is the primary factor [21].
Samples were collected from Beit Lahia (31°32′47″ N, 34°29′43″ E) as shown in Figure 1c.

2.2. Study Setting and Population Characteristics

A cross-sectional study was conducted in the city to collect blood samples from infants (1–12 months) attending the main primary healthcare clinics (Al-Shaimaa and Al-Atatra primary healthcare centers) for vaccination.
The sampling period of the population extended from mid-May 2022 to mid-August 2022. Table 1 summarizes the general characteristics of our study population. Of the 87 infants, 58.6% were males and 41.4% were females; 3.4% were aged 0–31 days, 2.3%, 1–2 months, 8%, 2–3 months, 24.1%, 3–6 months, and 62.1%, 6–12 months.

2.3. Questionnaire Tools Development

The World Health Organization (WHO) and the ISPOR Task Force for Translation and Cultural Adaptation principles were adopted to translate an infant and young child feeding questionnaire into the local Arabic language.
The forward–backward translation was carried out by two bilingual experts to ensure the equivalence of the questionnaires in the target language. To ensure the content validity and relevance of questionnaire items within the current study setting, an expert panel was assembled, comprising two specialists in biostatistics and bioinformatics. The study tools were eventually pilot tested on five mothers; however, the data collected from this test were not included in the primary study findings.
Mothers in primary health clinics filled out a questionnaire to estimate the consumption of vegetables by infants. The questionnaire asked whether they fed their children carrots, zucchini, and potatoes. Of those participating, 87.2% answered “yes” and 12.8% answered “no”. Potatoes and carrots are crops grown underground, and the edible portion is the stem. Zucchini is a fruity vegetable.

2.4. Water Sampling and Analysis

Table 2 shows the six major desalination plants in the north of the Gaza Strip selected for this study. Information was gathered from the desalination plant units to assess the water quality because they are the major distributor of drinking water in the selected study region (Beit Lahia City). Water samples were collected and analyzed following international protocols. A standard 500-mL polyethylene bottle was used for collecting samples. During transfer to the Drug and Toxicology Analysis Center (Al-Azhar University-Gaza) laboratory, samples were kept at a temperature of 1–4 °C in an ice box. The water samples were analyzed immediately after collection. The water samples were collected from each desalination plant twice weekly for three months to determine the nitrate parameters. The samples were collected from the feeding wells and desalination plants (product desalinated water). The water samples were examined using the APHA 4500 NO3 method B, UV spectrophotometric method, which is the procedure for determining nitrate in water and wastewater [22]. The spectrophotometer (UV-2600i, Shimadzu, Kyoto, Japan) was adjusted to wavelengths of 220 nm and 275 nm.

2.5. Vegetable Sampling and Analysis

At Beit Lahia farms, 5 samples from each crop were collected for a total of 15 samples. During the study period, samples were transferred to PE bags for transport to the laboratory. Samples were rinsed with distilled water after being washed with tap water. Vegetables were cut into small pieces, ground, and mixed in a homogenizer. After that, 1 g of ground vegetable with 20 mg activated carbon was added to the flasks, and 40 mL of 0.025 M aluminum sulfate solution was added and shaken well for 30 min. The solution was centrifuged and then transferred to the supernatant. After the extraction of samples, the Cataldo method was used to determine the nitrate, and nitrate levels were measured by a spectrophotometer at 410 nm [23].

2.6. Sample Collection and Analysis of Blood

Blood samples of 2–3 mL were collected from infants aged 1 to 12 months brought by their parents for regular vaccination to the Ministry of Health, Vaccination Department in Beit Lahia, Gaza Strip. Eighty-seven total blood samples were collected over three months, from mid-May 2022 to mid-August 2022. Written informed consent was obtained from the participants’ parents before collecting blood samples. A skilled laboratory technician collected blood samples using vacuum blood collection tubes, and the analysis was promptly conducted in under an hour due to the instability of MetHb. After collection, blood samples were stored at 4 °C and transported immediately to the laboratory of the Palestinian Medical Relief Society-GAZA (PMRS) for immediate analysis using a Human Methemoglobin ELISA Kit. For the determination of methemoglobin concentration, an assay was conducted according to the procedure instructions of the company Human Methemoglobin (MHB) ELISA Kit (CUSABIO, Lot No: R15223929).

2.7. Risk Assessment

The Joint FAO/WHO Expert Committee on Food Additives (JECFA) has set the acceptable daily intake (ADI) for nitrates at 0–3.7 milligrams per kilogram of body weight per day (mg/kg bw/day). The estimation of the daily intake of vegetables and drinking water for infants was carried out using the EFSA Panel on Contaminants in the Food Chain (CONTAM) [24]. Additionally, the human health risk assessment model proposed by the US Environmental Protection Agency was utilized to estimate the potential risk of groundwater contamination by computing hazard quotients [25]. Given that the contaminant under study was non-volatile and the sampled water was primarily utilized for drinking purposes, the health risk assessment was exclusively conducted for the oral route, while the dermal and respiratory routes were disregarded. As there is insufficient evidence that nitrate in drinking water is carcinogenic in humans, only noncarcinogenic health effects resulting from long-term exposure to nitrate in drinking water were assessed through hazard quotients (HQs) in accordance with the US EPA health risk assessment model [26], as shown in Equation (1).
H Q = C D I R f D
where chronic daily intake (CDI) is the sum of nitrate intake via drinking water as shown in Equation (2), and RfD is a nitrate reference dose for oral intake, which is 1.6 mg/kg/day (Integrated Risk Information System) [27].
C D I = C × I R × E F × E D B W × A T
where C (mg/L) is the nitrate concentration, IR is the intake rate (0.8 L/day for infants, 1.5 L/day for children, and 2 L/day for adults), EF is the exposure frequency (365 day/year), ED is the exposure duration per year (1, 10, and 40 years for infants, children, and adults, respectively), BW is the average body weight (10 kg for infants, 20 kg for children, and 70 kg for adults), and AT is the averaging time (14,600, 3650, and 365 days for adults, children, and infants, respectively). An HQ value > 1 indicated a significant non-carcinogenic risk level [28].
In the present work, we performed a non-carcinogenic risk assessment of nitrate in source groundwater supplying the drinking water from different parts of Beit Lahia City and the treated water based on the results of nitrate in the major desalination plant units.

2.8. Statistical Analysis

This study used descriptive and inferential statistics. The statistical methods were performed using the SPSS statistics package program (SPSS software, IBM SPSS product version 25), including the independent sample t-test and one-way ANOVA. The independent sample t-test was used to compare the means of the gender groups, while a one-way ANOVA was used to compare the means of the age groups.

3. Results

3.1. Nitrate Levels in Drinking Water

Nitrate levels were measured in 252 water samples from the selected area in Beit Lahia City. The results showed that the range of nitrate concentration in the treated water (drinking water) varied from 10 mg/L to 17 mg/L in the total (n = 126) water samples. In feeding water sources, 97% of groundwater wells exceeded the WHO guidelines (>50 mg/L), and the nitrate concentration in 126 samples ranged from 58.3 mg/L to 178.4 mg/L. The results in Table 3 show that the groundwater contributes much to the nitrate contamination of the drinking water supply.

Risk Assessment Results

Risk assessment is the branch of toxicology that deals with collecting all available data on the toxicity of a chemical and assessing it to determine possible risks [29]. The hazard quotient (HQ) is an extremely useful risk assessment tool, and it is a calculated value for the potential non-carcinogenic health hazard. An HQ value of one or more indicates a non-carcinogenic risk for the exposed population [30]. As shown in Table 4, the highest value of 0.837 represents the risk assessment calculation for drinking water in El-Barka. Regarding groundwater, all the desalination plants have HQ values greater than 1, which represents a significant non-carcinogenic risk level for infants.

3.2. Nitrate Levels in Vegetables

Infant methemoglobinemia has been associated with the consumption of nitrate-rich vegetables and improper handling of homemade vegetable purees [31].
Commission Regulation (EC) No. 1881/2006 of 19 December 2006 [32] sets maximum levels for certain contaminants (nitrates) in food and baby foods for infants and young children of 200 mg/kg. Although vegetables are seldom a source of acute toxicity in adults, they account for about 80% of the nitrates in a typical human diet [33]. Nitrate accumulation in vegetable tissues is influenced by several factors, including genetics, the environment (including atmospheric humidity, substrate water content, temperature, irradiance, and photoperiod), and agricultural practices (nitrogen doses and chemical forms, availability of other nutrients, use of herbicides, etc.) [34].
Fifteen samples of three different vegetable species were analyzed, and the average nitrate concentrations in vegetables are presented in Table 5. Nitrate was detected in at least three vegetable samples. These results were found to follow the ability of the vegetables to accumulate nitrate. Zucchini accumulated the highest amount of nitrate, and potatoes had a maximum average concentration of nitrates at 343.6 mg/kg.

3.3. Prevalence of Methemoglobinemia

To determine the level of methemoglobin, a MetHb ELISA kit was utilized to measure the concentration of methemoglobin. The detection limit for this measurement was 0.003 g/dL. When the MetHb level was between 0.06 and 0.24 g/dL, corresponding to 0.4–1.5% of total Hb, it was considered to be within normal limits [35].
In total, 28 cases of methemoglobinemia were detected in the 87 infants who participated in the study. Of the total cases, 64.28% were male and 35.71% were female. There were no statistically significant differences between the two groups.
The results showed that the percentage of methemoglobin levels increased with age, as shown in Table 6. The age range of six to twelve months displayed a higher incidence of methemoglobinemia, which could be due to potential exposure to vegetables and drinking water during this period. Statistical reports from the Ministry of Health in Gaza demonstrated that 14 cases of methemoglobinemia necessitating hospitalization with accompanying cyanosis symptoms were documented between 2009 and 2021. Over half of the reported cases appeared in Beit Lahia [36].

4. Discussion

Drinking nitrate-contaminated water can cause potential adverse health impacts on the inhabitants; therefore, daily exposure to nitrate should be assessed. Before this study, no records of methemoglobinemia in Beit Lahia City had been documented. At least one region in the Gaza Strip appears to be affected by this health issue among infants. Several risk factors were examined, and high nitrate content in vegetables (>200 mg/kg NO3) was clearly associated with the increased prevalence of methemoglobinemia as well as higher mean levels of MetHb in the blood of infants in the age group from six to twelve months.
The study area TDS (total dissolved solids) was 471 mg/L, which indicates that there is less salinity, and that nitrate is tasteless and odorless. Observation and practice indicate that poor people in this area still drink groundwater with high levels of nitrate of more than 50 mg/L as NO3, causing an increased prevalence of methemoglobinemia. In this study area, no further probable causes of methemoglobinemia were found. As none of the infants had a MetHb level of more than 1.5 g/dL, hereditary methemoglobinemia was also excluded. The results of prescreening revealed that none of the study participants had ever consumed pharmaceutical products (medicines and/or herbs) or common household items that might contain nitrates.
Among infants 3–6 months of age, methemoglobinemia risks were reported by [19], with high MetHb levels associated with 338 infants. Water sources were the primary factor causing high MetHb. They mainly consumed tap water from groundwater (59.5%), followed by treated water (20.4%), and lastly, home-filtered water (11.2%). Among 338 infants with raised MetHb levels, 54.9% were males, and 45.1% were females.
Among 28 infants with high MetHb levels in this study, 64.28% were male, and 35.71% were female. Infant gender did not appear to be significantly correlated in our study, and this was due to, in general, and specifically, in the blood system, there being no physiological differences between males and females at this age. In 2008, researchers [37] conducted a survey to investigate the prevalence of methemoglobinemia in 411 children aged 1–7 years in Morocco. The children were from areas with low- and high-nitrate drinking water, where the water sources were municipal water and well water, respectively. In the high-nitrate area, 78 wells were tested, and nitrate levels ranged from 15 to 247 mg/L, with 69% of wells having nitrate concentrations above 50 mg/L. On the other hand, in the low-nitrate area, the mean nitrate level in municipal water was 2.99 mg/L. The study found that children who drank well water with nitrate concentrations exceeding 50 mg/L were more likely to develop methemoglobinemia than those who drank municipal water.
The data on nitrate levels in vegetables in Palestine are limited. A study in the West Bank, in Tulkarm, presented that the highest nitrate concentration was found in potatoes at 253.13 mg/kg [38]. According to our study, potatoes had the maximum nitrate concentration of 343.6 mg/kg. The average nitrate concentration in zucchini was 275.86 mg/kg. This was the highest among vegetable species. It is higher than 200 mg/kg, the maximum level of nitrate as a contaminant in food and baby foods for infants and young children set by the European Commission. In our study, zucchini had high nitrate levels due to intensive fertilization, high nitrate accumulation rates, or nitrate-contaminated water. The results from a study in Egypt [39] indicated that the mean of nitrate in carrots is (41.3 ± 54.9 mg/kg) and in potatoes, (65.5 ± 60.6 mg/kg), which is lower than the present study findings. Another recent study [40] in India found that the average nitrate in carrots was 50.67 mg/kg fresh weight, and in potatoes, 107.58 mg/kg, which is also lower than our results. By contrast, a higher concentration of nitrate than our findings was detected in Iran by [41]. The mean nitrate contents in carrots and potatoes were 355.88 mg/kg and 341.56 mg/kg), respectively, but the mean nitrate concentration in zucchini was 165.59 mg/kg, which was lower than its nitrate content in this study. Variations in nitrate levels could be caused by differences in weather conditions, soil, fertilizers, and cultivation frequency [42]. Methemoglobinemia caused by the consumption of vegetables is mainly observed in Europe and the Mediterranean region, with certain vegetables such as spinach, beets, and carrots having a high nitrate content [43]. A number of cases of acquired methemoglobinemia have been reported by [30,44,45,46] after feeding infants over 6 months of age vegetable purees made from a combination of potatoes, zucchini, and carrots. The vegetables used in these purees may have had elevated levels of nitrates, which were converted to nitrites due to inadequate preservation methods. Ingesting nitrites can lead to methemoglobinemia [47].
In this study, samples were taken from drinking and groundwater sources, and nitrate levels in these samples were used to calculate HQ values. Based on our results, the HQ values for drinking water (0.26–0.83) and CDI values 0.54–1.33 (mg/kg-d) were higher than those of the study by [9], in which the HQ values for nitrate in infants ranged from 0.02 to 0.13 and CDI 0.03–0.20 (mg/kg-d).
It was found that all drinking water samples did not present a health risk as they had HQ values below 1. Nevertheless, all HQ values from groundwater sources were above the limit. These results are argumentative because groundwater sources are not the primary drinking water sources. However, groundwater does provide some of the drinking water. A recent study conducted by [48] stated that Beit Lahia residents are highly vulnerable to health risks. This is because there is a lack of awareness about the quality of water people drink, including whether or not it is drinkable. Thus, further studies should be designed to evince the possible health hazard risks more clearly.

5. Conclusions

Accurately determining nitrate levels in water is important to assess the contribution of water and food to nitrate intake in humans. This study highlights the importance of addressing nitrate contamination to protect human health and the environment. Based on the study results, there is no prevalence of methemoglobinemia in infants under six months in the study area because drinking water is the main source of intake, and nitrate concentrations are lower than 50 mg/L. On the other hand, methemoglobinemia is common in infants aged 6–12 months due to contaminated drinking water and vegetables high in nitrate. Finally, the study suggests that desalination plants in the region should be monitored to ensure that the nitrate levels in the water do not exceed WHO guidelines. Additionally, efforts should be made to promote safe farming practices and reduce the use of fertilizers containing nitrates to prevent the further contamination of vegetables. These results can be employed as background information on nitrate pollution by researchers and stakeholders to improve the quality of groundwater in areas susceptible to nitrate pollution.

Author Contributions

Conceptualization, J.S. and S.S.; methodology, J.S.; validation, S.S., K.A. and J.S.; formal analysis, K.A.; investigation, K.K.; resources, J.S.; data curation, H.A.-N.; writing—original draft preparation, J.S.; writing—review and editing, S.S and K.K.; supervision, S.S.; project administration, J.S. All authors have read and agreed to the published version of the manuscript.

Funding

This study received no external funding.

Institutional Review Board Statement

The study was conducted in accordance with the Declaration of Helsinki and approved by the Palestinian Helsinki Committee (No: PHRC/HC/1018/21, Date: 13 December 2021).

Informed Consent Statement

Informed consent was obtained from all subjects involved in the study.

Data Availability Statement

The data presented in this study are available on request from the corresponding author. The data are not publicly available due to ethical restrictions.

Conflicts of Interest

The authors declare no conflict of interest.

References

  1. Sachs, J.; Kroll, C.; Lafortune, G.; Fuller, G.; Woelm, F. Sustainable Development Report 2022; Cambridge University Press: Cambridge, UK, 2022; ISBN 978-1-00-921008-9. [Google Scholar]
  2. Ward, M.; Jones, R.; Brender, J.; de Kok, T.; Weyer, P.; Nolan, B.; Villanueva, C.; van Breda, S. Drinking Water Nitrate and Human Health: An Updated Review. Int. J. Environ. Res. Public Health 2018, 15, 1557. [Google Scholar] [CrossRef] [PubMed]
  3. Picetti, R.; Deeney, M.; Pastorino, S.; Miller, M.R.; Shah, A.; Leon, D.A.; Dangour, A.D.; Green, R. Nitrate and Nitrite Contamination in Drinking Water and Cancer Risk: A Systematic Review with Meta-Analysis. Environ. Res. 2022, 210, 112988. [Google Scholar] [CrossRef]
  4. Ranasinghe, R.; Marapana, R. Nitrate and Nitrite Content of Vegetables: A Review. J. Pharmacogn. Phytochem. 2018, 7, 322–328. [Google Scholar]
  5. van den Brand, A.D.; Beukers, M.; Niekerk, M.; van Donkersgoed, G.; van der Aa, M.; van de Ven, B.; Bulder, A.; van der Voet, H.; Sprong, C.R. Assessment of the Combined Nitrate and Nitrite Exposure from Food and Drinking Water: Application of Uncertainty around the Nitrate to Nitrite Conversion Factor. Food Addit. Contam. Part A 2020, 37, 568–582. [Google Scholar] [CrossRef] [PubMed]
  6. World Health Organization. Nitrate and Nitrite in Drinking-Water: Background Document for Development of WHO Guidelines for Drinking-Water Quality; World Health Organization: Geneva, Switzerland, 2003. [Google Scholar]
  7. Aires, A.; Carvalho, R.; Rosa, E.A.S.; Saavedra, M.J. Effects of Agriculture Production Systems on Nitrate and Nitrite Accumulation on Baby-leaf Salads. Food Sci. Nutr. 2013, 1, 3–7. [Google Scholar] [CrossRef] [PubMed]
  8. Wagh, V.M.; Panaskar, D.B.; Mukate, S.V.; Aamalawar, M.L.; Laxman Sahu, U. Nitrate Associated Health Risks from Groundwater of Kadava River Basin Nashik, Maharashtra, India. Hum. Ecol. Risk Assess. Int. J. 2020, 26, 654–672. [Google Scholar] [CrossRef]
  9. Golaki, M.; Azhdarpoor, A.; Mohamadpour, A.; Derakhshan, Z.; Conti, G.O. Health Risk Assessment and Spatial Distribution of Nitrate, Nitrite, Fluoride, and Coliform Contaminants in Drinking Water Resources of Kazerun, Iran. Environ. Res. 2022, 203, 111850. [Google Scholar] [CrossRef]
  10. Karunanidhi, D.; Aravinthasamy, P.; Subramani, T.; Kumar, M. Human Health Risks associated with Multipath Exposure of Groundwater Nitrate and Environmental Friendly Actions for Quality Improvement and Sustainable Management: A Case Study from Texvalley (Tiruppur Region) of India. Chemosphere 2021, 265, 129083. [Google Scholar] [CrossRef] [PubMed]
  11. Venkatesan, G.; Subramani, T.; Sathya, U.; Roy, P.D. Seasonal Changes in Groundwater Composition in an Industrial Center of South India and Quality Evaluation for Consumption and Health Risk Using Geospatial Methods. Geochemistry 2020, 80, 125651. [Google Scholar] [CrossRef]
  12. Ludlow, J.T.; Wilkerson, R.G.; Nappe, T.M. Methemoglobinemia. In StatPearls; StatPearls Publishing: Treasure Island, FL, USA, 2022. [Google Scholar]
  13. Maran, J.; Guan, Y.; Ou, C.-N.; Prchal, J.T. Heterogeneity of the Molecular Biology of Methemoglobinemia: A Study of Eight Consecutive Patients. Haematologica 2005, 90, 687–689. [Google Scholar] [CrossRef] [PubMed]
  14. Fossen Johnson, S. Methemoglobinemia: Infants at Risk. Curr. Probl. Pediatr. Adolesc. Health Care 2019, 49, 57–67. [Google Scholar] [CrossRef] [PubMed]
  15. Goldman, J. Hematology: Basic Principles and Practice. Bone Marrow Transplant. 2013, 48, 1144. [Google Scholar] [CrossRef]
  16. Shomar, B. Retraction Note: Groundwater Contaminations and Health Perspectives in Developing World Case Study: Gaza Strip. Environ. Geochem. Health 2012, 34, 151. [Google Scholar] [CrossRef] [PubMed]
  17. Al-Najar, H.; Al-Dalou, F.; Snounu, I.; Al-Dadah, J. Framework Analysis of Socio-Economic and Health Aspects of Nitrate Pollution from Urban Agricultural Practices: The Gaza Strip as a Case Study. J. Agric. Environ. Sci. 2014, 3, 355–370. [Google Scholar]
  18. Qrenawi, L.I.; Shomar, R.A. Health Risk Assessment of Groundwater Contamination Case Study: Gaza Strip. J. Eng. Res. Technol. 2020, 7. [Google Scholar] [CrossRef]
  19. Palestinian Central Bureau of Statistics-PCBS. Preliminary Results of the Population, Housing and Establishments Census 2017; Palestinian Central Bureau of Statistics-PCBS: Ramallah, Palestine, 2018. [Google Scholar]
  20. Water Resources Directorate. 2020 Water Resources Status Summary Report/Gaza Strip; Unpublished Report; Water Resources Directorate: Ramallah, Palestine, 2021. [Google Scholar]
  21. Baird, R.; Eaton, A.D.; Rice, E.W.; Bridgewater, L. (Eds.) Standard Methods for the Examination of Water and Wastewater, 23rd ed.; American Public Health Association: Washington, DC, USA, 2017; ISBN 978-0-87553-287-5. [Google Scholar]
  22. Cataldo, D.A.; Maroon, M.; Schrader, L.E.; Youngs, V.L. Rapid Colorimetric Determination of Nitrate in Plant Tissue by Nitration of Salicylic Acid. Commun. Soil Sci. Plant Anal. 1975, 6, 71–80. [Google Scholar] [CrossRef]
  23. Statement on Possible Public Health Risks for Infants and Young Children from the Presence of Nitrates in Leafy Vegetables|EFSA. Available online: https://www.efsa.europa.eu/en/efsajournal/pub/1935 (accessed on 17 February 2023).
  24. Qasemi, M.; Afsharnia, M.; Farhang, M.; Bakhshizadeh, A.; Allahdadi, M.; Zarei, A. Health Risk Assessment of Nitrate Exposure in Groundwater of Rural Areas of Gonabad and Bajestan, Iran. Environ. Earth Sci. 2018, 77, 551. [Google Scholar] [CrossRef]
  25. US EPA. Conducting a Human Health Risk Assessment. Available online: https://www.epa.gov/risk/conducting-human-health-risk-assessment (accessed on 17 February 2023).
  26. Assessment, U.E.N.C. for ENitrate CASRN 14797-55-8|IRIS|US EPA, ORD. Available online: https://iris.epa.gov/ChemicalLanding/&substance_nmbr=76 (accessed on 17 February 2023).
  27. Rezaei, H.; Jafari, A.; Kamarehie, B.; Fakhri, Y.; Ghaderpoury, A.; Karami, M.A.; Ghaderpoori, M.; Shams, M.; Bidarpoor, F.; Salimi, M. Health-Risk Assessment Related to the Fluoride, Nitrate, and Nitrite in the Drinking Water in the Sanandaj, Kurdistan County, Iran. Hum. Ecol. Risk Assess. Int. J. 2019, 25, 1242–1250. [Google Scholar] [CrossRef]
  28. Module Three—Lecture Notes|Toxicology Curriculum for Communities Trainer’s Manual|ATSDR. Available online: https://www.atsdr.cdc.gov/training/toxmanual/modules/3/lecturenotes.html (accessed on 21 February 2023).
  29. Calculating Hazard Quotients and Cancer Risk Estimates. Available online: https://www.atsdr.cdc.gov/pha-guidance/conducting_scientific_evaluations/epcs_and_exposure_calculations/hazardquotients_cancerrisk.html (accessed on 21 February 2023).
  30. Sanchez-Echaniz, J.; Benito-Fernández, J.; Mintegui-Raso, S. Methemoglobinemia and Consumption of Vegetables in Infants. Pediatrics 2001, 107, 1024–1028. [Google Scholar] [CrossRef]
  31. Commission Regulation (EC) No.1881/2006 Setting Maximum Levels for Certain Contaminants in Foodstuffs. UNEP Law and Environment Assistance Platform. Available online: https://leap.unep.org/countries/eu/national-legislation/commission-regulation-ec-no-18812006-setting-maximum-levels (accessed on 17 February 2023).
  32. Hord, N.G.; Ghannam, J.S.; Garg, H.K.; Berens, P.D.; Bryan, N.S. Nitrate and Nitrite Content of Human, Formula, Bovine, and Soy Milks: Implications for Dietary Nitrite and Nitrate Recommendations. Breastfeed. Med. 2011, 6, 393–399. [Google Scholar] [CrossRef]
  33. Colla, G.; Kim, H.-J.; Kyriacou, M.C.; Rouphael, Y. Nitrate in Fruits and Vegetables. Sci. Hortic. 2018, 237, 221–238. [Google Scholar] [CrossRef]
  34. Pagana, K.D. 1952—Mosby’s Diagnostic and Laboratory Test Reference, 7th ed.; Elsevier Mosby: St. Louis, MO, USA, 2005. [Google Scholar]
  35. Palestinian Ministry of Health. Hospital Reports; Unpublished Report; Palestinian Ministry of Health: Ramallah, Palestine, 2022. [Google Scholar]
  36. Abu Naser, A.A.; Ghbn, N.; Khoudary, R. Relation of Nitrate Contamination of Groundwater with Methemoglobin Level among Infants in Gaza. EMHJ—East. Mediterr. Health J. 2007, 13, 994–1004. [Google Scholar] [CrossRef] [PubMed]
  37. Sadeq, M.; Moe, C.L.; Attarassi, B.; Cherkaoui, I.; ElAouad, R.; Idrissi, L. Drinking Water Nitrate and Prevalence of Methemoglobinemia among Infants and Children Aged 1–7 Years in Moroccan Areas. Int. J. Hyg. Environ. Health 2008, 211, 546–554. [Google Scholar] [CrossRef]
  38. Abu-Dayeh, A.G.H. Determination of Nitrate and Nitrite Content in Several Vegetables in Tulkarm District. 2007. Available online: https://hdl.handle.net/20.500.11888/7664 (accessed on 10 April 2023).
  39. Sebaei, A.S.; Refai, H.M. Hazard Index: Probabilistic Risk Exposure of Nitrate and Nitrite in Egyptian Fruits and Vegetables. Int. J. Environ. Anal. Chem. 2021, 101, 1477–1484. [Google Scholar] [CrossRef]
  40. Taneja, P.; Labhasetwar, P.; Nagarnaik, P. Nitrate in Drinking Water and Vegetables: Intake and Risk Assessment in Rural and Urban Areas of Nagpur and Bhandara Districts of India. Environ. Sci. Pollut. Res. 2019, 26, 2026–2037. [Google Scholar] [CrossRef]
  41. Zendehbad, M.; Mostaghelchi, M.; Mojganfar, M.; Cepuder, P.; Loiskandl, W. Nitrate in Groundwater and Agricultural Products: Intake and Risk Assessment in Northeastern Iran. Environ. Sci. Pollut. Res. 2022, 29, 78603–78619. [Google Scholar] [CrossRef]
  42. Salehzadeh, H.; Maleki, A.; Rezaee, R.; Shahmoradi, B.; Ponnet, K. The Nitrate Content of Fresh and Cooked Vegetables and Their Health-Related Risks. PLoS ONE 2020, 15, e0227551. [Google Scholar] [CrossRef]
  43. McNulty, R.; Kuchi, N.; Xu, E.; Gunja, N. Food-induced Methemoglobinemia: A Systematic Review. J. Food Sci. 2022, 87, 1423–1448. [Google Scholar] [CrossRef]
  44. Cannata, G.; Abate, L.; Scarabello, C.; Rubini, M.; Giacometti, A.; Principi, N.; Esposito, S.; Dodi, I. The Dose Makes the Poison: A Case Report of Acquired Methemoglobinemia. Int. J. Environ. Res. Public Health 2020, 17, 1845. [Google Scholar] [CrossRef]
  45. Savino, F.; Maccario, S.; Guidi, C.; Castagno, E.; Farinasso, D.; Cresi, F.; Silvestro, L.; Mussa, G.C. Methemoglobinemia Caused by the Ingestion of Courgette Soup Given in Order to Resolve Constipation in Two Formula-Fed Infants. Ann. Nutr. Metab. 2006, 50, 368–371. [Google Scholar] [CrossRef]
  46. Murone, A.-J.B.; Stucki, P.; Roback, M.G.; Gehri, M. Severe Methemoglobinemia Due to Food Intoxication in Infants. Pediatr. Emerg. Care 2005, 21, 536–538. [Google Scholar] [CrossRef] [PubMed]
  47. Chan, T.Y.K. Vegetable-Borne Nitrate and Nitrite and the Risk of Methemoglobinemia. Toxicol. Lett. 2011, 200, 107–108. [Google Scholar] [CrossRef] [PubMed]
  48. Shomar, R.T.A.; Qrenawi, L.I. Mapping Potential Health Risk Vulnerability in Relation to Nitrate Pollution of Water in Gaza, Palestine. Res. Sq. 2022, in review. [Google Scholar] [CrossRef]
Figure 1. (a) Location of Beit Lahia in the Gaza Strip, (b) Nitrate concentration distribution in groundwater in the Gaza Strip, and (c) Regions of Beit Lahia City (Source: Beit Lahia Municipality GIS Sector, Borders of Beit Lahia City, Beit Lahia Municipality, Gaza, (2023)).
Water 15 01989 g001
Table 1. Characteristics of the study populations in Beit Lahia City, Gaza Strip.
VariableCategoryNPercent
%
Significance
p-Value 1
GenderMale5158.60.496
Female3641.4
Age group (month)1 month33.40.798
2 months22.3
3 months78
6 months2124.1
6–12 months5462.1
LocationAl-Shaimaa health center4147.2
Al-Atatra health center4652.8
1 Gender and group differences were tested by using an independent sample t-test and one-way ANOVA depending on data distribution.
Table 2. Selected desalination plant unit details (Beit Lahia City).
Desalination Plant UnitProduction (m3/h)Local CoordinationNitrate Concentration (mg/L)
XYInOut
El-barka12.6103,994105,111144.016.7
El-weam4.8103,994105,738100.27.2
Aladham8.4104,753106,103169.46.8
Alzaeem12.6102,872106,124100.610.2
Dar al-salam5.4101,818107,255161.95.2
El-neama11.1100,429106,892180.612.7
Table 3. The concentration of nitrate in desalination plants in Beit Lahia City.
Desalination Plant UnitExamined WaterMinimum (mg/L)Maximum (mg/L)X ± 2SD (95%)
El-BarkaFeeding water20.6199.00144.75 ± 49.02
Treated water123.7016.47 ± 7.38
El-weamFeeding water66.5143.60100.25 ±21.08
Treated water010.007.29 ± 2.60
AladhamFeeding water136.3209.00 169.4± 18.24
Treated water09.606.87 ± 2.53
AlzaeemFeeding water9.0132.80100.66 ± 32.83
Treated water017.0010.24 ± 4.21
Dar al-salamFeeding water123.7182.00161.94 ± 16.83
Treated water011.905.22 ± 2.72
El-neamaFeeding water145.0323.30180.60 ± 46.61
Treated water016.2312.75 ± 4.86
Table 4. Chronic daily intake (CDI) and health quotient (HQ) for water following US EPA for infants.
Desalination PlantsDrinking WaterGroundwater
CDIHQCDIHQ
El-Barka1.33920.837011.58007.2375
El-weam0.58320.36458.02005.0125
Aladham0.54960.343513.55528.4720
Alzaeem0.81920.51208.05285.0330
Dar al-salam0.41760.261012.95528.0970
El-neama1.02000.63753.72882.3305
Table 5. Concentration of nitrate in vegetables.
NO3 mg/kg Fresh Weight
Vegetable (n = 15)MinimumMaximumAverage Std Dev.
Carrot204.0298.6237.20 ± 53.23
Potatoes175.6343.6246.80 ± 81.42
Zucchini177.1327.5275.86 ± 58.87
Table 6. Methemoglobin levels (MetHb) of the study infants.
Infants Age (Months)Total (n = 87)
Maximum < 1.5%Methemoglobin Level > 1.5%
%N%N
0–12.321.11
1–22.320.00
2–33.434.64
3–618.4165.75
6–1241.43620.718
Total67.85932.228
Disclaimer/Publisher’s Note: The statements, opinions and data contained in all publications are solely those of the individual author(s) and contributor(s) and not of MDPI and/or the editor(s). MDPI and/or the editor(s) disclaim responsibility for any injury to people or property resulting from any ideas, methods, instructions or products referred to in the content.

