Article

Recent Changes in Composition and Distribution Patterns of Summer Mesozooplankton off the Western Antarctic Peninsula

by
Valentina V. Kasyan
Laboratory of Systematics and Morphology, A.V. Zhirmunsky National Scientific Center of Marine Biology, Far Eastern Branch, Russian Academy of Sciences (NSCMB FEB RAS), 690041 Vladivostok, Russia
Water 2023, 15(10), 1948; https://doi.org/10.3390/w15101948
Submission received: 19 April 2023 / Revised: 13 May 2023 / Accepted: 19 May 2023 / Published: 21 May 2023

Abstract

:
The Southern Ocean has undergone significant climate-related changes in recent decades. As a result, pelagic communities inhabiting these waters, particularly mesozooplankton, have adapted to new conditions. The present study considers the patterns of horizontal and vertical (up to 1000 m) distribution, the composition, abundance, and biomass of mesozooplankton, and the relationships of these parameters to the extreme environmental conditions off the western Antarctic Peninsula throughout the record-warm austral summer season of 2022. Sampling was conducted using the opening/closing Multinet system (0.25 m2 aperture) equipped with five 150-μm mesh nets and a WP-2 net. The mesozooplankton was represented by the three most abundant groups: eggs and larvae of euphausiids such as Euphausia superba, small copepods such as Oithona similis, and large calanoid copepods such as Calanoides acutus, Calanus propinquus, Metridia gerlachei, and Rhincalanus gigas. The composition and quantitative distribution of the mesozooplankton significantly varied: the copepods were abundant in the west, off the Antarctic Peninsula, while eggs and larvae of euphausiids were abundant in the east, off the South Orkney Islands. Most mesozooplankton occurred in the upper 200 m layer, and each taxon showed characteristic depth preference: small copepods, euphausiids larvae, and cirripeds cypris larvae were abundant in the epipelagic layer, while large calanoid copepods, euphausiids eggs, amphipods, pelagic polychaetes, and ostracods were found mostly in the mesopelagic layer. The composition and quantitative distribution of mesozooplankton had clear relationships with environmental factors, particularly with a combination of variables such as water salinity, temperature, and chlorophyll a concentration.

1. Introduction

The condition of Antarctic marine ecosystems has recently attracted major attention from scientists, the public, nature conservation activists, and authorities alarmed by the dramatic ecosystem shifts that took place in the region under the effect of global climate change associated with warming and increasing anthropogenic pressure [1,2,3,4]. In the West Antarctic sector of the Southern Ocean, climate change has caused the following consequences over the past few decades: an increase in sea surface temperature (SST) of up to 0.2 °C per decade, with projections indicating further extensive increase at a rate of 0.27–1.08 °C per decade that may occur by the late 21st century [5,6,7], a reduction in sea-ice cover near the Antarctic Peninsula [8,9], and significant interannual variations in chlorophyll a (Chl a) concentrations [10]. Some significant changes in the plankton communities were reported previously, including replacement of dominant phytoplankton species by others [11,12,13], variations in the dominance and abundance of taxonomic groups of zooplankton, in particular copepods [14,15,16,17,18,19,20], variations in the abundance, biomass, and spatial distribution of the pelagic tunicate Salpa thompsoni [21,22], krill Euphausia superba [23,24,25,26], and krill larvae [18,27,28,29]. Such changes might be either part of a natural ecosystem mechanism [30,31] or a negative trend that caused communities to adapt to new habitat conditions [15,32,33].
Recent studies in the Southern Ocean have focused on the most important zooplankton taxa such as krill, salps, and copepods that constitute the largest portion of the total abundance and biomass [15,17,21,34]. These taxa form the major food supply in the food web between primary producers and predators and are used as a commercially valuable source of marine-derived animal protein [14,35,36,37]. To date, the distribution patterns, life cycles, and interannual variability of the most common zooplanktonic species in the Antarctic marine ecosystems have been sufficiently well studied [33,38]. Nevertheless, Antarctica requires continuous scientific research in order to identify emerging trends and provide predictions. Annual surveys of zooplanktonic communities will help timely identify the responses of Antarctic marine ecosystems to the ongoing climate changes.
Previously, data on the mesozooplankton together with the other plankton categories (phytoplankton, macroplankton, and ichthyoplankton) were obtained as preliminary results, e.g., [20,29]; in the present study, we provide more details and carried out additional analyses.
We hypothesize that the mesozooplankton communities in the Southern Ocean have changed habitat conditions in these ecosystems. The main objectives of this study were as follows: update existing information on the summer mesozooplankton composition, abundance, biomass, and distribution patterns during the record-warm SSTs [9]; study the vertical distribution patterns of the dominant taxa to a 1000 m depth; and identify the environmental factors having no/having effects on the composition and distribution of mesozooplankton in the study region.

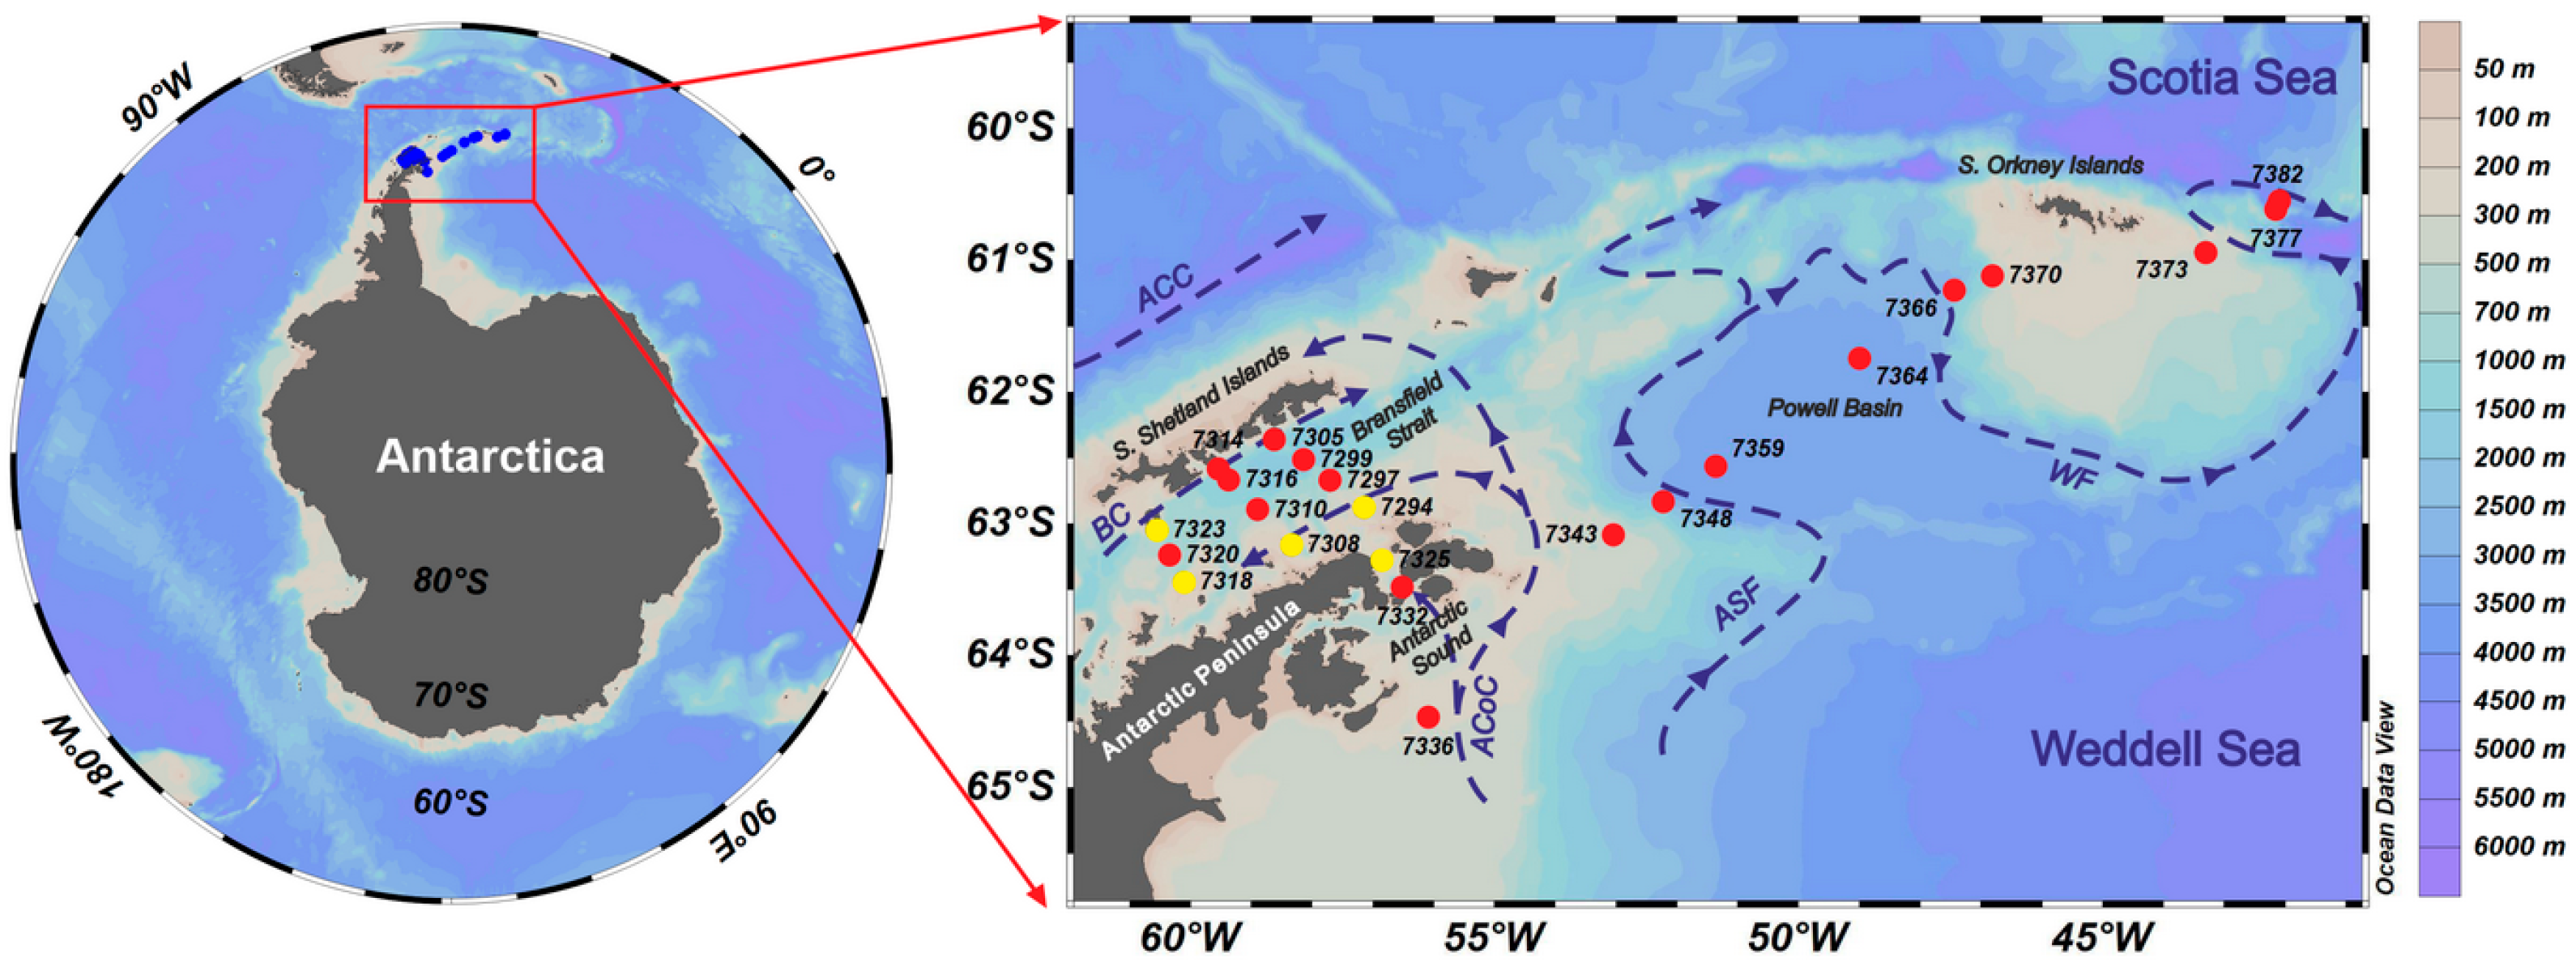
2. Materials and Methods

Plankton samples were collected in the research expedition on board the R/V Akademik Mstislav Keldysh during a period from 19 January to 10 February (austral summer), 2022. The study region included the Bransfield Strait, the Antarctic Sound, the Powell Basin of the Weddell Sea, and off the South Orkney Islands (Figure 1). Sampling was performed using an opening/closing Multinet system (150-μm mesh, 0.25 m2 aperture) equipped with five nets [39]. Vertical tows of the nets from 1000 (800) m to 500, 500–200, 200–100, 100–50, and 50–0 m were made at night. In addition, at near-shore stations (depths < 200 m) sampling was carried out with a WP-2 net (150 μm mesh, 0.25 m2 aperture) [40]. A total of 117 plankton samples were collected and processed. The samples delivered to the laboratory were viewed in a Bogorov’s chamber under a SZX7 binocular microscope (Olympus, Tokyo, Japan), and then fixed in a 4% formaldehyde solution. The mesozooplankton taxa were identified using the relevant identification keys [41,42]. Copepods and euphausiids larvae (such as the krill E. superba) at different development stages, as the dominant groups of mesozooplankton, were subjected to more detailed taxonomic analysis using the Marine Planktonic Copepods database [43] and special identification keys [44,45], respectively. Copepods were identified into species; morphologically indistinguishable small copepodites from some genera were grouped together (such as Oithona spp. and Oncaea spp.). The taxonomic groups (Appendicularia, Ctenophora, Echinodermata, Hydromedusae, Polychaeta, Pteropoda, Siphonophorae, eggs, and larvae of fish) that were represented at sampling stations by less than 5% of the total mesozooplankton abundance were categorized as “Other”. Abundance (expressed in terms of ind. m−3) and biomass (expressed in terms of mg wet weight (WW) m−3) of mesozooplankton were calculated by the standard hydrobiological methods according to [46,47]. The environmental parameters such as water temperature (T, °C), salinity (S, psu), dissolved oxygen (O2, mg/L), and chlorophyll a (Chl a, µg/L) concentrations at the stations were measured using a CTD multiparameter probe (Idronaut, Italy) with a calibrated fluorometer (Seapoint Sensors Inc., Exeter, NH, USA) [20]. The data of water temperature, salinity, oxygen, and Chl a concentrations between the 500 and 1000 m layers were not significantly different and, therefore, we here provide values of the environmental variables for the 500 m layer.

Statistical Analysis

We hypothesized that the environmental variables such as water temperature, salinity, oxygen, and chlorophyll a concentrations at the surface (upper 50 m depth) and in the 50–200 and 200–500 m layers may be key factors that determine distribution patterns of mesozooplankton communities in the study region. To assess the similarity between the mesozooplankton communities in the study region, cluster analysis and non-metric multidimensional scaling (nMDS) were used [51]. The Bray–Curtis similarity was calculated as a log10 (x + 1) transformation of the species/taxa abundance [52]. Cluster analysis was applied through average group sorting. To assess the reliability of clustering, the SIMPROF (Similarity Profile Routine) permutation test (number of repeats 999, p = 0.05) was performed [51]. The SIMPER (Similarity Percentage) procedure was used to assess the average percent contribution of each mesozooplankton species to the overall dissimilarities, the contribution of each species to the average intra-group similarity (SIM) with the standard deviation (SD), and the contribution of each species to the average between-group dissimilarity (DISS/SD) [53].
The relationships between the species/taxa abundances and the environmental variables at different layers of the water column were assessed using Spearman’s rank order correlation [53]. The BEST analysis (BIO-ENV algorithm) was used to test relationships between the environmental variables and the biological data (abundance) which best explain the observed patterns of mesozooplankton distribution. Environmental variables were log-transformed, normalized (divided by SD), and calculated for Euclidean distances [53]. To determine the significance of relationships between the similarity matrices (biological data and environmental variables), the RELATE test was used [53]. Additionally, the Canonical Correspondence analysis (CCA) was carried out to reveal the environmental variables that determine the distribution of mesozooplankton communities [53]. Multivariate analyses were performed in the PRIMER ver. 6 [54] and PAST ver. 4 [55] software. The map of the sampling stations was composed using Ocean Data View ver. 5 [56].

3. Results

3.1. Dynamics of Environmental Conditions

The detailed dynamics of some environmental variables and the pattern of main currents in the study region were described earlier elsewhere [20,26,29,57,58,59,60]. During the summer of 2022, the average values of the environmental variables at the sampling stations were as follows: water temperature, −0.02 ± 0.70 °C; water salinity, 34.56 ± 0.15 psu; oxygen concentration, 8.84 ± 1.46 mg/L; and chlorophyll a concentration, 0.30 ± 0.62 µg/L. The highest values of temperature were recorded from off the South Orkney Islands and from the Bransfield Strait off the South Shetland Islands; the lowest values, from the Antarctic Sound and off the Antarctic Peninsula, where one extreme temperature minimum (Stn. 7336) was recorded (Figure 2a). The highest salinity values were recorded from the Bransfield Strait off the South Shetland Islands and the Powell Basin; the extreme lowest values, were off the Antarctic Peninsula (Figure 2b). The average values of the water temperature and salinity variables increased from off the Antarctic Peninsula to off the South Orkney Islands, except for the decreasing sea surface salinity and temperature in the 200 m layer (Table 1). The highest values of oxygen concentrations (>10 mg/L) were recorded at most stations; they decreased by half at the greatest depth (Figure 2c). The highest chlorophyll a concentrations were observed in the Antarctic Sound, Powell Basin, and off the South Orkney Islands, with extreme values at Stn. 7336 off the Antarctic Peninsula (Figure 2d). The average values of oxygen and chlorophyll a concentrations decreased from off the Antarctic Peninsula to off the South Orkney Islands, except for the increasing surface Chl a concentration (Table 1).

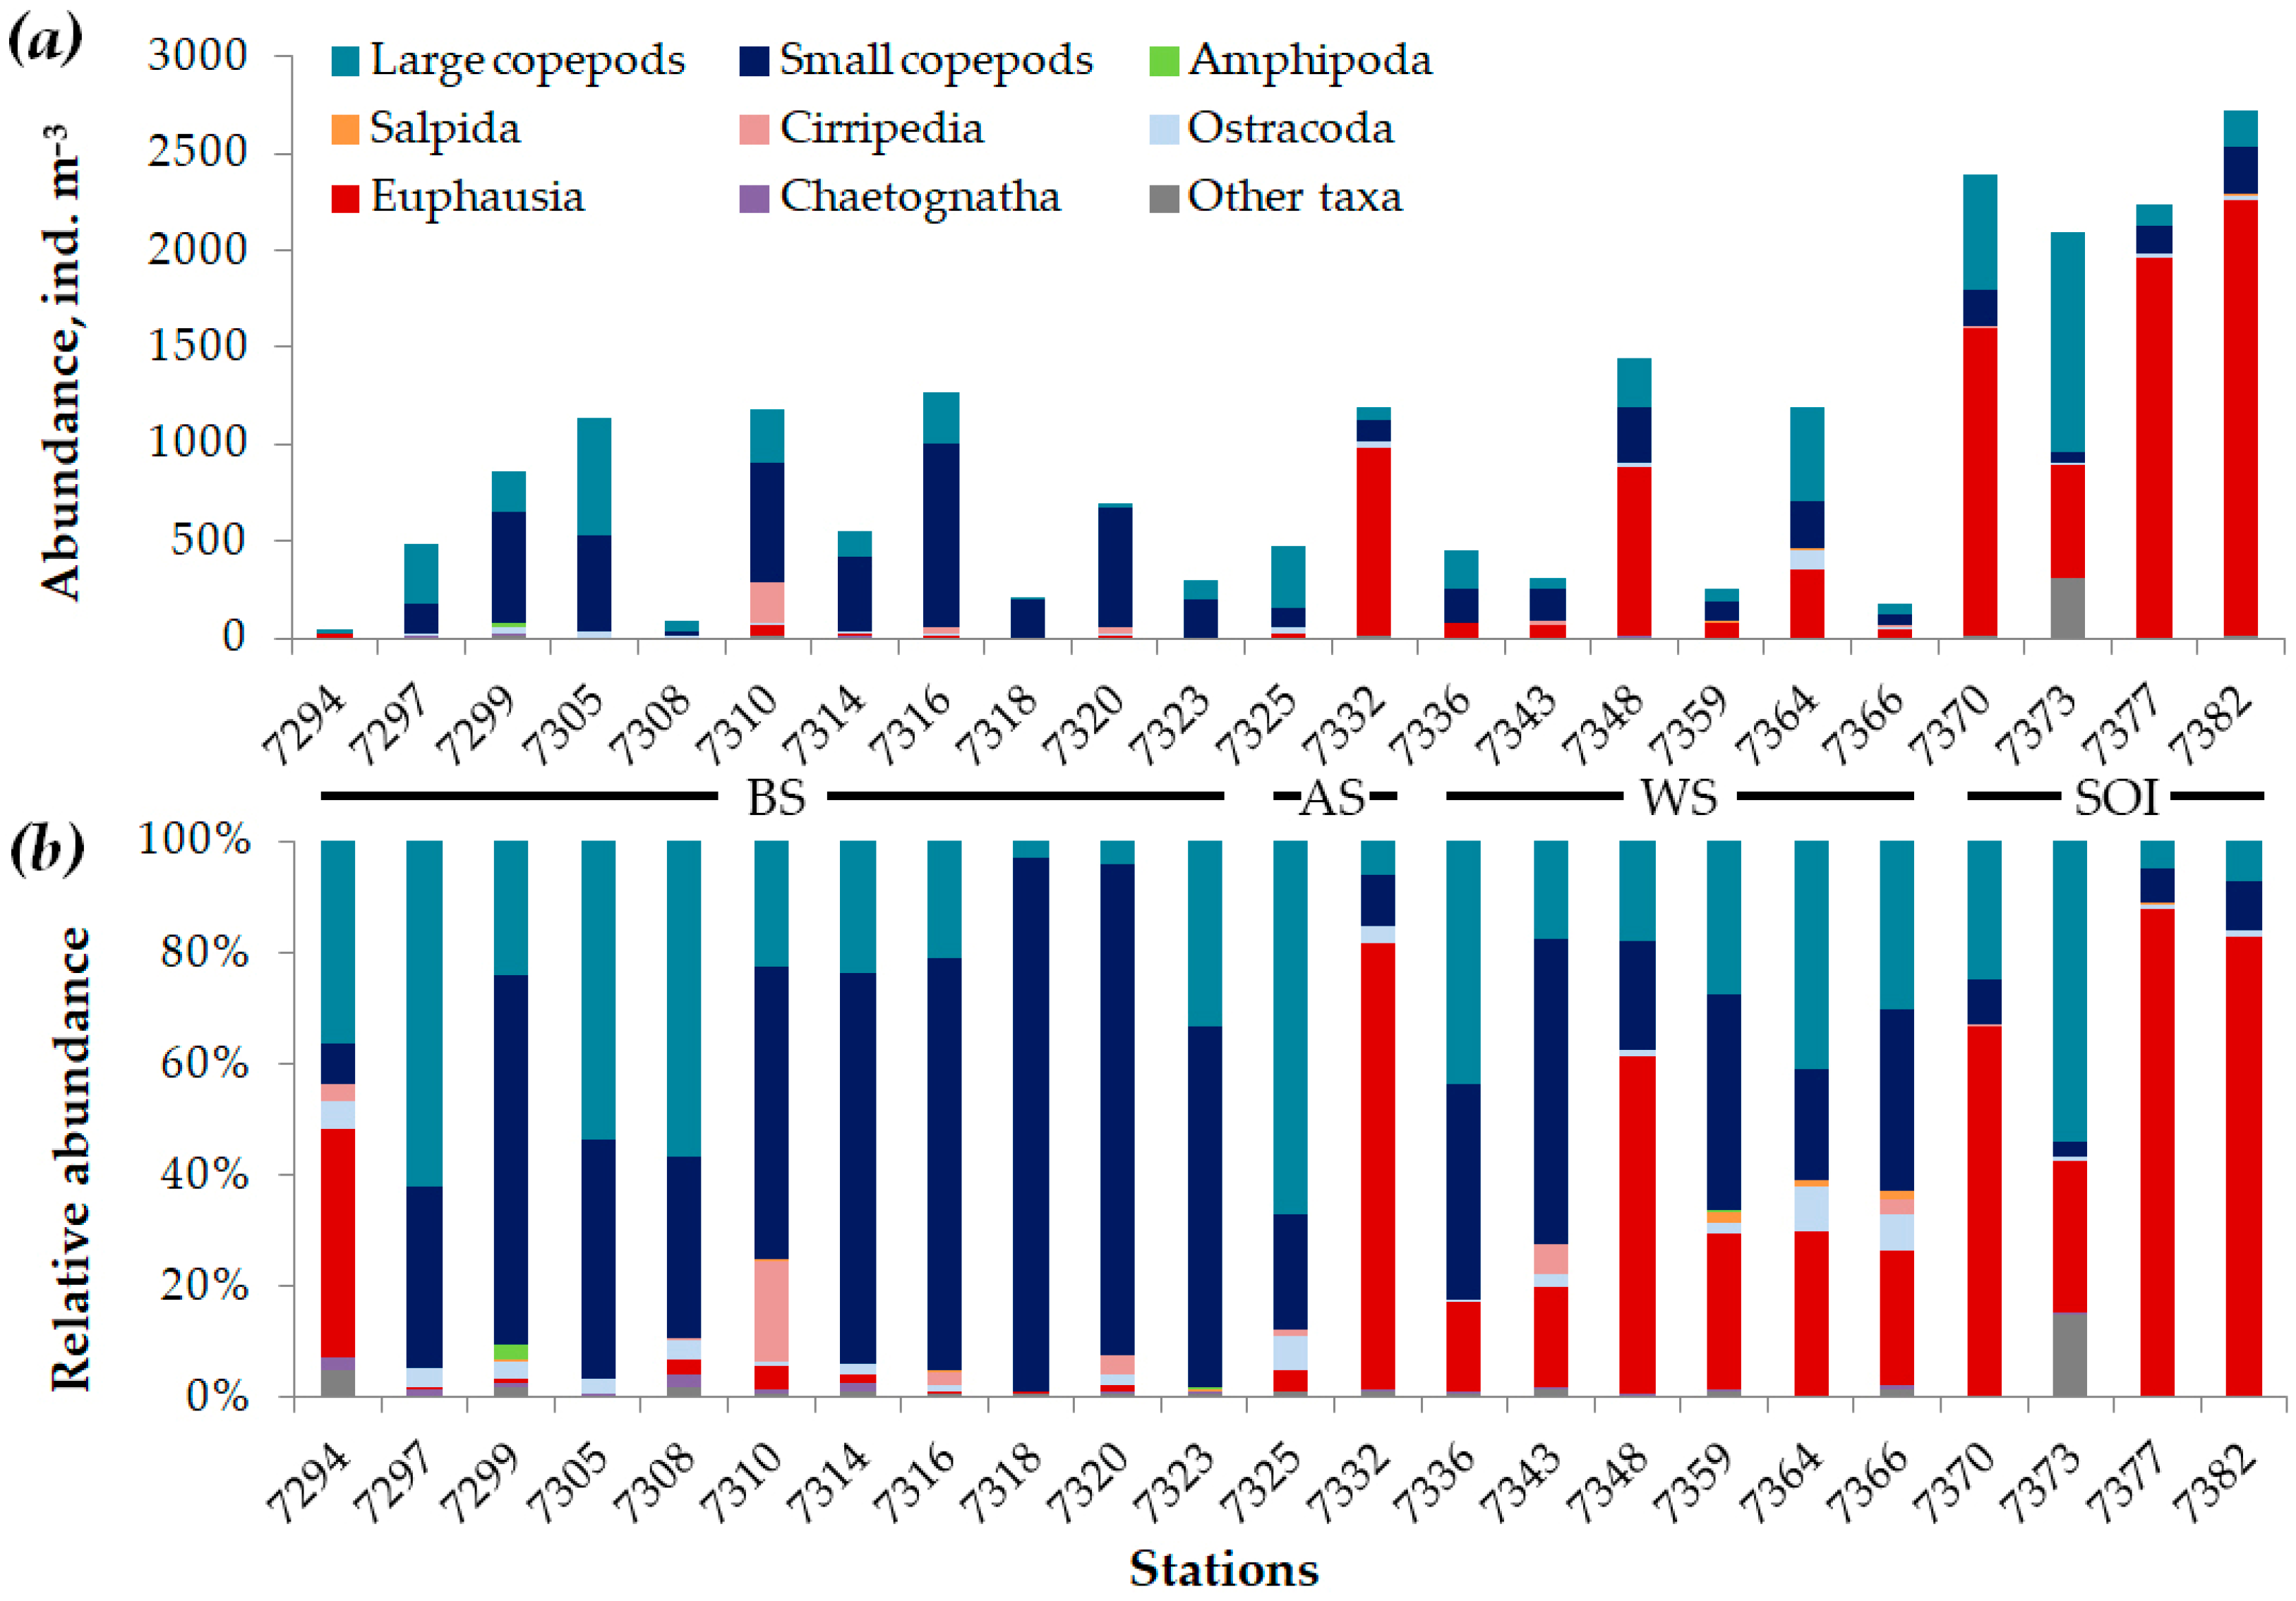
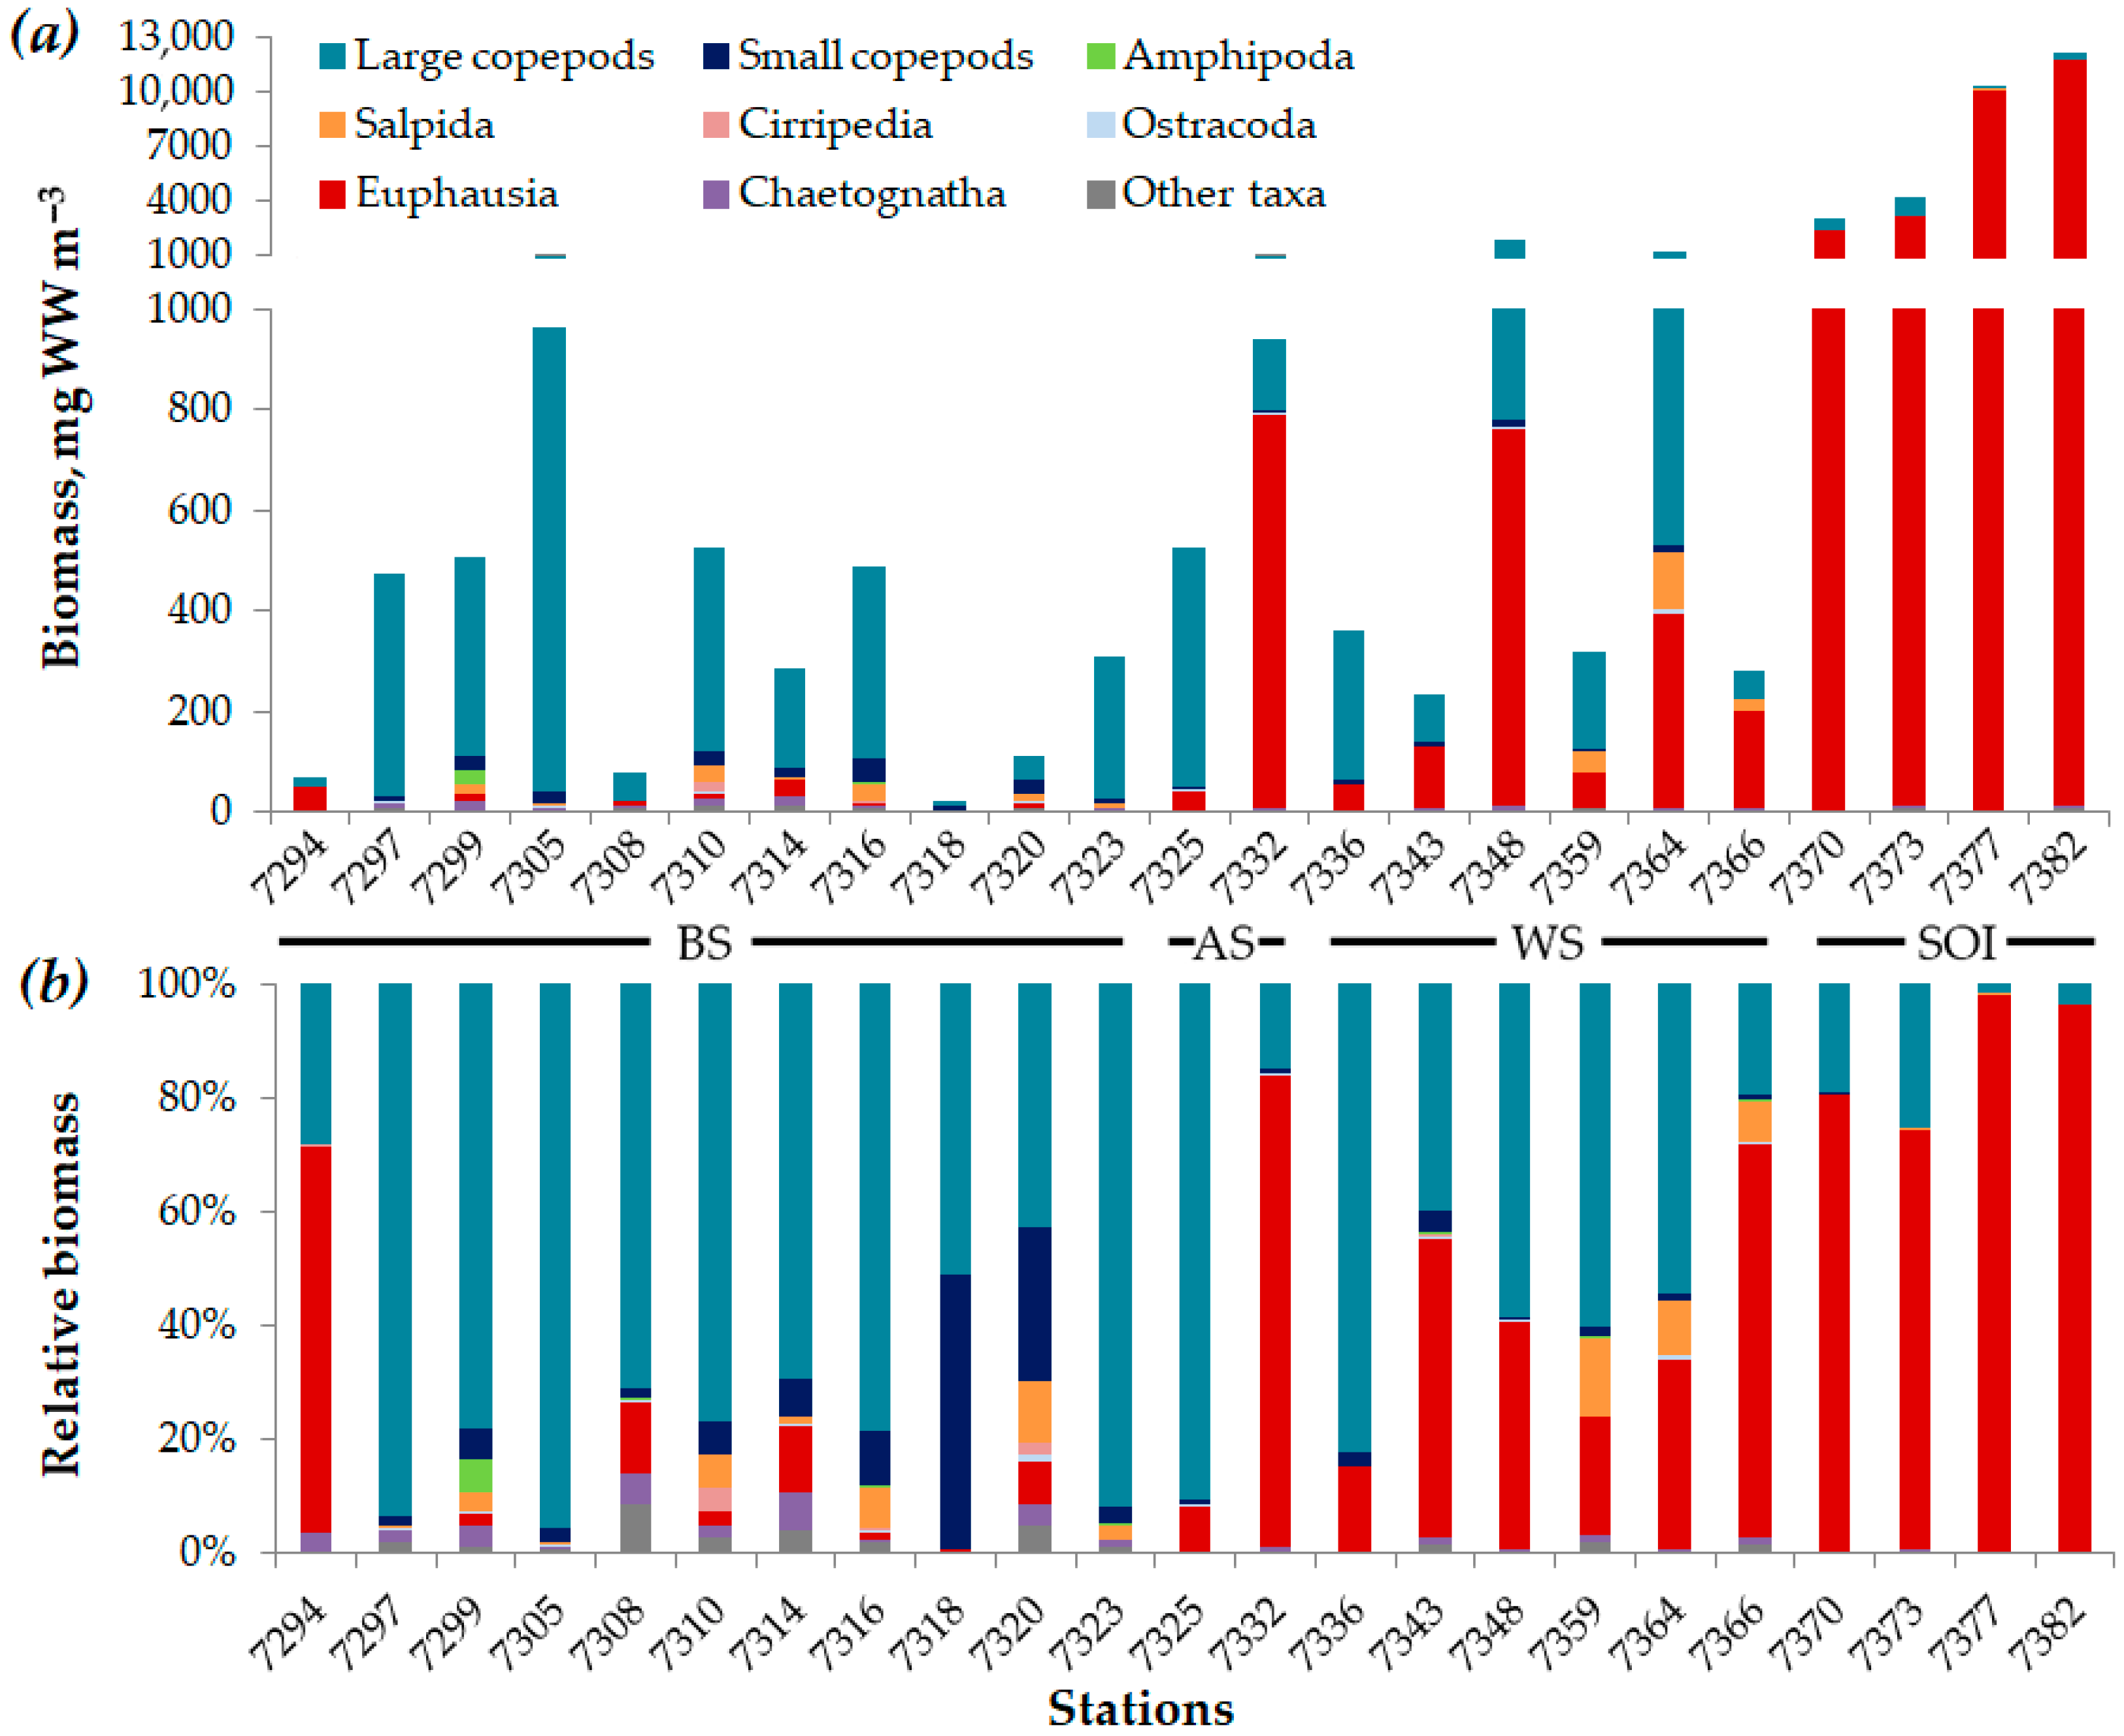
3.2. Composition and Distribution Patterns of Mesozooplankton Abundance and Biomass

The total mesozooplankton abundance varied between 47.3 and 2797.8 ind. m−3 with a mean value of 970.3 ± 376.8 ind. m−3. The maximum abundances were recorded from off the South Orkney Islands (Figure 3a). At the stations of this area, euphausiids larvae numerically dominated (Figure 3b). At the rest of the stations, mesozooplankton abundances ranged from 300 to 1200 ind. m−3 with a trend to increase from west to east. Euphausiids larvae, being the most abundant group of mesozooplankton, constituted 39.9% of total abundance. It was noted that the greatest euphausiids larvae abundances mostly matched the stations characterized by high phytoplankton concentrations; as, e.g., at station (Stn.) 7332 eggs and nauplii of euphausiids accounted for >80% of total abundance. Phytoplankton cells were not counted, and phytoplankton concentration was estimated visually in the samples. The second abundant group of mesozooplankton, comprised of small-sized copepods, such as Oithona spp., Oncaea spp., and copepod nauplii (hereafter referred to as small copepods), constituted 27.2% of total abundance. Contributions of small copepods at the stations sampled in the Bransfield Strait were higher compared to other study areas (Figure 3b). The third abundant group of mesozooplankton was comprised of large-sized calanoid copepods, e.g., Calanoides acutus, Calanus propinquus, Metridia gerlachei, and Rhincalanus gigas (hereafter referred to as large copepods), that made up 24.7% of total abundance. At the stations, their distribution did not have any clear pattern. Other mesozooplankton taxa rarely accounted for more than 5% of total abundance (Supplementary Material).
The total mesozooplankton biomass varied between 20.1 and 12,287.8 mg WW m−3 with a mean of 1757.5 ± 869.1 mg WW m−3. The highest biomasses were recorded from two groups of stations off the South Orkney Islands (1st group, Stns. 7377 and 7382; 2nd group, Stns. 7370 and 7373) (Figure 4a). In the 1st group, euphausiids larvae accounted for >90% of total mesozooplankton biomass; the stations of the 2nd group were characterized by generally high concentrations of large calanoid copepods and euphausiids larvae. At the other stations, the mesozooplankton biomass ranged from 100 to 1100 mg WW m−3 with no clear distribution pattern. Generally, at stations with concentrations less than 500 mg WW m−3, large calanoid copepods accounted for more than 50% of total biomass (Figure 4b). At some stations, other taxa of mesozooplankton contributed significantly to total biomass: e.g., small copepods constituted up to 48% (Stn. 7318); pelagic tunicates, mainly Salpa thompsoni, up to 12% (Stn. 7359); chaetognaths, up to 6% (Stn. 7314); amphipods, mainly Themisto gaudichaudii, up to 5% (Stn. 7299). We observed a tendency of total mesozooplankton biomass to increase, similarly to abundance, from the Antarctic Peninsula towards the South Orkney Islands.

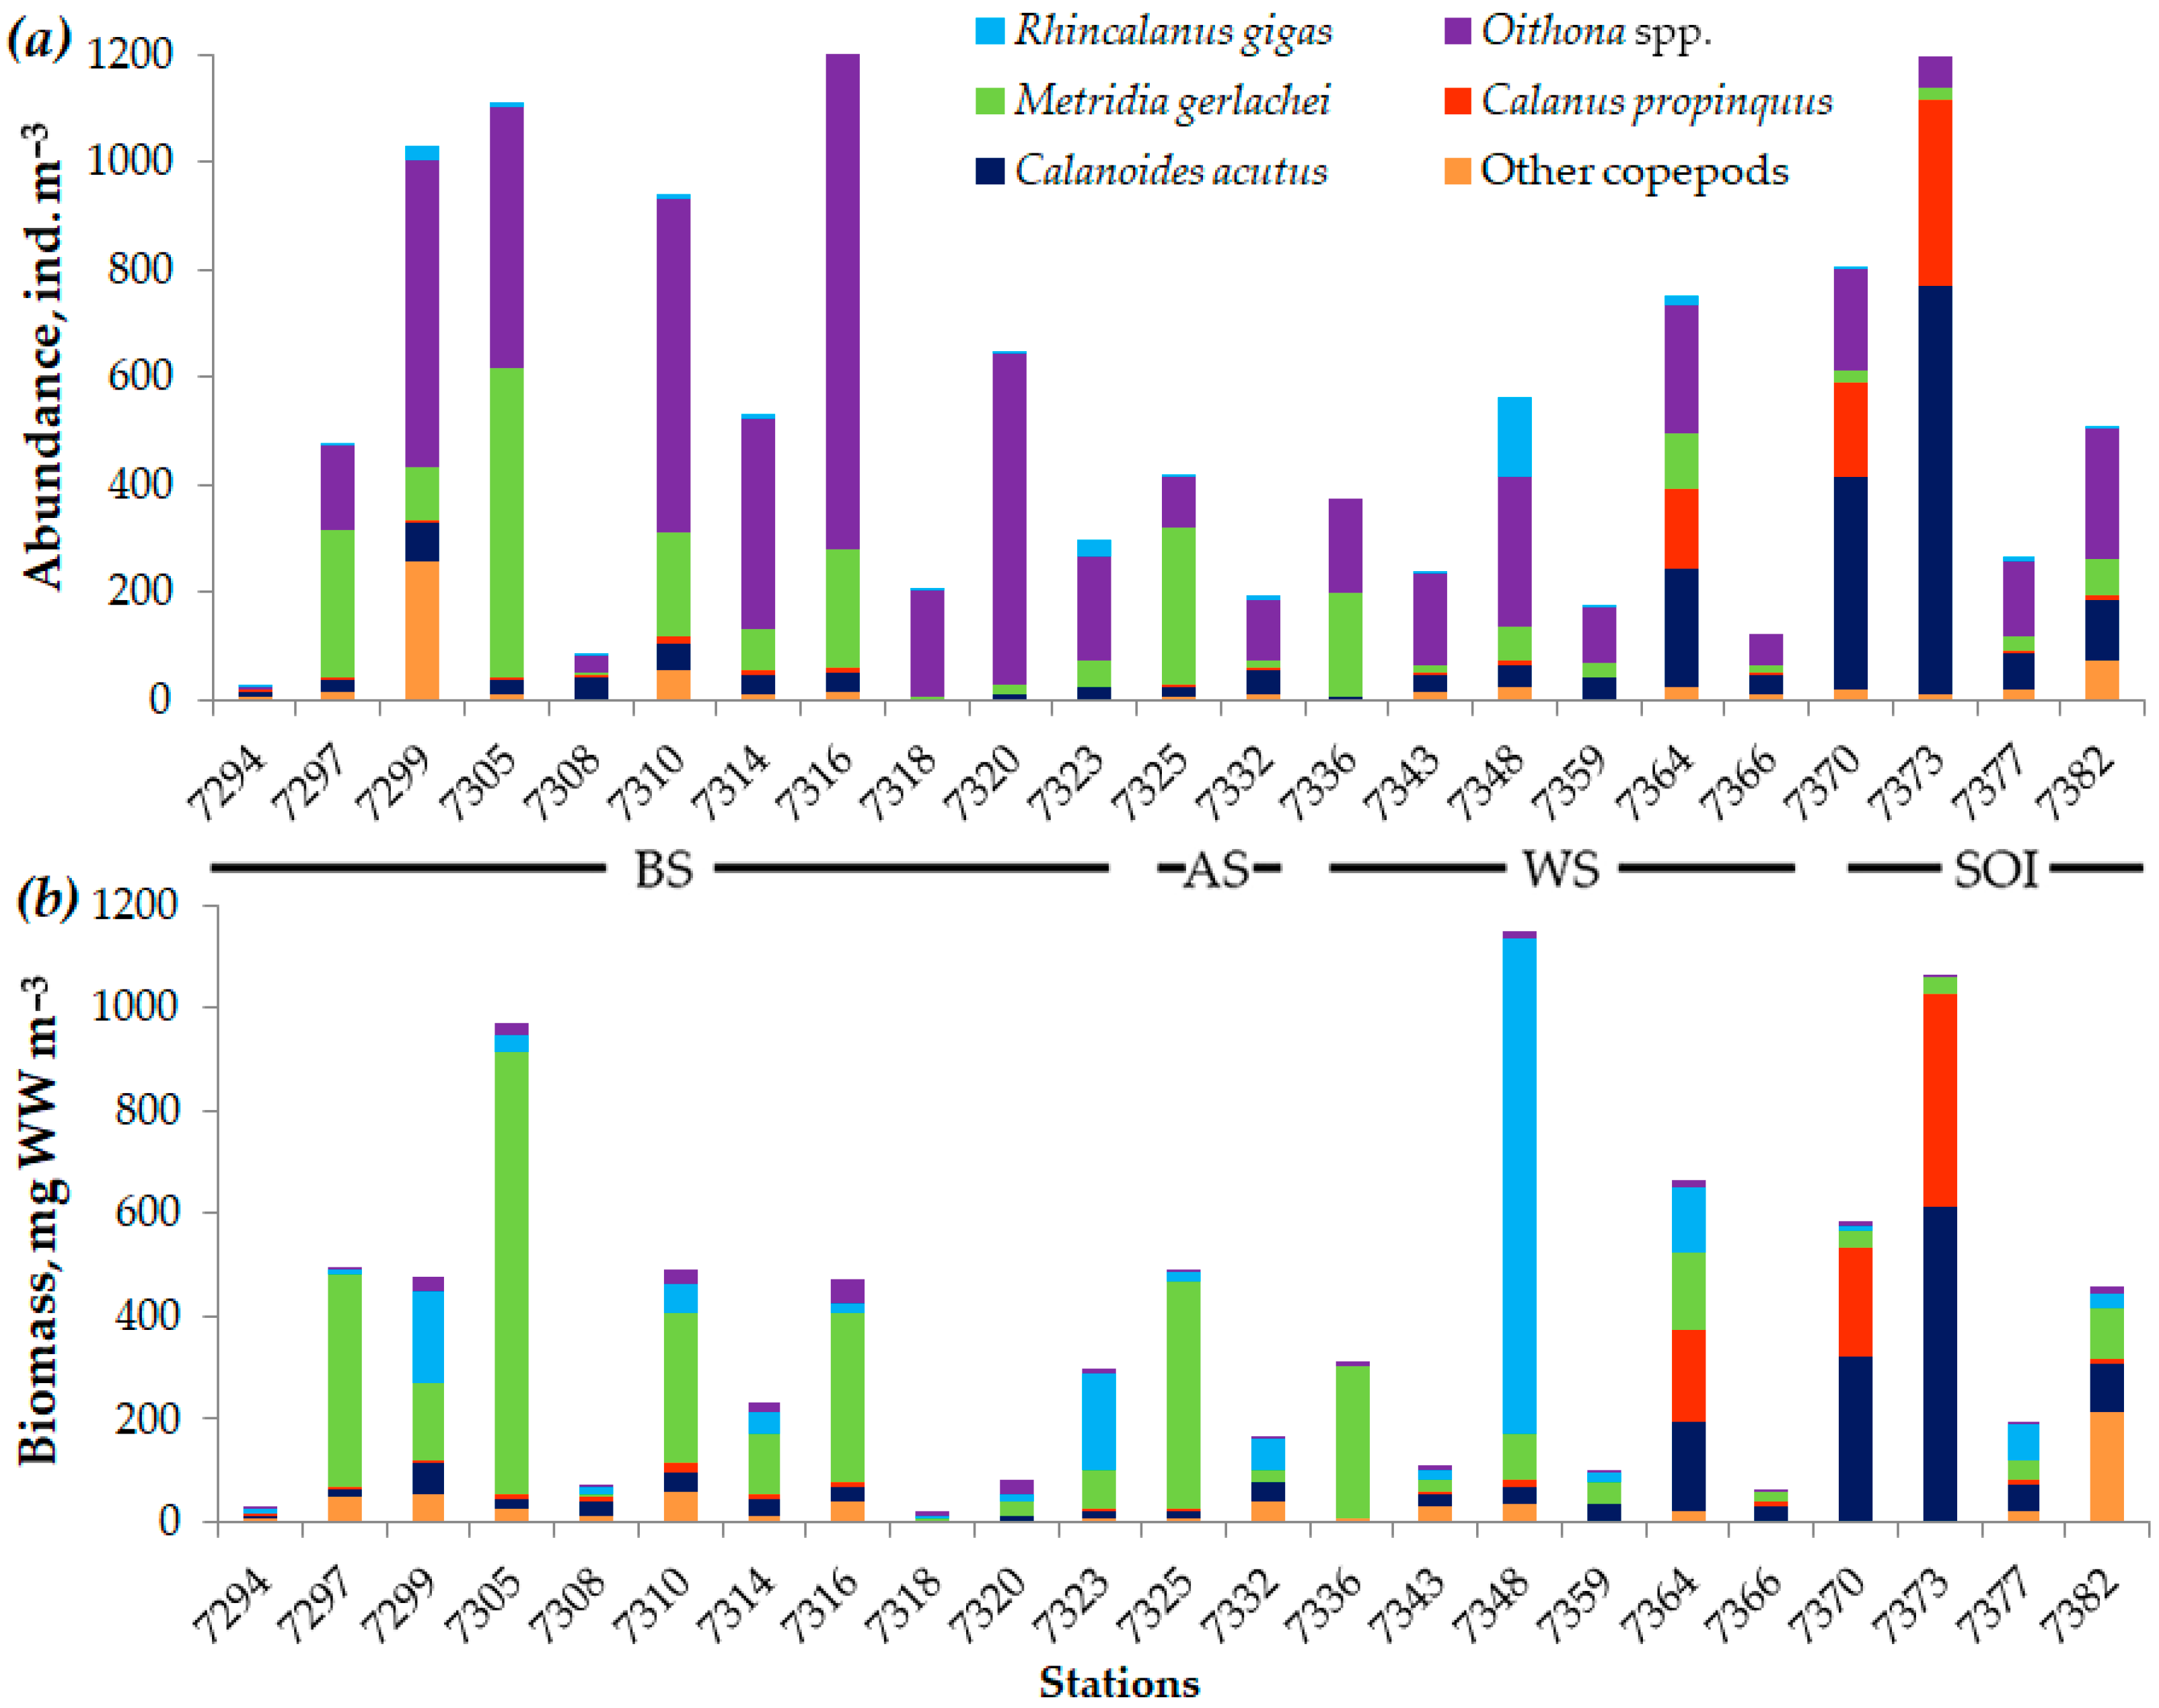
3.3. Dynamics of Copepod Community

Copepods were the most abundant taxa and prominent components of the mesozooplankton communities in the study region (Figure 3). Usually, the copepod abundance ranged between 200 and 700 ind. m−3 in the Powell Basin (Weddell Sea), Antarctic Sound, and off the Antarctic Peninsula. The highest copepod abundance was recorded at the stations in the Bransfield Strait and off the South Orkney Islands (Figure 5a). At most stations, small copepods, e.g., Oithona spp. dominated and showed substantial values in the Bransfield Strait and Powell Basin, while large calanoid copepods, e.g., C. acutus, C. propinquus, M. gerlachei, and R. gigas numerically dominated off the South Orkney Islands. We also noted that the lowest copepod abundances mostly matched the stations with high concentrations of pelagic tunicates, S. thompsoni (up to 13 ind. m−3).
The highest copepod biomasses were recorded from the Bransfield Strait, Powell Basin, and off the South Orkney Islands. The larger calanoid copepods significantly contributed to the total biomass of copepods in the study region. Metridia gerlachei dominated most stations; with several exceptions, the samples from the Powell Basin and off the South Orkney Islands were dominated by C. acutus, C. propinquus, and R. gigas (Figure 5b).

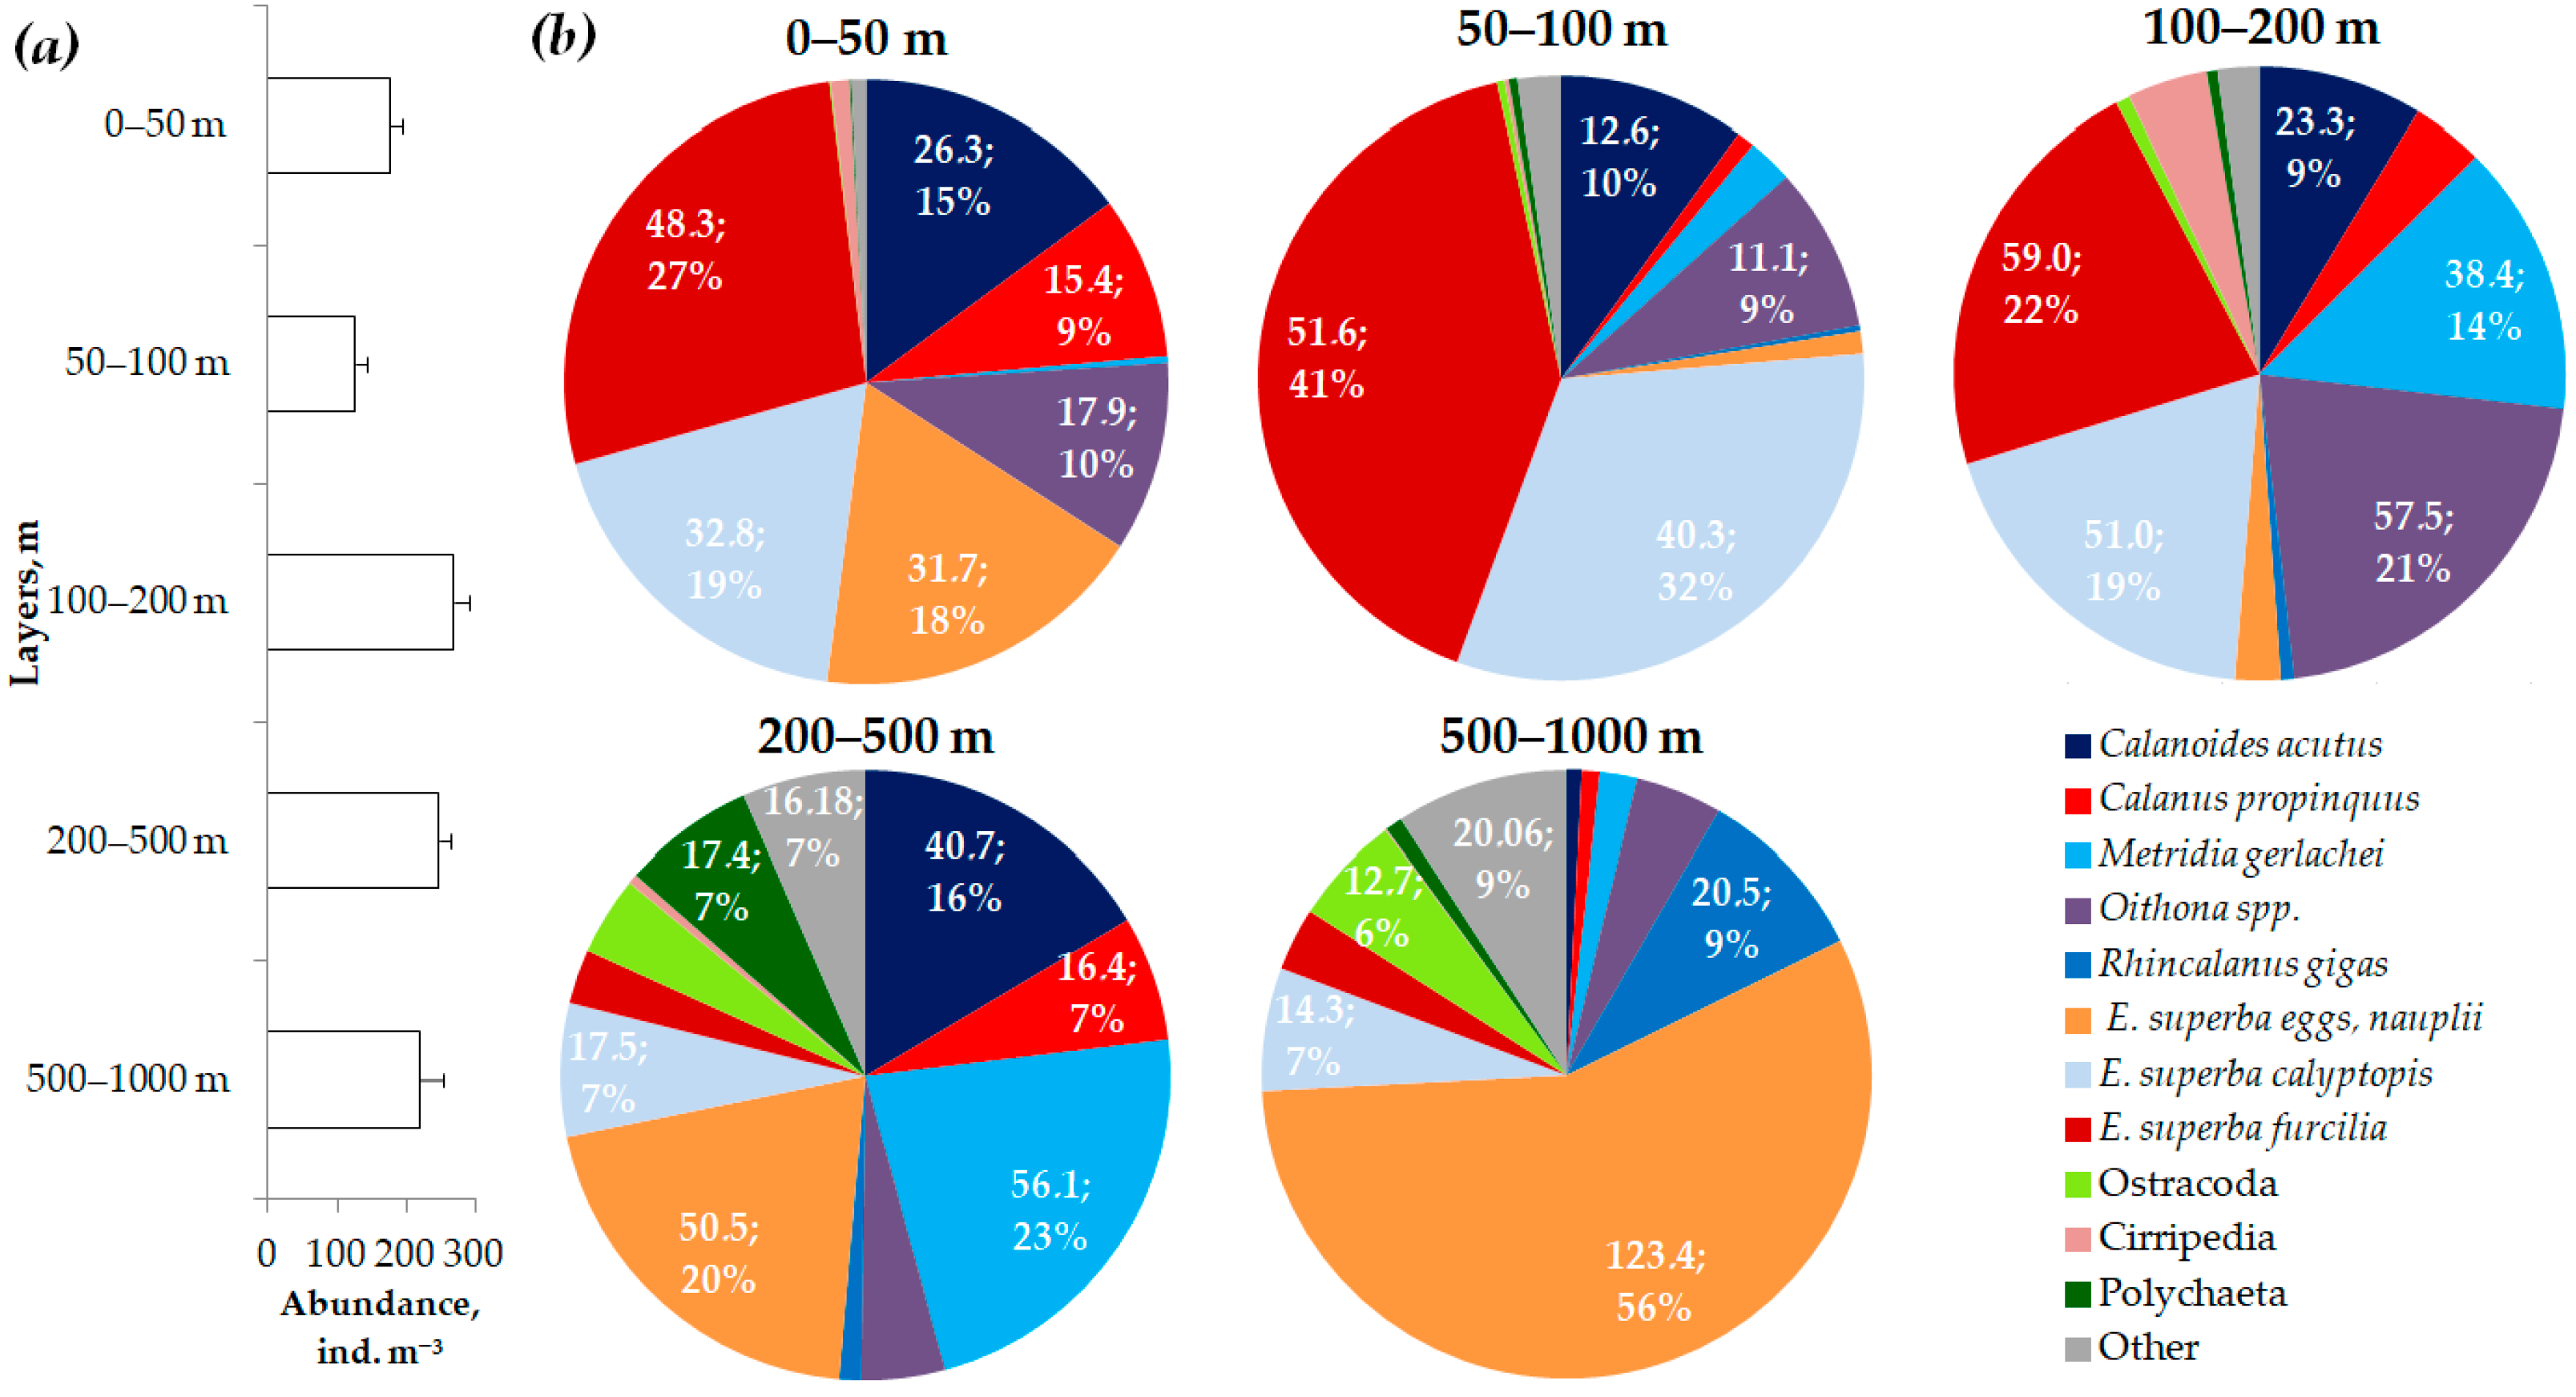
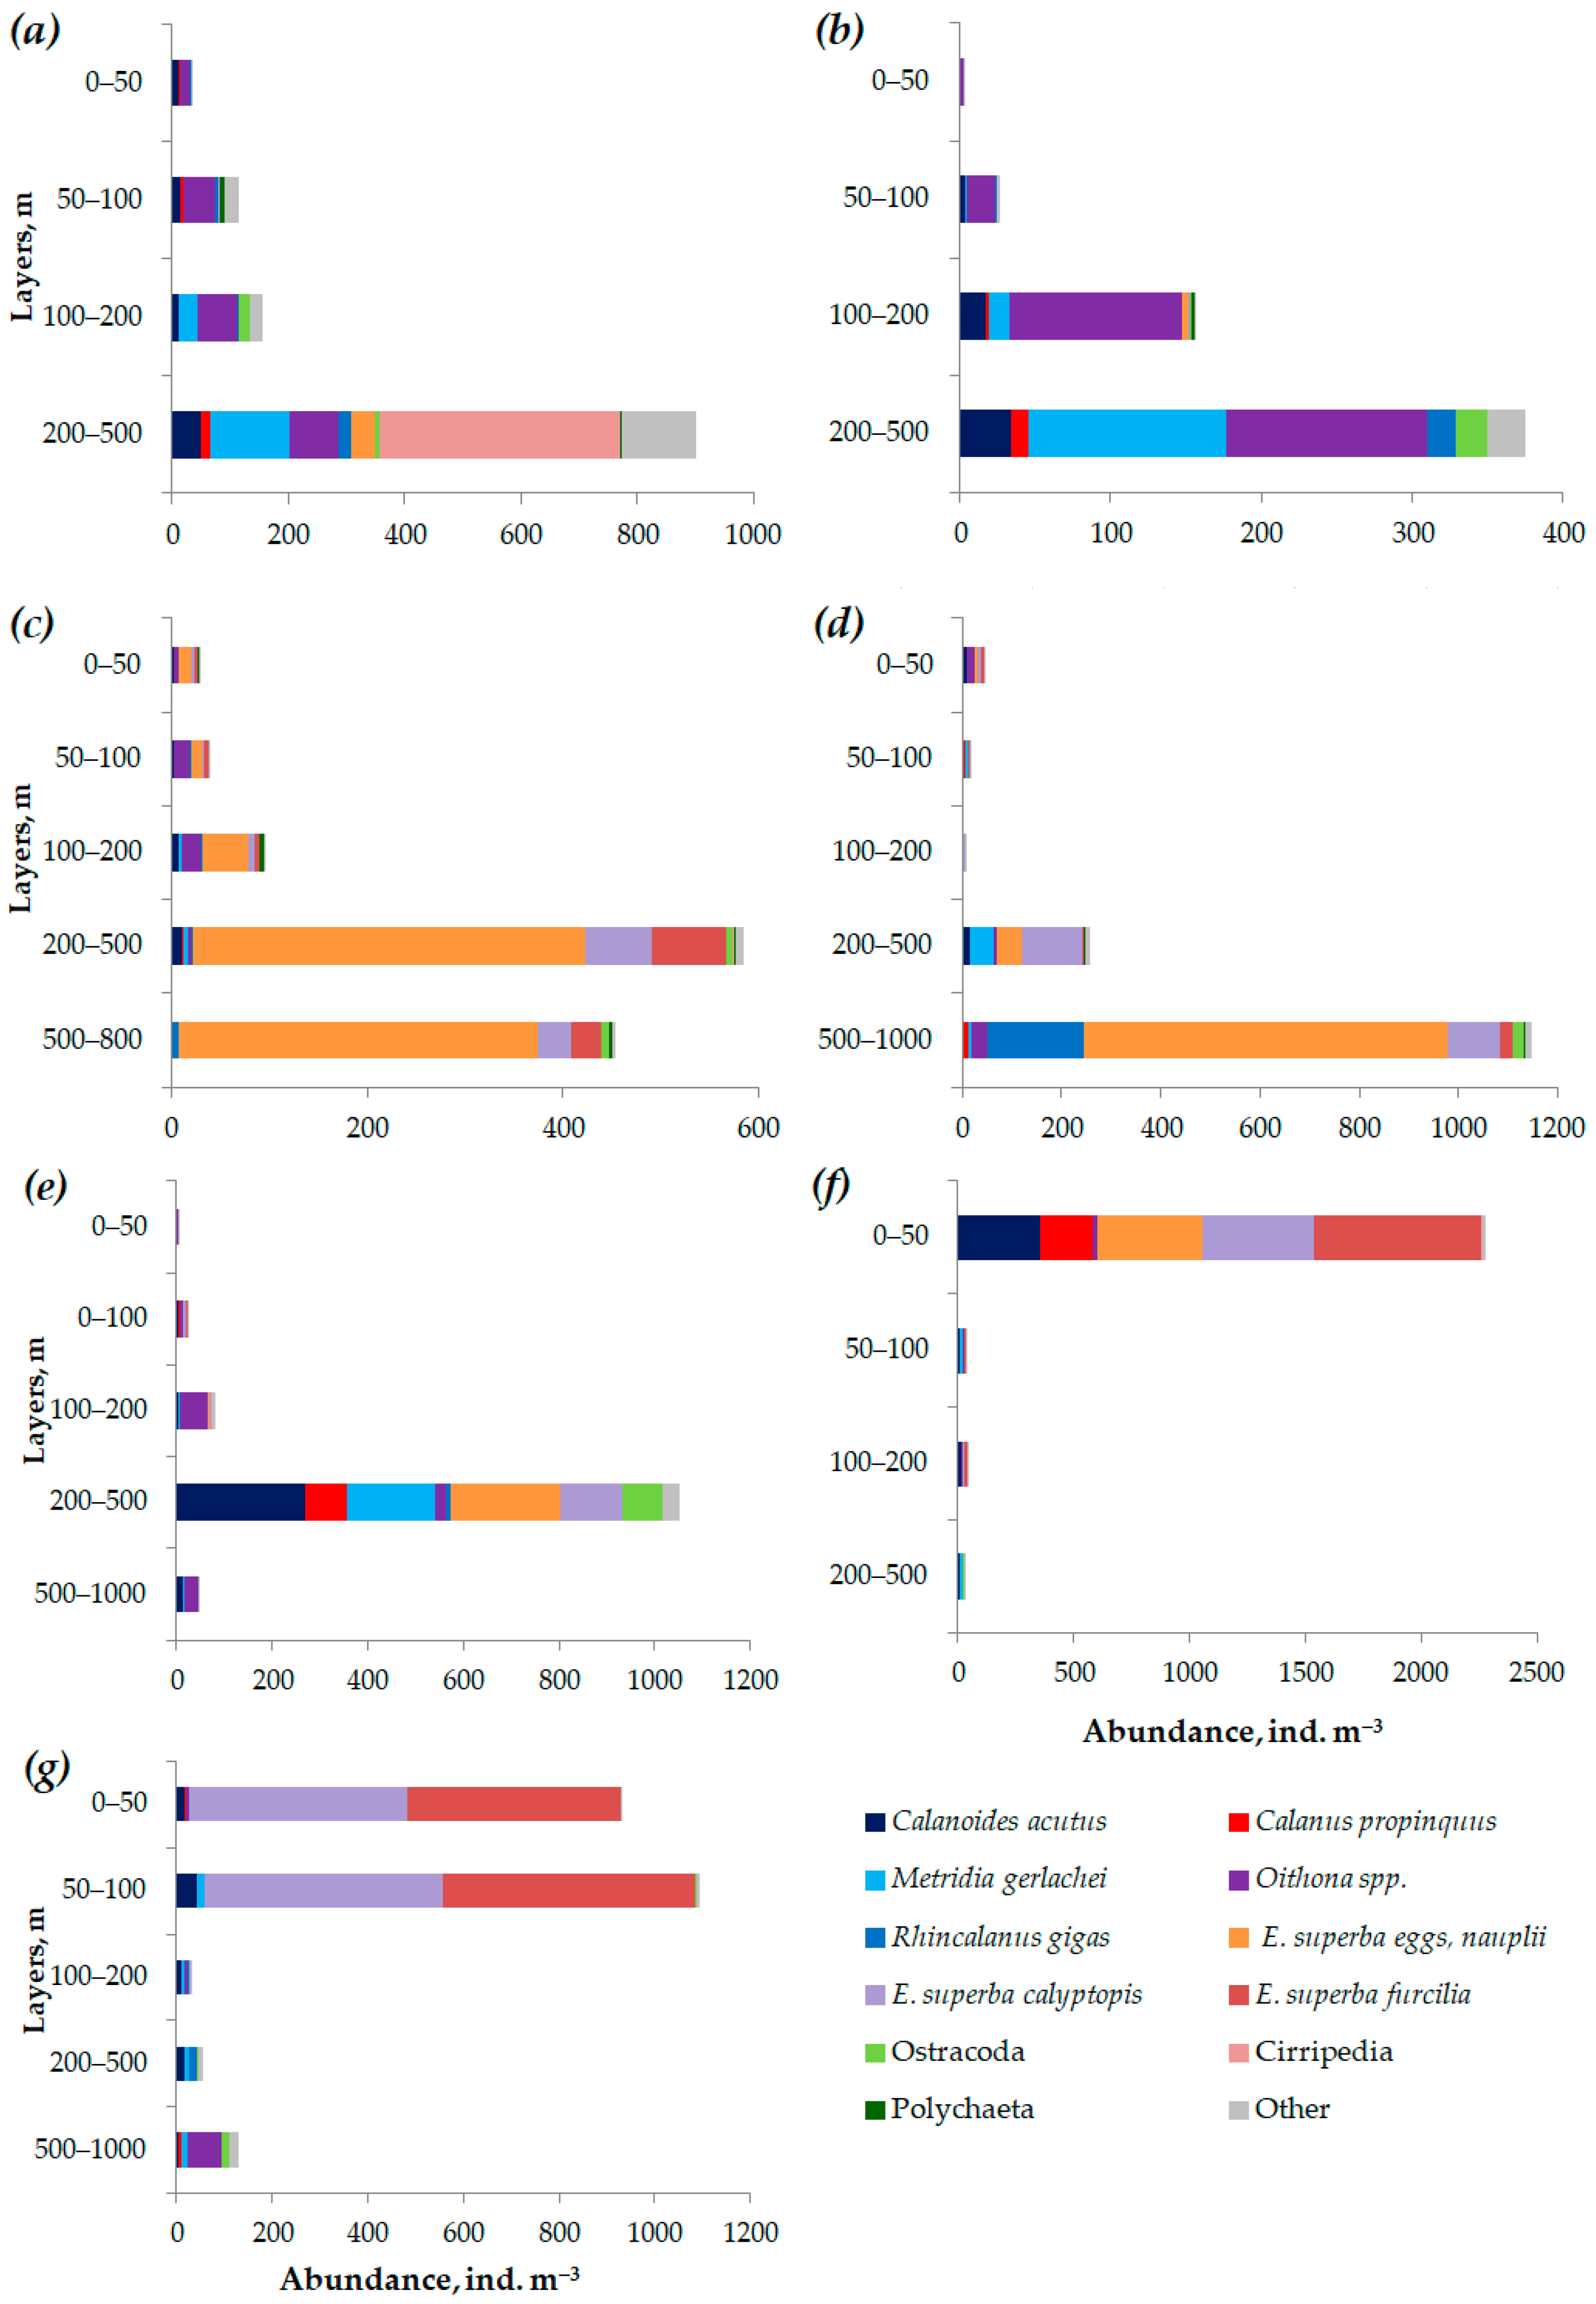
3.4. Vertical Distribution Patterns of Mesozooplankton Abundance

The average mesozooplankton abundance in the waters off the western Antarctic Peninsula reduced with increasing depth (Figure 6a). A major part of mesozooplankton occurred in the upper 200 m layer. Each mesozooplankton taxon showed characteristic depth preference: small copepods had high average abundance values in the depth layer 100–200 m, while large calanoid copepods were abundant in the layers deeper than 200 m (Figure 6b). Usually, euphausiid eggs were concentrated in the layers deeper than 500 m, with some exceptions off the South Orkney Islands (Stn. 7370) where eggs occurred in the surface layer. Euphausiids larvae were abundant in the upper 200 m layer, with a maximum of 100–200 m. The copepods C. acutus and C. propinquus were abundant in the 200–500 m layer, with several exceptions off the South Orkney Islands where these copepods dominated the warm surface layer. Metridia gerlachei was abundant in the 100–500 m layer; R. gigas, deeper than the 200 m layer; and Calanus simillimus, Candacia spp., Paraeuchaeta antarctica, and Euchirella rostomagna, in the 500–1000 m layer. Amphipods, ostracods, and pelagic polychaetes concentrated deeper than the 200 m layer; cirripeds cypris larvae were abundant within the 100–200 m layer.
The pattern of vertical distribution of mesozooplankton major species/taxa for the four study areas (BS−AS−WS−SOI) is shown in Figure 7. The maximum values of the average abundance of mesozooplankton were recorded from the warm 0–100 m layer in the waters off the South Orkney Islands (Figure 7f,g) influenced by the warm and saline-modified Antarctic Surface Water (AASW). Relatively high concentrations of mesozooplankton were recorded from the deep-sea (200–500 and 500–1000 m) layers in the cold and saline Transitional Zonal Water with Weddell Sea influence (TWW) of the Antarctic Coastal Current (ACoC) and modified circumpolar deep water (mCDW) (Figure 7a), freezing and freshening Shelf Water (SW) and TWW (Figure 7c,d), warm and saline Warm Deep Water (WDW) (Figure 7e), except waters off the South Shetland Islands in the Bransfield Strait influenced by the Transitional Bellingshausen Water (TBW) of the warm Bransfield Current (BC) and mCDW (Figure 7b).

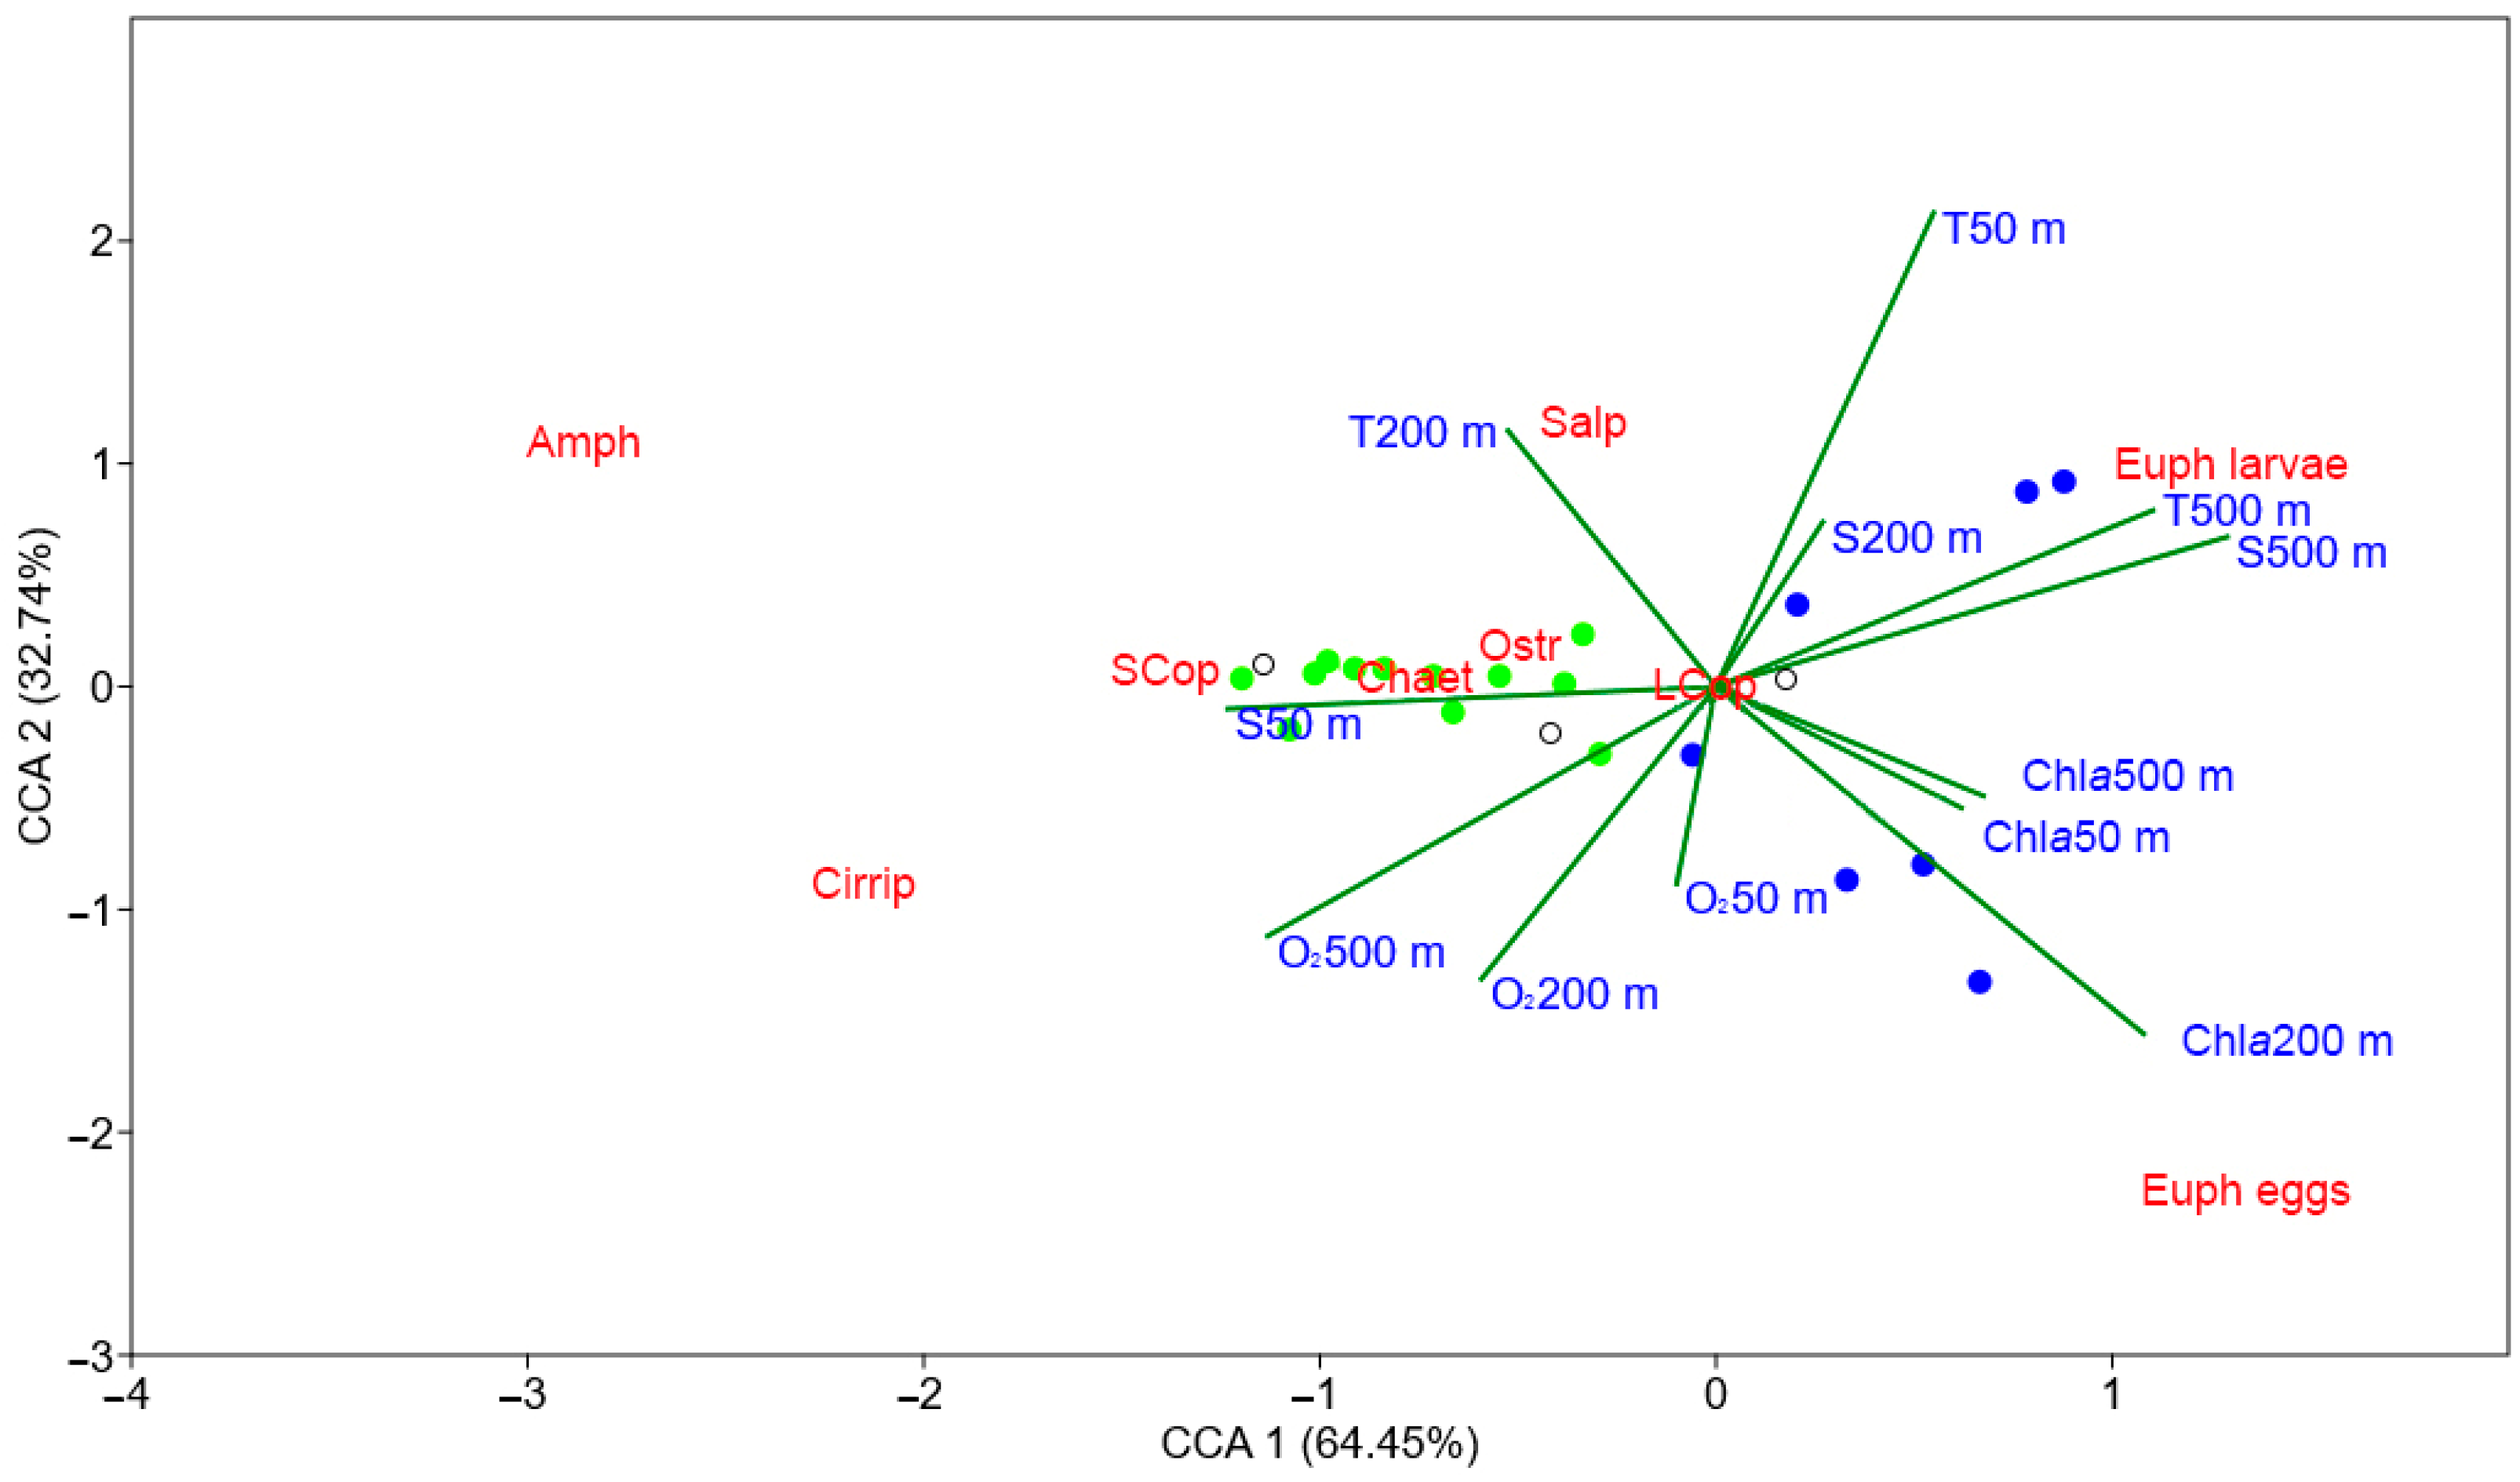
3.5. Effects of Environmental Variables on Distribution of Summer Mesozooplankton

The BEST analysis between the environmental variables and the biological data (abundance) showed that significant variations in quantitative distribution could be explained by three environmental variables such as salinity, temperature, and Chl a concentration (correlation coefficient from 0.353 to 0.400). In contrast, the other variables did not increase the correlation coefficient (Table 2). These relationships were statistically significant for each of the four models (RELATE; p < 0.01). The best combination of variables explaining the variations in mesozooplankton abundance was the salinity and Chl a concentration at 500 m (correlation coefficient, 0.400). As our study showed, the abundances of mesozooplankton in particular copepods negatively correlated with the Chl a concentration at 500 m, while the mesozooplankton biomass positively correlated with the salinity at 500 m (p < 0.05) (Table 3). The abundance of euphausiids larvae showed positive relationships with the salinity at 500 m and negative ones with the sea surface salinity and also with the temperature at 200 m. The surface Chl a concentration and the salinity at 500 m positively correlated with the biomass of euphausiids larvae. The correlations between copepod biomass and all variables considered in the analysis were non-significant.

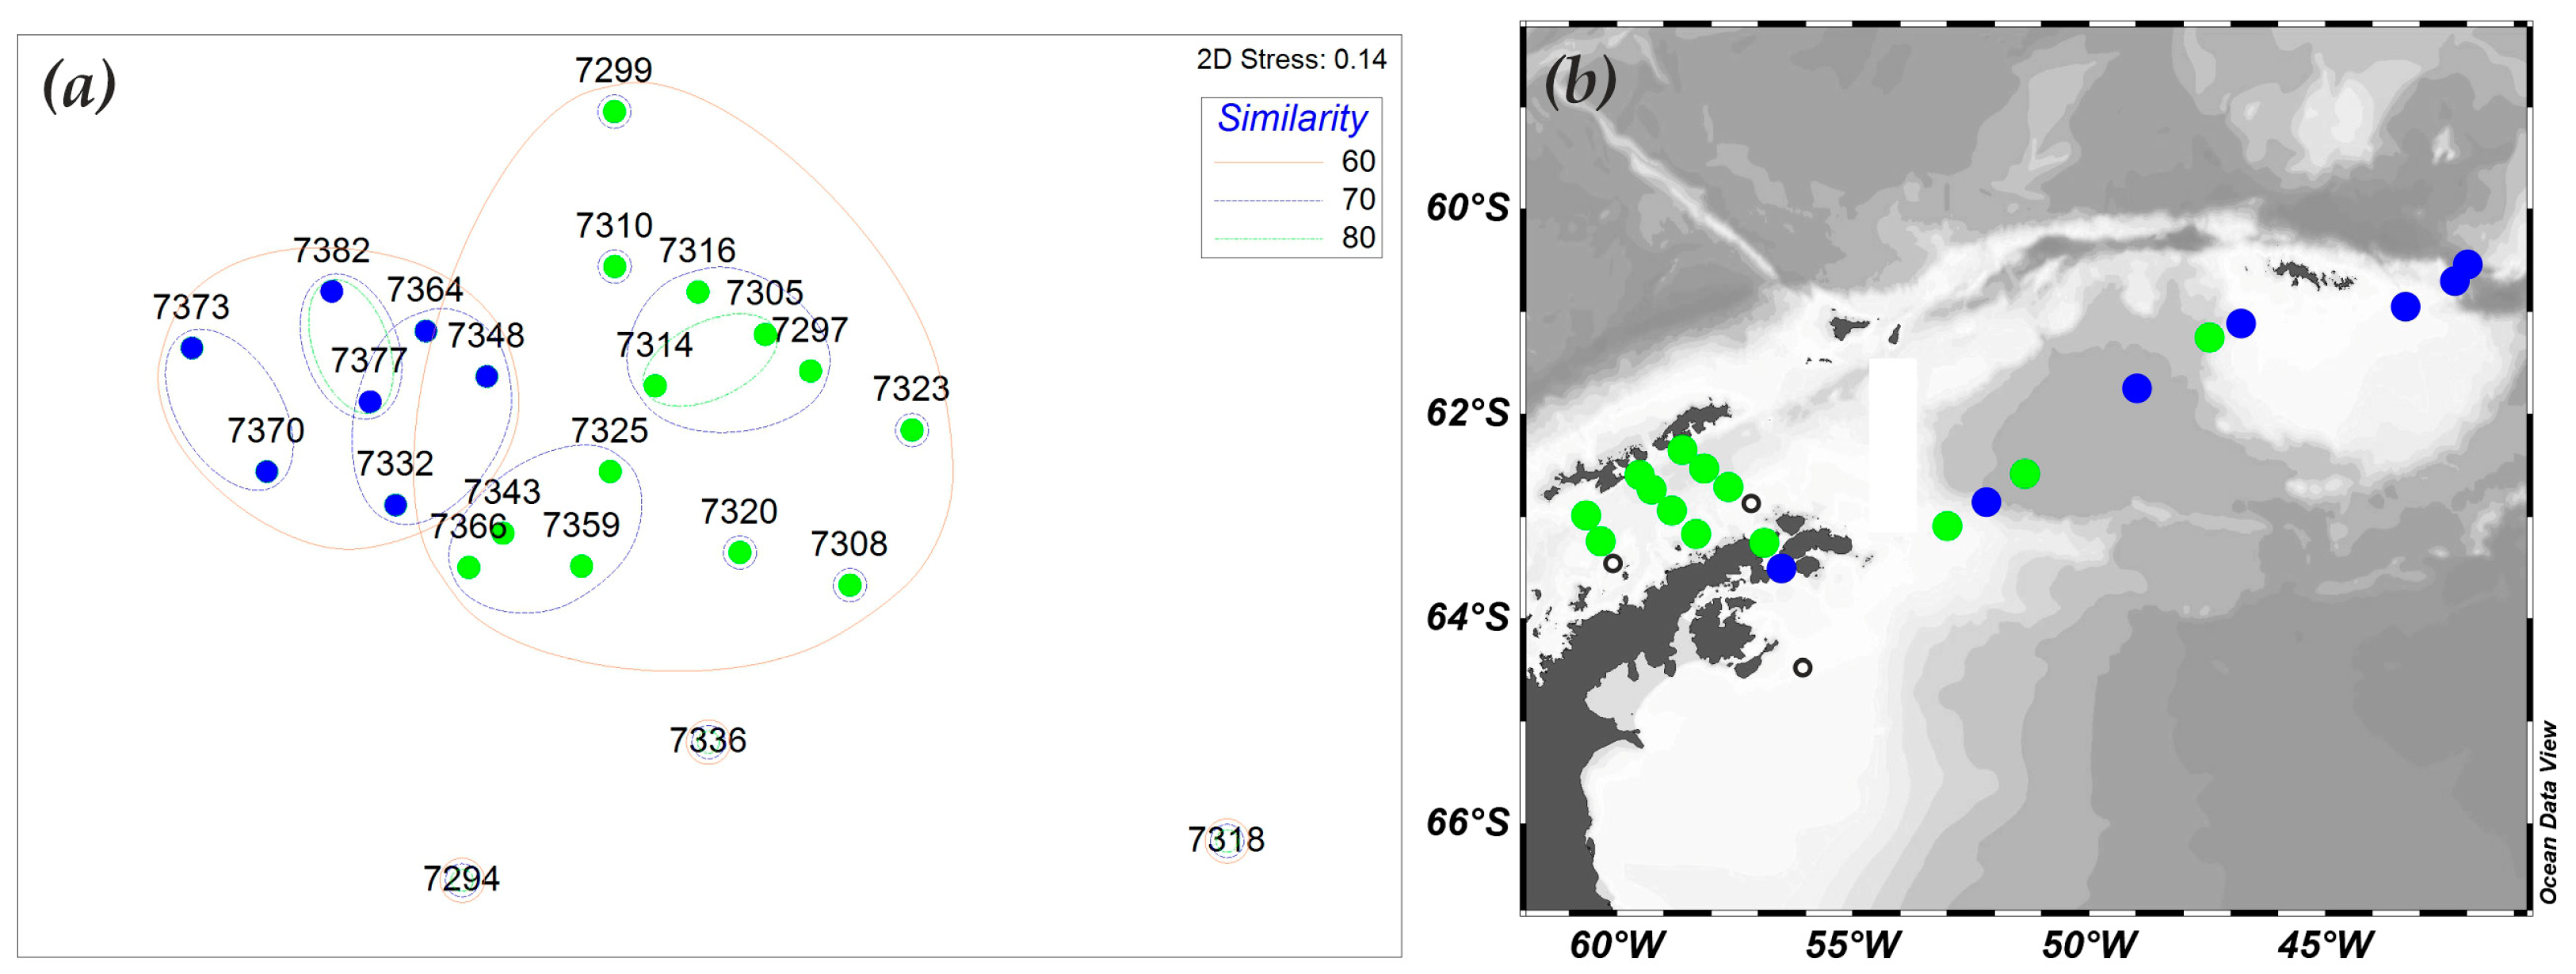
3.6. Mesozooplankton Community Structure

Using the cluster and nMDS (stress value of 0.14) analyses, two significant groups of stations were distinguished that geographically matched the inner sector off the Antarctic Peninsula (ISAP) and the outer sector off the Antarctic Peninsula (OSAP) (Figure 8). The ISAP was located in the Bransfield Strait, in the northern Antarctic Sound, and the Powell Basin of the Weddell Sea, while the OSAP was located in the deep-sea area of the southern Antarctic Sound, in the Powell Basin, and off the South Orkney Islands. A non-recognized group (Stns. 7294, 7318, and 7336) stood out against the other stations. The ISAP and OSAP groups off the western Antarctic Peninsula overlapped somewhat but were well separated from the non-recognized group of stations.
By comparing the locations of the distinguished groups of stations with the key currents in the study region (Figure 1), we have found that the OSAP was influenced by the modified warm waters from the Powell Basin: Antarctic Slope Front (ASF) and the Weddell Front (WF) with the warm and saline modified AASW. On the contrary, the ISAP was influenced by the cold and freshening AASW and by the TBW of the warm Bransfield Current and the cool and saline TWW of the cold Antarctic Coastal Current. Stations of the non-recognized group were influenced by the freezing and freshening water.
Typical species (SIM/SD ratio of >3) of the ISAP community were Oithona spp., M. gerlachei, and C. acutus that together accounted for 53.1% of the average intra-group similarity (SIMPER; average similarity, 64.81%). The OSAP community was characterized by euphausiids larvae, Oithona spp., M. gerlachei, C. acutus, and ostracods, which together accounted for 67.66% of the average intra-group similarity (SIMPER; average similarity, 68.78%). The dissimilarity between the tested sectors (OSAP vs. ISAP) was driven by 15 species that represented such taxa as euphausiids, copepods, ostracods, pelagic polychaetes, cirripeds cypris larvae, and pelagic tunicates, which collectively accounted for 41.8% of the dissimilarity, as shown by a SIMPER analysis (Table 4). The samples (non-recognized group) collected from the very cold and freshening water were characterized by a minimum abundance and a low species richness represented by Antarctic species [61,62].
A canonical correspondence analysis (CCA) performed to assess relationships between the mesozooplankton composition and the environmental variables in the two sectors (ISAP and OSAP) together showed that the revealed models explained 97.1% of the total variation in the dataset (64.4 and 32.7% for the CCA1 and CCA2 axes, respectively) (Figure 9). The increase in the abundance of euphausiid eggs was associated with the high oxygen and Chl a concentrations and the low temperature in the 200 m (T 200 m) layer. In general, the higher concentrations of euphausiids larvae were associated with the high temperature in the surface (T 50 m) and 500 m (T 500 m) layers, the high salinity in the 200 m (S 200 m) and 500 m (S 500 m) layers, and a low oxygen concentration. The abundance of large copepods was poorly represented on the first two CCA axes (it was located close to the origin). The high salinity in the surface layer (S 50 m) was associated with the abundance of small copepods and other mesozooplankton aggregations, ostracods, amphipods, and chaetognaths. The abundance of pelagic tunicates was associated with the high temperature in the 200 m layer (T 200 m) and low Chl a conditions. The abundance of cirripeds cypris larvae was associated with the high salinity in the surface layer (S 50 m) and the high oxygen in the 500 m layer (O2 500 m), but the low temperature and the low Chl a concentration which is the predominant environmental conditions in the ISAP (green circles in Figure 9).

4. Discussion

Climate warming [5] and freshening of surface waters due to the extremely rapid melting of glaciers over the past few decades [2,63,64] have induced marked changes in the pelagic zone of the Southern Ocean such as a decrease in the photosynthesis efficiency [65] and in the total phytoplankton biomass, and also a change in the phytoplankton structure from the predominance of large diatoms to cryptophytes and small flagellates [66,67,68]. This has exerted a significant impact on the abundance of krill and salps [33,69]. Overall, the composition and distribution of mesozooplankton communities in the Austral summer of 2022 changed slightly compared to data for other years [16,18,19,61,70]. It should, however, be pointed out that while average abundance and biomass levels were within the documented range, they showed the highest estimated values. This can be explained by the 150 μm mesh used in this study. For comparison, most of the other estimates were derived from net samples where mesh size was often 200 μm or greater, and a 200 μm mesh preserves by an average of ~10 and ~20% less biomass and density, respectively, compared to the similarly designed 150 μm mesh net [71]. It is possible that much of small-size mesozooplankton is underrepresented in many present and historical data sets [72].
According to NOAA [9], the Austral summer of 2022 in the region off the western Antarctic Peninsula was the second warmest period after 2016 (observations since 1910). The SST recorded in this period proved to be the highest for the past 113 years, with a positive anomaly of 1.35 °C [9]. Furthermore, the record lows in sea-ice cover in the Antarctic for the past 44 years, including the retreat of the sea-ice edge up to 64°30′ S in the Weddell Sea, and the increased concentration of chlorophyll a were also observed in the Austral summer of 2022 [73]. Copepods, eggs, and larvae of euphausiids were the most abundant taxa and prominent components of the mesozooplankton communities throughout the record-warm summer season of 2022. The spatial distributions of copepods and euphausiids larvae together drove distribution patterns for the total mesozooplankton abundance. Copepods showed maximum abundances immediately off the Antarctic Peninsula, whereas abundances of euphausiid larvae were highest east of the Antarctic Peninsula, at the Weddell-Scotia Confluence. The trends of variations in total mesozooplankton abundance over time were quite consistent, i.e., a steady increase from 1998 to 2009, a leveling-off, and then a decrease between 2010 and 2014, followed by a second period of increase that occurred in 2015–2018 [17]. During the warmest summer of 2022, the distribution of mesozooplankton varied considerably, and abundances were generally high at the easternmost stations. There was no surprise that small copepods accounted for a major part of the mesozooplankton abundance off the Antarctic Peninsula [15,16,61,74,75]. A positive trend of increasing small copepod contributions to the total mesozooplankton abundance off the Antarctic Peninsula has been observed over the last 20 years [17,76,77]. Small copepods and nauplii of large species constitute a very important group of mesozooplankton, providing a food supply for fish larvae and macrozooplankton [36,78]. The average abundance of euphausiid eggs and larvae proved to be 3–5-fold lower than previously reported [27,28,79]. It is likely that the survey in 2022 could coincide with a period between years of high abundance of the krill population, as was noted earlier [22,28]. Previous studies showed that the euphausiid abundance did not increase after 2010 [17,33]. Currently, a trend of krill population declines due to climate changes observed since the late 20th century is very probable [15,17,22,62].
The stability of mesozooplankton communities in the Southern Ocean is related to changes in the phytoplankton structure, in particular, variations in food availability, which may be a major factor responsible for differences in the composition and quantitative distribution of mesozooplankton [17,68,80,81]. Larger-sized phytoplankton organisms (e.g., diatoms) are typically grazed by calanoid copepods and krill [82,83], whereas smaller-sized ones (e.g., flagellates) are grazed by small copepods and pelagic tunicates [84,85]. In our study, a maximum abundance of small copepods was located in areas with high concentrations of Haptophyta and Dinophyta microalgae, e.g., Phaeocystis antarctica, Polarella glacialis, and Protoperidinium spp., while a maximum abundance of large copepods and euphausiid larvae was in waters with high concentrations of diatoms, e.g., Chaetoceros criophilus, C. concavicornis, Fragilariopsis kerguelensis, Odontella weissflogii, and Rhizosolenia spp., which is consistent with a previous study [20]. If the change in the phytoplankton structure trend continues, we may observe the increasing concentration of flagellates microalgae, which may be a trigger for an increase in abundance and expansive distribution of small copepods and pelagic tunicates in the Southern Ocean.
Differences in the vertical distribution of mesozooplankton may be caused by seasonal migration of plankton organisms, food availability, and seasonal pycnocline [86,87,88]. The calanoid copepods C. acutus, C. propinquus, and M. gerlachei commonly occur in the epipelagic layer of 0–200 m off the Antarctic Peninsula in summer [61,89]. In the warmest summer of 2022, these calanoid copepods were ubiquitously distributed in the warm and saline water of the mesopelagic layer (200–500 m), except for a few stations off the South Orkney Islands where these copepods dominated the warm surface layer of 0–50 m. The presence of a sharp seasonal pycnocline in the study region, where gradients of thermohaline characteristics reached 0.5 °C and 0.06 psu per 10 m [20], may have prevented calanoid copepods from migrating to the surface for feeding and breeding. Nevertheless, stratification of the water column can contribute to the active vegetation of phytoplankton as essential food for the development of macro- and mesozooplankton [12,35], as, e.g., off the South Orkney Islands, where the highest density of euphausiid larvae can be associated with bloom events of diatoms of the genera Chaetoceros and Rhizosolenia in the warm near-surface layer. On the contrary, in the Antarctic Sound, characterized by high concentrations of microalgae (mainly diatoms), with an increase from the surface to the bottom (800 m depth), the abundance of eggs and nauplii of euphausiids was recorded deeper than 500 m.
Yet, there is a limited understanding of how environmental conditions can structure the dynamics of mesozooplankton communities in the Antarctic waters. As was previously reported, mesozooplankton communities are thermally resilient to the present levels of sea surface warming, whereas other selective pressures, in particular food availability and the properties of underlying water masses, imposed greater constraints on the distribution of mesozooplankton in the Antarctic region [16,90]. Nevertheless, we found that water salinity, temperature, and chlorophyll a concentration are important factors structuring the composition and the quantitative distribution of mesozooplankton in the waters off the Antarctic Peninsula during the warmest austral summer. Each mesozooplankton taxon showed characteristic environmental preference. Copepods, ostracods, and chaetognaths were associated with salinity; pelagic tunicates, with temperature; cirripeds cypris larvae and amphipods, with salinity and oxygen concentration; euphausiids larvae, with temperature and salinity; euphausiids eggs, with oxygen and chlorophyll a concentrations. The highest euphausiid egg abundances were observed at the deep-sea stations which were associated with the highest oxygen concentrations (>10 mg/L), very cold water (−1 °C), and high, bloom-like phytoplankton concentrations. Mackintosh [91] found that euphausiid eggs and larvae at early stages tend to certain zones as the thermocline disappears; in addition, an abundance of krill larvae at early developmental stages may be associated with temperature and Chl a concentration [27,29,92,93]. Further studies are expected to be carried out to elucidate the relative contributions of the factors driving the abundance of copepods that dominate the mesozooplankton of the Southern Ocean and form the major food supply in the food chain between primary producers and predators [94,95].

5. Conclusions

Eggs and larvae of euphausiids such as Euphausia superba, small copepods such as O. similis, and large calanoid copepods such as C. acutus, C. propinquus, M. gerlachei, and R. gigas proved to be the most abundant taxa and prominent components of the mesozooplankton communities off the western Antarctic Peninsula during the record-warm summer season of 2022. Small copepods dominated substantially in the Bransfield Strait and off the Antarctic Peninsula, while large calanoid copepods and euphausiid eggs and larvae numerically dominated in the Powell Basin and off the South Orkney Islands. The other taxa of mesozooplankton, e.g., Appendicularia, Ctenophora, Echinodermata, Hydromedusae, Polychaeta, Pteropoda, Siphonophorae, and eggs and larvae of fish did not play any substantial role in the total abundance. With a few exceptions, the contributions of amphipods, chaetognaths, ostracods, salps, pelagic polychaetes, and cirripeds cypris larvae were significant. The total abundance and biomass of the mesozooplankton increased in an easterly direction, from the Antarctic Peninsula to the South Orkney Islands. Most mesozooplankton occurred in the upper 200 m layer. Each taxon showed characteristic depth preference: small copepods, euphausiids, and cirripeds cypris larvae were abundant in the epipelagic layer (up to 200 m), while large calanoid copepods, euphausiid eggs, amphipods, ostracods, and pelagic polychaetes were concentrated in the mesopelagic layer (up to 1000 m). Two significant groups of sampling stations were identified off the western Antarctic Peninsula. The first group, located in the inner sector off of the Antarctic Peninsula (ISAP), was represented by copepods Oithona spp., M. gerlachei, and C. acutus; the second group, located in the outer sector off of the Antarctic Peninsula (OSAP), by euphausiids larvae, copepods Oithona spp., M. gerlachei, C. acutus, and ostracods. The composition and quantitative distribution of mesozooplankton showed clear relationships with environmental factors, particularly with a combination of variables such as water salinity, temperature, and Chl a concentration. The increase in the abundance of euphausiid eggs was associated with the high oxygen and Chl a concentrations and the low temperature in the 200 m layer; euphausiid larvae, with the high temperature (>1 °C) in the surface and 500–m layers, the high salinity in the 200 m (S 200 m) and 500 m layers, and a low oxygen concentration; small copepods, together with ostracods and chaetognaths, with the high salinity in the surface layer; pelagic tunicates, with the high temperature in the 200 m layer and low Chl a conditions; cirripeds cypris larvae, with the high salinity in the surface layer and the high oxygen concentration in the 500 m layer, but a low temperature and low Chl a concentration.
The results of the present and future studies do and will provide invaluable data as regards the life of planktonic organisms in the extreme conditions of the changing Southern Ocean. These are also expected to have important practical implications for predicting long-term changes in pelagic communities and designing future programs for the conservation of Antarctic marine ecosystems and sustainable management of commercial fisheries.

Supplementary Materials

The following supporting information can be downloaded at: https://www.mdpi.com/article/10.3390/w15101948/s1, Table S1: Composition and mean abundance, ind. m−3 (±SD) of mesozooplankton in the Bransfield Strait (BS), Antarctic Sound (AS), Weddell Sea (WS), and off the South Orkney Islands (SOI) during the austral summer of 2022.

Funding

This study was supported by the Russian State Assignment no. FMWE-2022-0001 no. 122072000067-9 (for the A.V. Zhirmunsky National Scientific Center of Marine Biology, Far Eastern Branch, Russian Academy of Sciences) and FWFE-2021-0003 no. 1021062912502-3.

Data Availability Statement

Not applicable.

Acknowledgments

We are grateful to the administration of the Shirshov Institute of Oceanology, Russian Academy of Sciences, for the organization of the expedition and field operations, to the plankton and benthos research teams for collecting and providing plankton samples, to the hydrology research team for providing environmental parameters, to the primary production research team, especially to O. Kalinina, for advice on phytoplankton and also to the captain and the crew of the R/V Akademik Mstislav Keldysh for their comprehensive assistance. Special thanks are due to E. Shvetsov for his help in improving the English. The author thanks anonymous reviewers whose valuable comments and suggestions substantially improved the manuscript.

Conflicts of Interest

The author declares no conflict of interest.

References

  1. Vaughan, D.; Marshall, G.; Connolley, W.; Parkinson, C.; Mulvaney, R.; Hodgson, D.; King, J.C.; Pudsey, C.J.; Turner, J. Recent rapid regional climate warming on the Antarctic Peninsula. Clim. Chang. 2003, 60, 243–274. [Google Scholar] [CrossRef]
  2. Cook, A.J.; Fox, A.J.; Vaughan, D.G.; Ferrigno, J.G. Retreating Glacier fronts on the Antarctic Peninsula over the past half-century. Science 2005, 308, 541–544. [Google Scholar] [CrossRef] [PubMed]
  3. Xiao, C. Changes in Antarctic climate system: Past, present and future. Adv. Clim. Chang. Res. 2008, 4, 1–7. [Google Scholar]
  4. Constable, A.J.; Melbourne-Thomas, J.; Corney, S.P.; Arrigo, K.R.; Barbraud, C.; Barnes, D.K.A.; Bindoff, N.L.; Boyd, P.W.; Brandt, A.; Costa, D.P.; et al. Climate change and Southern Ocean ecosystems I: How changes in physical habitats directly affect marine biota. Glob. Chang. Biol. 2014, 20, 3004–3025. [Google Scholar] [CrossRef] [PubMed]
  5. Meredith, M.P.; King, J.C. Rapid climate change in the ocean west of the Antarctic Peninsula during the second half of the 20th century. Geophys. Res. Lett. 2005, 32, L19604. [Google Scholar] [CrossRef]
  6. Turner, J.; Colwell, S.; Marshall, G.; Lachlan-Cope, T.; Carleton, A.; Jones, P.; Lagun, V.; Reid, P.A.; Iagovkina, S. Antarctic climate change during the last 50 years. Int. J. Climatol. 2005, 25, 279–294. [Google Scholar] [CrossRef]
  7. Hill, S.L.; Phillips, T.; Atkinson, A. Potential climate change effects on the habitat of Antarctic krill in the Weddell Quadrant of the Southern Ocean. PLoS ONE 2013, 8, e72246. [Google Scholar] [CrossRef] [PubMed]
  8. Stammerjohn, S.; Martinson, D.; Smith, R.; Iannuzzi, R. Sea ice in the western Antarctic Peninsula region: Spatio-temporal variability from ecological and climate change perspectives. Deep-Sea Res. II 2008, 55, 2041–2058. [Google Scholar] [CrossRef]
  9. NOAA National Centers for Environmental Information, Monthly Global Climate Report for January 2022, Published Online February 2022. Available online: https://www.ncei.noaa.gov/access/monitoring/monthly-report/global/202201 (accessed on 13 March 2023).
  10. Constable, A.J.; Nicol, S.; Strutton, P.G. Southern Ocean productivity in relation to spatial and temporal variation in the physical environment. J. Geophys. Res. 2003, 108, 8079. [Google Scholar]
  11. Montes-Hugo, M.; Vernet, M.; Martinson, D.; Smith, R.; Iannuzzi, R. Variability on phytoplankton size structure in the western Antarctic Peninsula (1997–2006). Deep Sea Res. II 2008, 55, 2106–2117. [Google Scholar] [CrossRef]
  12. Deppeler, S.L.; Davidson, A.T. Southern Ocean phytoplankton in a changing climate. Front. Mar. Sci. 2017, 4, 40. [Google Scholar] [CrossRef]
  13. Sapozhnikov, P.V.; Kalinina, O.Y.; Morozova, T.V. Phytopelagic сommunities of the Powell Basin in the summer of 2020. In Antarctic Peninsula Region of the Southern Ocean; Morozov, E.G., Flint, M.V., Spiridonov, V.A., Eds.; Springer: Cham, Switzerland, 2021; Volume 6, pp. 279–306. [Google Scholar] [CrossRef]
  14. Rombola, E.F.; Franzosi, C.A.; Tosonotto, G.V.; Alder, V.A.; Marschoff, E.R. Variability of euphausiid larvae densities during the 2011, 2012, and 2014 summer seasons in the Atlantic sector of the Antarctic. Polar. Sci. 2019, 19, 86–93. [Google Scholar] [CrossRef]
  15. Garcia, M.D.; Sofia Dutto, M.; Chazarreta, C.J.; Berasategui, A.A.; Schloss, I.R.; Hoffmeyer, M.S. Micro- and mesozooplankton successions in the Antarctic coastal environment during a warm year. PLoS ONE 2020, 15, e0232614. [Google Scholar] [CrossRef]
  16. Pakhomov, E.; Pshenichnov, L.; Krot, A.; Paramonov, V.; Slypko, I.; Zabroda, P. Zooplankton distribution and community structure in the Pacific and Atlantic Sectors of the Southern Ocean during austral summer 2017–2018: A Pilot Study Conducted from Ukrainian Long-Liners. J. Mar. Sci. Eng. 2020, 8, 488. [Google Scholar] [CrossRef]
  17. Pinkerton, M.H.; Decima, M.; Kitchener, J.A.; Takahashi, K.T.; Robinson, K.V.; Stewart, R.; Hosie, G.W. Zooplankton in the Southern Ocean from the continuous plankton recorder: Distributions and long-term change. Deep Sea Res. 2020, 162, 103303. [Google Scholar] [CrossRef]
  18. Yakovenko, V.A.; Spiridonov, V.A.; Gorbatenko, K.M.; Shadrin, N.V.; Samyshev, E.Z.; Minkina, N.I. Macro- and mesozooplankton in the Powell Basin (Antarctica): Species composition and distribution of abundance and biomass in February 2020. In Antarctic Peninsula Region of the Southern Ocean; Morozov, E.G., Flint, M.V., Spiridonov, V.A., Eds.; Springer: Cham, Switzerland, 2021; Volume 6, pp. 131–141. [Google Scholar] [CrossRef]
  19. Criales–Hernandez, M.I.; Jerez–Guerrero, M.; Latandret–Solana, S.A.; Gomez–Sanchez, M.D. Spatial distribution of meso- and macrozooplankton in the Bransfield Strait and around Elephant Island, Antarctic Peninsula, during the 2019–2020 austral summer. Polar. Sci. 2022, 32, 100821. [Google Scholar] [CrossRef]
  20. Kasyan, V.V.; Bitiutskii, D.G.; Mishin, A.V.; Zuev, O.A.; Murzina, S.A.; Sapozhnikov, P.V.; Kalinina, O.Y.; Syomin, V.L.; Kolbasova, G.D.; Voronin, V.P.; et al. Composition and Distribution of Plankton Communities in the Atlantic Sector of the Southern Ocean. Diversity 2022, 14, 923. [Google Scholar] [CrossRef]
  21. Loeb, V.J.; Santora, J.A. Population dynamics of Salpa thompsoni near the Antarctic Peninsula: Growth rates and interannual variations in reproductive activity (1993–2009). Prog. Oceanogr. 2012, 96, 93–107. [Google Scholar] [CrossRef]
  22. Siegel, V.; Watkins, J.L. Distribution, Biomass and Demography of Antarctic Krill, Euphausia superba. In Biology and Ecology of Antarctic Krill; Advances in Polar Ecology; Siegel, V., Ed.; Springer: Cham, Switzerland, 2016; pp. 21–100. [Google Scholar] [CrossRef]
  23. Pakhomov, E.A.; Froneman, P.W.; Perissinotto, R. Salp/krill interactions in the Southern Ocean: Spatial segregation and implications for the carbon flux. Deep Sea Res. II 2002, 49, 1881–1907. [Google Scholar] [CrossRef]
  24. Atkinson, A.; Hill, S.L.; Pakhomov, E.A.; Siegel, V.; Reiss, C.S.; Loeb, V.J.; Steinberg, D.K.; Schmidt, K.; Tarling, G.A.; Gerrish, L.; et al. Krill (Euphausia superba) distribution contracts southward during rapid regional warming. Nat. Clim. Chang. 2019, 9, 142–147. [Google Scholar] [CrossRef]
  25. McBride, M.M.; Schram Stokke, O.; Renner, A.H.H.; Krafft, B.A.; Bergstad, O.; Biuw, M.; Lowther, A.; Stiansen, J. Antarctic krill Euphausia superba: Spatial distribution, abundance, and management of fisheries in a changing climate. Mar. Ecol. Prog. Ser. 2021, 668, 185–214. [Google Scholar] [CrossRef]
  26. Bitiutskii, D.G.; Samyshev, E.Z.; Minkina, N.I.; Melnikov, V.V.; Chudinovskih, E.S.; Usachev, S.I.; Salyuk, P.A.; Serebrennikov, A.N.; Zuev, O.A.; Orlov, A.M. Distribution and demography of Antarctic krill and salps in the Atlantic sector of the Southern Ocean during austral summer 2021–2022. Water 2022, 14, 3812. [Google Scholar] [CrossRef]
  27. Gao, Q.; Xu, Z.; Huang, H.; Chen, X.; Feng, C.; Li, L. Geographical distribution and age composition of Euphausia superba larvae (Crustacea: Euphausiacea) in the South Shetland Islands region and southern Scotia Sea in relation to environmental conditions. Acta Oceanol. Sin. 2013, 32, 59–67. [Google Scholar] [CrossRef]
  28. Sologub, D.O. Distribution and age structure of euphausiids larvae at the Western Antarctic Peninsula (Subarea 48.1). Trudy VNIRO 2015, 154, 3–15. [Google Scholar]
  29. Kasyan, V.V. Age Structure and Spatial Distribution of Euphausia superba Larvae off the Antarctic Peninsula, Southern Ocean. Water 2022, 14, 3196. [Google Scholar] [CrossRef]
  30. Voronina, N.M. Pelagic Ecosystems of the Southern Ocean; Nauka: Moscow, Russia, 1984; pp. 5–206. [Google Scholar]
  31. McBride, M.; Dalpadado, P.; Drinkwater, K.; Godo, O.; Hobday, A.; Hollowed, A.; Kristiansen, T.; Murphy, E.; Ressler, P.; Subbey, S.; et al. Krill, climate, and contrasting future scenarios for Arctic and Antarctic fisheries. ICES J. Mar. Sci. 2014, 71, 1934–1955. [Google Scholar] [CrossRef]
  32. Takahashi, K.; Takamura, T.; Odate, T. Zooplankton communities along a Southern Ocean monitoring transect at 110 E from three CPR surveys (Dec 2014, Jan 2015, Mar 2015). Polar. Biol. 2021, 44, 1069–1081. [Google Scholar] [CrossRef]
  33. Johnston, N.M.; Murphy, E.J.; Atkinson, A.; Constable, A.J.; Cotte, C.; Cox, M.; Daly, K.L.; Driscoll, R.; Flores, H.; Halfter, S.; et al. Status, change, and futures of zooplankton in the Southern Ocean. Front. Ecol. Evol. 2022, 9, 624692. [Google Scholar] [CrossRef]
  34. Quetin, L.B.; Ross, R.M.; Frazer, T.K.; Haberman, K.L. Factors affecting distribution and abundance of zooplankton, with an emphasis on Antarctic krill, Euphausia superba. In Antarctic Research Series; Hofmann, E.E., Ross, R.M., Quetin, L.B., Eds.; American Geophysical Union: Washington, DC, USA, 1996; pp. 357–371. [Google Scholar] [CrossRef]
  35. Atkinson, A. Life cycle strategies of epipelagic copepods in the Southern Ocean. J. Mar. Syst. 1998, 15, 289–311. [Google Scholar] [CrossRef]
  36. Kawaguchi, S.; Nicol, S. Learning about Antarctic krill from the fishery. Antarct. Sci. 2007, 19, 219–230. [Google Scholar] [CrossRef]
  37. Siegel, V.; Reiss, C.S.; Dietrich, K.S.; Haraldsson, M.; Rohardt, G. Distribution and abundance of Antarctic krill (Euphausia superba) along the Antarctic Peninsula. Deep Res. Part I 2013, 77, 63–74. [Google Scholar] [CrossRef]
  38. Steinberg, D.K.; Ruck, K.E.; Gleiber, M.R.; Garzio, L.M.; Cope, J.S.; Bernard, K.S.; Stammerjohn, S.E.; Schofield, O.M.E.; Quetin, L.B.; Ross, R.M. Long-term (1993–2013) changes in macrozooplankton off the Western Antarctic Peninsula. Deep Sea Res. I 2015, 101, 54–70. [Google Scholar] [CrossRef]
  39. Weikert, H.; John, H.C. Experiences with a modified be multiple opening–closing plankton net. J. Plankton Res. 1981, 3, 167–176. [Google Scholar] [CrossRef]
  40. Tranter, D.J. (Ed.) Reviews on zooplankton sampling methods. In Zooplankton Sampling; Part I (2); UNESCO: Paris, France, 1968; pp. 11–144. [Google Scholar]
  41. Boltovskoy, D. South Atlantic Zooplankton; Backhuys Publishers: Leiden, The Netherlands, 1999; p. 868. [Google Scholar]
  42. WoRMS Editorial Board. World Register of Marine Species. 2015. Available online: http://www.marinespecies.org (accessed on 29 August 2022).
  43. Razouls, C.; De Bovee, F.; Kouwenberg, J.; Desreumaux, N. Diversity and Geographic Distribution of Marine Planktonic Copepods; CNRS—Sorbonne University: Paris, France, 2005–2022; Available online: http://copepodes.obs–banyuls.fr/en/ (accessed on 3 February 2022).
  44. Makarov, R.R. Larvae of Euphausia superba Dana in plankton from the Sea of Scotia. Tr. Vses. Nauchno-Issled. Ryb. Okeanogr. 1974, 99, 84–103. [Google Scholar]
  45. Pertsova, K.N. Larvae of euphausiids of the Antarctic. In Ecology and Biogeography of Plankton: Proceedings of the Institute of Oceanology RAS; Nauka: Moscow, Russia, 1976; Volume 105, pp. 147–170. [Google Scholar]
  46. Suntov, A.P. Manual on Quantitative Processing of Marine Net Plankton; TINRO: Vladivostok, Russia, 1982; pp. 1–29. (In Russian) [Google Scholar]
  47. Mizdalski, E. Weight and length data of zooplankton in the Weddell Sea in austral spring 1986 (ANT V/3). Ber. Polarforsch. 1988, 55, 1–72. [Google Scholar]
  48. Heywood, K.J.; Garabato, A.C.N.; Stevens, D.P.; Muench, R.D. On the fate of the Antarctic Slope Front and the origin of the Weddell Front. J. Geophys. Res. 2004, 109, C06021. [Google Scholar] [CrossRef]
  49. Thompson, A.F.; Heywood, K.J.; Thorpe, S.E.; Renner, A.H.H.; Trasvica, A. Surface circulation at the tip of the Antarctic Peninsula from drifters. J. Phys. Oceanog. 2009, 39, 3–26. [Google Scholar] [CrossRef]
  50. Morozov, E.G.; Flint, M.V.; Spiridonov, V.A. Antarctic Peninsula region of the Southern Ocean; Advances in Polar Ecology; Springer: Cham, Switzerland, 2021; Volume 6, p. 433. [Google Scholar] [CrossRef]
  51. Clark, K.R.; Warwick, R.M. Change in Marine Communities: An Approach to Statistical Analysis and Interpretation; PRIMER–E Ltd.: Plymouth, UK, 2001; p. 144. [Google Scholar]
  52. Bray, J.R.; Curtis, J.T. An ordination of the upland forest communities of Southern Wisconsin. Ecol. Monogr. 1957, 27, 325–349. [Google Scholar] [CrossRef]
  53. Clarke, K.R.; Ainsworth, M. A method of linking multivariate community structure to environmental variables. Mar. Ecol. Prog. Ser. 1993, 92, 205–219. [Google Scholar] [CrossRef]
  54. Clarke, K.R.; Gorley, R.N. PRIMER v6: User Manual/Tutorial; PRIMER–E Ltd.: Plymouth, UK, 2006; p. 192. [Google Scholar]
  55. Hammer, O.; Harper, D.A.T.; Ryan, P.D. PAST: Paleontological Statistics Software Package for Education and Data Analysis. Palaeontol. Electron. 2001, 4, 262. Available online: http://palaeo–electronica.org/2001_1/past/issue1_01.htm (accessed on 1 March 2023).
  56. Schlitzer, R. Ocean Data View; Alfred Wegener Institute: Bremerhaven, Germany, 2012; p. 151. Available online: http://odv.awi.de (accessed on 13 February 2023).
  57. Zhou, X.Q.; Zhu, G.P.; Hu, S. Influence of tides on mass transport in the Bransfield Strait and the adjacent areas. Antarct. Polar. Sci. 2020, 23, 100506. [Google Scholar] [CrossRef]
  58. Fedotova, A.A.; Stepanova, S.V. Water mass transformation in the Powell Basin. In Antarctic Peninsula Region of the Southern Ocean; Morozov, E.G., Flint, M.V., Spiridonov, V.A., Eds.; Springer: Cham, Switzerland, 2021; Volume 6, pp. 115–129. [Google Scholar] [CrossRef]
  59. Krechik, V.A.; Frey, D.I.; Morozov, E.G. Peculiarities of water circulation in the central part of the Bransfield Strait in January 2020. Dokl. Earth Sci. 2021, 496, 92–95. [Google Scholar] [CrossRef]
  60. Frey, D.I.; Krechik, V.A.; Morozov, E.G.; Drozd, I.D.; Gordey, A.S.; Latushkin, A.A.; Mekhova, O.S.; Mukhametianov, R.Z.; Murzina, S.A.; Ostroumova, S.A.; et al. Water Exchange between Deep Basins of the Bransfield Strait. Water 2022, 14, 3193. [Google Scholar] [CrossRef]
  61. Lee, W.; Kim, S.; Kang, S.; Bang, H.; Lee, K.; Kwak, I. Distribution and abundance of zooplankton in the Bransfield Strait and the western Weddell Sea during austral summer. Ocean Polar. Res. 2004, 26, 607–618. [Google Scholar] [CrossRef]
  62. Atkinson, A.; Ward, P.; Hunt, B.P.V.; Pakhomov, E.A.; Hosie, G.W. An overview of Southern Ocean zooplankton data: Abundance, biomass, feeding and functional relationships. CCAMLR Sci. 2012, 19, 171–218. [Google Scholar]
  63. Edwards, M.; Bresnan, E.; Cook, K.; Heath, M.; Helaouet, P.; Lynam, C.; Raine, R.; Widdicombe, C. Impacts of climate change on plankton. MCCIP Sci. Rev. 2013, 4, 98–112. [Google Scholar] [CrossRef]
  64. Sallee, J.B. Southern Ocean warming. Oceanography 2018, 31, 52–62. [Google Scholar] [CrossRef]
  65. Schofield, O.; Brown, M.; Kohut, J.; Nardelli, S.; Saba, G.; Waite, N.; Ducklow, H. Changing upper ocean mixed layer depth and phytoplankton productivity along the West Antarctic Peninsula. Philos. Trans. R. Soc. A 2018, 376, 20170174. [Google Scholar] [CrossRef]
  66. Moline, M.A.; Claustre, H.; Frazer, T.K.; Schofield, O.; Vernet, M. Alteration of the food web along the Antarctic Peninsula in response to a regional warming trend. Glob. Chang. Biol. 2004, 10, 1973–1980. [Google Scholar] [CrossRef]
  67. Montes-Hugo, M.; Doney, S.C.; Ducklow, H.W.; Fraser, W.; Martinson, D.; Stammerjohn, S.E.; Schofield, O. Recent changes in phytoplankton communities associated with rapid regional climate change along the Western Antarctic Peninsula. Science 2009, 323, 1470–1473. [Google Scholar] [CrossRef]
  68. Biggs, T.E.G.; Alvarez-Fernandez, S.; Evans, C.; Mojica, K.D.A.; Rozema, P.D.; Venables, H.J.; Pond, D.W.; Brussaard, C.P.D. Antarctic phytoplankton community composition and size structure: Importance of ice type and temperature as regulatory factors. Polar. Biol. 2019, 42, 1997–2015. [Google Scholar] [CrossRef]
  69. Atkinson, A.; Hill, S.L.; Pakhomov, E.A.; Siegel, V.; Anadon, R.; Chiba, S.; Daly, K.L.; Downie, R.; Fielding, S.; Fretwell, P.; et al. KRILLBASE: A circumpolar database of Antarctic krill and salp numerical densities, 1926–2016. Earth Syst. Sci. Data 2017, 9, 193–210. [Google Scholar] [CrossRef]
  70. Morozov, E.G.; Krechik, V.A.; Frey, D.I.; Polukhin, A.A.; Artemiev, V.A.; Kasyan, V.V.; Sapozhnikov, P.V.; Mukhametianov, R.Z. Frontal Zone between Relatively Warm and Cold Waters in the Northern Weddell Sea. In Antarctic Peninsula Region of the Southern Ocean; Morozov, E.G., Flint, M.V., Spiridonov, V.A., Eds.; Springer: Cham, Switzerland, 2021; Volume 6, pp. 31–54. [Google Scholar] [CrossRef]
  71. Gallienne, C.P.; Robins, D.B. Is Oithona the most important copepod in the world’s oceans? J. Plankton Res. 2001, 23, 1421–1432. [Google Scholar] [CrossRef]
  72. Skjoldal, H.R.; Wiebe, P.H.; Postel, L.; Knutsen, T.; Kaartvedt, S.; Sameoto, D.D. Intercomparison of zooplankton (net) sampling systems: Results the ICES/GLOBEC sea-going workshop. Prog. Oceanogr. 2013, 108, 1–42. [Google Scholar] [CrossRef]
  73. Morozov, E.G.; Flint, M.V.; Orlov, A.M.; Frey, D.I.; Molodtsova, T.N.; Krechik, V.A.; Latushkin, A.A.; Salyuk, P.A.; Murzina, S.A.; Minin, K.V.; et al. Oceanographic and Ecosystem Studies in the Atlantic Sector of Antarctica (Cruise 87 of the Research Vessel Akademik Mstislav Keldysh). Oceanology 2022, 62, 825–827. [Google Scholar] [CrossRef]
  74. Hopkins, T.L.; Torres, J.J. The zooplankton community in the vicinity of the ice edge, western Weddell Sea, March 1986. Polar. Biol. 1988, 9, 79–87. [Google Scholar] [CrossRef]
  75. Voronina, N.M.; Kosobokova, K.N.; Pakhomov, E.A. Composition and biomass of summer metazoan plankton in the 0–200 m layer of the Atlantic sector of the Antarctic. Polar. Biol. 1994, 14, 91–95. [Google Scholar] [CrossRef]
  76. Fransz, H.G.; Gonzalez, S.R. The production of Oithona similis (Copepoda: Cyclopoida) in the Southern Ocean. ICES (Int. Counc. Explor. Sea) J. Mar. Sci. 1995, 52, 549–555. [Google Scholar]
  77. Pinkerton, M.H.; Smith, A.N.H.; Raymond, B.; Hosie, G.W.; Sharp, B.; Leathwick, J.R.; Bradford-Grieve, J.M. Spatial and seasonal distribution of adult Oithona similis in the Southern Ocean: Predictions using boosted regression trees. Deep Sea Res. I 2010, 57, 469–485. [Google Scholar] [CrossRef]
  78. Takahashi, M.; Nemoto, T. The food of some Antarctic fish in the western Ross Sea in summer 1979. Polar. Biol. 1984, 3, 237–239. [Google Scholar] [CrossRef]
  79. Spiridonov, V.A.; Zalota, A.K.; Yakovenko, V.A.; Gorbatenko, K.M. Composition of population and transport of juveniles of Antarctic krill in Powell Basin region (northwestern Weddell Sea) in January 2020. Tr. VNIRO 2020, 181, 33–51. [Google Scholar] [CrossRef]
  80. Tarling, G.A.; Peck, V.; Ward, P.; Ensor, N.; Achterberg, E.; Tynan, E.; Poulton, A.J.; Mitchell, E.; Zubkov, M.V. Effects of acute ocean acidification on spatially–diverse polar pelagic foodwebs: Insights from on–deck microcosms. Deep-Sea Res. II 2016, 127, 75–92. [Google Scholar] [CrossRef]
  81. Trifoglio, N.L.; Olguin Salinas, H.F.; Franzosi, C.A.; Alder, V.A. Annual cycle of phytoplankton, protozoa and diatom species from Scotia Bay (South Orkney Islands, Antarctica): Community structure prior to, during and after an anomalously low sea ice year. Prog. Oceanogr. 2022, 204, 102807. [Google Scholar] [CrossRef]
  82. Quetin, L.B.; Ross, R.M. Feeding by Antarctic krill, Euphausia superba: Does size matter? In Antarctic Nutrient Cycles and Food Webs; Siegfried, W.R., Condy, P.R., Laws, R.M., Eds.; Springer: Berlin, Germany, 1985; pp. 372–377. [Google Scholar]
  83. Granli, E.; Graneli, W.; Rabbani, M.M.; Daugbjerg, N.; Fransz, G.; Roudy, J.C.; Alder, V.A. The influence of copepod and krill grazing on the species composition of phytoplankton communities from the Scotia Weddell Sea. Polar. Biol. 1993, 13, 201–213. [Google Scholar] [CrossRef]
  84. Froneman, P.W.; Perissinotto, R. Microzooplankton grazing and protozooplankton community structure in the South Atlantic and in the Atlantic sector of the Southern Ocean. Deep Sea Res. 1996, 43, 703–721. [Google Scholar] [CrossRef]
  85. Perissinotto, R.A.; Pakhomov, E.A. The trophic role of the tunicate Salpa thompsoni in the Antarctic marine ecosystem. J. Mar. Syst. 1998, 17, 361–374. [Google Scholar] [CrossRef]
  86. Flores, H.; Hunt, B.P.V.; Kruse, S.; Pakhomov, E.A.; Siegel, V.; van Franeker, J.A.; Strass, V.; Van de Putte, A.P.; Meesters, E.H.W.G.; Bathmann, U. Seasonal changes in the vertical distribution and community structure of Antarctic macrozooplankton and micronekton. Deep Sea Res. 2014, 84, 127–141. [Google Scholar] [CrossRef]
  87. Takahashi, K.T.; Ojima, M.; Tanimura, A.; Odate, T.; Fukuchi, M. The vertical distribution and abundance of copepod nauplii and other micro- and mesozooplankton in the seasonal ice zone of Lützow-Holm Bay during austral summer 2009. Polar. Biol. 2017, 40, 79–93. [Google Scholar] [CrossRef]
  88. Conroy, J.A.; Steinberg, D.K.; Thibodeau, P.S.; Schofield, O. Zooplankton diel vertical migration during Antarctic summer. Deep Sea Res. I 2020, 162, 103324. [Google Scholar] [CrossRef]
  89. Delgado, L.E.; Jana, R.; Mari, V.H. Testing hypotheses on life-cycle models for Antarctic calanoid copepods, using qualitative, winter, zooplankton samples. Polar. Biol. 1998, 20, 74–76. [Google Scholar] [CrossRef]
  90. Tarling, G.A.; Ward, P.; Thorpe, S.E. Spatial distributions of Southern Ocean mesozooplankton communities have been resilient to long-term surface warming. Glob. Chang. Biol. 2018, 24, 132–142. [Google Scholar] [CrossRef]
  91. Mackintosh, N.A. Life cycle of Antarctic krill in relation to ice and water conditions. Discov. Rep. 1972, 36, 1–94. [Google Scholar]
  92. Ross, R.M.; Quetin, L.B.; Kirsch, E. Effect of temperature on developmental times and survival of early larval stages of Euphausia superba Dana. J. Exp. Mar. Biol. Ecol. 1988, 121, 55–71. [Google Scholar] [CrossRef]
  93. Ross, R.M.; Quetin, L.B.; Baker, K.S.; Vernet, M.; Smith, R.C. Growth limitation in young Euphausia superba under field conditions. Limnol. Oceanogr. 2000, 45, 31–43. [Google Scholar] [CrossRef]
  94. Kouwenberg, J.H.M.; Razouls, C.; Desreumaux, N. Southern Ocean pelagic copepods. In The Biogeographic Atlas of the Southern Ocean; De Broyer, C., Koubbi, P., Griffith, H.J., Raymond, B., d’Udekem d’Acoz, C., Van de Putte, A.D., Danis, B., David, B., Grant, S., Gutt, J., et al., Eds.; SCAR: Cambridge, UK, 2014; pp. 209–296. [Google Scholar]
  95. Cornils, A.; Sieger, R.; Mizdalski, E.; Schumacher, S.; Grobe, H.; Schnack-Schiel, S.B. Copepod species abundance from the Southern Ocean and other regions (1980–2005)—A legacy. Earth Syst. Sci. Data 2018, 10, 1457–1471. [Google Scholar] [CrossRef]
Figure 1. Map of the sampling stations and the main ocean currents designated according to [20,48,49,50]. Numerals are codes of the stations. Circles indicate plankton nets used at the stations: red is the Multinet, and yellow is WP-2. Dashed lines indicate currents in the study region: ACC is the Antarctic Circumpolar Current; BC, the Bransfield Current; ACoC, the Antarctic Coastal Current; ASF, the Antarctic Slope Front; WF, the Weddell Front.
Water 15 01948 g001
Figure 2. Values of water temperature (a), salinity (b), oxygen concentration (c), and chlorophyll a concentration (d) in the 50-, 100-, 200-, 500-, and 1000 m layers during the austral summer of 2022.
Water 15 01948 g002
Figure 3. The total abundance (a) and contribution of the major taxa (b) of mesozooplankton in the Bransfield Strait (BS), Antarctic Sound (AS), Weddell Sea (WS), and off the South Orkney Islands (SOI) during the austral summer 2022.
Water 15 01948 g003
Figure 4. The total biomass (a) and contribution of the major taxa (b) of mesozooplankton in the study region. For an explanation of acronyms, see Figure 3.
Water 15 01948 g004
Figure 5. Total copepod abundance (a) and biomass (b) during the austral summer of 2022. For an explanation of acronyms, see Figure 3.
Water 15 01948 g005
Figure 6. Vertical distribution (up to 1000 m) of the average abundance of mesozooplankton (a) and contribution of the major species/taxa (abundance, ind. m−3 and proportions, %) (b) off the western Antarctic Peninsula during the austral summer of 2022.
Water 15 01948 g006
Figure 7. Vertical distribution of average abundances of mesozooplankton (ind. m−3): (a) in the middle of the Bransfield Strait (BS); (b) in the Bransfield Strait off the South Shetland Islands; (c) in the deep-sea waters of the Antarctic Sound (AS); (d) in the southwestern Powell Basin (WS); (e) in the northeastern Powell Basin (WS); (f) in the coastal waters off the South Orkney Islands (SOI); (g) in the deep-sea waters off the South Orkney Islands (SOI).
Water 15 01948 g007
Figure 8. nMDS ordination plot (a) based on abundance of mesozooplankton by the Bray–Curtis similarity matrix, and location of the groups of stations in the inner (ISAP, green circles) and outer (OSAP, blue circles) sectors off the western Antarctic Peninsula (b). Blank circles mean non-recognized group.
Water 15 01948 g008
Figure 9. Canonical correspondence analysis (CCA) of mesozooplankton composition (in red) in relationships with the environmental variables (in blue). The symbols of the mesozooplankton communities (circles), as they were disclosed by nMDS analysis (see Figure 8), were superimposed on the station labels. Abbreviations of the taxa are as follows: large copepods (LCop), small copepods (SCop), ostracods (Ostr), cirripeds cypris larvae (Cirrip), pelagic tunicates (Salp), amphipods (Amph), chaetognaths (Chaet), and euphausiid (Euph) eggs and larvae. For explanations for abbreviations of environmental variables, see Table 1.
Water 15 01948 g009
Table 1. The environmental variables (mean ± SD) in the Bransfield Strait (BS), Antarctic Sound (AS), Weddell Sea (WS), and off the South Orkney Islands (SOI) during the austral summer of 2022.
VariablesStudy Region
BSASWSSOI
50 m S34.46 ± 0.1434.49 ± 0.0734.27 ± 0.1534.32 ± 0.08
200 m S34.56 ± 0.0734.53 ± 0.0434.60 ± 0.0734.59 ± 0.04
500 m S34.62 ± 0.0834.54 ± 0.0334.70 ± 0.0934.74 ± 0.01
50 m T0.53 ± 0.61−0.25 ± 0.140.47 ± 0.631.35 ± 0.41
200 m T−0.11 ± 0.55−0.41 ± 0.07−0.77 ± 0.72−0.37 ± 0.33
500 m T−0.28 ± 0.68−0.63 ± 0.37−0.10 ± 0.910.27 ± 0.19
50 m O210.49 ± 0.2510.76 ± 0.0110.50 ± 0.1910.46 ± 0.16
200 m O28.75 ± 0.9510.41 ± 0.128.17 ± 1.088.15 ± 0.75
500 m O28.12 ± 0.909.74 ± 0.597.09 ± 0.96.63 ± 0.29
50 m Chl a0.65 ± 0.261.17 ± 0.091.38 ± 1.821.15 ± 1.1
200 m Chl a0.12 ± 0.140.44 ± 0.140.07 ± 0.030.06 ± 0.01
500 m Chl a0.07 ± 0.080.11 ± 0.010.06 ± 0.030.04 ± 0.01
Notes: Abbreviations of environmental variables are as follows: salinity (S), temperature (T), chlorophyll a concentration (Chl a), and oxygen (O2) concentration in the surface (to 50 m), 200-, and 500 m layers.
Table 2. Combination of environmental variables leading to the best results (BEST analysis).
Number of VariablesCorrelation CoefficientSelections
20.400500 m S, 500 m Chl a
30.385500 m S, 50 m Chl a, 500 m Chl a
30.361500 m S, 200 m T, 500 m Chl a
30.353500 m S, 50 m S, 500 m Chl a
Table 3. Spearman’s rank order correlations between the quantitative value of mesozooplankton and the environmental variables. Significant correlations (p < 0.05) are highlighted in bold.
50 m T50 m S50 m O250 m Chl a200 m T200 m S200 m O2200 m Chl a500 m T500 m S500 m O2500 m Chl a
Abn Meso0.38−0.16−0.200.05−0.060.35−0.13−0.230.110.40−0.240.46
Bm Meso0.37−0.28−0.240.120.010.31−0.27−0.340.210.50−0.31−0.41
Abn Cop0.290.08−0.21−0.190.000.26−0.13−0.23−0.100.21−0.120.43
Bm Cop0.14−0.07−0.32−0.10−0.020.18−0.21−0.250.110.38−0.29−0.29
Abn Euph0.080.36−0.030.120.390.34−0.09−0.020.210.44−0.28−0.14
Bm Euph0.17−0.260.020.40−0.260.36−0.17−0.070.270.49−0.33−0.15
Notes: Abn, abundance (ind. m−3); Bm, biomass (mg WW m−3); Meso, mesozooplankton; Cop, copepods; and Euph, euphausiids. For explanations for abbreviations of environmental variables, see Table 1.
Table 4. Result of a SIMPER analysis of average abundance (N, ind. m−3) of mesozooplankton species/taxa with contributions (Contr, %) to and cumulative total (Cum, %) of intra-group similarity (SIM/SD) and between-group dissimilarity (DISS/SD) within the station groups of the inner (ISAP) and outer (OSAP) sectors off the western Antarctic Peninsula. The listed taxa contributed to at least 80% of the dissimilarity between the sectors.
TaxaOSAPISAPOSAP vs. ISAP
NSIM/SDContr, %NSIM/SDContr, %DISS/SDContr, %Cum, %
Similarity: 68.78Similarity: 64.81Dissimilarity: 41.82
E. superba calyptopis5.589.4214.811.33 2.8412.4812.48
E. superba furcilia4.731.739.910.77 1.8211.8924.37
E. superba eggs4.080.926.821.33 1.4310.3034.67
Calanus propinquus3.422.046.891.673.246.451.135.5740.24
Calanoides acutus4.936.7412.453.394.5614.671.314.6244.86
Rhincalanus gigas2.19 1.641.815.181.284.3249.18
Cirripedia0.79 1.45 1.204.2153.39
Polychaeta2.08 1.05 0.854.0257.42
Metridia gerlachei3.638.779.414.223.3015.771.453.9561.37
Oncea spp.1.00 0.53 0.923.5464.91
Ostracoda3.003.787.132.381.988.461.103.2668.17
Calanus simillimus1.03 1.25 1.282.9971.15
Oithona spp.5.0811.4313.955.425.4822.661.512.9074.06
Metridia spp.0.88 0.22 0.692.8176.87
Salpa thompsoni0.96 0.74 1.272.6382.01
Disclaimer/Publisher’s Note: The statements, opinions and data contained in all publications are solely those of the individual author(s) and contributor(s) and not of MDPI and/or the editor(s). MDPI and/or the editor(s) disclaim responsibility for any injury to people or property resulting from any ideas, methods, instructions or products referred to in the content.

