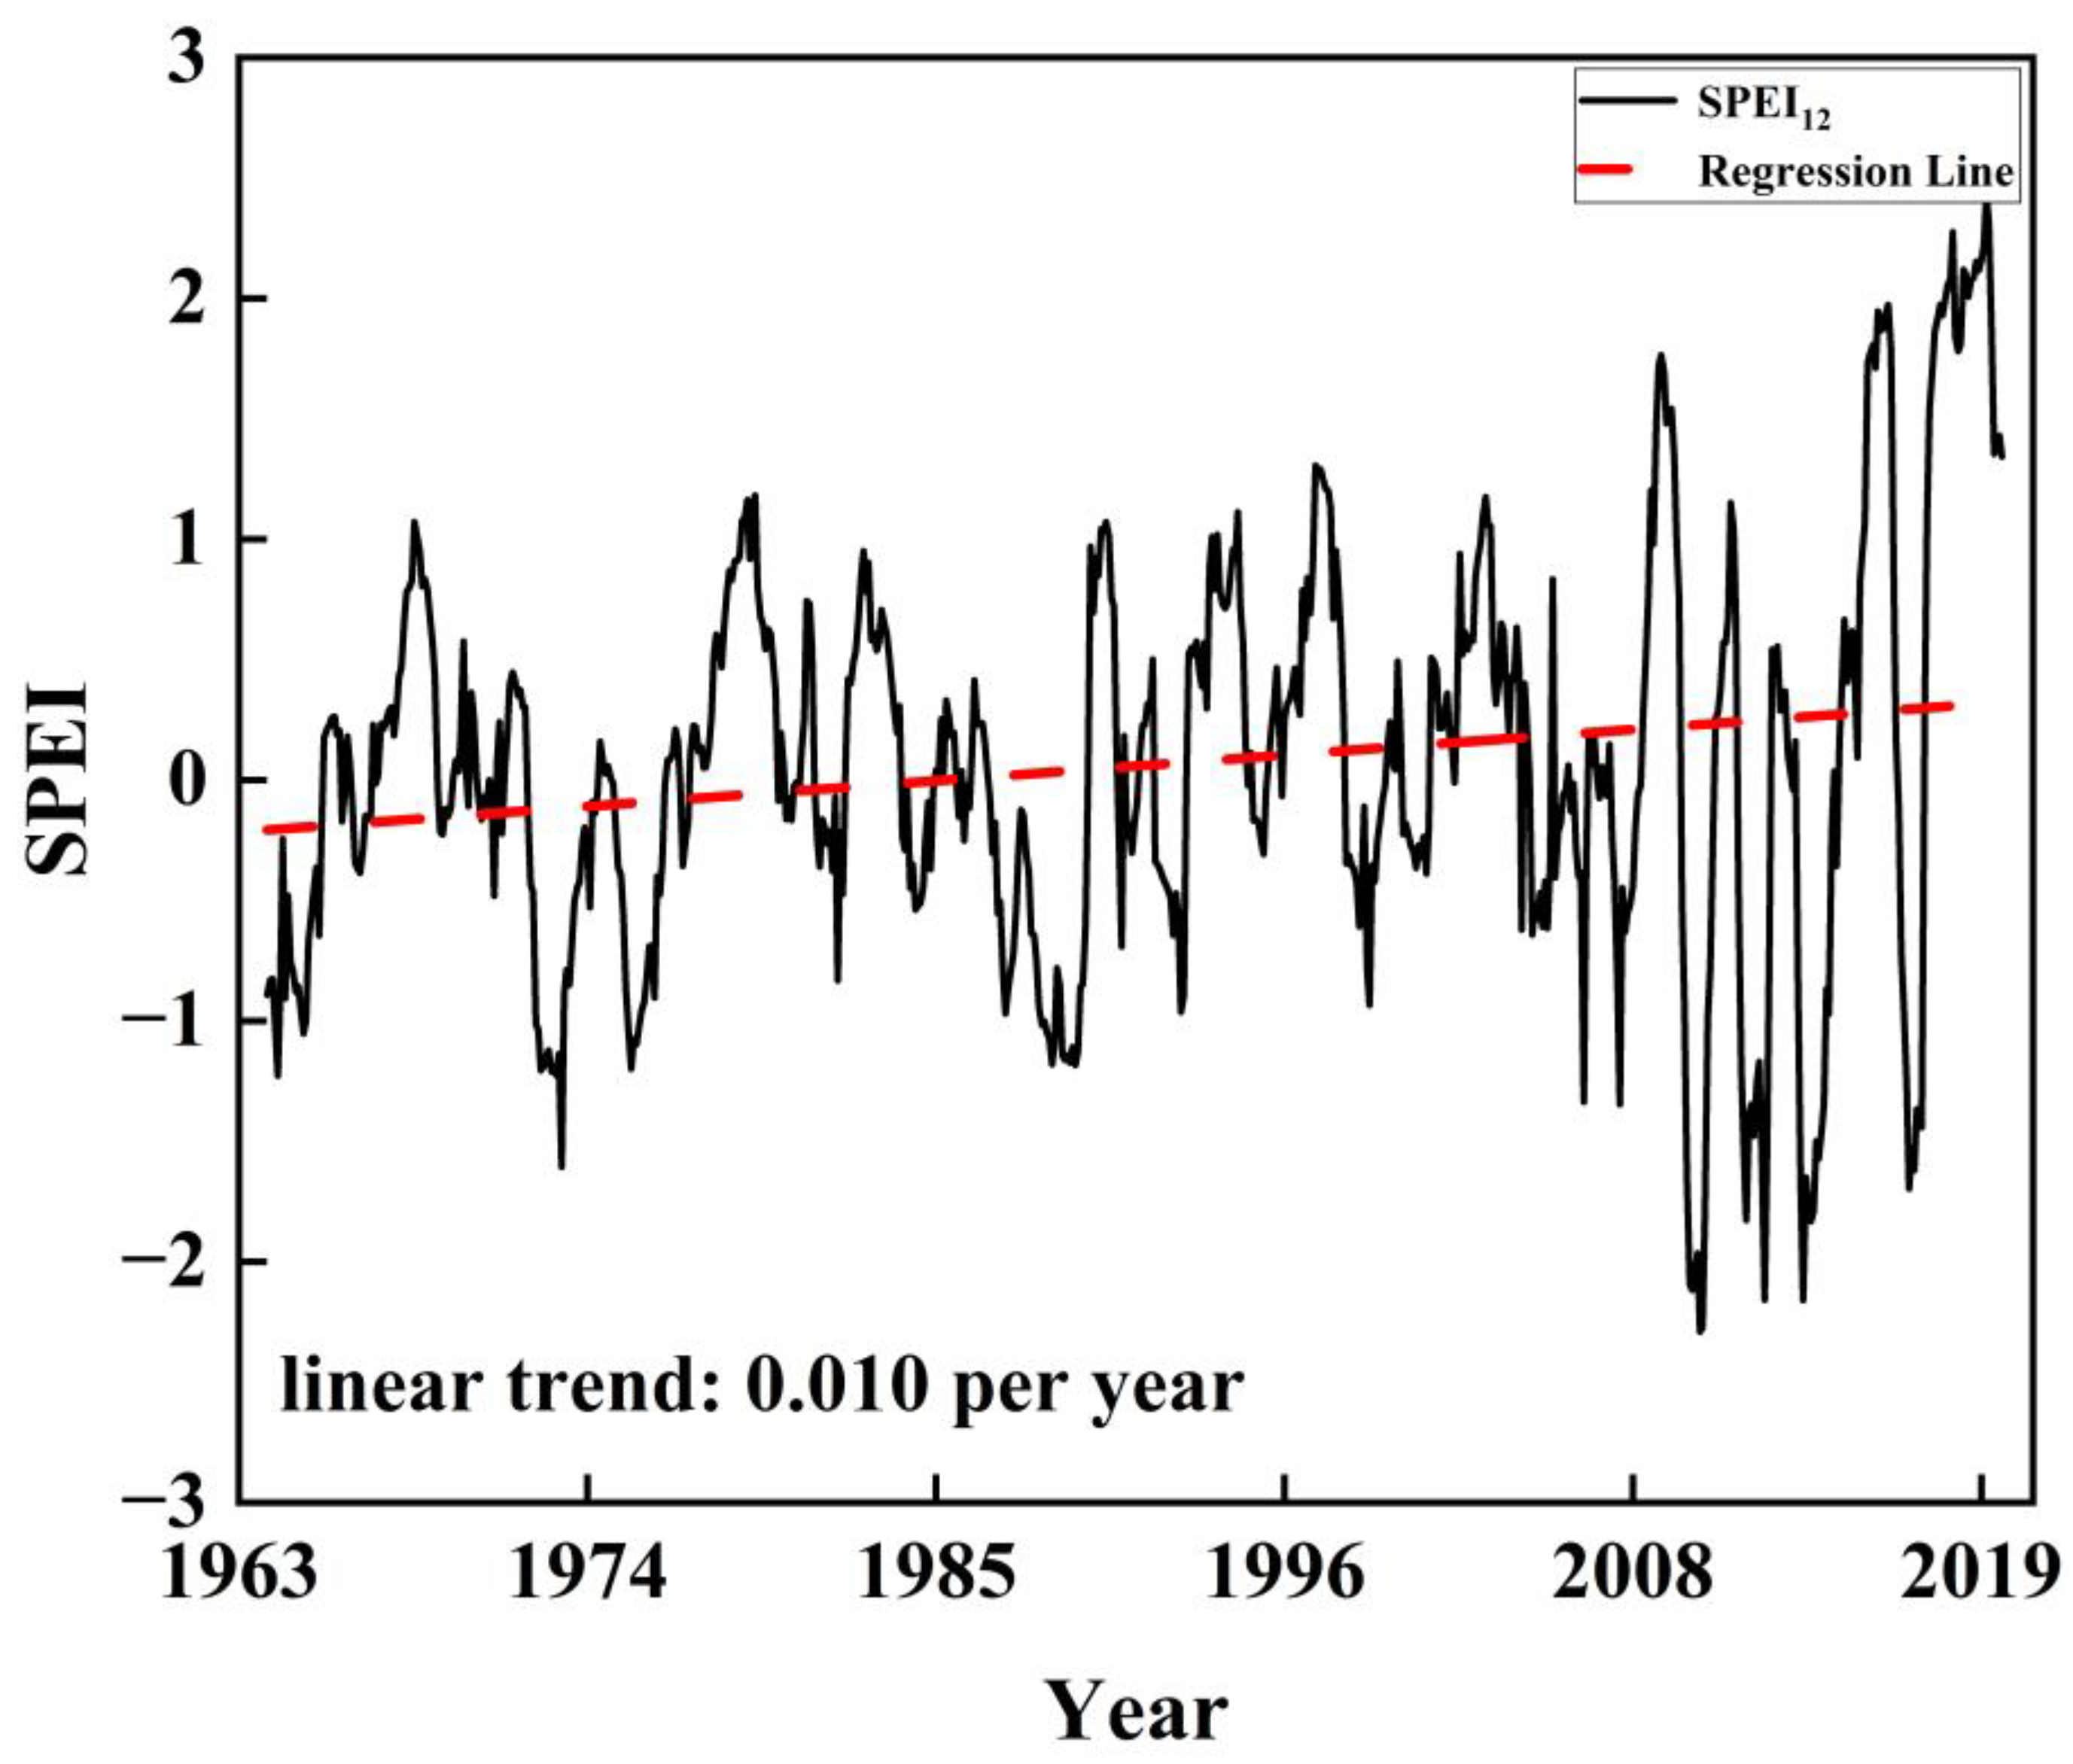
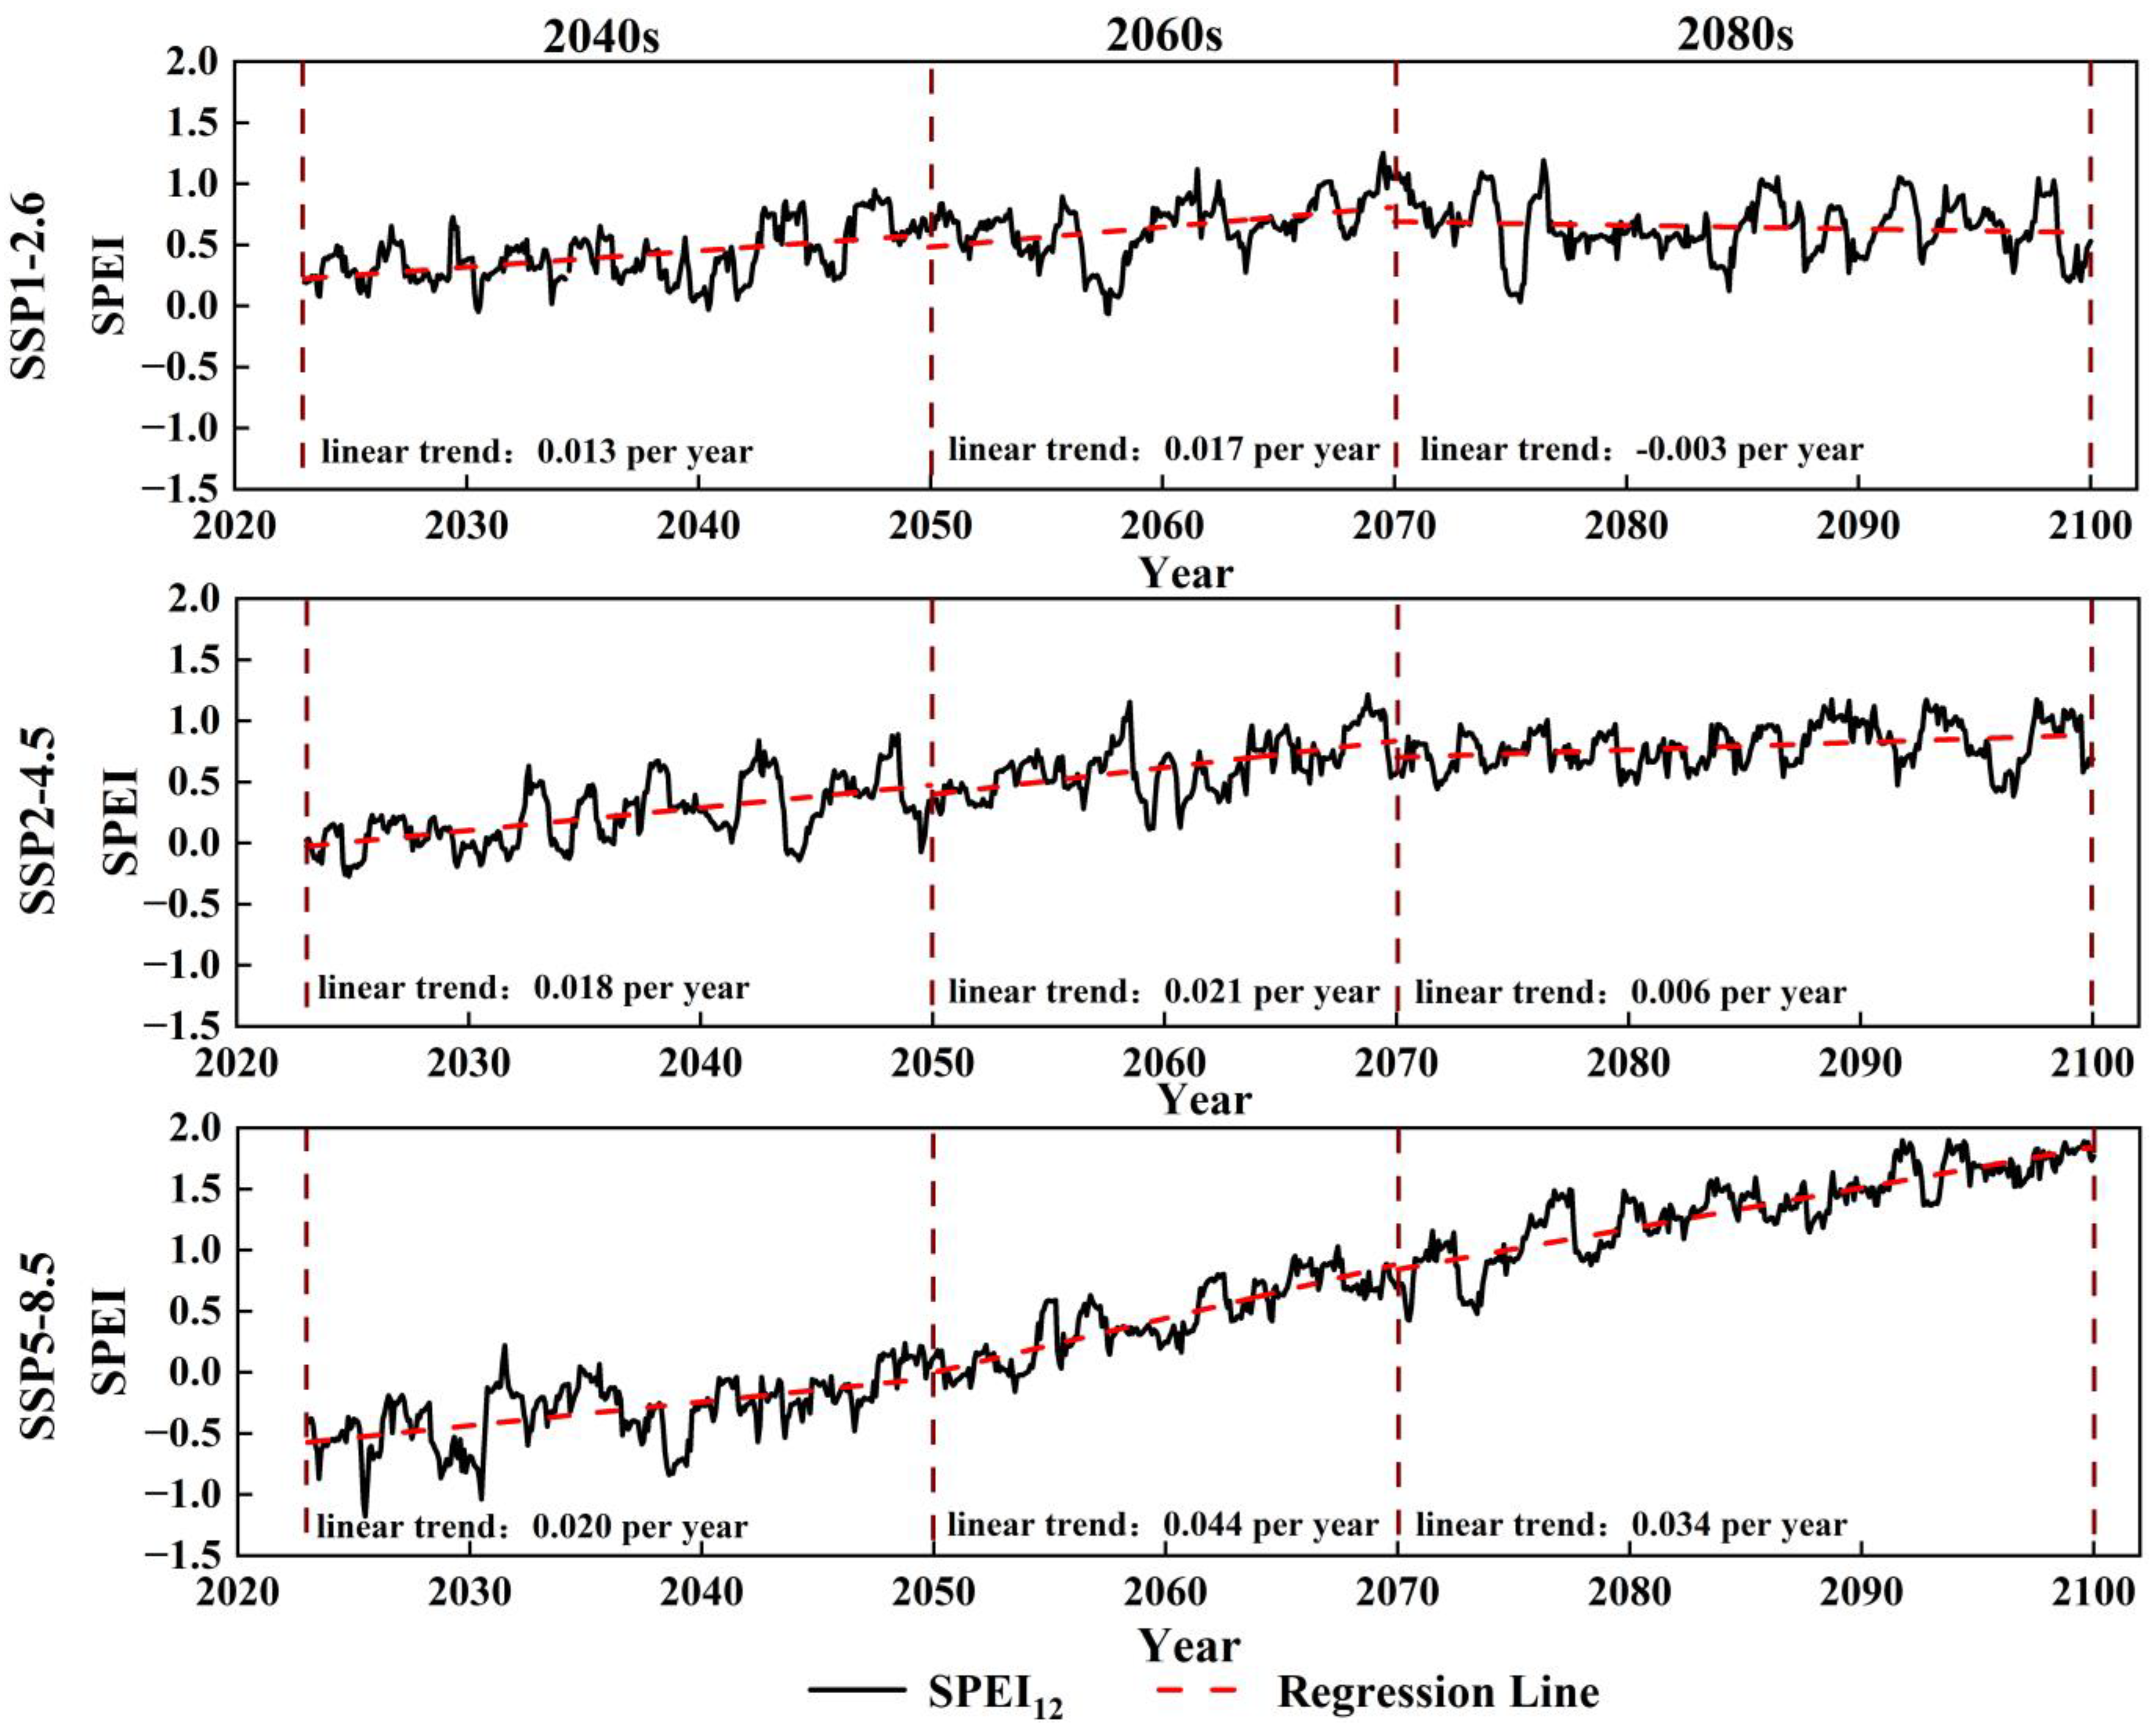
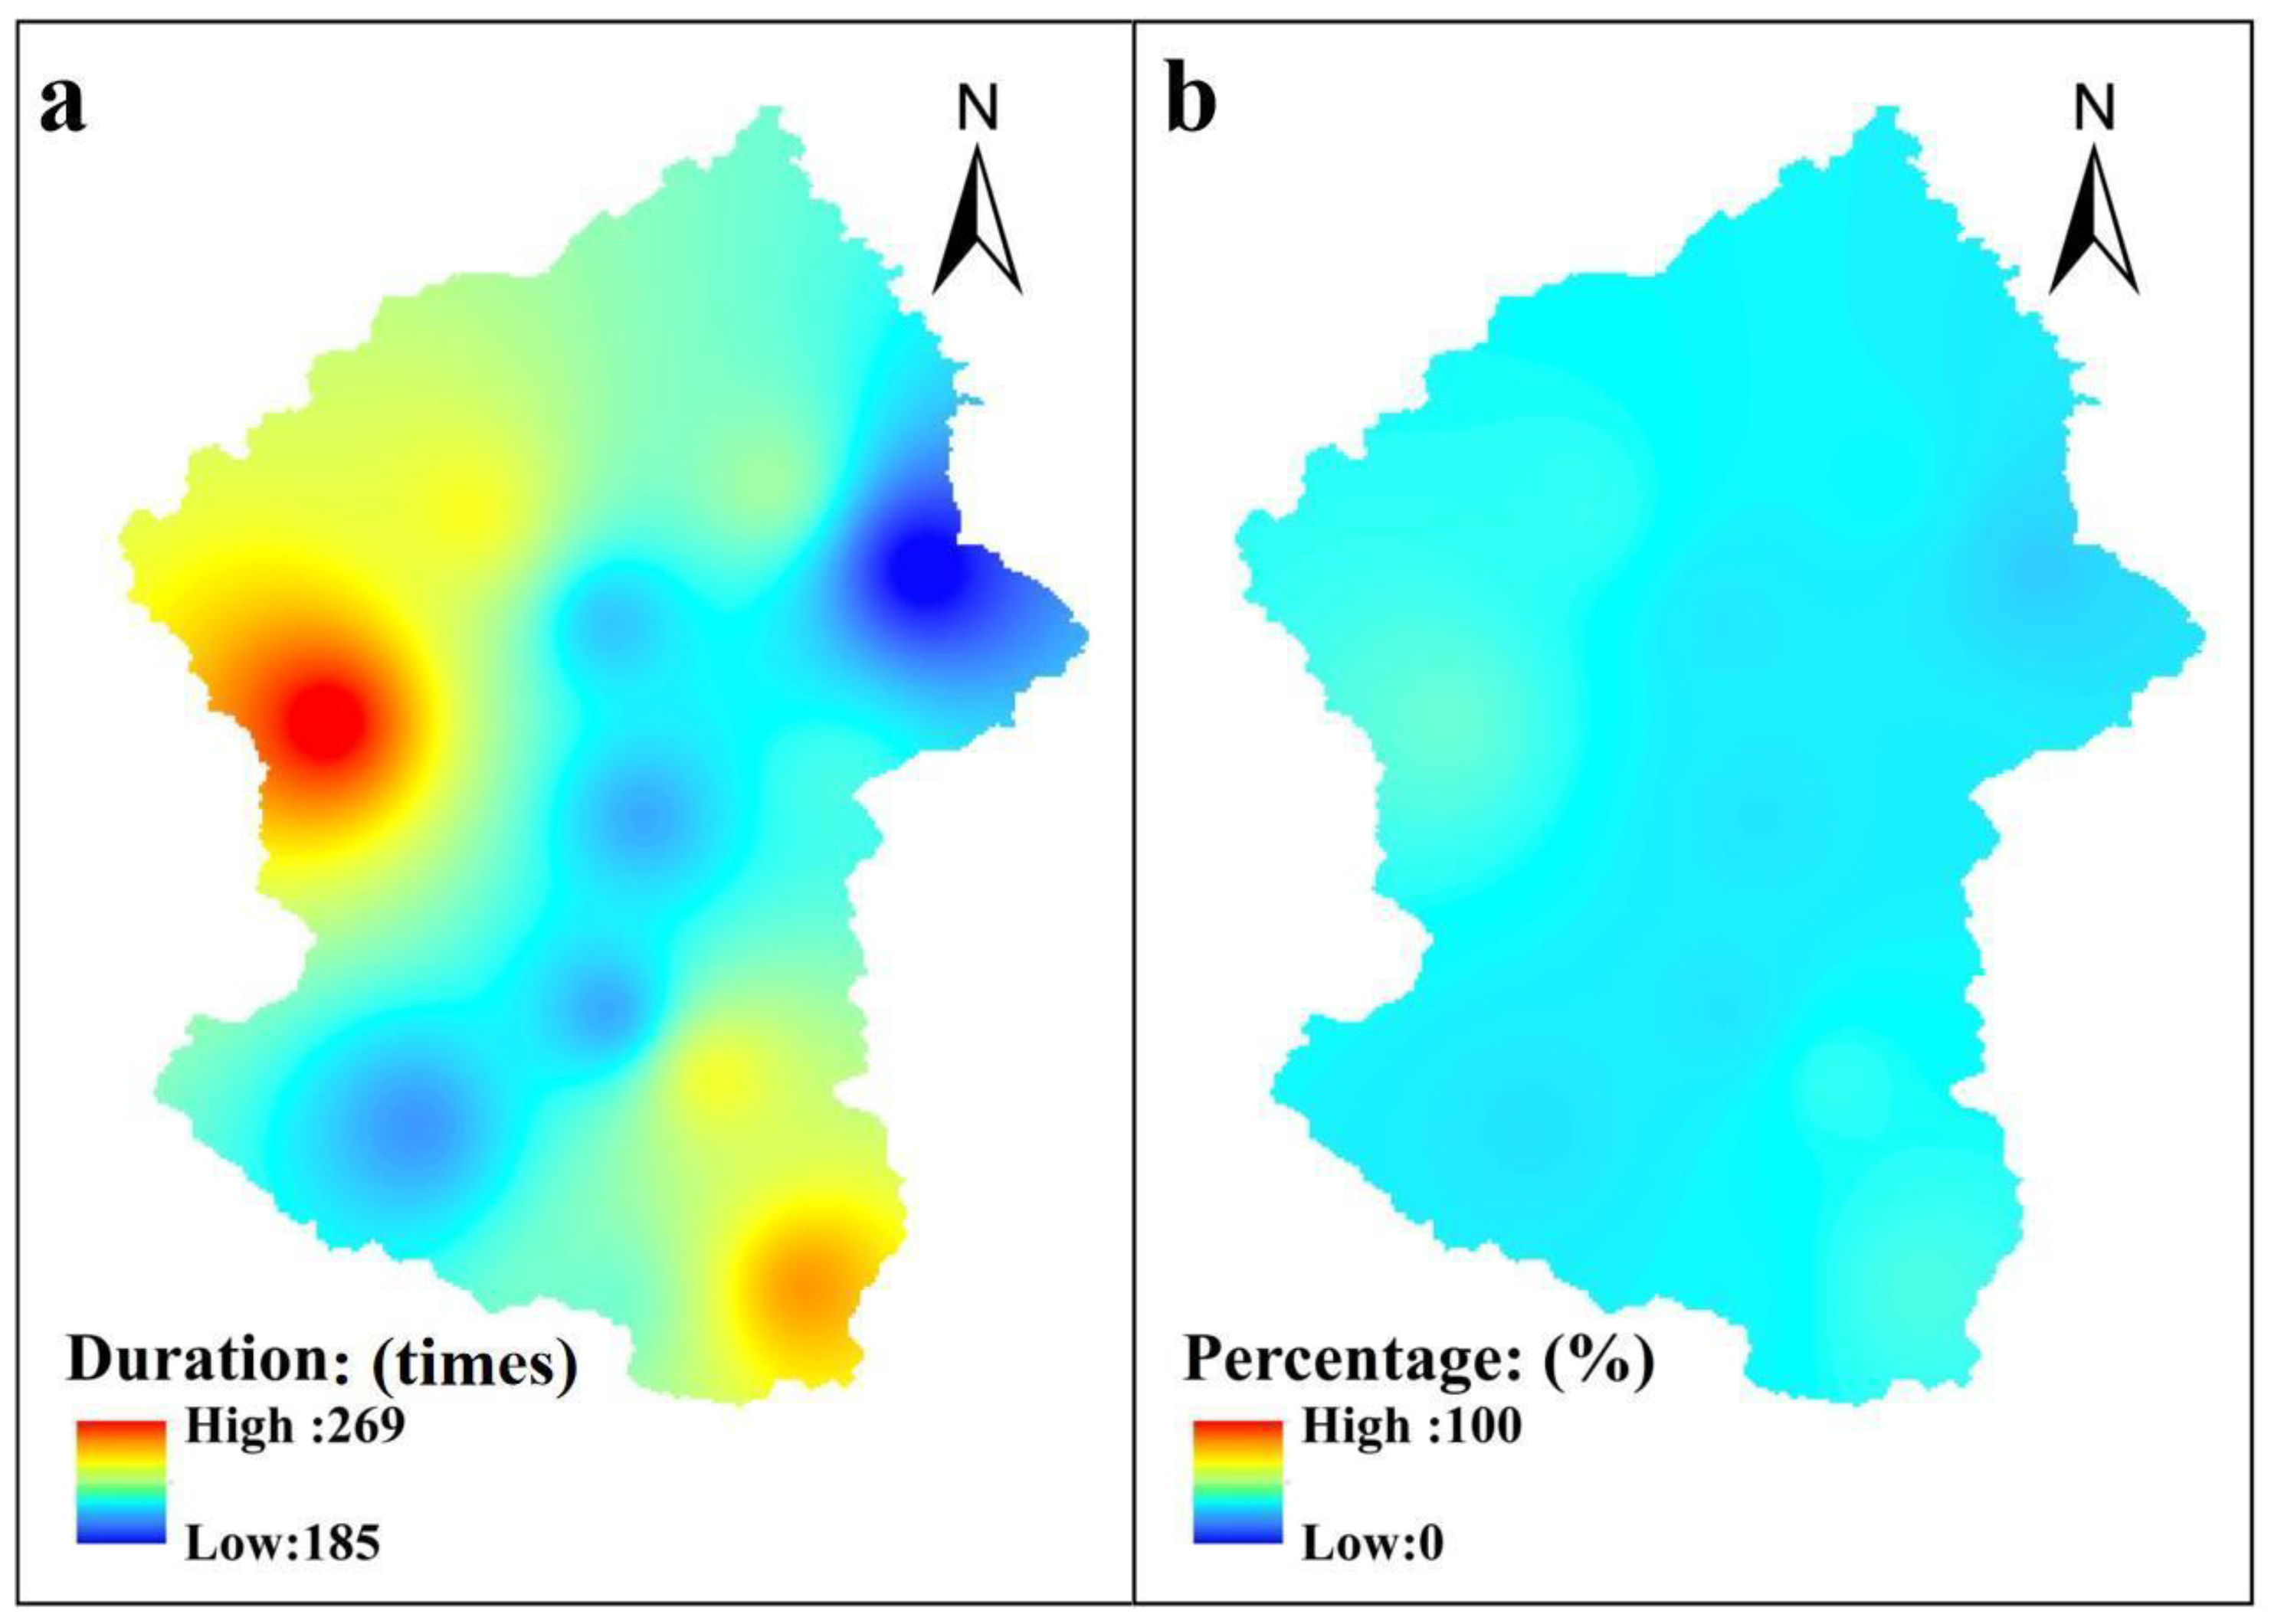
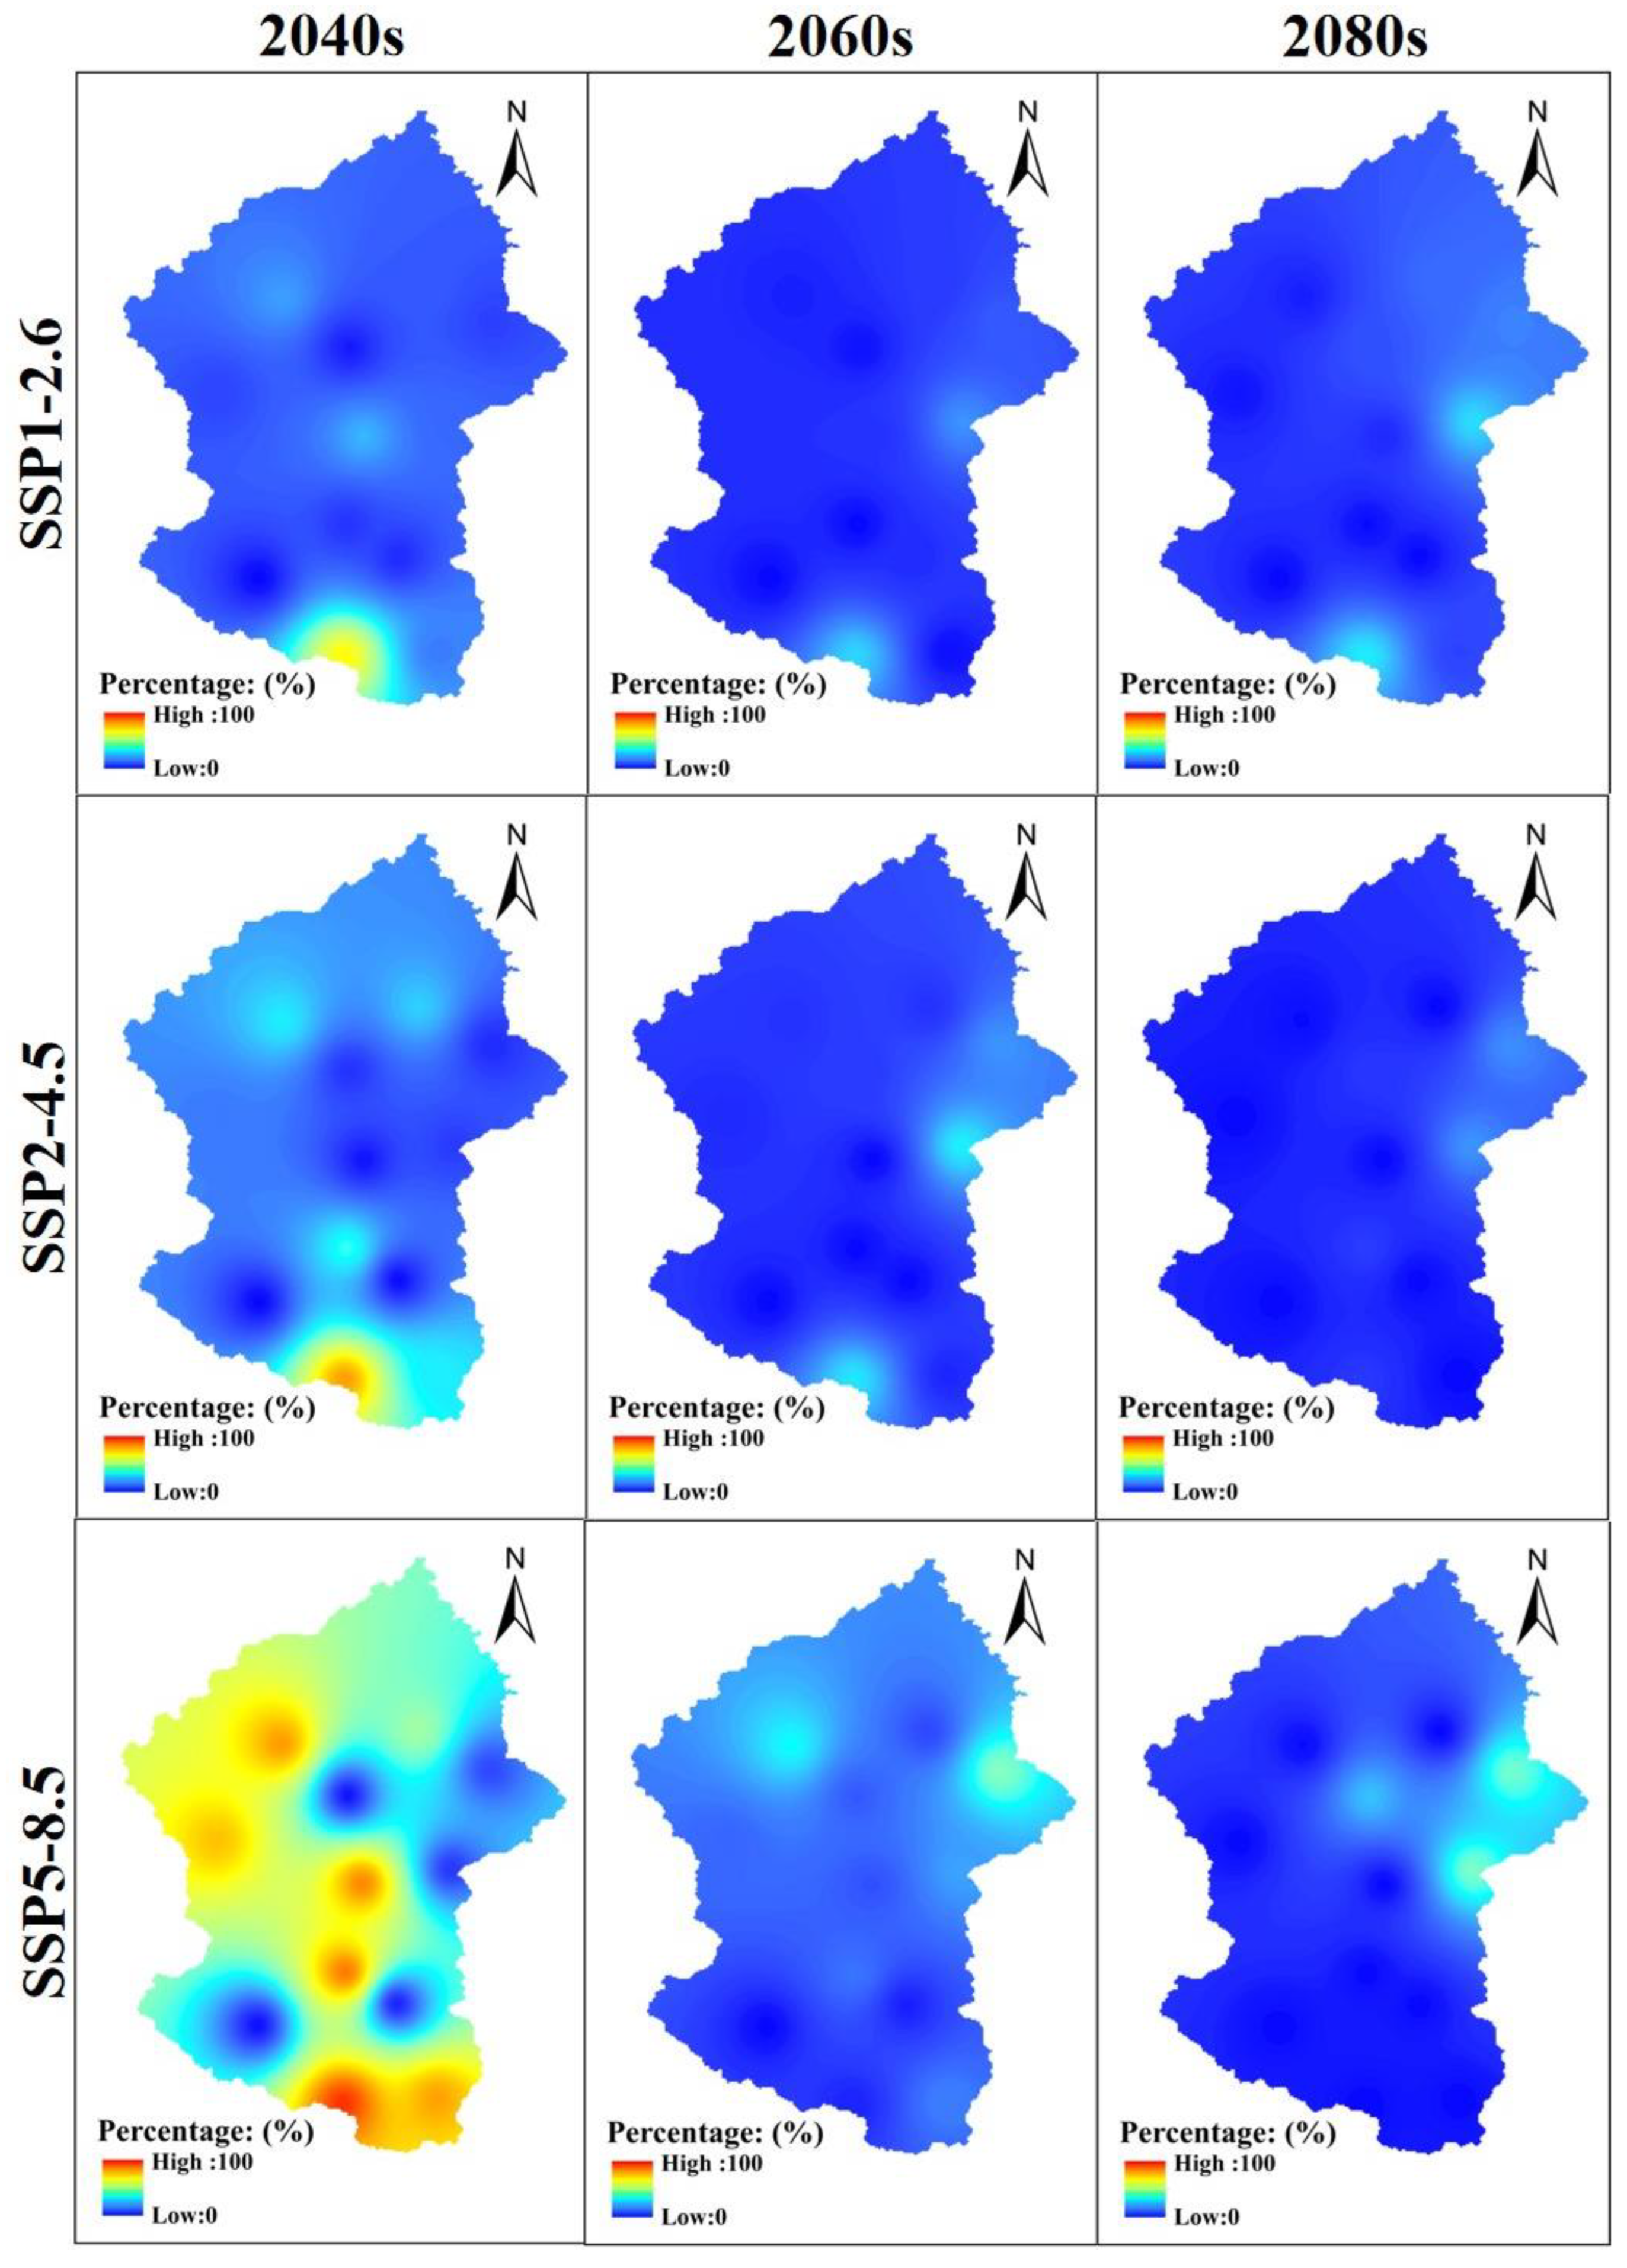
1. Introduction
Climate change can bring fluctuations in precipitation and temperature, which affect the hydrological cycle and runoff evolution processes [
1]. Insufficient precipitation or high temperature may lead to droughts, which are natural disasters with a high frequency, long duration, and wide coverage [
2]. For instance, Africa suffered a severe drought in 2019, which caused serious damage to food and water security [
3]. The frequency and severity of droughts has increased annually in northern China in recent years, affecting millions of people and causing tens of billions of dollars in economic losses each year [
4]. According to data from the U.S. Drought Monitoring Center, since 2000 there have been frequent drought hazards caused by extreme climate change in the southwestern United States, with 68% of the western United States suffering extreme or exceptional drought conditions from July to October 2021 [
5]. Therefore, to reduce the risk of severe drought events from climate change, it is of great practical significance to conduct drought assessment [
6].
The change projections of climate factors such as precipitation and temperature are prerequisites for drought assessment. The Global Climate Model (GCM) is the main tool for projecting climate factor changes. However, the horizontal resolution of the GCM model is mostly in the range of 100~300 km, which results in an undesirable performance when characterizing complex climatic heterogeneous features. Therefore, it cannot be directly used for the projection of small-scale climate change [
7]. To overcome this drawback, downscaling methods have been gradually proposed. These downscaling methods essentially comprise a technology by which information on largescale climate change with regional geographic factors is combined to obtain highly accurate spatial climate information. At present, the main downscaling methods are dynamic downscaling and statistical downscaling [
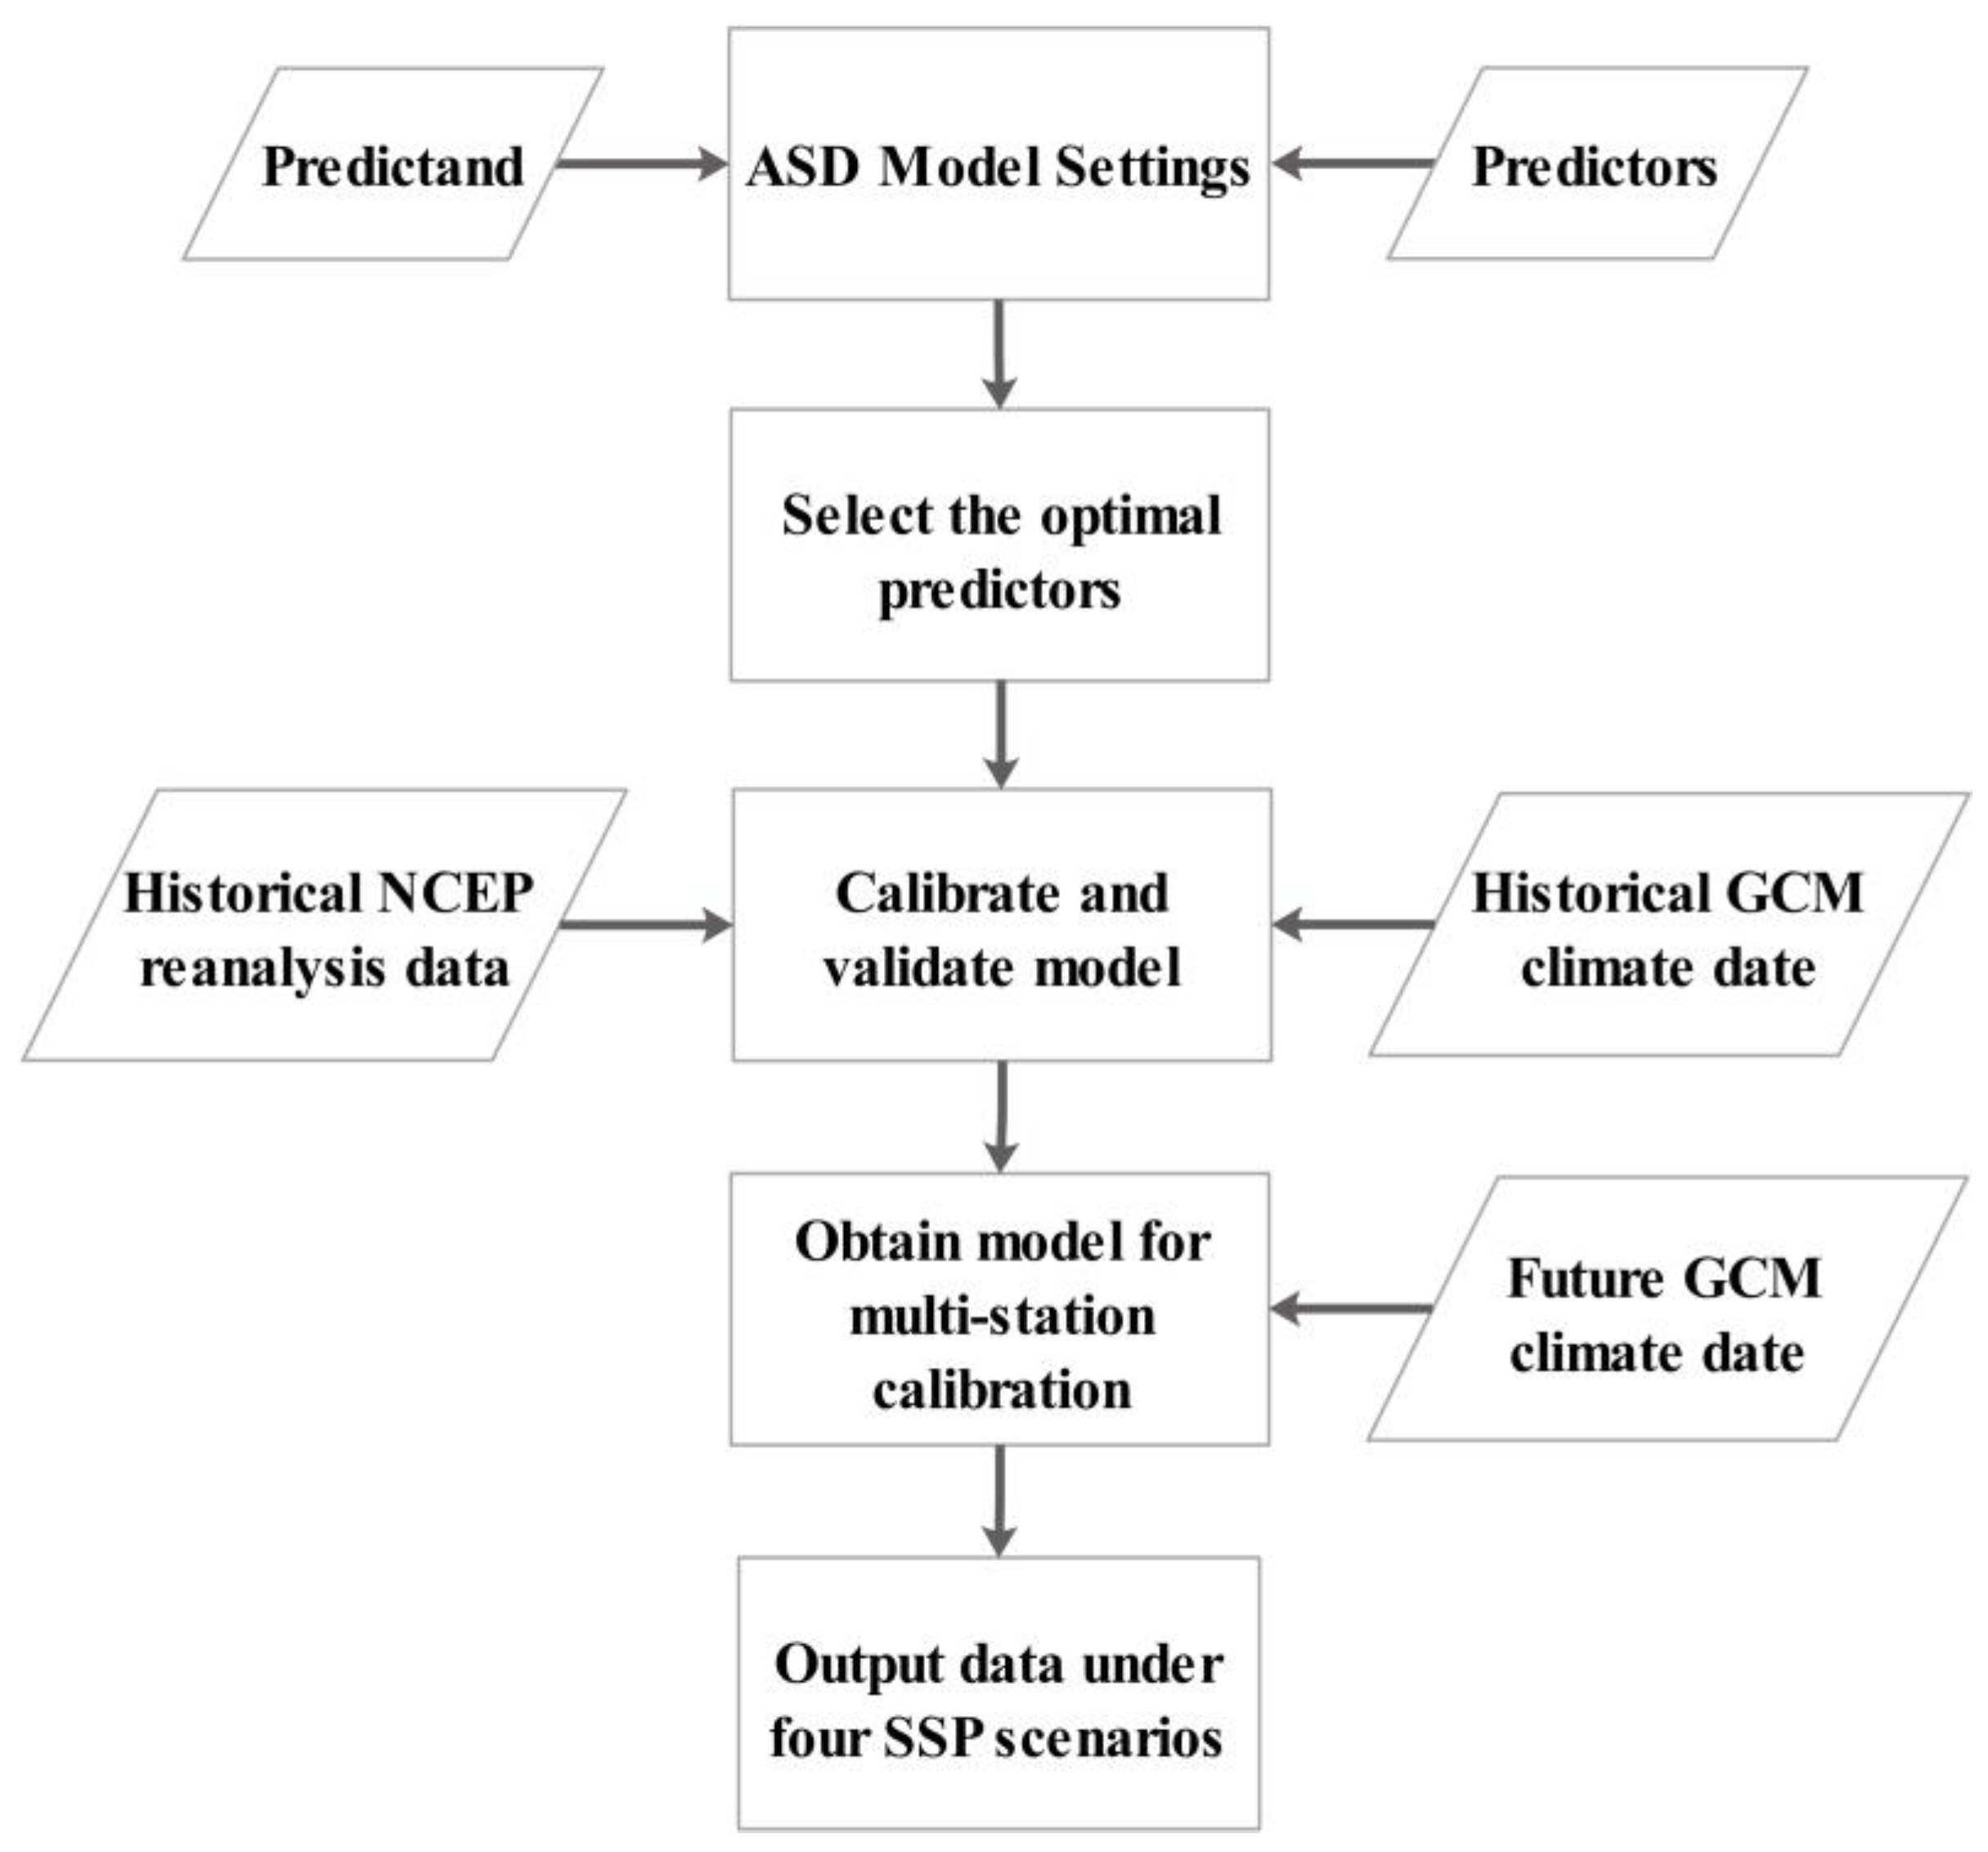
8]. Dynamic downscaling can embed the Regional Climate Model (RCM) into the GCM to obtain accurate regional meteorological information; however, this method is labor intensive and computationally complex. However, the statistical downscaling model is simple and convenient to apply and can correct the large-scale GCM results by establishing statistical relationships through actual observations, thus reducing errors and biases and allowing the relatively accurate acquisition of future climate change in small- and medium-sized regions. Owing to its simplicity and reliability, this study adopted a typical statistical method, the automated statistical downscaling (ASD) model, as a tool for downscaling.
The GCM climate data after downscaling can be used to calculate drought indexes for assessing drought. Some common drought indicators are the self-calibrating Palmer Drought Severity Index (scPDSI) [
9], the Standardized Precipitation Index (SPI) [
10], the Standardized Precipitation Evapotranspiration Index (SPEI) [
11], and the New Drought Index (NDI) [
12]. In drought assessment, the scPDSI is sensitive to temperature, but only at time scales of weeks and months. the SPI can reflect multi-temporal and multi-spatial regional drought conditions, but it ignores the influence of temperature on drought trends. In the context of global warming, there will be some errors when using SPI to assess regional drought conditions. However, the SPEI combines the strengths of the two previous indices while considering the effects of both precipitation and temperature, which can better reflect the condition of regional drought. The NDI is calculated using precipitation and temperature and their average and standard deviation. In recent years, scholars have conducted numerous studies in regional drought assessment based on GCM climate data and different drought indexes. For example, Ahmadalipour et al. [
13] chose the SPI and SPEI to synthetically assess the drought conditions in the United States from 1950 to 2099, and their results reveal that the frequency and intensity of droughts might increase significantly in the future. Ali et al. [
14] projected precipitation and temperature under two Representative Concentration Pathways (RCP 4.5 and RCP 8.5) in Ankara, and then evaluated Ankara’s meteorological drought using the SPI and SPEI, showing that the future drought situation in Turkey might be alleviated. Li et al. [
15] analyzed the severity of drought in northwest China using the PDSI under three Shared Socio-Economic Pathways (SSP1-2.6, SSP2-4.5, and SSP5-8.5) from 2015 to 2099. Among these widely used drought indexes, the SPEI considers the influence of both precipitation and temperature on drought. At different time scales, the SPEI can reflect drought conditions under different stages. The 3-month SPEI can reflect the seasonal wet and dry conditions, which can be used for the analysis of agricultural drought conditions, while the 12-month SPEI can reflect the overall annual drought conditions and the influence of climate change on water resources [
16]. Because the SPEI has a promising ability to characterize drought and is easy to use in areas where data are scarce, this study adopted it for drought assessment.
Karst areas account for about 7% to 12% of the Earth’s land area and about a quarter of the world’s population is completely dependent on karst water resources. Karst areas in China are widespread, covering an area of about 2.06 million square km. These are mainly distributed in the southwest. Guangxi, Yunnan, and Guizhou have the highest concentrations of karst areas, comprising a total of 318,600 km
2 and representing 39.44% of the total land area of the three regions. Karsts are areas formed by the dissolution of carbonate-based soluble rocks (limestone, dolomite, gypsum and rock salt, etc.). Surface runoff and groundwater flow have a dissolving and mechanically damaging effect on rocks in karst areas, which can generate underground drainage systems with sinkholes and caves [
17]. Thus, water from the surface flows more easily into the ground, resulting in a weaker water storage capacity in the basin. Compared with non-karst areas, karst areas are more vulnerable to drought hazards, so the study on drought assessment is more urgent. However, the terrain and geomorphology of karst areas are more complex, and karst geo-climatic features are highly spatially heterogeneous, making reliable drought assessment still highly challenging.
In summary, although some concrete results have been achieved in drought assessment studies under climate change, there are still some shortcomings. It is challenging to obtain reliable information on climate change and to analyze the evolution of drought under climate change in karst regions. To address these problems, this study mainly explores the following elements. Firstly, the Chengbi River karst basin in China is selected as the study area. Then, under the SSP1-2.6, SSP2-4.5 and SSP5-8.5 scenario, the ASD model is used to project the precipitation- and temperature-based GCM data for the 2040s (2023–2050), 2060s (2051–2070) and 2080s (2071–2100). The GCM climate data are exported from the fifth generation of the Canadian Earth System Model (CanESM5) in Phase VI of the Coupled Model Intercomparison Project (CMPI6). Finally, the 12-month SPEI values are chosen to assess the drought conditions. The novel contributions of this study can be summarized as follows: (1) the performance assessment of the multi-station calibration-based ASD model in the karst basin; (2) projections of precipitation and temperature under three SSP scenarios using the ASD model; and (3) assessment of the drought conditions under different climate change scenarios. To the best of our knowledge, few previous studies have combined the multi-station calibration-based ASD model and SPEI to conduct drought assessment in karst basins under multiple SSP scenarios. This study is expected to act as a reference for future drought assessment in karst areas.
2. Study Area and Data Sources
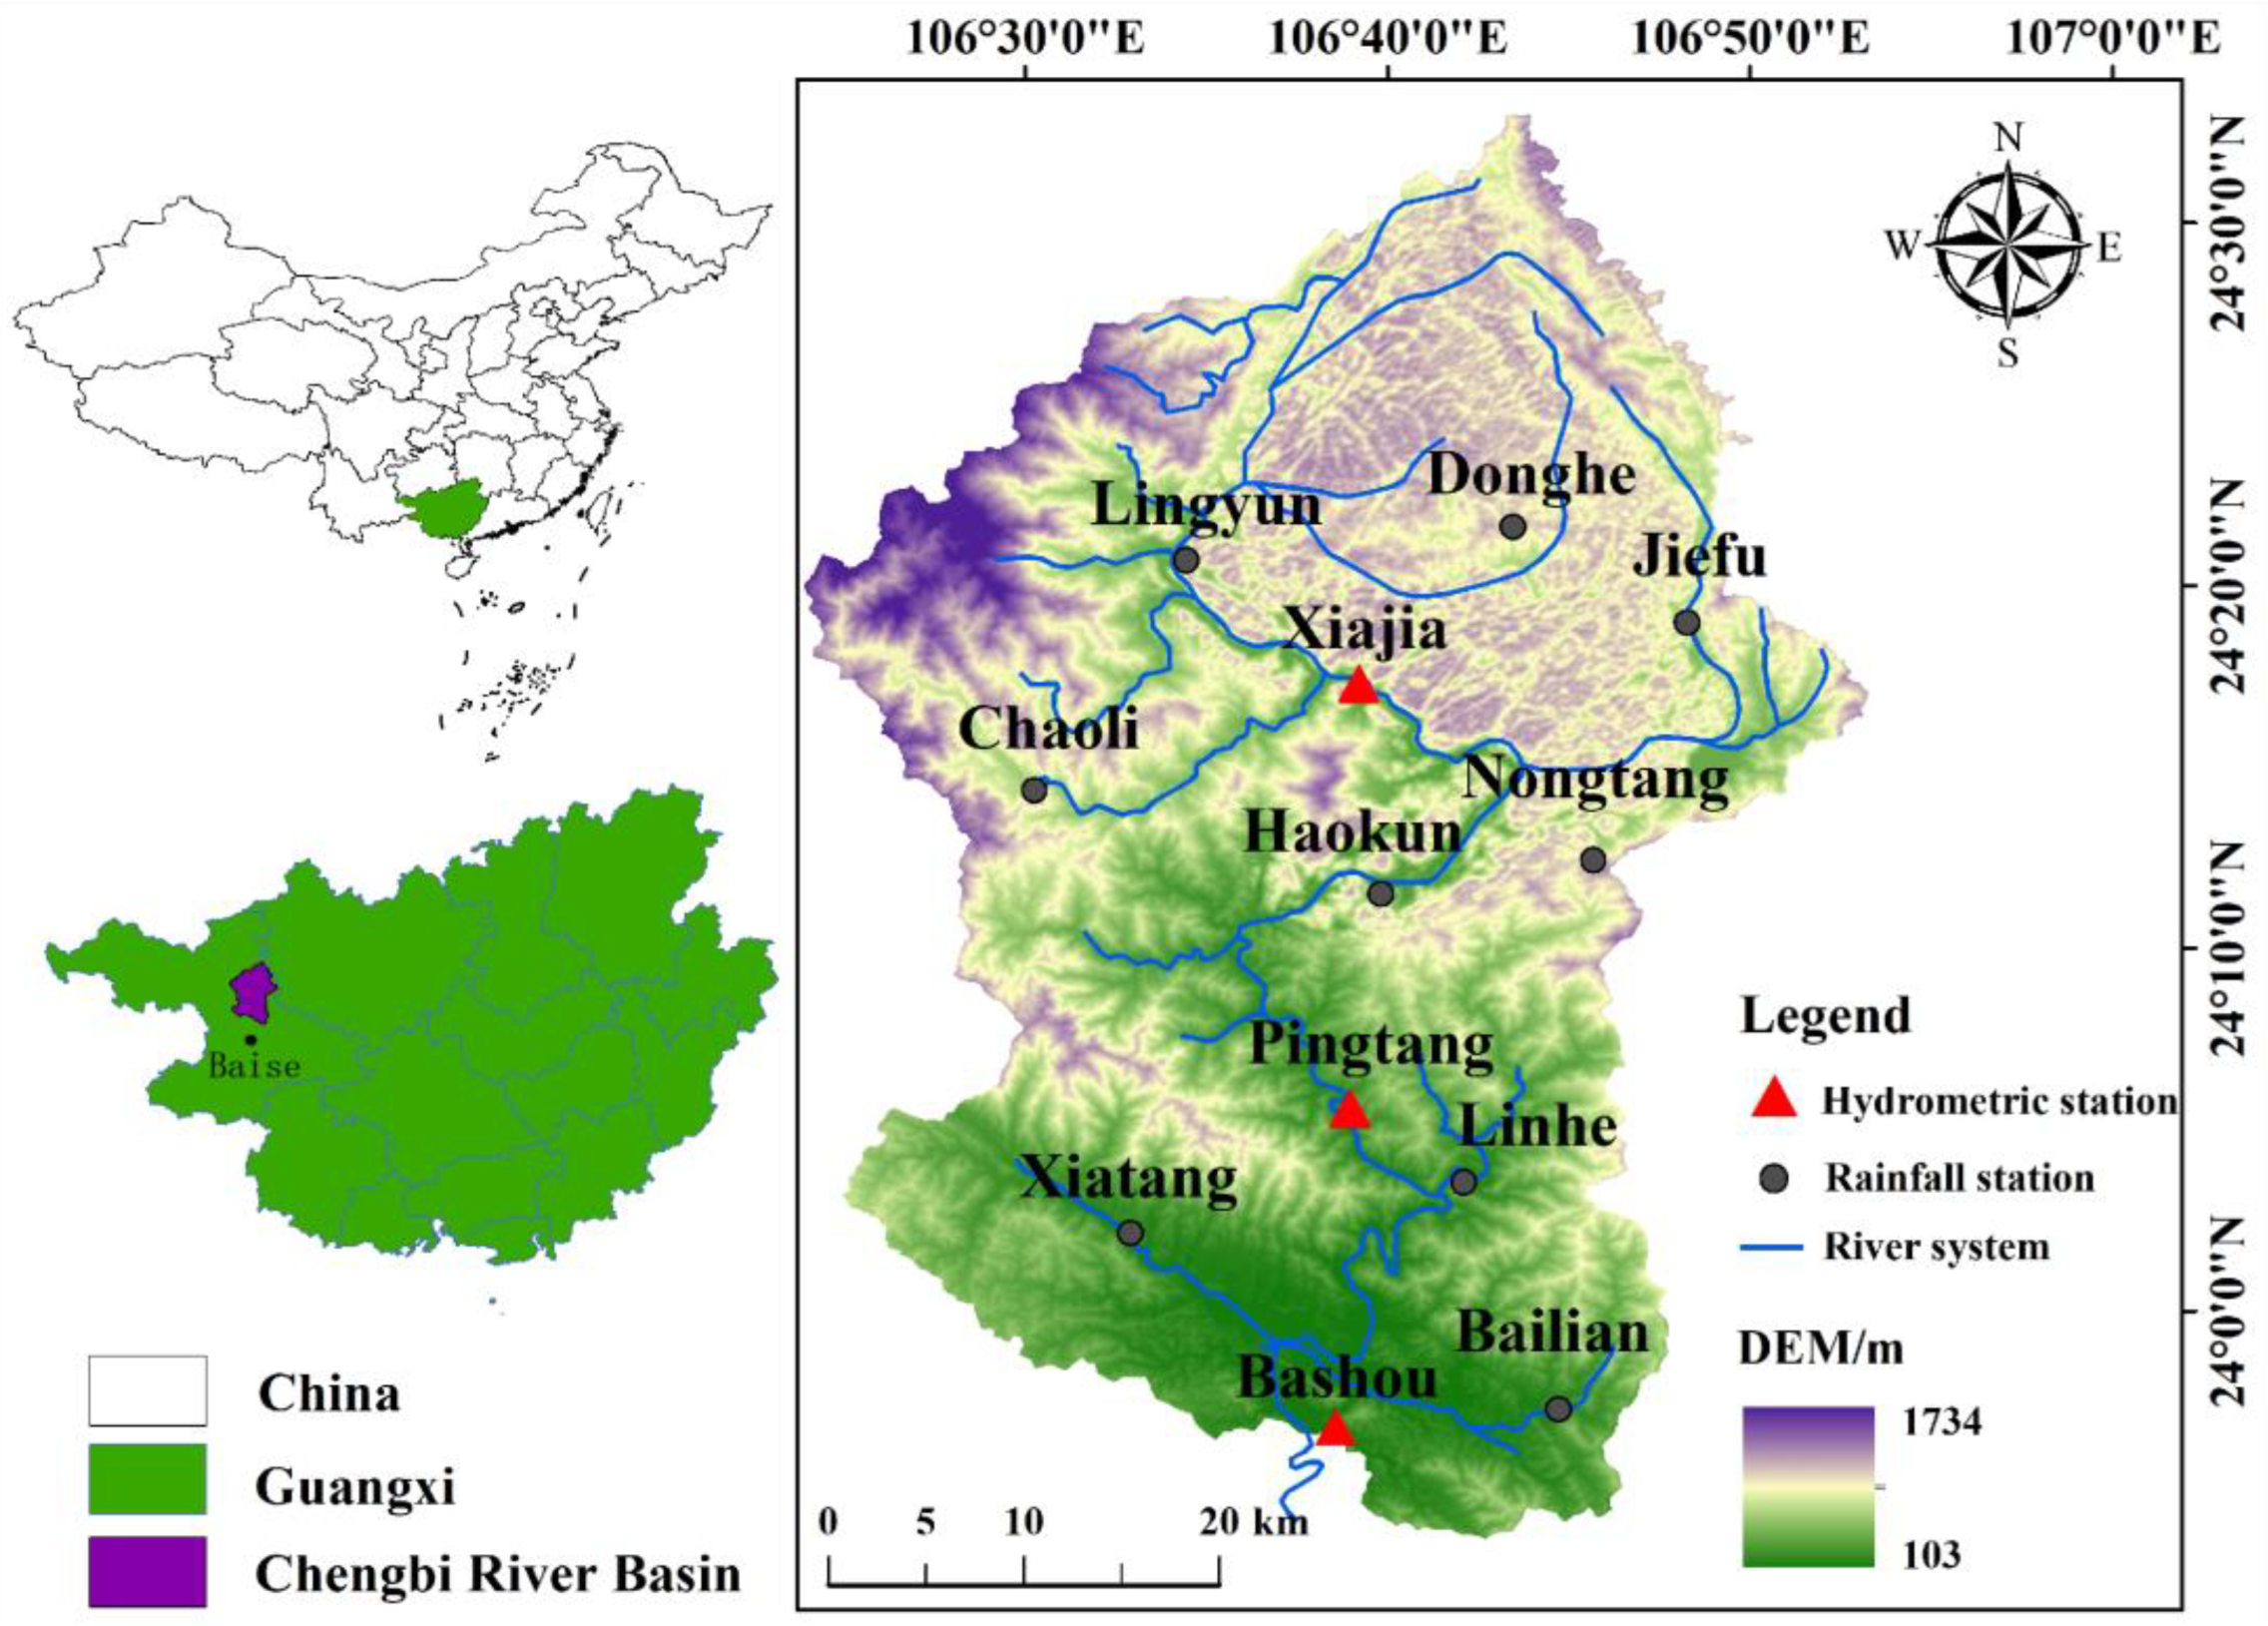
The Chengbi River karst basin is located in Guangxi District, China. The general topography is characterized by low southeast and high northwest. The total basin area is 2087 km
2, of which the karst area is about 1121 km
2, accounting for 53.7%. A unique geographical feature of this area is that the landform is divided into two parts bounded by the Nongtang station. The part above Haokun station to Nongtang station is a typical karst area where the terrain is largely undulating, with many structures such as sinkholes and skylights. The part below Haokun station to Nongtang station is mostly hilly, and, where the terrain is relatively flat, is lush with vegetation and dense forest. The climate heterogeneity is more obvious due to the influence of terrain and geomorphology. Precipitation in the basin is abundant, but its distribution is highly uneven, with 87% of the precipitation occurring during the flood season. The average annual precipitation is 1341.2 mm, showing a significant upward trend with an increased rate of 3.6 mm/y. The annual average temperature is 21.35 °C, the daily maximum temperature can reach 42.5 °C and the minimum temperature as low as −2 °C. The daily maximum temperature shows a decreasing trend with a decrease rate of 0.02 °C/y, while the daily minimum temperature shows an increasing trend with an increase rate of 0.02 °C/y; thus, the general variation of temperature is not obvious [
18]. With limited information with regard to the small latitudinal variation of the basin and its location close to the coastal area, the spatial heterogeneity of temperature is not discussed in detail in this paper. The climate information for each station is shown in
Table 1. There are 12 precipitation stations, and Xiajia, Pingtang and Bashou are both precipitation and hydrological stations. A general map of the basin and the distribution of stations are shown in
Figure 1 [
19].
The Chengbi River basin has been selected as the study area for the following reasons. Firstly, it is of strategic significance to the local water supply, power generation, agricultural irrigation and even the construction of the China–ASEAN-featured tourism belt. Secondly, the Chengbi River basin is a typical karst area with unique hydrogeological background. Its aquifer is highly permeable, resulting in more frequent transformations between surface water and groundwater than in other areas. The special karst landscape of the basin makes its hydrological cycle vulnerable to the influence of climate change, which causes it to become a frequent place of drought and flood disasters [
20].
Four main datasets are used in this study: precipitation data from 12 stations in Chengbi River reservoir (1963–2019), maximum and minimum temperature data from Baise station (1963–2019), precipitation and temperature data from NCEP reanalysis information (1963–2014) and GCM climate models (1963–2014 and 2023–2100). Precipitation data for the Chengbi River reservoir are provided by the Chengbi River Reservoir Authority, and temperature data for the Baise station are available from the China Surface Climate Information Daily Value Dataset (V3.0) in the China Meteorological Data Website [
http://data.cma.cn/ (accessed on 16 September 2021)], and National Centers for Environmental Prediction (NCEP). Reanalysis data are collected by the National Centers for Environmental Prediction and the National Center for Atmospheric Research [
https://www.esrl.noa.gov/ (accessed on 10 October 2021)]. GCM data are obtained from the CanESM5 climate model in CMIP6 proposed by the World Climate Research Program (WCRP) [
https://esgf-node.llnl.gov/projects/esgf-llnl/ (accessed on 20 January 2022)].
6. Conclusions
Drought has devastating influences on agricultural production, the hydrological cycle, economic development and ecological construction. Therefore, scientific projections of future drought conditions are important for karst drought disaster mitigation and water resources management. The following conclusions have been obtained from this study:
(1) According to the performance metrics of the ASD model, the average value of KGE and NSE for precipitation is 0.866 and 0.889, respectively; and the average value of both KGE and NSE for temperature is 0.989, which proves that the ASD model has good downscaling performance when characterizing karst climatic heterogeneous features areas.
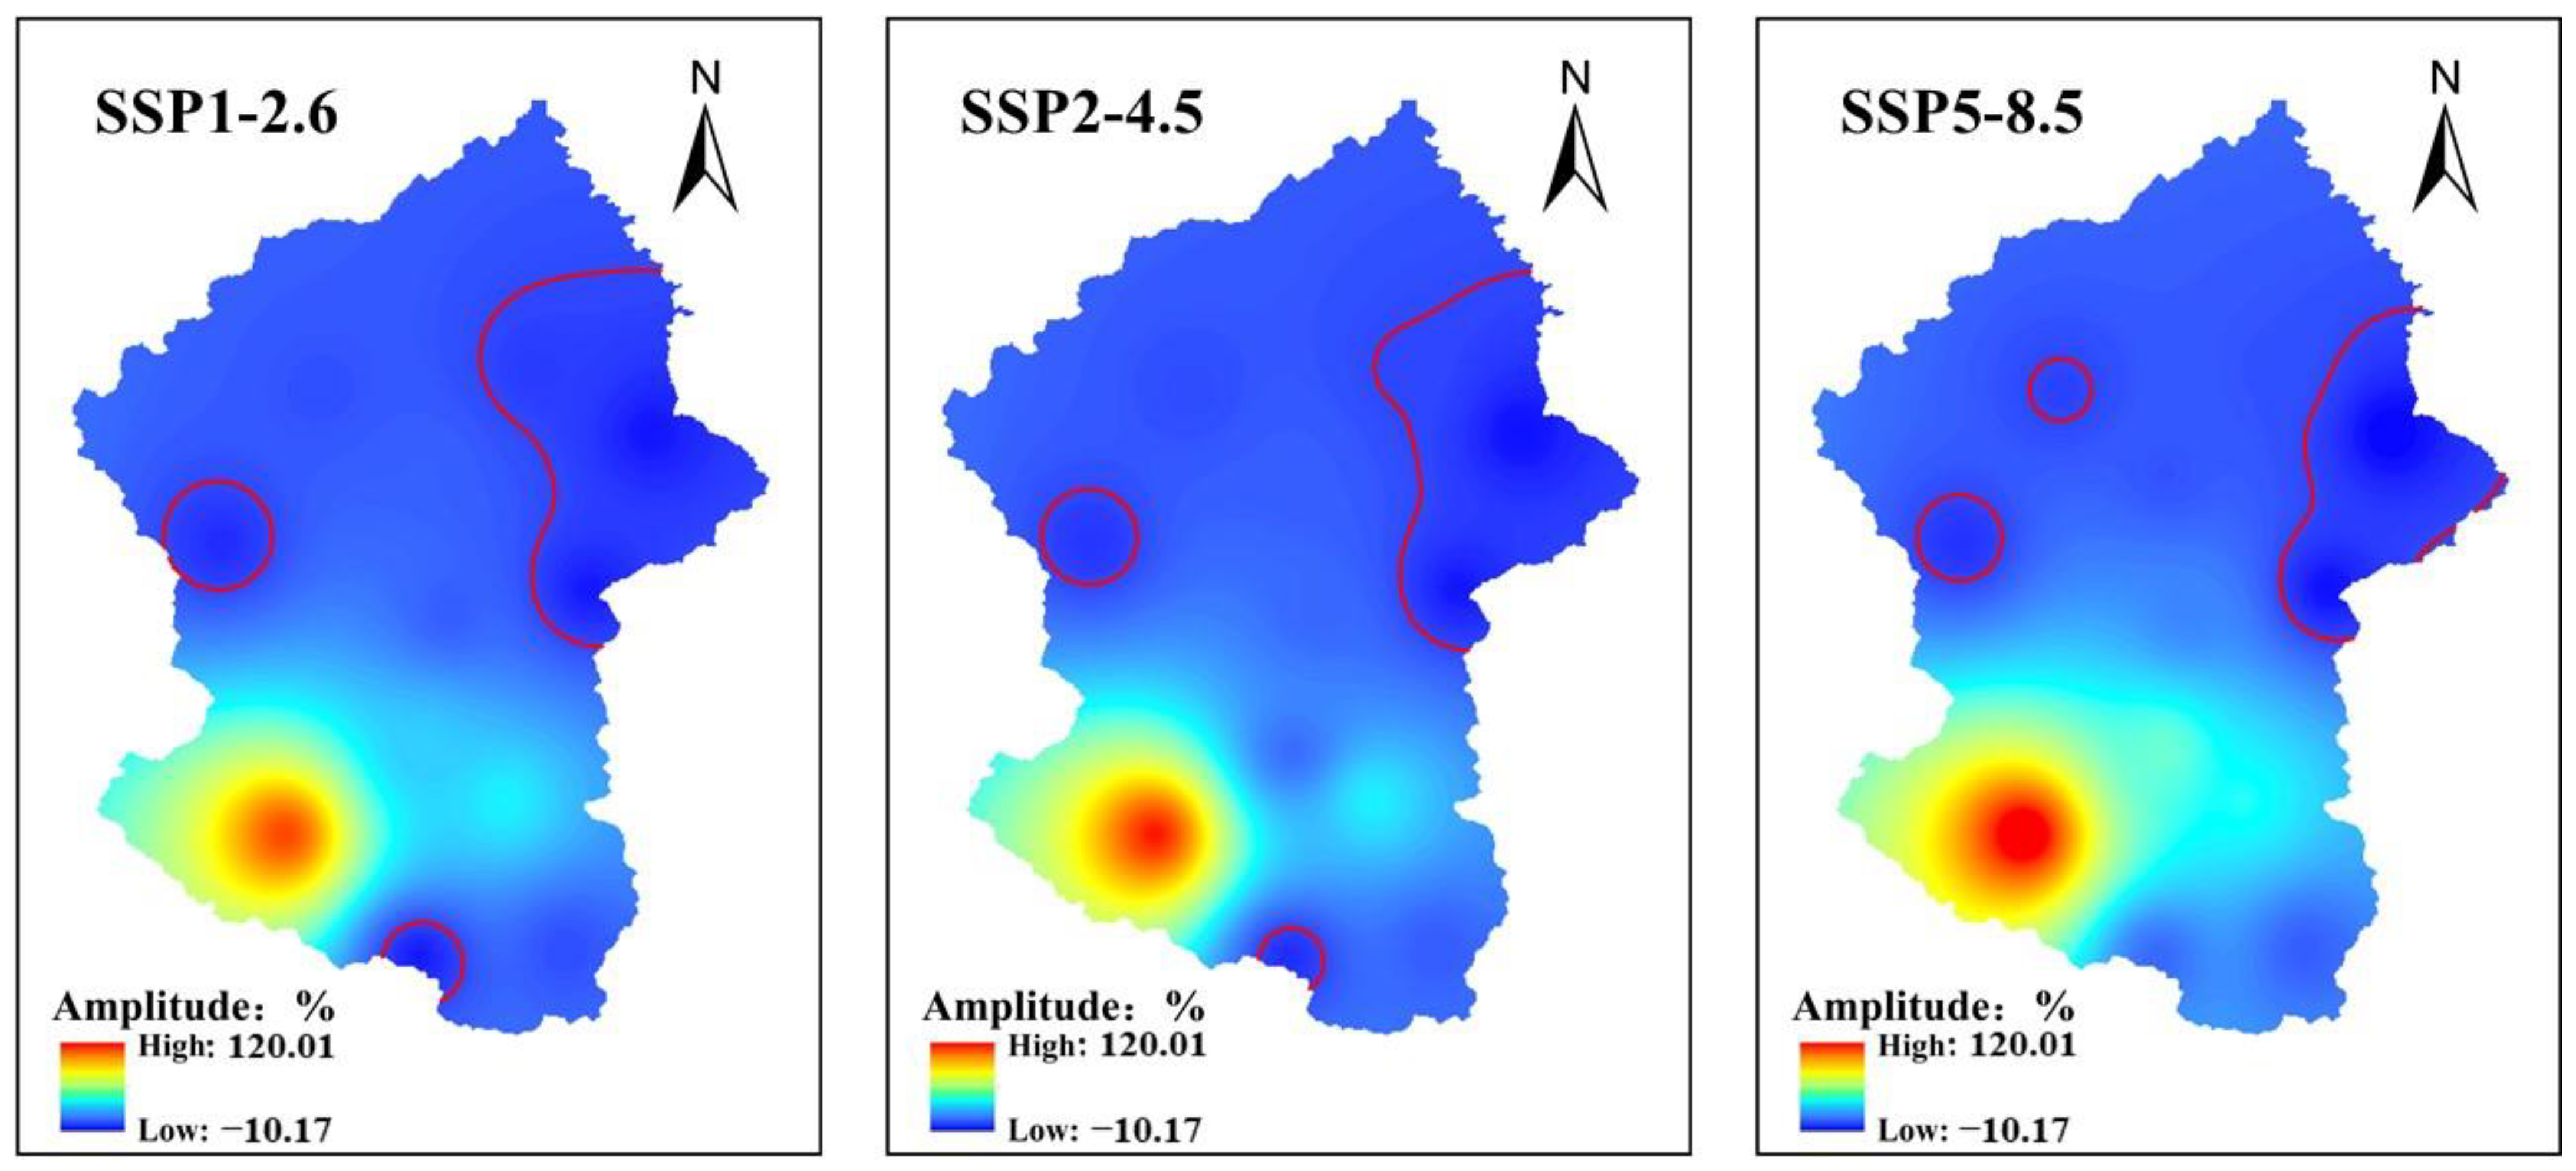
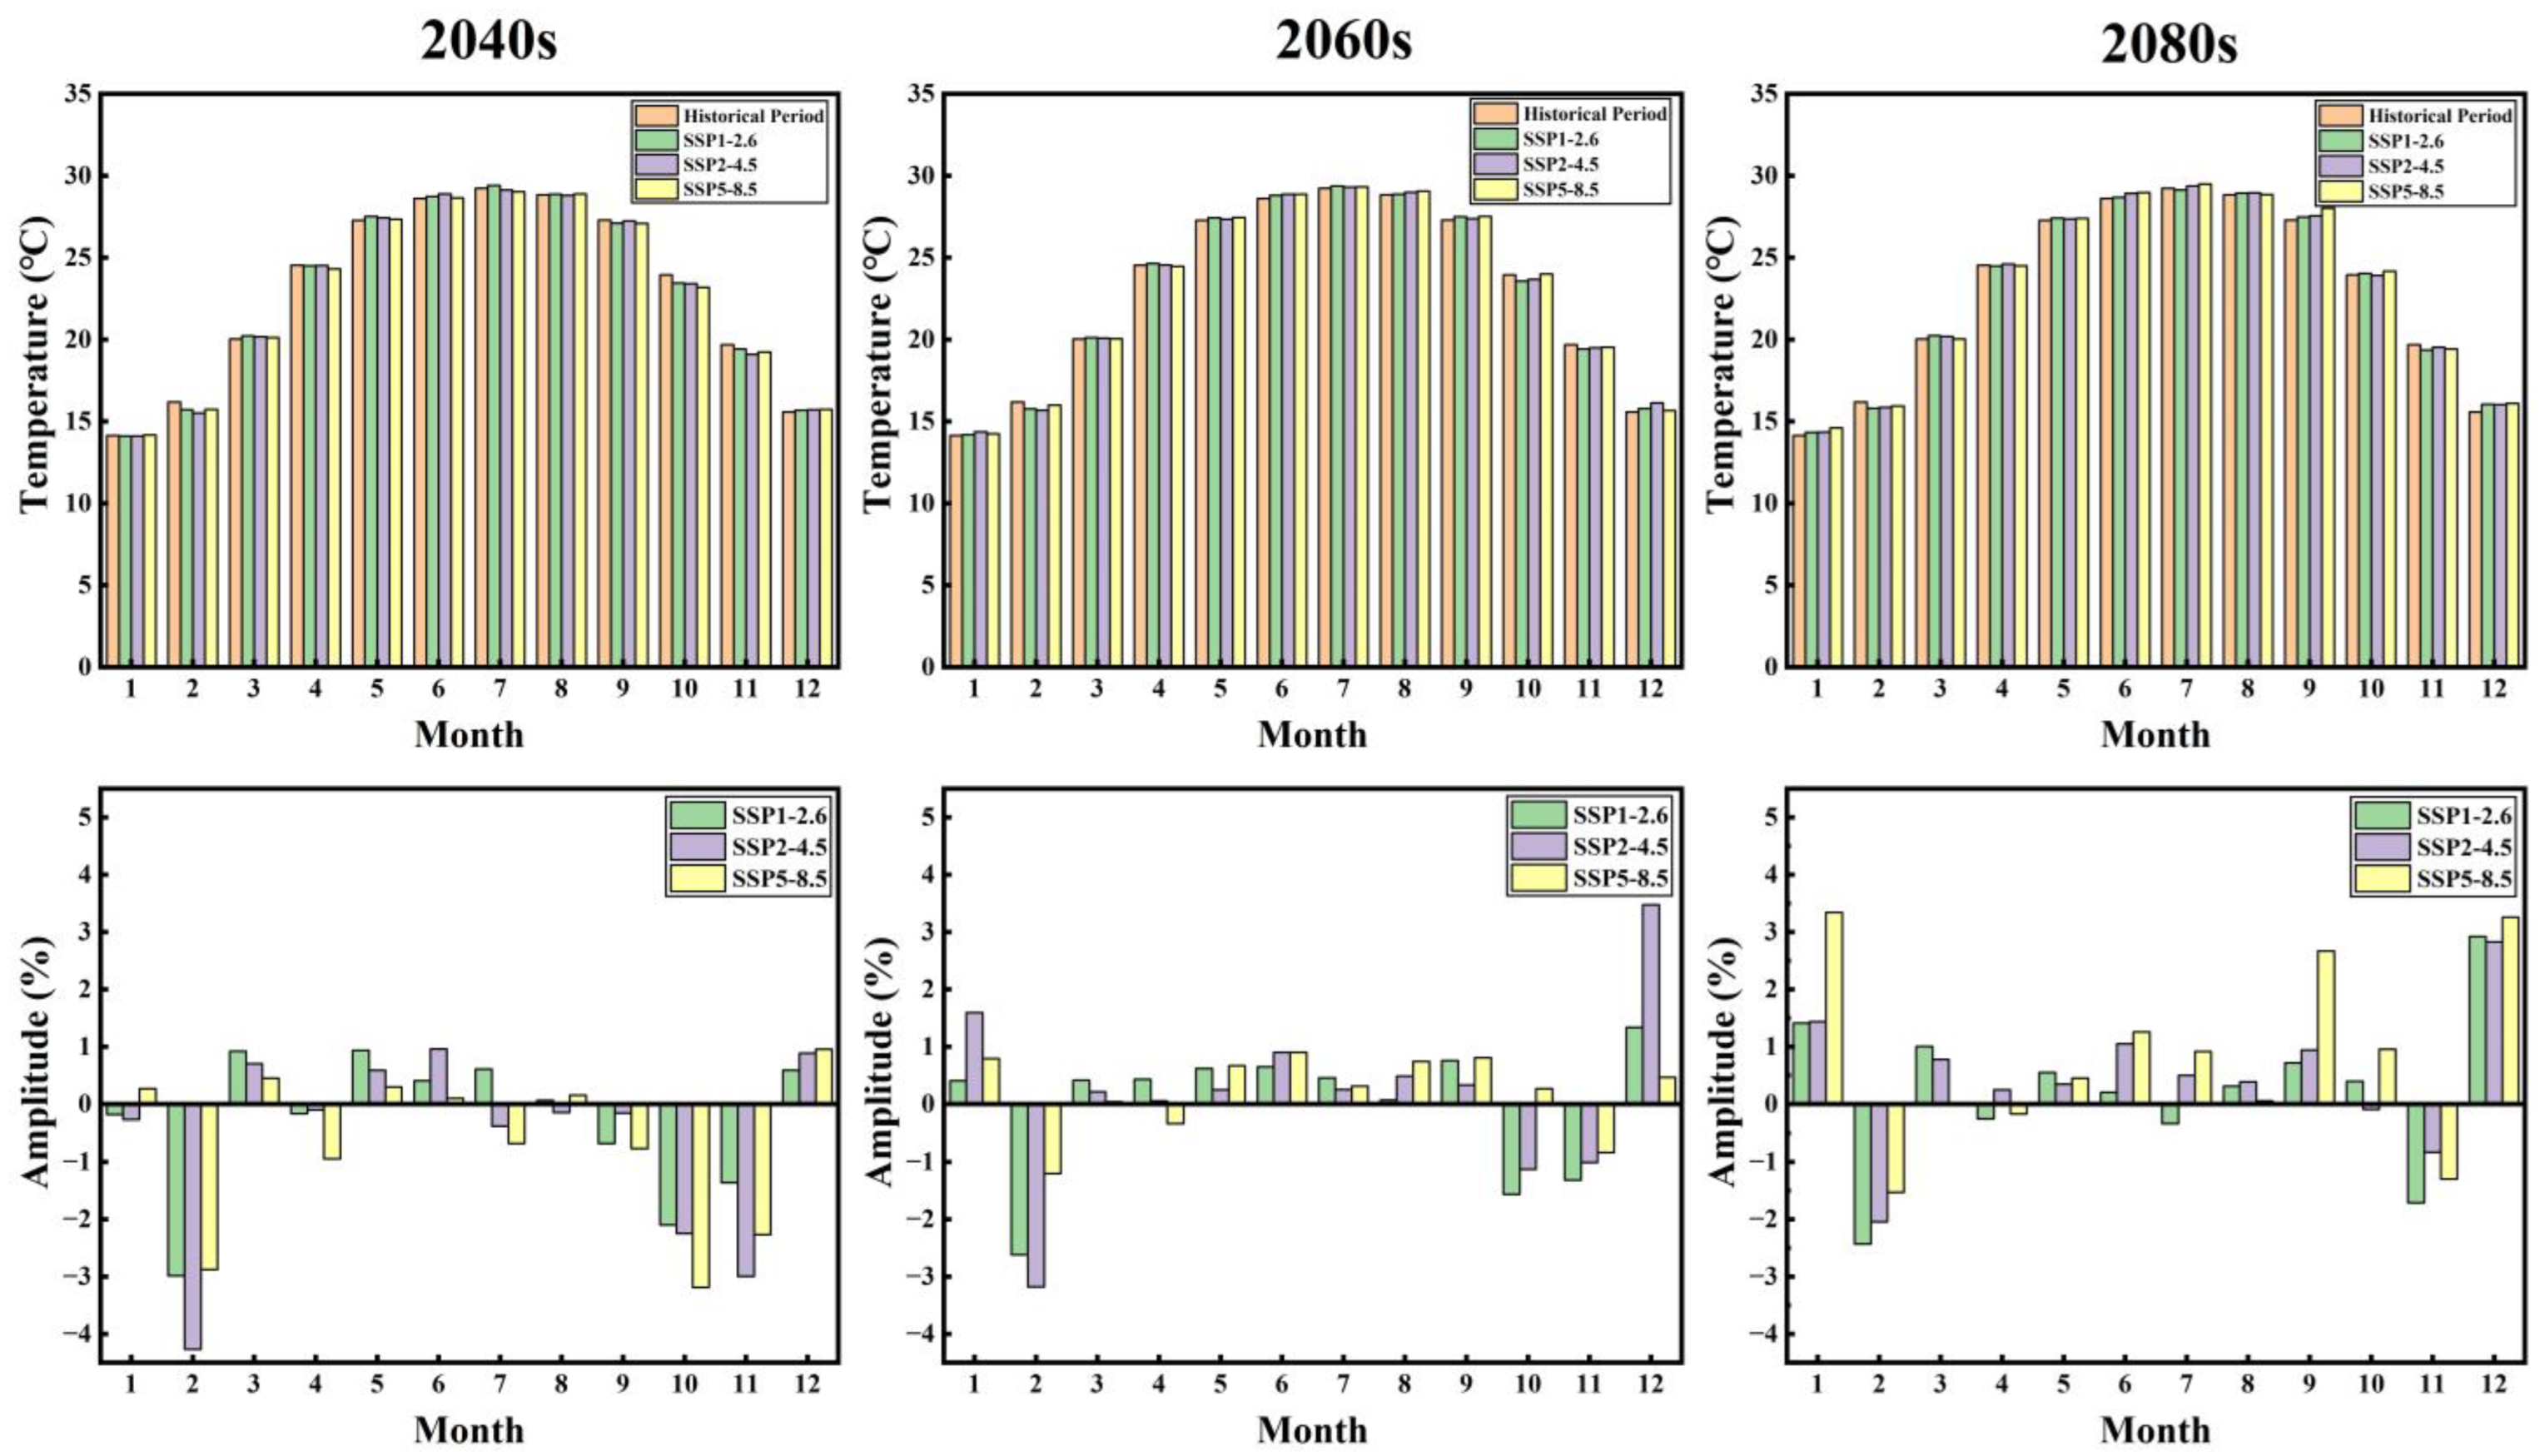
(2) In terms of time, precipitation is mainly on the rise on both monthly and annual scales. In terms of space, annual precipitation is decreasing in the upstream areas and increased significantly in the southwestern areas. Although temperature also shows an upward trend, its amplitude of increase is very small, with a maximum increase of 0.04 °C over the next 70 years.
(3) According to drought assessment results, the drought conditions are alleviated from the 2040s to the 2080s compared with the historical period. However, the drought condition in the 2040s is still relatively severe. From the SSP1-2.6 scenario to the SSP5-8.5 scenario, the trend of drought may also increase.
