1. Introduction
The coastal zone is naturally dynamic, and modifications occur at different temporal and spatial scales. Along sandy coastal stretches, changes in coastline position (erosion or accretion) are expected in response to variations in sediment budget, hydrodynamic conditions, and sea-level oscillations. The coastal zone is also a main interface that is becoming increasingly relevant and politically sensitive worldwide, in the context of extensive erosion, growing anthropogenic pressures (e.g., urban expansion, recreational development) [
1], and climate change (e.g., sea-level rise, increase in storminess) [
2,
3].
Particularly, barrier-island systems (BISs) are important geomorphic features that represent ~10% of the world’s coastlines [
4,
5,
6,
7,
8], support a variety of habitats, species, and anthropogenic activities, and provide storm protection and defence to back-barrier environments. In such complex coastal systems, sediment is delivered, lost, and exchanged across multiple geomorphic environments [
9]. According to Moore et al. [
10], the most important factors in determining barrier-island responses to sea-level rise are, in rank order, substrate composition and slope, sea-level rise rate, and sediment supply rate. Moreover, the genesis and evolution of BISs are key issues for predicting how a barrier island will adapt to future sea-level rise [
8,
10]. BISs are seriously exposed to erosion hazards: they can respond to an increase in sea level or a decrease in sediment supply, not only by migrating landward but also by destroying or drowning in place [
10]. As barrier islands host recreational and leisure activities and provide outstanding ecosystem values and services [
11,
12], BIS modifications occurring on a multidecadal timescale are of major importance in our understanding of, and capability to predict, the future evolution of these coastal systems.
The idea that coastlines are at risk owing to climate change acceleration is relatively recent [
13] and has increased the demand for accurate knowledge on coastal evolution, an occurrence that encouraged the development of numerous long-term (>30 years) analyses of coastal trends [
14].
Early studies considering a national-scale approach to coastline change were promoted in the USA by the USGS (United States Geological Survey) [
15] and in Europe by the European Commission [
16]. Several projects funded by the European Commission (e.g., BEACHMED, EUROSION, COSCIENCE, and MICORE) were launched to achieve the strategic objective of developing guidelines for sustainable management of the European coastal zones subjected to erosion. A basic concept of coastal erosion management is the ‘favourable sediment status’, defined by the EUROSION project as the situation in which the availability of coastal sediments supports the objective to promote coastal resilience, in general, and to preserve dynamic coastlines, together with three other key concepts, i.e., coastal resilience, coastal sediment cell, and strategic sediment reservoir. Coastal cells constitute the most appropriate units to achieve the objective of favourable sediment status [
16,
17]. Several aspects must be considered in the determination of coastal cell boundaries: (i) discontinuity in the rate or direction of sediment transport, (ii) geological or man-made structures, and (iii) long-term changes in shoreline position. Hence, a single coastal cell or compartment may include more than one beach; alternatively, beaches can occupy distinct cells or compartments separated by headlands and lagoon inlets [
18].
Anthropogenic modifications are directly or indirectly responsible for changes in coastal hydrodynamics and BIS sediment dynamics [
19,
20]. In particular, changes in the sedimentary budget can cause barrier erosion [
21] and sediment redistribution [
22]. The main human interventions, significant to the medium-term evolution of a barrier system, include (a) jetties and groins as interferences to the longshore sediment transport, (b) seawalls and beach nourishment as shoreline stabilizers, (c) mobile barriers located at the inlets, (d) coastal facilities, (e) land-use and land-cover changes, (f) dredging of marine sediments, and (g) hydraulic works and mining activities in the rivers.
Guidance for shoreline management has also been provided by several recent research projects comprising demonstration sites located along the northeastern coast of Italy, e.g., RITMARE Project [
23,
24], CAMP Italy Project, and COASTANCE Project [
25]. The northern Adriatic coast (Italy) is subjected to rapidly evolving pressures from a range of natural and anthropogenic drivers (e.g., accelerated sea-level rise, fast morphological modifications that also derive from coastal erosion, human-induced subsidence, and changes in wave and wind climate), all of which require an integrated approach.
The north Adriatic basin is shallow (<40 m) and characterised by a very low-gradient shelf responsible for a gentle slope [
26,
27]. Littorals, mainly composed of sandy-silty sediments, are highly exposed to coastal erosion and flooding. The wide presence of low-lying coastal areas, frequently lower than the mean sea level [
28], urban settlements, and socioeconomic activities increase the vulnerability of the coast [
29]. In this paper, the Lido barrier island, a 12 km sandy coast bounding the Lagoon of Venice, is addressed using a historical analysis of georeferenced aerial photographs, taken since 1955. The study aims at identifying the barrier-island evolution patterns and assessing the impacts of human interventions on the system. The work covers the past 64 years (1955–2019) and, to the authors’ knowledge, is the most complete and consistent long-term study on the recent coastline evolution of Venice’s BISs aimed at quantifying their morphological modifications and the influence of human interventions in the area.
2. Study Area
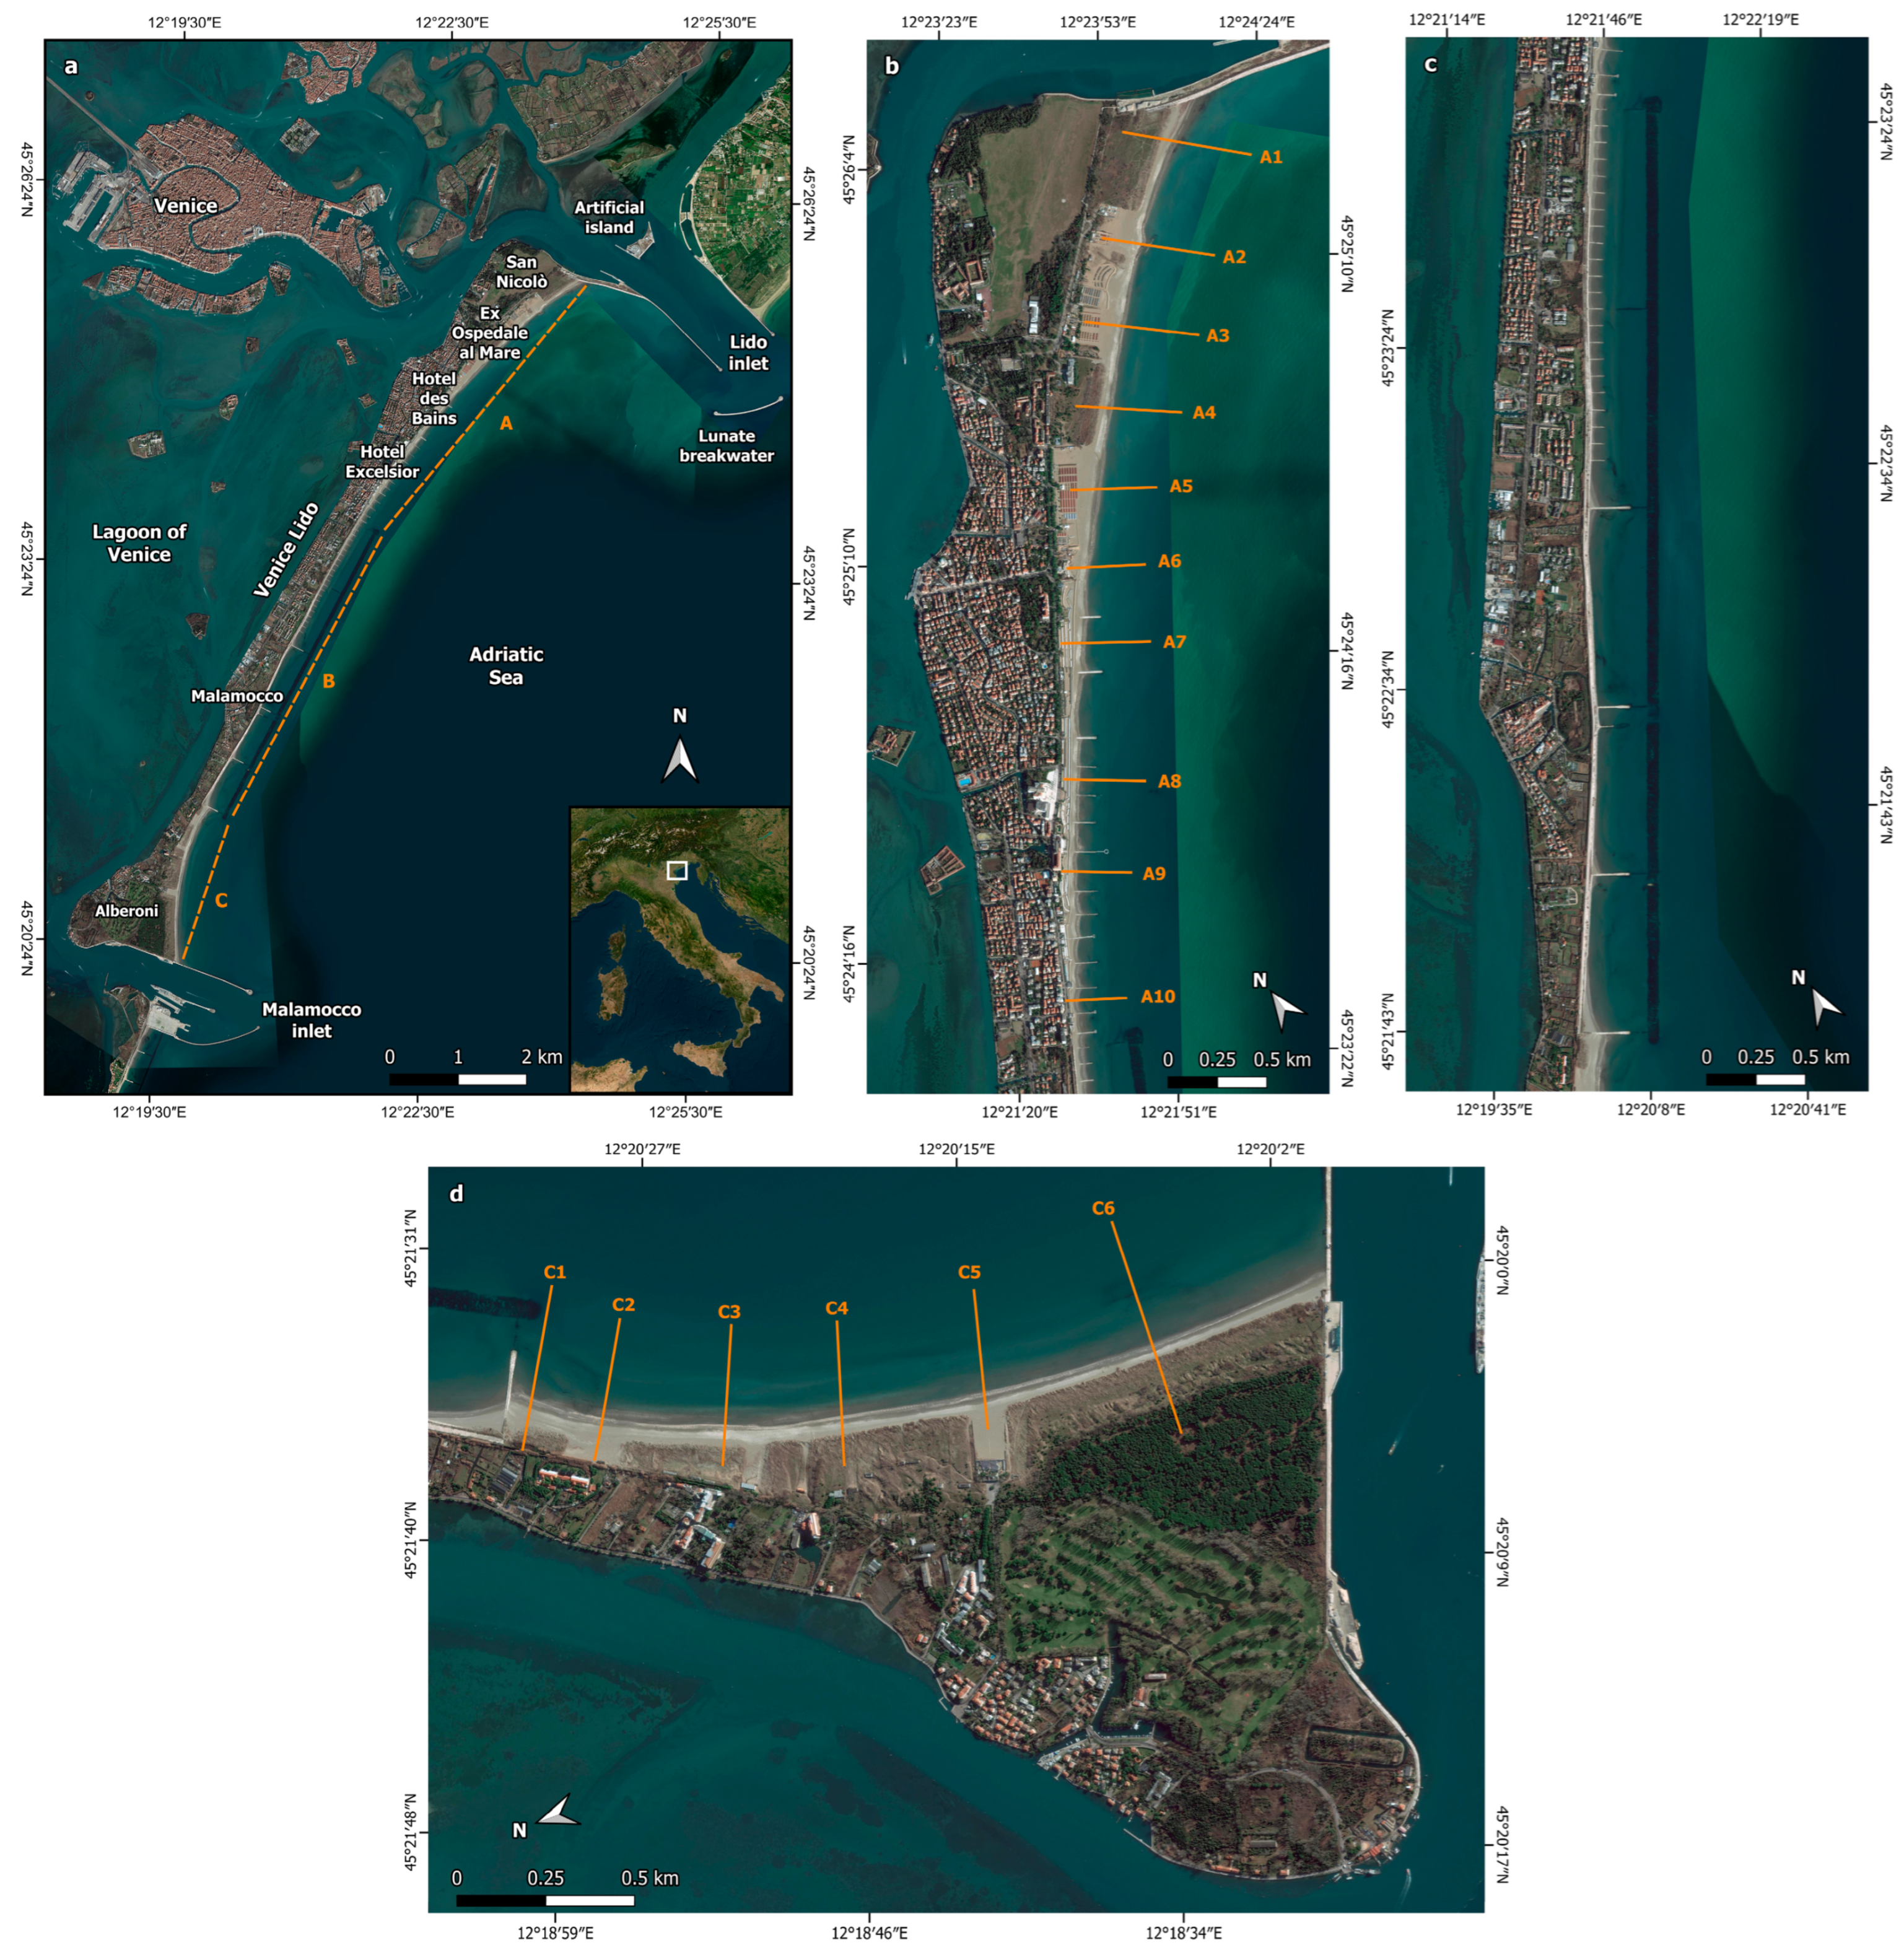
The Venice Lido, already described in the first century BC by the Roman historian Tito Livio as “tenue praetentum litus” (thin beach), with an extension of almost 12 km from the Lido inlet to Malamocco inlet, is one of the two sandy barrier islands that separate the Adriatic Sea from the Lagoon of Venice. The BISs originated nearly 6000 years ago when the rising Adriatic Sea flooded the Pleistocene palaeo-plain [
30,
31]. Between the 15th and 19th centuries, anthropogenic interventions, such as the diversion of the Brenta, Adige, and Piave rivers from the lagoon and major engineering works, affected the natural evolution of BISs. Over the centuries, the Venice Lido has undergone numerous and intense morphological transformations and urban development, due to the change of its functions, i.e., from the defensive to the urban centre [
32].
The width of the island is variable mainly due to the rapid progradation of the shoreline at the northern and southern ends, which occurred after the construction of the jetties at the Lido inlet (1891) and at the Malamocco inlet (1928) [
33] (
Figure 1). In particular, in the northern portion of the island, close to the south jetty of Lido, an overall advance that exceeded 450 m and led to an increase in surface area of about 70 hectares occurred between 1886 and 1951 [
34]. Near the north jetty of Malamocco, the beach had an overall advance of 300 m and an increase in surface area of about 40 hectares. At present, the maximum widths are measured in San Nicolò (~1 km, northern part of the Lido barrier) and Alberoni (~1.6 km, southern sector of the island) littoral zone, while the minimum width is at the southern end of the Murazzi, between Malamocco and Alberoni (<300 m) (
Figure 1). The Murazzi are defence works made in Istrian stone and pozzolana, built during the 18th century and completed between 1874 and 1886 [
34] to protect the narrow beach from storm waves. The Murazzi were seriously damaged by the storm surge occurring on 4 November 1966; therefore, to protect the littoral zone, the lagoon, and the city of Venice from the violence of the sea, they were restored at the beginning of the 1970s and new groins were built up along the Lido island.
Moreover, other numerous reclamations that were carried out during the 18th century considerably contributed to the increase in the surface of the island.
Due to the presence of jetties at the ends of the island, the Venice Lido appears to be an isolated physiographic unit. Sediment sources derive from the erosion of the seafloor within the inlets and in adjacent areas within the lagoon [
35]. For the period 1927–2002, Sarretta et al. [
36] estimated a sediment loss of 39 Mm
3 through the inlets towards the Adriatic Sea. Sediments mainly accumulated near the jetties [
37].
The Consorzio Venezia Nuova (CVN) [
35] provided a map of sediment transport, accumulation, and erosion along the shoreline of the Venice Lido between 1988 and 1989. During the ebb tide, the strong flow through the inlets gives rise to currents that are diverted southwards by the longshore current and originate large eddies south of the inlets. It is supposed that the ebb tidal flow first carries southward sediments that are eroded by extreme storm waves at depths between 5 and 10 m, which are then transferred to the entrance of the inlets by the flood tide. These processes produce offshore areas characterised by deposition at depths between 10 and 15 m and erosion at depths from 5 to 10 m.
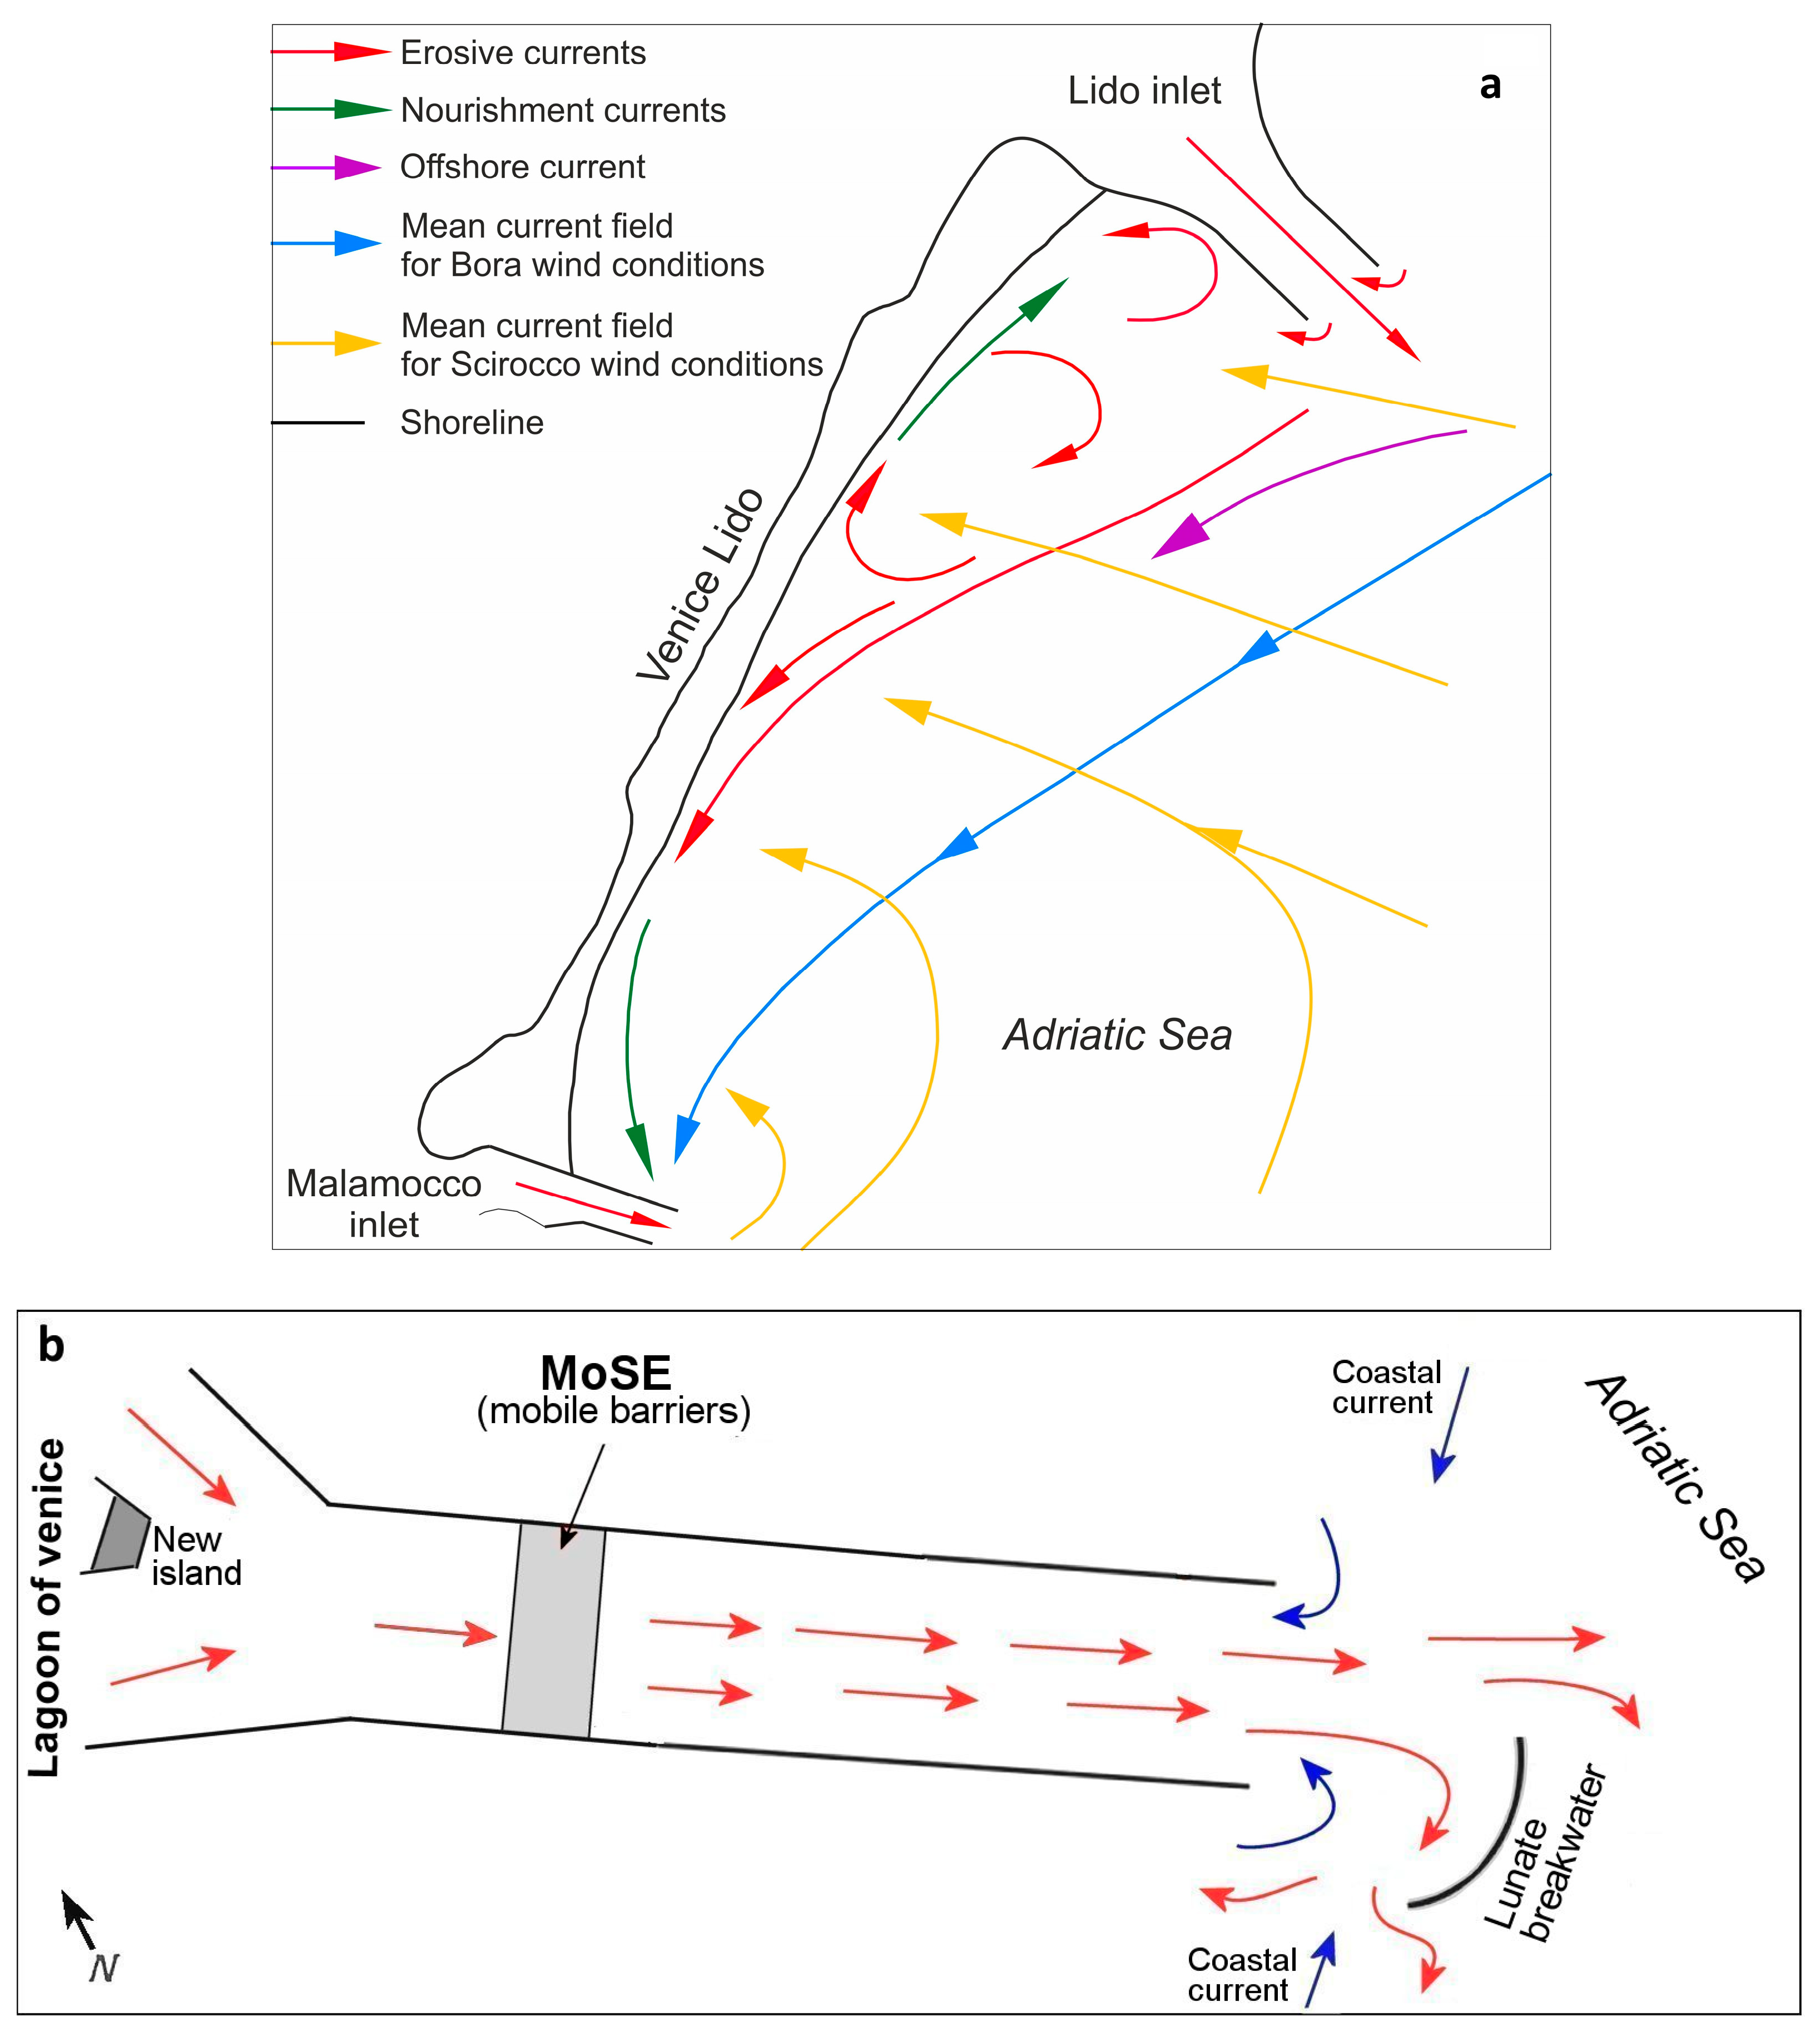
In the last 15 years, the inlet configuration has changed again, due to the construction of the MoSE (Modulo Sperimentale Elettromeccanico) structures that were built to prevent the city of Venice from exceptionally high tides. The project, established in 2003, has led to the development of mobile barriers located at the three inlets connecting the lagoon with the open sea [
38]. The 79 elements of the mobile barriers are raised whenever marine water exceeds a specified level (for now 110 cm).
Figure 2 shows a schematic sketch of the MoSE structures at the Lido inlet.
Toso et al. [
39] showed the rapid evolution of the seabed at the Lido inlet, following the construction of the structures of the MoSE and the lunate breakwater. The lunate, built between 2011 and 2013, induced the formation of two large scour holes at its ends, with a sediment loss of 170 × 10
3 ± 15.6% m
3. The construction of an artificial island in the centre of the lagoon side of the inlet and the reduction in the width of the inlet itself caused a change in the sedimentary regime from depositional [
40] to erosive, with a net loss of sediments of about 612 × 10
3 ± 42.7% m
3, and a decrease in fine sediments.
During the last century, the BISs have also literally sunk more than 25 cm [
41]. Anthropogenic subsidence has accelerated the natural subsidence of the Venice area, i.e., the natural sinking mainly due to tectonic reasons [
42,
43] and sediment consolidation [
42]. Combined with a continuous eustatic rise in sea level, subsidence has further increased relative sea-level rise (SLR) by ∼1.5 mm/year between 1972 and 2002. The most recent analyses estimate a subsidence rate of 1–2 mm/year for the central lagoon [
44]. In the last years, in the southern BIS margin an SLR rate of up to 5 mm/year has been measured, likely related to the works carried out to reinforce the littoral zone [
45,
46,
47]. At the reinforced portion of the south jetty of Lido inlet, a subsidence rate of 70 mm/year has been recorded [
48].
In the period 1872–2016, sea-level rise in Venice was estimated to be 2.51 mm/year, with significant variations over time. Three phases of relative stability or decrease in the mean sea level (MSL) were observed, i.e., between 1915 and 1925, between 1935 and 1945, and between 1965 and 1995, due to the influence of the North Atlantic Oscillation and the Mediterranean Oscillation [
49]. Other periods were characterised by rapid acceleration, such as the occurrence from the 1930s to the 1960s (owing to human-induced subsidence), with a rate of increase of the MSL greater than 5 mm/year. On the other hand, in the periods 1947–1969 and 1994–2016, the growth rate was substantially overlapping: 5.60 mm/year and 5.61 mm/year, respectively [
49].
Estimates of shoreline retreat on the BIS of Lido and Pellestrina range from 40 to 75 m, under a SLR scenario of 85 cm for the year 2100 [
50]. Since barrier islands defend the mainland coastal areas from storm surges and ocean waves, changes in their shape or partial disappearance due to erosion may lead to reduced protection for the lagoon and the city of Venice [
51].
Centuries of high anthropogenic pressure have impacted the dynamic and fragile ecosystem of the Lido island, representing one of the main causes of an increasing sinking rate and catastrophic floods in the last and current centuries. The urban development of the Venice Lido began in the second half of the 19th century, with the birth of beach resorts. Two main periods can be distinguished: the first refers to the period 1905–1921, during which the Venice Lido was confirmed as a prestigious seaside resort with the construction of luxurious hotels; the second occurred between the 1950s and 1960s with a rapid increase in urbanisation due to residential constructions. The progressive anthropisation of the territory led to a considerable reduction in the areas for agricultural or horticultural use and to a progressive burial of the internal hydrographic network made up of canals and fishponds. The development of the road network followed the progressive increase in urbanisation, which was crucial for connections with Venice and the mainland [
32].
Hydrodynamic Conditions
The Adriatic Sea is characterised by a counterclockwise circulation; therefore, currents are directed northward along the eastern margin (East Adriatic Currents, EAC) and southward along the western one (Western Adriatic Coastal Current, WACC) [
52]. Smaller cyclonic and anticyclonic gyres are also present in the northern, central, and southern sub-basins [
52,
53,
54]. The Adriatic basin is the part of the Mediterranean Sea affected by both the highest tides and sea-level extremes [
55,
56], particularly along the northern coast, which is characterised by a microtidal regime with an astronomical tidal range of about 1 m. The occurrence of strong winds, heat and water fluxes on the surface, freshwater input, and complex relation with the general Adriatic circulation can be responsible for high variable hydrodynamics in the northern basin ([
57] and references therein). The concurrent action of astronomical tides, seiches, and atmospherically forced fluctuations can also increase the probability of extreme events and, consequently, the occurrence of coastal flooding [
58]. Similar to the other Venetian BISs, the Lido littoral zone is exposed to two major wind events: the Scirocco, which is a warm, moist wind blowing from the southeast, mainly from November to March, and the Bora, which is a katabatic, cold, dry wind that prevails in winter and blows from the northeast. The Bora and Scirocco greatly influence basin circulation. The Bora intensifies the WACC, while the Scirocco may reduce or reverse it [
27,
59]. As the Adriatic Sea is a semi-enclosed basin elongated in the NW–SE direction, the Scirocco winds, blowing along the major axis of the basin, produce significant high and long waves in the northern part that result from its long fetch [
60,
61]. The large waves generated by the Scirocco are associated with relevant storm surges responsible for coastal flooding [
62], whereby they are particularly intense under conditions of low pressure and high tide [
34]. On the contrary, the Bora has a short fetch, yet the wind is so strong that it generates relatively short and steep waves [
62], which can induce sediment resuspension [
63,
64]. With regard to the Venetian littoral zone, the wind forcing influences the entire coastal area, while the riverine freshwater affects only the circulation in the proximity of the estuaries but not the hydrodynamics at the inlets of the Lagoon of Venice [
65].
Figure 2 shows a summary of coastal circulation.
3. Materials and Methods
3.1. Coastal Cells
The Lido island may be defined as a coastal physiographic unit delimited by man-made structures (jetties at the Lido and Malamocco inlets). Three cells (A, B, and C) were identified within this unit. However, a small-scale analysis of the cell system has not yet been performed.
This study used morphological criteria to determine the different parts of a single coastal cell and placed cell limits at points of discontinuity regarding the direction of sediment transport.
Cell A is enclosed between the south jetty of the Lido inlet, whose structure and length have changed in recent years, and the north end of the Murazzi. The cell extends for ~4.8 km, representing the northern part of the island. The beach has elements of naturalistic value in the NNE sector (the Oasis of San Nicolò and the dune system of the Ex Ospedale al Mare), with limited human use where three rigid defences are found. The central portion is marked by the greatest urban development and seaside tourism with several groins along the entire length. The coast is very extensive in the NNE portion and narrows towards the SSW.
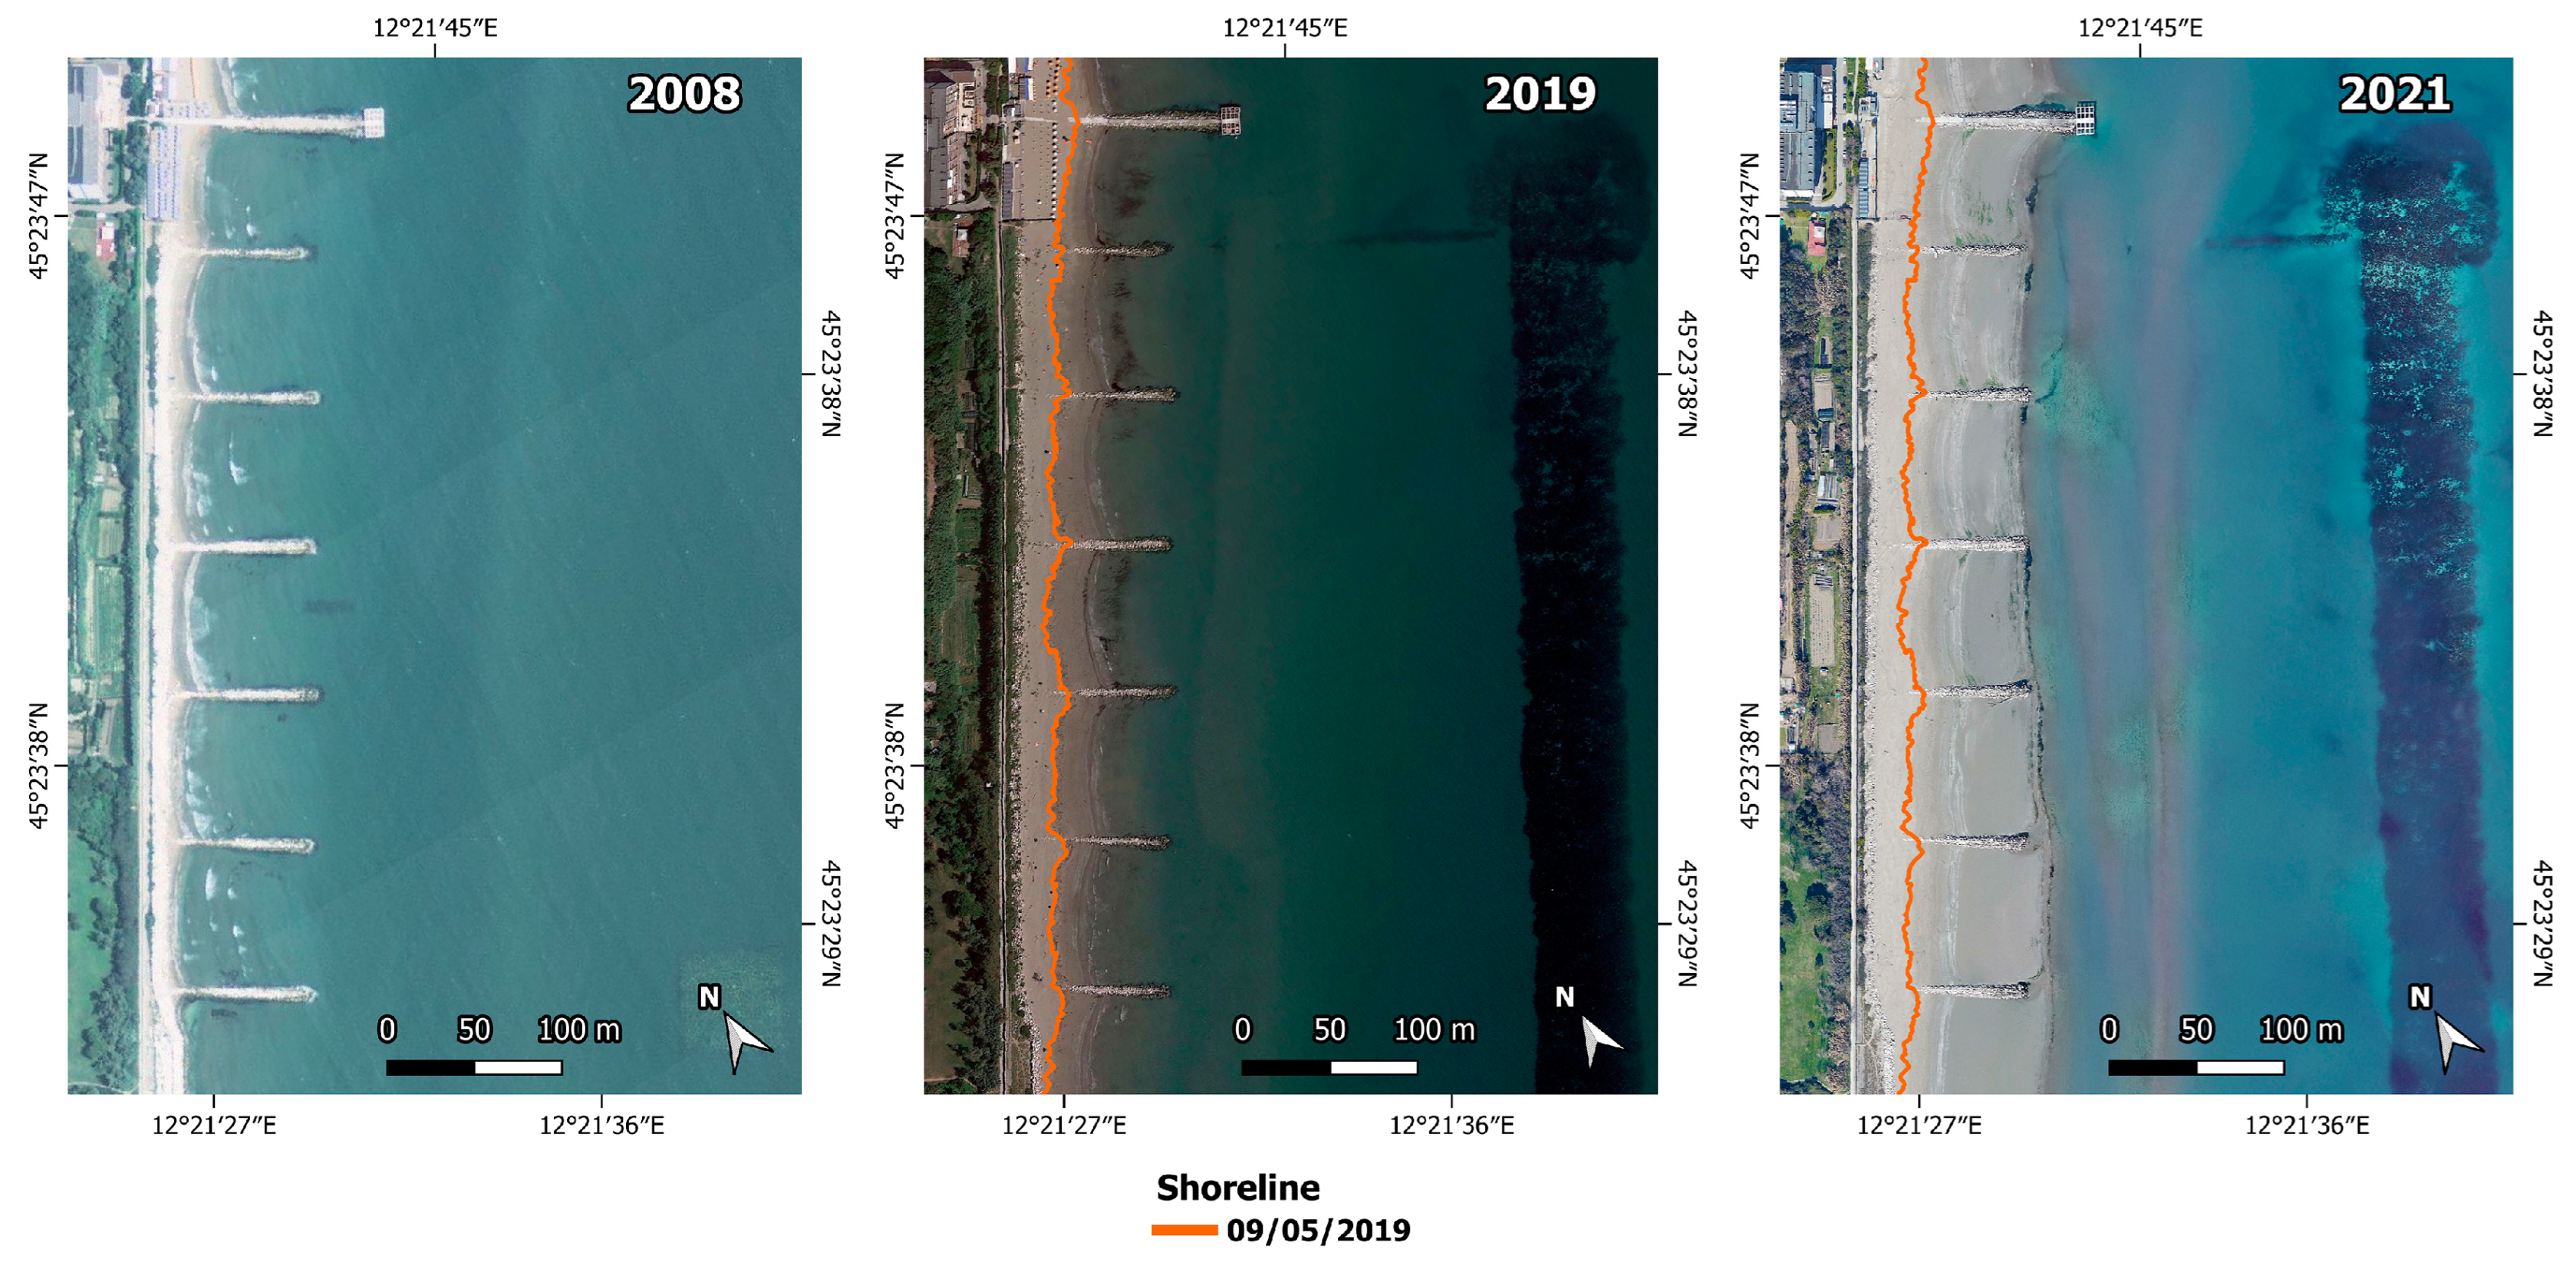
Cell B constitutes the central part of the Venice Lido and extends for ~4.7 km. The coast, historically erosive, is protected from storm surges and exceptional tidal events by a system of rigid defences which include the Murazzi that entirely armour the littoral zone, a series of groins, and a submerged breakwater placed at ~300 m from the shore. Cell B never had a beach; only after the construction of the submerged breakwater, built in 2008–2009, a natural nourishment process began along this coastal stretch.
Cell C extends for ~2.3 km and constitutes the southern end of the Lido island. It is characterised by scarce urbanisation, which is concentrated in the Alberoni village. The coast, once affected by more than thirty bathing concessions, is now almost completely re-naturalised, with the dune system and the pine forest behind it forming the Alberoni Oasis. Few bathing concessions are currently active; the biggest one is the Bagni Alberoni bathing establishment, which interrupts the continuity of the dune ridge that constitutes a natural defence against storm surges.
3.2. Aerial Photographs
Aerial photos and satellite images are of invaluable importance to evaluate landscape modifications over time regarding both urbanistic and geomorphological evolution. We obtained several aerial photos from the CVN and the Ministero delle Infrastrutture e dei Trasporti-Provveditorato Interregionale alle Opere Pubbliche del Veneto, Trentino Alto Adige e Friuli Venezia Giulia, previously Magistrato alle Acque di Venezia. In addition, we analysed some images available at the aerial photo library of the Regione Veneto geo data portal using the IDT-RV 2.0-INFRASTRUTTURA DATI TERRITORIALI DELLA REGIONE DEL VENETO (
https://idt2.regione.veneto.it/, accessed on 25 October 2019) (Regione del Veneto-L.R. n. 28/76 Formazione della Carta Tecnica Regionale) platform. We also obtained satellite terrain images from the Google Earth Pro software. The aerial photos and satellite images covered a time span of 64 years, i.e., from 1955 to 2019 (
Table 1).
We selected the best available images, mainly considering when they were taken. In this regard, we preferred the use of aerial photos and satellite images taken in spring and summer because those taken in autumn and winter often showed evidence of storms on the beach. However, the summer ones sometimes exhibited tracks of mechanical beach cleaning, thus making it difficult to identify the shoreline.
As the territory covered by the original photos is much larger than the study area, we cropped each of them and loaded the newly obtained images in the QGIS 3 software for georeferencing. We based the georeferencing process on the known coordinates (Gauss-Boaga East) of the digital topographic maps at the 1:5000 scale, available in vectorial DXF format and dating back to 1994. This GIS project was set accordingly to the Monte Mario/Italy Zone 2 (East) EPSG: 3004 reference system. Owing to the rather poor resolution of the older aerial photos, we decided to use the Thin Plate Spline (TPS) transformation as it allows the correction/reduction of any eventual image distortion, and the nearest neighbour resampling method as it is the most conservative. To achieve a proper georeferencing result, we used about 20 ground control points (GCP) per photo, on average.
We outlined the shorelines by manually tracing them at the boundary between dry and wet sand. Due to sunlight reflection on the 1987 photos, the identification of the related shoreline was quite difficult; consequently, we managed to identify it by turning the photos to false colours on the blue band; we also drew the coastal defence works.
In this regard, the INSPIRE (INfrastructure for Spatial InfoRmation in Europe) directive (point 1 of attachment II) defines the shoreline as follows: “A shoreline is a boundary where a sea area meets land. However, there can be many different shorelines depending on the tidal state. A shoreline must therefore have a value for the water level that identifies the tidal state used to define the shoreline”.
Unfortunately, the exact time of the photos was not available; consequently, we were not able to calculate the height of the tide occurring when each image was taken. We acknowledge that this issue could imply an error in the evaluation of the advance and retreat of the coast. In addition, it was not possible to provide the pixel dimensions of the pictures as the aerial photos that we used were scans of analogue frames that were made at different resolutions. Consequently, we were not able to estimate the error that could have been produced in the course of manual tracing of the boundary between dry and wet sand.
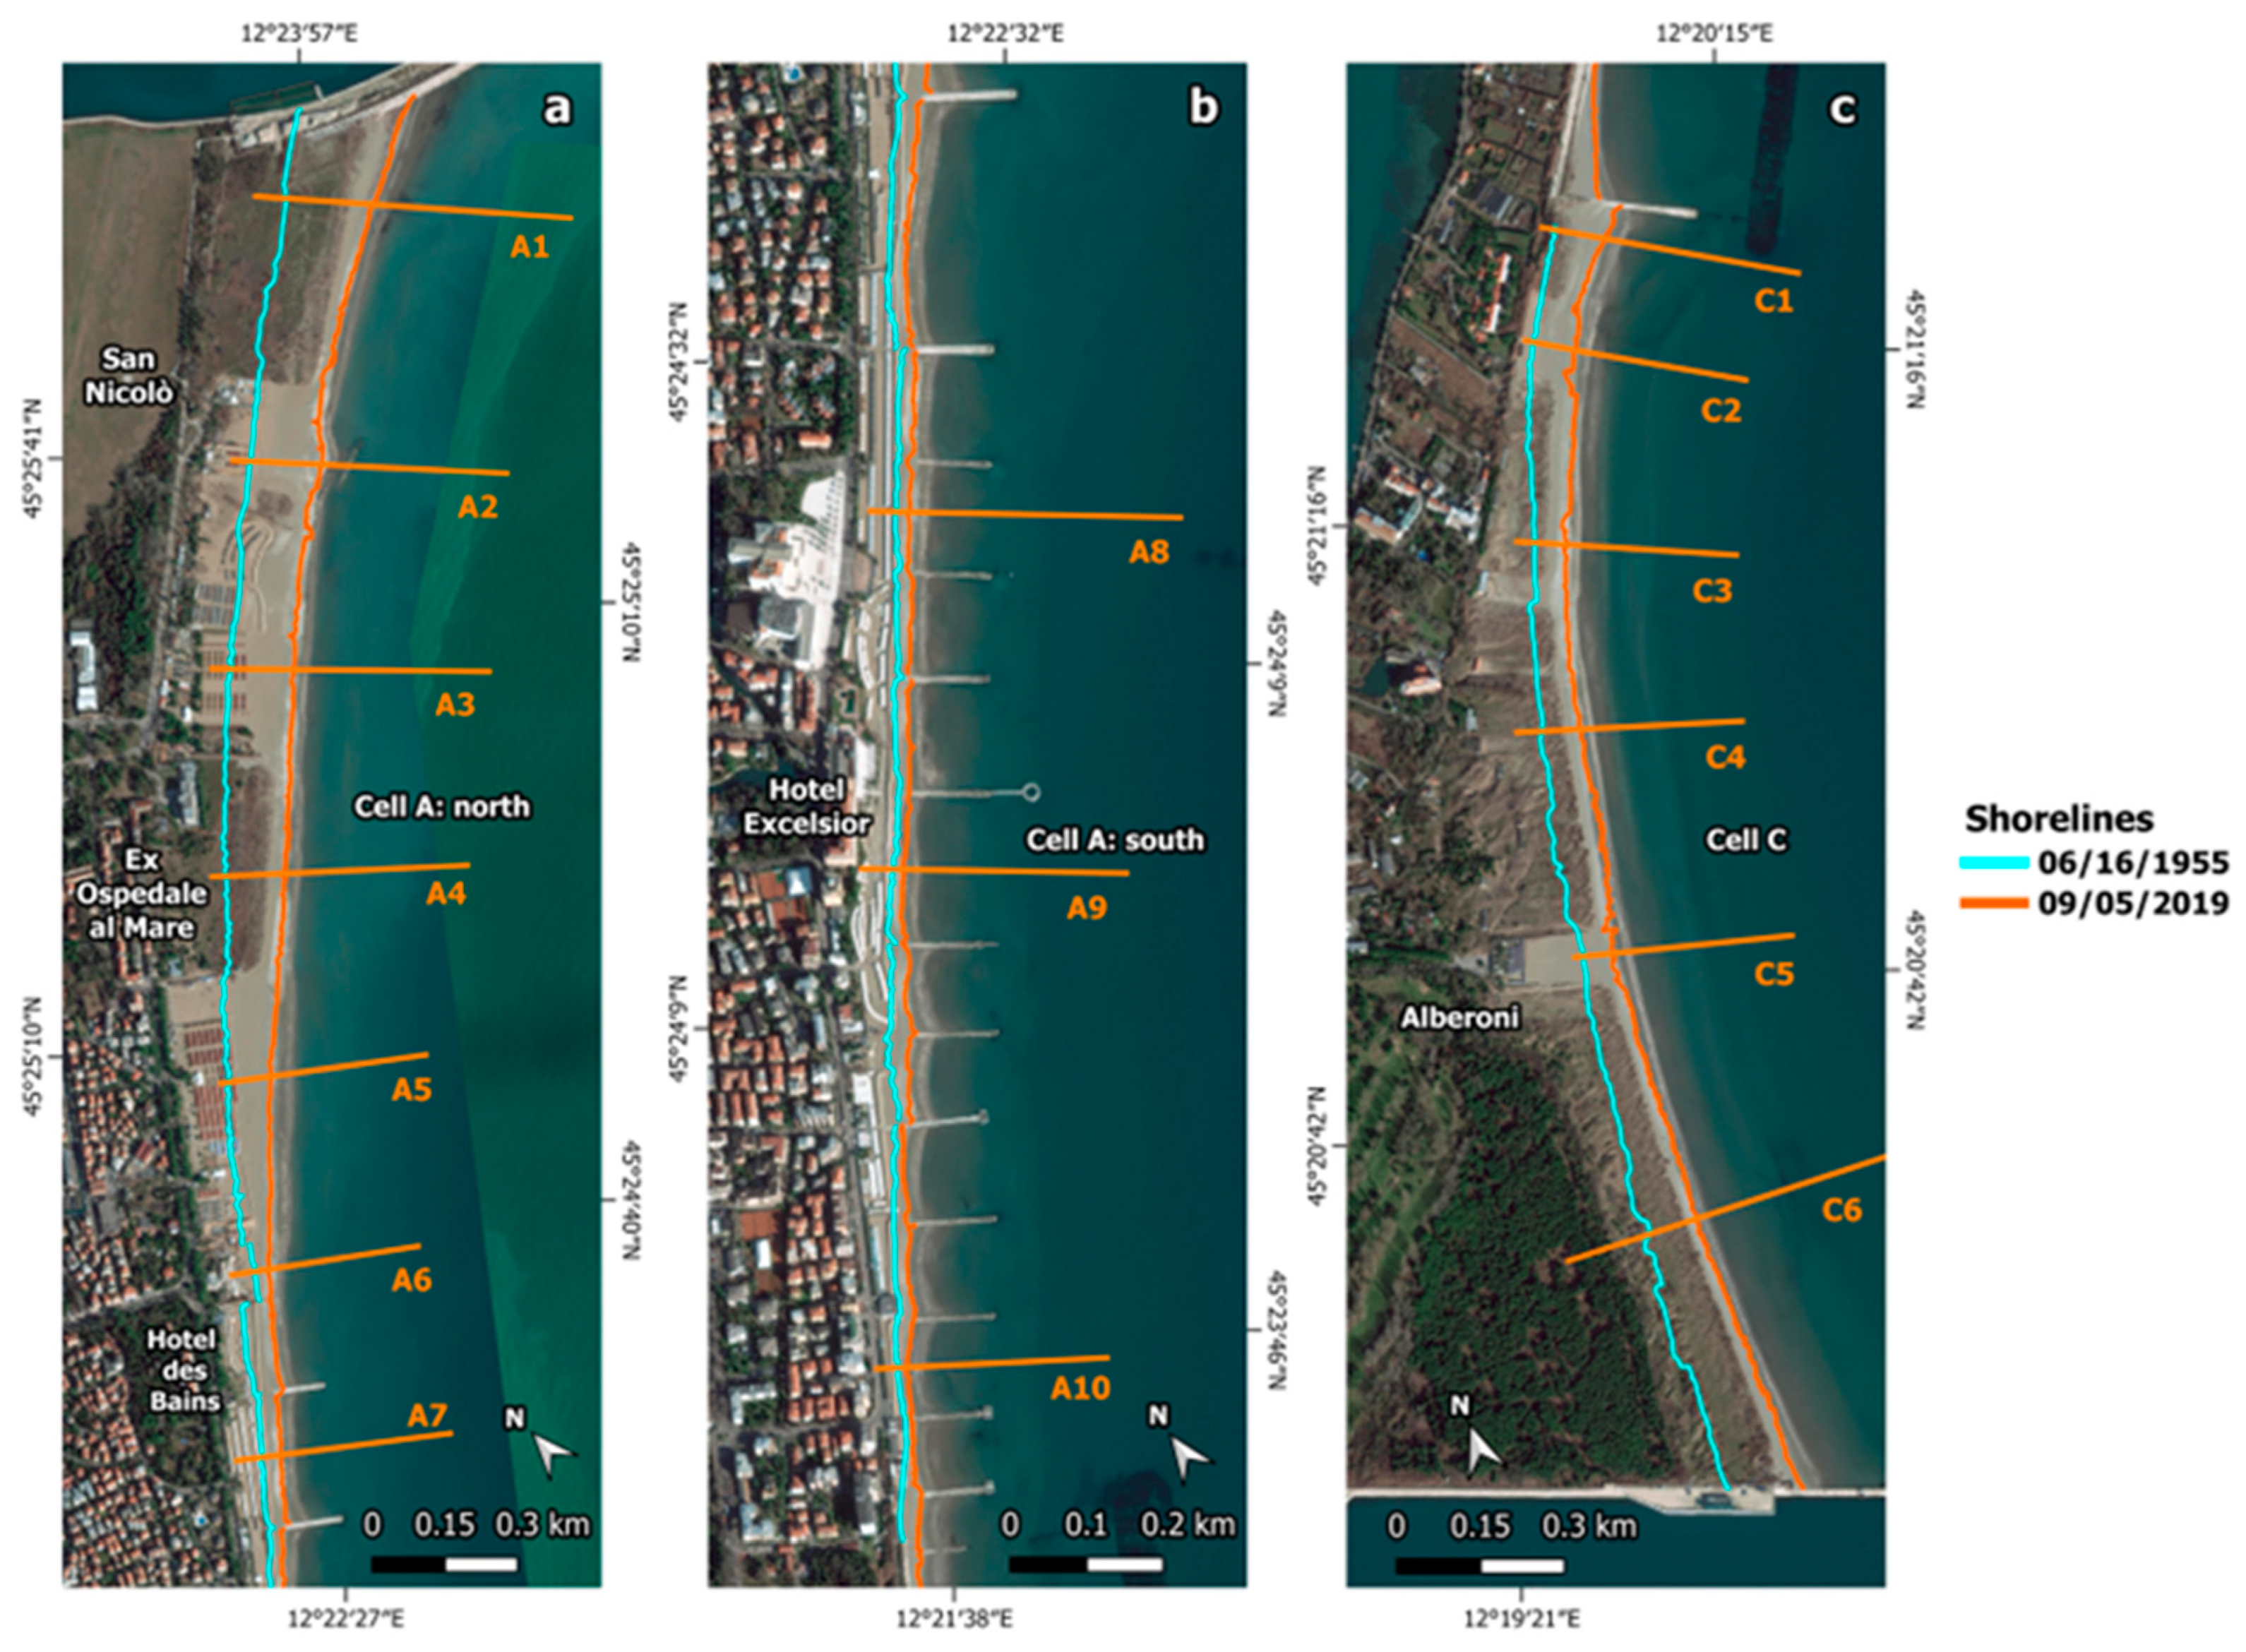
We defined fifteen approximately equidistant transects perpendicular to the coast within cells A and C (
Figure 1b,d); moreover, we added another transect at the northern end of cell C in order to get a better evaluation of the beach accretion following the construction of a breakwater at the boundary between cells B and C, which was built in the period 2005–2006.
To avoid any possible errors in the measurements of the beach advance and retreat along the identified transects, we used the “Line Intersections” tool to generate the intersection points between the shorelines and the transects. Then, by displaying only the points of intersection, we used the “Measure Line” tool (set to “ellipsoidal”) with the snapping function enabled to measure the distance between consecutive intersection points for each transect. The obtained advance and retreat data were organised in a table (
Table S1). Since the considered time intervals were not homogeneous, the annual advance/retreat rates of the shoreline along the different transects were also calculated (
Table S2). To draw
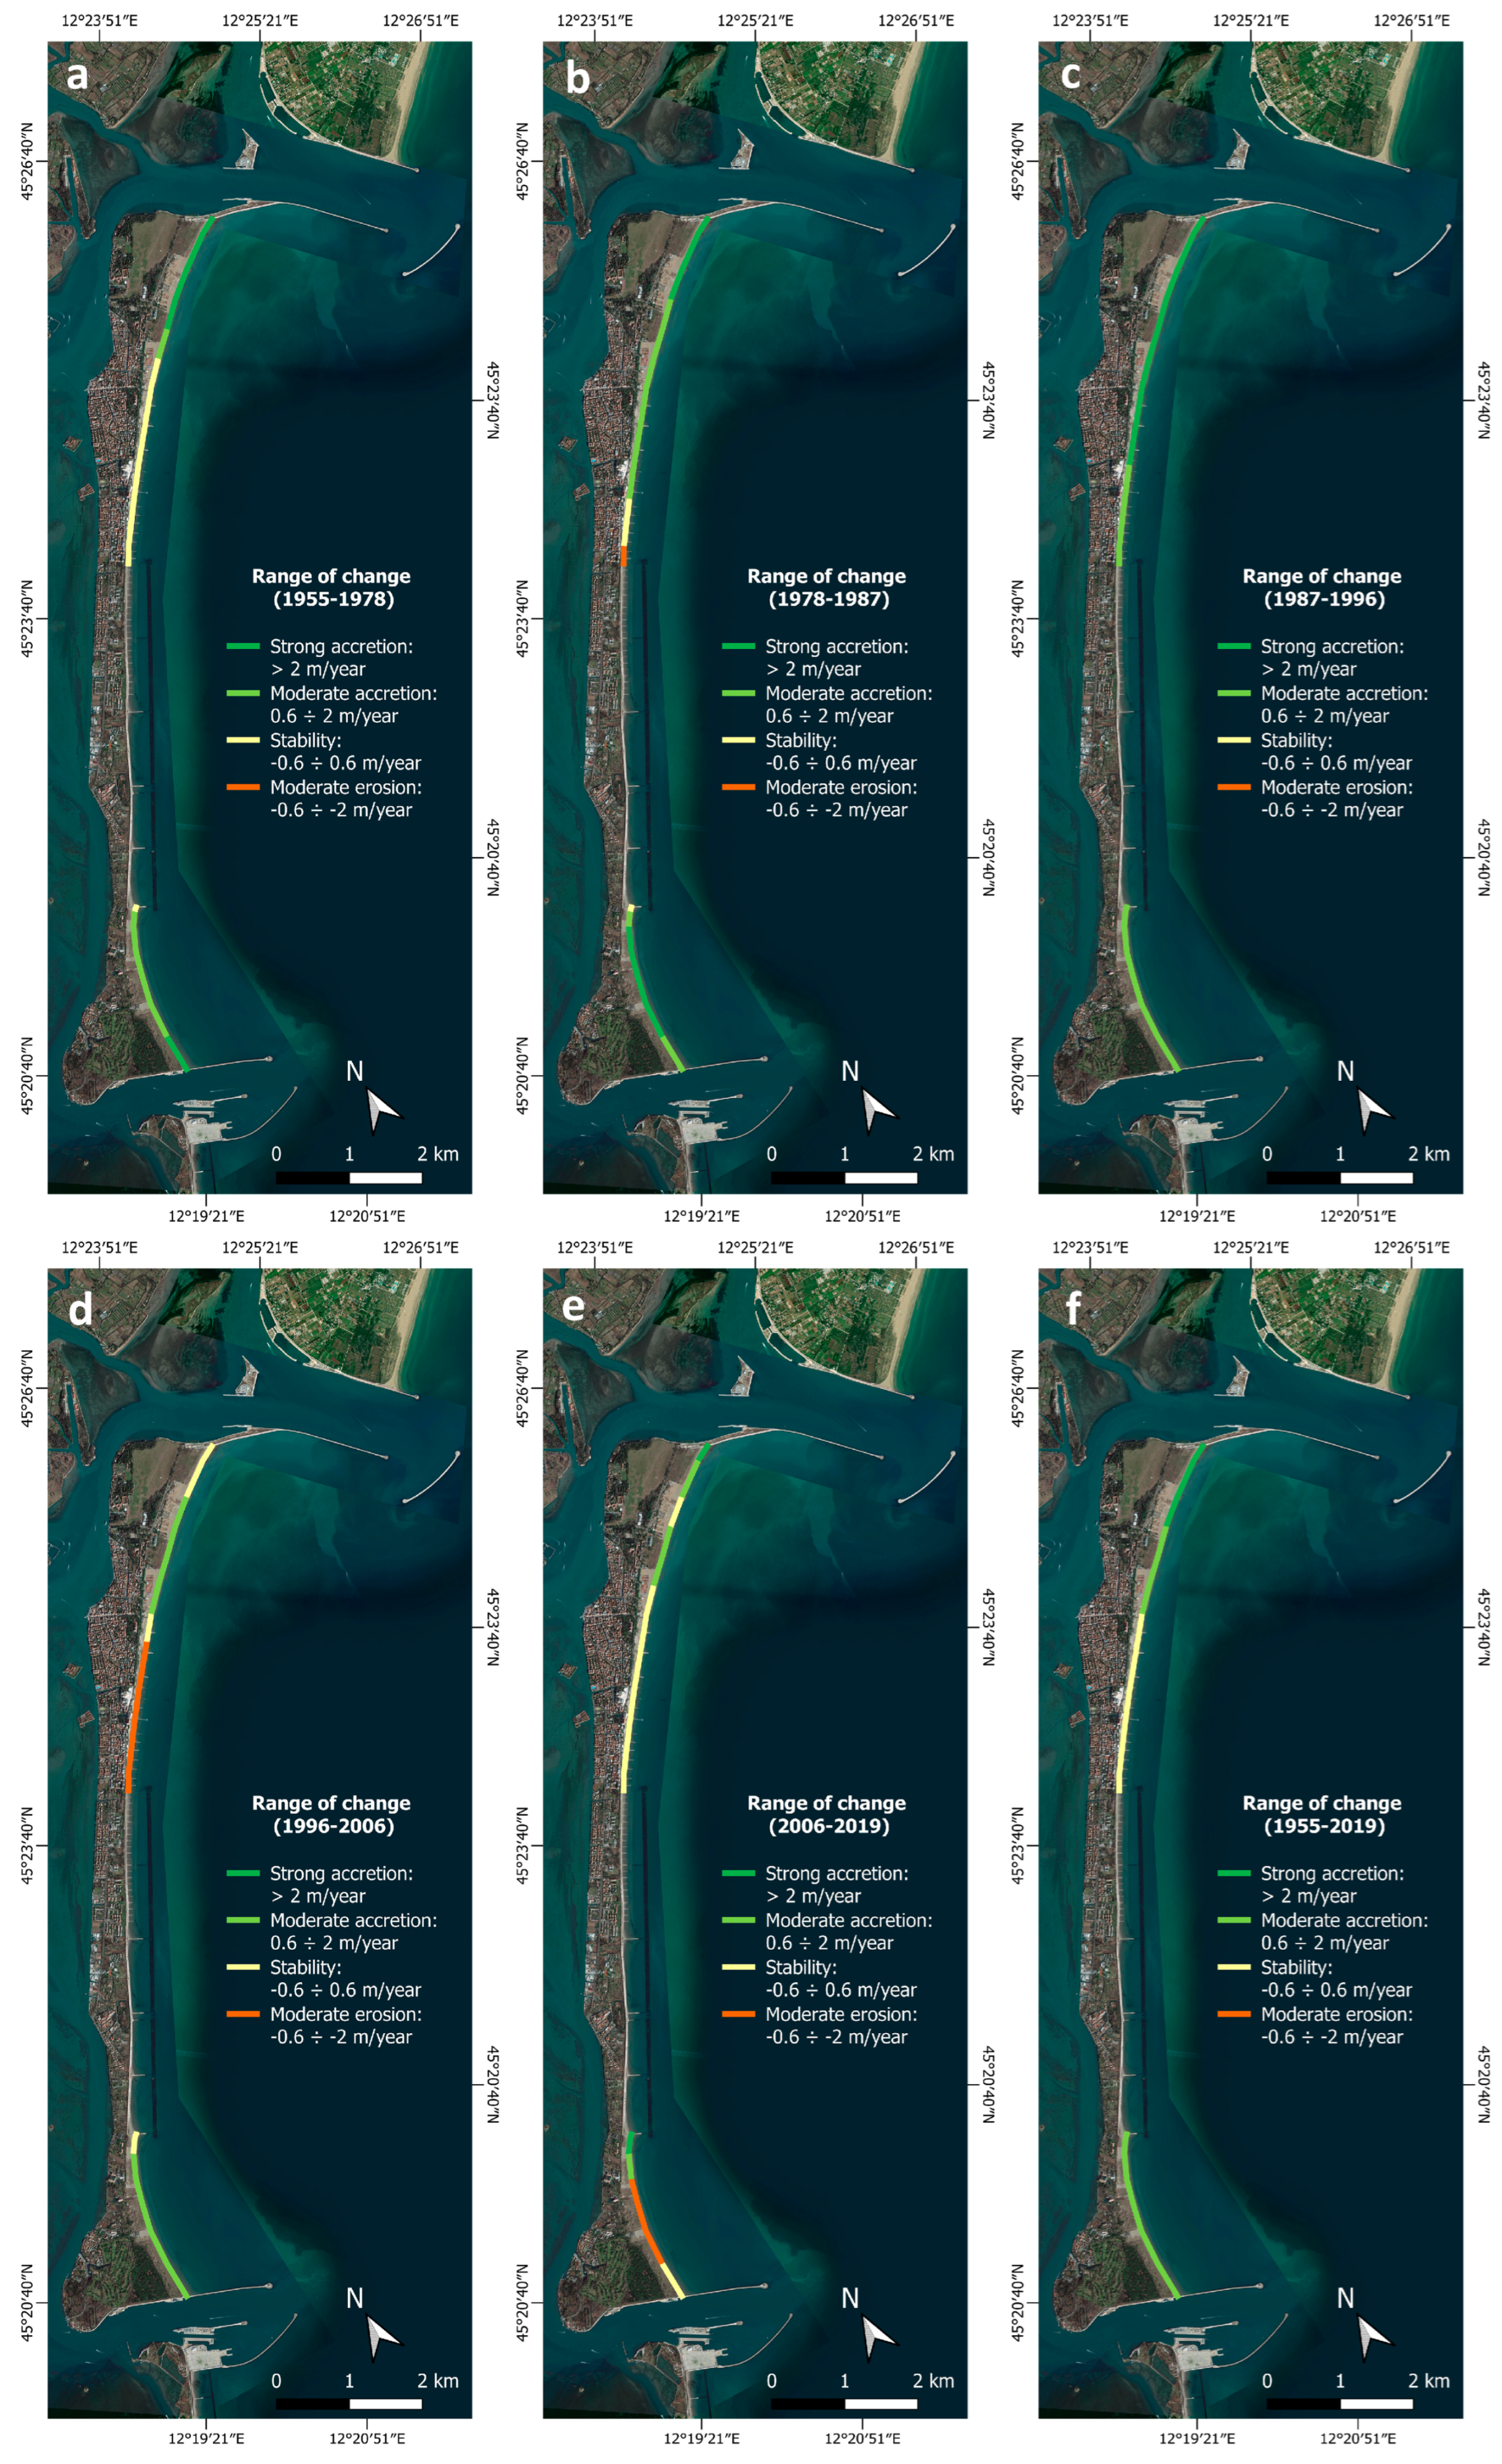
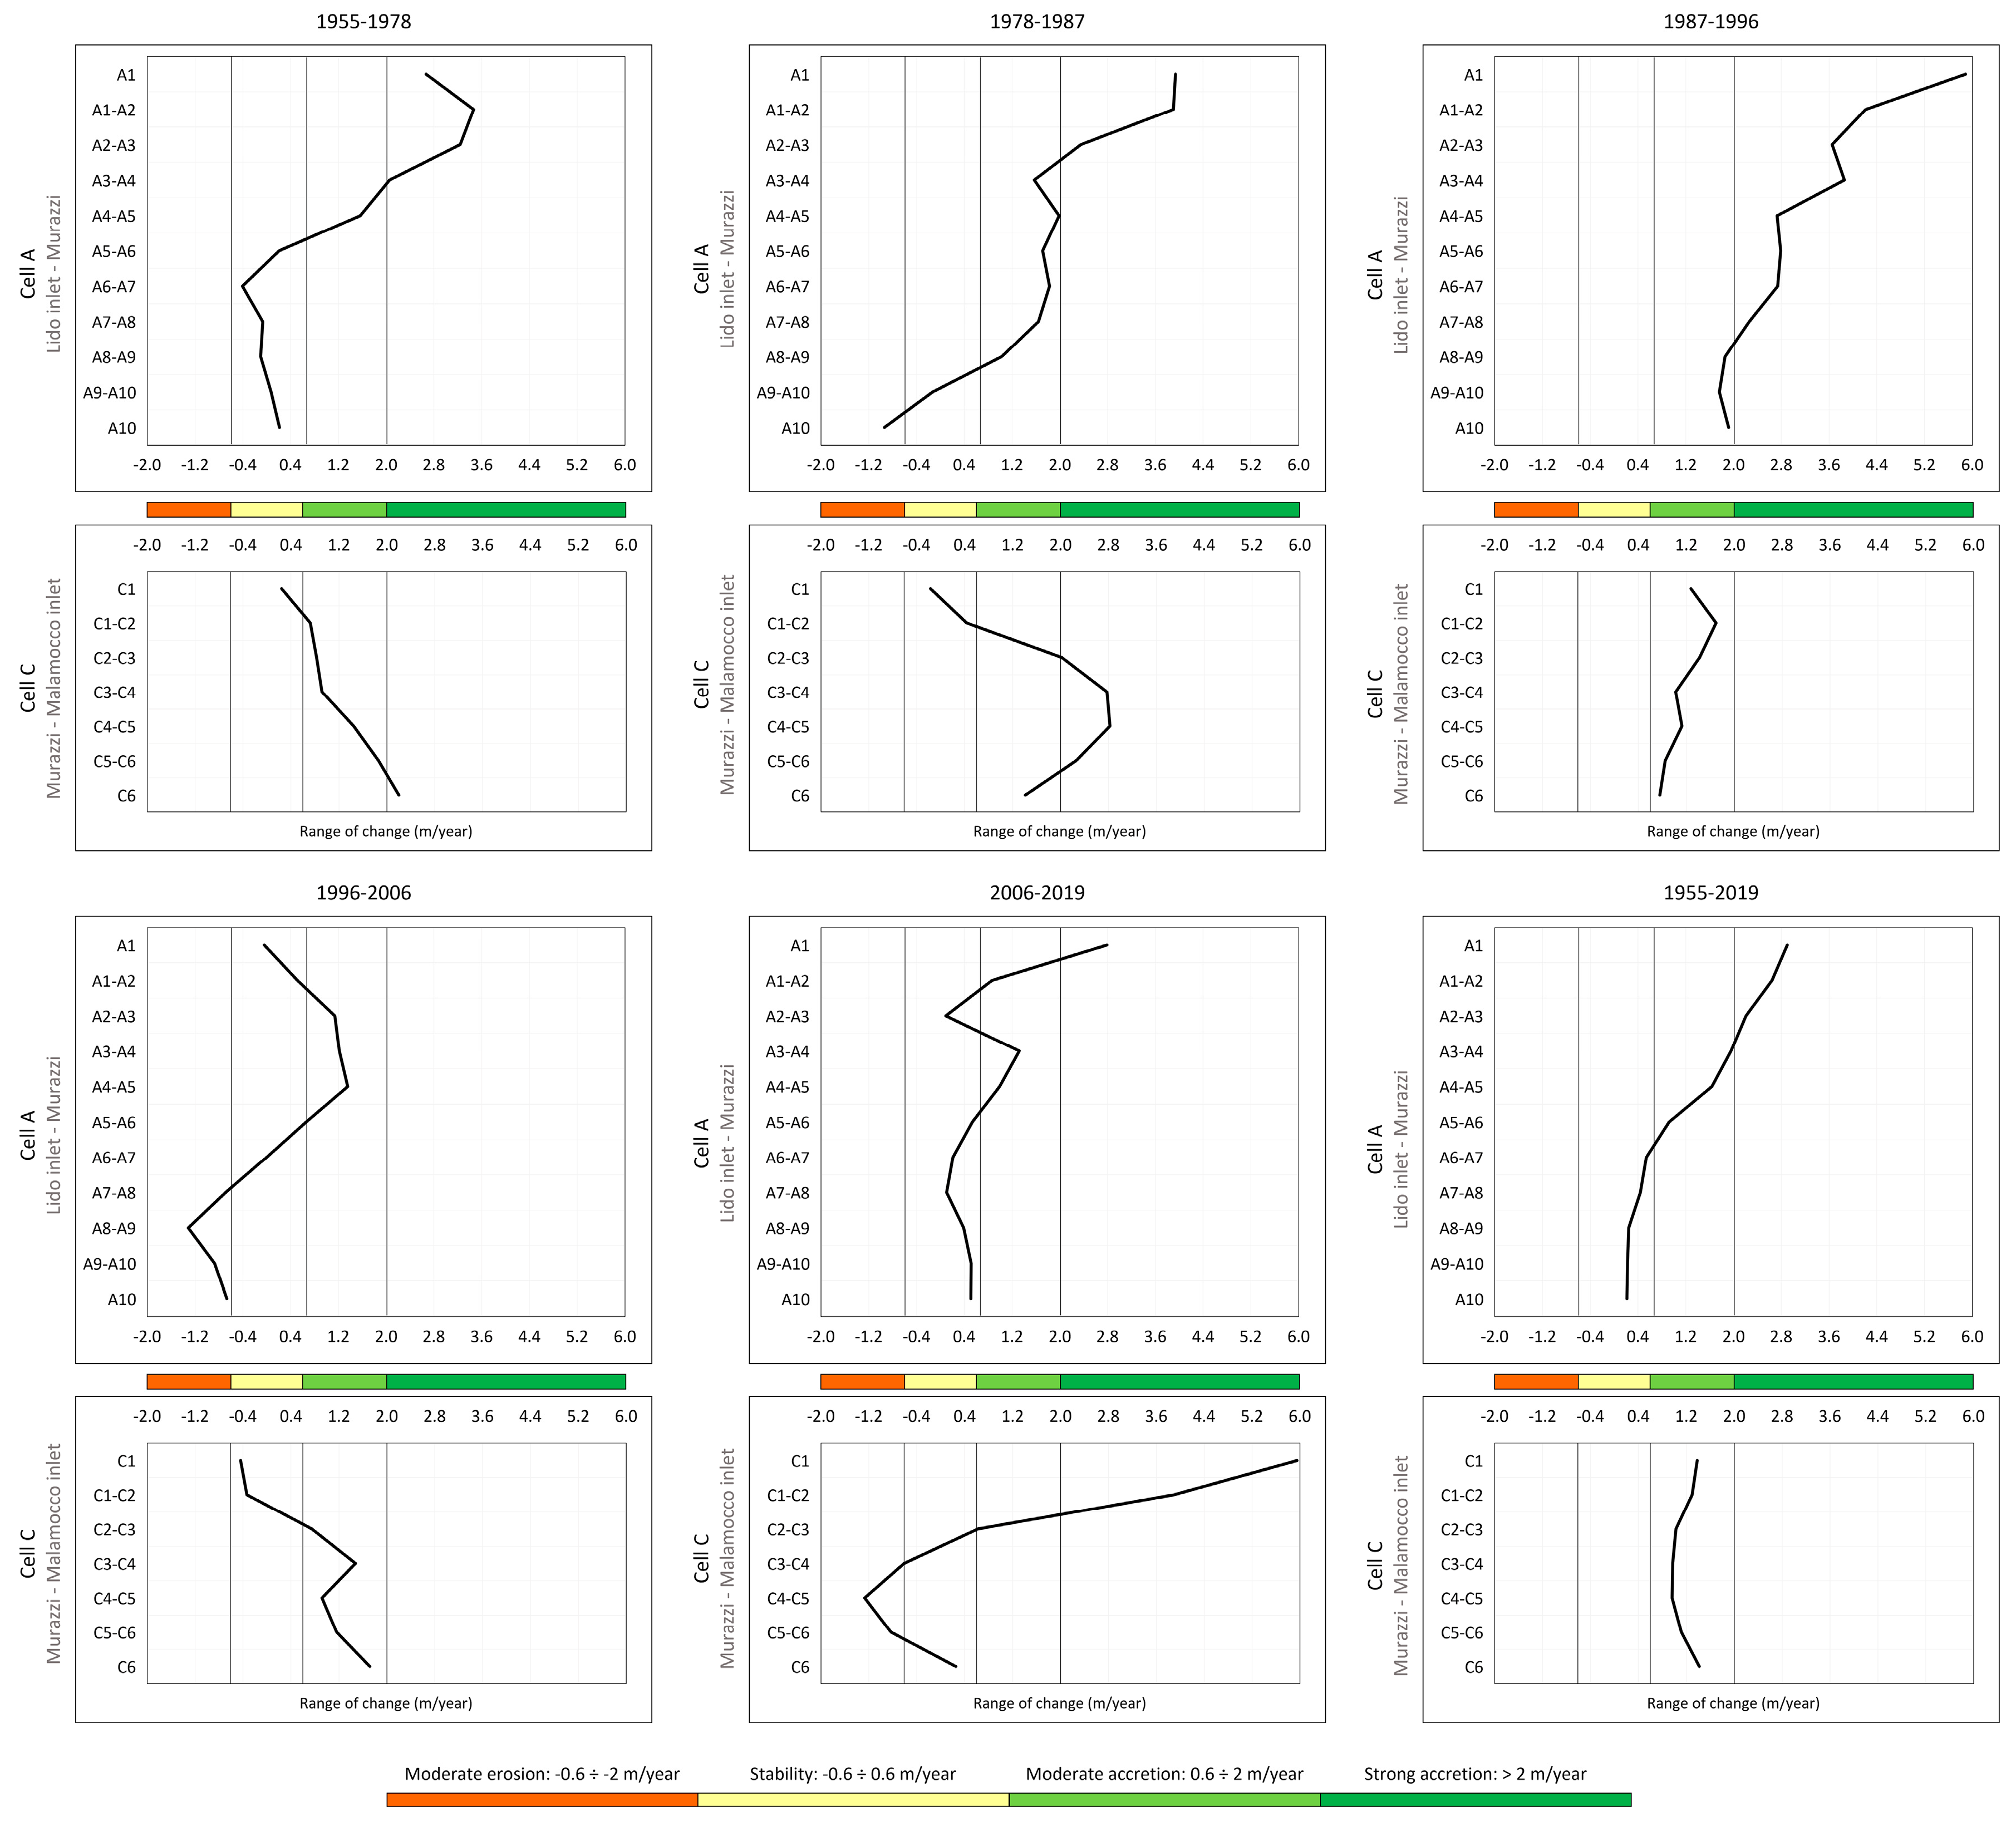
Figure 3 and
Figure 4, we considered the stretches of coastline between the transects, assuming for each stretch the average value of the annual advance/retreat rates measured along the transects bordering it. For the stretches of coastline located north and south of transects A1, A10 and C1, C6, respectively, the value measured along the nearest transect was assumed (
Tables S3 and S4).
4. Results and Discussion
The shoreline is a dynamic feature that records changes, in short-, medium- and long-term, in response to natural processes (e.g., waves, tides, currents, river inputs, storm events, and sea-level rise) [
66,
67,
68]. The coastline modifications provide information on coastal dynamics and sedimentary transfers taking place along the coast [
68]. In the Lido barrier, sediment transport is controlled by hydrodynamic actions, solid inputs carried by longshore currents, and anthropogenic features. In the following sections, the shoreline changes along the three sectors (mostly accretion/stability phenomena) are discussed. The findings on the shoreline evolution are interpreted in light of the main environmental coastal variations, sediment transport, dune fragmentation, and coastal armouring impact. The main causes of progradation, stability, and erosion along the Lido barrier are related to the wave–current regimes, construction of breakwaters and groins, reinforcement works at the jetties of Lido and realisation of structures related to the MoSE project.
Table 2 summarises the human interventions in cells A, B, and C and outlines the history of the impacts over time that led to the island’s evolution. The littoral zone, due to its orientation, is exposed to waves caused by major winds blowing from two dominant quadrants, i.e., southeast (second quadrant, Sirocco wind) and northeast (first quadrant, Bora wind). In the western Adriatic Sea, Bora conditions tended to maximise sediment flux because they increase both waves, which become capable of suspending sediment, especially along the northwestern coast [
63,
64,
69], and the WACC [
27,
65]. Sirocco, which may reduce or reverse the WACC owing to its blowing direction, can induce the maximum northward transport of sediments delivered by the northwestern Adriatic rivers to the sea (mainly the Po River) [
52,
59]. However, it can also produce longer-period waves and much stronger bottom stress in the shallow coastal regions than waves associated with Bora [
70].
In
Table 3, a summary of the exceptional storm surges that occurred in the considered periods was reported.
In addition, the presence of groins and jetties interrupts the natural southward coastal drift, thus altering the local sediment budget [
71]. Consequently, along the Lido island sediments are partially intercepted by the jetties at the Lido and Malamocco inlets.
Figure 2 provides information on the natural processes and sedimentary transfers taking place along the coast before and after the realisation of structures related to the MoSE project.
Over the time between 1955 and 2019, the coastal area of the Lido littoral zone was also largely modified following the great urban development and seaside tourism with the increasing of bathing concessions and the strengthening of the defence structures.
4.1. Shoreline Change Analysis
The long-term shoreline change analysis was carried out over a time frame covering 64 years (1955–2019). A synthesis of coastal change rates recorded between 1955 and 2019 is presented in
Figure 3 and
Figure 4, where some maps and graphic representations of the results are shown.
Figure 3 shows the overall shoreline change that occurred since 1955, revealing a significant temporal variability over 64 years. In both cell A and cell C, an overall pattern of prevailing accretion was detected during the periods 1955–1978, 1978–1987, and 1987–1996, whereas prevailing stability, or even erosion, occurred during the periods 1996–2006 and 2006–2019. However, exceptions to this general trend can be highlighted by analysing the area in detail.
4.2. Period 1955–1978
From 1955 to 1978 (a 23-year period), stability to strong accretion occurred along the entire coastal stretch (
Figure 3 and
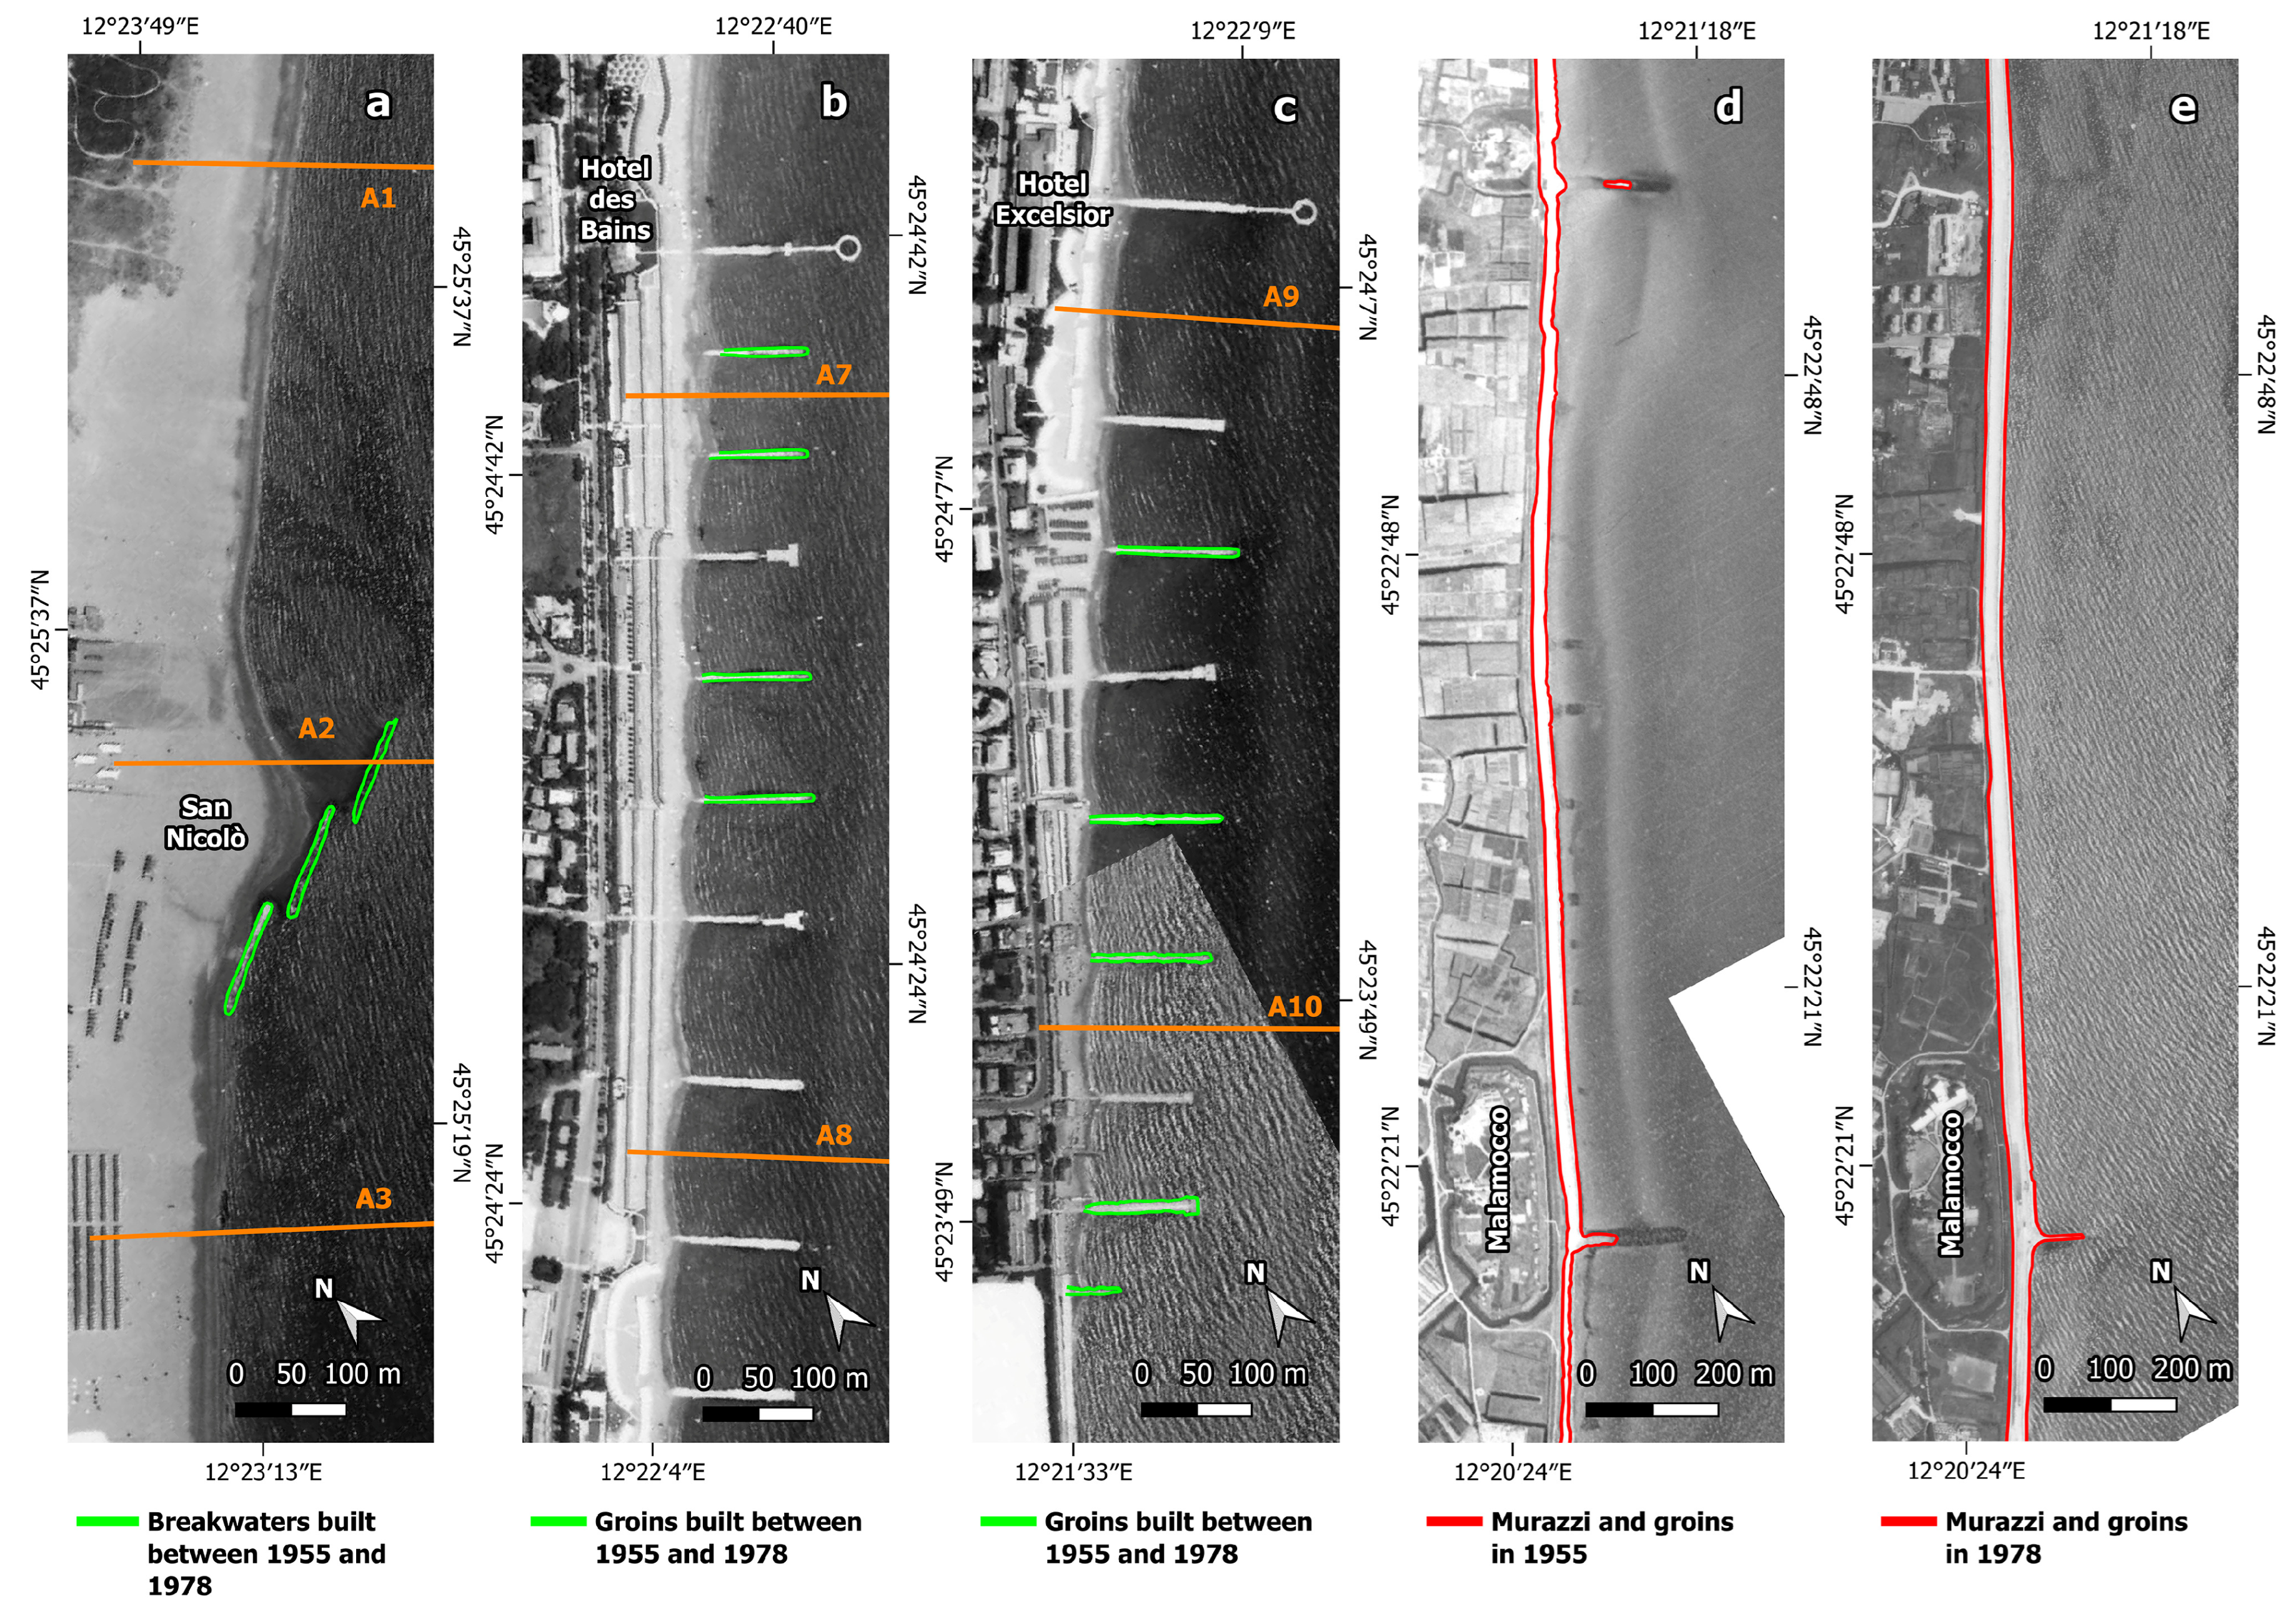
Figure 4). The analysis of the aerial photos of 1955 and 1978 allowed for highlighting the important coastal defence works built within cell A after the flood occurred in 1966.
In cell A, the shoreline underwent strong accretion in the northern part, from San Nicolò to the Ex Ospedale al Mare, with a maximum accretion rate of 3.47 m/year and 3.24 m/year in transects A1–A2 and A2–A3, respectively (
Figure 4). At San Nicolò, the largest increase in the beach occurred in correspondence with the installation of three breakwaters (
Figure 5a). A very restricted area of moderate accretion (1.56 m/year, transect A4–A5 in
Figure 4) was located south of the Ex Ospedale al Mare (
Figure 3). Stability, with a maximum rate of 0.21 m/year and a minimum rate of −0.41 m/year (transects A10 and A6-A7, respectively, in
Figure 4) occurred in the remnant sectors of cell A. In view of the evolution from south to north, it can be observed that accretion progressively increased approaching the jetty of Lido, which acted as a barrier that not only intercepted the sediment transport of the longshore current but also protected the northern end of the island from the Bora wind. In the considered period, along the southern part of cell A, the construction of 9 groins is noteworthy (
Figure 5b,c), while those already existing in 1955 appeared to have been restored and strengthened. These coastal structures positively favoured a condition of stability and subsequent accretion until 1996.
With regard to cell B, the dismantling of a groin that was almost completely submerged, the rebuilding of the groin in front of Malamocco village, and the restoration of the Murazzi were observed after the flood occurred in 1966 (
Figure 5d).
Cell C was characterised by stability (0.24 m/year, transect C1 in
Figure 4) in the northern part adjacent to the Murazzi, strong accretion at the end of the barrier (2.20 m/year, transect C6 in
Figure 4), and moderate accretion (maximum 1.86 m/year, transects C5-C6, and minimum 0.72 m/year, transects C1-C2 in
Figure 4) along the remaining coastal stretch. This condition is compatible with the direction of sediment transport available in the literature [
35].
The period 1955–1978 may be considered as the reference point to interpret the evolution of the Lido barrier in the following periods. In particular, during that interval of time, the environmental conditions were influenced by significant subsidence rates that in 1969 caused a maximum land sinking of 10 mm/year [
72]. This phenomenon, caused by the intensive groundwater withdrawal occurred mainly in the industrial zone located at the edge of the lagoon and secondly in the Lido littoral zone for tourism needs, was particularly severe in the 1950s and the 1960s [
73]. It slowed down after 1970, when drastic measures to limit artesian overexploitation were taken, and came to a stop in 1973. As a result, a positive phase of the sinking process along the entire littoral zone was already measured in 1973. Even if land subsidence can cause shoreline retreat [
74,
75,
76], along the Venice littoral zone this occurrence was not observed because of the presence of the Murazzi, which protected the coast from the ingression of the sea. However, Carbognin et al. [
73] demonstrated that the sea modified the submerged littoral zone by increasing the coastal slope. Indeed, the bathymetric surveys carried out from the shoreline to the 5 m isobaths during the period 1954–1992 showed that the near-shore bottom slope of the Lido island underwent the maximum increase value (0.50% or more) from 1954 to 1968. The destructive effect of the storm that struck the northern Adriatic coast in 1966 could have intensified the subsidence impacts.
4.3. Period 1978–1987
This period is marked by the appearance of erosion phenomena (
Figure 3 and
Figure 4). Sedimentation continued in cell A with strong accretion (maximum 3.94 m/year, transect A1, and minimum 2.35 m/year, transects A2–A3 in
Figure 4) in the San Nicolò area again, while moderate accretion (maximum 1.99 m/year, transects A4–A5, and minimum 1.02 m/year, transects A8–A9 in
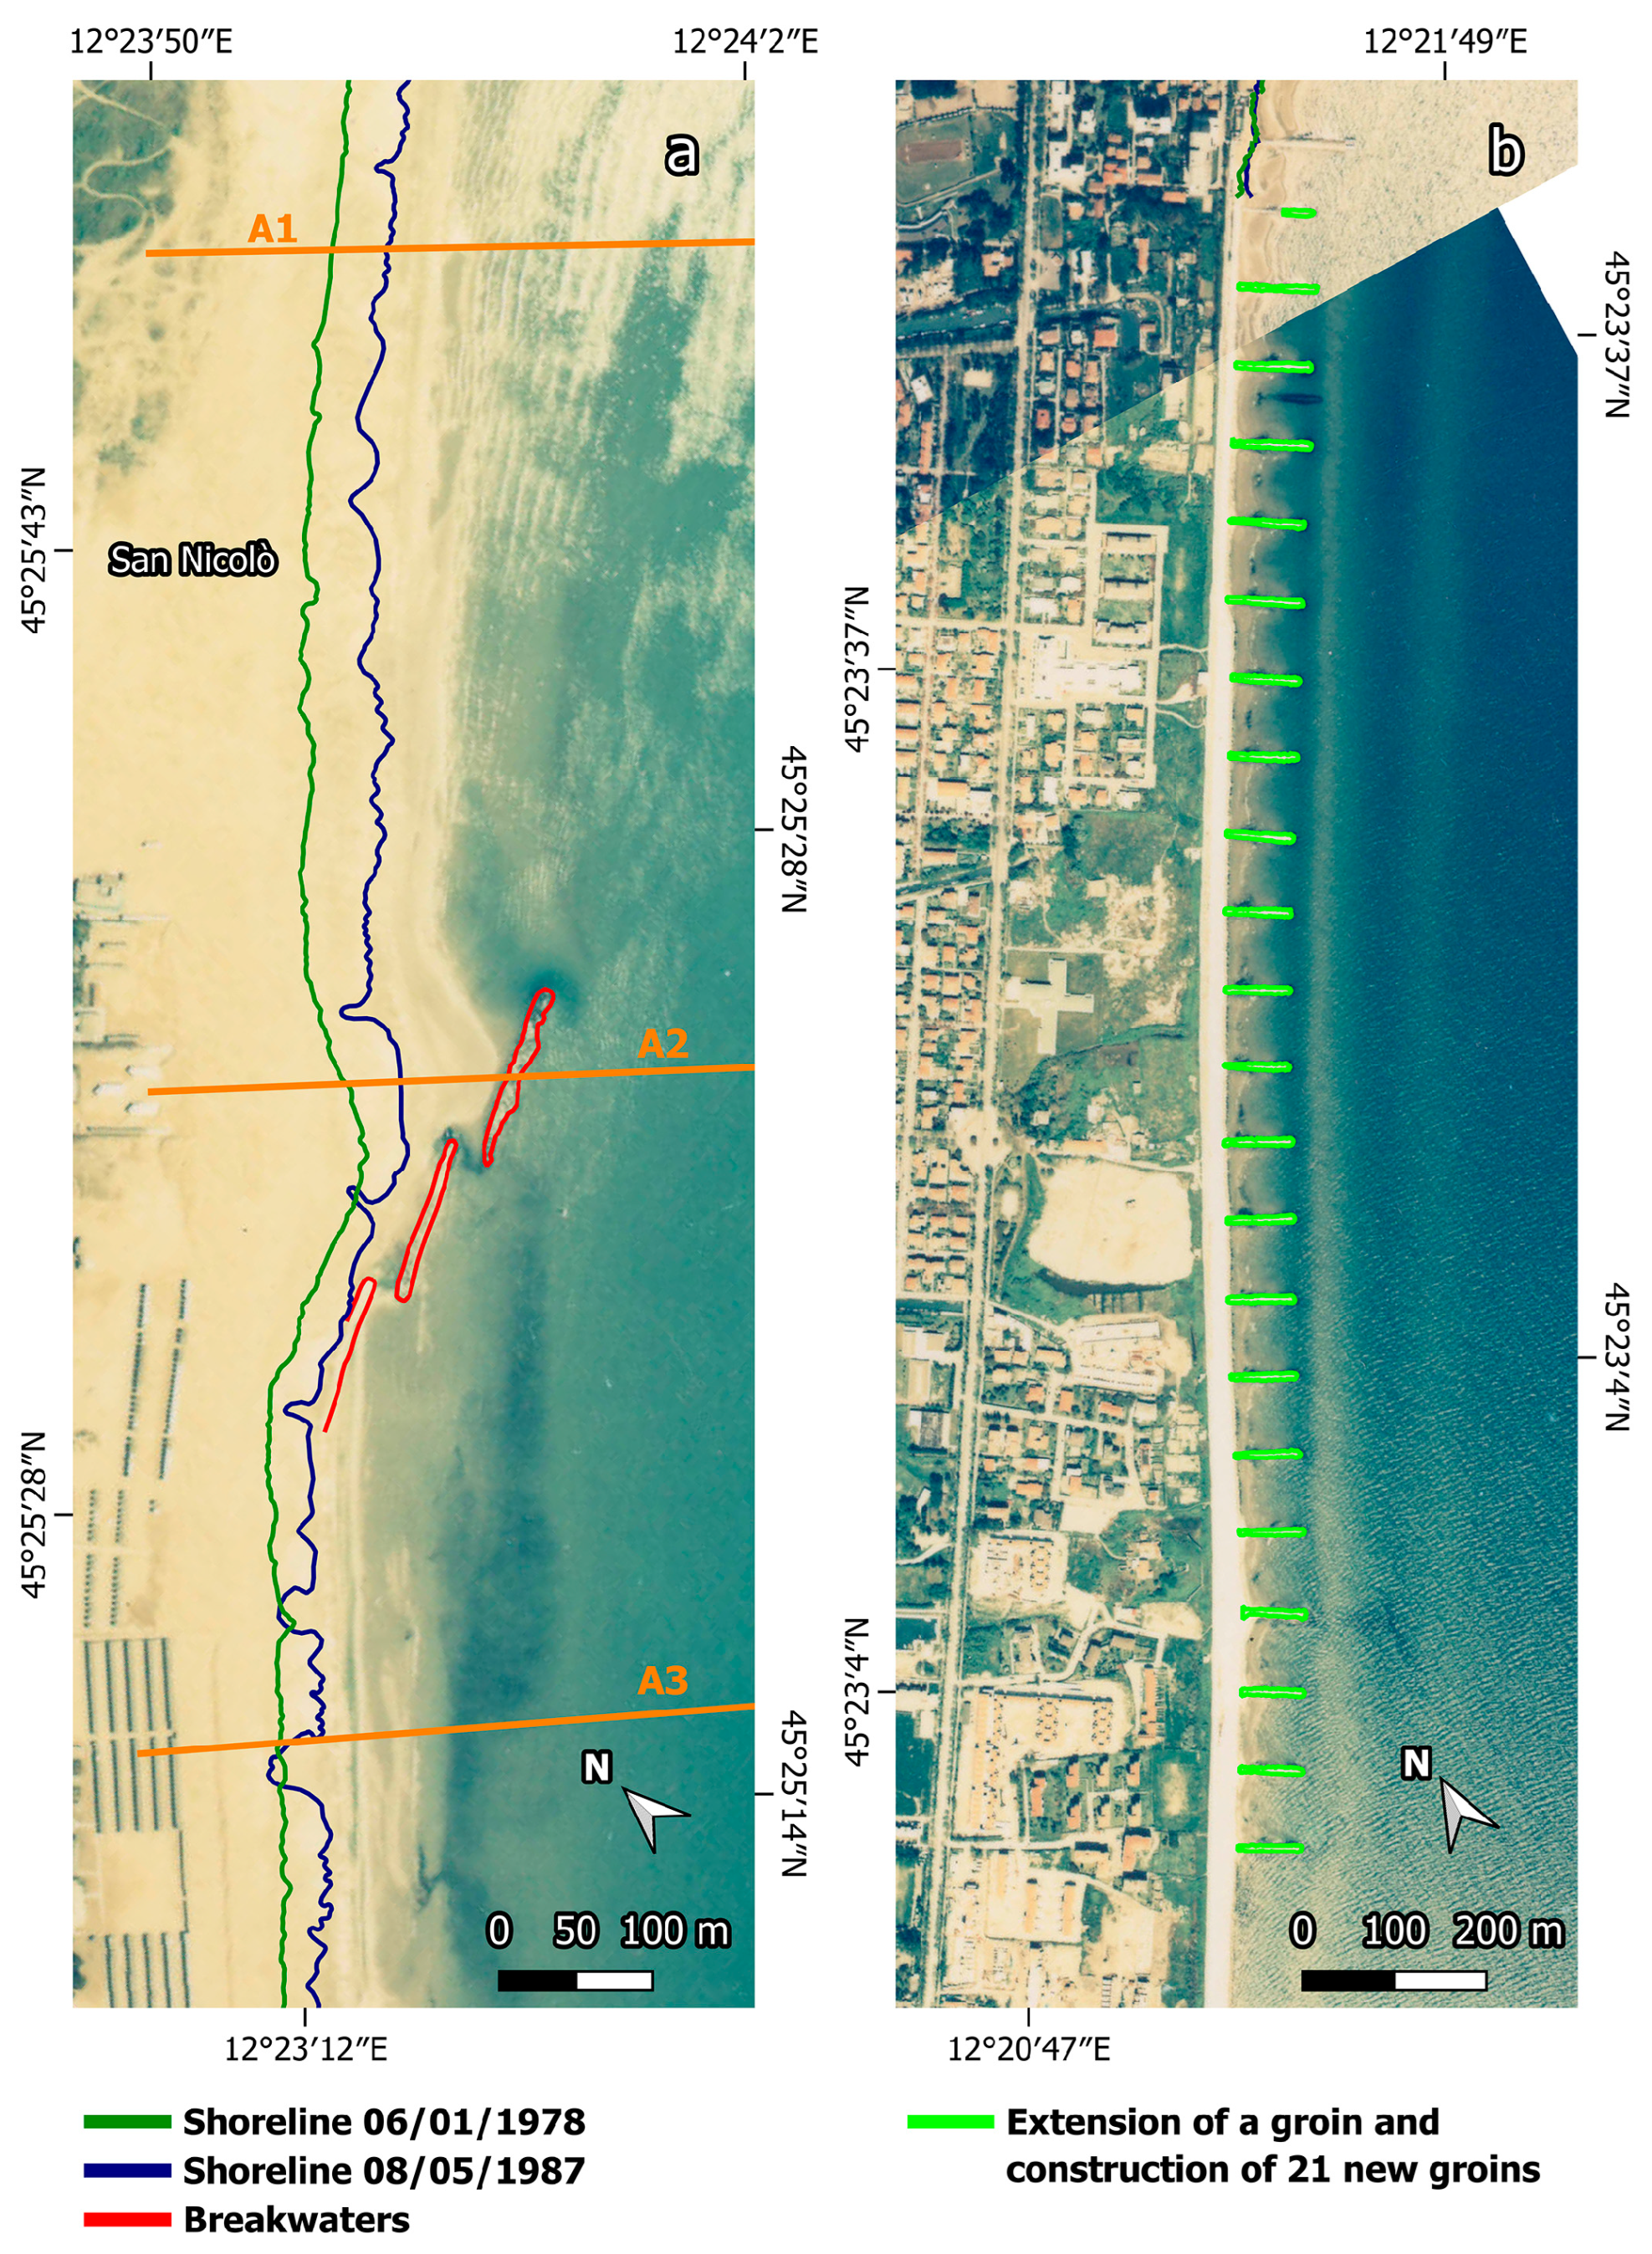
Figure 4) occurred southward, from about the Ex Ospedale al Mare to the Hotel Excelsior. At San Nicolò, an advanced process of silting up of the two rearmost breakwaters, due to the formation of a tombolo that reached the barrier furthest to the sea, took place (
Figure 6a). A very short area of stability (−0.13 m/year transects A9–A10 in
Figure 4) was located south of the Hotel Excelsior and moderate erosion (−0.94 m/year, transect A10 in
Figure 4) was recorded near the Murazzi (
Figure 3).
The shortening of the coastal stretches characterised by strong progradation and stability, previously observed in cell A and now partly substituted by less prominent accretion towards the north and by erosion close to the Murazzi, could be linked to storm surge events. Indeed, in the period 1978–1987 several storm surges, due to the Bora wind, occurred. The two major events took place in December 1979 and February 1986 [
58]. The former (i.e., the 1979 event) was characterised by a water level of 166 cm and gusts of Bora up to 42 knots on the upper Adriatic, whereas during the latter (i.e., the 1986 event), the water level reached 159 cm and the Bora produced wind gusts up to 43 knots ([
58,
77] and references therein). In this respect, regarding the low-energy coast of the Lido island, after the occurrence of high-energy events such as those of 1979 and 1986, a relatively long recovery period is necessary for beaches to return to the pre-storm equilibrium under prevailing hydrodynamic conditions ([
78] and references therein). In the same period, no changes were made to the defence structures present in this cell. The computed values really indicate the representative trend over the period of 1978–1987; this is due to the high number of Bora events and not just to a single event.
Figure 4 shows the general trend of cell A, where areas of stability and erosion are present in the central-southern parts of the island, which are the most vulnerable to the Bora wind.
In cell B, the groin at the northern end of the Murazzi was extended seaward, and 21 new groins, placed at a regular distance of 70 m, were built (
Figure 6b). These interventions followed the strong storm that occurred in December 1979.
Cell C was characterised by stability (−0.17 m/year, transect C1 in
Figure 4) in the northern part close to the Murazzi’s southern end, while strong accretion (maximum 2.83 m/year, transects C4–C5, and minimum 2.02 m/year, transects C2–C3 in
Figure 4) was recorded in the central sector of the cell. Two short areas exhibited moderate accretion (0.43 m/year, transects C1–C2, and 1.41 m/year, transect C6 in
Figure 4). No defence works were carried out in cell C.
One of the reasons why strong accretion was recorded in this period could be ascribed to both the numerous Bora events, which eroded sediments from the southernmost part of cell A and moved them towards the central part of cell C, and the combined erosive action of the storm surges and the longshore current. The Bora wind blows from the northeast, so the direction is similar to the longshore current, which may have increased the transport of sediments from cell A to cell C.
4.4. Period 1987–1996
The time interval 1987–1996 was characterised by a clear intensification of the accumulation processes, as both cells A and C were subjected to moderate or strong accretion (
Figure 3 and
Figure 4).
Cell A was characterised by strong accretion (maximum 5.89 m/year, transect A1, and 2.26 m/year, transects A7–A8 in
Figure 4) from San Nicolò to the Ex Ospedale al Mare and moderate accretion (maximum 1.92 m/year, transect A10, and 1.76 m/year, transects A9–A10 in
Figure 4) southward to the Murazzi (
Figure 3). Between 1987 and 1996, a considerable advancement of the shoreline along all the transects was observed. This trend could have been the result of an increase in sediment supply coming from the north, in accordance with the local coastal circulation also controlled by the defence structures present in the examined period. Indeed, the prevailing coastal current from the NE directly influences the northern part of the Venetian coastal stretch and, in an indirect complex way, the Lido littoral zone. South of the Lido inlet, a secondary current first approaches the shore with complex return vortices (as an effect of the extension of the jetties), then laps the beach in the median stretch of the coast, and finally, near Alberoni, is diverted again by the shallow waters due to the shore configuration and the presence of the northern jetty of the Malamocco inlet (see Figure 13c in [
79]). Sediments responsible for the shoreline progradation observed in cell A probably derived from the erosion of the seafloor within the inlet and in adjacent areas within the lagoon [
35,
36,
79]. Moderate accretion predominated in cell C from north to south (maximum 1.70 m/year, transects C1–C2, and minimum 0.76 m/year, transect C6 in
Figure 4). During this period, in cell C, a process of spontaneous re-naturalisation of the beach occurred as a consequence of the progressive dismantling of almost all the beach concessions and the organisation of the Alberoni Oasis, which was established later, in 1997. Therefore, from 1987 to 1996, a greater stabilisation of the dunes was observed. It could have influenced the mobilisation of sediments, producing a decrease in progradation compared to the previous period. No defence works were realised in cell C.
In cell B, following the construction of the 21 new groins built after the strong storm occurred in December 1979, no coastal modifications were observed. Consequently, the groins appeared to be ineffective.
The bathymetric surveys carried out in 1988 and 1992 attested to very modest negative variations of the near-shore coastal slope of the entire Lido littoral zone, lower than those measured in the previous periods (see Figure 10 in [
73]). It is also noteworthy that from 1987 to 1996 exceptional storm surges did not occur [
58,
77].
4.5. Period 1996–2006
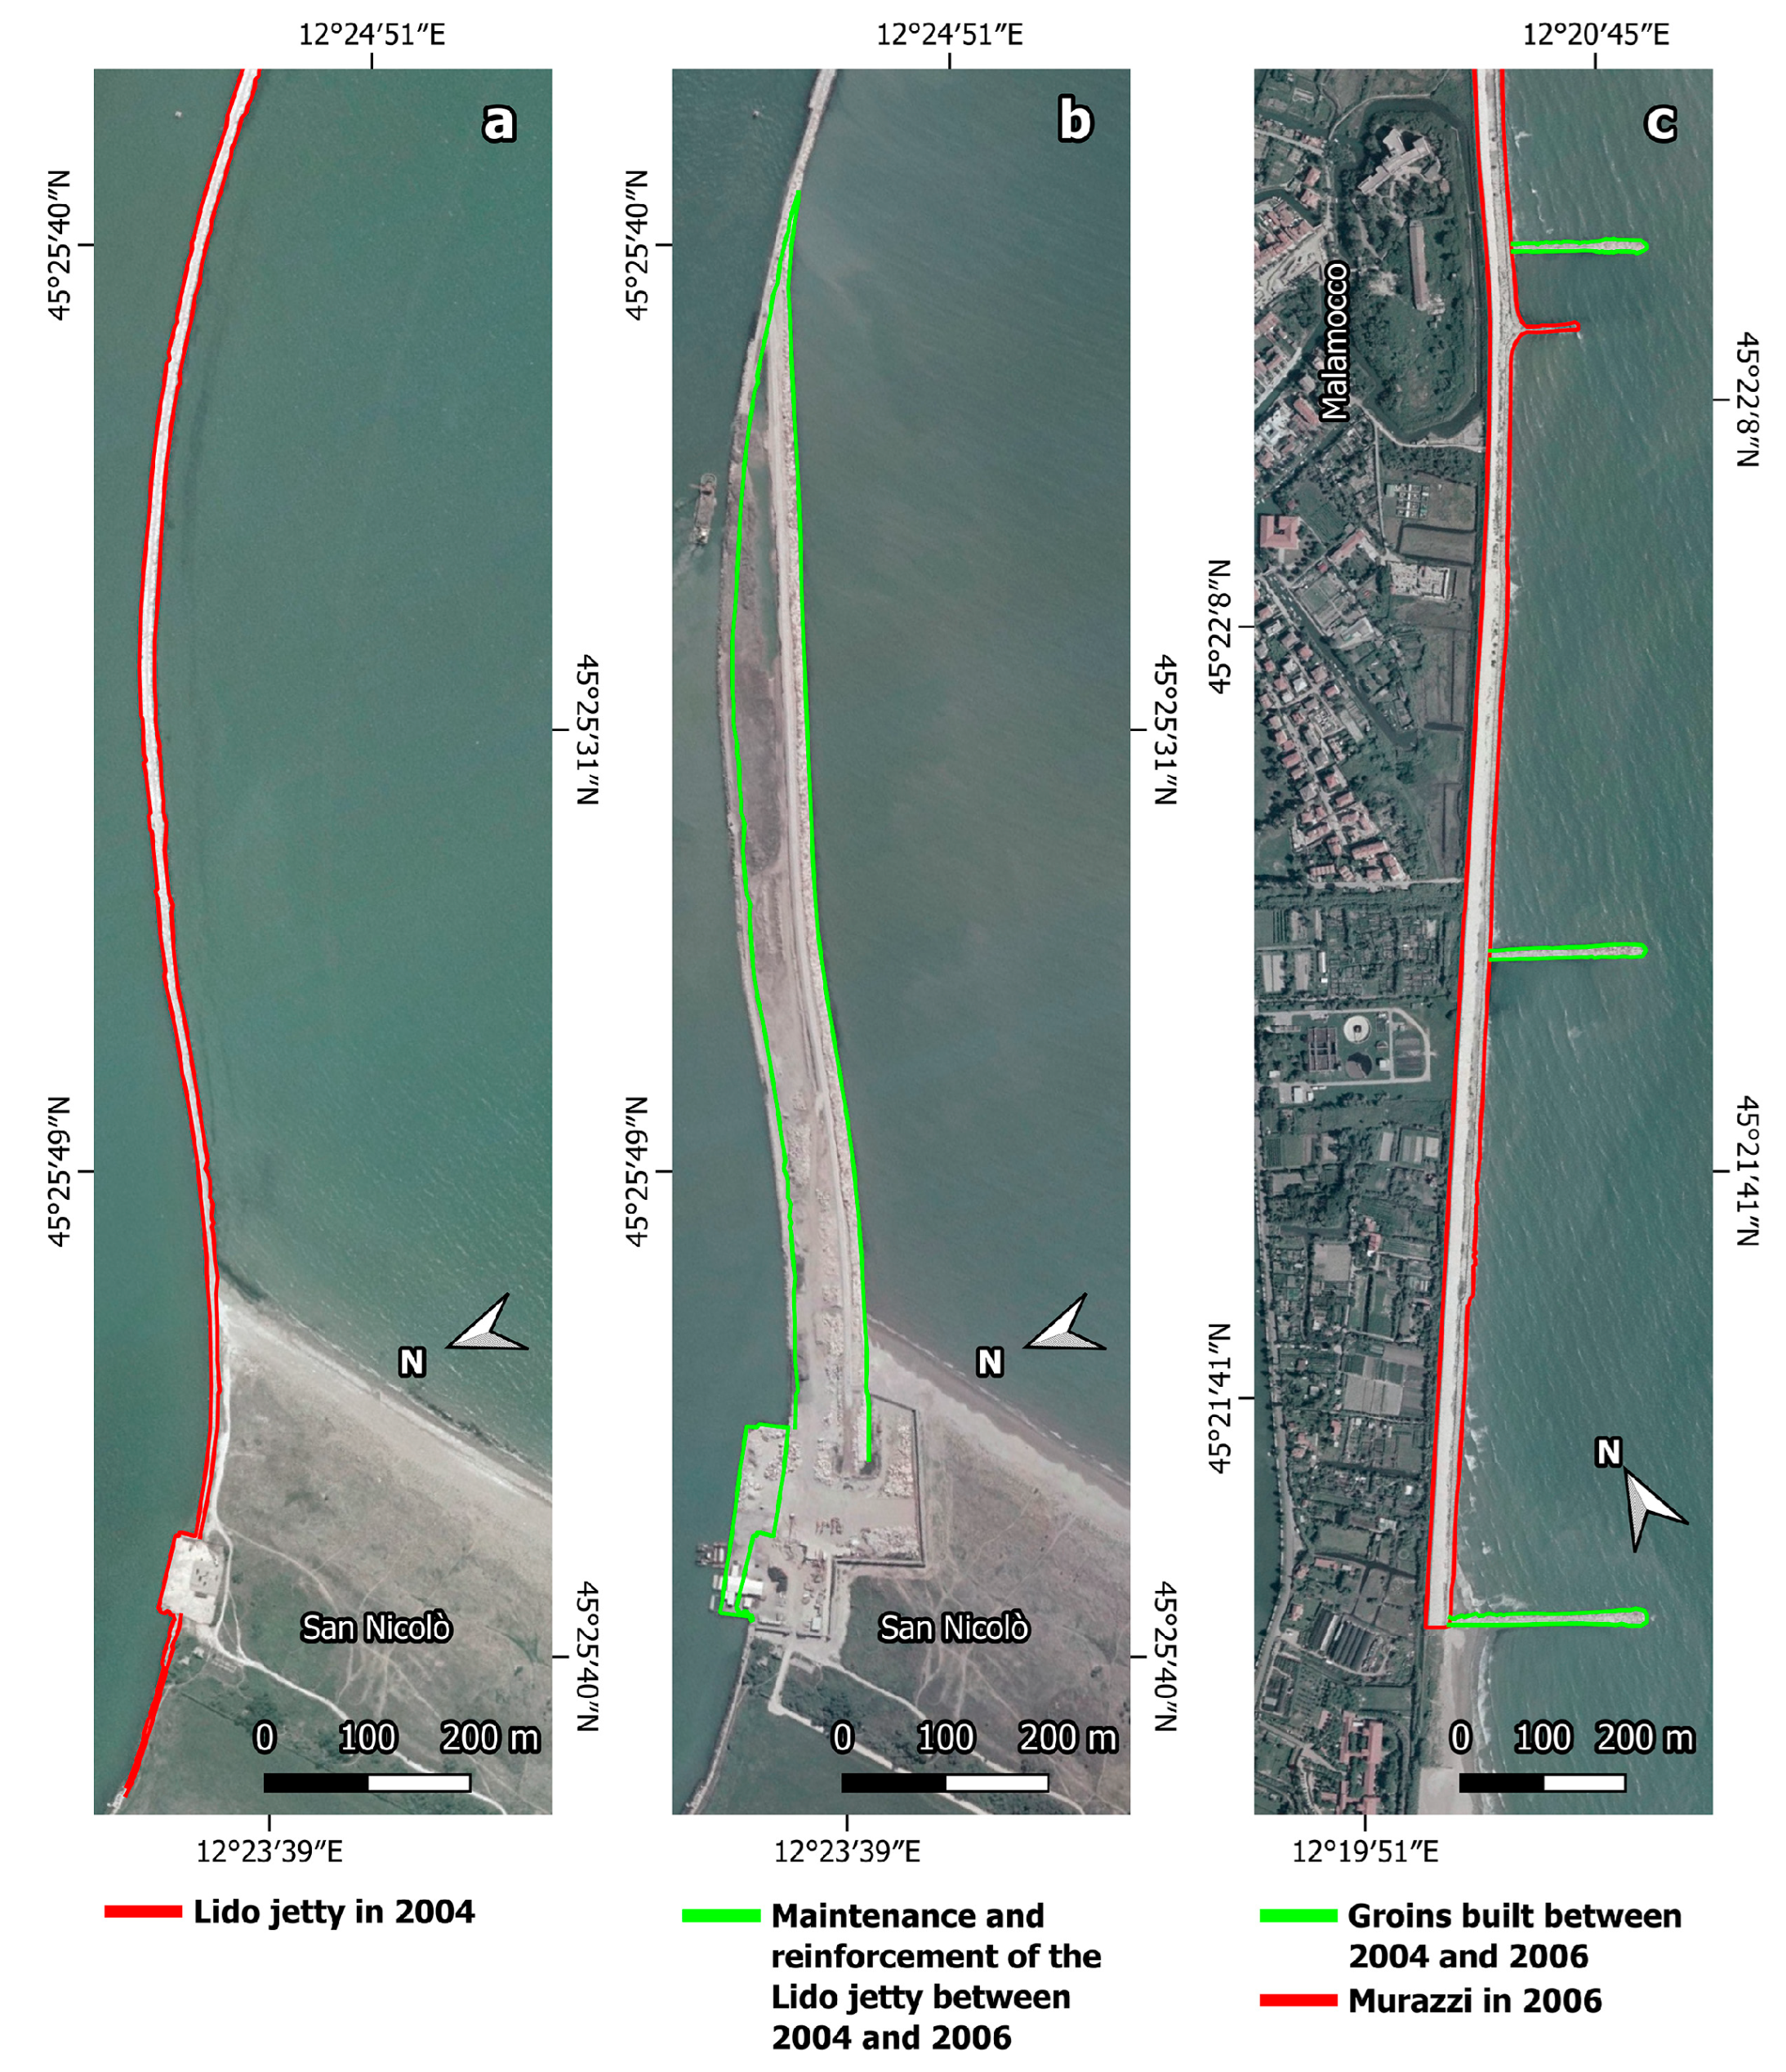
Before analysing the coastal evolution that occurred in this period, it should be pointed out that in 1997 the CVN carried out maintenance and reinforcement works at the jetties of Lido, while between 2004 and 2006 the southern jetty of Lido was considerably expanded and reinforced for a stretch of about 1 km starting from the beach, as a part of the realisation of the MoSE project (
Figure 7a) (
https://www.mosevenezia.eu/bocca-di-lido-2/, accessed on 15 March 2023). The construction site of the jetty occupied part of the dune surface and the beach of San Nicolò, leading to the destruction of important habitats (
Figure 7b). A dune system formed at the boundary near San Nicolò, on the beach that developed mainly after the construction of the dock at the Lido inlet. In this area, included in the “SCI IT3250023 - Lido di Venezia: Biotopi litoranei”, due to the presence of habitats and species whose conservation is a priority for the European Community (Directive 92/43 EEC), there are also back-dunes, wetlands, and arboreal vegetation (
https://www.comune.venezia.it/it/content/oasi-san-nicol, accessed on 15 March 2023). The works for the realisation of the MoSE system also required the excavation of large and deep ditches (30 m below the average sea level) housing the mobile bulkheads.
During the period of 1996–2006, the shoreline exhibited the most widespread erosion phenomenon (
Figure 3 and
Figure 4). However, within cell A, stability (maximum 0.51 m/year, transects A1–A2 and minimum −0.04 m/year, transect A1 in
Figure 4) was detected in the northern part of the San Nicolò area and in front of the Hotel des Bains, whereas moderate accretion (maximum 1.35 m/year, transects A4–A5, and minimum 0.66 m/year, transects A5–A6) occurred south of San Nicolò, up to the Hotel des Bains. Moderate erosion (maximum −1.31 m/year, transects A8–A9, and minimum −0.67 m/year, transect A10 in
Figure 4) was observed from the Hotel des Bains to the Murazzi (
Figure 3). The diggings and the other works carried out during the examined period have certainly contributed to reducing the amount of sediment available in cell A for the natural nourishment of the coast.
In cell B, between 2004 and 2006, 3 new groins were built, equidistant between Malamocco village and the southern end of the Murazzi (
Figure 7c).
Cell C displayed stability (maximum −0.34 m/year, transects C1–C2, and minimum 0.44 m/year, transect C1 in
Figure 4) in the northern part, close to the Murazzi, and moderate accretion (maximum 1.72 m/year, transect C6, and minimum 0.75 m/year, transects C2–C3 in
Figure 4) along the shoreline from the Murazzi to the jetty of Malamocco (
Figure 3). During this period, the coastal stretch included in cell C did not show significant evidence of changes.
In 2004, the Municipality of Venice prepared the “shoreline management plan of the Lido island”, approved by the Resolution of the City Council and directed to manage the maritime domain concessions for tourist uses and bathing facilities. The general objectives of the plan were: (i) the elimination of the existing factors of degradation and disturbance; (ii) the recovery of the potential of ecosystems in support of a favourable conservation status of habitats and species; (iii) the prevention of further actions having effects of disturbance and habitat degradation.
At a developing level, these objectives implied the withdrawal or partial relocation of the concessions that fell into sensitive areas, with the demolition of some permanent structures, and the definition of precise rules of governance for human actions on the coast (e.g., cleaning of beaches, use of removable paths, creation of restricted areas, etc.).
4.6. Period 2006–2019
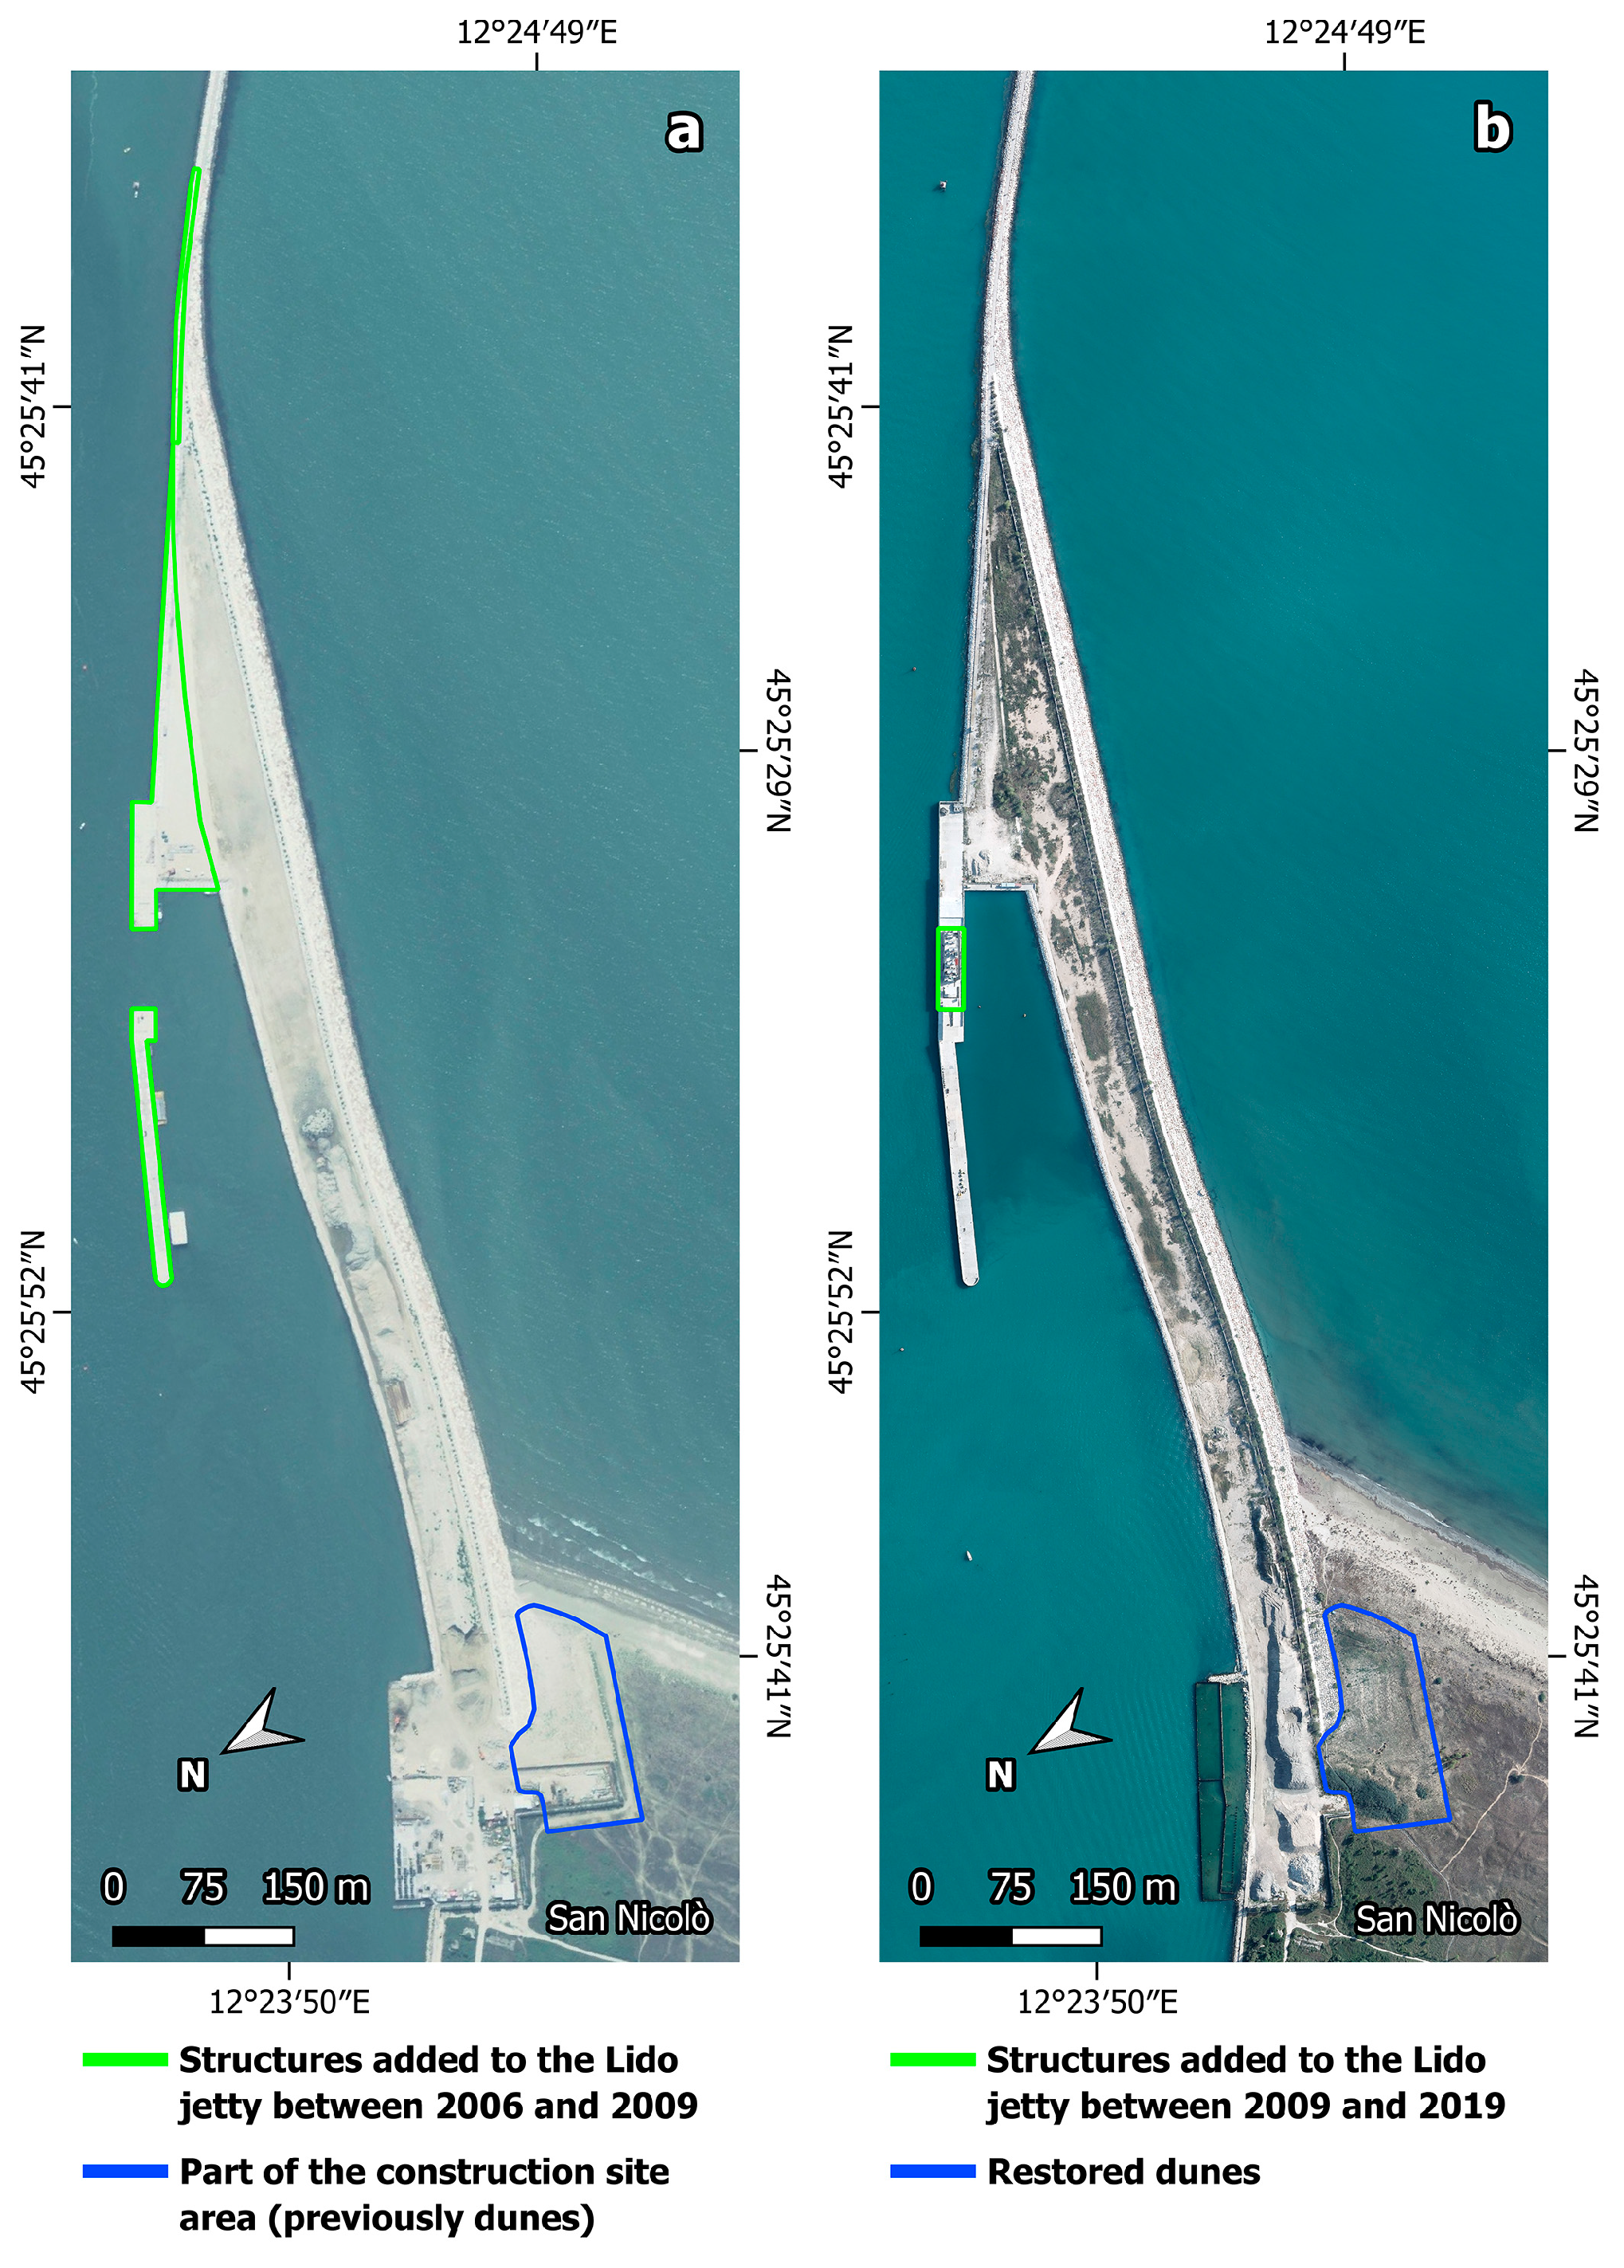
Between 2006 and 2019, the works at the jetty of Lido continued and the northern edge of the island was reinforced (
Figure 8). The period 2006–2019 was marked by the extension and strengthening of stability conditions in cell A and the occurrence of erosion phenomena in cell C (
Figure 3 and
Figure 4). In particular, cell A underwent strong accretion (2.79 m/year, transect A1 in
Figure 4) and moderate accretion (0.86 m/year, transects A1–A2 in
Figure 4) in the San Nicolò area; stability (0.09 m/year, transect A2–A3
Figure 4) and moderate accretion (maximum 1.32 m/year, transects A3–A4, and minimum 0.99 m/year, transects A4–A5 in
Figure 4) occurred southward to the Ex Ospedale al Mare.
From there to the Murazzi, stability (maximum 0.54 m/year, transects A5–A6, and minimum 0.10 m/year, transects A7–A8 in
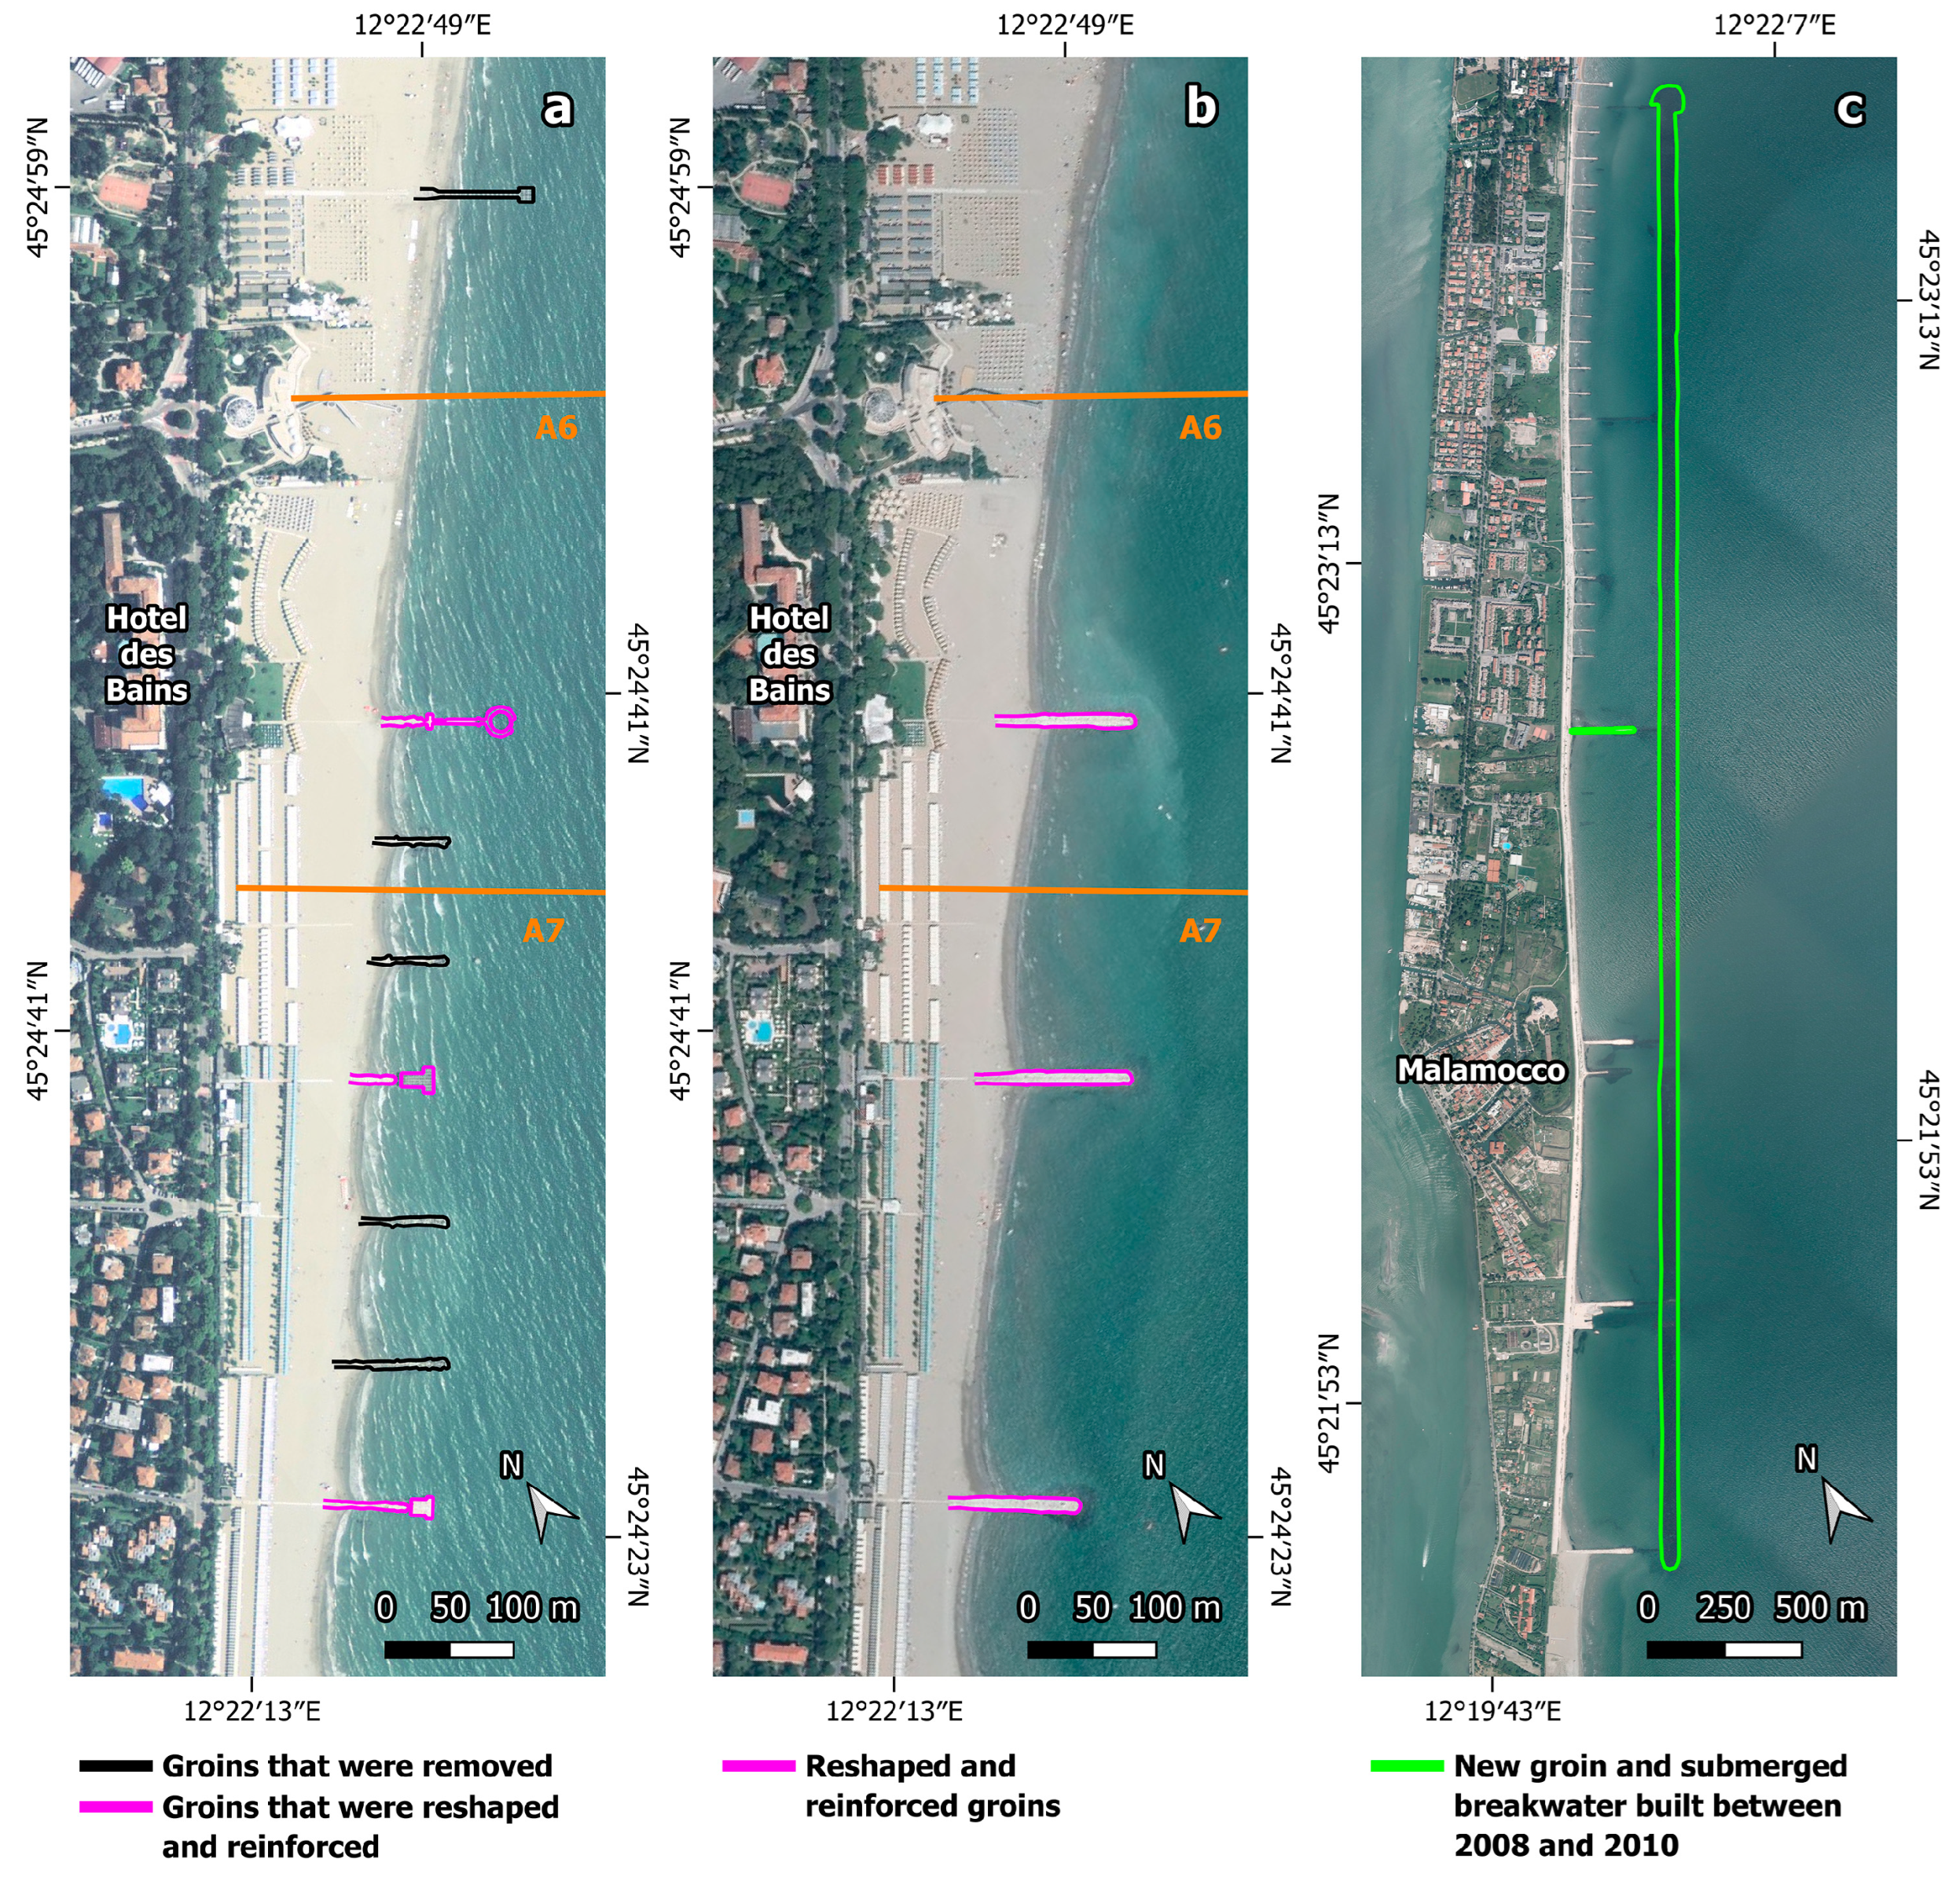
Figure 4) predominated. In the period 2008–2009, along the central and southern parts of cell A, 5 groins were removed and three were reshaped and reinforced (
Figure 9a,b). The latter contributed to stabilising the coastal stretch. During this period, the MoSE structures were almost completed. Within this coastal portion, significant topographic changes were observed. The construction of the lunate breakwater at the seaside of the Lido inlet (2010–2013) (
Figure 1a) led to the erosion of the ebb-tidal delta, as the breakwater was built on top of it [
39]. The breakwater determined a flow separation of the ebb tidal flux; consequently, at present, part of the flow deviates south of the inlet mouth, while the other part continues straight. Therefore, the solid inputs to the northern area of cell A increased.
During this period, we also observed an increase in the frequency of exceptional storm surges. In particular, the storm surges of December 2008 and October 2018 reached a water level of 156 cm, whereas, in November 2019, the water height reached 189 cm ([
58] and references therein). In the period 1978–1987, we also observed an increase in the frequency of exceptional storm surges that were all due to the Bora wind, while in the period 2006–2019, the three exceptional storm surges mentioned in
Table 3 were produced by the Scirocco wind. This different wind direction led to different sediment pathways along the Lido island (
Figure 2c,d).
As regards cell B, in 2007 a new groin and a submerged breakwater parallel to the Murazzi, at a distance of about 300 m from the seashore, were built (
Figure 9c). It is remarkable to highlight the changes that occurred in the last 13 years because of the construction of 21 new groins in the 1978–1987 period (
Figure 6b) and of the abovementioned submerged breakwater, which guaranteed uniform shoreline advancement and beach accretion. In particular, between 2008 and 2021 (
Figure 10), the coastline underwent a significant progradation and an evident deposition in the submerged beach close to the breakwater barrier. Recent studies have similarly highlighted the same results [
80].
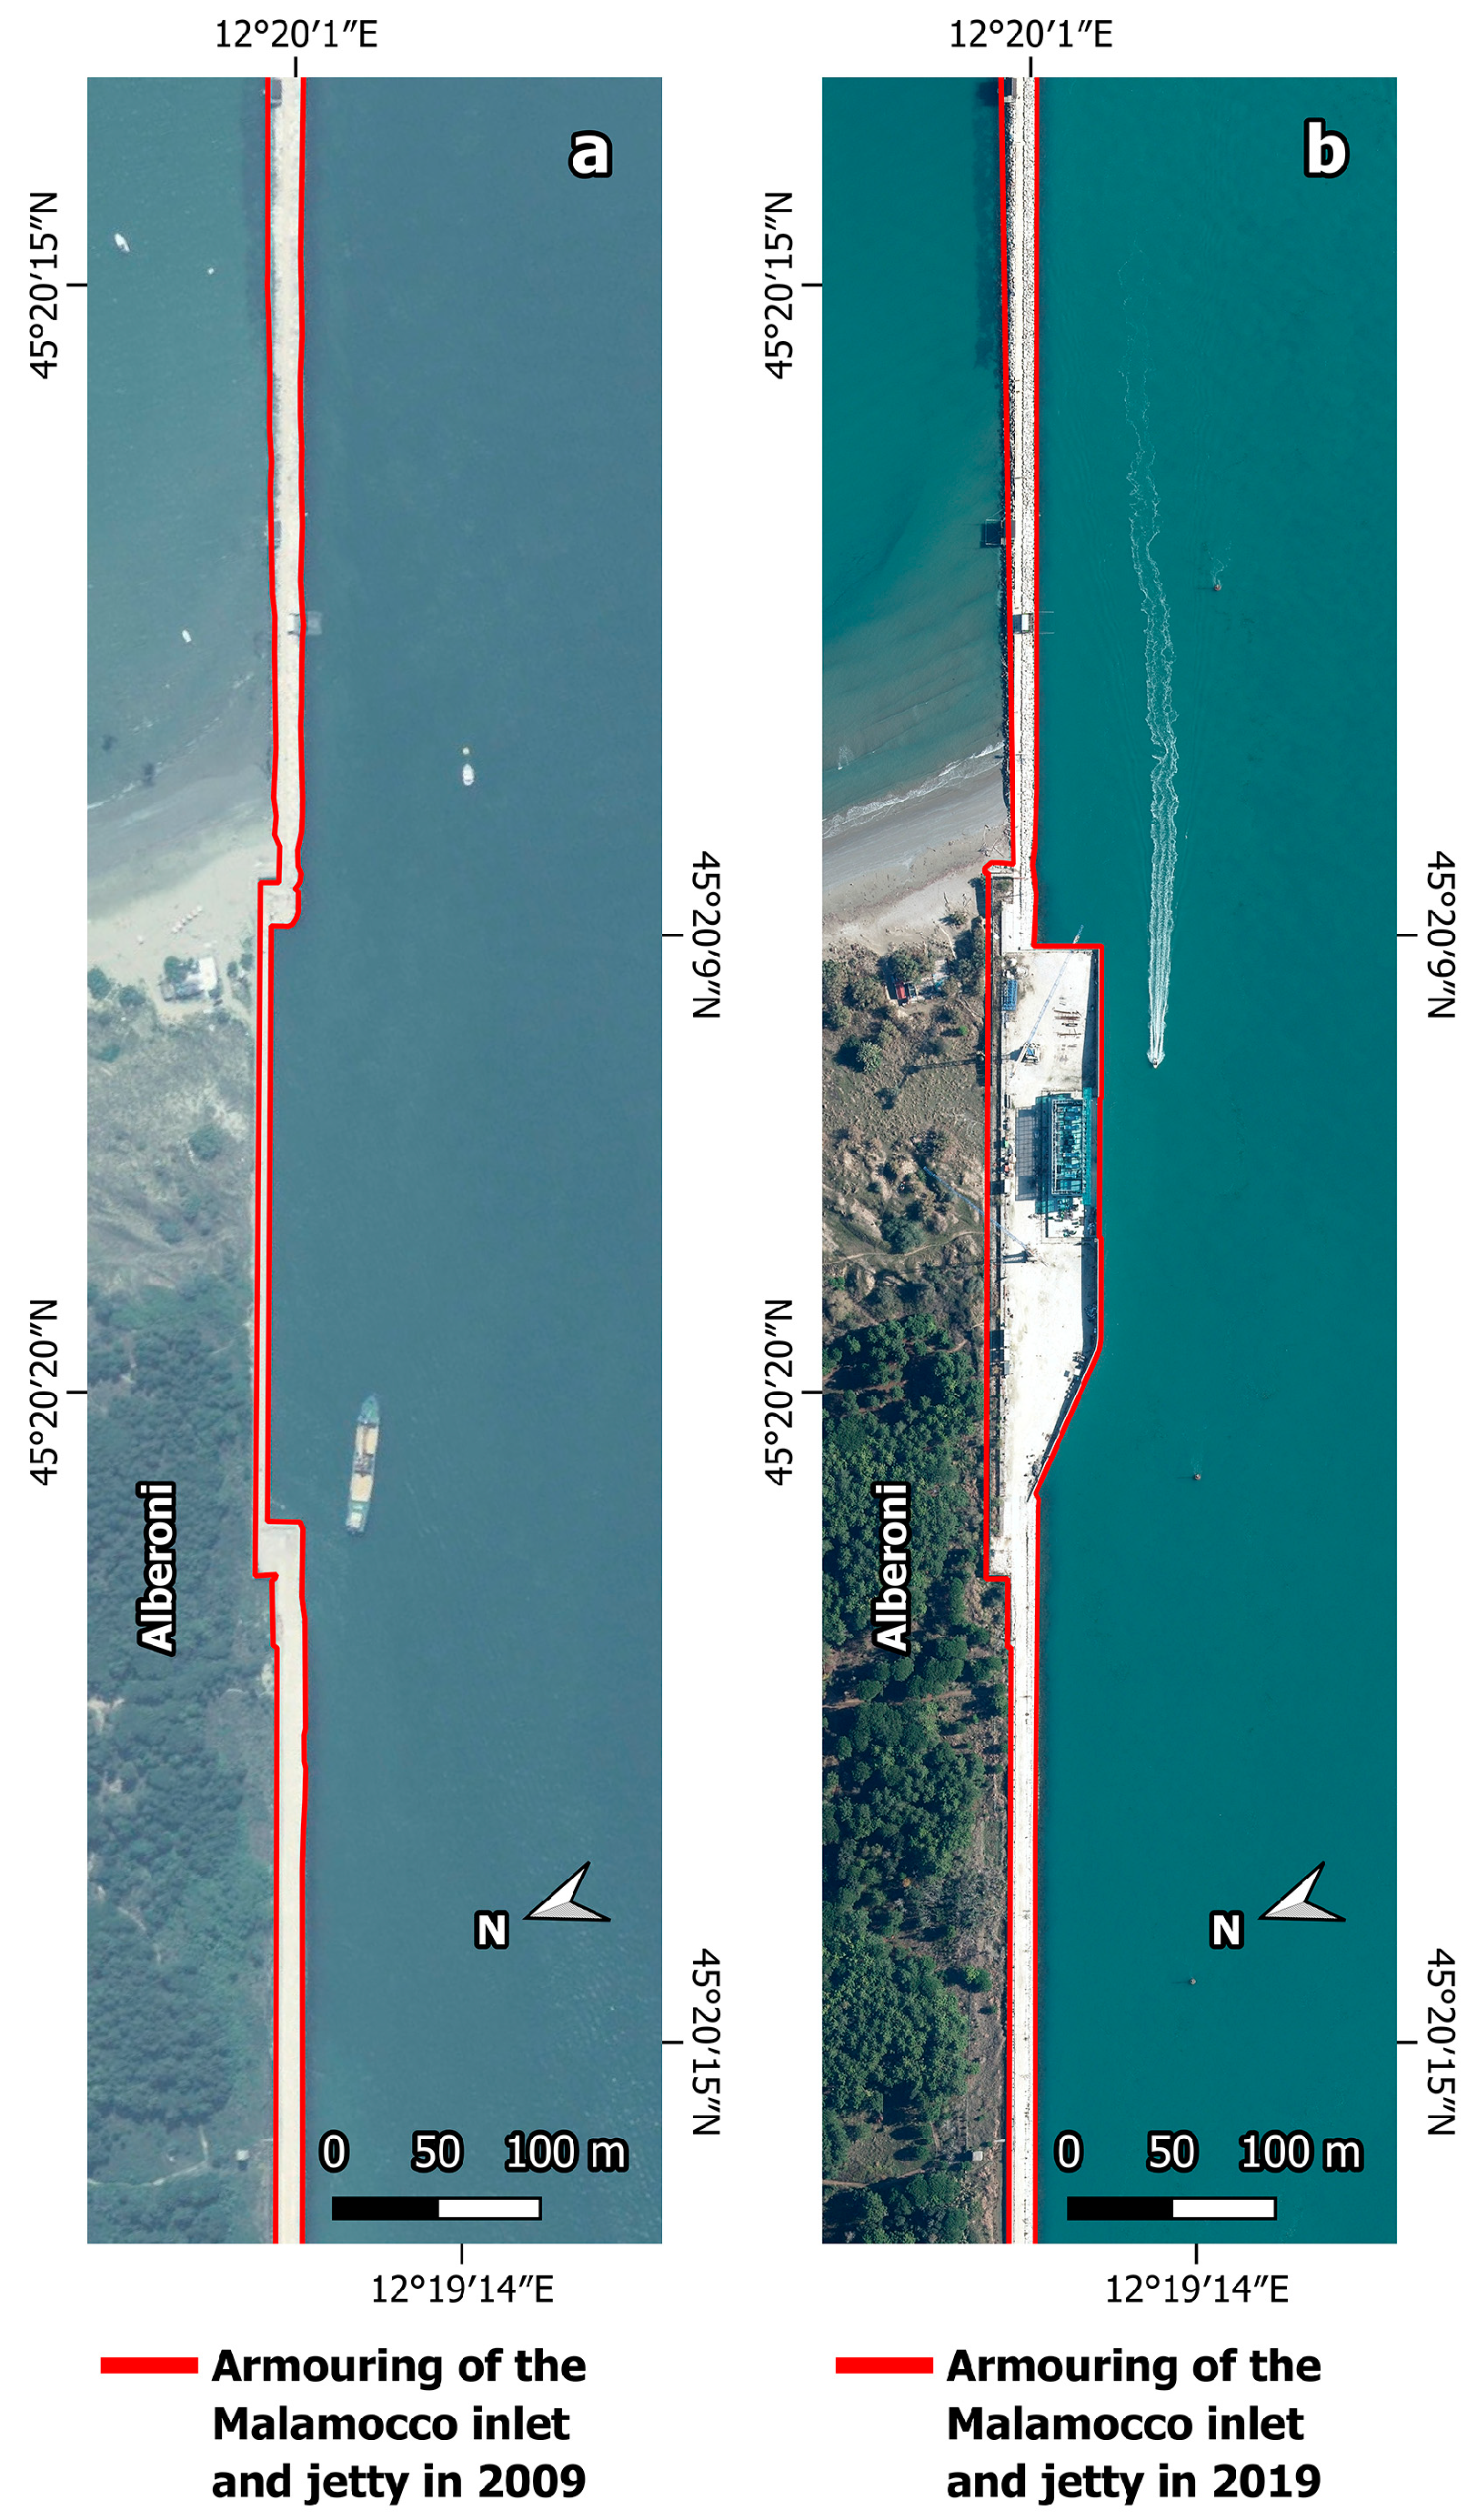
In cell C, the reinforcement of both the southern edge of the island and the jetty was carried out (
Figure 11a). Moreover, several preparatory works, functional for the construction of the MoSE structures at the Malamocco inlet, were realised (
Figure 11b). They could be partly the cause of the deterioration in the conditions of this coastal stretch and the change in the local sediment budget. A significant and very rapid increase in the shoreline was observed at the northern part, close to the
Murazzi (maximum 5.95 m/year, transect C1, and minimum 3.9 m/year, transects C1–C2, in
Figure 4), while the central portion showed consistent retreats of the shoreline (maximum −1.27 m/year, transects C4–C5, and minimum 0.61 m/year, transects C3–C4, in
Figure 4). In the southern sector, shoreline stability occurred, with 0.25 m/year of variation (transect C6). In cell C, the counterclockwise flow parallel to the littoral zone between the coast and the submerged breakwater built-in cell B may have increased sedimentation along the coast at the end of the Murazzi and favoured erosion further south. Previous experiments [
81,
82,
83] found that the same effects can be produced by the superimposition of the unidirectional longshore current and the flow over the submerged structure that forms under oblique wave incidence conditions. As a result, at the downdrift side of the breakwater, the two currents converged and the net longshore current was reinforced. The net result was accretion in the lee of the submerged structure and erosion on the downdrift section of the beach.
4.7. Period 1955–2019
The analysis of the changes in shoreline position that occurred from 1955 to 2019 shows that the study area was mainly exposed to accretion or stability processes (
Figure 3 and
Figure 4). The most significant shoreline progradation was observed in cell A, particularly close to the southern jetty of Lido. Indeed, during the considered 64-year period, the northern sector of the San Nicolò area was characterised by strong accretion with a maximum advance of 2.90 m/year (transect A1 in
Figure 4) and a minimum progradation of 2.21 m/year (transects A2–A3 in
Figure 4). Moderate accretion (maximum 1.96 m/year, transects A3–A4, and minimum 0.92 m/year, transects A5–A6 in
Figure 4) was observed from the Ex Ospedale al Mare to the Hotel des Bains, while the stability phenomenon (maximum 0.54 m/year, transects A6–A7, and minimum 0.21 m/year, transect A10 in
Figure 4) was recorded from the Hotel des Bains to the Murazzi area (
Figure 3). Cell C displayed moderate accretion (maximum 1.42 m/year, transect C6, and minimum 0.96 m/year, transects C4–C5 in
Figure 4) from the Murazzi to the jetty of Malamocco (
Figure 3).
4.8. Spatiotemporal Shoreline Change
The variations in shoreline position over a period of 64 years indicate that the whole coastal area of the Lido barrier was prevalently subjected to progradation. Those changes along the coast were controlled by both natural physical processes and human activities.
Figure 12 shows a linear decrease of the shoreline advancement measured along the transects, from A1 (185.7 m) to A10 (13.6 m). From transects A8–A9 (15.48 m) to transect A10 (13.6 m) substantially similar values were found (
Figure 12). The overall trend also displays a linear decrease from the north to the south, which was due to the presence of the Lido inlet that protected the northernmost part of the island, while leaving the central/southern part exposed to the violence of waves and currents. This process is shown in
Figure 2a. In cell C, shoreline evolution was characterised by an approximately parabolic trend, typical of partially isolated cells, with the maximum progradation measured along transects C6 (90.7 m) and C1 (88.4 m), and the minimum values measured along transects C3–C4 (62.07 m) and C4–C5 (61.51 m) (
Figure 12). Transects C5–C6 (71.6 m) differ from this trend showing a greater advancement. It is thought that the greater progradation detected between transects C5 and C6 may have been favoured by the greater quantity of sediments accumulated in that stretch of beach thanks to the presence of more mature and better-developed dunes, compared to those located in correspondence with transects C3–C4, which are more recent. The advancement of the coast near the C5–C6 transects was instead limited by the absence of dunes and by the periodic mechanical levelling of the beach at the Bagni Alberoni establishment.
Overall, the evolution of the coast in cell C was characterised by highly variable trends, as shown in
Figure 4. The reasons for these variations have been explained and justified in the previous paragraphs (see
Section 4). In the period 2006–2019, the construction of the new groin was the cause for the approximately parabolic evolutionary trend. Averaged over cells A and C (~7 km of sandy coast), the shoreline advanced by 78.54 m within 64 years, corresponding to an accretion rate of 1.23 m/year.
Finally, we considered the progradation of the shoreline at the northern and southern ends between 1886 and 1951 (see
Section 2). In that period, in the northern part of the island, close to the south jetty of Lido, an overall advance exceeding 450 m occurred, whereas close to the north jetty of Malamocco, the beach had an overall advance of 300 m. From 1955 to 2019, the shoreline maximum advancement measured at San Nicolò, south of the jetty of Lido, was 185.7 m, while, in the southern part, the maximum progradation (90.7 m) was measured at Alberoni, north of the jetty of Malamocco. If we compare the more recent rates of shoreline change with those from 1886 to 1955, we may highlight a substantial decrease in the growth of the two considered areas. This could be due to multiple factors but mainly to a decrease in sediment availability, subsidence (which has further increased the relative sea-level rise), increase in storm surges over time, and anthropogenic pressure.
According to the obtained results, this study offers local coastal managers a reliable tool for decision support that can assist them in evaluating coastal changes that should be taken into account when elaborating coastal management plans. Therefore, we suggest that a monitoring program for the shoreline evolution of the Lido barrier must be set up in order to complete the data and better manage the future evolution of the barrier.
5. Conclusions
The shoreline evolution and the environmental changes of the coastal strip along Venice Lido were investigated over a long-term period (1955–2019). The study showed that the shoreline changes along the sandy coast bordered by two large tidal inlets exhibited both spatial and temporal variability. These modifications were observed using aerial photographs and measured over five subsequent periods: 1955–1978, 1978–1987, 1987–1996, 1996–2006, and 2006–2019.
As a whole, the temporal variability of the shoreline position exhibited substantial accretion at most sites. In particular, the study showed that:
Over the considered 64-year period, a quasi-constant progradation occurred at the San Nicolò area (cell A), where an average accretion rate of 2.8 m/year was computed. This area is a relatively natural sector, which is essentially constrained by a jetty at the northern end. Moreover, the presence of groins and jetties interrupts the natural southward coastal drift. Recently, this sector has shown overall relatively stable conditions and slight accretion due to the conclusion of the construction of the MoSE structures. A similar process was also observed at the Alberoni Oasis (cell C), where an average accretion rate of 1.3 m/year was measured. The area was re-naturalised with a dune system and pine forest close to the jetty of Malamocco.
A two-step evolution corresponding to two different behaviours was identified: (a) within cell A, progradation occurred in the shoreline from 1955 to 1996 at a mean rate of 2.0 m/year, before showing a process of moderate erosion (−0.89 m/year) in the period 1996–2006, followed by stability and moderate accretion from 2006 onwards; (b) within cell C, in the southern sector of the Lido barrier, a fast accretion occurred from 1955 to 1996 (1.5 m/year), reversing into stability and moderate erosion (−0.91 m/year) from 1996 to the present.
This study also showed that the Lido barrier experienced moderate erosion in the period 1978–1987 due to several storm surges; in particular, two major events took place, i.e., in December 1979 and February 1986. Moreover, between 2006 and 2019, an increase in the frequency of exceptional storm surges was observed, with three major events in December 2008, October 2018, and November 2019. In the periods 1996–2006 and 2006–2019, moderate erosion also occurred in cells A and C, respectively, due to the realisation of the MoSE system. In particular, from 1996 to 2006, the excavation of large and deep ditches at the Lido inlet significantly contributed to reducing the amount of sediment available in cell A, causing a shoreline retreat on its southern side, whereas between 2006 and 2019, the reinforcement of the southern edge of the island and several other works for the realisation of the MoSE system at the Malamocco inlet could have been responsible for a deterioration in the conditions of cell C as they induced changes of the sediment budget in the area.
Concerning cell B, it is significant to underline the modifications that occurred from 2008 to 2021, related to the construction of several groins and a submerged breakwater, which guaranteed coast advancement and deposition in the submerged beach.
The results obtained for the 64-year period indicate a predominance of the accumulation process over stability and erosion, proving that, in the long term, the progradation occurred in the examined coastline despite the occurrence of severe storms and anthropogenic interventions, which had a significant impact on the magnitude of changes (accretion/erosion phenomena).
This study represents the first attempt to quantify the evolution of the Venice Lido coastal area in a long-term reference period. As such, it can be the starting point to forecast future shoreline trends, also considering climate change (e.g., sea-level rise and storm surge events), and can support the local policymakers and local/regional stakeholders to properly define management strategies and plans in a long-term scenario, i.e., to assess areas at high risk of flooding and to evaluate the efficiency of coastal armouring and natural protected coastal sectors.
Based on obtained results, we suggest that a monitoring program for the shoreline evolution of the Lido barrier must be set up in order to better manage the future evolution of the barrier.


