1. Introduction
In recent years, site pollution has become a worldwide environmental problem [
1,
2]. Site pollution not only leads to the deterioration of soil and water, but also seriously threatens the aquatic environment and human health. In the 1990s, developed countries began to take measures to control the pollution of groundwater, trying to curb the trend of groundwater pollution [
3]. In China, with the “National Plan for Prevention and Control of Ground Water Pollution (2011–2020)” and “Action Plan For Soil Pollution Control” issued in 2016, the pollution site system governance, risk management and control have been launched in succession. Process barriers are among the most important means of risk management and control of contaminated sites [
4]. The vertical flexible barrier (VFB) has good anti-aging performance, anti-seepage, and acid and alkali salt resistance [
5], and can effectively achieve the long-term and “zero” barrier of site target pollutants [
4]. However, VFBs are usually damaged in an actual project because of the poor quality of the membrane itself, improper construction, and other reasons that will greatly reduce the walls’ pollution barrier effect. This increases the necessity of detecting and evaluating the VFB’s integrity for early detection and repair of leakage points.
Commonly used methods for VFB integrity detection include geophysical and sampling analysis methods. Geophysical methods are nondestructive and fast, but can only observe abnormal electrical characteristics of environmental media [
6,
7]. It is still necessary to collect direct samples and test to determine whether leakage occurred through the vertical wall. The traditional sampling detection method is a passive detection method that depends on the natural hydraulic gradient for diffusion of the target pollutant. Because groundwater flow is slow, it takes a long time from the occurrence of leakage to the detection of leakage. This passive detection method not only is time-consuming and laborious, but also does not provide early pollution warning. An active sampling and monitoring method is based on hydraulic regulation, which includes setting up pumping wells to form a larger hydraulic gradient, accelerating the migration of groundwater and solute, speeding up the penetration process, shortening the leakage detection cycle, and improving the response speed [
8,
9,
10]. Detection speed is accelerated and background interference is reduced using an artificial fluorescent tracer instead of characteristic pollutants as the target detection object. The detection operation is simple and fast because of the low detection limit of fluorescent tracers, which can further shorten the detection cycle [
11]. In theory, the combination of a pumping experiment based on hydraulic control and a fluorescent tracer can effectively detect the damage of vertical pollution barrier curtain. However, the literature shows that the detection of vertical pollution barrier curtains based on the combination of the two methods has not been reported. Feasibility of the method and the influencing factors have not been systematically studied.
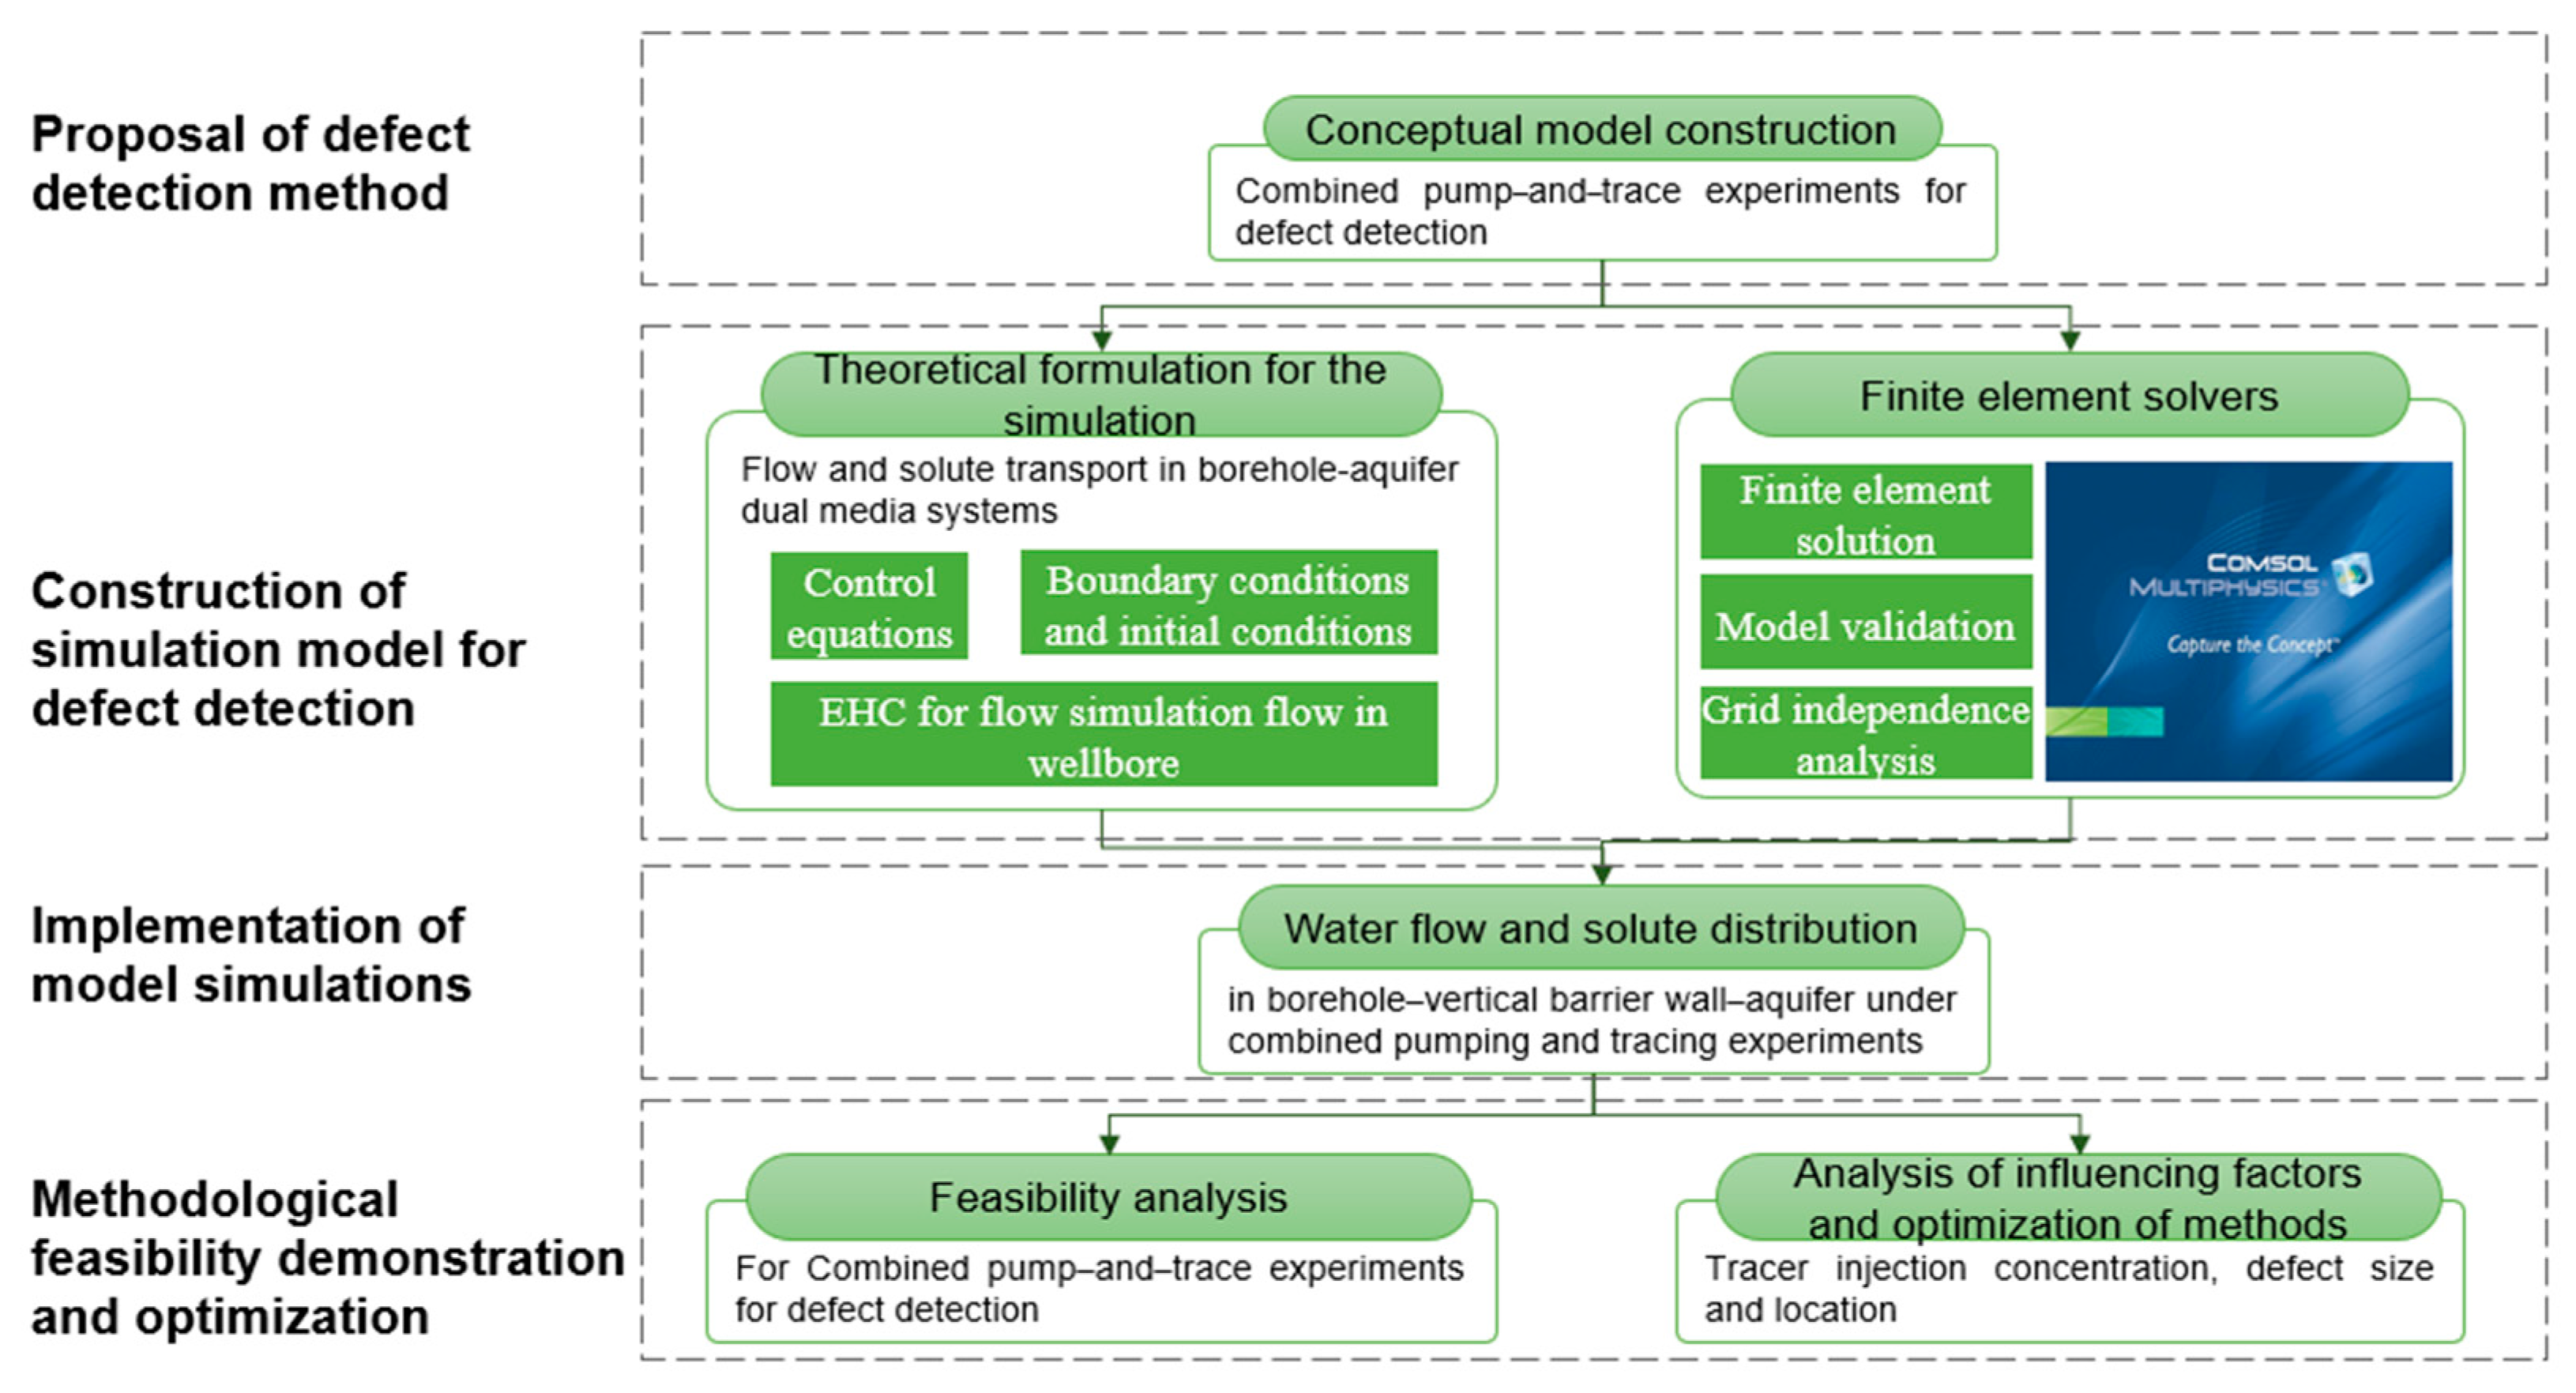
Therefore, this study intends to carry out targeted research to demonstrate the feasibility of the combined pumping tracer experiment to assess the integrity detection of vertical pollution barrier curtains. Firstly, the conceptual model of combined detection of pumping and tracing is constructed under the condition of a vertical seepage control curtain. Based on the conceptual model, the COMSOL multi-physical field is used as a simulation platform to simulate the water flow and tracer transport processes. Secondly, the Equivalent Hydraulic Conductivity (EHC) method is introduced to describe the influence of pumping wells and monitoring wells on the distribution of flow field and solute field in the process of small-scale seepage simulation [
12]. The process of tracer migration induced by artificial hydraulics is simulated under the typical vertical seepage control curtain. The penetration process and law are analyzed, the feasibility is demonstrated, and the main influencing factors and mechanism of detection sensitivity are discussed, which provides guidance and reference for the engineering application of this method as shown in
Figure 1.
2. Model and Method
2.1. Typical Scenario Construction
The polluted area is divided by the flexible vertical cutoff wall in the horizontal direction. In the vertical direction, the flexible vertical cutoff wall is connected with the first stable and continuous natural impermeable layer, thus forming a three-dimensional barrier [
13]. When the vertical cutoff wall is in good condition, the target pollutant is blocked by the vertical impervious membrane. Conversely, when the cutoff wall is damaged, the target pollutant will penetrate to the other side of the cutoff wall through the damaged section. If a groundwater monitoring well is present, the samples can be collected from the monitoring well to analyze the pollutants in the samples and evaluate the integrity of the anti-seepage curtain.
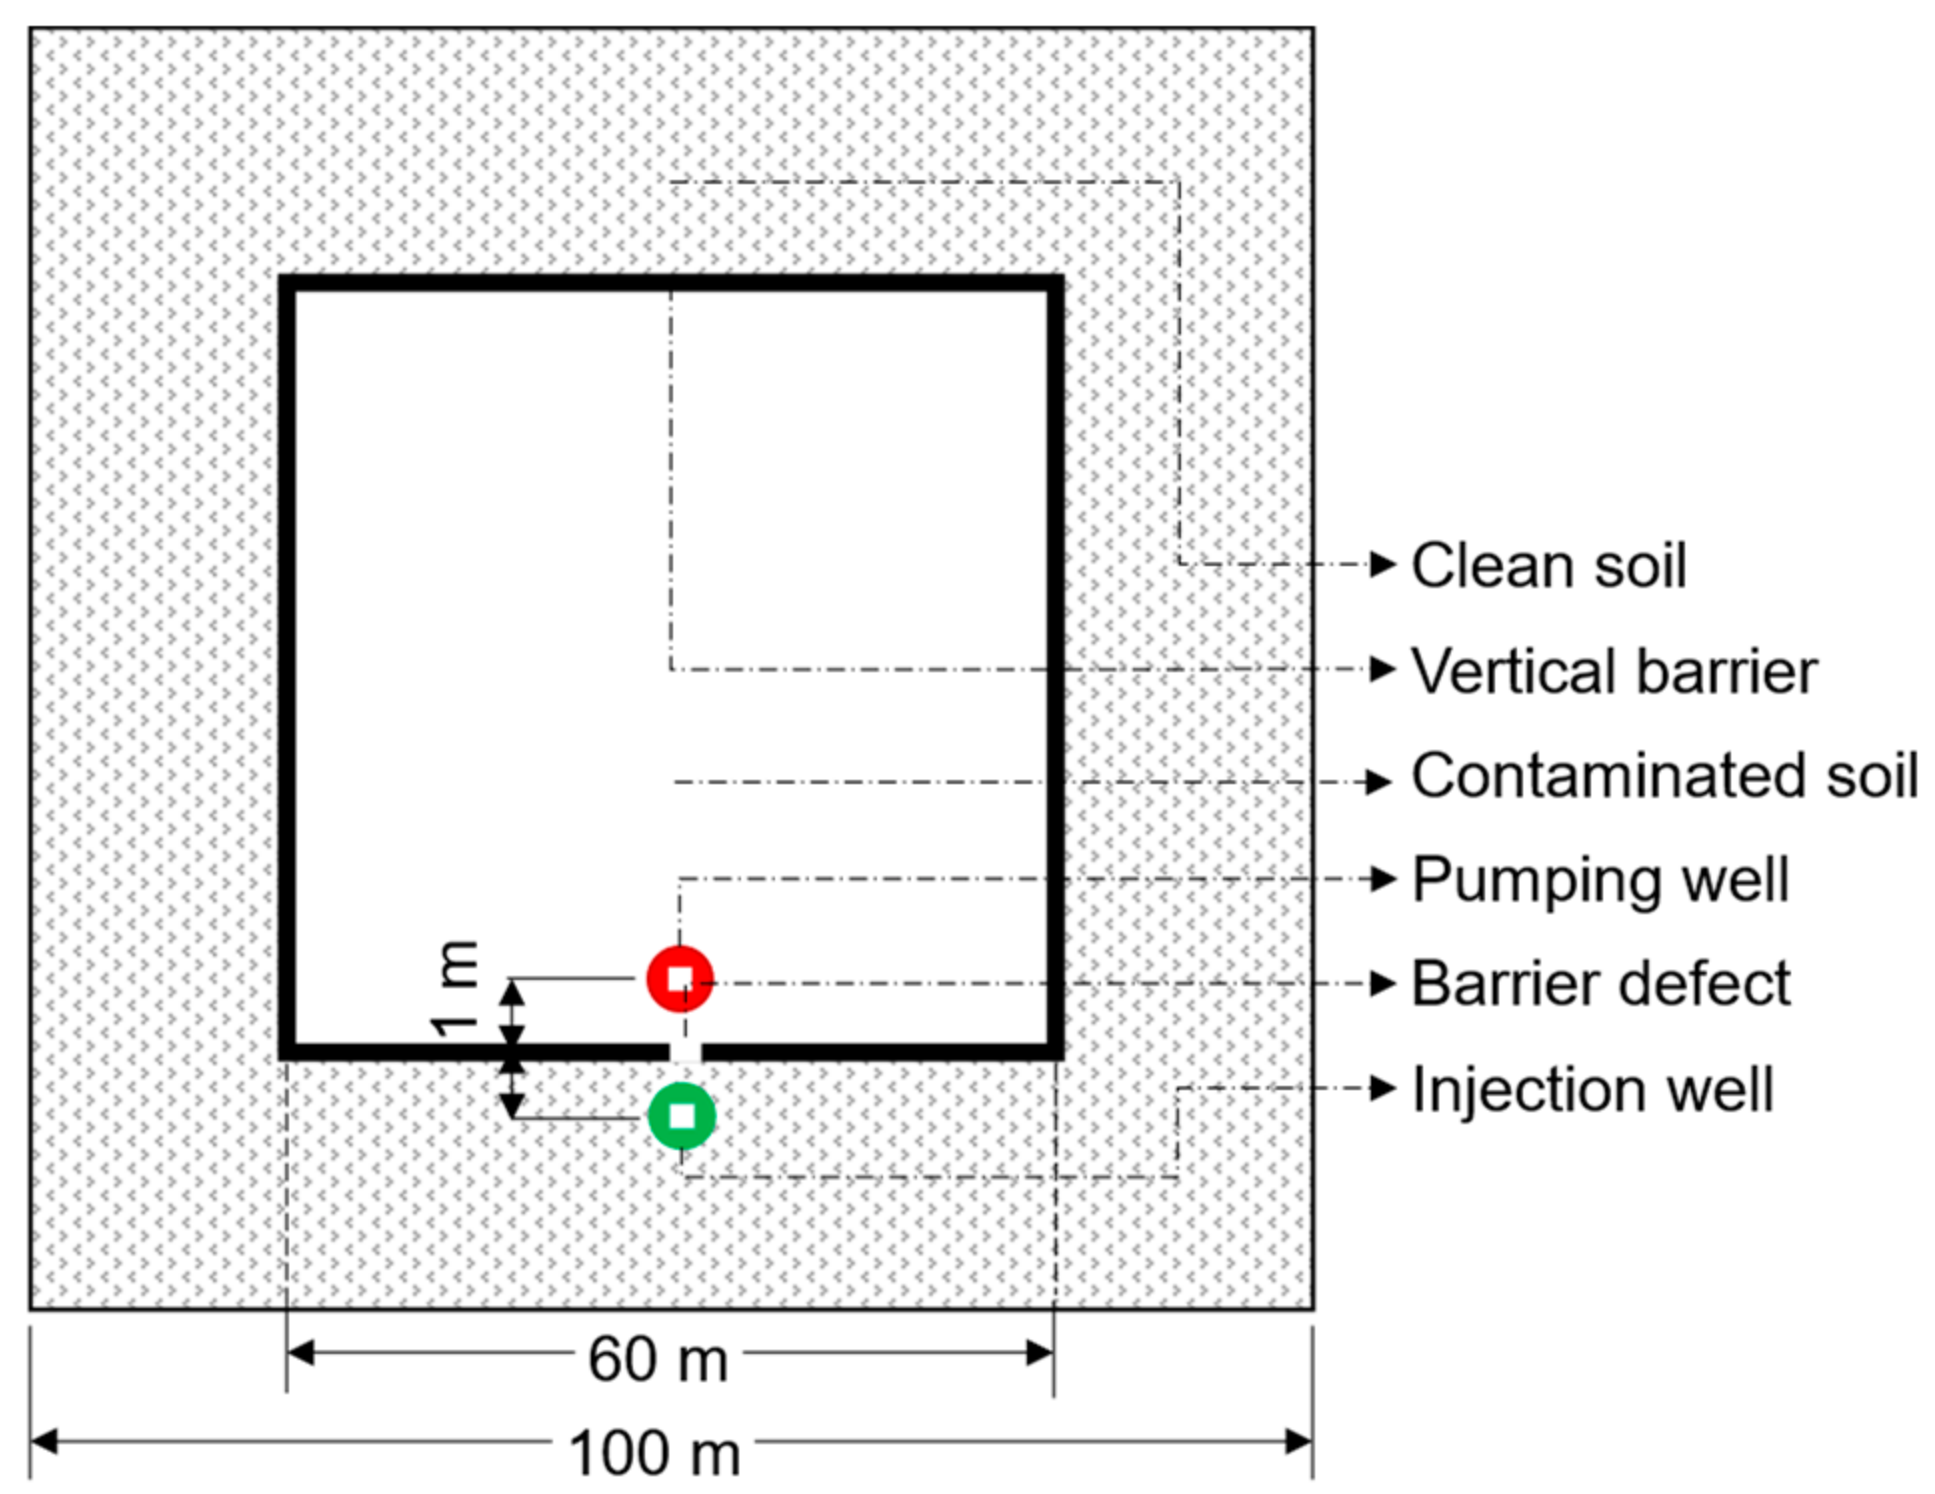
In the natural state, the hydraulic gradient on both sides of the cutoff wall is small, and it takes a long time for the target pollutants to penetrate from the inside to the outside of the curtain. The penetration process of the target pollutants can be accelerated and the detection cycle can be shortened by pumping water from the monitoring well outside the curtain, which creates a large head difference between the inside and outside of the curtain. Because the detection limit of conventional pollutants is high and analysis is time consuming, an unconventional fluorescent tracer is used. Additionally, because other pollution sources may be present outside the site and interfere with concentrations of pollutants originating from the site, a fluorescent tracer is advantageous because it will only originate from the designated injection location. So, an on-site injection well is arranged in a symmetrical position to that of the off-site monitoring well, and a fluorescent tracer such as sodium fluorescein is injected at a constant flow and concentration. If sodium fluorescein is detected in the off-site monitoring well, it indicates that there is damage to the vertical cutoff wall. In addition, the size and location of the leak can be qualitatively determined by modeling the arrival time and concentration of the tracer front. In this way, under the condition that the vertical pollution barrier curtain is damaged, the pumping tracing process is generalized as shown in
Figure 2. Actual operation and the simulation process use the same method of injecting tracer from the outside and pumping from the inside to avoid the pollutants in the vertical anti-seepage membrane from diffusing to the outside through the defects during the pumping process of the outside monitoring well.
2.2. Simulation of Pumping and Tracer Penetration Process
Migration of the tracer from injection well to inner pumping well through vertical pollution barrier curtain is via convection diffusion. Water flow and tracer transport in the injection well and pumping well are equivalent to that of pipeline flow. We use the equivalent EHC method proposed by Chen et al. [
14,
15] to solve the boundary coupling problem of different flow fields (porous media seepage and pipeline flow). Based on the energy loss equation of pipe flow, the water flow equation in the well pipe is changed to the form of Darcy’s Law, to unify the water flow in the wellbore aquifer into a control equation.
2.2.1. Expression of Equivalent Conductivity Coefficient in Well Pipe
Based on the basic principle of EHC method, the equivalent conductivity coefficient
KL table is used for the inner layer flow state of well pipe [
14] (including injection well and pumping well):
where
is the equivalent conductivity coefficient of well pipe flow when the water flow is laminar flow, m/d;
is the tube diameter, m/d; and
is the fluid weight, N/m
3.
is the dynamic viscosity, (N s)/m
3.
When the flow in the pipe flow is turbulent, the equivalent conductivity coefficient is
KN, and the expression is as follows:
where
is the equivalent conductivity coefficient of pipe flow when the flow is turbulent, m/d;
g is the gravitational acceleration, m/d
2;
is the fluid motion viscosity, m
2/s; and
is the coefficient of friction, dimensionless.
2.2.2. Water Flow Control Equation in Wellbore Pore Media System
The flow movement of the borehole aquifer system can be coupled into an equation, with the basic differential equation of the unsteady movement of confined water [
14]:
where
W is the source and sink terms,
d−1;
Ss is the specific elastic water storage coefficient
m−1;
KE is the equivalent conductivity coefficient, m/d; and
K is the permeability coefficient of aquifer, m/d.
and
have been defined above.
2.2.3. Solute Field
If the solute transport in the aquifer system obeys Fick transport, the convection dispersion equation can be expressed as follows [
16]:
where
Dxx,
Dyy, and
Dzz are hydrodynamic dispersion coefficients in
x,
y, and
z directions respectively, m
2/d;
vx,
vy, and
vz are the actual velocity of groundwater, m/d.
For solute transport in the wellbore, the radial molecular diffusion can be ignored because the diameter of the well is very small compared with the length, and the axial velocity in the well tube is much larger than the radial velocity. Therefore, without considering the solute reaction, the one-dimensional transport equation of solute in the pipe section can be obtained as follows:
where
c is the solute concentration at time
t at borehole depth
z (g/L) and
vz is the vertical flow velocity in the well pipe (m/d).
2.2.4. Boundary Conditions and Initial Conditions
The initial hydraulic conditions of the model are as follows: the groundwater level of the first phreatic layer is 1 m below the surface, the second impermeable layer is the same as the first layer, and the total head of the third layer of confined water is 2 m above the ground. The external hydraulic boundary condition matches the initial condition, with a water head of −1 m; the external boundary water head of the third layer is 2 m. The inner boundary of the vertical cutoff wall is an impermeable boundary condition, and the second and third layers are also set as impermeable boundary conditions to simulate the impermeable effect between the confined water and the water resisting layer. The leakage point is a permeable layer. The permeable boundary is 2–17 m below ground of the pumping well and the water injection well, and the impermeable boundary is 0–2 m and 17–20 m below ground. The whole bottom of the model is represented as an impermeable boundary.
The upper boundary of the pumping well is the outlet boundary, and the pumping flow rate is 100 L/h. The upper boundary of the water injection well is the entrance boundary, and the injection flow is 1/100 (1 L/h) of the pumping flow rate, to minimize the interference of tracer injection on the regional flow field; the injection time is the third to fifth day. The concentration of tracer injected into the inlet is 1000 mg/L and the background concentration of tracer in groundwater is 0.01 mg/L.
2.3. Geometric Model and Mesh Generation
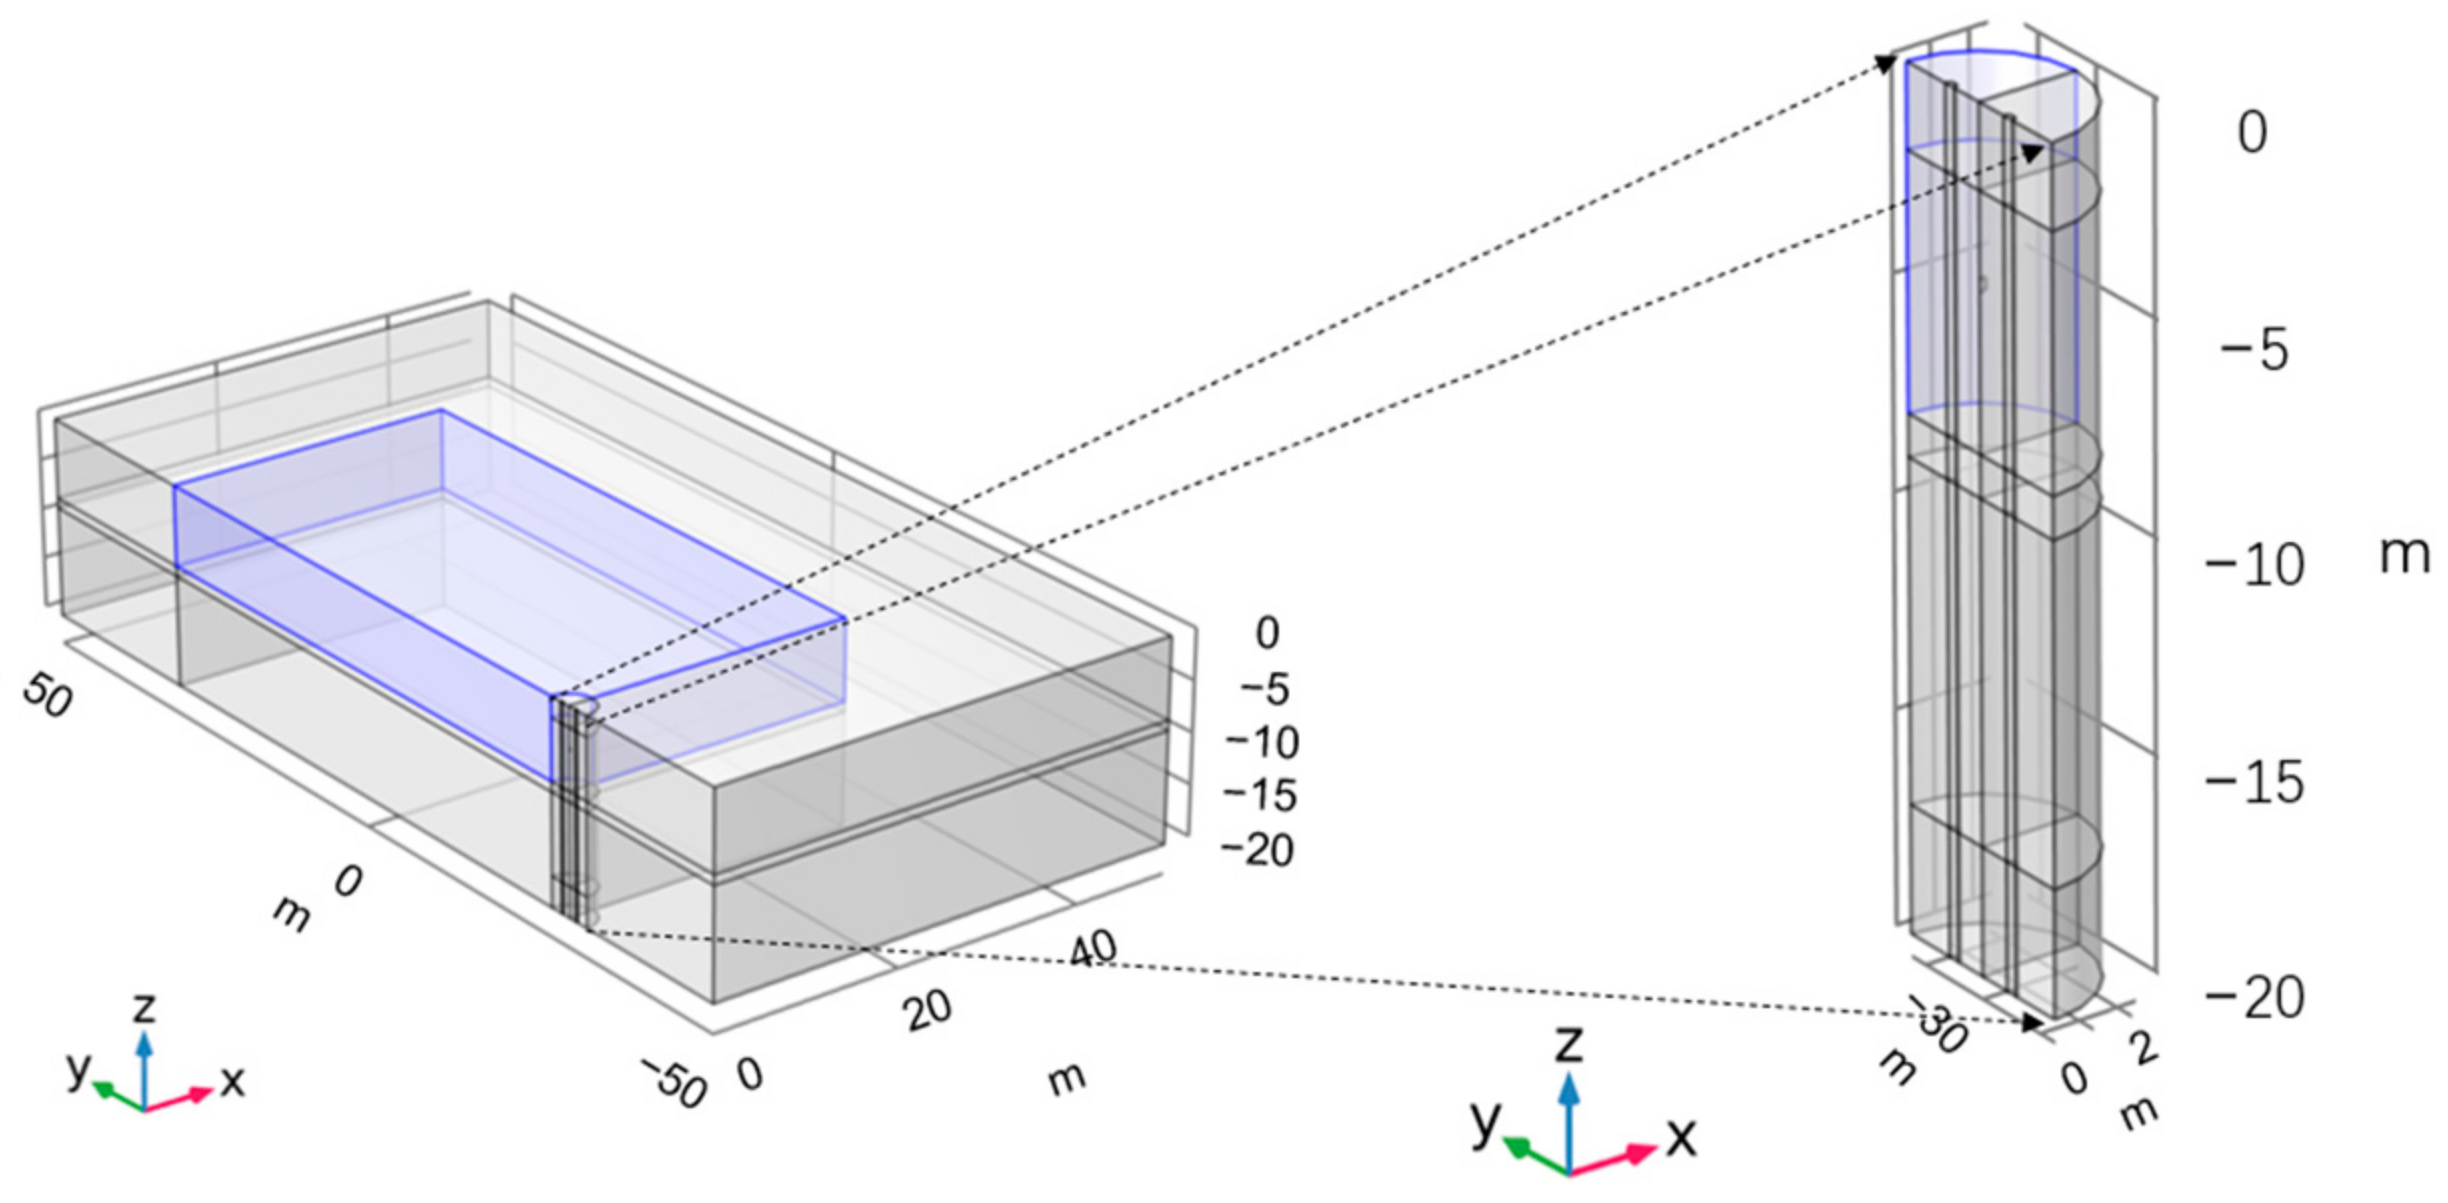
A vertical impervious membrane divides the whole model aquifer into an inner and an outer aquifer. The general dimensions of the (actual Yancheng pollution site) internal pollution area are 60 m × 60 m, and the external pollution area is 100 m × 100 m. The outer boundary of the outer region is set as an infinite boundary to reduce the influence of the boundary on the simulation process. The pumping well and monitoring well have diameters of 0.3 m and are located on opposite sides of the vertical anti-seepage membrane, 1 m away from the membrane. The leakage point is located at the vertical impermeable membrane position of the central line between the pumping well and the tracer injection well, and it is 0.3 m long. The monitoring well and tracer injection well run through the whole aquifer, but the upper 0–2 m and the bottom 17–20 m well walls are impermeable, and the middle well walls are permeable. The internal and external aquifers are divided into three layers from top to bottom, the first layer is 0–8 m, the second layer is 8–9 m (water resisting layer), and the third layer is 9–20 m. The vertical membrane runs through the whole aquifer, with a depth of 20 m. The damage position of the vertical impermeable membrane is 0.3 m high and 4 m (4.0–4.3) below the surface. Half of the whole model, which is symmetric, is used for simulation to reduce computation time. The model is shown in
Figure 3, which is a partially enlarged drawing of the well edge.
Based on the COMSOL multi-physical field simulation platform, the control equations and boundary conditions are solved using the finite element method. COMSOL is a multi-physics simulation software that integrates the above-mentioned controlling Equations (3)–(6) for water flow and solute transport. Therefore, after setting the corresponding boundary conditions and intrinsic relationships defined by Equations (1) and (2), the water flow and solute distribution can be solved.
To verify the grid independence, the model was solved for three different sets of grid profiles (sparse, normal, and encrypted) and the results showed that the maximum relative error in the simulated concentrations did not exceed 1% for the three different grid quality conditions in the area of greatest interest, i.e., in and around the monitoring wells. Therefore, the normal grid was chosen for the subsequent calculations. After tetrahedron partition, the total number of mesh elements is 189,084 (see
Figure 4 for grid generation), the minimum mesh quality is 0.1799, and the average mesh quality is 0.6474. The required computing memory is about 10 Gb.
The permeability coefficient, porosity, permeability coefficient of impervious membrane, fluid density, and dynamic viscosity coefficient of the aquifer are determined according to the actual parameters of an experimental site in Yancheng, as shown in
Table 1. It should be noted that the permeability coefficient at the defect is influenced by both the outer and inner media. Assuming that the influence of the media on both sides is the same, the weighted average method is used to determine the permeability coefficient at the defect (as shown in
Table 1).
3. Results and Discussion
3.1. Simulation Results in Typical Scenes
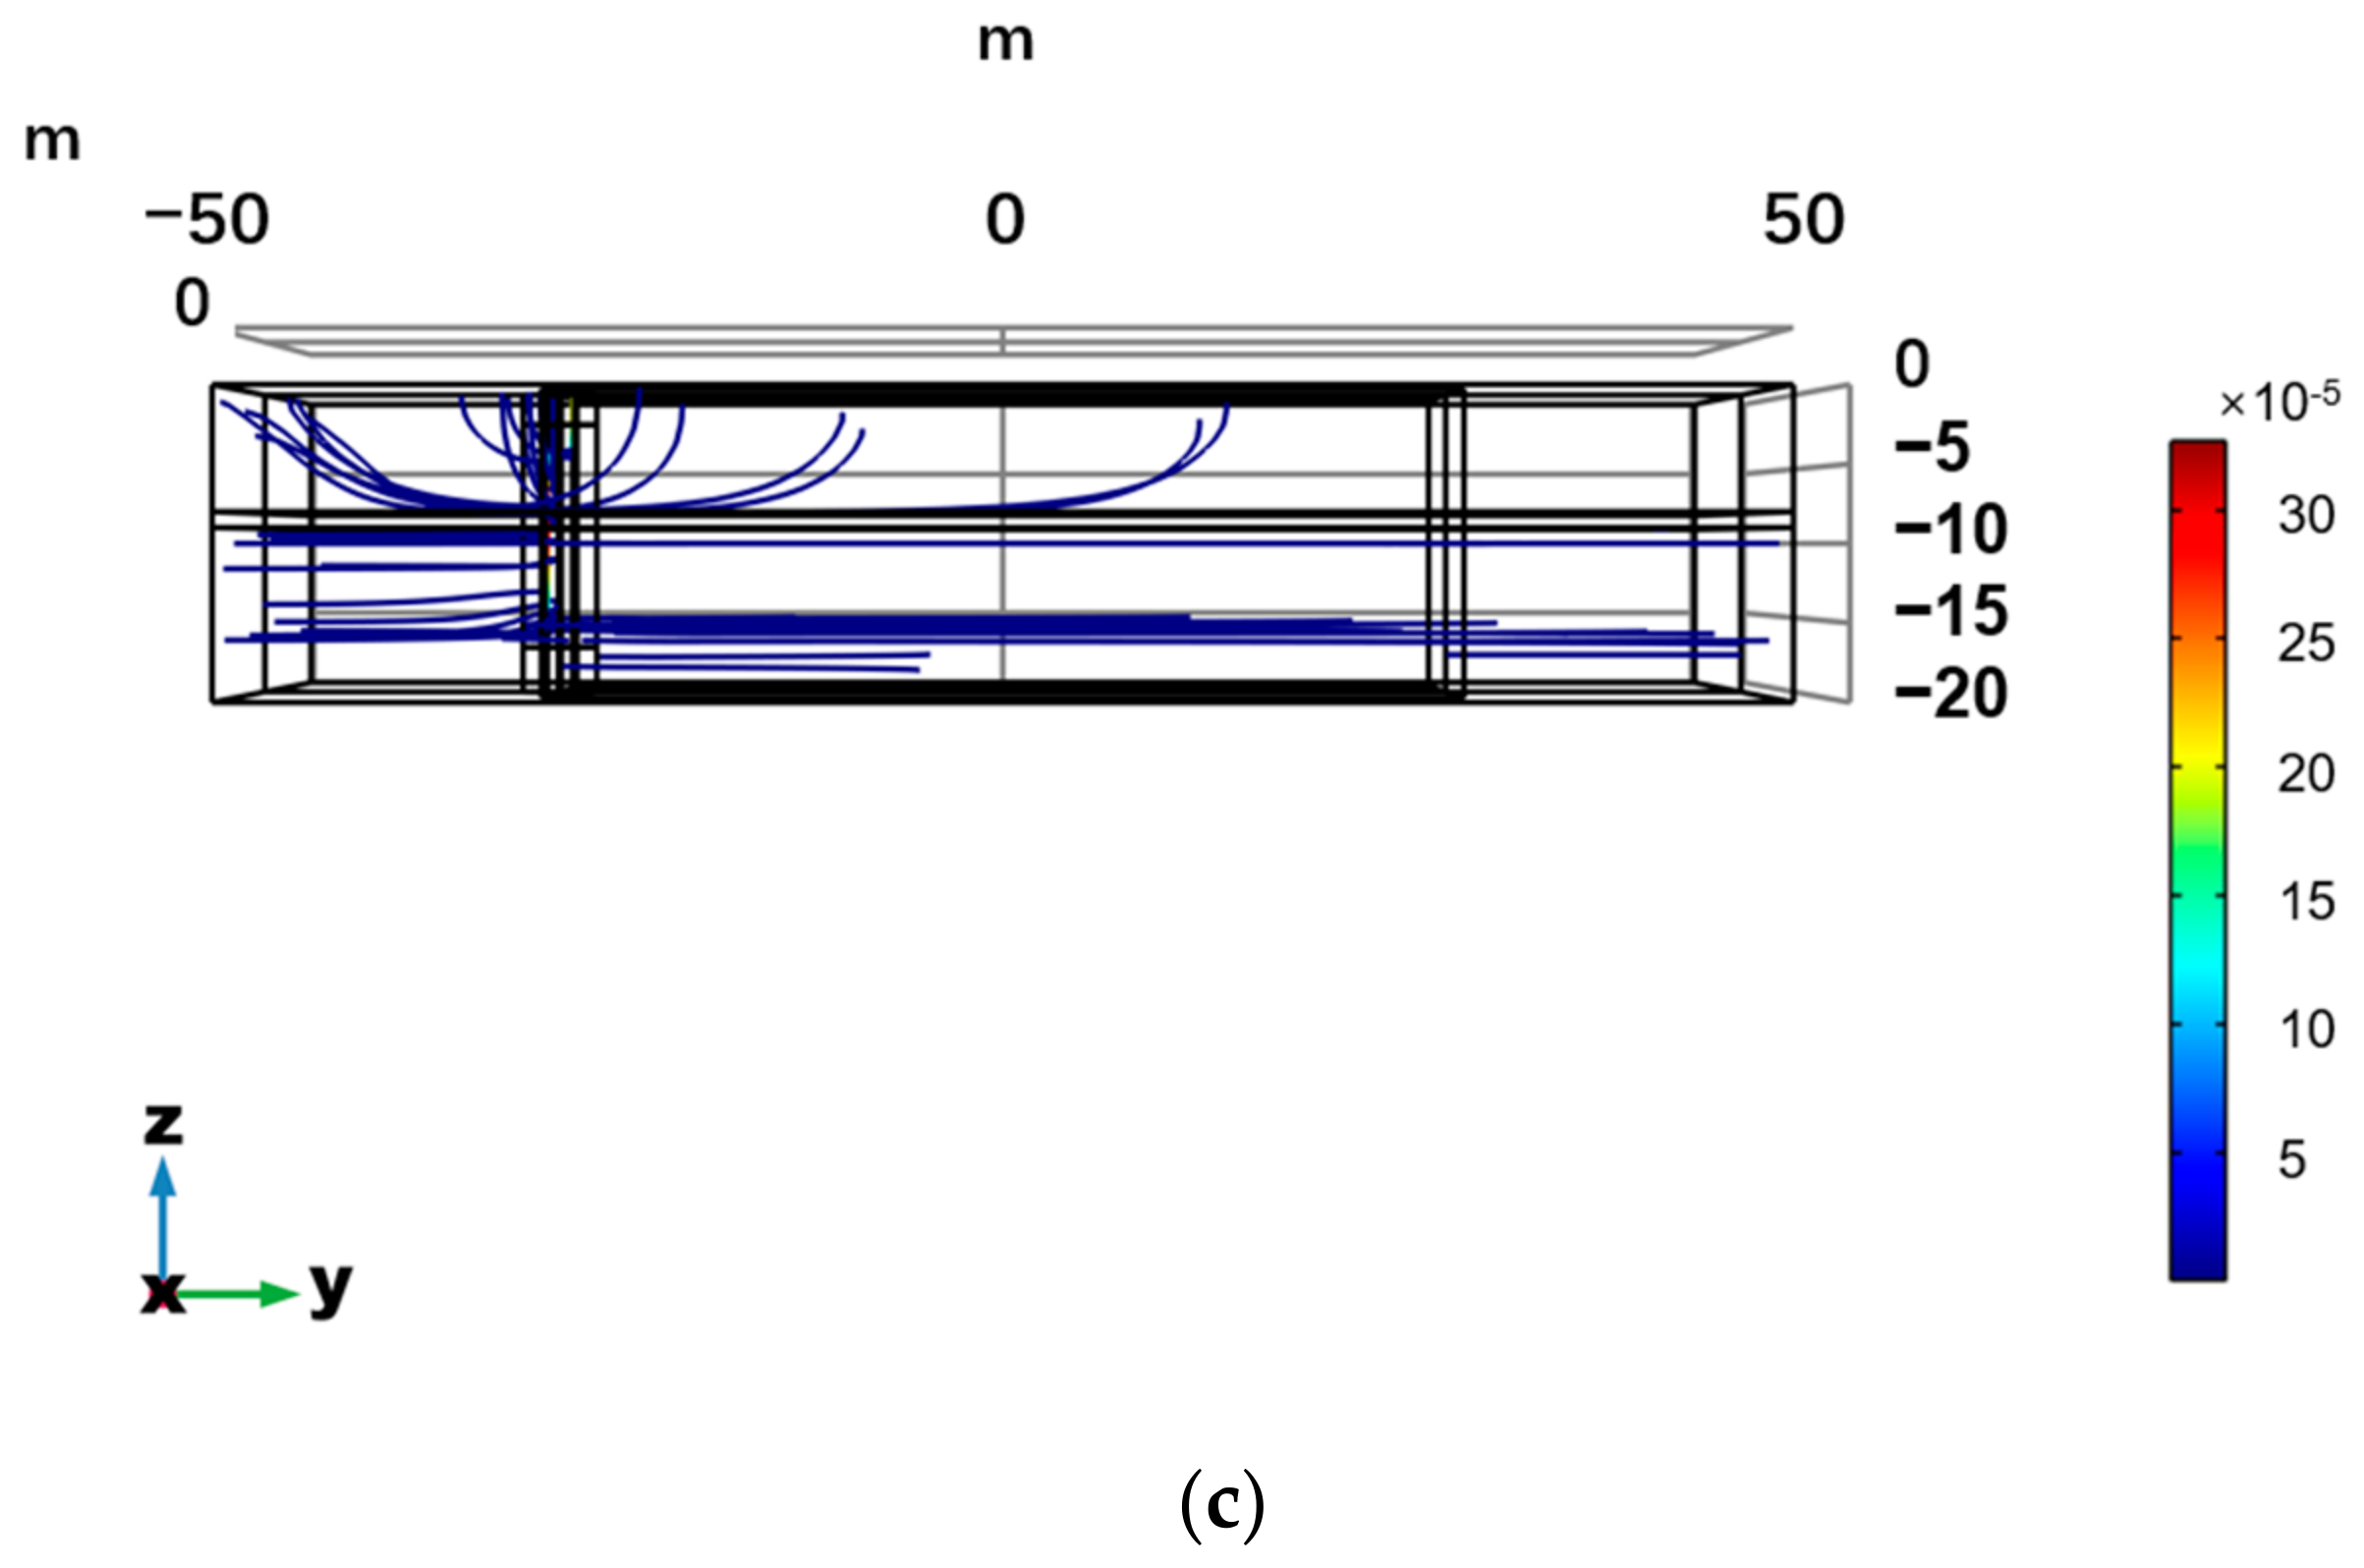
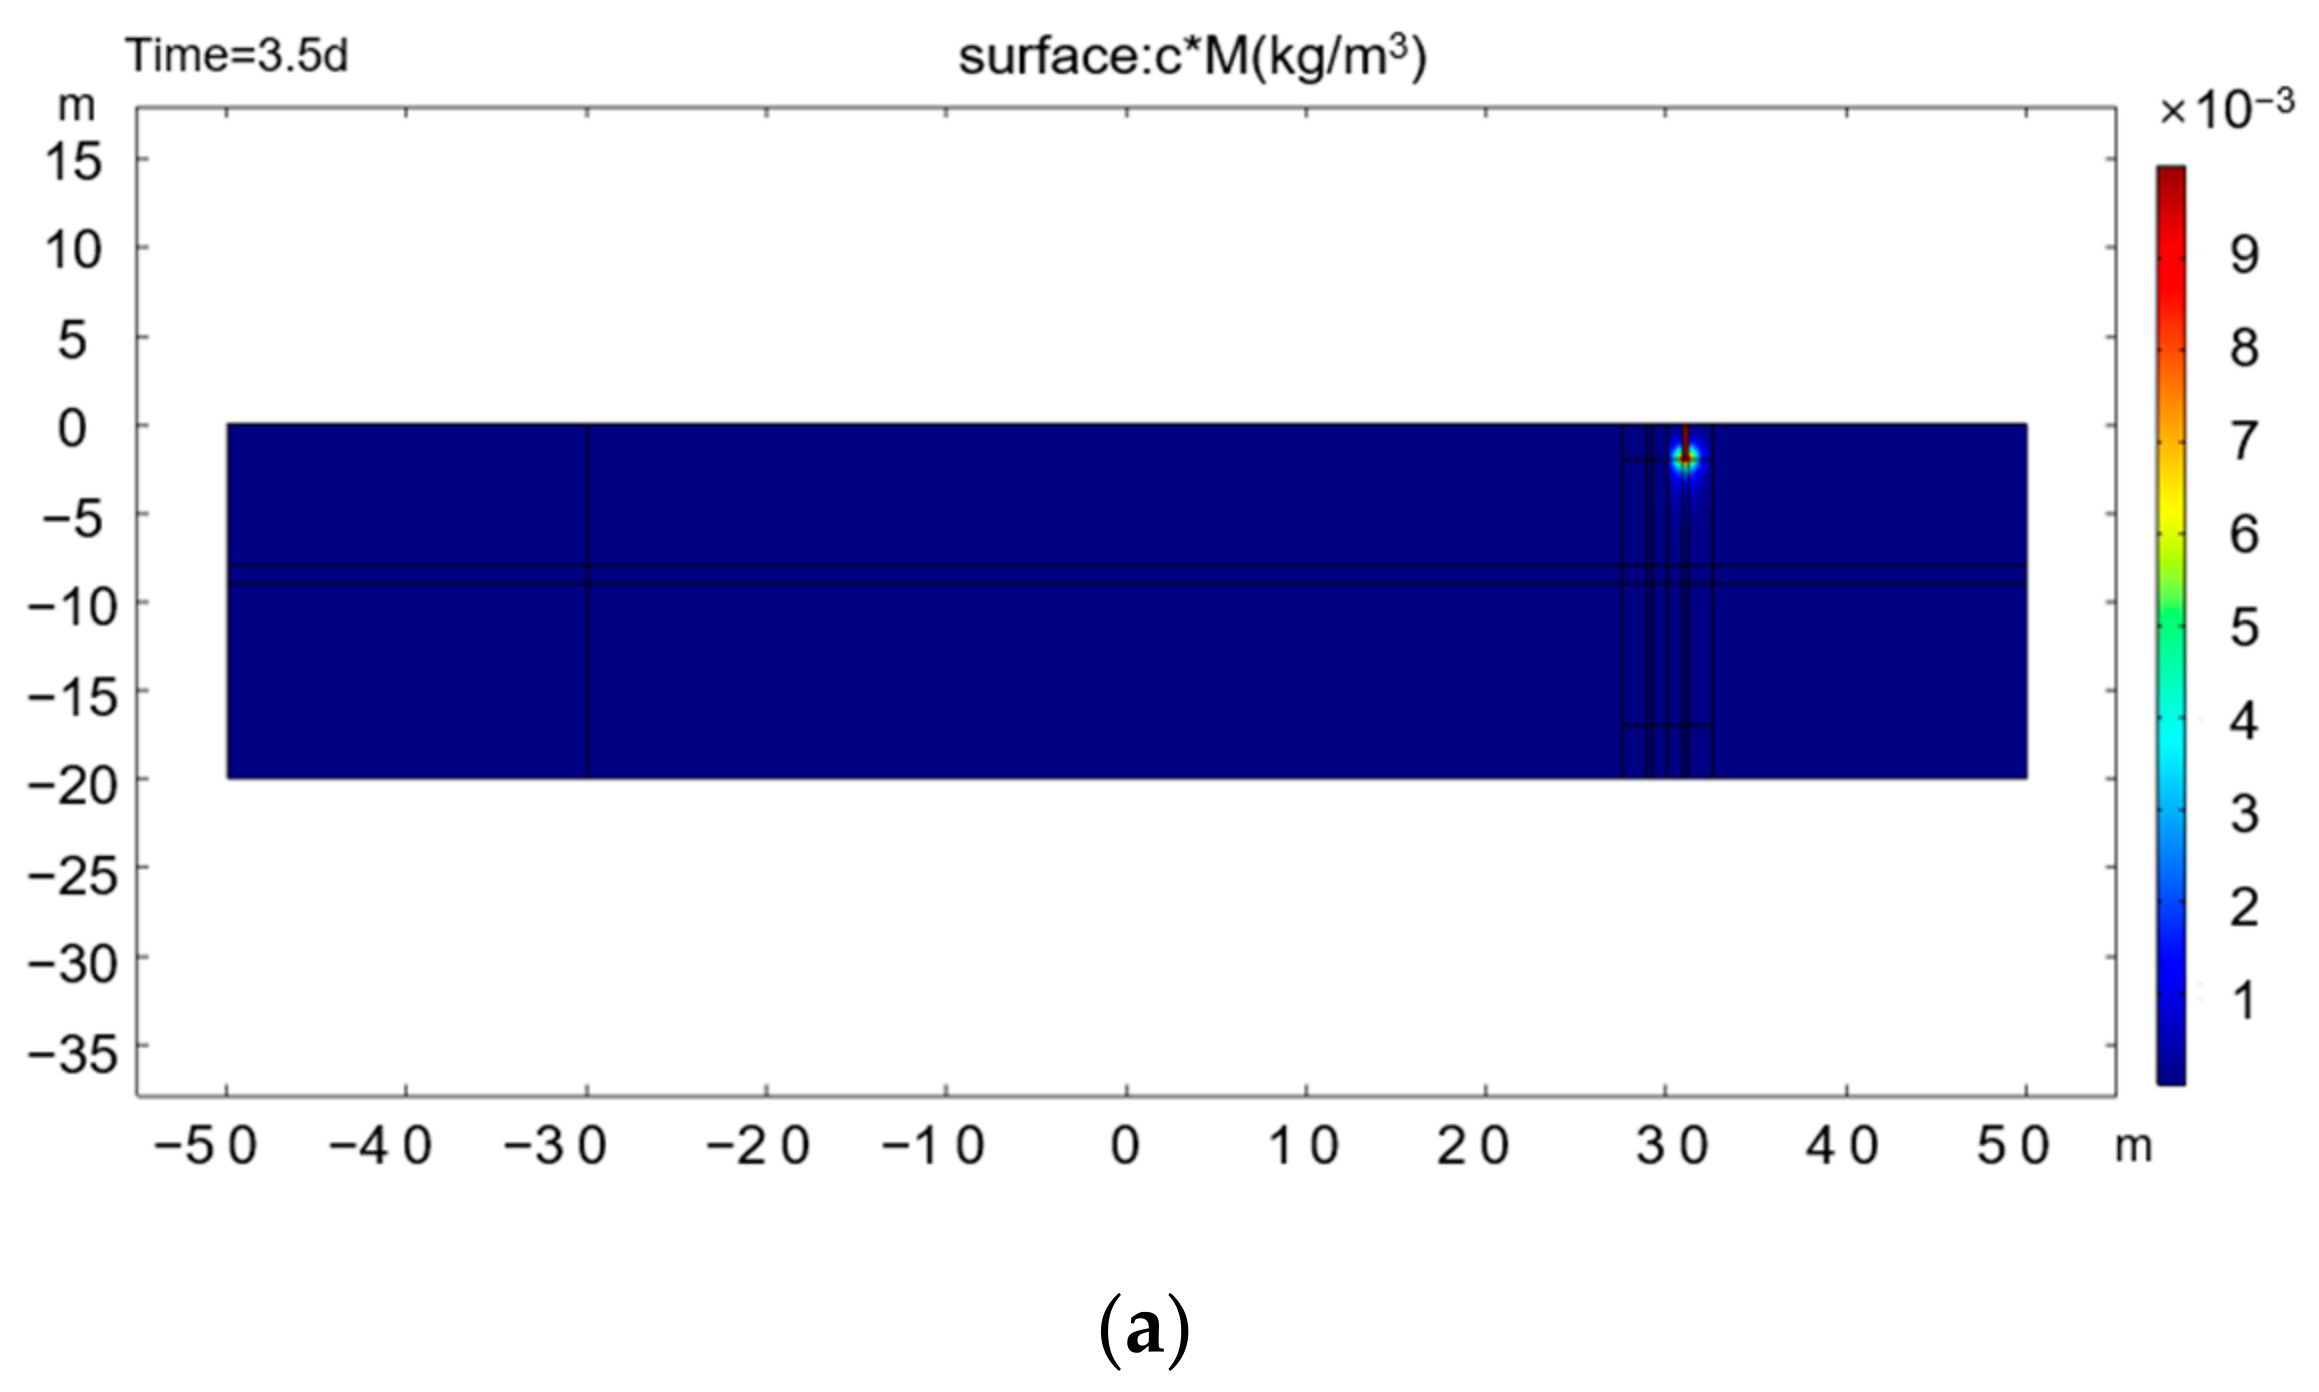
Based on the above generalized model, the pipe flow field in the scope of the pumping well, leakage monitoring well, and the groundwater flow and tracer migration in the aquifer are simulated. The results are shown in
Figure 5.
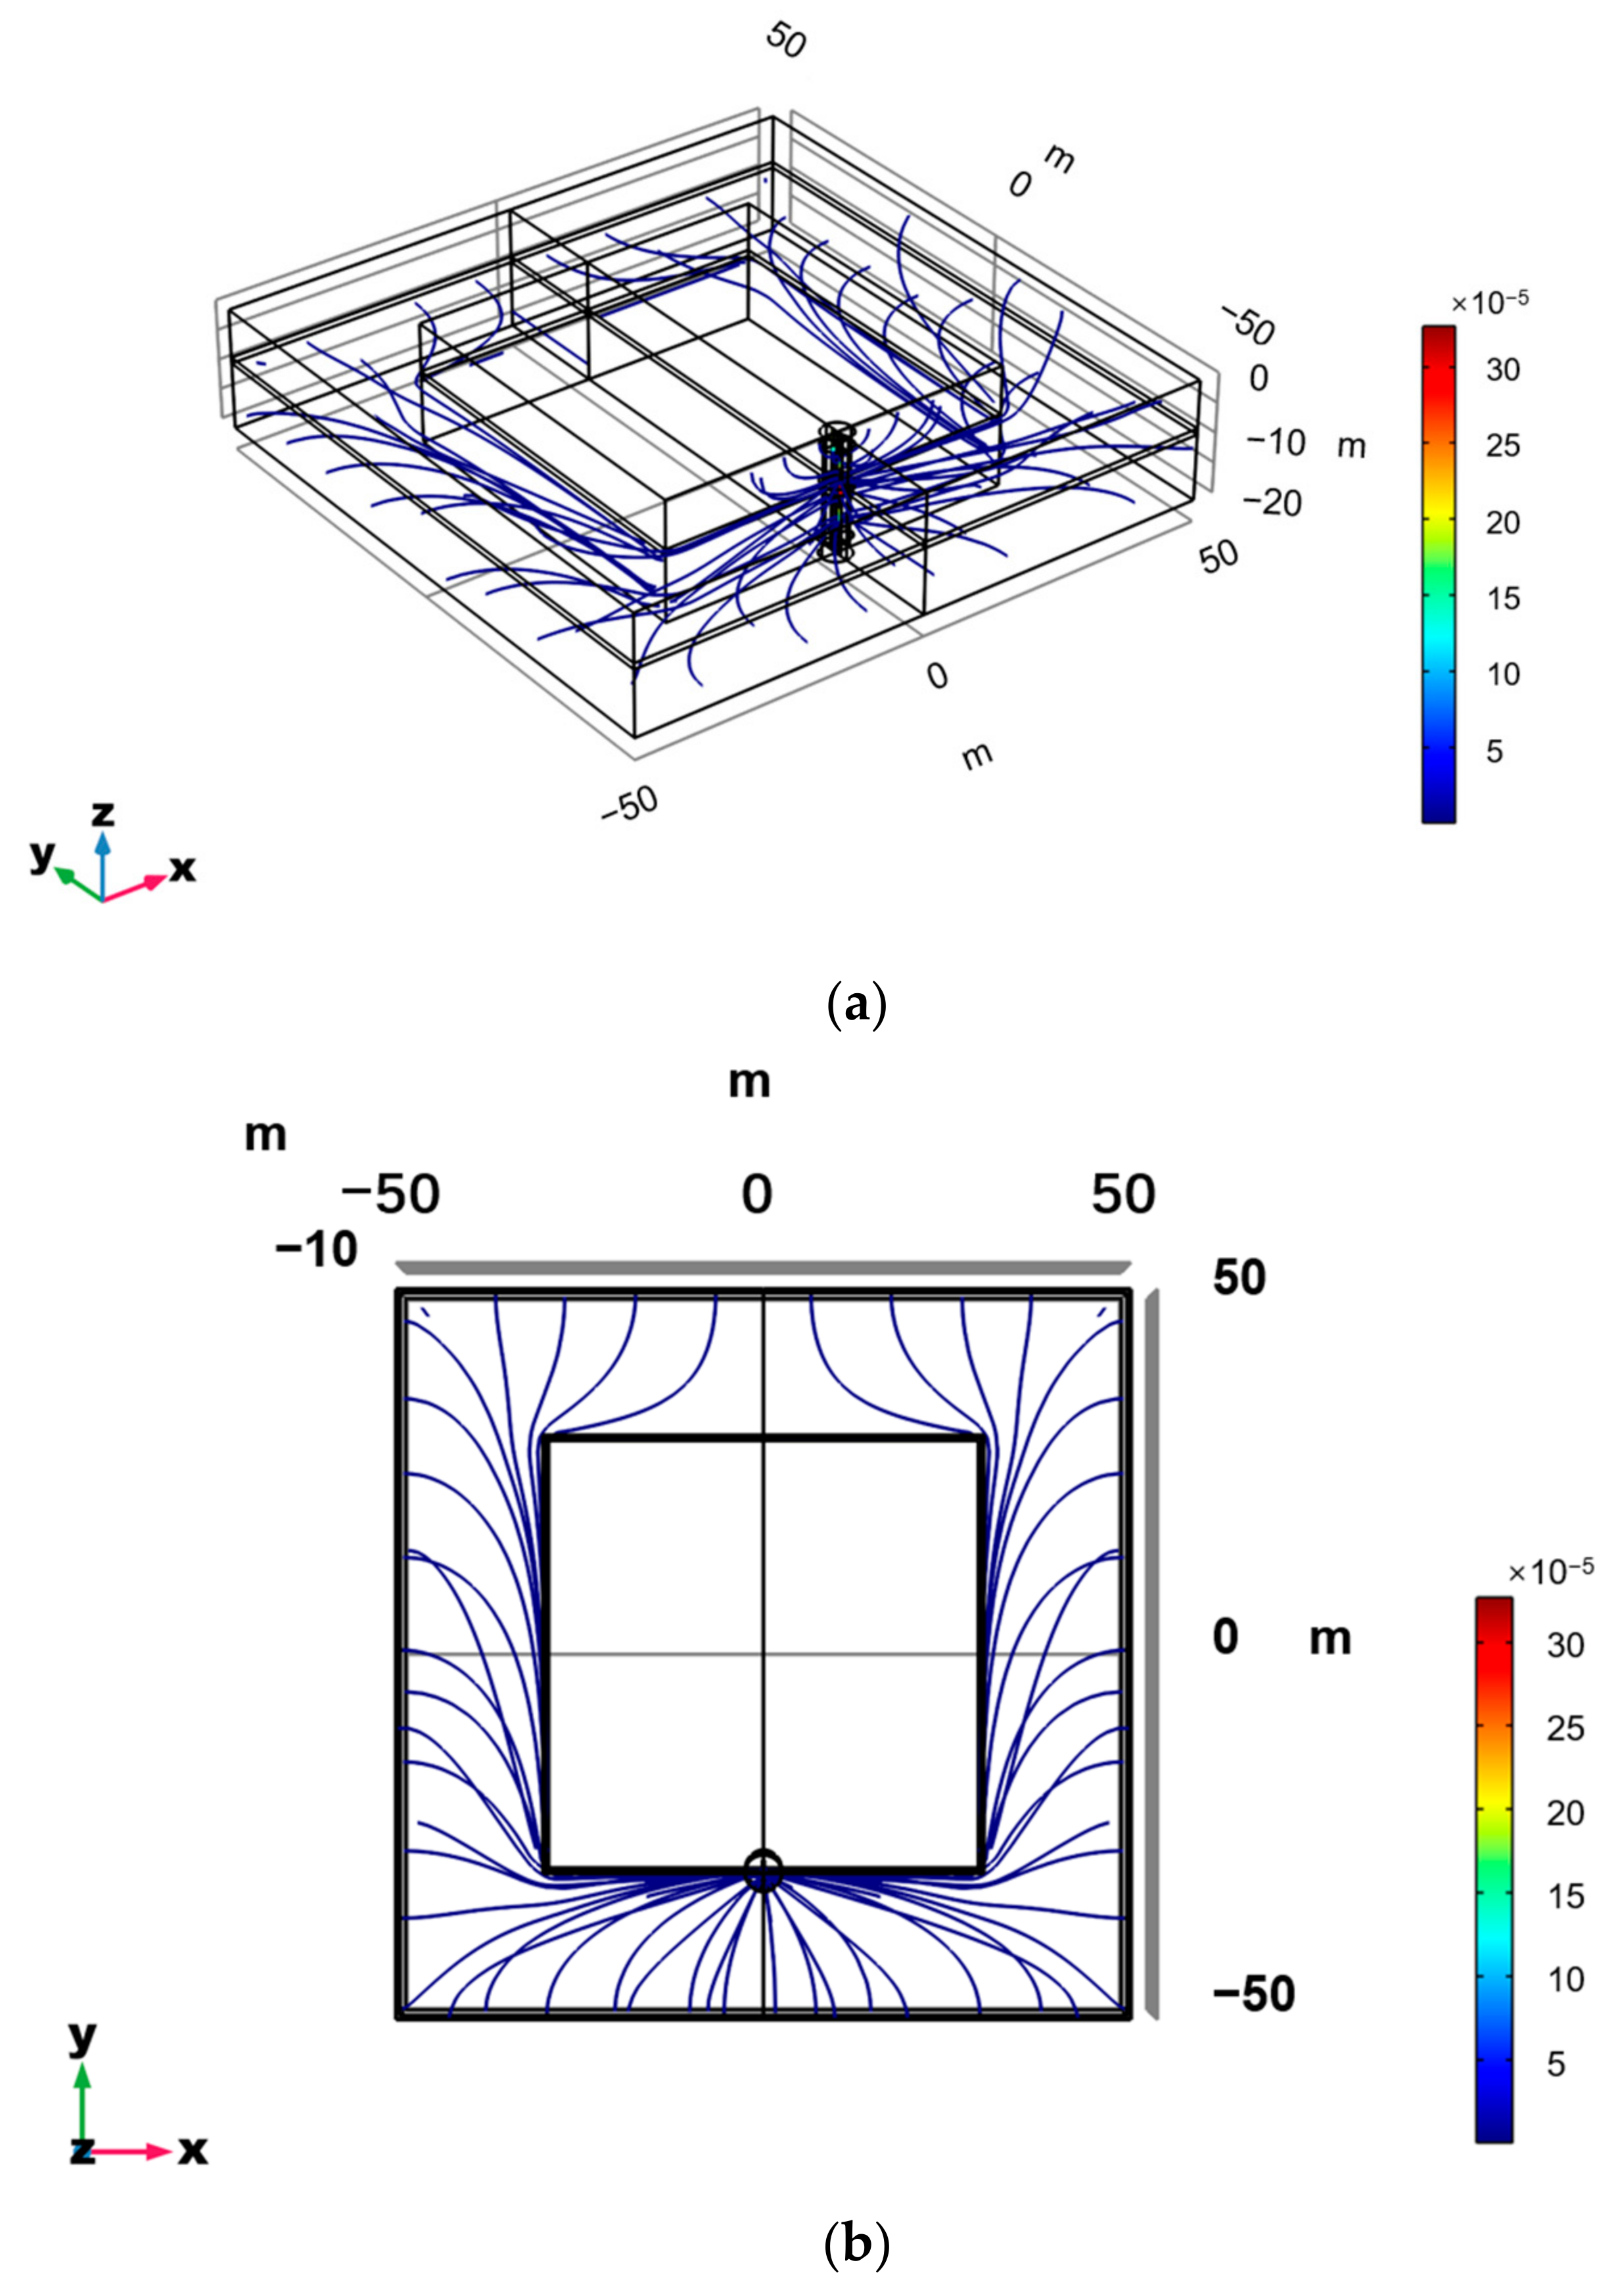
Figure 6a shows the distribution of the flow field in the aquifer system when the vertical curtain is defective under the guidance of artificial pumping. The water head of the outer aquifer is reduced by pumping, and the artificial hydraulic pressure difference is formed inside and outside the vertical membrane [
17]. Under the action of the hydraulic pressure difference, the groundwater accelerates to flow from the inner side to the outer side through defects, and most of the water flows into the pumping well and is discharged.
The flow movement also drives the tracer flow, which is the convection effect of solute transport [
18,
19].
Figure 7 shows the process of tracer penetration through the vertical cutoff wall leakage point after injection into the monitoring well.
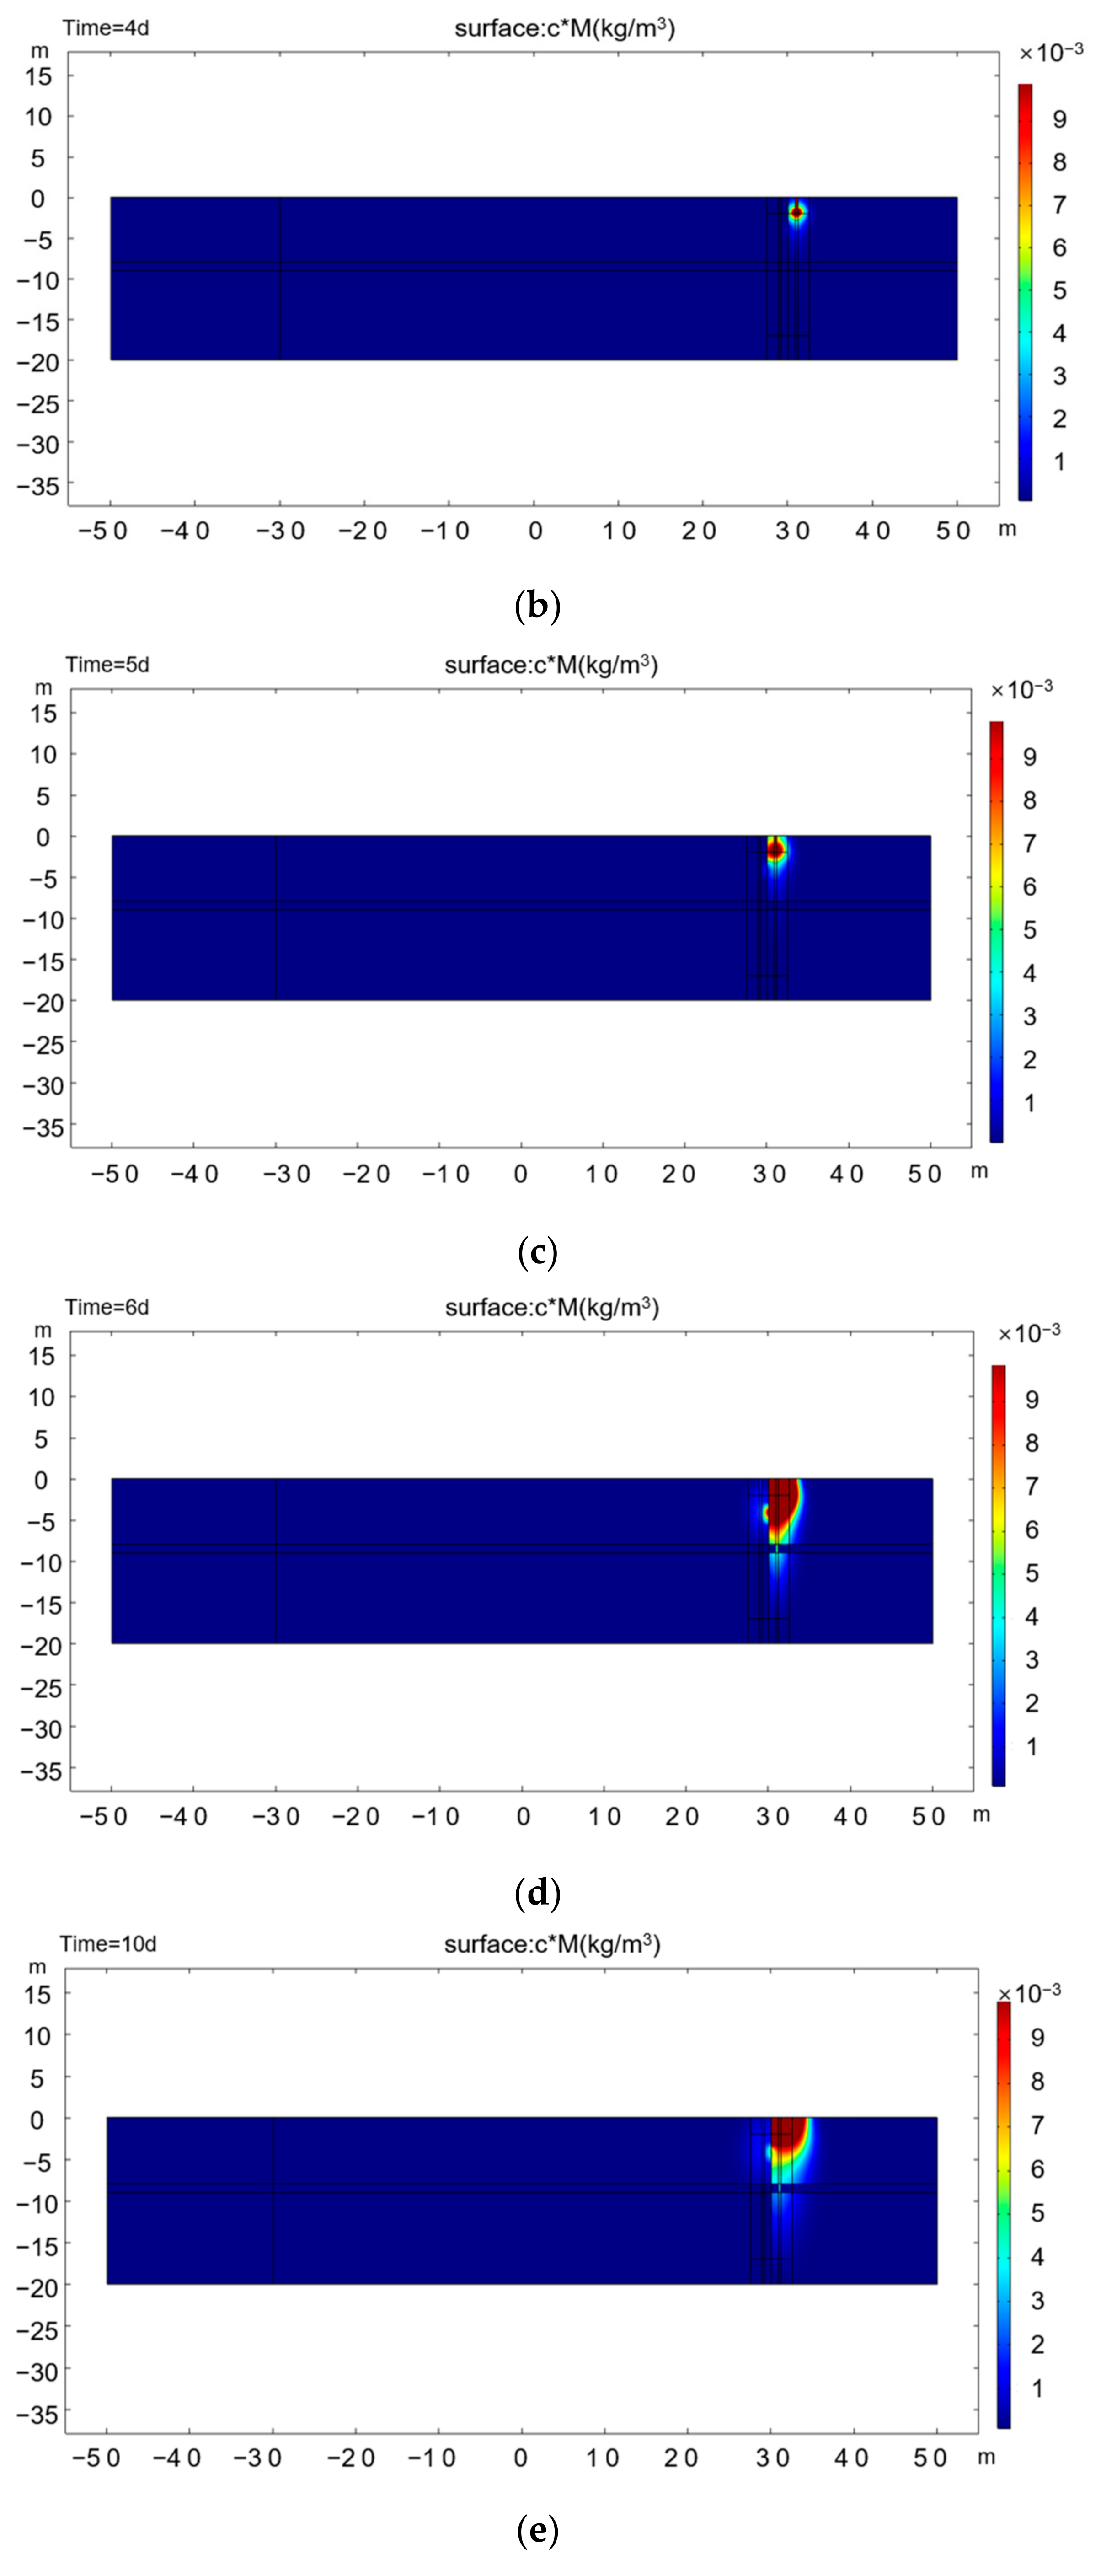
Figure 6a−c shows that during the continuous injection of tracer at constant concentration (days 3.5−5), the tracer concentration plume in the pumping well continues to increase and expand, reaches the vertical barrier area on the day of injection, and continues to migrate to the opposite side through defects; the tracer concentration plume inside the vertical barrier can be seen in
Figure 6d.
Figure 7 shows the variation of tracer concentration in the wells during the simulation. Tracer concentration in the pumping well continues to increase with the continuous injection of tracer on the 3rd–5th day, reaching the peak value (0.16 ppb) on the 6th day; with the stop of tracer injection on the 5th day, the tracer concentration in the pumping well also decreases. Due to the short duration of tracer injection (3 days), the time between the tracer reaching its peak (day 6) and the start of its decline (day 6.5) was also short, around 0.5 days. There was a delay of approximately 4.5 days from the start of tracer injection to the peak tracer concentration in the pumping wells, and a delay of approximately 1.5 days from the cessation of injection to the start of decline.
3.2. Influence of Defect Location on Detection Performance
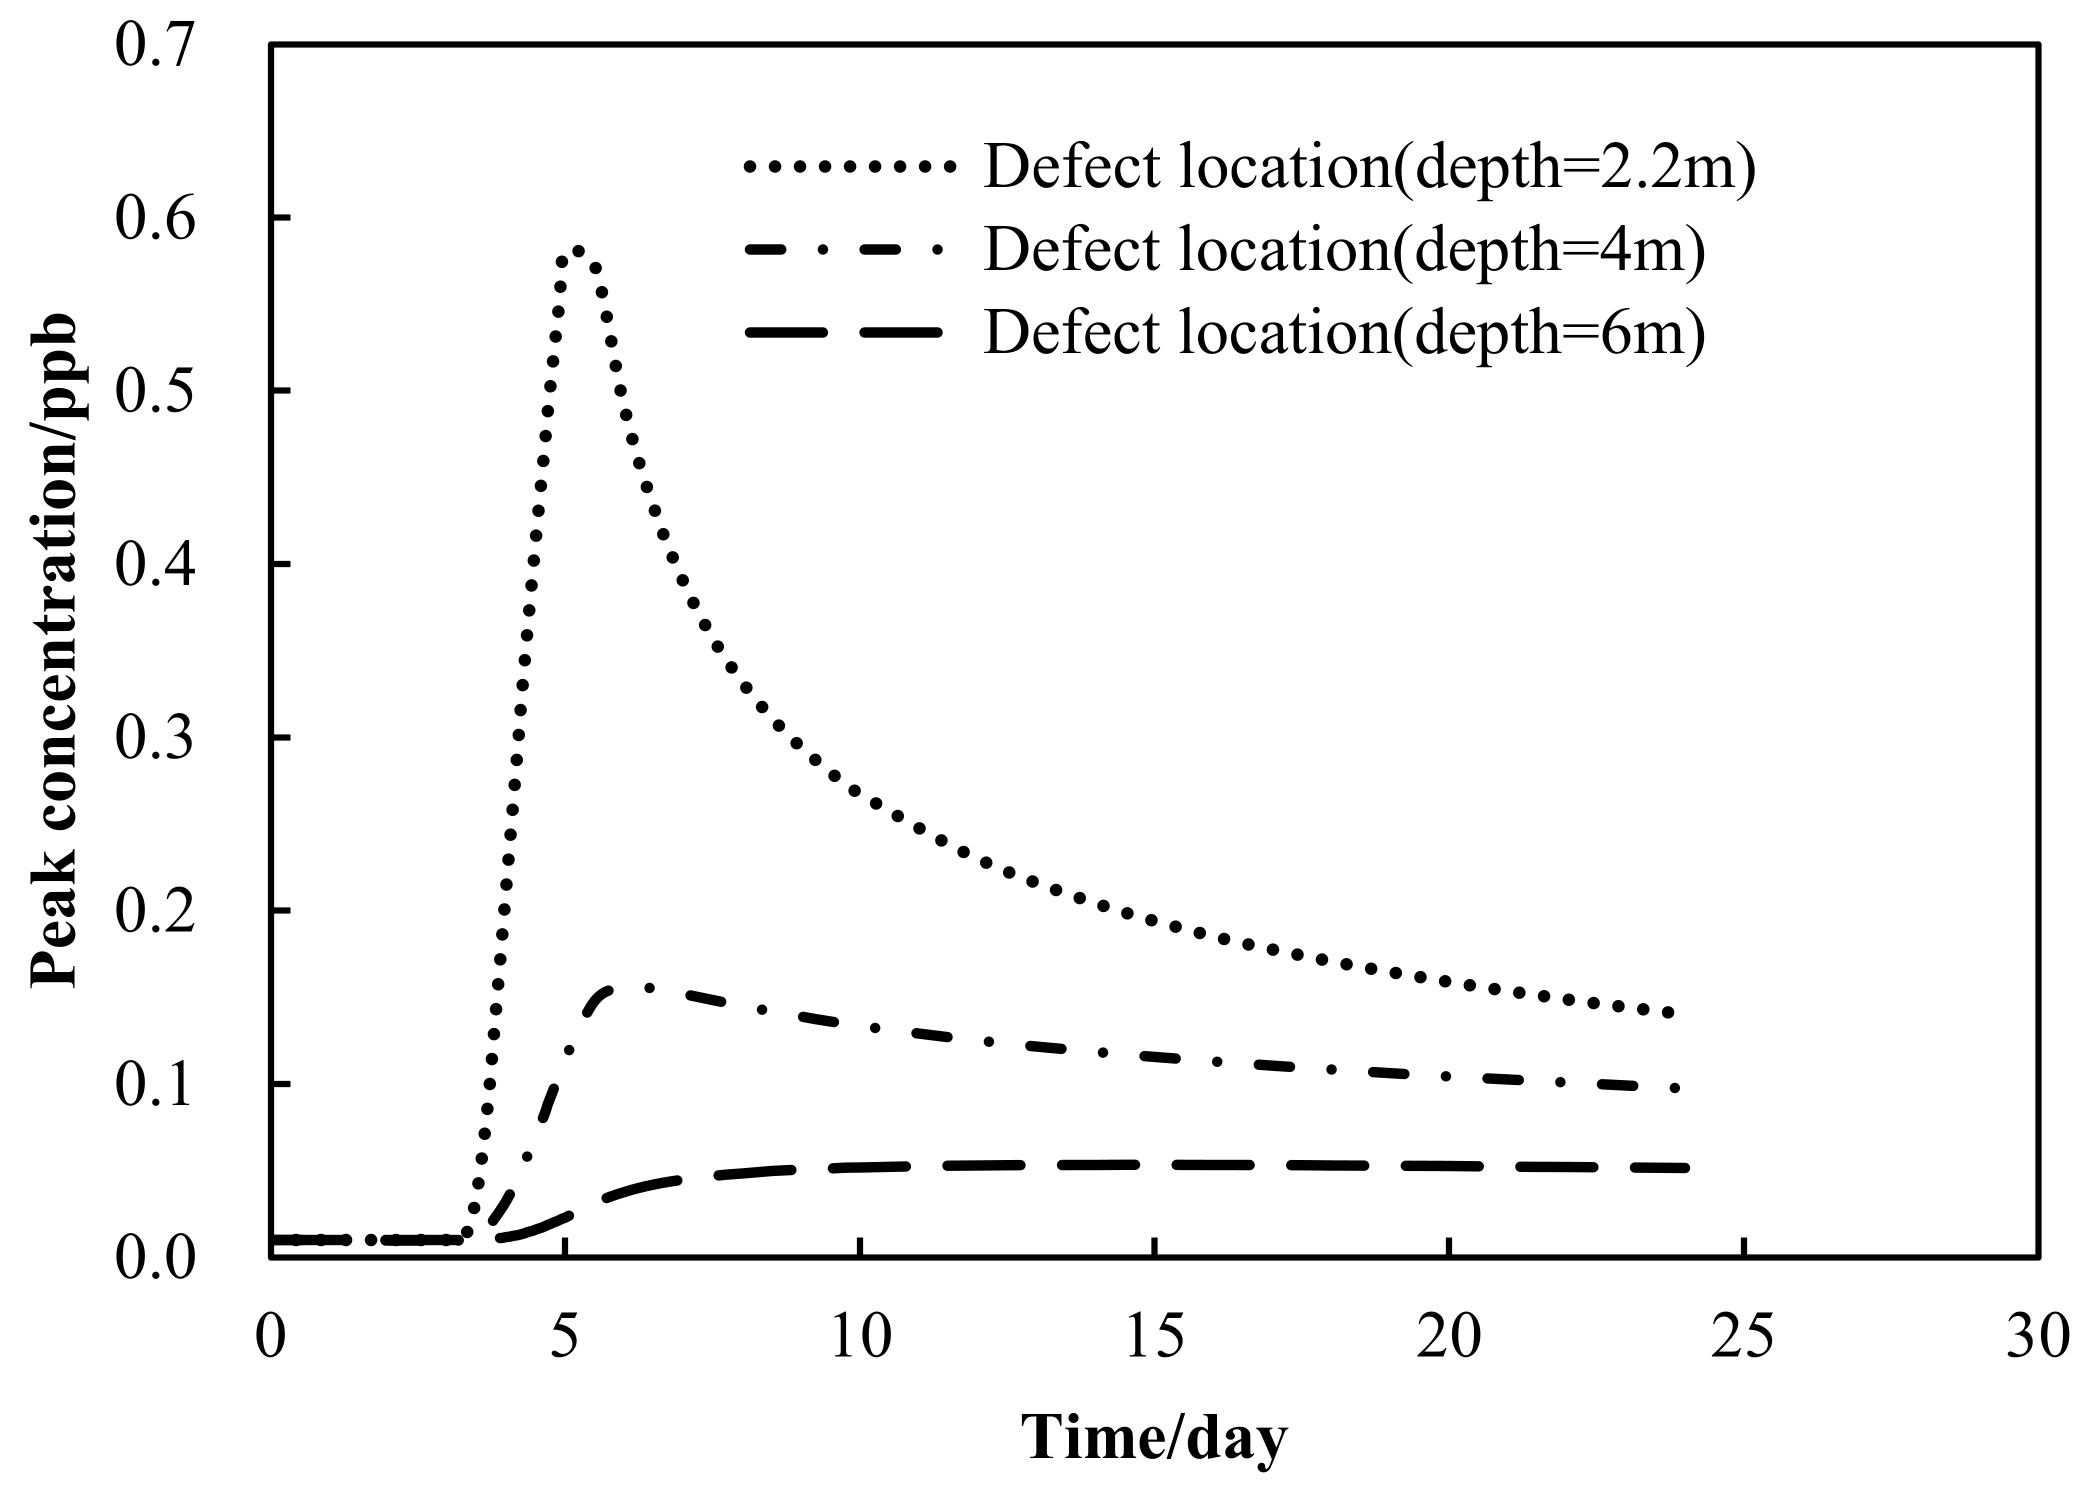
Figure 8 shows the variation of tracer concentration in a pumping well with the hole at different depths (with the same horizontal position and size). The depth of the hole has an important influence on the tracer penetration curve. Shallower depth has a steeper breakthrough curve, more rapid concentration increases and earlier peak concentration. A higher peak concentration will also result in a more rapid concentration decrease after reaching the peak concentration as shown in
Table 2. For example, when the depth changes from 2.2 m to 4 m and 6 m, the peak concentration decreases from 5.81 × 10
−4 ppm to 1.56 × 10
−4 and 5.35 × 10
−5 ppm, respectively. In addition, the time to reach the peak concentration was extended from day 5, to day 6, and day 14, respectively.
In addition, it is assumed that the background value of groundwater is 0.01 ppb and the detection limit of tracer is 0.4 ppb. When the depth of the hole is 2.2 m, the peak concentration of the tracer in the pumping well can exceed the tracer detection limit of the instrument. Therefore, the defect of the vertical barrier can be detected by the tracer method. When the depth of the hole is 4 m and 6 m, the peak concentration of tracer in the pumping well is only 0.14 times of the detection limit of the instrument, so it cannot be detected, nor can the defects of the vertical barrier be found.
In addition, with a tracer concentration of 1000 ppb, injection flow of 1 L/h, and duration of 3 days (day 3 to day 5), the tracer concentration can exceed the detection limit when the defect is shallow, the exceeding time is only about 2.6 days (day 4.4 to day 7). This also requires the detection time and monitoring frequency [
20,
21], to be at least once a day, or the tracer concentration will be missed when it is greater than the detection limit.
3.3. Effect of Injection Concentration on Detection Performance
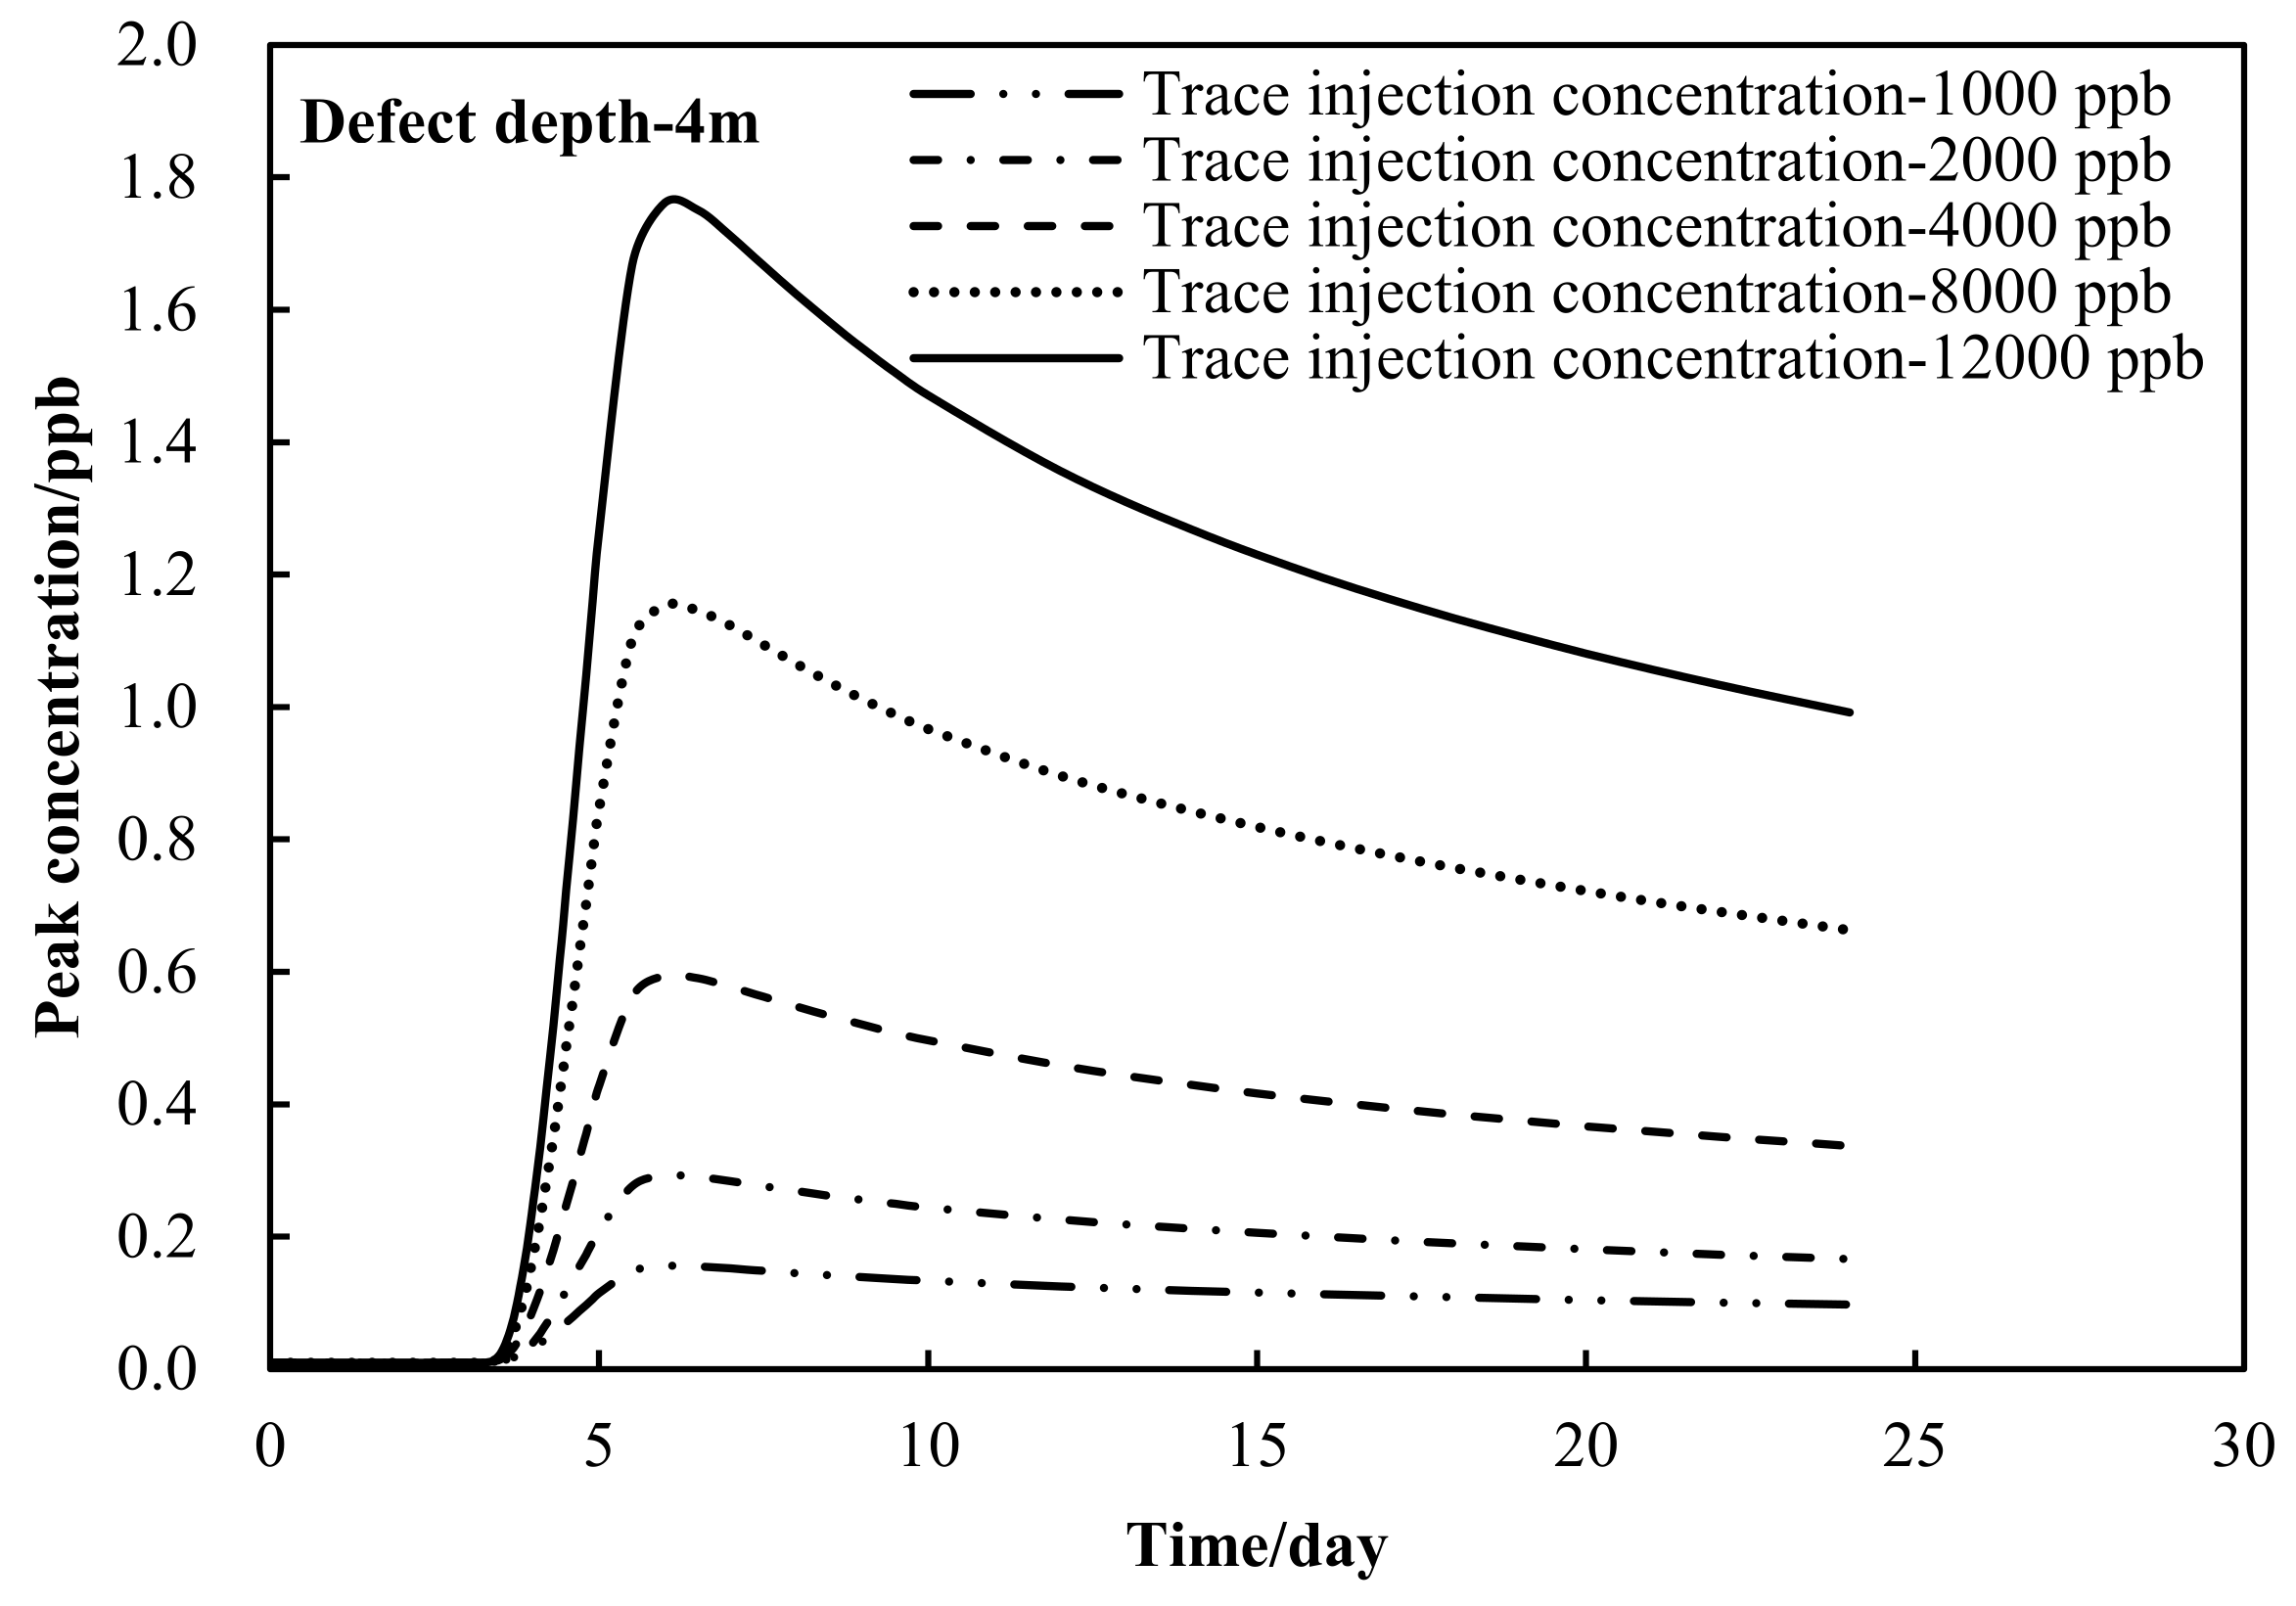
The penetration process under different injection concentrations is illustrated in
Figure 9, which shows that the change of dosing concentration will not cause a change in the shape of the breakthrough curve, nor the change in the arrival time of the peak concentration in the pumping well, but will cause the change of the peak concentration [
21,
22]. The peak concentration increased from 0.16 ppb to 0.29 ppb and 0.59 ppb in the process of adding concentration from 1000 ppb to 2000 ppb and 4000 ppb.
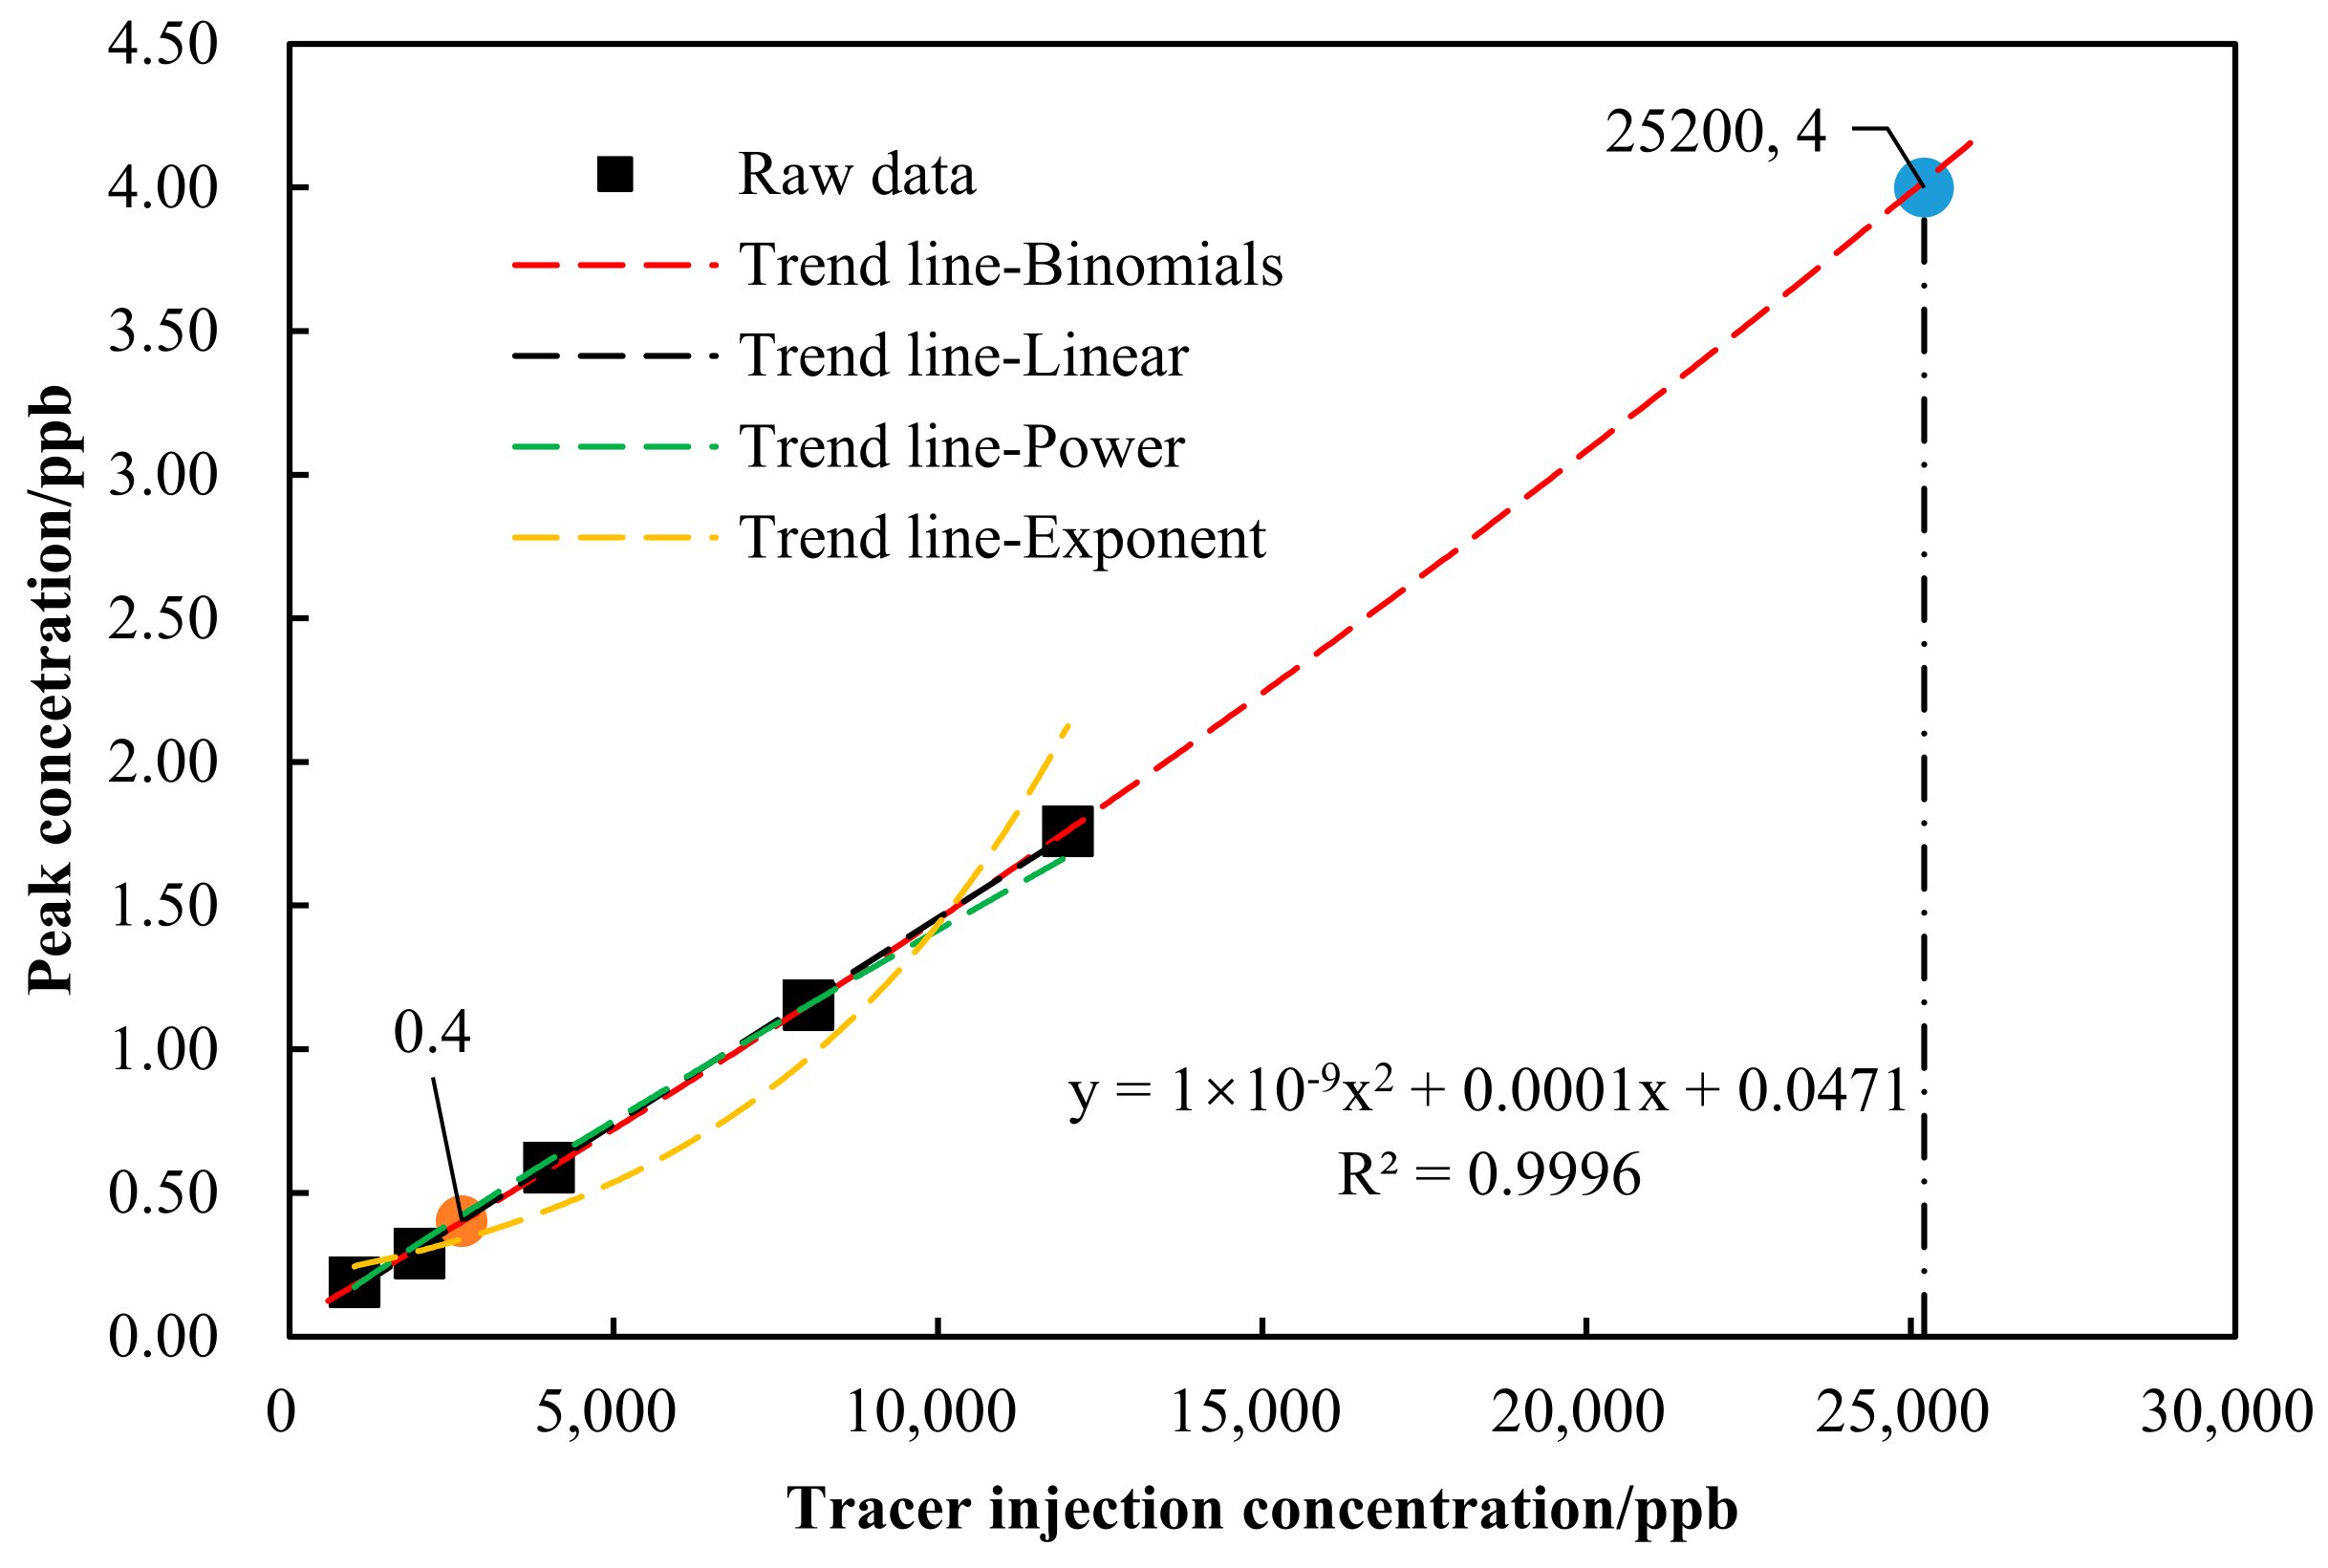
Exponential, linear, polynomial, and power functions are selected to fit the concentration of tracer and the peak concentration curve, with the relationships shown in
Figure 10. Because polynomial fitting is the best, R
2 = 1, the dosing concentration and peak concentration are not linearly correlated but nonlinearly correlated. Literature research shows that tracer concentration monitoring data can be more accurate in the reaction penetration process when the peak concentration reaches more than 10 times the detection limit (i.e., 4 ppb) [
23]. It can be inferred that when the hole is located at the depth of 4 m, according to the polynomial fitting results, the tracer concentration in the pumping well can reach 4 ppb only when the dosing concentration exceeds 25,200 ppb, i.e., 25.2 ppm, and the tracer penetration curve can be completely described [
24].
3.4. Impact of Defect Size on Detection Performance
When the tracer concentration is 1000 ppb, the injection flow is 1 L/h, and the duration is 3 days (from the 3rd day to the 5th day), the influence of the size of the hole in the VFB (the length of the hole side) on the tracer penetration process is shown in
Figure 11. The difference in the size of the hole substantially changes the tracer penetration curve. A larger defect results in a higher peak value of the penetration curve, and a faster rate of peak reduction after the peak value is reached, but the time required for the tracer to reach the peak value will not change. Increased hole size will result in the tracer concentration quickly reaching the highest (peak) value [
25,
26]. When the tracer injection ends, the tracer concentration will gradually decrease from the highest value. Concentration will decrease more rapidly if the hole is larger. The data showed that when the size of the hole increased from 0.3 m to 0.5 m and 0.8 m, the peak concentration increased from 0.156 ppb to 0.227 ppb and 0.311 ppb, respectively. The time for the concentration to reach the maximum value after penetration was on the 6th day.
In addition, it is assumed that the background value of tracer in groundwater is 0.01 ppb and the detection limit of tracer is 0.4 ppb. The results show that when the side length of the hole is 0.3–0.8 m, the peak concentration of the tracer in the pumping well is less than the detection limit of the instrument, and the tracer cannot be detected by the instrument, and the defect of the vertical barrier cannot be found.
The selection of the exponential, linear, and power functions to fit the size of the VFB defect and the peak concentration in the pumping well curve are shown in
Figure 12. The power function shown in
Figure 12 has an R
2 = 1, which indicates that there is a nonlinear relationship between the peak concentration of tracer and the defect size. According to the relationship model, when the defect size is at least 1.07 m, the peak concentration of the tracer in the pumping well can be greater than 0.4 ppb. When the hole is located at this depth, its side length needs to be greater than 1.07 m to detect the VFB defect using the tracer method. Peak tracer concentrations in pumping wells can reach 10 times the detection limit of the instrument when the hole size reaches 30 m, and the pattern of the penetration curve can be very clearly observed.
4. Conclusions
This study proposes a combined pumping–tracer-based method for the detection of VFB defects. Simulation of the defect detection process based on a high-performance numerical model shows that the local hydraulic gradient formed by pumping effectively accelerates the rate and amount of tracer through the defect, which, together with the low detection limit of the exogenous tracer itself, enables the combined method to accurately and rapidly detect defects in VFB under specific conditions.
Further studies have shown that under typical conditions (hole depth 2.2 m, size 0.5 m, tracer injection concentration 1000 ppb, flow rate 1 L/h), the tracer concentration in the pumped well can reach the detection limit of the instrument (0.4 ppb) in about 4 days, indicating that defects of size 0.5 m and depth 2.2 m can be detected at this pumping rate and tracer injection concentration with response times can be achieved within 5 days.
Other things being equal, when the defect depth is increased from 2.2 m to 4 m, the peak tracer concentration in the monitoring well is much less than 0.4 ppb; however, when the tracer injection concentration is also increased from 1000 ppb to 2660 ppb, the tracer concentration in the monitoring well can reach 0.4 ppb. The above simulation results show that the depth of the defect affects the effectiveness of the method and the response time. When the location is too deep, the effectiveness and response time of the method need to be guaranteed by increasing the tracer injection concentration.
Author Contributions
Conceptualization, Y.X. and M.Z.; methodology, X.L.; software, Z.C.; validation, X.L., Y.X. and Y.L.; formal analysis, Z.C.; investigation, Y.L.; resources, L.D.; data curation, P.Q.; writing—original draft preparation, Z.C.; writing—review and editing, Y.L.; visualization, P.Q.; supervision, Y.X.; project administration, Y.X.; funding acquisition, Y.X. All authors have read and agreed to the published version of the manuscript.
Funding
This work was funded by the Joint Research Program for ecological conservation and high-quality development of the Yellow River Basin (grant number 2022YRUC010303) and the National Key R&D Program of China (grant number 2020YFC1806304).
Data Availability Statement
The data are not publicly available due to the company’s requirements for confidentiality of data. If you would like to know the data, please contact the corresponding author.
Conflicts of Interest
The authors declare no conflict of interest. The funders had no role in the design of the study; in the collection, analysis, or interpretation of data.
References
- Sankoh, A.A.; Amara, J.; Komba, T.; Laar, C.; Sesay, A.; Derkyi, N.S.; Frazer-williams, R. Seasonal assessment of heavy metal contamination of groundwater in two major dumpsites in Sierra Leone. Cogent Eng. 2023, 10, 2185955. [Google Scholar] [CrossRef]
- Oppong-Anane, A.B.; Quiñones, K.Y.D.; Harris, W.; Townsend, T.; Bonzongo, J.C.J. Iron reductive dissolution in vadose zone soils: Implication for groundwater pollution in landfill impacted sites. Appl. Geochem. 2018, 94, 21–27. [Google Scholar] [CrossRef]
- Battaglia, D.; Birindelli, F.; Rinaldi, M.; Vettraino, E.; Bezzi, A. Fluorescent tracer tests for detection of dam leakages: The case of the Bumbuna dam—Sierra Leone. Eng. Geol. 2016, 205, 30–39. [Google Scholar] [CrossRef]
- Chidichimo, F.; De Biase, M.D.; Straface, S. Groundwater pollution assessment in landfill areas: Is it only about the leachate. Waste Manag. 2020, 102, 655–666. [Google Scholar] [CrossRef] [PubMed]
- Darilek, G.T.; Laine, D.L. Costs and benefits of geomembrane liner installation CQA. In Proceedings of the Geosynthetics 2001 Conference, Portland, OR, USA, 12–14 February 2001; pp. 65–75. [Google Scholar]
- Soupios, P.M.; Loupasakis, C.; Vallianatos, F. Reconstructing former urban environments by combining geophysical electrical methods and geotechnical investigations—An example from Chania, Greece. J. Geophys. Eng. 2008, 5, 186–194. [Google Scholar] [CrossRef]
- Luück, E.; Ruehlmann, J.; Kirchmann, H. Properties of soils from the Swedish long-term fertility experiments: VI. Map-ping soil electrical conductivity with different geophysical methods. Acta Agric. Scand. Sect. B Soil Plant. Sci. 2011, 61, 438–447. [Google Scholar] [CrossRef]
- Zhao, X.; Wang, D.; Xu, H.; Ding, Z.; Shi, Y.; Lu, Z.; Cheng, Z. Groundwater pollution risk assessment based on groundwater vulnerability and pollution load on an isolated island. Chemosphere 2022, 289, 133134. [Google Scholar] [CrossRef]
- Gupta, I.; Wilson, A.M.; Rostron, B.J. Groundwater age, brine migration, and large-scale solute transport in the Alberta Basin, Canada. Geofluids 2015, 15, 608–620. [Google Scholar] [CrossRef]
- Shuaiji, Z.; Wenfeng, D.; Zhengwen, L.; Xiaoyu, G. Migration and pollution control of chlorinated hydrocarbons in groundwater system of eastern Jinan. Environ. Earth Sci. 2023, 82, 1. [Google Scholar] [CrossRef]
- Mor, S.; Ravindra, K.; Dahiya, R.P.; Chandra, A. Leachate Characterization and Assessment of Groundwater Pollution Near Municipal Solid Waste Landfill Site. Environ. Monit. Assess. 2006, 118, 435–456. [Google Scholar] [CrossRef]
- Pandey LM, S.; Shukla, S.K.; Habibi, D. Resistivity profiles of Perth soil in Australia in leak-detection test. Geotech. Res. 2017, 4, 214–221. [Google Scholar] [CrossRef]
- Anvar, K.; Yurii, O. Phreatic seepage around a rectilinear cutoff wall: The Zhu-kovsky-Vedernikov-Polubarinova-Kochina dispute revisited. Adv. Water Resour. 2023, 173, 104367. [Google Scholar]
- Chen, C.X.; Wan, J.W.; Zhan, H.B. Theoretical and experimental studies of coupled seepage-pipe flow to a horizontal well. J. Hydrol. 2003, 281, 159–171. [Google Scholar] [CrossRef]
- Hu, L.T.; Chen, C.X.; Chen, X.H. Simulation of groundwater flow within observation boreholes for confined aquifers. J. Hydrol. 2011, 398, 101–108. [Google Scholar] [CrossRef]
- Dilip, K.J.; Naveen, K.; Raja, R.Y. Analytical solution for transport of pollutant from time-dependent locations along groundwater. J. Hydrol. 2022, 610, 127826. [Google Scholar]
- Zha, Y.; Yeh, T.C.J.; Illman, W.A.; Mok, C.M.W.; Tso, C.H.M.; Carrera, B.A.; Wang, Y.L. Exploitation of pump-and-treat remediation systems for characterization of hydraulic heterogeneity. J. Hydrol. 2019, 573, 324–340. [Google Scholar] [CrossRef]
- Schwede, R.L.; Li, W.; Leven, C.; Cirpka, O.A. Three-dimensional geostatistical inversion of synthetic tomographic pumping and heat-tracer tests in a nested-cell setup. Adv. Water Resour. 2014, 63, 77–90. [Google Scholar] [CrossRef]
- Poulsen, D.L.; Cook, P.G.; Simmons, C.T.; McCallum, J.M.; Noorduijn, S.L.; Dogramaci, S. A constant rate salt tracer injection method to quantify pumped flows in long-screened or open borehole wells. J. Hydrol. 2019, 574, 408–420. [Google Scholar] [CrossRef]
- Wang, X.T.; Zhang, Y.C.; Lin, P.; Xu, Z.H. Laboratory and temporal moment analysis of tracer-based solute transport in karst conduits. J. Cent. South Univ. 2023, 30, 306–330. [Google Scholar] [CrossRef]
- Schiperski, F.; Oertwich, M.; Scheytt, T.; Licha, T. Solubility of Tinopal CBS-X fluorescent dye at different EDTA concentrations and pH values: Implications regarding its applicability in field tracer tests. J. Hydrol. 2019, 578, 124025. [Google Scholar] [CrossRef]
- Schiperski, F.; Gabrovsek, F. Spreading of tracer plumes through confined telogenetic karst aquifers: A model. J. Hydrol. 2011, 409, 20–29. [Google Scholar]
- Isokangas, E.; Ronkanen, A.K.; Rossi, P.M.; Marttila, H.; Kløve, B. A tracer-based method for classifying groundwater dependence in boreal headwater streams. J. Hydrol. 2019, 577, 123762. [Google Scholar] [CrossRef]
- USEPA. National Oil and Hazardous Substance Pollution Contingency Plan [EB/OL]; Final Rule, 50 Federal Register 47912; USEPA: Washington, DC, USA, 1985.
- Gao, H.; Tatomir, A.B.; Karadimitriou, N.K.; Steeb, H.; Sauter, M. Reservoir characterization by push-pull tests employing kinetic interface sensitive tracers—A pore-scale study for understanding large-scale processes. Adv. Water Resour. 2023, 174, 104424. [Google Scholar] [CrossRef]
- Neira, N.M.; Clark, J.F.; Fisher, A.T.; Wheat, C.G.; Haymon, R.M.; Becker, K. Cross-hole tracer experiment reveals rapid fluid flow and low effective porosity in the upper oceanic crust. Earth Planet. Sci. Lett. 2016, 450, 355–365. [Google Scholar] [CrossRef]
| Disclaimer/Publisher’s Note: The statements, opinions and data contained in all publications are solely those of the individual author(s) and contributor(s) and not of MDPI and/or the editor(s). MDPI and/or the editor(s) disclaim responsibility for any injury to people or property resulting from any ideas, methods, instructions or products referred to in the content. |
© 2023 by the authors. Licensee MDPI, Basel, Switzerland. This article is an open access article distributed under the terms and conditions of the Creative Commons Attribution (CC BY) license (https://creativecommons.org/licenses/by/4.0/).
