Article

Application of a Fluorescence-Based Instrument Prototype for Chlorophyll Measurements and Its Utility in an Herbicide Algal Ecotoxicity Assay

1
Agro-Environmental Research Centre, Institute of Environmental Sciences, Hungarian University of Agriculture and Life Sciences, Herman O. út 15, H-1022 Budapest, Hungary
2
Limnology Research Group, Center for Natural Science, University of Pannonia, Egyetem u. 10, H-8200 Veszprém, Hungary
3
Department of Atomic Physics, Institute of Physics, Budapest University of Technology and Economics, Műegyetem rkp. 3., H-1111 Budapest, Hungary
4
Optimal Optik Ltd., Dayka Gábor u. 6/B, H-1118 Budapest, Hungary
5
Limnoecology Research Group, ELKH-PE, Egyetem u. 10, H-8200 Veszprém, Hungary
6
Agrotechnology National Laboratory, Institute of Environmental Sciences, Hungarian University of Agriculture and Life Sciences, Páter K. u. 1., H-2100 Gödöllő, Hungary
*
Author to whom correspondence should be addressed.
Water 2023, 15(10), 1866; https://doi.org/10.3390/w15101866
Submission received: 24 February 2023 / Revised: 27 April 2023 / Accepted: 11 May 2023 / Published: 15 May 2023
(This article belongs to the Special Issue Water Quality Assessment—Methods and Surveys)

Abstract

:
Project Aquafluosense was designed to develop prototypes for a modular fluorescence-based instrumental setup for in situ measurement of major water quality parameters. A fluorometer was developed for algal density estimation based on the fluorescent excitation of chlorophyll. The appropriate type of sample holder microplate was determined, along with the need for dark acclimation, prior to the measurements during the instrument’s development. Model species of green (Raphidocelis subcapitata) and blue-green alga (Microcystis aeruginosa) were applied in forms of pure monocultures and their mixtures, and improved analytical limits of detection were achieved (3.70 × 10³ cell/mL and 1.13 × 10⁵ for R. subcapitata and M. aeruginosa, respectively). The fluorescence-based determination of algal density was validated by conventional methods, such as cell counting in a Bürker chamber, optical density measurement, and chlorophyll extraction with ethanol. The signals obtained by the fluorometer correlated well with the conventional methods. Pearson r coefficients (applied where the correlation was linear) were ≥0.988 and Spearman ρ coefficients (applied where the correlation was not linear) were >0.976, indicating a strong and positive correlation. The applicability of the developed fluorometer was demonstrated in a growth inhibition ecotoxicity assay on R. subcapitata using the herbicide active ingredient isoxaflutole. During the assay, light intensity (continuous, 104.9 ± 14.9 µE/m2/s), temperature (22 ± 2 °C), pH of algal media (pH = 6–7 for Zehnder and Allen media, as well), and intensity of stirring (continuous, 100 rpm) were controlled. The results indicated that the FluoroMeter Module is applicable for screening algal toxicity: the observed ratio of fluorescence decrease determined by fluorescence induction provided significantly lower toxicity values (EC50: 0.015 ± 0.001 µg/mL) compared to values determined by the optical density (EC50: 0.034 ± 0.004 µg/mL) and chlorophyll a content (EC50: 0.033 ± 0.000 µg/mL).

Graphical Abstract

1. Introduction

Among chemical substances of anthropogenic origin, pesticides used in chemical plant protection represent relevant environmental loads since their residues, decomposition products, and metabolites can easily enter natural water systems via surface run-off, leaching, and drifting of foliar spray [1,2,3]. Along with pesticides, fertilizers as agrochemical pollutants trigger impacts on the aquatic environment through the leaching of nitrogen compounds and soil erosion of adsorbed phosphates. Due to this artificial nutrient enrichment (eutrophication) associated with anthropogenic activities, many algae can form water blooms (harmful algal blooms, HABs) and can be considered as natural organic matter (NOM) in aquatic ecosystems, causing an array of serious problems worldwide [4,5,6]. Among others, algal blooms can disrupt aquatic ecological processes, properties, and ecosystem services, such as compromising water utility through the production of taints, metabolites, and toxins. Consequently, the application of plant protection products and fertilizers can lead to degraded water quality and health problems both for animals and humans, and may pose hazards to drinking water bases as well [7,8,9]. Therefore, the quality and the ecological status of natural water bodies, as well as their utilization potential, are highly affected by the composition and quantity of algal biomass and by the presence of harmful toxins produced by cyanobacterial taxa [10]. Thus, continuous qualitative and quantitative monitoring activities of algae communities are essential in water quality management.
Numerous techniques are available for the detection and estimation of algal biomass. The most frequently used methods are based on the determination of the algal cell count using light microscopes and counting chambers (e.g., Bürker counting chamber), electronic particle counters, or flow cytometers. However, the estimation of algal biomass can also be performed by measuring the dry weight, optical density, or chlorophyll a content, and other main photosynthetic pigment content in algae cells [11,12,13]. The routine and most conventional identification methods of individual algal cells and species by microscopic cell counting are quite time-consuming and require a high level of knowledge in taxonomy. The most accurate methods of species identification are DNA barcoding and phylogenetic analysis; however, these are currently under development and are not yet widespread due to their high cost and equipment requirements [14,15]. Flow cytometry is faster due to its automated counting process compared to conventional microscopy, and further useful information (e.g., DNA content, cell volume, lipid concentration) can be obtained from the analysis. However, such methods are costly and signals can be interfered with by suspended detritus and other particles [11,13]. The estimation of algal biomass based on the direct weighing of the dry algal mass is a more time-consuming standard method, and the accuracy highly depends on the accuracy of weighing, especially in case of a smaller sample size. Moreover, the dry matter content of the cells within and among algae populations is highly variable [16,17]. The use of optical density for the estimation of algal biomass is simple, economical, accurate, and reliable. Unfortunately, it is insensitive at lower algal cell densities, and optical density can be affected by the presence of inorganic solids and bacteria [13].
Chlorophylls, responsible for photosynthesis, are the primary source of endogenous fluorescence in algae, and several in vivo methods based on the detection of chlorophyll a fluorescence have been developed in spectral [18,19,20,21] or time-resolved [22] setups for cost-effective and fast in situ determination of both algal biomass and community composition. The technique is often used for monitoring the effects of herbicides on the photosynthetic process [23,24,25] or for the detection of pesticides [26]. During the measurements, after the illumination of the sample, a part of the absorbed light is re-emitted as fluorescence, and the detected chlorophyll a fluorescence can be used for the estimation of algal biomass [21,27]. The photosynthetic efficiency can be characterized as well by the fluorescence induction kinetics with the use of various parameters indicating changes in the process of photosynthesis and the physiological status of algae cultures [21,27]. These techniques are suitable for rapid, non-invasive screening and monitoring of photosynthetic activity and for the estimation of algal biomass in laboratory and field studies. They are also able to rapidly indicate the occurrence of adverse phytotoxic effects. However, the efficiency of these methods in terms of diversity is contested [20], and the interpretation of the data is quite difficult because the process of photosynthesis can be related to the alteration of the physiological status, cultivation conditions, and growth of algal cultures for each strain and cultivation system [28].
Aquatic organisms are particularly exposed to the harmful effects of water pollutants, as their contact with aquatic xenobiotics is unavoidable in water. Algae, including cyanobacteria, play an essential role in the aquatic food webs and nutrient transport processes [29,30]. Phototrophic algae communities significantly contribute to the primary production of oxygen and biomass; therefore, any adverse effects on their habitat or on the process of photosynthesis can result in further potential alterations on higher trophic levels [31]. Raphidocelis subcapitata is a widely used algal species for investigating the toxic effects of pesticides [32,33,34], and is also considered a reference species recommended by OECD [12].
Herbicides are specifically hazardous to photoautotrophic algae due to their efficiency and mode of action, and their effect is often detected on the basis of the direct or indirect disruption of the photosynthetic activity [35,36,37]. Isoxaflutole is the active ingredient of several commercially available, pre-emergent, systemic soil-applied herbicide formulations that are widely used to control a wide range of broadleaf and grass weeds, especially in corn and sugar cane crops [38]. It is very effective against weeds that are resistant to other classes of herbicide active ingredients, such as atrazine or glyphosate [39]. Isoxaflutole is systemic in plants; it is mostly absorbed through the leaves and roots, and then it is translocated within the plant. Upon plant uptake, it is rapidly hydrolyzed to its biologically active diketonitrile derivative, blocking carotenoid biosynthesis by competitive inhibition of 4-hydroxyphenylpyruvate dioxygenase (HPPD) activity within plants (including algae) [39,40]. As a result of surface and/or subsurface runoff from agricultural fields, isoxaflutole may appear in aquatic environments. Isoxaflutole and its metabolites are very mobile in soil [41]. The water solubility of isoxaflutole is 6.2 µg/mL (20 °C), while its degradation half-life (DT50) in water ranges between 3.2 h and 11 days depending on temperature and pH [38], but its substantially (52-fold) more water-soluble diketonitrile metabolite is stable to hydrolysis [42], and isoxaflutole, along with its diketonitrile and benzoic acid metabolites, has been detected in surface waters [43,44] and classified as a persistent water pollutant [45] via its metabolites, with particular potential to contaminate shallow groundwater. The water contamination potential increases with increasing application rates of isoxaflutole (see below).
Although the herbicide effect of isoxaflutole was identified in 1991, it is still considered a relatively novel active ingredient on the herbicide market, and little is known about its potential side effects on non-target organisms, especially regarding ecotoxicity [41,46]. The order of species sensitivity has been specified as vascular plants (Tracheophyta) > diatom algae (Bacillariophyta) > Cyanobacteria > green algae (Chlorophyta) > chordates (Chordata) > arthropods (Arthropoda) [41]. Algal toxicity studies performed on green algae (Chlamydomonas reinhardtii) showed immense tocopherol loss in algal cells even upon short exposures to isoxaflutole under high light illumination [47]. High tolerance of diatoms to the effects of isoxaflutole was observed, presumably due to the presence of fucoxanthin in their plastids [48]. Based on data available in 2016, the endocrine-disrupting potential of isoxaflutole was not identified, but it was classified in the categories “toxic to reproduction category 2” and “carcinogenic category 2” by the European Food Safety Authority, while it showed low toxicity to soil-borne and aquatic organisms [49]. Due to its potential toxicity, isoxaflutole could be approved by the U.S. Environmental Protection Agency only with severe limitations, as a “restricted-use pesticide” (applicators must receive special training to use it). Despite this, it has reached a prominent position in the U.S. herbicide market with an application rate of 270 tons in 2017 [50]. Its application volume will further grow with the introduction of isoxaflutole-tolerant genetically modified crops, for which the U.S. Environmental Protection Agency expanded the registration of the active ingredient in 2020 [51].
The aim of this study was to develop an instrument for estimating algal density and composition based on induced chlorophyll a fluorescence with higher efficiency and sensitivity compared to the currently available instruments, within the framework of Project Aquafluosense (NVKP_16-1-2016-0049). In addition to developing the instrument, the present work aimed to compare the applicability and efficiency of the developed prototype and process to commonly used methods. During our comparative studies, algal biomass was determined by cell count using a Bürker counting chamber, and expressed through additional surrogate parameters, including chlorophyll a content, optical density, and the peak level of chlorophyll a fluorescence emitted by illuminated algae cells after dark acclimation. We also determined the phytotoxic effects of isoxaflutole on Raphidocelis subcapitata and compared using the developed prototype while monitoring the degradation of the active ingredient in the water matrix by analytical methods.

2. Materials and Methods

2.1. Microalga Monocultures

Model algae species were obtained from public collections. Green alga Raphidocelis subcapitata, Korshikov (NIVA-CHL1), and blue-green alga Cylindrospermopsis raciborskii, Woloszynska (NIVA-CYA399), were obtained from the alga collection of the Norwegian Institute for Water Research (NIVA). Blue-green alga Microcystis aeruginosa, Kützing (CCAP1450/1); green alga Desmodesmus subspicatus, Hegewald & Schmidt (CCAP276/20); and Scenedesmus bijugus var. obtusiusculus, Schmidt (CCAP 276/25) were provided by the Culture Collection of Algae and Protozoa (CCAP). Allen [52] and Z8 [53] media were used for the batch culture of blue-green and green algae, respectively. Although the name of C. raciborskii has been taxonomically changed to Raphidiopsis raciborskii (Woloszynska) Aguilera et al. [54], we use its original name in this manuscript as it appears in the culture collections. Fresh media were added to the cultures every two weeks and they were maintained at 23 ± 1 °C and illuminated in a 14:10 light/dark period using cool-white fluorescence tubes (15 µmol/m2/s).

2.2. Instrumentation

The plant leaf fluorometer with a dedicated sample holder (e.g., cuvette) or probe for liquid-phase samples is suitable for algae detection (Table 1). Compared to other live sample holders (e.g., FluorPen, Photon Systems Instruments, Drásov, Czech Republic) [55], our instrument is applicable for algae detection in a 96-well microplate; thus, parallel determination of 24 samples was possible. In Project Aquafluosense, we developed a novel instrument, the Dichroic Fluorometer System (DFS), with increased sensitivity and resolution (Figure 1). The advantage of the dichroic setup is that the detection optical path is fully axial with collecting optics optimized for the extended area of a microplate well to maximize the collection efficiency and the detection cross-section of the fluorescence signal and, simultaneously, to limit large angle scattering of the excitation beam within the allowed range of the bandpass filters. The former two parameters are exploited by using large-area photodetectors to increase the sensitivity of the system. The latter is a requirement to exploit the high extinction coefficient of the bandpass filters in their stop bands to realize high dynamic range detection in terms of the chlorophyll a concentration range.
The compatibility of the DFS system with most of the 96-well microplates widespread in analytical practice allows quick measurement. The repeatability of the measurements according to a pre-defined sampling protocol is ensured by the automatic stepping of the motorized heads. The system stability is also considered by keeping both the measurement time and the excitation intensity low for a given set of sample dilutions. Measuring with initially low and subsequently increased excitation well under the saturation level minimizes sample fading, eliminates the need for a long dark acclimation period, and increases the overall range of measurable chlorophyll a concentration. The elimination (or at least minimization) of the dark acclimation period has become necessary to avoid sedimentation, degradation, or reorganization of metabolism to dark respiration reactions.
Both the light source and the bandpass filter can be exchanged independently in each measuring head, allowing a combination of excitation and emission spectral bands optimized for samples with different algal compositions. The instrument was developed partly (motor, optics, and sample holder) at Optimal Optik Ltd. (Budapest, Hungary) and partly (detector, LED driver, and control electronics with firmware code) at the Budapest University of Technology and Economics (Budapest, Hungary). The fluorescence intensity is given in relative fluorescence units (RFUs).
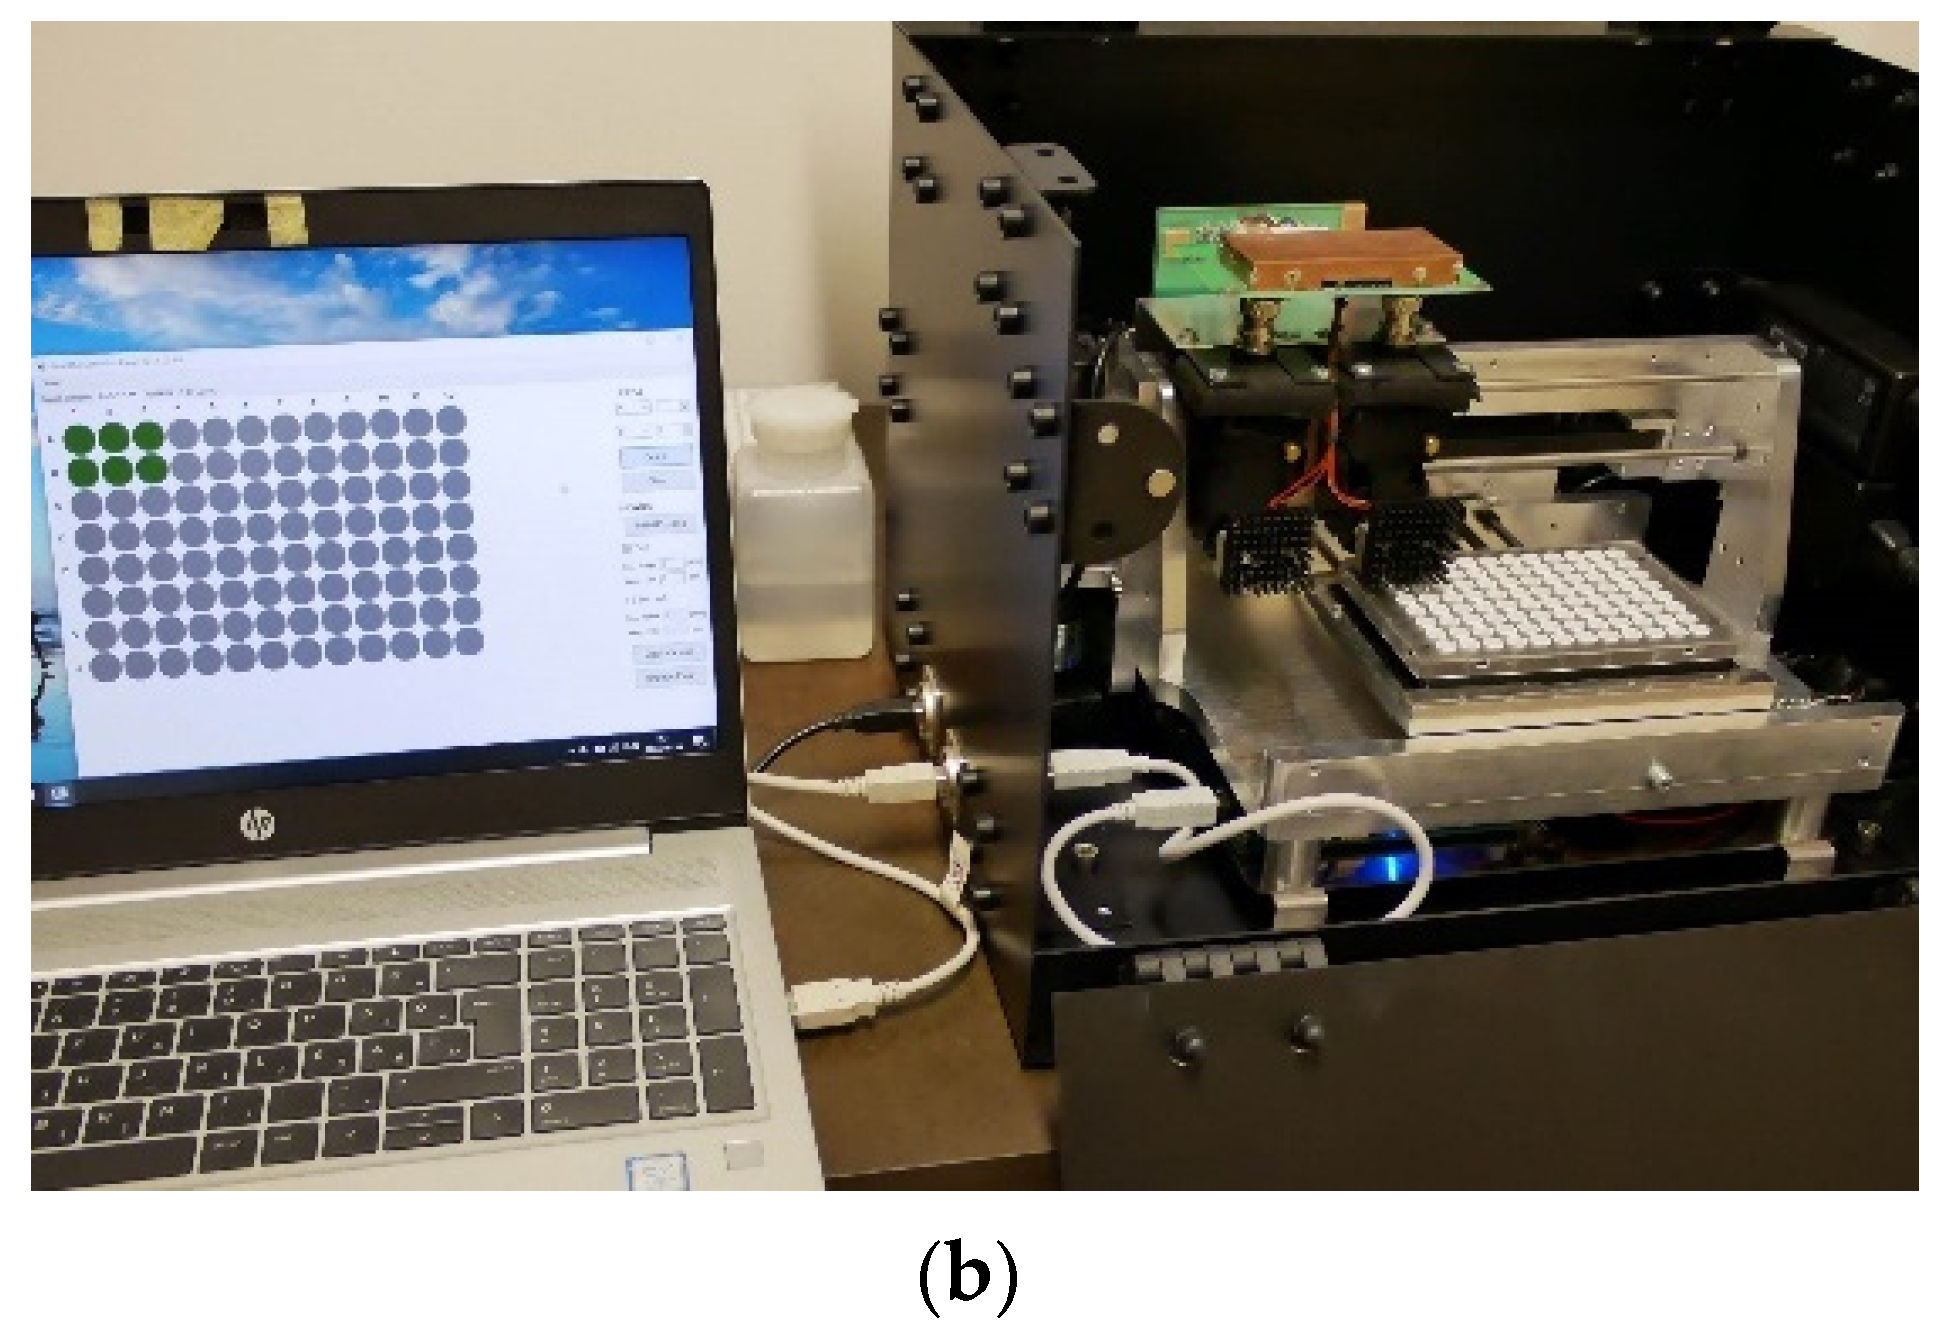
A block scheme of the DFS instrument is shown in Figure 1a. To minimize cross-talk between adjacent microplate wells, a 3D-printed holder frame was designed and applied. The samples were illuminated in a dual-head configuration with different LEDs in each head (LED1: SMB1N-D630-02, peak wavelength: 630 nm, viewing angle: 18°; LED2: SMB1N-470H-02, peak wavelength: 470 nm, viewing angle: 20°, Roithner Lasertechnik, Wien, Austria). LED powers could be digitally set in 256 non-equidistant steps, or 100 linearized percent units up to 2.4 mW (100%) at 630 nm and 2.0 mW (100%) at 470 nm, measured at the top plane of the microplate. The optical power–control curves were calibrated by a FieldMaxII-TO (Coherent, Santa Clara, CA, USA) power meter with an OP-2 VIS sensor headset to the nominal wavelength of each LED. The emitted fluorescence was measured in a dichroic beam path with silicon photodiodes (PIN-25D, OSI Optoelectronics, Hawthorne, CA, USA) having a large active area (d = 27.9 mm). The necessary high-spectral blocking and contrast were achieved by a combination of dichroic (Semrock FF652-Di01, edge: 652 nm, IDEX Health & Science, West Henrietta, NY, USA) and bandpass (DET1: Semrock FF01-716/43-25, peak: 716 nm, width: 43 nm and DET2: Semrock FF01-708/75-25, peak: 708 nm, width: 75 nm) optical filters in the emission path of the heads with LED1: 630 nm and LED2: 470 nm, respectively. An aperture with a diameter of 2 mm confined the excitation beam within the microplate well, whereas the aperture with a diameter of 3.8 mm in the emission path limited the incident angle on the bandpass filter to within the allowed range of ±5°. The photodetector signal was coupled to a 2-stage amplifier unit (1st stage: OPA129 electrometer preamplifier, Texas Instruments, Dallas, TX, USA; 2nd stage: AD620 instrumentation amplifier, Analog Devices, Cambridge, MA, USA) and then fed to a 12-bit, 4-channel simultaneous sampling analog-to-digital converter (ADC, AD7864-2 with 0 V to +5 V unipolar input range, Analog Devices), yielding 4095 resolvable RFUs. The gain and offset of the 2nd stage and the LED optical power were controlled by 256-stage (8-bit) digital potentiometers. The instrument was equipped with stepping motors to move both detector heads over the 96-well microplates, which provided fast and effective determination of individual RFUs in each microplate well. The DFS can be utilized as a benchtop system (Figure 1b). The system can be accessed through its embedded microcontroller (Arduino Nano) and motor-controller by the user control and acquisition software running in a Windows 10 environment on a computer with USB 2.0 connectivity.
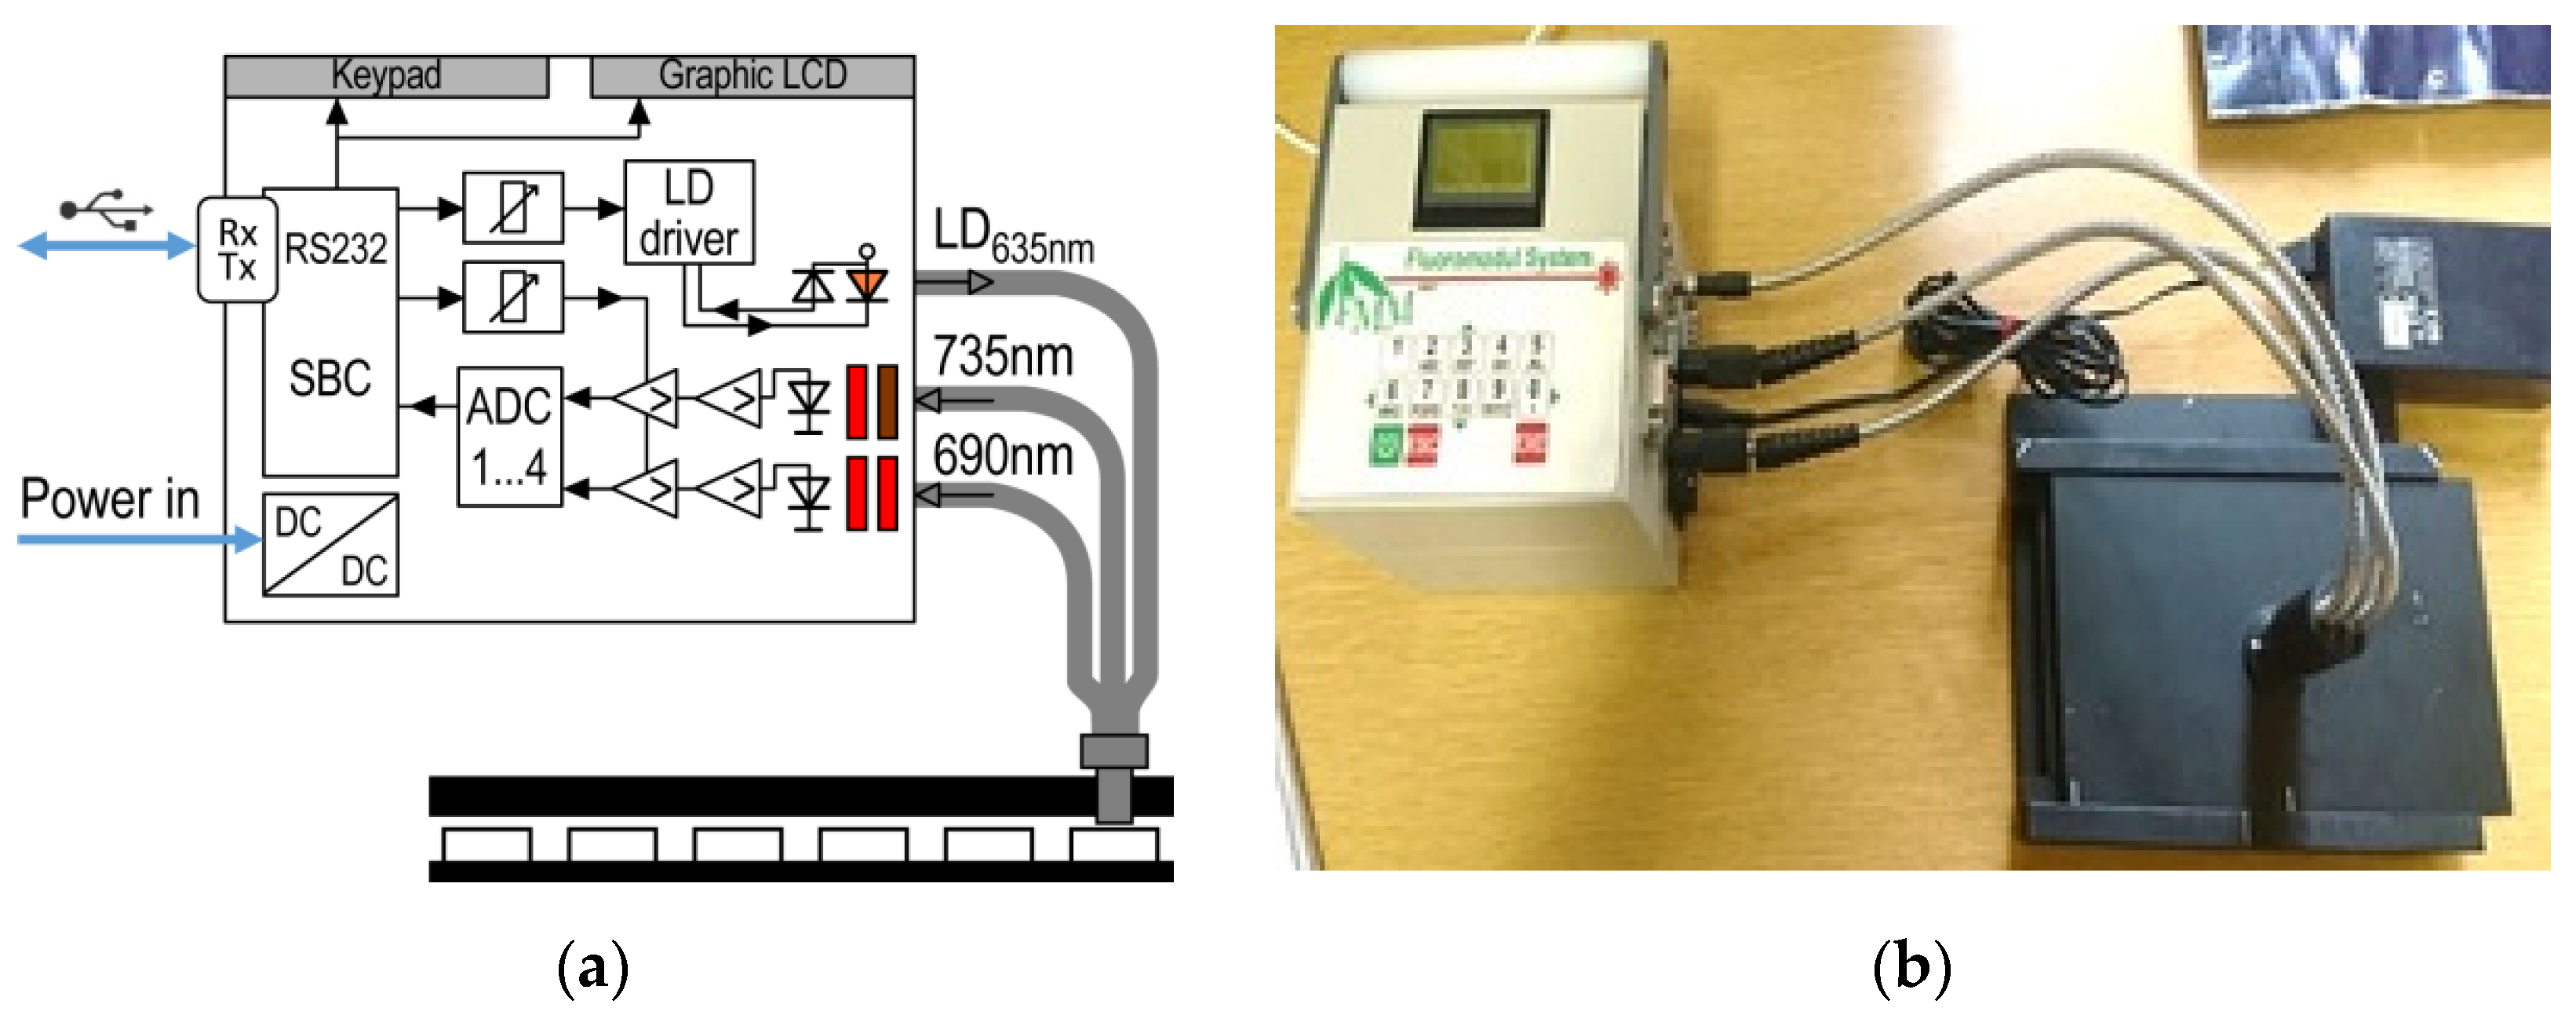
The FluoroMeter Module (FMM) is a modified version of a plant leaf fluorometer extensively described in [27] and capable of measuring the excitation kinetics of chlorophyll a fluorescence induction [56] besides the traditional Kautsky induction kinetics [57,58,59]. The latter was used throughout the experiments and the kinetic curves were detected simultaneously at the two maxima of the chlorophyll a fluorescence (at the 690 nm red and 735 nm far-red bands) upon continuous excitation with no saturation pulses. The FMM was also equipped with an apparatus capable of holding standard-size 96-well microplates and allowing manual stepping among the wells. A block scheme and the photograph of the FMM instrument are shown in Figure 2a,b, respectively. As an actinic light source, a 635 nm laser diode was used, having a 256-step digital optical power adjustment with a full-range (0–100%) linear response. The mixed optical fiber bundle guided the laser beam onto the sample space (individual wells of the microplate) and the fluorescence signals back to the detectors. The ends of all three branches were joined together to form a fiber endface positioned into the sample holder as close as 1 mm to the sample surface. The other ends of the three fiber arms were mounted to the instrument body. The central laser guiding arm with a core diameter of 2 mm delivered a maximum of 5.6 mW (100%) optical power. Around the central fiber, fibers with a diameter of 0.5 mm were positioned in a mixed fashion at the fiber endface for the two detection wavelengths. A combination of interference filters (NT43-089 for 690 nm and NT43-091 for 730 nm, full width at half maximum of 10 nm each; Edmund Optics, Barnington, NJ, USA) and 665 nm cut-off filters (RG665, Edmund Optics) was used to separate the detection wavelengths and eliminate the scattered illumination light. Low-noise PIN photodetectors (SD-200-14-21-241, Laser Components, Olching, Germany) with electrometer preamplifiers (OPA129, Texas Instruments) were applied for photocurrent-to-voltage conversion. The signals amplified to the appropriate level by instrumentation amplifiers (AD620, Analog Devices) were digitized by a 12-bit ADC (AD7864-2, Analog Devices) yielding again 4095 RFUs. The gain and offset of the second stage and the LED optical power were controlled by 256-stage (8-bit) digital potentiometers using the keypad and display module of the instrument serving as the user interface. A single-board computer (CMD16686GX, Real Time Devices, Wickwar, UK) was embedded in the central processing unit running the firmware and storing the recorded data. Data transfers were performed directly through a serial port or via a serial-to-USB interface cable. Technical parameters of the two instrument prototypes (DFS and FMM) applied in this study and other commercially available fluorometers are shown in Table 1.
Both instruments are appropriate for measurement on a 96-well microplate, which results in a more effective determination procedure, as it is possible to evaluate 24 samples in parallel. For avoiding the well-to-well cross-talk, samples are placed in a well surrounded by empty wells.

2.3. Optimization of the Measurement Parameters

2.3.1. Reflection

The color of the microplates can have an important effect on the detected fluorescence signal. In order to select the appropriate microplate, the phenomenon of reflection was measured in algal media solutions (Allen and Z8) and in distilled water by Channel 1 (excitation wavelength: 630 nm, detection wavelength: 716 nm) of the Dichroic Fluorometer System (DFS). Fluorescence intensity was determined in relative fluorescence units (RFUs). Fluorescence signals using microplates with two different colors, black (Microfluor 2 Black, Thermo Electron Corporation, Waltham, MA, USA) and white (Microfluor 2 White, Thermo Electron Corporation, Waltham, MA, USA), were measured and compared to each other. Light intensity was continuously increased at regular intervals during the measurements.

2.3.2. Dark Acclimation

The necessity of dark acclimation before excitation was investigated. A twofold dilution series of seven concentrations was prepared from the monoculture of R. subcapitata algae diluted with Z8 medium. After that, 3 × 250 µL of each dilution of R. subcapitata was pipetted into 3 wells of the microplate and then placed in the instrument and acclimated in the dark. After 10 min, samples were excited and the fluorescent signal was measured. Fluorescence intensity was determined in relative fluorescence units (RFUs). The same procedure was repeated without dark acclimation and the results were compared. The whole experiment was repeated 3 times.

2.4. Comparison with Conventional Methods Most Commonly Applied for Algal Biomass Estimation

A threefold dilution series of six concentrations of the blue-green M. aeruginosa and the green R. subcapitata was used for quantitative measurements. Optical density, chlorophyll content, and cell concentration with a Bürker chamber were measured for each concentration, together with the determination of the fluorescence signal intensities using both the FMM and the DFS instrument prototypes. Fluorescence intensity was determined in relative fluorescence units (RFUs). Optical densities were measured at 750 nm with a CAM-Spec.M33 UV–visible spectrophotometer (Nikon Corp., Tokyo, Japan). Chlorophyll a was extracted and measured following the method of Wetzel et al. [59]. For M. aeruginosa, cell counting is difficult; however, the biases of cell estimations are well studied and summarized [60]. According to that study, cell number estimation of cyanobacteria, including their unicellular, filamentous as well as colonial forms, is advised to be involved as an integral part of water quality alert systems; thus, this cell density information cannot be omitted from analyses. For their estimation, the method of cell count is commonly used and even recommended [61,62]. While measuring the cell sizes and counting the numbers of unicellular or filamentous forms can be accurate and easily accomplished, the estimation of cell numbers in colonial forms (e.g., coenobial Microcystis) has an unknown bias. However, the study of T-Krasznai et al. [63] concluded that the method of cell number estimation has slightly low accuracy but high precision, which can be further enhanced by the experience of the researcher performing the calculation. On the basis of this research, those approaches can be proposed for monitoring purposes that focus directly on the estimation of cell count within the colonies. Although potential bias can appear in cell counting of M. aeruginosa, as it is a colonial species [63], the culture applied in this study did not form colonies; thus, after careful homogenization, algal samples were placed in a Bürker chamber, and cell numbers were counted using a Nikon Labophot 2 microscope at 20× and 40× magnifications. Furthermore, the limit of detection (LOD) and lower limit of quantification (LLOQ) values of the fluorimeter instruments were determined as the minimal signal levels exceeding the background by 3-fold and 5-fold values of the standard deviation of the background, respectively. The upper limit of quantification (ULOQ) was determined for DFS as the upper threshold of the instrument. FMM was applied in the ecotoxicity assay, where the initial algal concentration is defined in the OECD guideline and the final concentration is determined according to the conditions of the assay. In the assays, the highest concentration was detected in the untreated control, and this concentration did not reach the upper threshold of the FMM instrument. The results obtained by the different abundance methods were correlated with each other by linear fitting methods and by Pearson or Spearman correlation.

2.5. Application of Dichroic Fluorometer System on Surface Water

Algae monocultures of R. subcapitata and M. aeruginosa were diluted with water from three natural water bodies in order to determine the presence of other compounds in natural waters that can potentially interfere with the fluorescent signal of the algae. The three sampling sites included two lakes, Lake Balaton (N 46.953349, E 17.894280) at Balatonfüred and a fishing pond close to Nagybivalyos–S2 (N 47.178651, E 18.169382) near Várpalota, as well as the Danube River (N 47.476750, E 19.062470) in Budapest. Water quality is a key issue for all three sampling sites, but the levels of microalgae are seasonal and low in Lake Balaton and the Danube River, while algae are more abundant in the fishing pond. In contrast, the levels of organic microcontaminants show an opposite pattern among these surface water sites [64]. Samples were taken in mid-December 2020. Algal nutrient solutions (Z8 for R. subcapitata and Allen for M. aeruginosa) were used as blind samples during the measurements. Due to the winter sampling, the water samples are expected to contain very low amounts of algae, except for the eutrophic fishing pond. Algae species were determined with a Zeiss Axiovert 100 inverted microscope (Carl Zeiss AG, Oberkochen, Germany) using 100× magnification, and then biomass was calculated on the basis of international standards [65].

2.6. Examination of Algae Group Ratios by Dichroic Fluorometer System

A dilution series was prepared from a stock culture of R. subcapitata green algae and M. aeruginosa blue-green algae. The R. subcapitata and M. aeruginosa cell concentrations in the stock cultures were 2.99 × 10⁶ and 3.17 × 10⁷ cells/mL, respectively. These cell numbers were equivalent to 3.45 × 10² and 2.59 × 10² µg/mL for R. subcapitata and M. aeruginosa, respectively. Dilution series for both algae were prepared between 0% and 100% with 10% increments by diluting with clean algal nutrient solution. Different concentrations of the two algae cultures were systematically combined, resulting in a total of 121 samples. The fluorescence signals of the combinations were then visualized on a contour plot generated with the R statistical software [66].

2.7. Application of FluoroMeter Module in Ecotoxicology Tests

2.7.1. Degradation of Herbicide Active Ingredient Isoxaflutole

Substance losses of the herbicide active ingredient isoxaflutole were determined in distilled water and in Z8 medium applied to maintain algal monocultures. Analytical measurements were performed by high-performance liquid chromatography with ultraviolet detection (HPLC-UV) (Youngin YL9100 HPLC equipped with a YL9150 autosampler) (Youngin Chromass, Anyang-si, Korea). A mixture of acetonitrile and water (70:30) was used as an eluent at a flow rate of 1 mL/min. Isoxaflutole was separated on a PerfectSil 100 ODS-3 column (MZ-Analysentechnik GmbH, Mainz, Germany) (150 × 4.6 mm i.d., 5 µm) at 35 °C, and UV detector signals were recorded at λ = 220 nm. The concentration of the active ingredient was determined in samples collected in 0, 9, 24, 48, 72, 96, 120, 168, 216, 264, 336, 384, and 504 h after the beginning of the test setup with an initial isoxaflutole concentration of 5 µg/mL. Samples were collected in triplicates.

2.7.2. Ecotoxicity Test

Ecotoxicity tests were performed to investigate the possible harmful effect of the herbicide active ingredient isoxaflutole (CAS 141112-29-0) on green, unicellular, floating alga species. The active ingredient was obtained from Sigma-Aldrich and was of ≥97.5% purity.
Algal growth inhibition tests were performed according to OECD Guideline 201 [12]. During the assay, light intensity (continuous, 104.9 ± 14.9 µE/m2/s), temperature (22 ± 2 °C), pH of algal media (pH = 6–7 for Zehnder and Allen media, as well), and intensity of stirring (continuous, 100 rpm) were controlled. The experiments were performed on the R. subcapitata monocultures in a shaking incubator (Witeg WIS-10RL, Wertheim, Germany) at 23 °C and 100 rpm under continuous illumination (2500 lux). The compounds to be tested were serially diluted, and three replicates were used for each concentration. Alga density and chlorophyll a content were determined via optical density measurements by a spectrophotometer (UV/VIS Camspec single beam M330, Leeds, U.K.), whereas the proxy of quantum efficiency of the algae photosystem PSII (Fv*/Fp) and changes in the observed ratio of fluorescence decrease (Rfd*) were determined via induced fluorescence by FMM. Here, Fp refers to the peak value of the fluorescence induction curve using the FMM module and Fv* is the variable fluorescence in terms of Fp. Basically, the parameter of Fv/Fm describes whether or not plant stress affects photosystem II in a dark-acclimated state, where Fm is the maximum chlorophyll fluorescence at a saturating radiation pulse in the dark-acclimated state [67,68]. As the maximum actinic level available with the FMM will not saturate PSII, Fp is used to distinguish it from Fm, the maximum fluorescence value obtainable for a fully saturating continuous excitation [27,67]. Rfd* is equal to Fd/Fs, where Fs is the observed steady-state fluorescence and Fd is the fluorescence decreasing from Fp to Fs [67]. Descriptions of fluorescence quantities are summarized in Table 2
Circumstances (pH, temperature, light intensity, etc.) of the ecotoxicity assay were set up according to the Guideline; thus, measurements by spectrophotometer or FMM were performed under the same conditions. Three individual experiments on isoxaflutole were performed, and untreated control and alga suspensions exposed to different concentrations of the active ingredient were evaluated in triplicates in each experiment.

2.8. Statistical Evaluation

Statistical analyses were conducted using the R Statistical program 4.2.1. (R Development Core Team, Vienna, Austria). During the comparison of the optimized fluorescence measurement methods performed by the two instrument prototypes (FMM and DFS) with the other selected methods (cell counting, chlorophyll-a extraction, and determination of OD) for the determination of algae cell densities, the results obtained by the different methods were correlated with each other by linear and non-linear fitting methods and the correlation coefficients were determined by correlation tests. For the evaluation of the associations between the measured values, Pearson and Spearman correlation tests were applied according to the linear dependence between the values at the significance level of 0.050. The parametric Pearson correlation tests measure the linear dependence between the values, but before the tests, the normality of the data was checked by Shapiro–Wilk tests. Fast-induced chlorophyll fluorescence data in plants are known not to follow Gaussian distribution [69]. Thus, during correlation analysis, if the dependence was non-linear and the data were not normally distributed, Spearman’s rank correlation tests were applied. The correlation between the values was characterized (strength and direction of the correlation) by Pearson correlation coefficients (r) or Spearman ρ.
Based on the results of the ecotoxicity tests, the differences between the EC50 values determined by OD, chlorophyll-a content, and Rfd* fluorescence parameters were evaluated with the use of general linear models. Before statistical analysis, the normality of the data and the homogeneity of variance were also checked by Shapiro–Wilk and Levene’s or Bartlett’s tests at the significance level of 0.050. Moreover, the applicability of the fitted model was checked in each case with diagnostic plots (QQ plot, residual variances, Cook’s distance plot). Tukey’s honest significant difference (HSD) tests were performed as post hoc analyses to assess the significant differences between groups.

3. Results and Discussion

3.1. Results for the Preliminary Experiments

The effects of the microplates with different colors (black and white) on the fluorescence signal are shown in Figure 3a. Fluorescence intensity was determined in relative fluorescence units (RFUs) by Channel 1 (excitation wavelength: 630 nm, detection wavelength: 716 nm) of the Dichroic Fluorometer System (DFS). As the light intensity gradually increased over time, the signal intensity in parallel increased during measurements using white microplates. In contrast, the signal did not increase with time as the light intensity increased, but remained constant on the black microplate. This is probably due to the black microplate absorbing light, while the white plate produces a well-detectable signal. Based on these results, white microplates were chosen to be used for the following analyses. White microplates have a much lower light loss, than black plates and are applied in alga quantification studies [70,71].
The correlation between signals of R. subcapitata samples obtained with and without dark acclimation is shown in Figure 3b. As experiments were performed in triplicates, for better comparison of data obtained from the three individual experiments, the mean ± standard deviation of normalized (RFU/RFUMAX) fluorescence intensity values are presented in Figure 4b. RFUMAX refers to the fluorescence intensity detected for the algal suspension with the highest cell density. The two datasets are demonstrated as being equivalent to each other based on the levels of the signals (relative to the corresponding maximal signals) and because they are strongly correlated with each other based on their coefficients of determination (r2) not differing significantly from 1. Based on these findings, it is concluded that the use of dark acclimation has no effect on the magnitude of the fluorescence signal obtained. Thus, no dark acclimation was applied prior to the experiment. It can be explained by the characteristic of instruments, i.e., they operate with continuous excitation with no saturation pulses. The whole measurement process shortens and the sedimentation of algae in microplate wells does not result in the instability of analytical signals. Detection stability can be determined based on the Fo [72], and can be decreased by continuous stirring of samples. Endpoint-induced fluorescence-based algal density detection methods offer the advantages of high detection sensitivity (due to highly specific signal generation) and good detection stability (due to the endpoint detection mode). Moreover, in this study, we applied both fluorescence-based instruments for characterizing the PSII photosystem of algal species in a given time (e.g., as endpoint in ecotoxicity assay), and not for continuously monitoring the system status over extended periods; thus, detection stability has not been an uncertainty factor.

3.2. Correlation between the Different Methods, Determination of LOD, LLOQ, and ULOQ

The results obtained with different abundance measurement methods on the same samples were compared with the results of the two instrument prototypes, FMM and DFS. The determined correlation coefficients (Pearson r coefficient and Spearman ρ), as well as the determined coefficients of determination (r2), are shown in Table 3. The results are presented separately for monocultures of the two algal species, a green (R. subcapitata) and a blue-green alga (M. aeruginosa). Generally, the determined r2 values were ≥0.96. However, during the comparison of the cell counting and the fluorescence detection of Channel 2 of DFS, a lower r2 (0.858) was detected.
During the evaluation of the correlations between the measured values, generally, a linear correlation was detected between the values, and the determined Pearson r coefficients were ≥0.988, indicating a strong and positive correlation between the values detected by the selected measurement methods (Table 3) (p ≤ 0.002). Possibly due to reabsorption at high culture density, the non-linear correlation between the fluorescence detection by the channels of DFS and the measured OD values and chlorophyll-a contents in M. aeruginosa was determined; thus, the correlation was characterized by Spearman ρ coefficients in these cases. The determined ρ coefficients (ρ = 1) were higher for Channel 1 compared to Channel 2 (ρ = 0.976) (p < 0.001), but the determined ρ values also indicate a very strong and positive correlation between the values. Correlation among determination by fluorescence and by other conventional methods for biomass detection is documented [73,74,75]; however, in this study, we applied correlation as a validation of the results obtained by FMM or DFS for algal biomass.
The LOD, LLOQ, and ULOQ values calculated for the two prototypes are shown in Table 4. Based on the correlations with the cell counting method, the values are interpreted in cells per milliliter based on the R. subcapitata and M. aeruginosa species. LOD and LLOQ data showed reduced values for the DFS module compared to the FMM (Table 4).

3.3. Results of Fluorescence Measurements on Green and Blue-Green Algae by Dichroic Fluorometer System

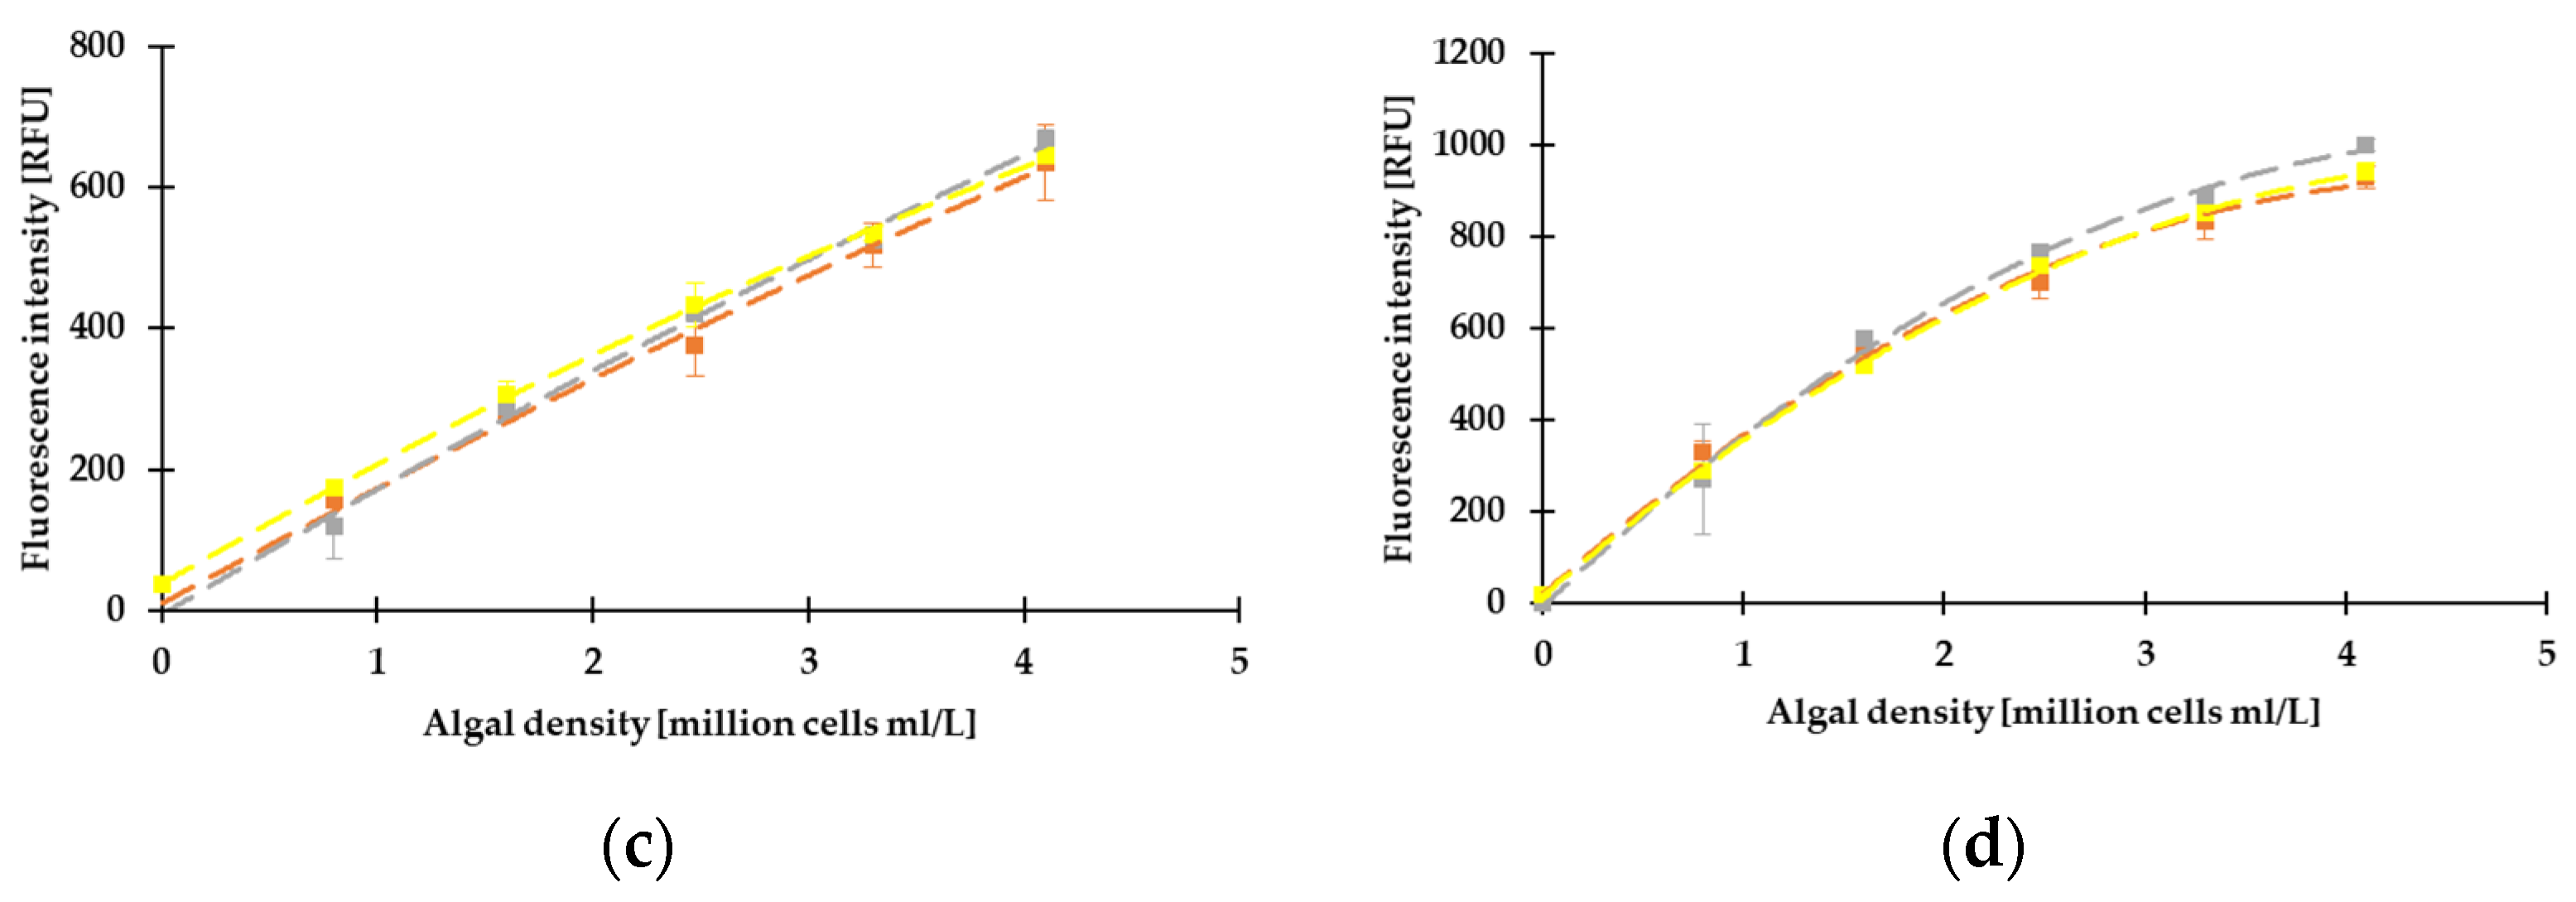
In the winter, the algal biomass of water bodies is low, which was further confirmed by our measurements. The detected fluorescence signals of Lake Balaton and the Danube River were similar to the signal of the nutrient medium that served as the background. The fluorescence signals detected on Channel 1 (excitation wavelength: 630 nm, detection wavelength: 716 nm) were 29.00 RFU, 30.19 RFU, and 64.35 RFU for Lake Balaton, the Danube River, and the fishing pond, respectively. On Channel 2 (excitation wavelength: 470, detection wavelength: 708 nm), fluorescence signals of 27.00 RFU, 27.99 RFU, and 46.35 RFU were detected for Lake Balaton, the Danube River, and the fishing pond, respectively. Fluorescence signals were 30.85 RFU and 28.85 RFU at Channel 1 and Channel 2, respectively, for the background. Therefore, it can be concluded that no chlorophyll content was measured in the Danube River and Lake Balaton. However, twice the amount of the background was detected in the fishing pond. A higher signal in Channel 1 than in Channel 2 indicated that the proportion of blue-green algae in the water was higher compared to green algae. In the case of M. aeruginosa, higher signals were detected on Channel 1 (Figure 4a) than on Channel 2 (Figure 4b), while R. subcapitata could be detected with both channels (Figure 4c, d). M. aeruginosa and R. subcapitata differ from each other in their pigment compositions and their arrangements, indicating differences in their spectral fluorescence properties, which are utilized by the DFS [76,77,78,79]. Additionally, we found that the dilution of the culture samples with lake and river waters did not show interference with the fluorescence signal.
Microscopic identification of the algal species of the fishing pond (Table 5) indicated, indeed, a higher dominance of blue-green algae present. The cell concentration of the Chlorophyta was 5.24 × 10² cells/mL, while that of the Cyanobacteria was 1.37 × 10⁵ cells/mL. Converting the obtained cell concentrations into biomass based on the volume of the calculated algal species, biomass values of the Chlorophyta and the Cyanobacteria were 808.6 mg/m3 and 8215.7 mg/m3, respectively. Analysis of the microscopy results indicated that the total cell concentration in the fishing pond was 1.53 × 10⁵ cells/mL, which is above the pre-defined LOD and LLOQ levels of the instrument, confirming the elevated fluorescence signal that has been detected.

3.4. Examination of Algae Group Ratios by the Dichroic Fluorometer System

The fluorescence signals of the algal mixtures detected by DFS are shown in Figure 5, where Channel 1 excited at 630 nm and emitted at 708 nm, while Channel 2 excited at 470 nm and emitted at 716 nm. Figure 5a indicates that signal intensity on Channel 1 increased with the increase in the number of blue-green and green algal cells. It shows, however, a stronger increase with the growth of the blue-green algae. With the growth of M. aeruginosa, it reached nearly 1200 RFU, but only around 600 RFU with R. subcapitata. Figure 5b shows that the fluorescence signal did not increase with the increase in M. aeruginosa when R. subcapitata was present at low concentrations. The signal showed a strong increase with increasing concentrations of R. subcapitata cells, reaching a maximum of around 1500 RFU. However, at high M. aeruginosa concentration, the signal showed a weaker increase with the increase in green algal cell concentration. At high R. subcapitata cell concentrations, the fluorescence signal decreased with the parallel increase in M. aeruginosa. Microcystis sp. and R. subcapitata differ from each other in their pigment compositions and arrangements, which indicated differences in their spectral fluorescence properties, which were utilized by the DFS (Figure 5) [18].

3.5. Assessment of the Degradation and Algal Toxicity of a Potential Water-Contaminant Herbicide Active Ingredient by FluoroMeter Module

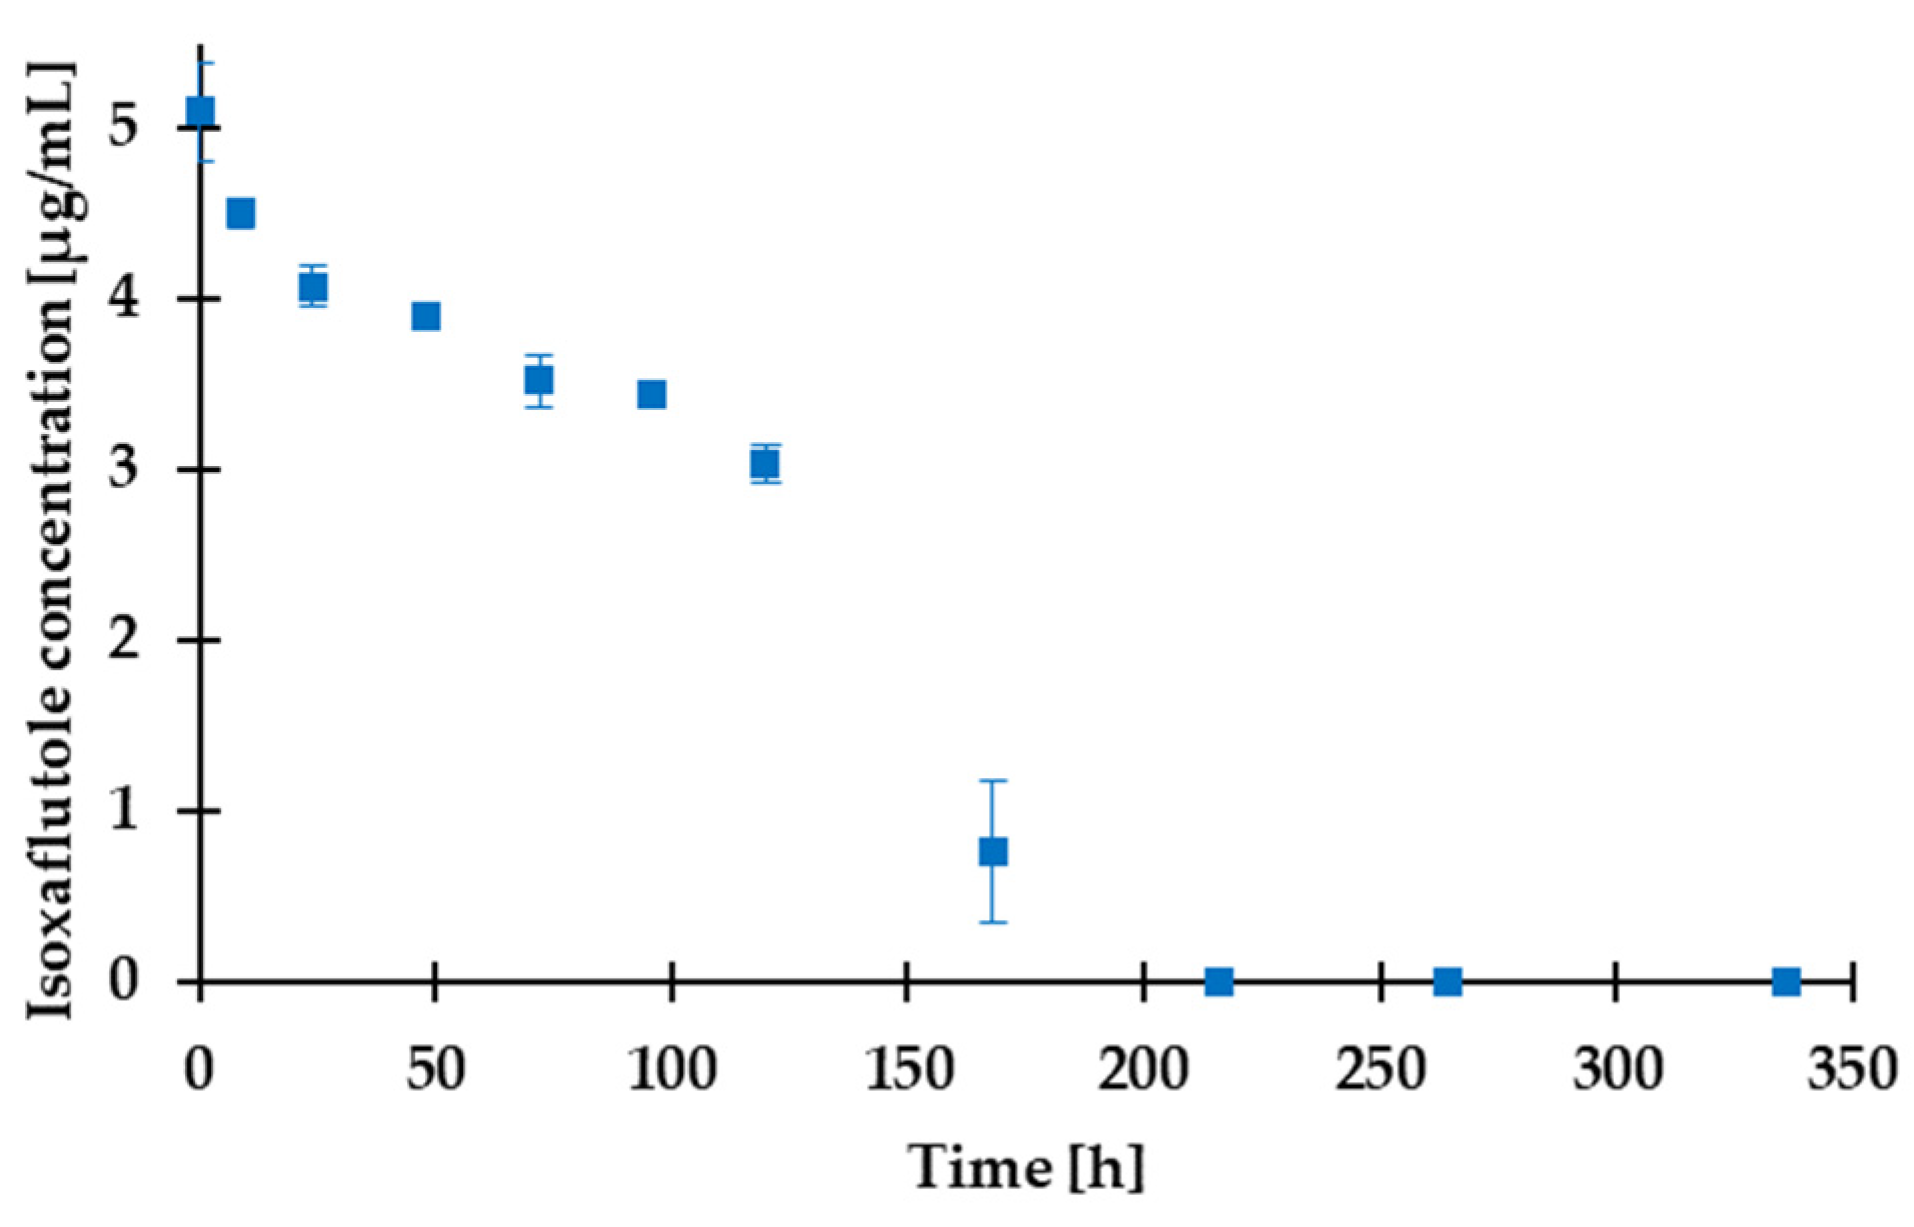
Isoxaflutole is increasingly being used as a replacement for atrazine, a herbicide that was widely used until it was banned in the EU in 2004. In turn, isoxaflutole has been reported as a potential emerging water pollutant both in the U.S. and in the EU [43,44], and it has also been reported for its algal toxicity [48]. To ensure the accuracy of algal toxicity tests, the stability of the compound during the test was verified by determining the differences in the degradation of isoxaflutole in distilled water and Z8 medium, the preferred medium for culturing Cyanobacteria. The results showed that no apparent degradation of isoxaflutole was observed in distilled water within 2 weeks, while the degradation was practically complete within 8–14 days in Z8 medium. Complete degradation of the active ingredient was measured at the 216th hour of the experiment (Figure 6).
The degradation study indicated that 83–87% of the initial amount of isoxaflutole was present in the solution during the first 72 h of the experiment, the overall duration of the ecotoxicity tests. In these assays, the effects of isoxaflutole on the growth of R. subcapitata were determined by measuring optical density and chlorophyll a content in the algal culture medium. No significant differences between EC50 values determined by optical density (EC50 = 0.034 ± 0.0004 µg/mL) and chlorophyll a content (EC50 = 0.033 ± 0.0003 µg/mL) were observed (p = 0.797). The determination of two fluorescence parameters (Fv*/Fp and Rfd*) was also performed in our ecotoxicity experiments. No toxic effect of the isoxaflutole active ingredient was observed on parameter Fv*/Fp: values ranged between 0.856 and 0.976 (including the control), and the results did not show dose-dependence among the exposition of different concentrations of isoxaflutole. Schagerl et al. reported that values of Fv/Fm remained comparable almost over the full range of optical density of Chlorella vulgaris [80,81]. However, a strong dose-dependence was determined for Rfd*, and an EC50 value of 0.015 ± 0.0001 µg/mL was calculated for the active ingredient (Table 6). The determined EC50 based on the measurements of Rfd* was significantly lower compared to the EC50 values by OD (p < 0.001) and by chlorophyll a content (p < 0.001). The parameter Rfd is usually used for biotic and abiotic plant stress detection [82,83], and it is considered to be a good and rapid indicator of the vitality of plants. In many cases, it has already proved to be a very sensitive indicator of metabolic disturbances caused by different types of stress (e.g., salinity [84], nutrient enrichment [85], heavy metals [86]). It is reported to disturb the photochemical reactions in photosystem II, resulting in less efficient photosynthesis [85,86]. In the present study, this parameter was also presented as the most sensitive biomarker for the investigation of the effects of an herbicide. Thus, the results of fluorescence-based characterization of the PSII photosystem prove the importance of investigating different toxicological endpoints in ecotoxicity assays. The results of fluorescence-based characterization of the PSII photosystem prove the importance of investigating different toxicological endpoints in ecotoxicity assays.
The result that isoxaflutole triggers a toxic effect on R. subcapitata green alga species is evident, since it is a herbicide active ingredient and inhibits the enzyme 4-hydroxyphenylpyruvate dioxygenase. However, it has a toxic effect on all green plant organisms, and there is a variation in the sensitivity of aquatic plant organisms to the active substance [87]. In the evaluation of the active substance, the European Food Safety Authority (EFSA) considered an EC50 for R. subcapitata of 1.71 µg/mL, which is 57 times lower toxicity for isoxaflutole than the result of the present study [49]. The advantage of the application of FMM in growth inhibition assays on algal species is dual. On one hand, the photochemical parameter provides a more sensitive endpoint compared to the conventional endpoints determining biomass (optical density, chlorophyll a content, cell number determined by Bürker chamber). On the other hand, the 96-well microplate construction provides a quick evaluation of 24 samples at the same time. As dark acclimation is not required before measurement, the effect of sedimentation of alga in samples on results is negligible.

4. Conclusions

The Aquafluosense Project adapted the setup of an existing plant leaf fluorometer (FluoroMeter Module, FMM) and developed it into the Dichroic Fluorometer System (DFS) instrument prototypes for determining algal biomass by induced fluorescence. The FMM was equipped with a 96-well microplate holder unit and calculated the parameters Fv*/Fp and Rfd* based on kinetics. The FMM was applied in an ecotoxicity assay, where the effects of isoxaflutole on Raphidocelis subcapitata were investigated. EC50 values were determined based on optical density, chlorophyll a content, Fv*/Fp, and Rfd*. It can be concluded that Fv*/Fp is not an appropriate parameter in the ecotoxicity assay, while Rfd* resulted in lower EC50 values than optical density or chlorophyll a content. The DFS developed in this study and under the framework of the Aquafluosense Project resulted in a method that is appropriate for the determination of algal biomass with a limit of detection of 3.70 × 10³ cells/mL. A strong and significant correlation was detected among the results of both instruments applied in this study (FMM and DFS) and the results obtained with different abundance measurement methods (determination of optical density, determination of chlorophyll a content, cell count in the Bürker chamber). The coefficient of determination by linear fitting (r2) ranged from 0.858 to 0.999 and from 0.982 to 0.998 for Microcystis aeruginosa blue-green and R. subcapitata green alga species, respectively.

Author Contributions

Conceptualization, L.K. and A.S.; methodology, E.T., S.K., A.B., L.K., S.L., L.D. and G.S.; software, A.B. and L.D.; validation, D.L., E.T., S.K. and E.L.; investigation, D.L., M.M. and S.K.; writing—original draft preparation, D.L., E.T. and M.M.; writing—review and editing, A.B., L.K., E.L. and A.S.; visualization, L.D., M.M. and A.B.; supervision, A.S.; funding acquisition, L.K. and A.S. All authors have read and agreed to the published version of the manuscript.

Funding

This research was funded by the Hungarian National Research, Development and Innovation Office within the National Competitiveness and Excellence Program, project NVKP_16-1-2016-0049, “In situ, complex water quality monitoring by using direct or immunofluorimetry and plasma spectroscopy” (Aquafluosense 2017–2021), and project 2022-2.1.1-NL-2022-00006, “Development of the Agrotechnology National Laboratory” (Grant agreement NKFIH-3524-1/2022), supported by the National Research, Development and Innovation Fund by the Hungarian Ministry of Culture and Innovation, as well as projects TKP2021-NVA-02 and TKP2021-NVA-22 within the framework of the Thematic Excellence Program 2021, National Defense, National Security Sub-Program.

Institutional Review Board Statement

Not applicable.

Informed Consent Statement

Not applicable.

Data Availability Statement

The data presented in this study are available on request from the corresponding author. The data are not publicly available due to privacy reasons.

Acknowledgments

The authors express their sincere appreciation to Dóra Gabnai for her technical assistance in the ecotoxicity tests, to Attila Csákányi for the mechanical design, and to László Lugosi for the motor control software.

Conflicts of Interest

The authors declare no conflict of interest.

References

  1. Verro, R.; Finizio, A.; Otto, S.; Vighi, M. Predicting Pesticide Environmental Risk in Intensive Agricultural Areas. II: Screening Level Risk Assessment of Complex Mixtures in Surface Waters. Environ. Sci. Technol. 2009, 43, 530–537. [Google Scholar] [CrossRef]
  2. Brock, T.C. Priorities to Improve the Ecological Risk Assessment and Management for Pesticides in Surface Water. Integr. Environ. Assess. Manag. 2013, 9, e64–e74. [Google Scholar] [CrossRef]
  3. Silva, E.; Daam, M.A.; Cerejeira, M.J. Predicting the Aquatic Risk of Realistic Pesticide Mixtures to Species Assemblages in Portuguese River Basins. J. Environ. Sci. 2015, 31, 12–20. [Google Scholar] [CrossRef]
  4. Sellner, K.G.; Doucette, G.J.; Kirkpatrick, G.J. Harmful algal blooms: Causes, impacts and detection. J. Ind. Microbiol. Biotechnol. 2003, 30, 383–406. [Google Scholar] [CrossRef] [PubMed]
  5. Mirnasab, M.A.; Hashemi, H.; Samaei, M.R.; Azhdarpoor, A. Advanced removal of water NOM by Pre-ozonation, Enhanced coagulation and Bio-augmented Granular Activated Carbon. Int. J. Environ. Sci. Technol. 2021, 18, 3143–3152. [Google Scholar] [CrossRef]
  6. Naselli-Flores, L.; Padisák, J. Ecosystem services provided by marine and freshwater phytoplankton. Hydrobiologia 2022, 28, 1–16. [Google Scholar] [CrossRef] [PubMed]
  7. O’Neil, J.M.; Davis, T.W.; Burford, M.A.; Gobler, C.J. The Rise of Harmful Cyanobacteria Blooms: The Potential Roles of Eutrophication and Climate Change. Harmful Algae 2012, 14, 313–334. [Google Scholar] [CrossRef]
  8. Klátyik, S.; Takács, E.; Mörtl, M.; Földi, A.; Trábert, Z.; Ács, É.; Darvas, B.; Székács, A. Dissipation of the Herbicide Active Ingredient Glyphosate in Natural Water Samples in the Presence of Biofilms. Int. J. Environ. Anal. Chem. 2017, 97, 901–921. [Google Scholar] [CrossRef]
  9. Wang, L.; Wang, X.; Jin, X.; Xu, J.; Zhang, H.; Yu, J.; Sun, Q.; Gao, C.; Wang, L. Analysis of Algae Growth Mechanism and Water Bloom Prediction under the Effect of Multi-Affecting Factor. Saudi J. Biol. Sci. 2017, 24, 556–562. [Google Scholar] [CrossRef]
  10. Paerl, H.W.; Otten, T.G. Harmful Cyanobacterial Blooms: Causes, Consequences, and Controls. Microb. Ecol. 2013, 65, 995–1010. [Google Scholar] [CrossRef] [PubMed]
  11. Butterwick, C.; Heaney, S.I.; Talling, J.F. A Comparison of Eight Methods for Estimating the Biomass and Growth of Planktonic Algae. Br. Phycol. J. 1982, 17, 69–79. [Google Scholar] [CrossRef]
  12. OECD (Organisation for Economic Cooperation and Development). Freshwater Alga and Cyanobacteria, Growth Inhibition Test (201); OECD Guidelines for the Testing of Chemicals, Section 2; OECD: Paris, France, 2011; Volume 2. [Google Scholar]
  13. Chioccioli, M.; Hankamer, B.; Ross, I.L. Flow Cytometry Pulse Width Data Enables Rapid and Sensitive Estimation of Biomass Dry Weight in the Microalgae Chlamydomonas Reinhardtii and Chlorella Vulgaris. PLoS ONE 2014, 9, e97269. [Google Scholar] [CrossRef] [PubMed]
  14. Catlett, D.; Siegel, D.A.; Matson, P.G.; Wear, E.K.; Carlson, C.A.; Lankiewicz, T.S.; Iglesias-Rodriguez, M.D. Integrating phytoplankton pigment and DNA metabarcoding observations to determine phytoplankton composition in the coastal ocean. Limol. Oceanogr. 2022, 68, 361–376. [Google Scholar] [CrossRef]
  15. Kaplan-Levy, R.N.; Alster-Gloukhovski, A.; Benyamini, Y.; Zohary, T. Lake Kinneret phytoplankton: Integrating classical and molecular taxonomy. Hydrobiologia 2016, 764, 283–302. [Google Scholar] [CrossRef]
  16. Zhu, C.J.; Lee, Y.K. Determination of Biomass Dry Weight of Marine Microalgae. J. Appl. Phycol. 1997, 9, 189–194. [Google Scholar] [CrossRef]
  17. Jahnke, J.; Mahlmann, D.M.; Jacobs, P.; Priefer, U.B. The Influence of Growth Conditions on the Cell Dry Weight per Unit Biovolume of Klebsormidium Flaccidum (Charophyta), a Typical Ubiquitous Soil Alga. J. Appl. Phycol. 2011, 23, 655–664. [Google Scholar] [CrossRef]
  18. Suggett, D.J.; Ondrej, P. Chlorophyll a Fluorescence in Aquatic Sciences: Methods and Applications; Borowitzka, M.A., Ed.; Springer: Dordrecht, The Netherlands, 2010; Volume 4, pp. 293–309. [Google Scholar]
  19. Fernandez-Jaramillo, A.A.; Duarte-Galvan, C.; Contreras-Medina, L.M.; Torres-Pacheco, I.; Romero-Troncoso, R.J.; Guevara-Gonzalez, R.G.; Jesus, R.; Millan-Almaraz, J.R. Instrumentation in Developing Chlorophyll Fluorescence Biosensing: A Review. Sensors 2012, 12, 11853–11869. [Google Scholar] [CrossRef]
  20. Kahlert, M.; McKie, B.G. Comparing New and Conventional Methods to Estimate Benthic Algal Biomass and Composition in Freshwaters. Environ. Sci. Process. Impacts 2014, 16, 2627–2634. [Google Scholar] [CrossRef]
  21. Lenk, S.; Gádoros, P.; Kocsányi, L.; Barócsi, A. Teaching Laser-Induced Fluorescence of Plant Leaves. Eur. J. Phys. 2016, 37, 064003. [Google Scholar] [CrossRef]
  22. Marcek Chorvatova, A.; Uherek, M.; Mateasik, A.; Chorvat, D., Jr. Time-resolved Endogenous Chlorophyll Fluorescence Sensitivity to pH: Study on Chlorella sp. Algae. Methods Appl. Fluoresc. 2020, 8, 024007. [Google Scholar] [CrossRef]
  23. Mueller, T.C.; Moorman, T.B.; Locke, M.A. Detection of Herbicides Using Fluorescence Spectroscopy. Weed Sci. 1992, 40, 270–274. [Google Scholar] [CrossRef]
  24. Hunsche, M.; Bürling, K.; Noga, G. Spectral and Time-resolved Fluorescence Signature of Four Weed Species as Affected by Selected Herbicides. Pestic. Biochem. Physiol. 2011, 101, 39–47. [Google Scholar] [CrossRef]
  25. De Dayan, F.E.M.; Zaccaro, L.M. Chlorophyll Fluorescence as a Marker for Herbicide Mechanisms of Action. Pestic. Biochem. Physiol. 2012, 102, 189–197. [Google Scholar] [CrossRef]
  26. Levine, M. Fluorescence-based Sensing of Pesticides Using Supramolecular Chemistry. Front. Chem. 2021, 9, 616815. [Google Scholar] [CrossRef] [PubMed]
  27. Barócsi, A.; Kocsányi, L.; Várkonyi, S.; Richter, P.; Csintalan, Z.; Szente, K. Two-Wavelength, Multipurpose, Two-wavelength, multipurpose, truly portable chlorophyll fluorometer and its application in field monitoring of phytoremediation. Meas. Sci. Technol. 2000, 11, 717–729. [Google Scholar] [CrossRef]
  28. Malapascua, J.R.F.; Jerez, C.G.; Sergejevová, M.; Figueroa, F.L.; Masojídek, J. Photosynthesis Monitoring to Optimize Growth of Microalgal Mass Cultures: Application of Chlorophyll Fluorescence Techniques. Aquat. Biol. 2014, 22, 123–140. [Google Scholar] [CrossRef]
  29. Schaffer, J.D.; Sebetich, M.J. Effects of Aquatic Herbicides on Primary Productivity of Phytoplankton in the Laboratory. Bull. Environ. Contam. Toxicol. 2004, 72, 1032–1037. [Google Scholar] [CrossRef] [PubMed]
  30. Jyothi, K.; Krishna Prasad, M.; Mohan Narasimha Rao, G. Algae in Fresh Water Ecosystem. Phykos 2016, 46, 25–31. [Google Scholar]
  31. Pesce, S.; Bouchez, A.; Montuelle, B. Effects of Organic Herbicides on Phototrophic Microbial Communities in Freshwater Ecosystems. In Reviews of Environmental Contamination and Toxicology; Whitacre, D.M., Ed.; Springer: New York, NY, USA, 2011; pp. 87–124. [Google Scholar] [CrossRef]
  32. Ma, J.; Wang, S.; Ma, L.; Chen, X.; Xu, R. Toxicity assessment of 40 herbicides to the green alga Raphidocelis subcapitata. Ecotox Environ. Saf. 2006, 63, 456–462. [Google Scholar] [CrossRef]
  33. Carbajal-Hernández, A.L.; Arzate-Cárdenas, M.A.; Valerio-García, R.C.; Martínez-Jerónimo, F. Commercial pesticides for urban applications induced population growth and subcellular alterations in Raphidocelis subcapitata (Chlorophyceae) at concerning environmental concentrations. Ecotoxicology 2022, 31, 1–15. [Google Scholar] [CrossRef]
  34. Lanasa, S.; Niedzwiecki, M.; Reber, K.P.; East, A.; Sivey, J.D.; Salice, C.D. Comparative toxicity of herbicide active ingredients, safener additives, and commercial formulations to the Nontarget Alga Raphidocelis subcapitata. Environ. Toxicol Chem. 2022, 41, 1466–1476. [Google Scholar] [CrossRef] [PubMed]
  35. Pallett, K.E. The Mode of Action of Isoxaflutole: A Case Study of an Emerging Target Site. In Herbicides and Their Mechanism of Action; Cobb, A.H., Kirkwood, R.C., Eds.; CRC Press: Boca Raton, FL, USA, 2000; pp. 215–238. [Google Scholar]
  36. DeLorenzo, M.E.; Scott, G.I.; Ross, P.E. Toxicity of Pesticides to Aquatic Microorganisms: A Review. Environ. Toxicol. Chem. 2001, 20, 84–98. [Google Scholar] [CrossRef] [PubMed]
  37. Trebst, A.; Depka, B.; Jäger, J.; Oettmeier, W. Reversal of the Inhibition of Photosynthesis by Herbicides Affecting Hydroxyphenylpyruvate Dioxygenase by Plastoquinone and Tocopheryl Derivatives in Chlamydomonas Reinhardtii. Pest Manag. Sci. 2004, 60, 669–674. [Google Scholar] [CrossRef] [PubMed]
  38. MacBean, C. The Pesticide Manual: A World Compendium; British Crop Production Council: Alton, UK, 2012; pp. 677–678. [Google Scholar]
  39. Kaur, H.; Bhowmik, P.C. Phytotoxicity of Isoxaflutole to Phalaris Minor Retz. Plant. Soil. 2004, 258, 161–168. [Google Scholar] [CrossRef]
  40. Pallett, K.E.; Cramp, S.M.; Little, J.P.; Veerasekaran, P.; Crudace, A.J.; Slater, A.E. Isoxaflutole: The Background to Its Discovery and the Basis of Its Herbicidal Properties. Pest Manag. Sci. 2001, 57, 133–142. [Google Scholar] [CrossRef]
  41. King, O.; Smith, R.; Mann, R.; Warne, M. Proposed Aquatic Ecosystem Protection Guideline Values for Pesticides Commonly Used in the Great Barrier Reef Catchment Area: Part 1–2,4-D, Ametryn, Diuron, Glyphosate, Hexazinone, Imazapic, Imidacloprid, Isoxaflutole, Metolachlor, Metribuzin, Metsulfuron-Methyl, Simazine and Tebuthiuron; Department of Science, Information Technology and Innovation: Brisbane, QLD, Australia, 2017; pp. 176–184. [Google Scholar]
  42. Ramanarayanan, T.; Narasimhan, B.; Srinivasan, R. Characterization of Fate and Transport of Isoxaflutole, a Soil-applied Corn Herbicide, in Surface Water Using a Watershed Model. J. Agric. Food Chem. 2005, 53, 8848–8858. [Google Scholar] [CrossRef] [PubMed]
  43. Meyer, M.T.; Scribner, E.A.; Kalkhoff, S.J. Comparison of Fate and Transport of Isoxaflutole to Atrazine and Metolachlor in 10 Iowa Rivers. Environ. Sci. Technol. 2007, 41, 6933–6939. [Google Scholar] [CrossRef]
  44. Da Silva Santarossa, M.A.; Coleone, A.C.; de Mello, N.P.; Ignácio, N.F.; Machado, A.A.; Marques Silva, J.R.; Velini, E.D.; Machado Neto, J.G. Contamination of Fee-fishing Ponds with Agrochemicals Used in Sugarcane Crops. SN Appl. Sci. 2020, 2, 1498. [Google Scholar] [CrossRef]
  45. US EPA. Pesticide Fact Sheet. Isoxaflutole. United States Environmental Protection Agency: Washington, DC, USA, 1998; pp. 1–15. Available online: https://www3.epa.gov/pesticides/chem_search/reg_actions/registration/fs_PC-123000_15-Sep-98.pdf (accessed on 12 May 2023).
  46. De Santo, F.B.; Ramos, G.A.; Filho, A.M.R.; Marchioro, C.A.; Niemeyer, J.C. Ecotoxicity of the Isoxaflutole Herbicide to Soil InvertebratesEcotoxicity of Isoxaflutole Herbicide to Soil Invertebrates. Rev. Ciênc. Agrovet. 2020, 19, 217–223. [Google Scholar] [CrossRef]
  47. Trebst, A.; Depka, B.; Holländer-Czytko, H. A Specific Role for Tocopherol and of Chemical Singlet Oxygen Quenchers in the Maintenance of Photosystem II Structure and Function in Chlamydomonas Reinhardtii. FEBS Lett. 2002, 516, 156–160. [Google Scholar] [CrossRef]
  48. Chamsi, O.; Pinelli, E.; Faucon, B.; Perrault, A.; Lacroix, L.; Sánchez-Pérez, J.-M.; Charcosset, J.-Y. Effects of Herbicide Mixtures on Freshwater Microalgae with the Potential Effect of a Safener. Ann. Limnol. Int. J. Lim. 2019, 55, 3. [Google Scholar] [CrossRef]
  49. Peer Review of the Pesticide Risk Assessment of the Active Substance Isoxaflutole. Available online: https://www.efsa.europa.eu/en/efsajournal/pub/4416 (accessed on 12 May 2023).
  50. US Geological Survey. Estimated Annual Agricultural Pesticide Use. Pesticide Use Maps—Isoxaflutole. United States US Geological Survey: Reston, VA, USA, 2022. Available online: https://water.usgs.gov/nawqa/pnsp/usage/maps/show_map.php?year=2017&map=ISOXAFLUTOLE&hilo=L&disp=Isoxaflutole (accessed on 12 May 2023).
  51. US EPA. Public Participation for Isoxaflutole: New Use on Herbicide Resistant Soybeans. EPA-HQ-OPP-2019-0398. United States Environmental Protection Agency: Washington, DC, USA, 2020; pp. 1–12. Available online: https://www.regulations.gov/docket/EPA-HQ-OPP-2019-0398 (accessed on 12 May 2023).
  52. Allen, M.M. Simple Conditions for Growth of Unicellular Blue-Green Algae on Plates1, 2. J. Phycol. 1968, 4, 1–4. [Google Scholar] [CrossRef]
  53. Z8 Medium. Available online: https://www-cyanosite.bio.purdue.edu/media/table/Z8.html (accessed on 12 May 2023).
  54. Aguilera, A.; Berrendero Gómez, E.; Kaštovský, J.; Echenique, R.O.; Salerno, G.L. The polyphasic analysis of two native Raphidiopsis isolates supports the unification of the genera Raphidiopsis and Cylindrospermopsis (Nostocales, Cyanobacteria). Phycologia 2018, 57, 130–146. [Google Scholar] [CrossRef]
  55. Chekanov, K.; Lukyanov, A.; Boussiba, S.; Aflalo, C.; Solovchenko, A. Modulation of photosynthetic activity and photoprotection in Haematococcus pluvialis cells during their conversion into haematocysts and back. Photosynth. Res. 2016, 128, 313–323. [Google Scholar] [CrossRef] [PubMed]
  56. Barócsi, A.; Lenk, S.; Kocsányi, L.; Buschmann, C. Excitation Kinetics during Induction of Chlorophyll a Fluorescence. Photosynthetica 2009, 47, 104–111. [Google Scholar] [CrossRef]
  57. Kautsky, H.; Hirsch, A. Neue versuche zur kohlensäureassimilation. Naturwissenschaften 1931, 19, 964. [Google Scholar] [CrossRef]
  58. Huang, Y.; Thomson, S.J.; Molin, W.T.; Reddy, K.N.; Yao, H. Early Detection of Soybean Plant Injury from Glyphosate by Measuring Chlorophyll Reflectance and Fluorescence. J. Agric. Sci. 2012, 4, 117–124. [Google Scholar] [CrossRef]
  59. Vredenberg, W.J. On the quantitative relation between dark kinetics of NPQ-induced changes in variable fluorescence and the activation state of the CF0·CF1·ATPase in leaves. Photosynthetica 2018, 56, 139–149. [Google Scholar] [CrossRef]
  60. Wetzel, R.G.; Likens, G.E. Limnol Analys; Springer Science & Business Media: Berlin/Heidelberg, Germany, 2013; ISBN 978-1-4757-3250-4. [Google Scholar]
  61. WHO. Toxic Cyanobacteria in Water: A Guide to Their Public Health Consequences, Monitoring and Management; Chorus, I., Welker, M., Eds.; E & FN Spon: London, UK, 1999. [Google Scholar]
  62. Carvalho, L.; McDonald, C.; de Hoyos, C.; Mischke, U.; Phillips, G.; Borics, G.; Poikane, S.; Skjelbred, B.; Solheim, A.L.; Van Wichelen, J.; et al. Sustaining recreational quality of European lakes: Minimizing the health risks from algal blooms through phosphorus control. J. Appl. Ecol. 2013, 50, 315–323. [Google Scholar] [CrossRef]
  63. T-Krasznai, E.; Lerf, V.; Tóth, I.; Kisantal, T.; Várbíró, G.; Vasas, G.; B-Béres, V.; Görgényi, J.; Lukács, Á.; Kókai, Z.; et al. Uncertainties of cell number estimation in cyanobacterial colonies and the potential use of sphere packing. Harmful Algae 2022, 117, 102290. [Google Scholar] [CrossRef]
  64. Székács, A.; Mörtl, M.; Darvas, B. Monitoring Pesticide Residues in Surface and Ground Water in Hungary: Surveys in 1990–2015. J. Chem. 2015, 2015, 717948. [Google Scholar] [CrossRef]
  65. Utermöhl, H. Methods of Collecting Plankton for Various Purposes Are Discussed. SIL Commun. 1953–1996 1958, 9, 1–38. [Google Scholar] [CrossRef]
  66. R Core Team. R: A Language and Environment for Statistical Computing; R Fondation for Statistical Computing: Vienna, Austria, 2021. [Google Scholar]
  67. Lichtenthaler, H.K.; Buschmann, C.; Knapp, M. How to correctly determine the different chlorophyll fluorescence parameters and the chlorophyll fluorescence decrease ratio RFd of leaves with the PAM fluorometer. Photosynthetica 2005, 43, 379–393. [Google Scholar] [CrossRef]
  68. Kalaji, H.M.; Schansker, G.; Ladle, R.J.; Goltsev, V.; Bosa, K.; Allakhverdiev, S.I.; Brestic, M.; Bussotti, F.; Calatayud, A.; Dąbrowski, P.; et al. Frequently asked questions about chlorophyll fluorescence, the sequel. Photosynth. Res. 2016, 132, 13–66. [Google Scholar] [CrossRef]
  69. Sobiechowska-Sasim, M.; Stoń-Egiert, J.; Kosakowska, A. Quantitative analysis of extracted phycobilin pigments in cyanobacteria-an assessment of spectrophotometric and spectrofluorometric methods. J. Appl. Phycol. 2014, 26, 2065–2074. [Google Scholar] [CrossRef] [PubMed]
  70. Gregor, J.; Maršálek, B. Freshwater phytoplankton quantification by chlorophyll a: A comparative study of in vitro, in vivo and in situ methods. Water Res. 2004, 38, 517–522. [Google Scholar] [CrossRef]
  71. Volpe, C.; Vadstein, O.; Andersen, G.; Andersen, T. Nanocosm: A well plate photobioreactor for environmental and biotechnological studies. Lab. Chip. 2021, 21, 2027–2039. [Google Scholar] [CrossRef]
  72. Schreiber, U.; Klughammer, C. Evidence for variable chlorophyll fluorescence of photosystem I in vivo. Photosynth. Res. 2021, 149, 213–231. [Google Scholar] [CrossRef]
  73. Cadondon, J.G.; Ong, P.M.B.; Vallar, E.A.; Shiina, T.; Galvez, M.C.D. Chlorophyll-a Pigment Measurement of Spirulina in Algal Growth Monitoring Using Portable Pulsed LED Fluorescence Lidar System. Sensors 2022, 22, 2940. [Google Scholar] [CrossRef]
  74. Albrecht, M.; Khanipour Roshan, S.; Fuchs, L.; Karsten, U.; Schumann, R. Applicability and limitations of high-throughput algal growth rate measurements using in vivo fluorescence in microtiter plates. J. Appl. Phycol. 2022, 34, 2037–2049. [Google Scholar] [CrossRef]
  75. Siedlewicza, G.; Zakb, A.; Sharmaa, L.; Kosakowskaa, A.; Pazdroa, K. Effects of oxytetracycline on growth and chlorophyll a fluorescence in green algae (Chlorella vulgaris), diatom (Phaeodactylum tricornutum) and cyanobacteria (Microcystis aeruginosa and Nodularia spumigena). Oceanologia 2020, 62, 214–225. [Google Scholar] [CrossRef]
  76. Cook, A.H. Algal pigments and their significance. Biol. Rev. 1945, 20, 115–132. [Google Scholar] [CrossRef]
  77. Macintyre, H.L.; Lawrenz, E.; Richardson, T.L. Taxonomic Discrimination of Phytoplankton by Spectral Fluorescence. Taxonomic Discrimination of Phytoplankton by Spectral Fluorescence. In Chlorophyll a Fluorescence in Aquatic Sciences: Methods and Applications; Sugget, D., Prášil, O., Borowitzka, M., Eds.; Springer Science + Business Media B.V.: Dordrecht, The Netherlands, 2010; pp. 129–169. [Google Scholar] [CrossRef]
  78. Hsieh-Lo, M.; Castillo, G.; Ochoa-Becerra, M.A.; Mojica, L. Phycocyanin and phycoerythrin: Strategies to improve production yield and chemical stability. Algal. Res. 2019, 42, 101600. [Google Scholar] [CrossRef]
  79. Pagels, F.; Pereira, R.N.; Vicente, A.A.; Guedes, A.C. Extraction of Pigments from Microalgae and Cyanobacteria—A Review on Current Methodologies. Appl. Sci. 2021, 11, 5187. [Google Scholar] [CrossRef]
  80. Schagerl, M.; Siedler, R.; Konopáčová, E.; Ali, S.S. Estimating Biomass and Vitality of Microalgae for Monitoring Cultures: A Roadmap for Reliable Measurements. Cells 2022, 11, 2455. [Google Scholar] [CrossRef]
  81. Oláh, V.; Hepp, A.; Irfan, M.; Mészáros, I. Chlorophyll Fluorescence Imaging-Based Duckweed Phenotyping to Assess Acute Phytotoxic Effects. Plants 2021, 10, 2763. [Google Scholar] [CrossRef]
  82. Lichtenthaler, H.K.; Miehé, J.A. Fluorescence Imaging as a Diagnostic Tool for Plant Stress. Trends Plant. Sci. 1997, 2, 316–320. [Google Scholar] [CrossRef]
  83. Lichtentaler, H.K.; Babani, F. Detection of photosynthetic activity and water stress by imaging the red chlorophyll fluorescence. Plant. Physiol. Biochem. 2000, 38, 889–895. [Google Scholar] [CrossRef]
  84. Canora, D.D.; Guasch, L.L.; Zuazo, R.S. Species-specific responses of Antarctic terrestrial microalgae to salinity stress. Comparative study in Klebsormidium sp. and Stigeoclonium sp. Czech Polar Rep. 2022, 12, 89–102. [Google Scholar] [CrossRef]
  85. Fodorpataki, L.; Geráj, J.; Deák, H.; Barna, S.; Kovács, B. Influence of inorganic nutrients on parameters of biomass production in a local strain of the microalga Scenedesmus acuminatus. Contrib. Bot. 2013, 48, 83–94. Available online: http://contributiibotanice.reviste.ubbcluj.ro/materiale/2013/Contrib_Bot_vol_48_pp_083-094.pdf (accessed on 12 May 2023).
  86. Santos, A.M.D.; Vitorino, L.C.; Cruvinel, B.G.; Ávila, R.G.; Vasconcelos Filho, S.D.C.; Batista, P.F.; Bessa, L.A. Impacts of Cd Pollution on the Vitality, Anatomy and Physiology of Two Morphologically Different Lichen Species of the Genera Parmotrema and Usnea, Evaluated under Experimental Conditions. Diversity 2022, 14, 926. [Google Scholar] [CrossRef]
  87. National Registration Authority for Agricultural and Veterinary Chemicals (Australia). Public Release Summary on Evaluation of the New Active Isoxaflutole in the Product Balance 750WG Herbicide; The Authority: Canberra, NSW, Australia, 2001; p. 35. [Google Scholar]
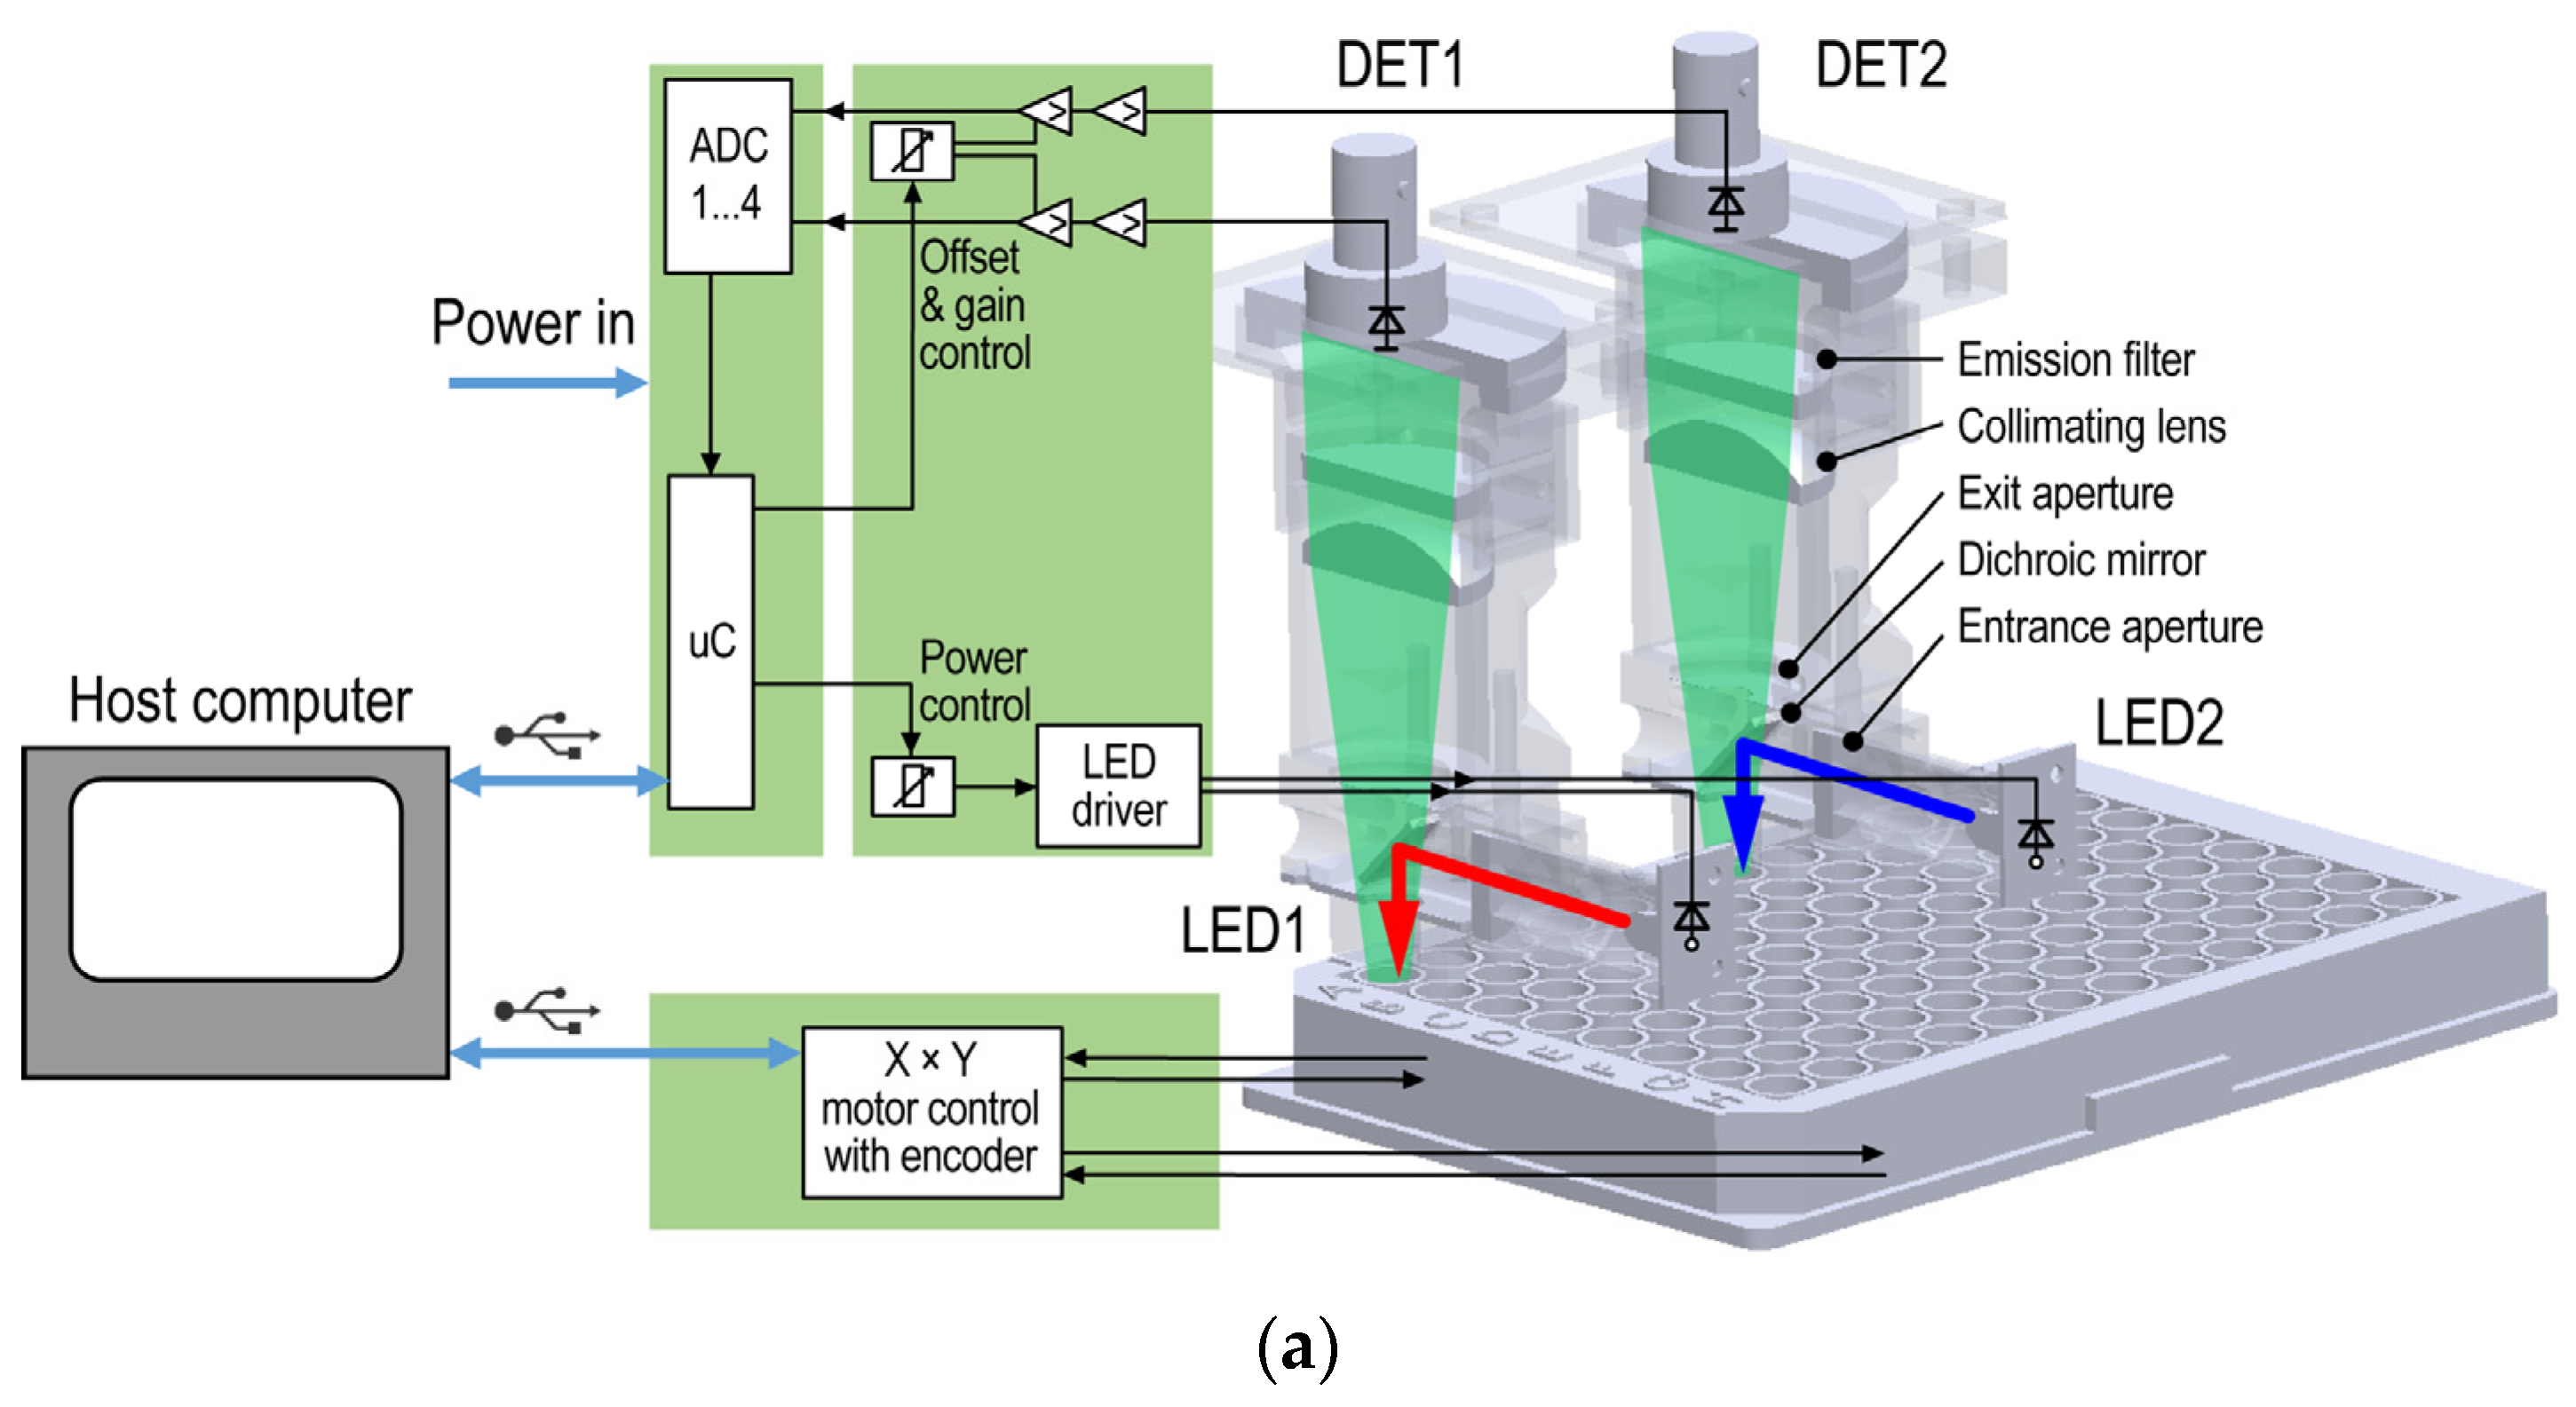
Figure 1. Block scheme (a) and implementation (b) of the dual-head Dichroic Fluorometer System equipped with a dichroic mirror to reflect the visible input light beam (red and blue arrows from the LED1 red and LED2 blue LED sources, respectively) and pass the fluorescent output light beam (green path) to the corresponding DET1 and DET2 detectors, as well as a motorized X × Y stepping apparatus for reading fluorescent signals in individual wells of a 96-well microplate. The instrument is microcontroller (uC)-controlled; the detector signal is digitized by a multichannel analog-to-digital converter (ADC).
Water 15 01866 g001aWater 15 01866 g001b
Figure 2. Block scheme (a) and image (b) of the FluoroMeter Module equipped with a microplate holder for reading fluorescent signals in individual wells of a 96-well microplate: laser diode (LD), 2-channel by 2-stage organized amplifiers (>), multichannel analog-to-digital converter (ADC1…4), single-board computer (SBC), switching power converter (DC/DC), liquid crystal display (LDC), RS232 transmission line with receive (Rx) and transmit (Tx) lines.
Water 15 01866 g002
Figure 3. Comparisons of fluorometric tests obtained using microplates of different colors (a) and without or with dark acclimation before the measurement (b). (a) The reflection of black (black line) and white (gray line) microplates upon illumination, applying gradually increasing light intensity over time. (b) Correlation of the normalized (RFU/RFUMAX) fluorescence signals measured with (abscissa) or without (ordinate) dark acclimation prior to illumination. Data are presented as mean ± standard deviation on both the abscissa and ordinate. Fluorescence intensity is determined in relative fluorescence units (RFUs).
Water 15 01866 g003
Figure 4. Fluorescence results of algal concentrations diluted with water taken from Lake Balaton (brick red), the Danube River (gray), and the fishing pond (yellow). The measurements were performed using Microcystis aeruginosa on Channel 1 (excitation wavelength: 630 nm, detection wavelength: 708 nm) (a) and Channel 2 (excitation wavelength: 470, detection wavelength: 716 nm) (b) and Raphidohelis subcapitata concentration on Channel 1 (c) and Channel 2 (d) of Dichroic Fluorometer System. Data are presented as mean ± standard deviation for all surface waters. Fluorescence intensity is determined in relative fluorescence units (RFUs).
Water 15 01866 g004aWater 15 01866 g004b
Figure 5. Fluorescence signals (relative fluorescence units, indicated by colors) as a function of cell concentrations of two microalgae, Microcystis aeruginosa and Raphidocelis subcapitata, in the algal mixtures measured on Channel 1 (excitation wavelength: 630 nm, detection wavelength: 708 nm) (a) and Channel 2 (excitation wavelength: 470, detection wavelength: 716 nm) (b).
Water 15 01866 g005
Figure 6. Degradation study of isoxaflutole in Z8 medium.
Water 15 01866 g006
Table 1. Technical characteristics of the FluoroMeter Module, Dichroic Fluorometer System (both applied in this study), and other commercially available fluorescence-based instruments.
Instrument FeaturesInstrument Type
FMM 1
(This Study)
DFS 2
(This Study)
Phyto
-PAM-II/ED 3
AlgaeTorch 4AquaFluor 5AquaPen AP 110-C 6YSI 6025 7
Detection mode *CECEPMCECEPMCE
PM measuring source **
Peak wavelength (nm)
Number of wavelengths
LED
440–625
5
LED
Actinic (saturation) source
Peak wavelength (nm)
Number of wavelengths
LD
635
1
LED
470, 630
2
LED
440–640
6
LED
470–610
3
LED
350–530
2
LED
455, 630
2
LED
470
1
Actinic (saturation)
peak level (μmol/m2/s)
77015001500 (5000) 1000
(3000)
Detection wavelength (FWHM bandpass) (nm)690 (10)
735 (10)
708 (75)
716(43)
>650
(LP) ***
>660
(LP)
708 (83)675 (50)
Detector type ****
Number of channels
PD
2
PD
2
PMT
1
PD
1
PD
2
PD
1
PD
1
Chlorophyll a range
(resolution) (ng/mL)
80–80000–200 0–5000–300 0–400
(0.1)(0.1)(0.1)(0.5)(0.5)(0.1)
Liquid-sample holder *****PMPCPCCP
Recorded data type ******KMF, L, KMMF, L, MM
Notes: 1 FMM: FluoroMeter Module (reported in this study). 2 DFS: Dichroic Fluorometer System (reported in this study). 3 Phyto Pulse Amplitude Modulated instrument (Heinz Walz GmbH, Effeltrich, Germany). 4 Algae Torch Chlorophyll Fluorometer (bbe Moldaenke GmbH, Schwentinental, Germany). 5 AquaFluor Handheld Fluorometer (Turner Designs Inc., San Jose, CA, USA). 6 AquaPen AP 110-C Pulse Amplitude Modulated fluorometer (Photon Systems Instruments, spol. s r.o., Drásov, Czech Republic). 7 YSI 6025 Chlorophyll Sensor (YSI Inc., Yellow Springs, OH, USA). * Pulse modulation (PM) or continuous excitation (CE). ** LED (array) or laser diode (LD). *** Low-pass filter (LP). **** Photodetector (PD) or photomultiplier tube (PMT). ***** Cuvette (C), direct/fiber probe (P), multiwell microplate (MP). ****** Fast (polyphasic) kinetics (F), full kinetics (K), light response curve (L), or peak/maximum fluorescence intensity (M).
Table 2. Summary of the main fluorescence quantities determined by FMM.
SymbolDefinitionDescription
FoobservedNon-variable (original) fluorescence intensity
FpobservedPeak fluorescence intensity, maximum fluorescence at a non-saturating light pulse
Fv*Fp–FoVariable fluorescence in terms of Fp
Fv*/FpFv*/FpProxy of quantum efficiency of photosystem II
FsobservedSteady-state (terminal) fluorescence
FdFp–FsFluorescence decrease in terms of Fp
Rfd*Fd/FsFluorescence decrease ratio
Table 3. Correlation coefficients (Pearson and Spearman correlation coefficients) and the coefficients of determination (r2) between densities of model green and blue-green algae determined by different methods.
PrototypeRaphidocelis subcapitataMicrocystis aeruginosa
FMM 1DFS 2FMMDFS
r *r2rr2rr2rρ **r2
Optical density (determined spectrophotometrically)0.992
(p < 0.001) ***
0.984Channel 10.989
(p = 0.001)
0.978Channel 1
0.999
(p < 0.001)
0.998-1
(p < 0.001)
0.999
Channel 2Channel 2
0.997
(p < 0.001)
0.994-0.976
(p < 0.001)
0.962
Cell number (determined in a Bürker chamber)0.992
(p < 0.001)
0.984Channel 10.989
(p = 0.001)
0.978Channel 1
0.999
(p < 0.001)
0.9980.993
(p < 0.001)
-0.987
Channel 2Channel 2
0.998
(p < 0.001)
0.9960.921
(p < 0.001)
-0.858
Chlorophyll-a content (obtained by extraction)0.992
(p < 0.001)
0.984Channel 10.988
(p = 0.002)
0.976Channel 1
0.999
(p < 0.001)
0.998-1
(p < 0.001)
0.998
Channel 2Channel 2
0.991
(p = 0.001)
0.982-0.976
(p < 0.001)
0.962
Notes: 1 FMM: FluoroMeter Module; 2 DFS: Dichroic Fluorometer System with two channels; * Pearson correlation coefficients at the significance level of 0.050; ** Spearman correlation coefficients at the significance level of 0.050; *** the significance level (p-value) of the correlation.
Table 4. Achievable detection and quantification limits using the FMM1 and DFS 2 instruments.
Analytical FeatureCell Number (Cells/mL)
FMM 1DFS 2
R. subcapitataM. aeruginosaR. subcapitataM. aeruginosa
Channel 1Channel 2Channel 1Channel 2
LOD *4.01 × 1068.26 × 1077.58 × 1043.70 × 1033.80 × 1041.13 × 105
LLOQ **8.12 × 1061.51 × 1089.34 × 1046.10 × 1038.72 × 1049.97 × 105
ULOQ ***ND ****ND7.22 × 1068.06 × 1061.27 × 1082.4 × 109
Notes: 1 FMM: FluoroMeter Module; 2 DFS: Dichroic Fluorometer System; * LOD: limit of detection; ** LLOQ: lower limit of quantification; *** ULOQ: upper limit of quantification (refers to the upper threshold of the instrument); **** ND: no data.
Table 5. Algae taxa identified by a light microscope in the water of the fishing pond. Taxa highlighted by green and blue letters belong to Chlorophyta and Cyanobacteria, respectively.
TaxonPhylumConcentration
(106 cells/m3)
Fresh Weight
(mg/m3)
Biomass
(%)
Chrysochromulina parvaHaptophyta916.30989.608.31
Keratococcus sp.Chlorophyta257.12168.291.41
Raphidocelis subcapitataChlorophyta4.6713.220.11
Scenedesmus sp.Chlorophyta23.3713.220.11
Monoraphidium sp.Chlorophyta28.0527.490.23
Pediastrum duplexChlorophyta79.47149.811.26
Cryptomonas sp.Cryptista0.9353.970.45
Rhodomonas sp.Cryptista130.901605.1113.48
Geitlerinema sp.Cyanobacteria37.4025.070.21
Glaucospira sp.Cyanobacteria4.672.570.02
Gloeocapsa sp.Cyanobacteria902.27896.887.53
Limnothrix redekeiCyanobacteria23.373.300.03
Merismopedia sp.Cyanobacteria1477.303828.8832.15
Merismopedia elegansCyanobacteria205.708.620.07
Merismopedia glaucaCyanobacteria247.77162.171.36
Planktolyngbya circumcretaCyanobacteria9452.831336.3611.22
Planktolyngbya limneticaCyanobacteria579.70227.651.91
Planktothrix rubescensCyanobacteria776.051219.0110.23
Pseudanabaena sp.Cyanobacteria37.40505.234.24
Table 6. Ecotoxicological parameters (EC50 values determined by optical density, chlorophyll a content, and observed ratio of fluorescence decrease (Rfd*)) of isoxaflutole.
EC50
(µg/mL)
Standard Deviation (SD)
(µg/mL)
Optical density0.0340.004
Chlorophyll a content0.0330.000
Rfd*0.0150.001
Disclaimer/Publisher’s Note: The statements, opinions and data contained in all publications are solely those of the individual author(s) and contributor(s) and not of MDPI and/or the editor(s). MDPI and/or the editor(s) disclaim responsibility for any injury to people or property resulting from any ideas, methods, instructions or products referred to in the content.