Article

Trends, Cycles, and Spatial Distribution of the Precipitation, Potential Evapotranspiration and Aridity Index in Xinjiang, China

1
Xinjiang Production and Construction Group Key Laboratory of Modern Water-Saving Irrigation, College of Water and Architectural Engineering, Shihezi University, Shihezi 832000, China
2
State Key Laboratory of Simulation and Regulation of Water Cycle in River Basin, China Institute of Water Resources and Hydropower Research, Beijing 100044, China
3
China Reinsurance (Group) Corporation, Beijing 100033, China
4
College of Management and Economics, Tianjin University, Tianjin 300072, China
5
State Key Laboratory of Hydraulic Engineering Simulation and Safety, School of Civil Engineering, Tianjin University, Tianjin 300072, China
*
Authors to whom correspondence should be addressed.
These authors contributed equally to this work.
Water 2023, 15(1), 62; https://doi.org/10.3390/w15010062
Submission received: 8 November 2022 / Revised: 19 December 2022 / Accepted: 20 December 2022 / Published: 24 December 2022
(This article belongs to the Section Hydrology)

Abstract

:
Xinjiang is a typical continental arid climate zone and ecologically fragile zone. Drought has caused damage to the local social economy, agricultural production, and the ecological environment. However, the study of drought is more difficult due to the complex topography and the lack of monitoring information. In this paper, based on the meteorological data of 94 meteorological stations in Xinjiang from 1961 to 2020, we used the precipitation and potential evapotranspiration (ET0) to calculate the aridity index (AI); the Mann–Kendall test, Morlet wavelet analysis, and Kriging interpolation were used to identify the trend, period, and spatial distribution. The results showed that (1) the average change rate of the precipitation in Xinjiang was 8.58 mm/10a, the average change rate of the ET0 was −14.84 mm/10a, and the average change rate of the AI was −1.94/10a; (2) the periods of precipitation, ET0, and AI in Xinjiang were 39, 29, and 14 years, respectively, and the abrupt changes occurred in 1986, 1971, and 1987, respectively; (3) The Moran index of precipitation and temperature are 0.41 and 0.33, respectively, indicating that precipitation and temperature in Xinjiang are positively correlated in spatial distribution and have spatial clustering characteristics; and the z-values are both greater than 2.58 (p < 0.01), indicating that the spatial autocorrelation of precipitation and temperature in Xinjiang is significant. This study can provide a reference for the diagnosis of the meteorological drought mechanism and the coping with climate change in Xinjiang.

1. Introduction

Drought is a natural phenomenon in which precipitation in a certain region continues to be much lower than the historical level for the same period, resulting in a water deficit in surface water quantity and underground aquifers such as rivers and lakes [1]. Drought is one of the most complexes, least understood, and most common natural disasters, which has a large impact on society, the economy, and the environment and threatens the safety of human life and property [2,3,4]. According to the International Disaster Database, droughts occur as only 5% of all-natural disasters, but the number of people affected is the highest, even reaching 30% of the total population. Droughts can last for weeks, months, or even decades, leading to severe losses in agriculture and forestry, causing ecosystem degradation, and threatening healthy socioeconomic development [5]. Drought disasters are characterized by their high frequency, long duration, wide impact, and severe losses [6] and have become one of the important factors limiting sustainable socioeconomic development. Scholars generally classify droughts into four types: meteorological drought, agricultural drought, hydrological drought, and socioeconomic drought [7], and there are drought propagation and progressive links between these types, corresponding to different stages of drought development. Meteorological drought caused by a persistent precipitation deficit acts on the subsurface to cause a decrease in soil moisture, which affects plant growth and thus produces agricultural drought; meanwhile, the shortage of surface water and groundwater resources such as rivers and lakes causes hydrological drought; when the duration and impact of meteorological drought reach a certain level, multiple droughts will coexist and seriously affect the development of national economy, resulting in socioeconomic drought [8]. Meteorological droughts occur first, and the other three types of droughts are essentially the result of the effects of meteorological droughts, so the early warning can be achieved through monitoring of meteorological droughts [9].
Global warming and the frequent occurrence of extreme events causing large economic losses to have made people pay more attention to the monitoring of and defense against drought disasters [10]. Under different shared socio-economic paths, the global land is likely to show an overall trend of drought intensification in the future, and the duration of drought events becomes longer. Among them, Australia, the Middle East, South Africa, North Africa, Central Asia, and other originally arid regions may experience more severe droughts in the future, and the Asian drylands along the Silk Road Economic Belt will face the risk of increasing droughts in the future, and the intensity and duration of droughts also show an increasing trend [11]. Due to its special geographical location, Xinjiang has a harsh climatic environment, a shortage of water resources with uneven spatial and temporal distribution, and seasonal contradiction between supply and demand, resulting in a high frequency of droughts in Xinjiang. In recent years, many scholars have studied the frequent droughts in Xinjiang on a territory-wide or local basis, using different indicators to classify drought levels and analyze the spatial and temporal variation characteristics of Xinjiang droughts [12,13,14,15,16]. The commonly used indicators globally or regionally are the Palmer index (PDSI) [17], the standardized rainfall index (SPI) [18], the standardized rainfall evapotranspiration index (SPEI) [19], and other indices based on meteorological station data, along with the normalized vegetation index (NDVI) [20], the temperature vegetation drought index (TVDI) [21], based on remote sensing data, the Water Deficit Index (WDI) [22], etc. The aridity index (AI) takes into account both precipitation and potential evapotranspiration and is a careful consideration of temperature, wind speed, insolation, and atmospheric factors, which can objectively reflect the dry and wet conditions of an area; it is considered the most accurate indicator to describe the actual dry, wet, and hydrothermal conditions of the land surface [23].
Different researchers have achieved fruitful results on the dryness and wetness changes in China [23,24] and its regions using AI [25,26,27,28,29,30]. Geng [31] analyzed the spatial and temporal characteristics of extreme dry and wet events in Xinjiang based on the frequency of extreme dry and wet events at 36 stations; Zhang [32] and Wu [33] conducted a study on the spatial and temporal characteristics of AI in the whole of Xinjiang and northern Xinjiang from 1961 to 2013, respectively; they both discussed the spatial and temporal distribution characteristics and influencing factors of AI. In this paper, with reference to the above studies, the rainfall, potential evapotranspiration, and AI in Xinjiang are analyzed.
In this study, we obtained information on 94 meteorological stations in the Xinjiang region by interfacing with local meteorological bureaus, Xinjiang Meteorological Bureau, China Meteorological Administration, and other government departments. To our knowledge, this is the complete measured meteorological data for drought studies in the Xinjiang region. Due to the characteristics of the mountain-basin system in the Xinjiang region, there are still controversies about the drought studies in the region: the lack of actual measurement data in mountainous areas and deserts and the large error of remote sensing data in mountainous areas and deserts. Controversies have always existed, but research is still needed for the Xinjiang region. In this study, we also use Tyson polygons to further investigate climate change in the Xinjiang region. In this study, the precipitation, potential evapotranspiration, and AI were calculated for Xinjiang for the past 60 years using data from 94 national basic meteorological stations in Xinjiang for the period 1961–2020. The climate change characteristics of the Xinjiang region were analyzed using the precipitation and potential evapotranspiration, and the drought characteristics of Xinjiang were analyzed by using the aridity index. The results of this study can provide a reference for the formulation of climate change adaptation countermeasures, ecological and environmental protection, disaster prevention and mitigation, and water resource management in Xinjiang.

2. Data Sources and Methods

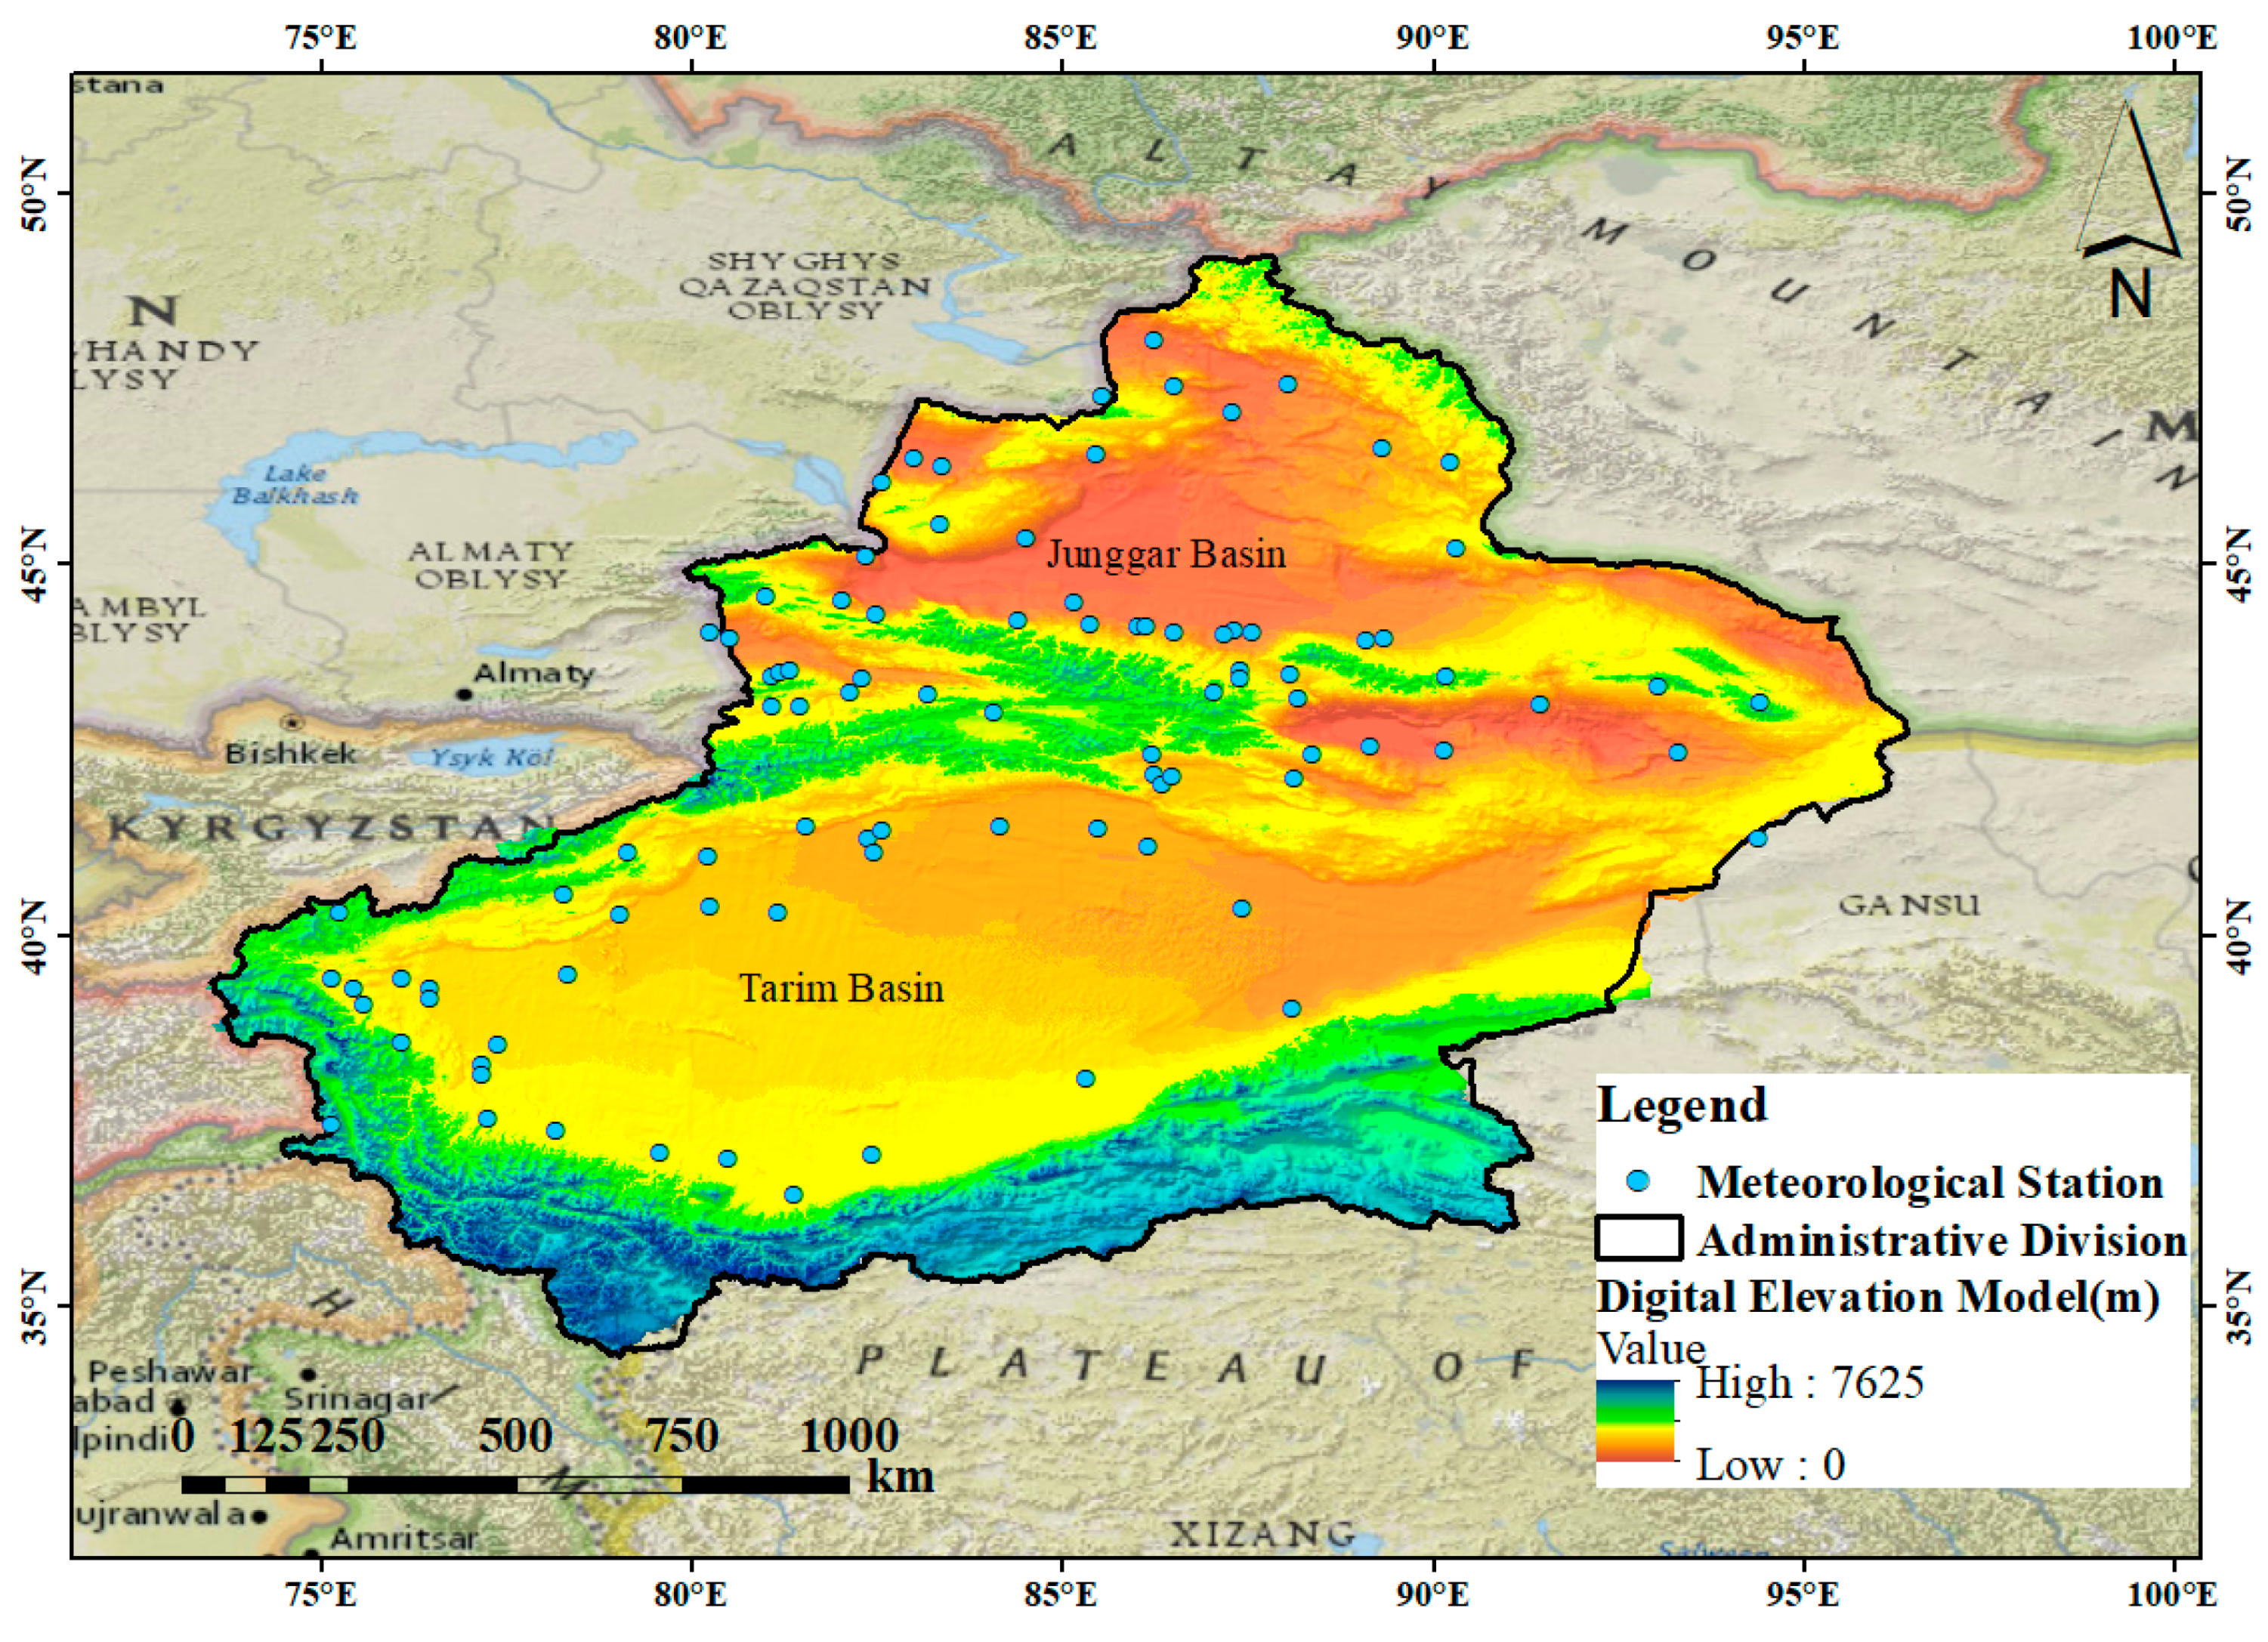
2.1. Overview of the Study Area
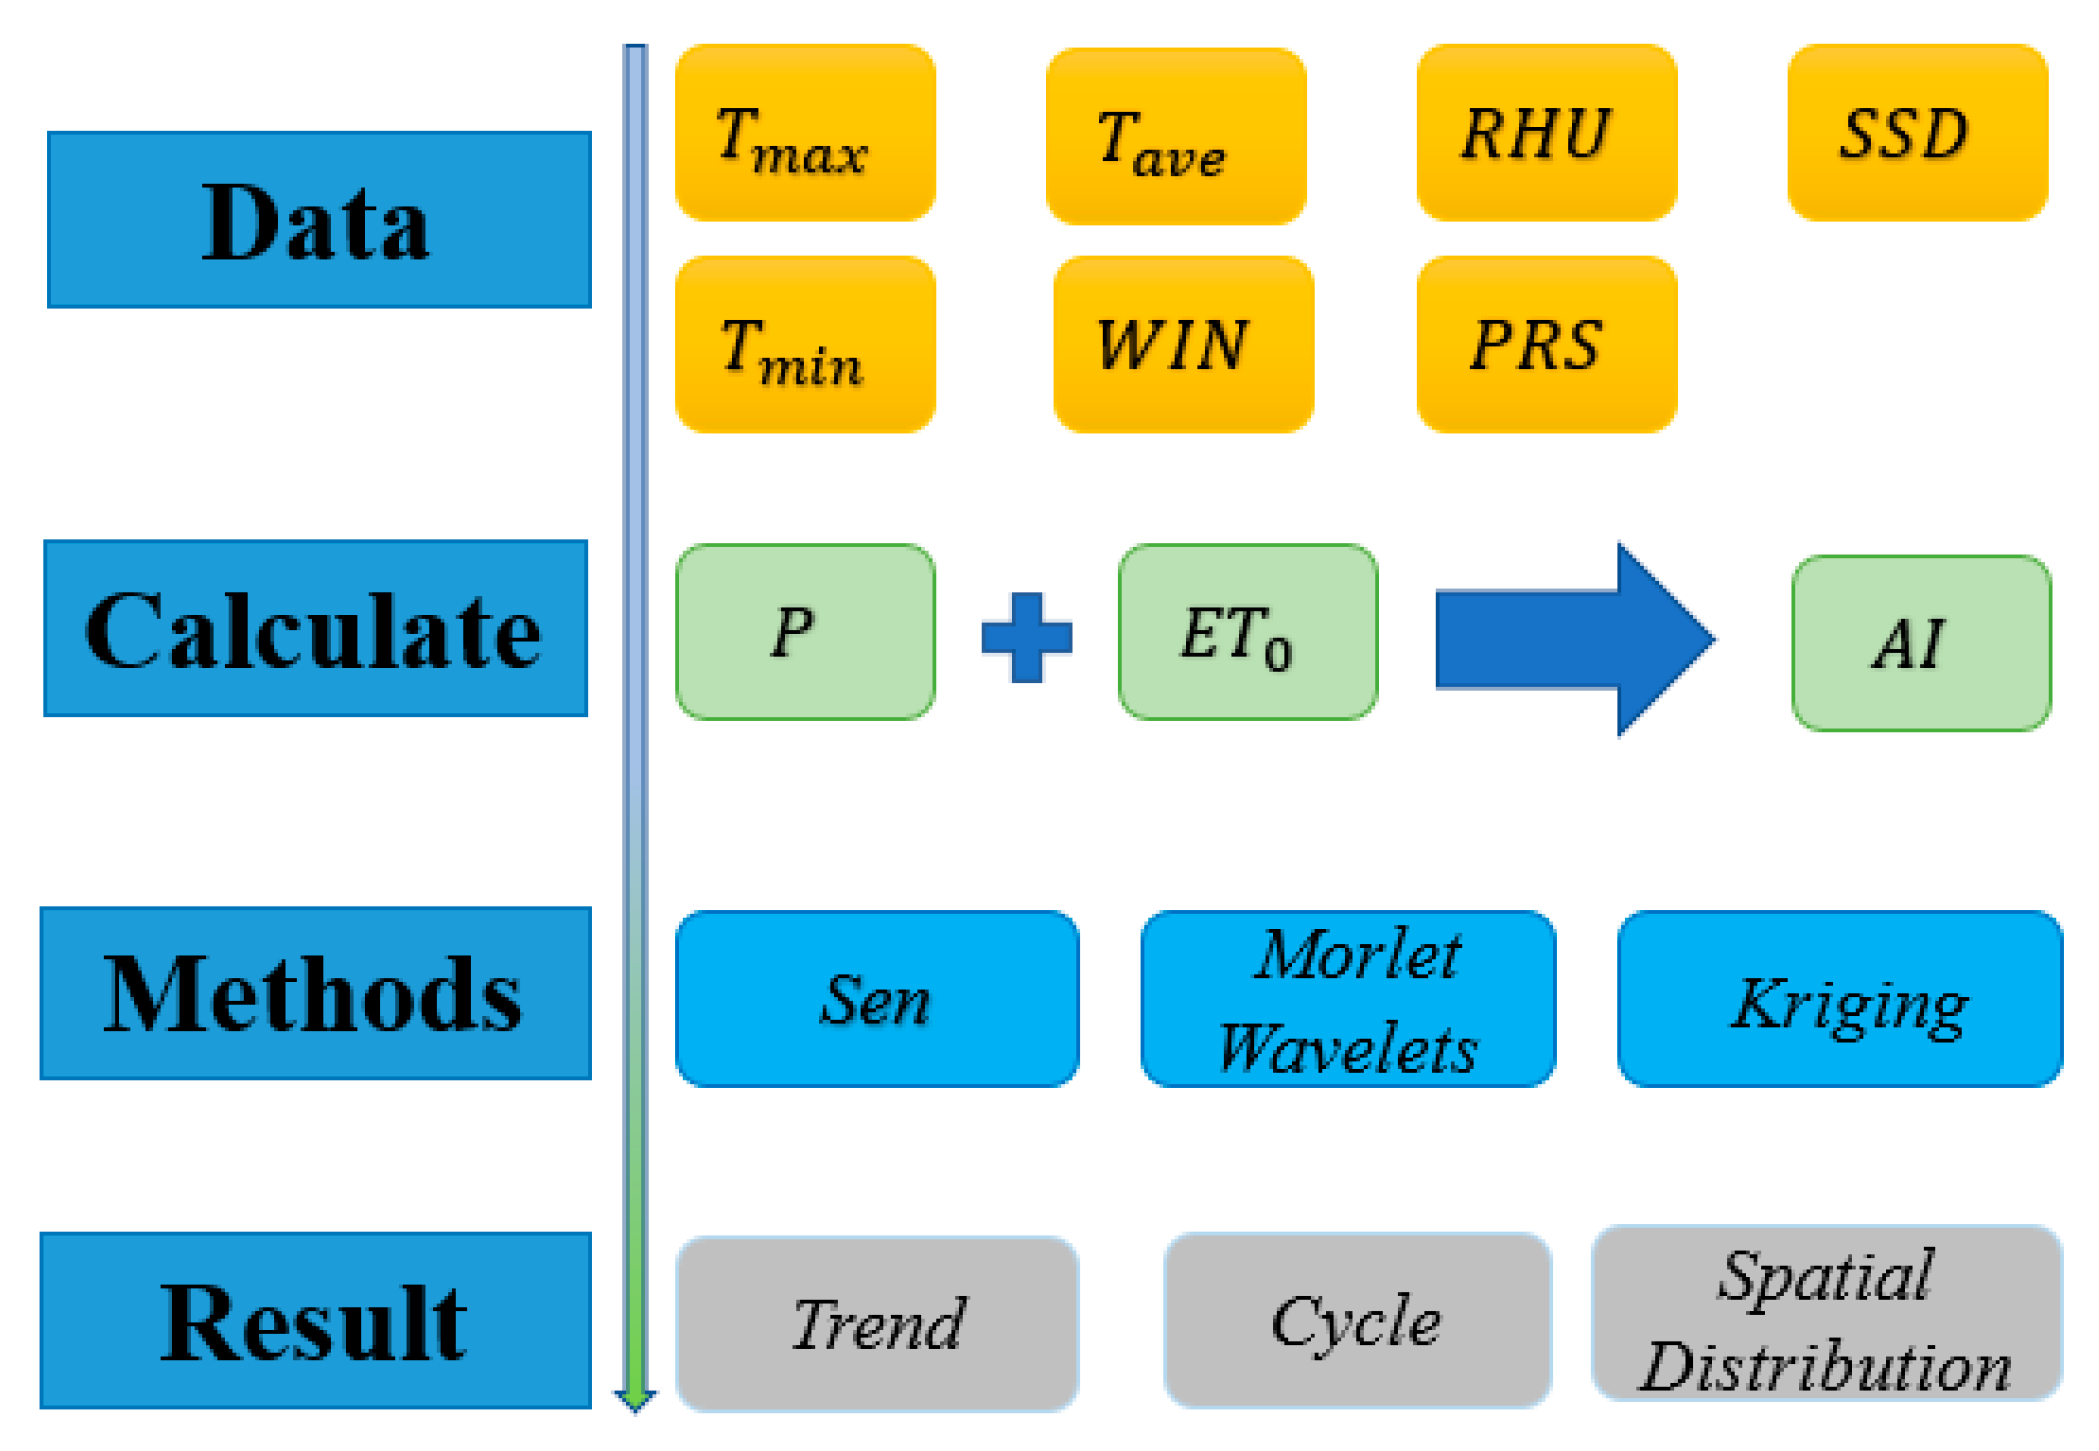
Xinjiang is located in the hinterland of the Eurasian continent at mid-latitudes, along the northwest border of China, between 73°20′~96°25′ E and 34°15′~49°10′ N. The total area of Xinjiang is 1.66 × 10⁶ km2, accounting for about one-sixth of the national area. Three major mountain systems stretch-east-west in the territory, the Altai Mountains in the north, the Kunlun Mountains in the south, and the Tianshan Mountains in the middle, dividing Xinjiang into two parts, the Junggar Basin and the Tarim Basin, forming a unique complex topography of “three mountains and two basins” (Figure 1). Xinjiang has a typical temperate continental arid climate. It is deep inland and far from the sea, surrounded by mountains on three sides, and the widely developed inland rivers form a unique mountain–oversert–desert ecosystem in the global arid zone. The annual precipitation in Xinjiang is low and unevenly distributed in space and time, with an average annual precipitation of 159.43 mm, an average annual temperature of about 8.32 °C, and average annual sunshine hours of 2836 h. Xinjiang is a typical oasis agricultural region, with an increasing oasis area and agriculture as the primary industry of Xinjiang’s development. The scarce precipitation and dry climate make drought a major natural disaster in Xinjiang, and the disaster is widespread, long-lasting, and large in area, causing large losses to the society and agricultural economy.

2.2. Data Source

The meteorological data required for the AI calculation were obtained from the China Meteorological Data Network (https://data.cma.cn/, accessed on 18 October 2021), which mainly consisted of daily minimum and maximum temperatures, average temperatures, average water vapor pressure, average wind speed, sunshine hours, and precipitation at 94 meteorological stations on the ground from 1961 to 2020 in Xinjiang. The digital elevation data (DEM) were ASTER GDEM with 30 m resolution from the Earth Observation Center (https://yceo.yale.edu/aster-gdem-global-elevation-data, accessed on 20 March 2022). The Xinjiang provincial boundary data were obtained from the National Center for Basic Geographic Information (https://www.ngcc.cn/ngcc/html/1/391/392/16114.html, accessed on 1 March 2022). According to Das et al. [34,35] the ordinary kriging (OK) method is a univariate model that is much simpler than regression kriging (RK) and multivariate kriging with external drift (KED), while it has fairly good spatial results with low errors. Therefore, we chose the ordinary kriging method for spatial interpolation (Figure A2). The geographical coordinate system used in this study was WGS_1984.

2.3. Research Methodology

The research framework of this paper is as follows (Figure 2):

2.3.1. Aridity Index

The aridity index is an index reflecting the degree of climate drought and is the ratio of the annual evaporation capacity and the annual precipitation. Since the influence of two physical parameters, potential evapotranspiration, and atmospheric precipitation, on surface dryness and wetness is considered at the same time, the AI is effective for drought monitoring. The formula is:
A I = E T 0 P
where A I is the aridity index, E T 0 is the potential evapotranspiration (mm), and P is the precipitation (mm).
The AI classification method refers to the literature [36], and the corresponding relationship between the value of AI and the division of dry and wet zones is: AI ≤ 1.00 for wet; 1.00 ≤ AI ≤ 1.5 for semi-wet; 1.50 ≤ AI ≤ 4.00 for semiarid; AI ≥ 4.00 for arid.
The potential evapotranspiration E T 0 can be obtained by using the Penman-Monteith method with the formula:
E T 0 = 0.408 ( R n G ) + γ 900 T + 273 U 2 ( e a e d ) + γ ( 1 + 0.34 U 2 )
where R n is the net radiation input to the canopy; = d e s / d T is the slope of the saturation water vapor pressure-temperature curve; γ is the thermometer constant; G is the soil heat flux; T is the mean temperature; U 2 is the 2 m high wind speed; e a is the saturation water vapor pressure; and e d is the actual water vapor pressure. The specific measurement method is referred to in the literature [37].
R n is the net radiation input to the canopy and is calculated as:
R n = R n s R n 1
R n s = 0.77 ( 0.25 + 0.5 n N ) R n
R n 1 = 2.45 × 10 9 ( 0.1 + 0.9 n N ) ( 0.34 0.14 e d ) ( T k s 4 + T k n 4 )
where R n s is the net short-wave radiation; R n 1 is the net long-wave radiation; n represents the daily sunshine hours; N represents the maximum astronomical sunshine hours; T k s is the maximum absolute temperature; and T k n is the minimum absolute temperature.

2.3.2. Mann–Kendall Test (M–K)

The M–K method is recognized as an excellent mutation test, with the advantage that it does not require the sample to follow a certain distribution and is not disturbed by a few outliers. In addition, during the study, we found that the results of M–K often have multiple potential “mutation points.” Therefore, we also tested these mutation points in combination with a t-test, combining the two methods to find the true mutation points. The M–K is a nonparametric test for the time series of meteorological elements [38,39,40], which is not required for the distribution of the series to be tested, is not disturbed by a few outliers, and can clarify the time when the mutation starts. The test was used to analyze the mutation of AI, ET0, and P changes in the last 30 years in Xinjiang, given a significance level α = 0.05 and a critical line U = ±1.96. If there are multiple intersections of UF and UB curves, the mutation point can be determined by combining the sliding t-test corroboration.
U F k = ( S k E [ S k ] ) v a r [ S k ]
where U F 1 = 0 . Let the climate sequence be x 1 , x 2 , , x n , and S k denote the cumulative count of its sample x i > x j , ( 1 j i ) , j = 1 , 2 , i ; i = 1 , 2 , n .   E ( S k ) and v a r [ S k ] are the mean and variance of S k , respectively.
If the UF value is greater than 0 (UF is the positive sequence of time changes), it indicates a continuous growth trend, and the value is at the 0.05 significance level, indicating that it passes the 0.05 significance test; if the intersection of the UF and UB (UB is the reverse sequence of time changes) curves are within the confidence interval, the specific year of the intersection is the mutation point.

2.3.3. Sliding T-Test

In order to make the mutation test results more accurate, this paper combined the sliding t-test method for co-testing [41,42]. This method artificially set a certain moment as the reference point under a time series with n sample sizes, and the samples of x1 and x2 under the two sub-series before and after were n1 and n2, respectively, and defined the statistics.
t = x ¯ 1 x ¯ 2 s · 1 n 1 + 1 n 2 ~ t ( n 1 + n 2 2 )
where x 1 ¯ and x 2 ¯ are the means of the two subsequences, respectively, and S 1 2 and S 2 2 are the variances. s is calculated by the following equation:
s = n 1 S 1 2 + n 2 S 1 2 n 1 + n 2 2
Given the significance level α, we checked the t distribution table to obtain the critical value tα. If | t i | > t α , the mutation is considered to have occurred at that reference point moment.

2.3.4. Morlet Wavelets

Morlet wavelets have both good localization and multiresolution properties in the time and frequency domains, providing the possibility to better study time series problems, to discern the magnitude of the multi-timescale periodicity contained in the time series and the distribution of these periods in the time domain, and to make qualitative estimates of the future trends of the system [43,44]. In this paper, the Morlet wavelet function was used to analyze the aridity, potential evapotranspiration, and precipitation over the whole territory for the last 30 years.
ω f ( a , b ) = | a | 1 2 f ( t ) d t ϕ ( t b a ) d t = { f ( t ) , ϕ a , b ( t ) }
where ω f ( a , b ) is called the wavelet coefficient; a is the scale scaling factor; b is the time translation factor; and ϕ a , b ( t ) is a set of functions made by ϕ ( t ) scaling and translation, called continuous wavelets.

2.3.5. Theil–Sen Analysis

The Theil–Sen Median method, also known as the Sen slope estimation, is a robust trend calculation method with nonparametric statistics [45,46]. This method is computationally efficient, insensitive to measurement errors and outlier data, and is often used in trend analysis of long time series data.
β = M e d i a n ( x j x i j i )
where Median () stands for taking the median value; if β is greater than 0, it indicates a growing trend in the time series, and vice versa, indicates a decreasing trend.

2.3.6. Spatial Autocorrelation Analysis

Spatial autocorrelation refers to geographical things distributed in different spatial locations which have a statistical correlation of one attribute value; generally speaking, the closer the distance, the greater the correlation [47,48]. The global spatial autocorrelation index (Moran index) was first used to determine whether there was spatial autocorrelation of the temperature and precipitation in Xinjiang, and then hotspot analysis was conducted to determine the spatial distribution of various types of clusters.
I = n i = 1 n j = 1 n W i j ( x i x ¯ ) i = 1 n j = 1 n W i j i = 1 n ( x i x ¯ ) 2
where n is the number of Tyson polygons divided in Xinjiang; x i and x j are the observations at regions i and j, respectively; x ¯ is the average of the observations; and W i j is the spatial weight matrix.
When the Moran index > 0, the spatial distribution is positively correlated, and the correlation increases with its value, indicating that the research object has spatial clustering characteristics; when the Moran index < 0, the spatial distribution is negatively correlated, and the spatial variability increases with its value, indicating that the research object has spatial dispersion characteristics; when the Moran index = 0, the spatial distribution has randomness, and the research object does not present spatial dispersion characteristics. The Z value is used to indicate the significance of the correlation; when Z > 2.58 or Z < −2.58, it indicates that there is significant spatial autocorrelation of the research object in space and vice versa, respectively.

3. Results

3.1. Precipitation

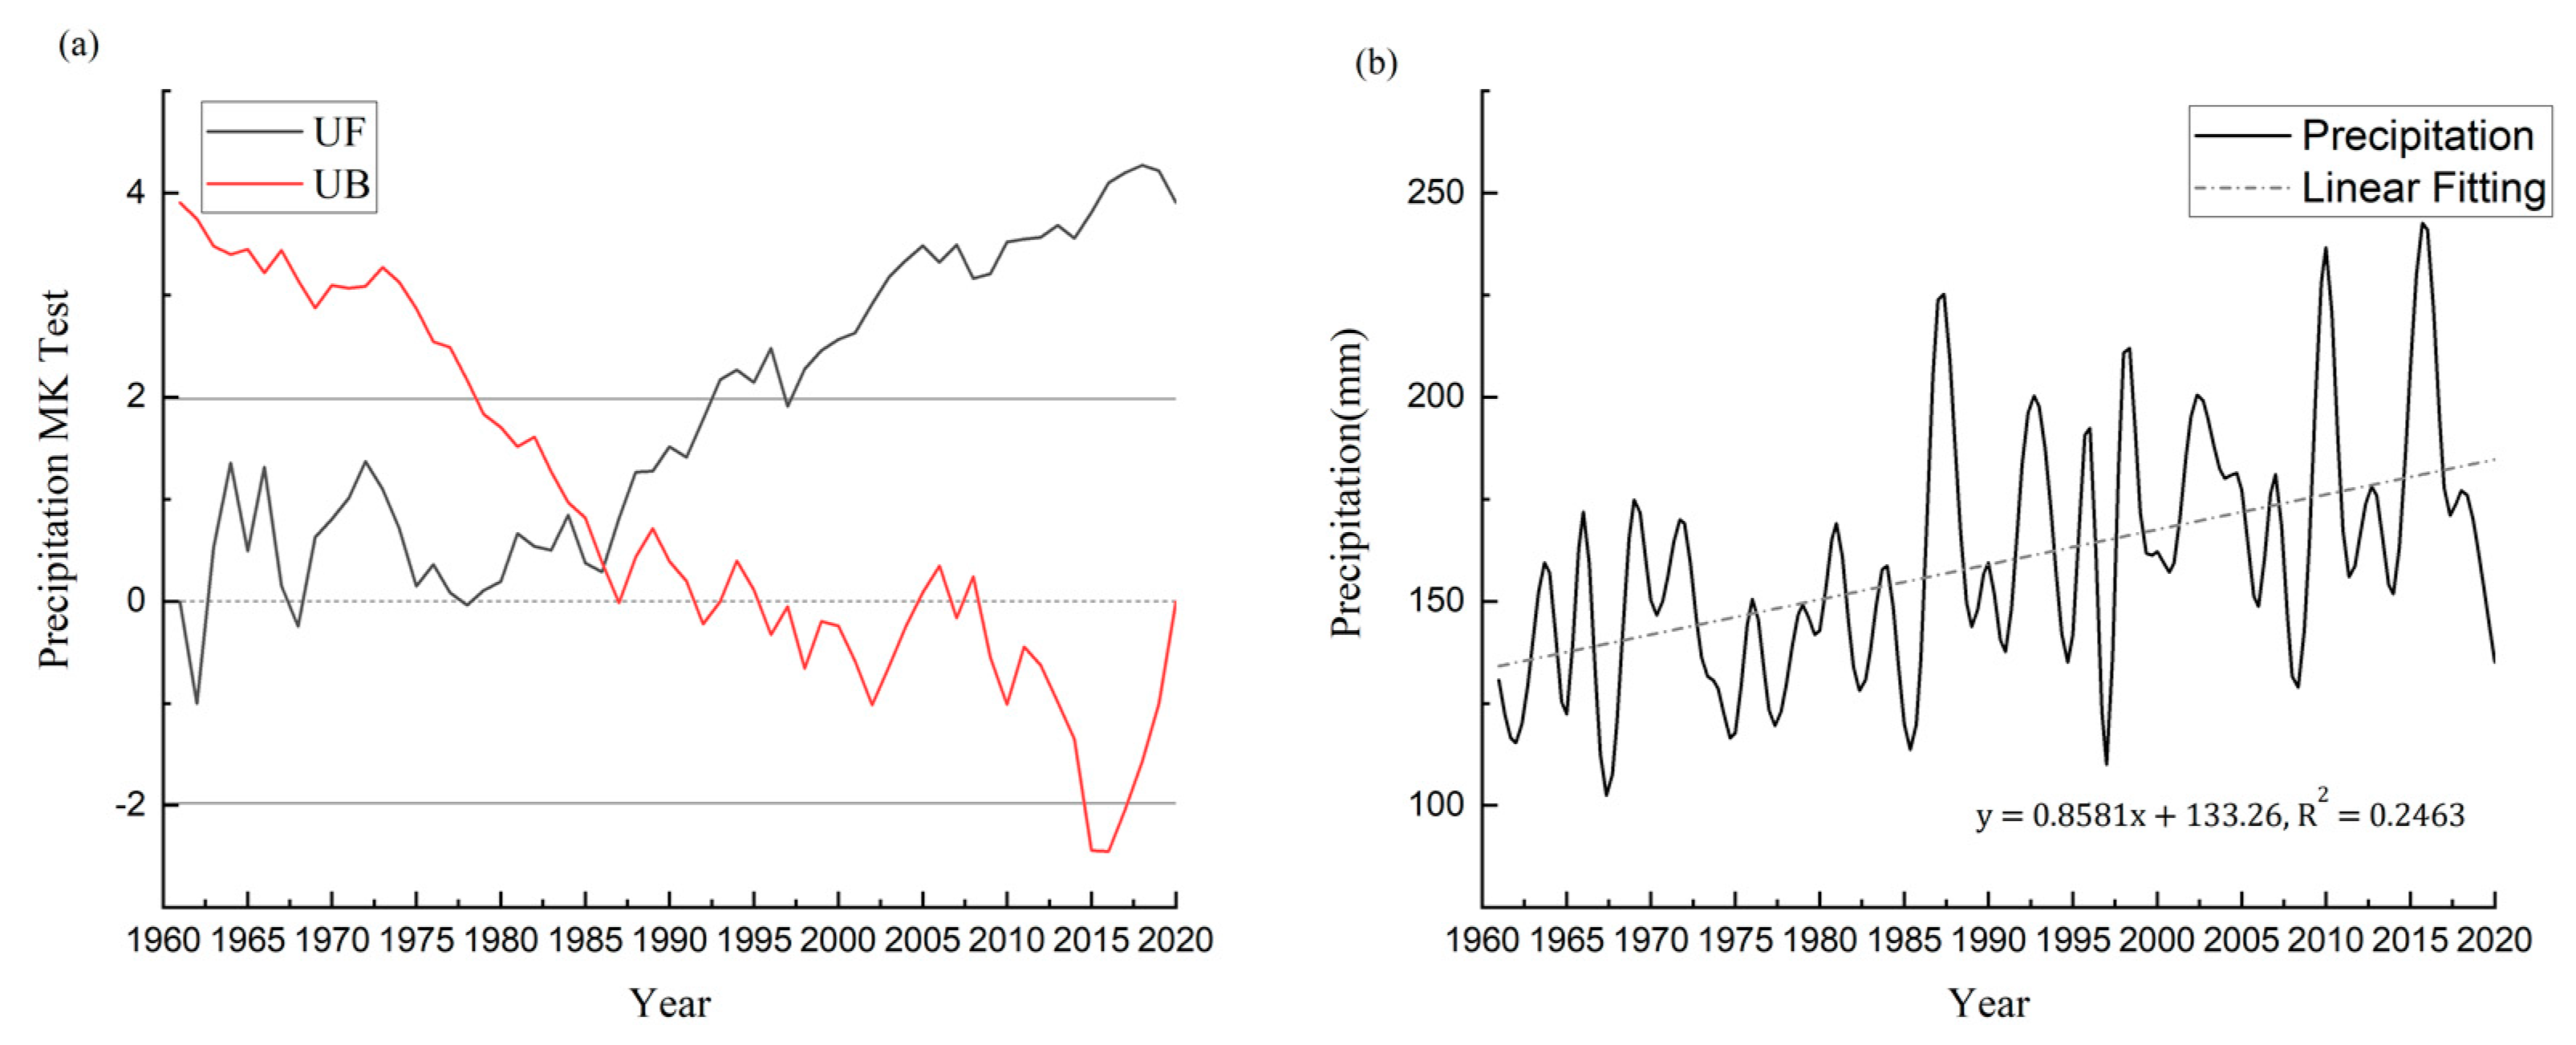
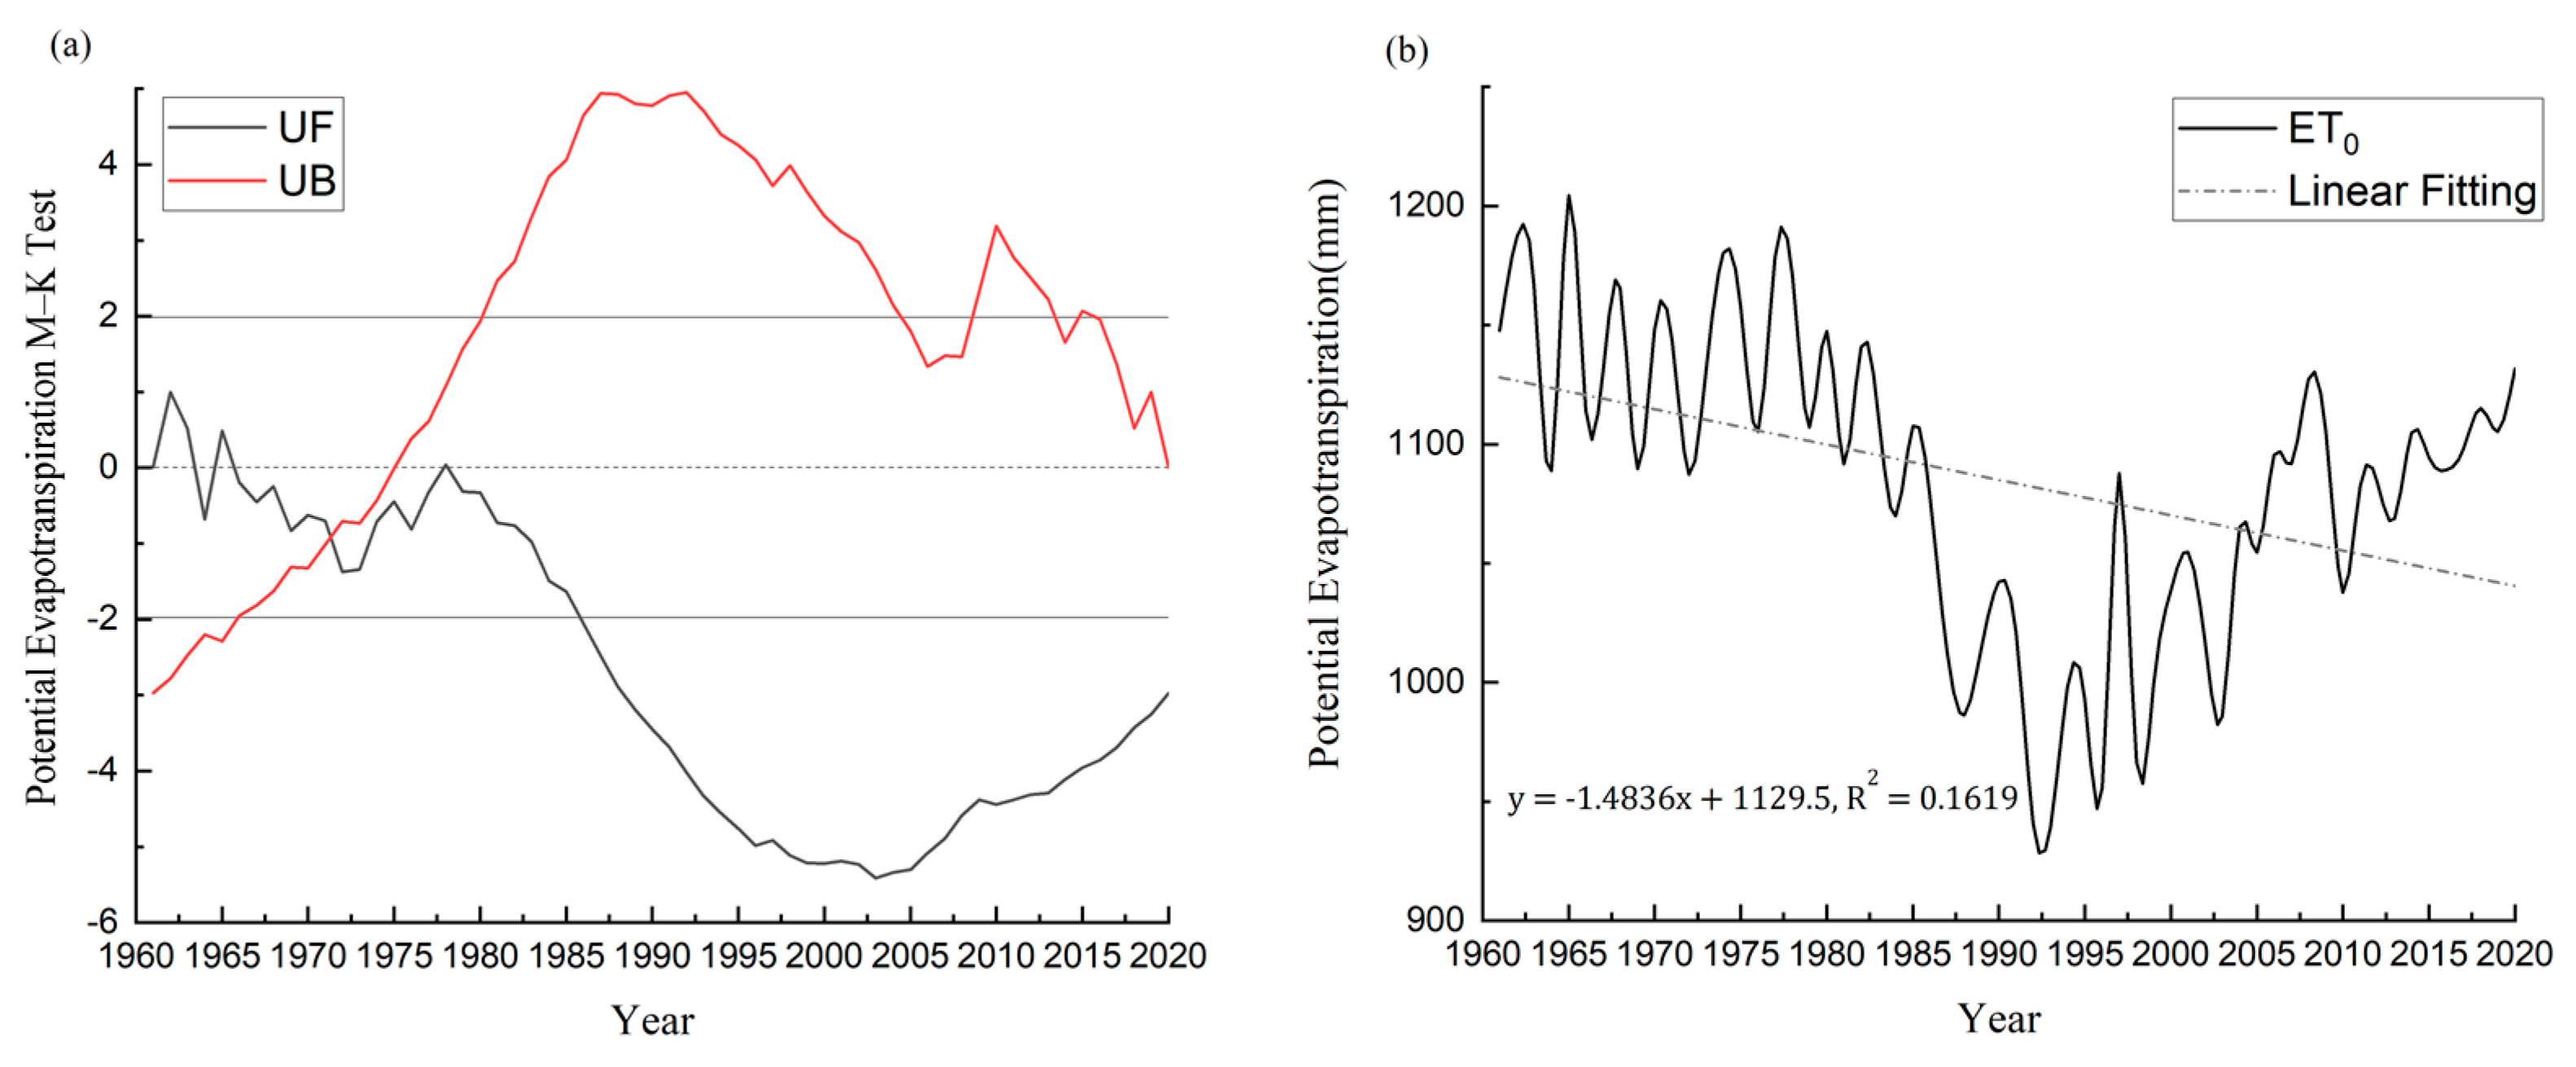
3.1.1. Mutation Test and Trend Analysis of the Precipitation

The M–K mutation test was used to analyze the precipitation over the last 60 years in Xinjiang. The UF and UB curves of the precipitation intersected in 1986 (Figure 3a). From the UF curve, the precipitation showed a nonsignificant increasing trend during 1963–1992; after 1992, the UF curve broke the confidence line, indicating a significant increasing trend of precipitation.
The overall trend of precipitation in Xinjiang over the past 60 years was fluctuating and increasing, with an average variable rate of 8.58 mm/10 a (Figure 3b). The multiyear average of precipitation was 159.43 mm, with a maximum value of 240.95 mm in 2016 and a minimum value of 109.99 mm in 1997, with a coefficient of variation of 18.78% and more obvious interannual fluctuations.

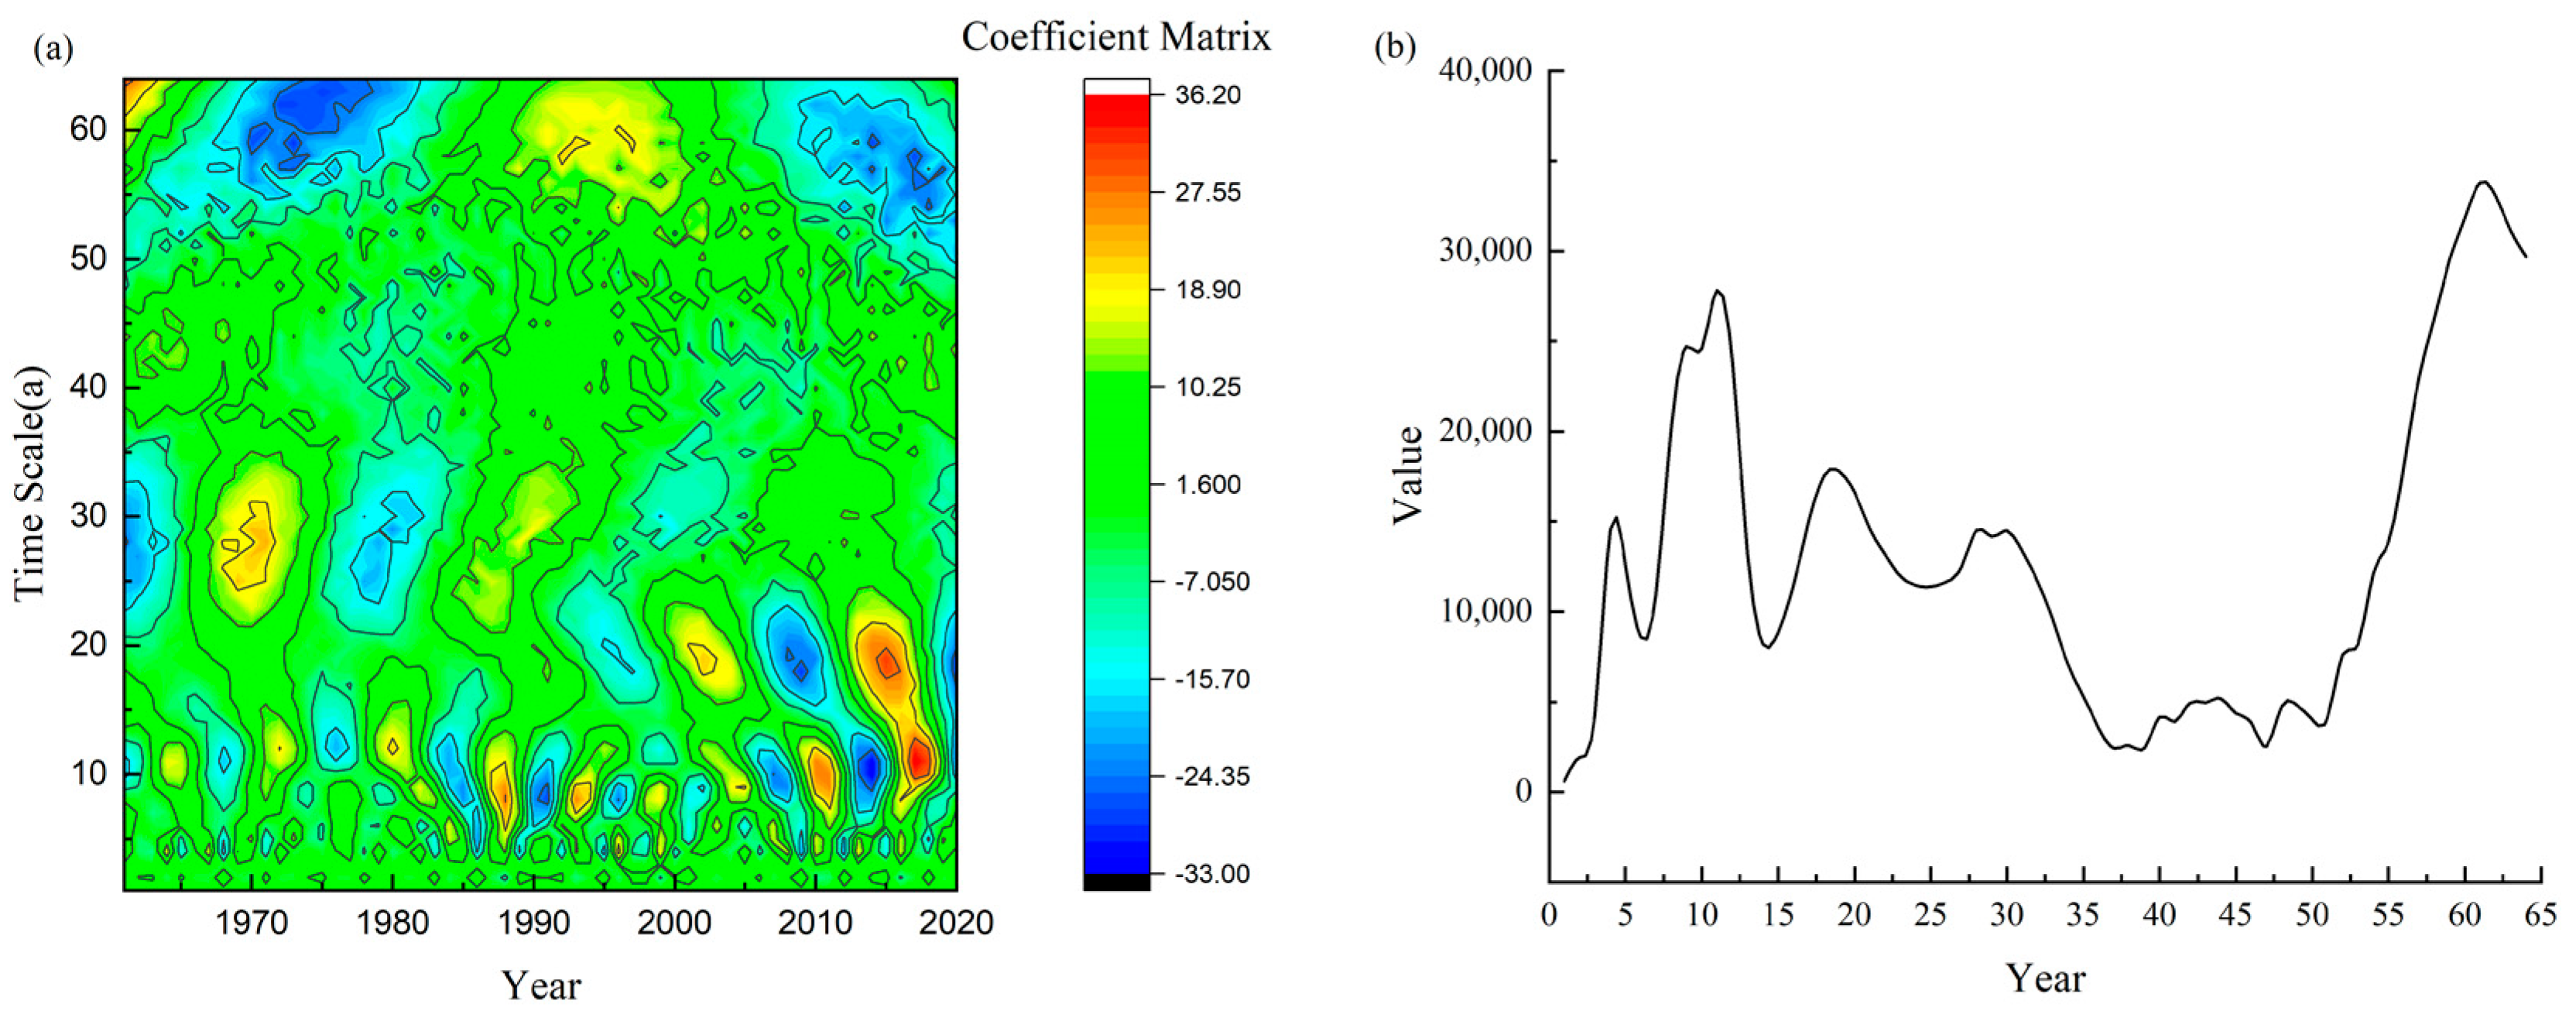
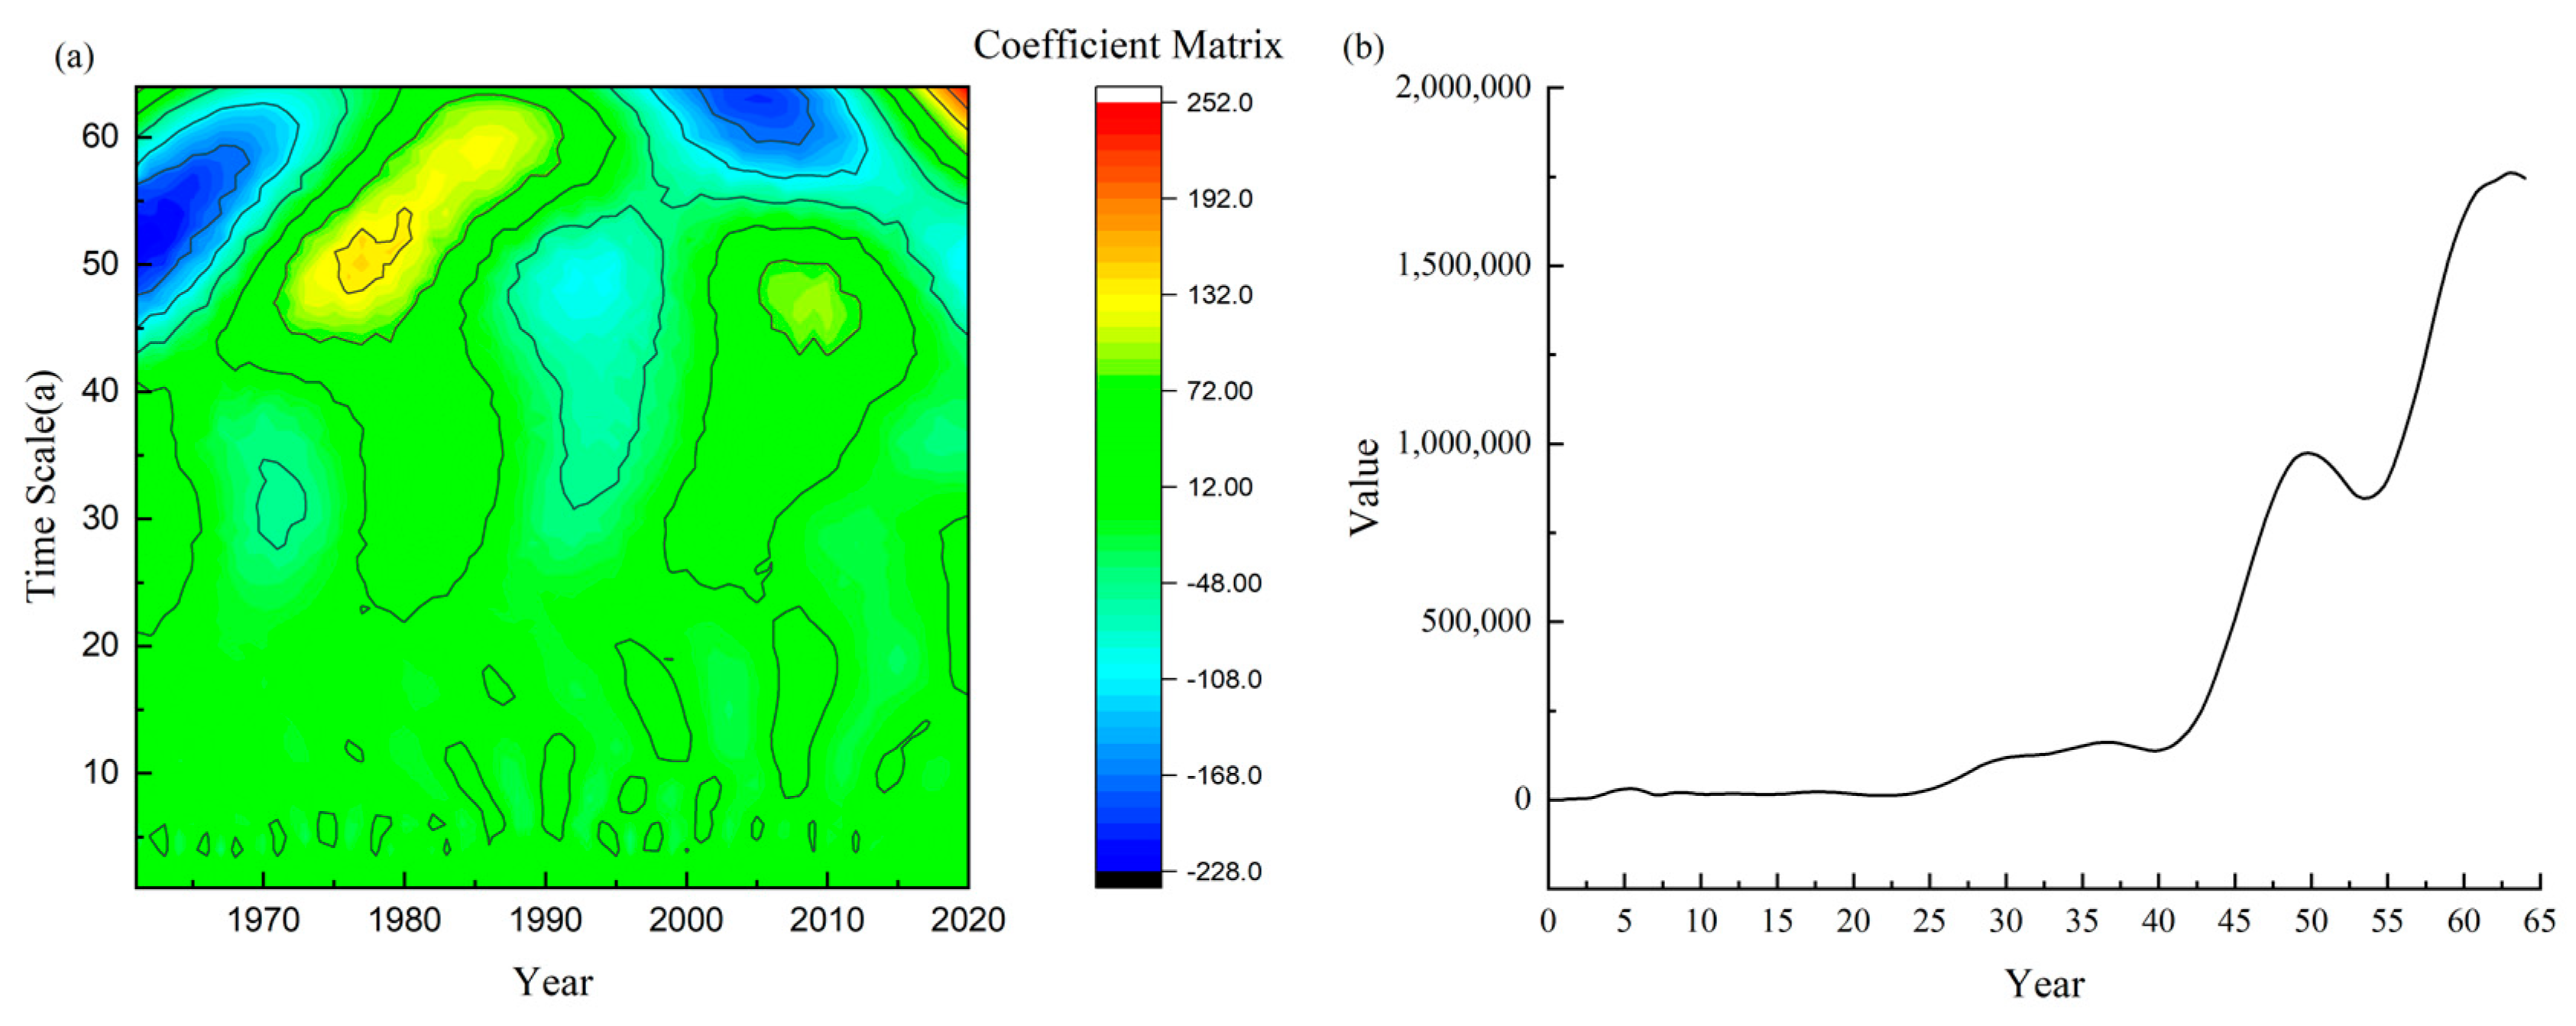
3.1.2. Cycle Analysis of Precipitation

A first main cycle (time scale) of 61 years and submain cycles of 11 and 19 years existed for the precipitation in Xinjiang (Figure 4). Under the 61-year time scale, precipitation was most cyclic, with a cycle of 39 years. Under the 11-year time scale, the cycle was 8 years, and the cycle was weak and insignificant from 1961 to 1990; under the 19-year time scale, the cycle was 12 years, and the cycle was weak and insignificant. From the structure of the wavelet transform of precipitation, it is known that the cycle changes in the next 19–20 years under the 61-year time scale will be mainly within the positive half-cycle, and the precipitation in Xinjiang is expected to increase in the next few years.

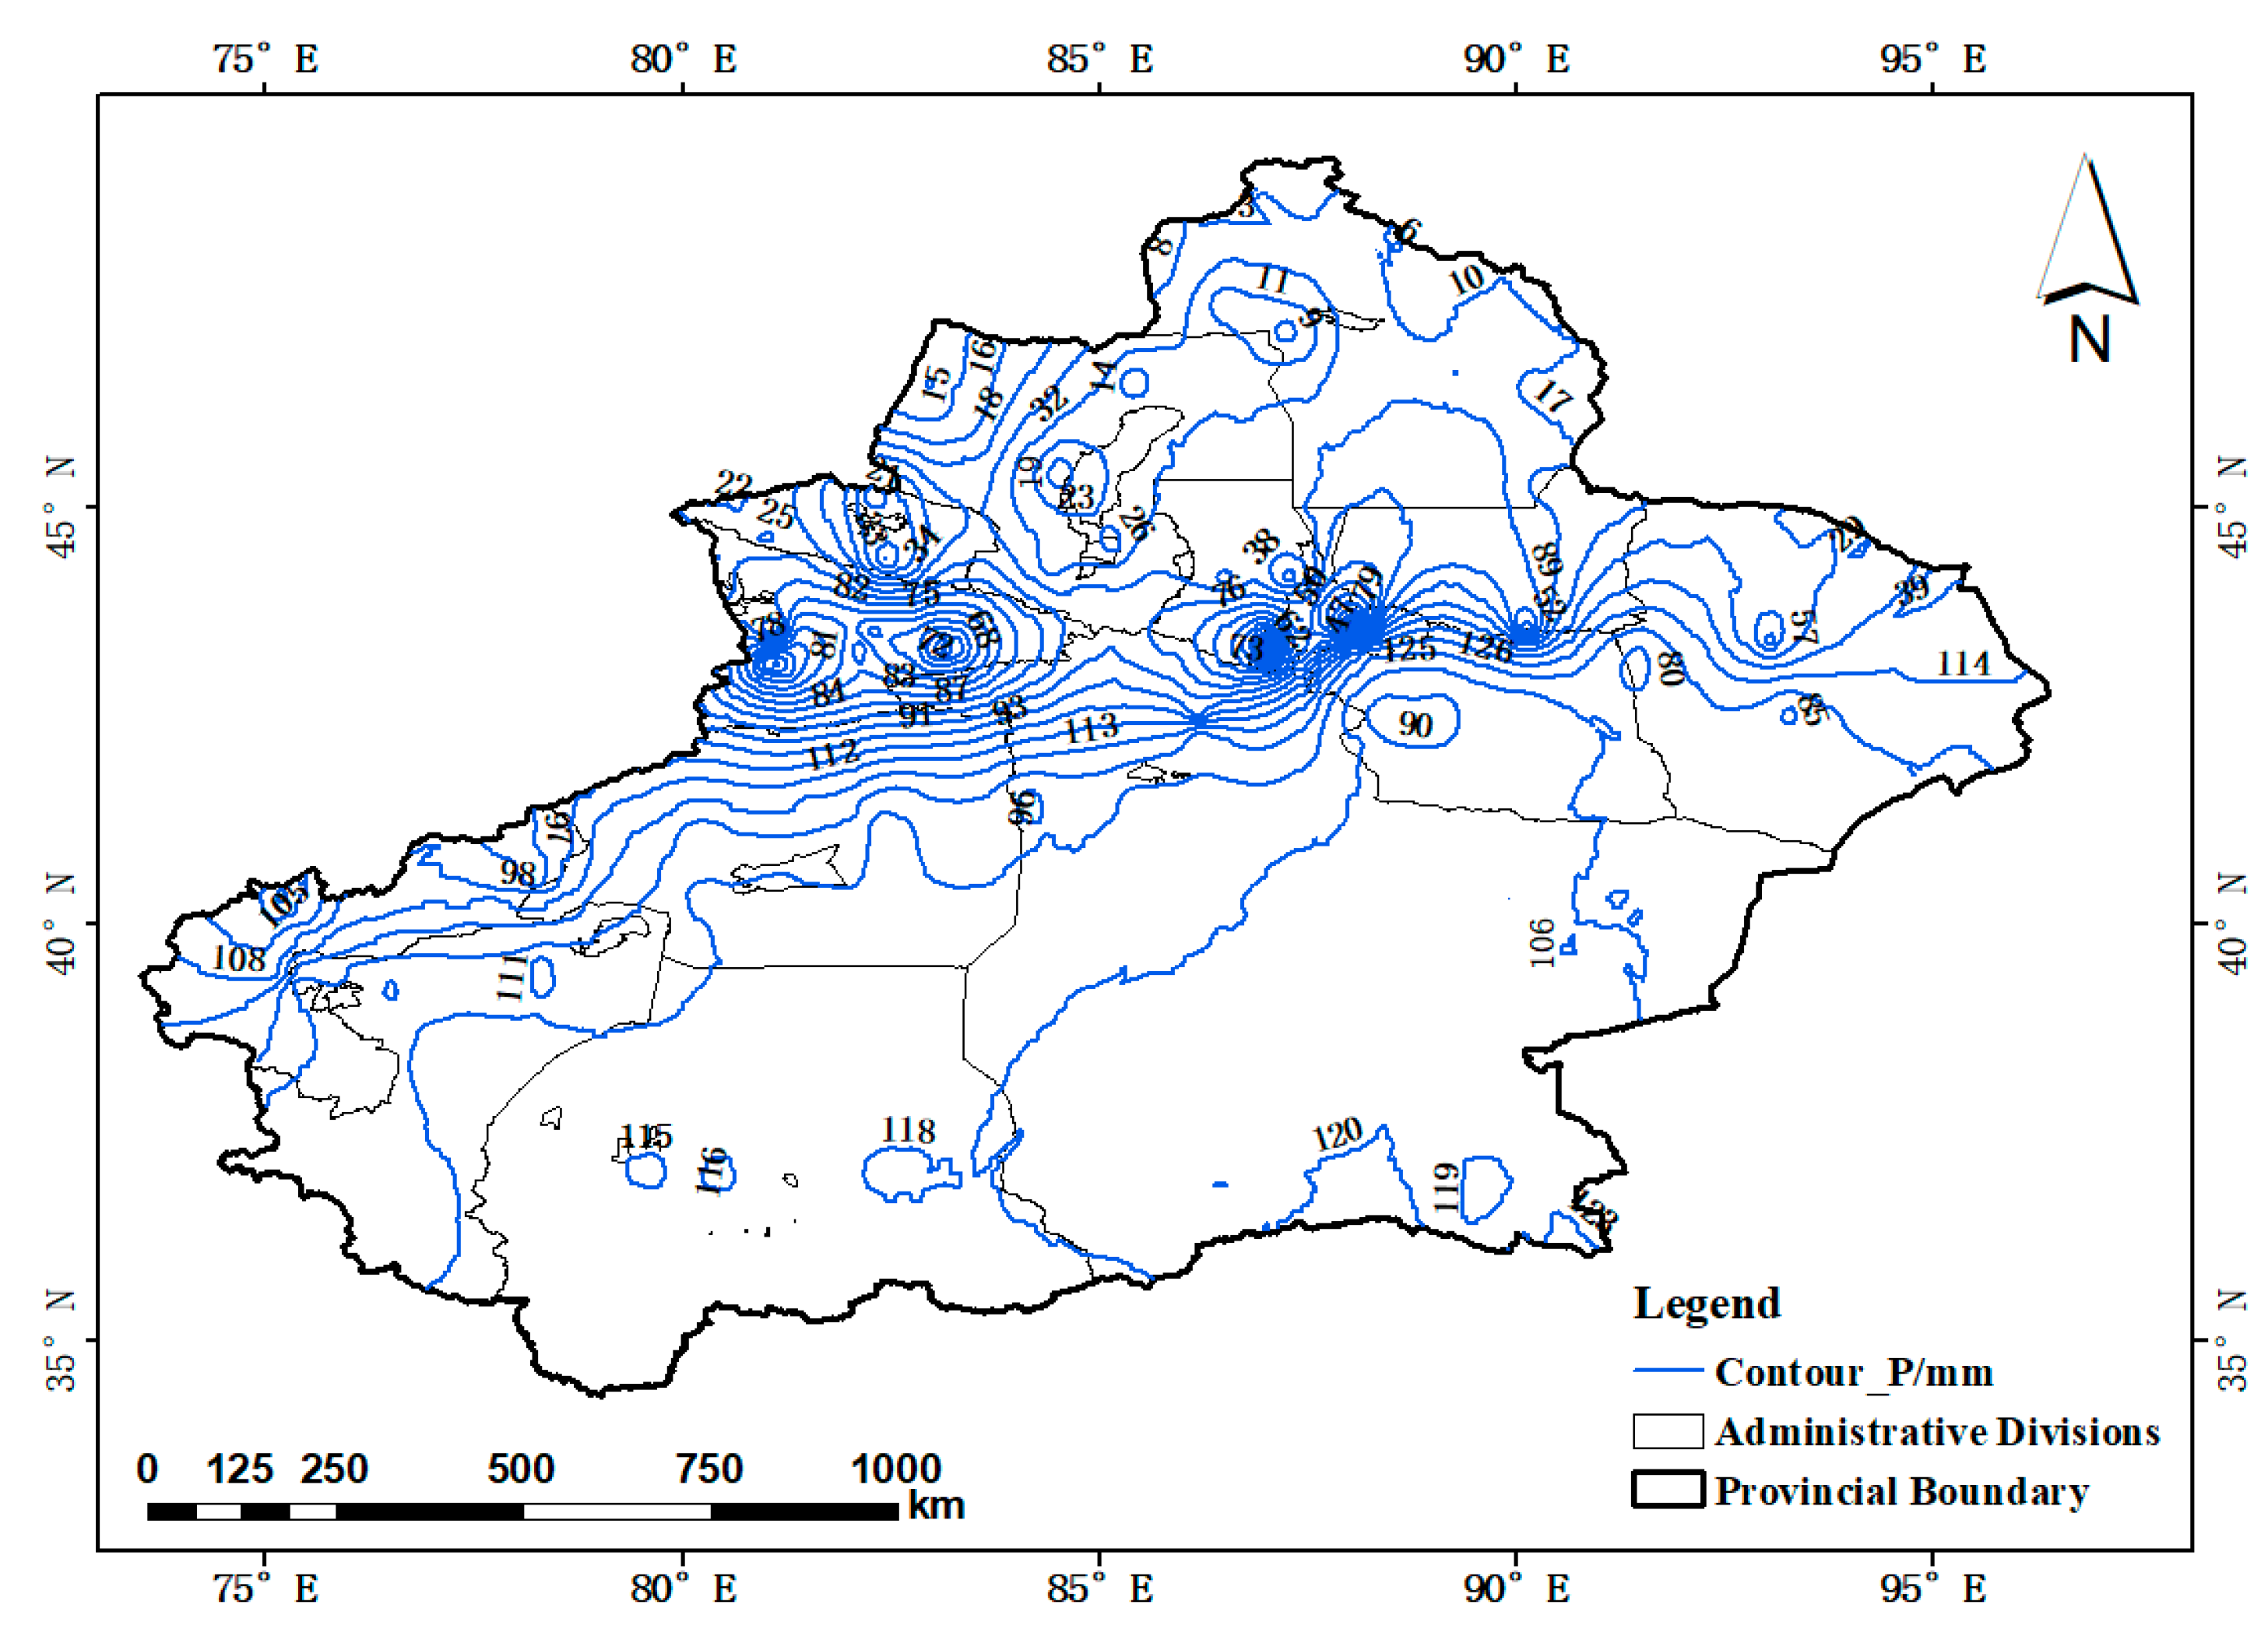
3.1.3. Spatial Distribution of the Precipitation

The spatial distribution of the precipitation in Xinjiang shows that the mountain area had more than the basin plain, the west had more than the east, and northern Xinjiang had significantly more than southern Xinjiang, showing a pattern of more precipitation in the north and less in the south (Figure 5). The average annual precipitation in northern Xinjiang was 243.26 mm, while in southern Xinjiang, it was only 87.20 mm, and in eastern Xinjiang, 61.32 mm. In total, 42.55% of the stations with average annual precipitation less than 100 mm were located mostly around the Taklamakan Desert in southern Xinjiang and near the Tuha Basin in the east; then, 26.60% of the stations were between 100 and 200 mm; the percentage of stations greater than 200 mm was 30.85%, with Xinyuan, Zhaosu, Xiaoquzi, and Tianchi having the most precipitation, exceeding 500 mm. Furthermore, 89 of 94 meteorological stations in Xinjiang in the last 60 years showed an increasing trend in precipitation, accounting for 94.68%, and the stations with the largest increasing trend were Ahechi and Urumqi. The westward water vapor brought by the westerly latitudinal circulation and the dry and cold-water vapor from the Arctic Ocean was blocked by the tall mountains in the central north of Xinjiang, making the precipitation in the mountains of Xinjiang much greater than that in the basin plains.

3.2. Potential Evapotranspiration (ET0)

3.2.1. Mutation Testing and Trend Analysis of the Potential Evapotranspiration

The UF and UB curves of the potential evapotranspiration intersected in 1971 (Figure 6a) and were within the critical line (When using the sliding t-test, the mutation point was 1987). The UF curve changed from positive to negative in 1966, indicating a nonsignificant decreasing trend of the potential evapotranspiration in Xinjiang; it broke the confidence line in 1986, indicating a significant decreasing trend of the potential evapotranspiration in Xinjiang.
In the past 60 years, the potential evapotranspiration in Xinjiang has shown a significant decreasing trend with an average variable rate of −14.84 mm/10 a (Figure 6b). The multiyear average value of the potential evapotranspiration was 1084.28 mm, with a maximum value of 1204.50 mm in 1965 and a minimum value of 939.07 mm in 1993, with a coefficient of variation of 5.89% and insignificant interannual fluctuations.

3.2.2. Cycle Analysis of Potential Evapotranspiration

The first main cycle of 50 years existed for the potential evapotranspiration in Xinjiang (Figure 7). Under the 50-year time scale, there existed a 29-year cycle of potential evapotranspiration, which was weak and insignificant. From the wavelet transform structure of potential evapotranspiration, we know that the cycle change in the next 8–9 years under the 63-year time scale will still be within the negative half-cycle, and it is expected that the potential evapotranspiration in Xinjiang will have a decreasing trend in the next few years.

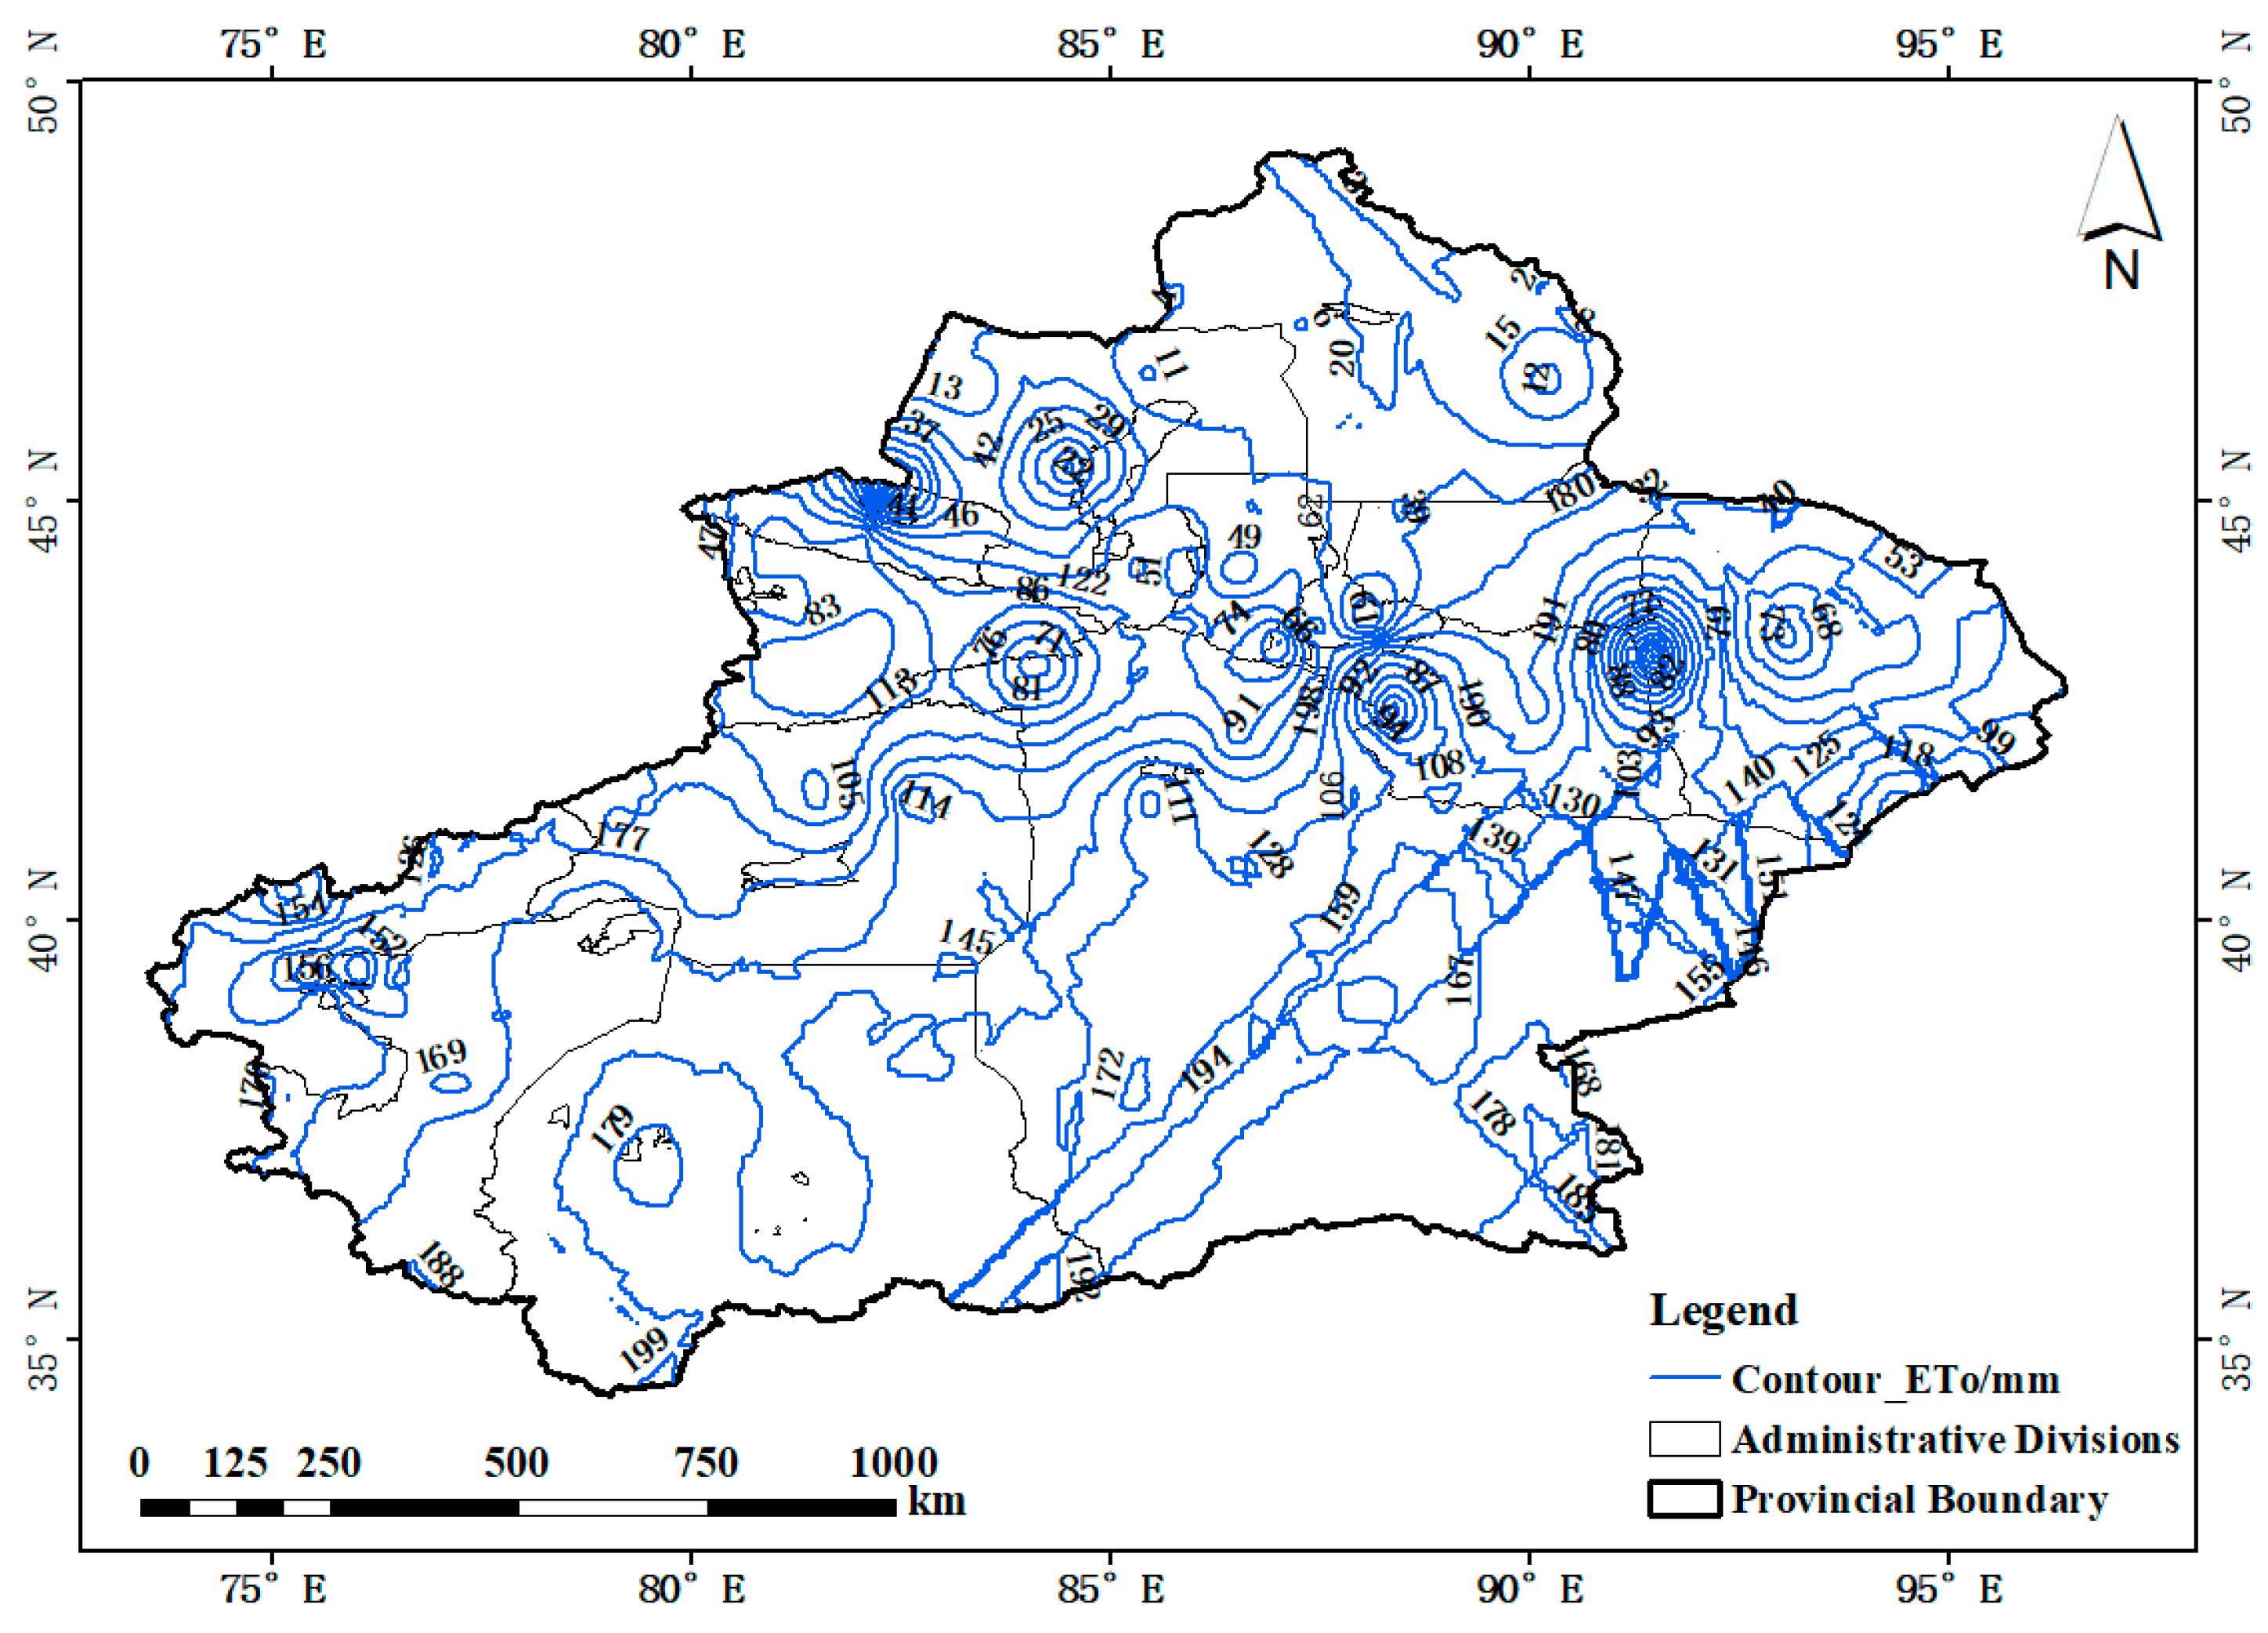
3.2.3. Spatial Distribution of Potential Evapotranspiration

The multiyear average potential evapotranspiration in northern Xinjiang was 1000.31 mm; in southern Xinjiang, it was 1096.36 mm, and in eastern Xinjiang, it was 1450.48 mm. The spatial distribution characteristics of the potential evapotranspiration in the whole of Xinjiang were lower in northern Xinjiang than in southern Xinjiang and higher in eastern Xinjiang than in western Xinjiang (Figure 8). Among 94 meteorological stations in Xinjiang, there were 20 stations higher than 1200 mm, accounting for 21.28%; there were 38 stations between 1000 and 1200 mm, accounting for 40.43%; and 38.3% of stations were lower than 1000 mm. Only 20 sites had an increasing trend of potential evapotranspiration, accounting for 21.28%, while the remaining sites had a decreasing trend. The increasing trend of potential evapotranspiration was most significant at the sites of Aksu, Balikun, Fuyun, and Hetian, and the decreasing trend was most significant at the sites of Karamay and Aktau.

3.3. Aridity Index (AI)

3.3.1. Mutation Test and Trend Analysis of AI

There were several intersection points of the UF and UB curves of the AI within the confidence line (Figure 9a), and the sudden change point of the Xinjiang aridity index was determined to be 1987 by using the sliding t-test for analysis. From the UF curve, the AI showed a fluctuating decreasing trend before 1992; the UF curve broke through the lower confidence line in 1992, and the AI decreased significantly, indicating a clear trend of drought relief in Xinjiang.
The AI in Xinjiang showed a slightly decreasing trend at the rate of −1.94/10a from 1961 to 2020, indicating a trend of wetting climate in Xinjiang (Figure 9b). The multiyear mean value of the AI was 23.26; the maximum value was 64.53 in 1968, and the minimum value was 11.03 in 2002, with a difference of 53.50 between the maximum and minimum values and a coefficient of variation of 41.31%, indicating that the interannual fluctuation of the AI in Xinjiang was obvious. In 1968, when the precipitation was scarce, and the evaporation was strong in Xinjiang, the AI was at its maximum, indicating a mega-drought event; in addition to 1968, the AIs in 1967, 1980, 1985, 1997, and 2019 were also relatively large, indicating that a large drought occurred in Xinjiang in these years.

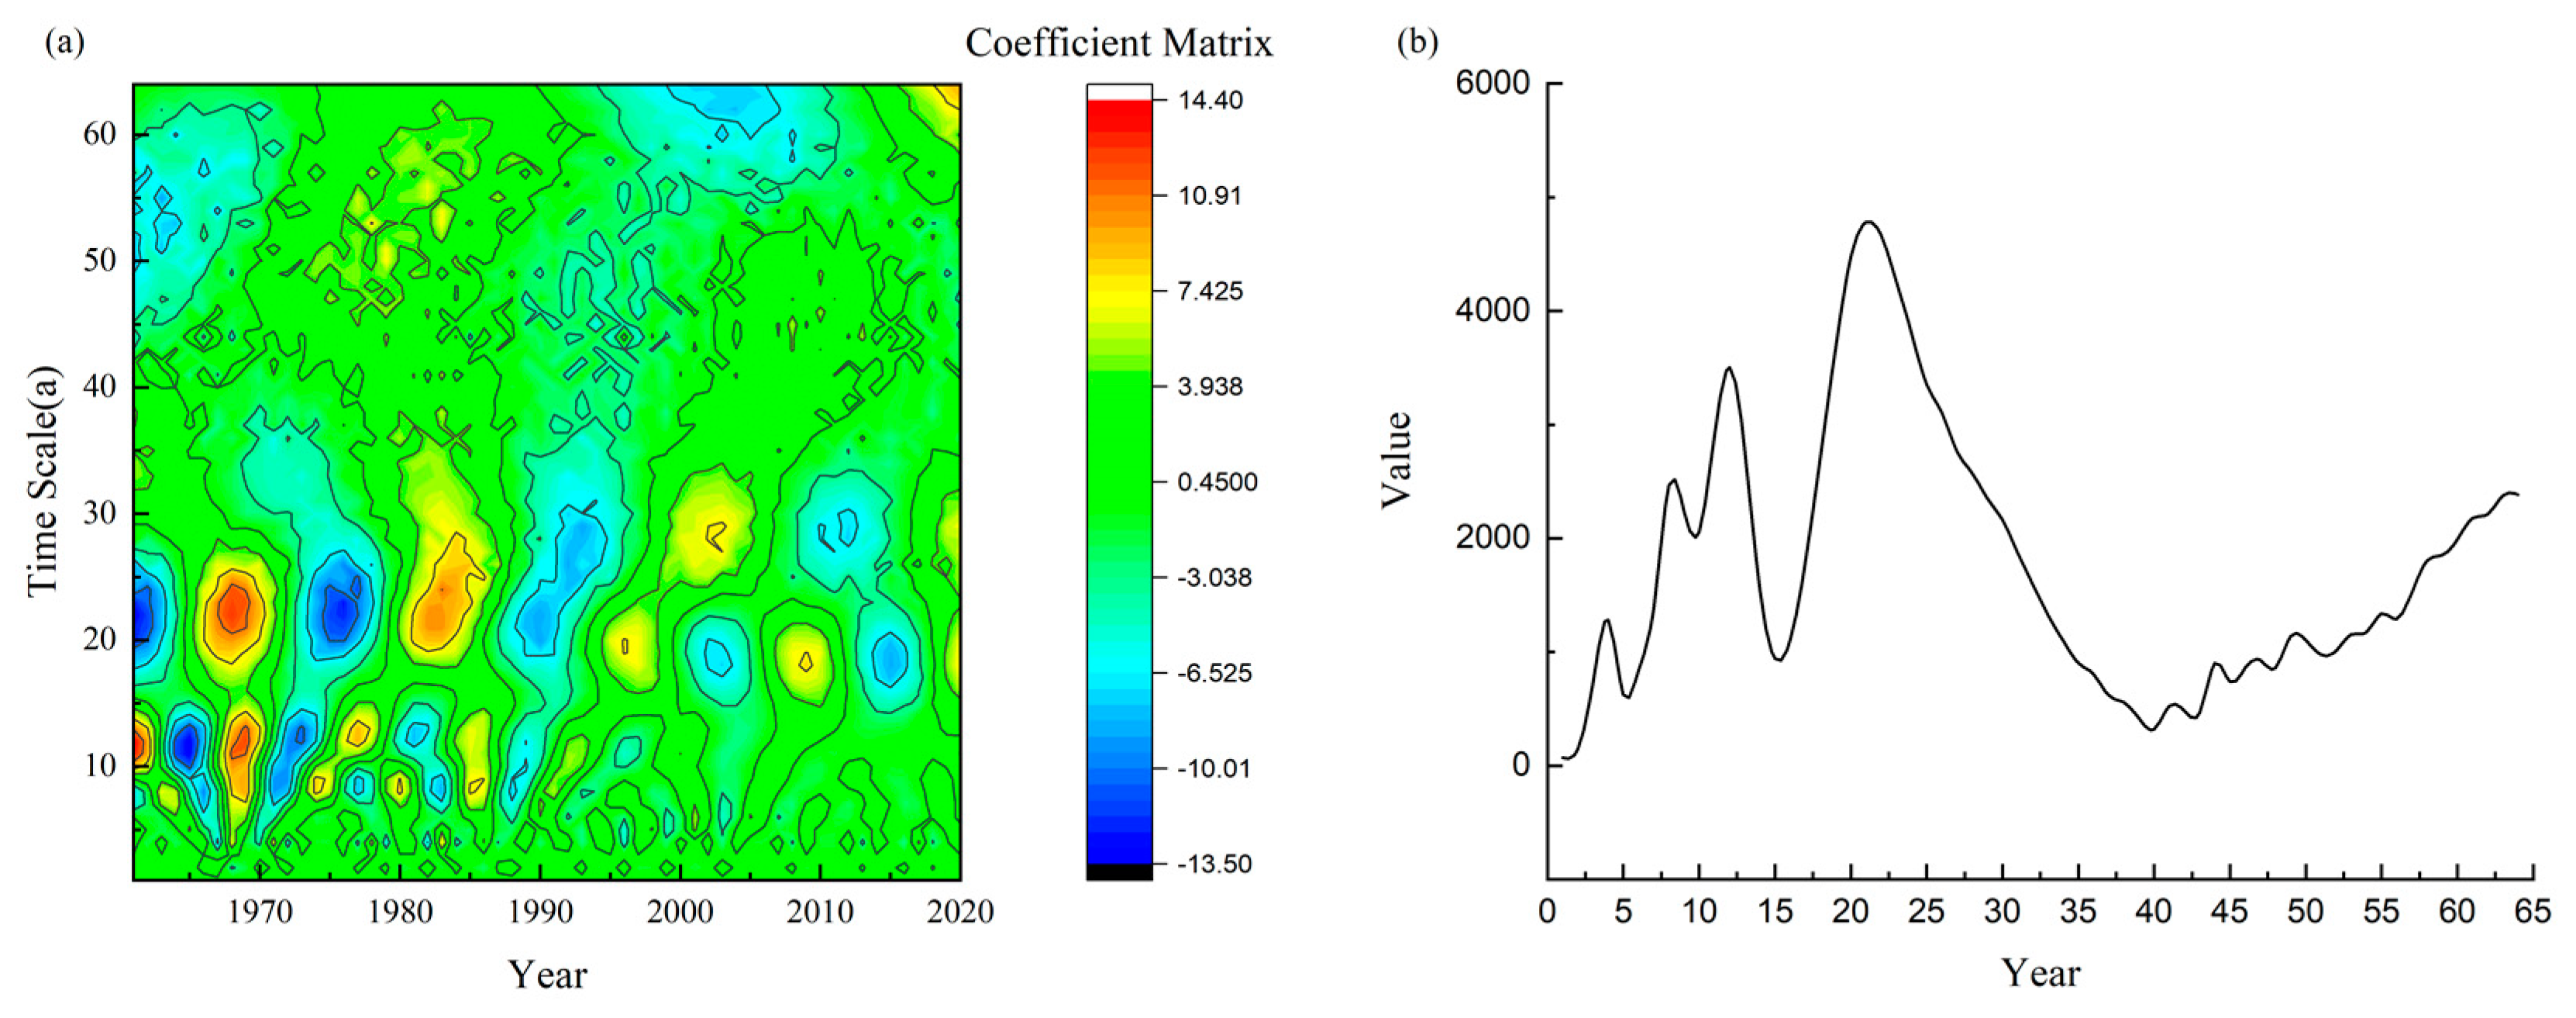
3.3.2. Cycle Analysis of the AI

There existed a first main cycle (time scale) of 21 years for the AI in Xinjiang and secondary main cycles of 12 and 8 years (Figure 10). Under the 21-year time scale, the AI cycle was 14 years, which was the strongest and most obvious; under the 12-year time scale, the cycle was 8 years; the cycle was weak, and the cycle was not obvious after 1990. Under the 8-year time scale, the cycle was 5 years; the cycle was weak, and the cycle was less obvious from 1985. From the wavelet transform structure of the Xinjiang AI, we know that, under the 21-year time scale, the aridity index will have an increasing trend in the next 1–3 years, and the cycle change will turn negative in the next 4–10 years in the half-cycle, and the Xinjiang AI will have a decreasing trend.

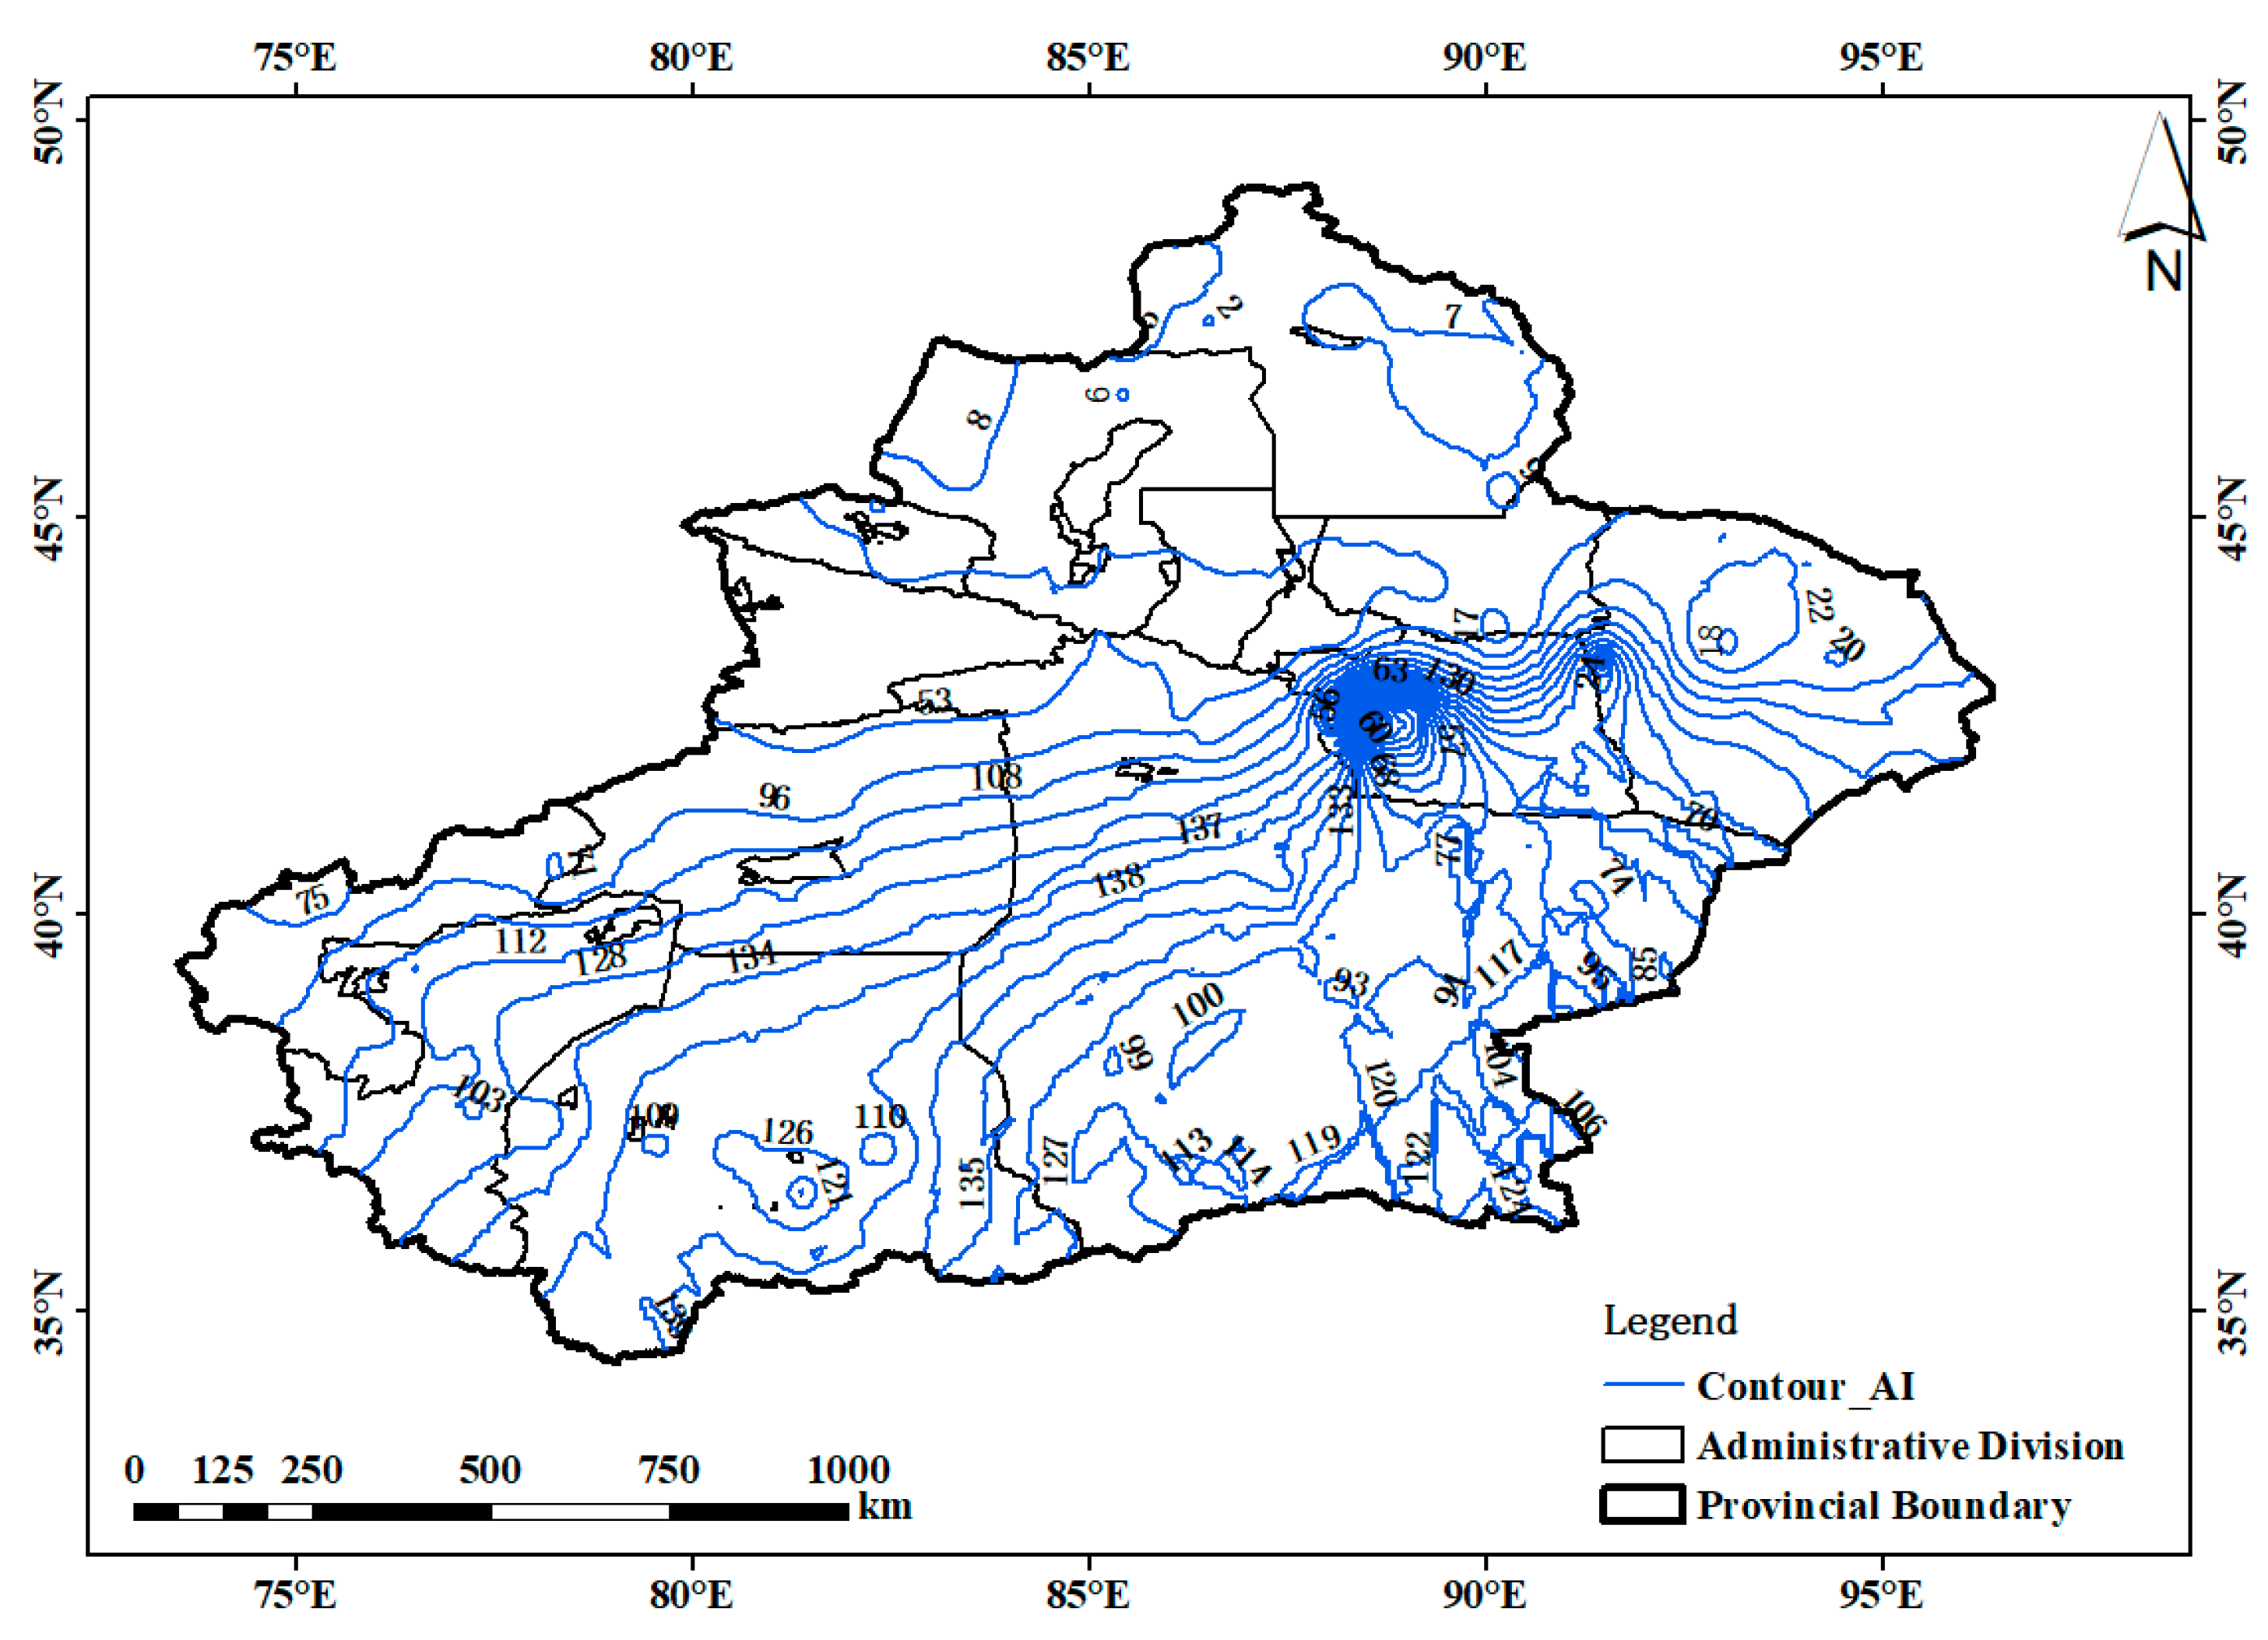
3.3.3. Spatial Distribution of the AI

The AI is affected by the joint influence of the potential evapotranspiration and precipitation, and the spatial distribution of the AI in Xinjiang showed that: southern Xinjiang was higher than northern Xinjiang, eastern was higher than western, and the basin was higher than the mountainous area (Figure 11). The spatial distribution patterns of the precipitation and AI were relatively similar, indicating that the spatial distribution of AI is very sensitive to precipitation. The average AI in northern Xinjiang was 5.88, and the lowest AI in Yili was 2.95; the AI in southern Xinjiang was generally high, with an average value of 50.84, and Kezhou 10.37 had the lowest value area of aridity in southern Xinjiang; the average AI in eastern Xinjiang was 49.31, and the AI was generally large except for Balikun and Iwu. Among the 94 stations in Xinjiang, only the AI of 13 stations showed an increasing trend, and the rest of the stations showed a decreasing trend.
Most of northern Xinjiang was a low-value area of AI, the AI was high at the edge of Tarim Basin (Figure 1 and Figure 11) in southern Xinjiang, and the AI was generally high in Hami and Turpan in eastern Xinjiang. The west wind circulation carries water vapor into Xinjiang from the Ili Valley and Bozhou, and the two states have more precipitation and less potential evapotranspiration, so the AI was low. The cold air from the south of the Arctic Ocean enters the Altay region and converges with the westerly circulation, with active warm and humid air masses and more precipitation, and the potential evapotranspiration is smaller due to the influence of latitude and topography, so the AI was lower. The area around Hami–Turpan has abundant sunshine and wind resources, precipitation is scarce, and evapotranspiration is high. In contrast, the Tarim Basin and its edges in South Xinjiang, which are between Tianshan, Kunlun, and Aljinshan, and the extensive Taklamakan Desert in the interior of the basin, are influenced by the location of sea and land and closed topography, with fewer water vapor sources and long sunshine hours, resulting in a higher AI in this region.

4. Discussion

In recent decades, many scholars have studied global and regional wet and dry conditions. Dai [49] analyzed the global drought characteristics since 1950 and concluded that the global drought trend has increased in the context of climate warming, with an increase in a drought area, drought duration, and drought frequency, especially the area of extreme droughts increasing to twice as much as in the past. Mondal et al. [50] used the standardized precipitation evaporation index (SPEI) as the basis for evaluating drought characteristics in Southeast Asia. The results showed that the frequency of drought and the area of drought increased with increasing radiation forcing under different climatic conditions. Xinjiang is a very ecologically fragile region and the core part of the mid-latitude arid region of Asia, a transition zone where the westerly and monsoonal climates interact, and it is very sensitive to the corresponding global climate change [51]. This paper analyses the aridity characteristics of Xinjiang by calculating rainfall, potential evapotranspiration, and AI at 94 meteorological stations in Xinjiang using daily value meteorological data, indicating a trend towards wetting.
From 1961 to 2020, the AI in Xinjiang gradually decreased over time, a result that is generally consistent with the findings of Zhang [52] and Huo [53], who studied AI in China as a whole and in northwest China, but it is different from the results of Liu [54] and others on Xinjiang, although they were both based on meteorological station observations and the FAO-56 Penman-Monteith equation for potential evapotranspiration, which may be an error caused by the data source and interpolation method, etc. The AI of Xinjiang changed abruptly in 1987, and there was a 14-year cycle. The aridity indices in the 1960s, 1970s, 1980s, 1990s, 2000s, and 2010s were: 31.73, 25.77, 22.43, 18.88, 20.05, and 20.69, respectively. The AI of Xinjiang showed a spatial pattern in which southern Xinjiang was higher than northern Xinjiang, eastern Xinjiang was higher than western Xinjiang, and the basins were higher than the mountainous areas. The spatial pattern was stronger in the south than in the north, in the east than in the west, and in the basin than in the mountains. Some scholars have considered that the climate in the northwest underwent a shift from warm and dry to warm and wet around 1987 [52,55], while the average temperature in Xinjiang has increased by 0.30 °C per decade over the past 60 years, with an increasing trend in precipitation variability and an average rate of change of 8.58 mm/10a.
Further global spatial autocorrelation analysis and cold hotspot analysis were conducted for the precipitation and temperature [56]. As can be seen from Table A1 (Appendix A), the Moran index was 0.41 and 0.33, respectively, with z-values greater than 2.58 (p < 0.01), indicating that there was a significant spatial autocorrelation for both the precipitation and temperature in Xinjiang. As can be seen from Figure A1, the precipitation hotspots were concentrated in Yili, Urumqi, Tacheng, and Changji, with the most significant hotspot in Yili, while many areas in southern Xinjiang were low-value precipitation areas, with the most significant cold spot in Bazhou. Average temperature hotspot areas were concentrated in most of southern Xinjiang and Toksun in eastern Xinjiang, while the cold spot areas were mainly in northern Xinjiang in Altay, Tacheng, Changji, and Urumqi, with the most significant cold spot in Altay.
AI is influenced by numerous factors, which will be examined in the future. At present, the influence of climatic factors and atmospheric circulation on AI has been investigated using different methods [52,54], and the conclusions obtained were not entirely consistent. In addition, there are many other factors that can influence it, such as vegetation, soil, and human activities, which also need to be enhanced in future research. The AI was based on the actual data from the meteorological stations to determine the dry and wet conditions of the surrounding area, but due to the scarcity of stations in the high mountains and desert areas of Xinjiang and the lack of observational data, only station data from the plains could be used to reflect the characteristics of climate change in Xinjiang. In the future, more remote sensing inversion data and reanalysis data can be used to conduct large regional studies to make up for the lack of data.

5. Conclusions

This paper explored the trends, cycles, and spatial distributions of the P, ET0, and AI in the Xinjiang region by trend analysis, the M–K mutation test, and Morlet wavelet analysis using the Kriging interpolation method based on data from 94 meteorological stations in the Xinjiang region from 1961 to 2020. This study uses a case study in Xinjiang to be able to provide support for local social activities such as agricultural production. Compared to case studies in other regions, there are still relatively few relevant studies in Xinjiang, and some of the current drought mechanisms are still unclear. We used essentially the complete data available for the current study, which is one of the prerequisites for our study to be meaningful. In addition, since the remote sensing data and simulation data sets are not accurate, our next study will consider whether we can calibrate these data to obtain more complete data for the Xinjiang region. The results of the study are as follows:
(1)
The precipitation, potential evapotranspiration, and AI in Xinjiang changed abruptly around 1986, 1971, and 1987, and there were cycles of 39, 29, and 14 years, respectively.
(2)
In the past 60 years, the AI in Xinjiang has shown an insignificant decreasing trend with a tendency rate of −1.94/10a, indicating that the climate in Xinjiang has a trend of becoming wetter, and the coefficient of variation was 41.31%, indicating that the interannual fluctuation of the Xinjiang desiccation index was obvious. The potential evapotranspiration and precipitation showed a decreasing and increasing trend with a variable rate of −14.84 mm/10a and 8.58 mm/10a, respectively.
(3)
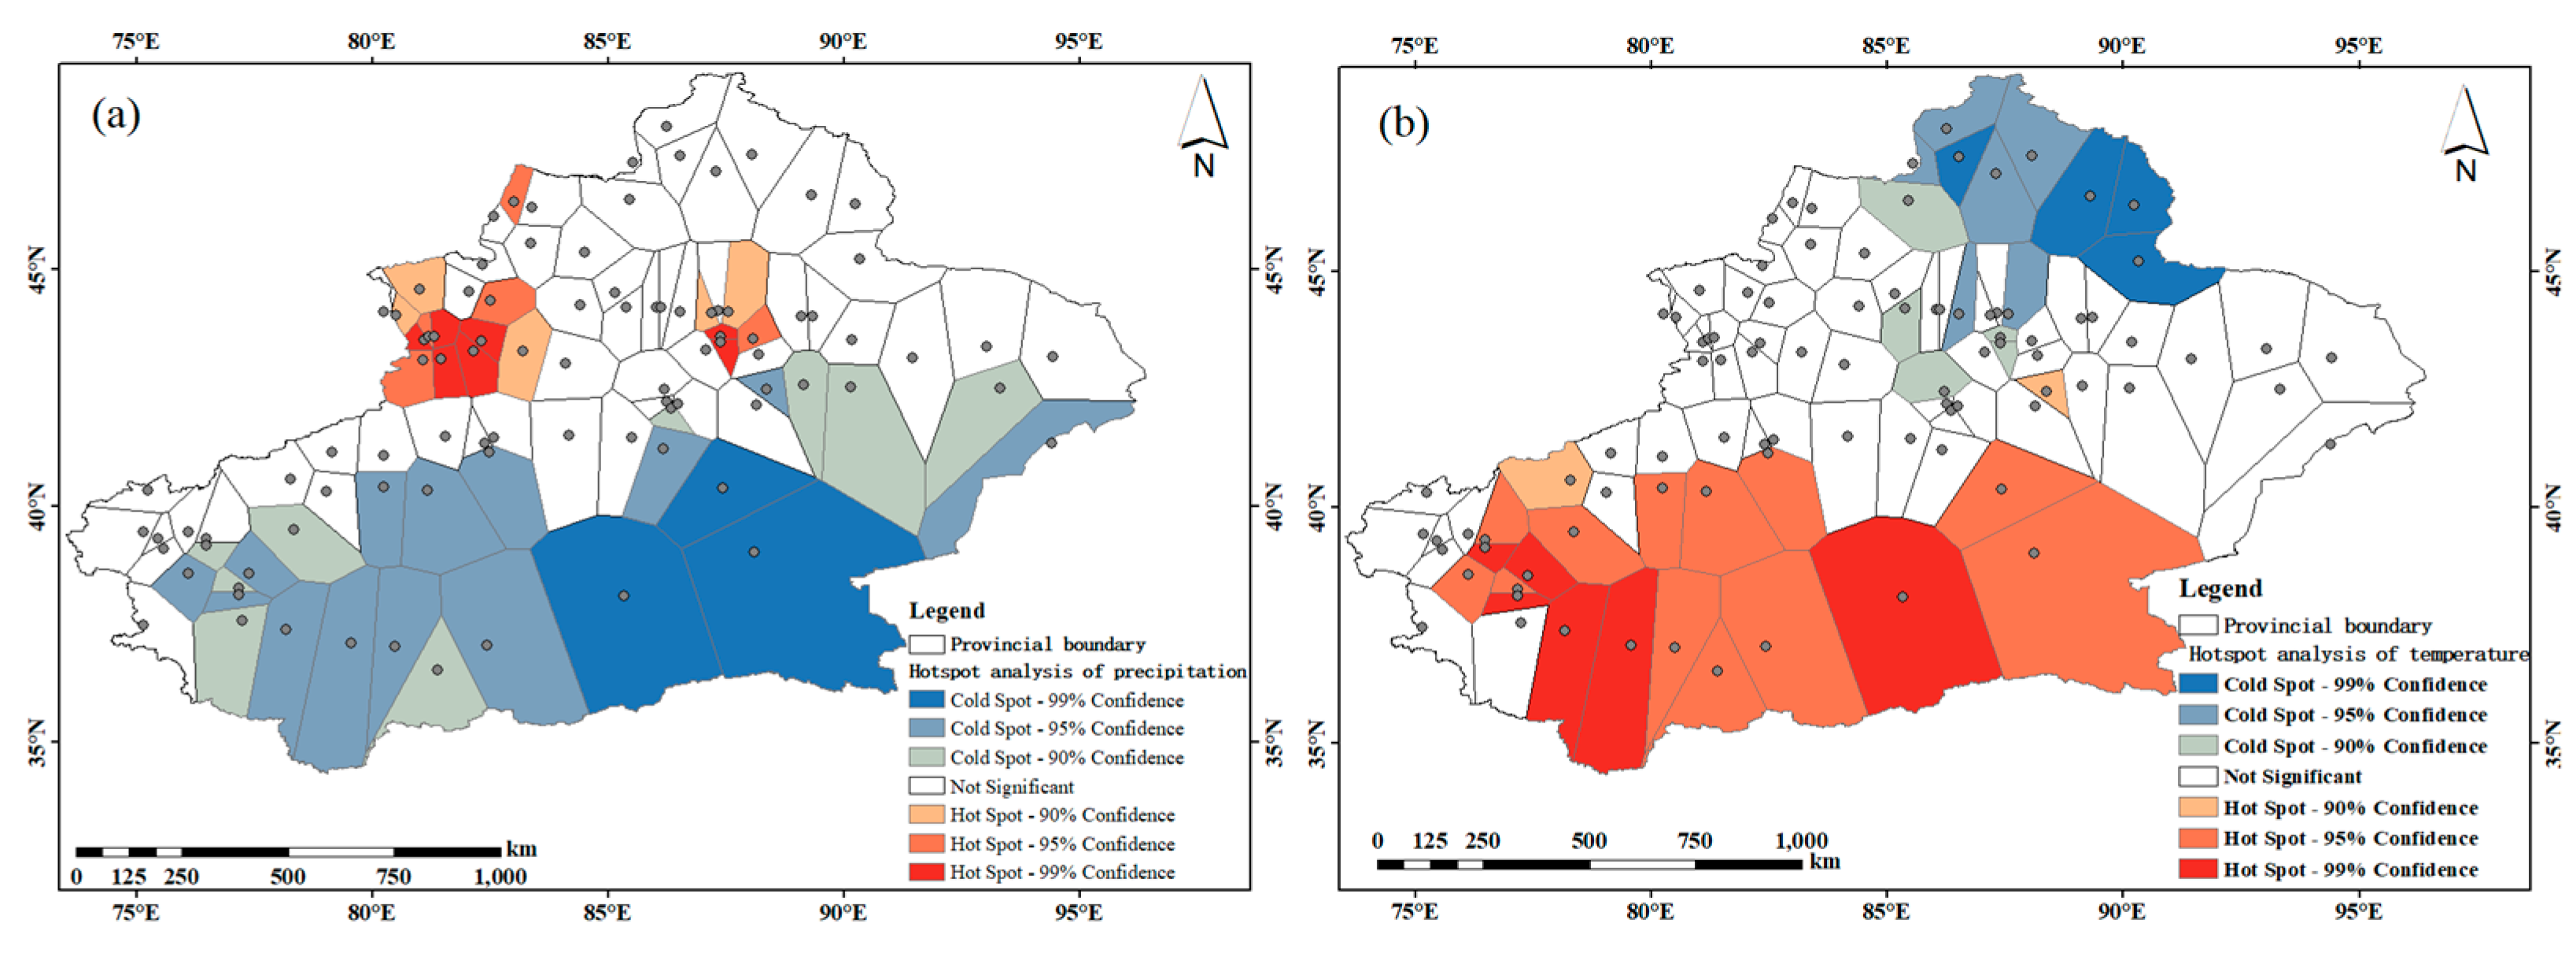
All of Xinjiang belongs to arid and semiarid regions. The spatial distribution of the AI in Xinjiang showed that the southern border was higher than the northern border, and the basin was higher than the mountainous area; the potential evapotranspiration was lower in the northern border than in the southern border; the spatial distribution of precipitation showed that the mountainous area was higher than the basin plain, and the precipitation in the northern border was obviously higher than the southern border, showing a pattern of more in the north and less in the south.

Author Contributions

Conceptualization, A.L.; methodology, A.L. and Y.Z.; software, X.G.; vali-dation, A.L. and Y.Z.; formal analysis, Y.Z.; investigation, X.G. and Y.W.; resources, X.G.; data cu-ration, Y.Z.; writing—original draft preparation, Y.Z., T.L., and A.L.; writing—review and editing, Y.Z., X.L. and X.D.; visualization, X.G. and N.P.; supervision, X.G.; project administration, A.L.; funding acquisition, A.L. All authors have read and agreed to the published version of the manuscript.

Funding

This research was supported by the Third Xinjiang Scientific Expedition Program (Grant Number: 2021XJKK0400) and the National Natural Science Foundation (Grant Number: 52179028, 51609260).

Institutional Review Board Statement

Not applicable.

Informed Consent Statement

Not applicable.

Data Availability Statement

Not applicable.

Conflicts of Interest

The authors declare no conflict of interest.

Appendix A

Table A1. Spatial autocorrelation test results.
IndexPrecipitationAverage Temperature
Moran index0.410.33
Z-score6.665.32
Note: All p values are less than 0.01.
Figure A1. Cold spot and hotspot distribution of the precipitation (a) and temperature (b) in the study area. Note: The polygons are based on the spatial location of 94 meteorological stations using the Ty son polygon method.
Water 15 00062 g0a1
Figure A2. The semi-variogram fitting procedure of P (a), ET0 (b), and AI (c).
Water 15 00062 g0a2

References

  1. Yanping, Q.; Jianqiang, L.; Juan, L.; Zhicheng, S.; Bing, Q.; Aihua, L. A quantitative framework for assessing drought disaster risk and key techniques. Adv. Water Sci. 2014, 25, 297–304. [Google Scholar] [CrossRef]
  2. Zhang, B.; Wu, P.; Zhao, X.; Wang, Y.; Gao, X.; Cao, X. A drought hazard assessment index based on the VIC-PDSI model and its application on the Loess Plateau, China. Theor. Appl. Climatol. 2013, 114, 125–138. [Google Scholar] [CrossRef]
  3. Zhang, J.; Mu, Q.; Huang, J. Assessing the remotely sensed Drought Severity Index for agricultural drought monitoring and impact analysis in North China. Ecol. Indic. 2016, 63, 296–309. [Google Scholar] [CrossRef]
  4. Qin, L.; Qiang, Z.; Qingzhong, H.; Peijun, S. Nonparametric integrated agro-meteorological drought monitoring in China:New monitoring technique and applicability. Acta Geogr. Sin. 2018, 73, 67–80. [Google Scholar]
  5. Qing, P.; Ranghui, W.; Yelin, J.; Xiaoquan, W. Adaptability of drought situation monitor in Xinjiang with the NDVI-LST index. Acta Ecol. Sin. 2018, 38, 4694–4703. [Google Scholar]
  6. Junqiang, Y.; Weiyi, M.; Jing, C.; Tuoliewubieke, D. Signal and impact of wet-to-dry shift over Xinjiang, China. Acta Geogr. Sin. 2021, 76, 57–72. [Google Scholar]
  7. Hao, Z.; Singh, V.P. Drought characterization from a multivariate perspective: A review. J. Hydrol. 2015, 527, 668–678. [Google Scholar] [CrossRef]
  8. Zhang, Q.; Yao, Y.; Li, Y.; Huang, J.; Ma, Z.; Wang, Z.; Wang, S.; Wang, Y.; Zhang, Y. Causes and Changes of Drought in China: Research Progress and Prospects. J. Meteorol. Res. 2020, 34, 460–481. [Google Scholar] [CrossRef]
  9. Qiang, Z.; Liang, Z.; Xiancheng, C.; Jian, Z. Progresses and Challengesin Drought Assessment and Monitoring. Adv. Earth Sci. 2011, 26, 763–778. [Google Scholar]
  10. Xianfeng, L.; Xiufang, Z.; Yaozhong, P.; Shuangshuang, L.; Yanxu, L. Agricultural drought monitor: Progress, challenges and prospect. Acta Geogr. Sin. 2015, 70, 1835–1848. [Google Scholar]
  11. Li, Y.P.; Chen, Y.N.; Li, Z. Dry/wet pattern changes in global dryland areas over the past six decades. Glob. Planet. Chang. 2019, 178, 184–192. [Google Scholar] [CrossRef]
  12. Lijun, C.; Huilan, S.; Xiaoli, L.; Lele, Z.; Baobao, L.; Tianyi, L. Spatio-temporal evolution of the extreme dry and wet events in Tianshan Mountains, Xinjiang, China. Arid Zone Res. 2021, 38, 188–197. [Google Scholar] [CrossRef]
  13. Pei, X.; Yan-ling, G.; Yu-hu, Z.; Liu, X. Precipitation and drought characteristics in Xinjiang during 1961-2015. Arid Land Geogr. 2017, 40, 332–339. [Google Scholar] [CrossRef]
  14. Junwei, X.; Jianghua, Z.; Zhihui, L. SPEI-based Spatiotemporal Variation of Drought in Xinjiang. Arid Zone Res. 2016, 33, 338–344. [Google Scholar] [CrossRef]
  15. Xicheng, Z.; Changchun, X.; Jia, S.; Xiaofei, L. Analysis of drought characteristics in Xinjiang based on remote sensing DSI. Jiangsu Agric. Sci. 2020, 48, 239–246. [Google Scholar] [CrossRef]
  16. Jing, H.; Yun, Z.; Mingxiu, W.; Fang, W.; Zhi, T.; Hao, H. Spatial and temporal distribution characteristics of drought and its relationship with meteorological factors in Xinjiang in last 17 years. Acta Ecol. Sin. 2020, 40, 1077–1088. [Google Scholar]
  17. Zhou, Y.; Zhou, P.; Jin, J.; Wu, C.; Cui, Y.; Zhang, Y.; Tong, F. Drought identification based on Palmer drought severity index and return period analysis of drought characteristics in Huaibei Plain China. Environ. Res. 2022, 212. [Google Scholar] [CrossRef]
  18. Vysakh, A.; Kumar, B.A. Drought analysis using Standardized Precipitation Index (SPI) in Kerala. J. Agrometeorol. 2019, 21, 154–159. [Google Scholar]
  19. Manzano, A.; Clemente, M.A.; Morata, A.; Yolanda Luna, M.; Begueria, S.; Vicente-Serrano, S.M.; Luisa Martin, M. Analysis of the atmospheric circulation pattern effects over SPEI drought index in Spain. Atmos. Res. 2019, 230. [Google Scholar] [CrossRef]
  20. Van Hoek, M.; Jia, L.; Zhou, J.; Zheng, C.; Menenti, M. Early Drought Detection by Spectral Analysis of Satellite Time Series of Precipitation and Normalized Difference Vegetation Index (NDVI). Remote Sens. 2016, 8, 422. [Google Scholar] [CrossRef] [Green Version]
  21. Cong, D.; Zhao, S.; Li, X.; Zhuang, X.; Chen, C. Temporal and spatial distribution of drought in Northeast China based on temperature vegetation drought index (TVDI) from 2001–2013. In Proceedings of the 36th IEEE International Geoscience and Remote Sensing Symposium (IGARSS), Beijing, China, 10–15 July 2016; pp. 4241–4244. [Google Scholar]
  22. Sui, Y.; Huang, W.-H.; Yang, X.-G.; Li, M.-S. Characteristics and adaption of seasonal drought in southern China under the background of global climate change. II. Spatiotemporal characteristics of drought for wintering grain- and oil crops based on crop water deficit index. J. Appl. Ecol. 2012, 23, 2467–2476. [Google Scholar]
  23. Junfang, Z.; Jianping, G.; Jingwen, X.; Fei, M.; Xiaoguang, Y.; Yanhong, Z. Trends of Chinese dry-wet condition based on wetness index. Trans. CSAE 2010, 26, 18–24+386–387. [Google Scholar]
  24. Qi, H.; Bei, D.; Xuebiao, P.; Huifei, J.; Zhihua, P.; Yu, Q.; Changxiu, S.; Menglin, D.; Ziwei, Y.; Liting, H. Spatiotemporal variation and causes analysis of dry-wet climate over period of 1961–2014 in China. Trans. CSAE 2017, 33, 124–132+315. [Google Scholar]
  25. Hongxing, Z.; Jing, L. Long-term trends of aridity index and its sensitivity to climate factors in Northeast China: 1971–2008. Geogr. Res. 2011, 30, 1765–1774. [Google Scholar]
  26. Yu, X.; Yan-fei, W.; Gang, X.; Min, L. Characteristics of Surface Humidity and Extreme Drought/Wet Events in Yangtze River Delta. J. Nat. Resour. 2017, 32, 1579–1590. [Google Scholar]
  27. Qingwen, Z.; Ningbo, C.; Lushan, Z.; Yang, X.; Qian, L.; Feipeng, L. Seasonal drought characteristics based on relative moisture index in Yunnan Province. Agric. Res. Arid. Areas 2020, 38, 278–284. [Google Scholar]
  28. Zejiang, Z.; Baoqi, L.; Ziyue, Z.; Xiaoyong, D.; Jinpu, G. Spatial and temporal distribution characteristics of the humid index in north China plain. J. China Inst. Water Resour. Hydropower Res. 2022. [Google Scholar] [CrossRef]
  29. Jun, D.; Kanshe, Z.; Lei, Y. Climate change tendency of surface humidity index in Chang Tang Nature Reserve of Tibet from 1971 to 2018. Sci. Soil Water Conserv. 2021, 19, 13–23. [Google Scholar] [CrossRef]
  30. Li, Y.; Feng, A.; Liu, W.; Ma, X.; Dong, G. Variation of Aridity Index and the Role of Climate Variables in the Southwest China. Water 2017, 9, 743. [Google Scholar] [CrossRef] [Green Version]
  31. Geng, M.; Liu, P.; Qiao, X.; Wang, M.; Wang, X. Spatial and Temporal Characteristics of Extreme Dry and Wet Events in Xinjiang from 1960 to 2020 and the Analysis of Influencing Factors. Atmosphere 2022, 13, 1067. [Google Scholar] [CrossRef]
  32. Yanlong, Z.; Liu, P. Study on Temporal and Spatial Variation of the Dry-wet and Its Influence Factors in Xinjiang Based on Aridity Index. J. Nat. Resour. 2016, 31, 658–671. [Google Scholar]
  33. Wu, Y.; Zhang, G.; Shen, H.; Xu, Y.J.; Bake, B. Attribute Analysis of Aridity Variability in North Xinjiang, China. Adv. Meteorol. 2016, 2016, 9610960. [Google Scholar] [CrossRef] [Green Version]
  34. Das, S. Extreme rainfall estimation at ungauged locations: Information that needs to be included in low-lying monsoon climate regions like Bangladesh. J. Hydrol. 2021, 601. [Google Scholar] [CrossRef]
  35. Das, S.; Islam, A.M.T. Assessment of mapping of annual average rainfall in a tropical country like Bangladesh: Remotely sensed output vs. kriging estimate. Theor. Appl. Climatol. 2021, 146, 111–123. [Google Scholar] [CrossRef]
  36. Jingyun, Z.; Yunhe, Y.; Bingyuan, L. A New Scheme for Climate Regionalization in China. Acta Geogr. Sin. 2010, 65, 3–12. [Google Scholar]
  37. Pereira, L.S.; Allen, R.G.; Smith, M.; Raes, D. Crop evapotranspiration estimation with FAO56: Past and future. Agric. Water Manag. 2015, 147, 4–20. [Google Scholar] [CrossRef]
  38. Sharma, V.; Adhikari, K. Rainfall and rainy days trend and ENSO phenomena in Himalayan Kingdom of Bhutan. Acta Geophys. 2022, 70, 1855–1869. [Google Scholar] [CrossRef]
  39. Kendall, M.G. A new measure of rank correlation. Biometrika 1938, 30, 81–93. [Google Scholar] [CrossRef]
  40. Mann, H.B. Nonparametric Tests Against Trend. Econometrica 1945, 13, 245–259. [Google Scholar] [CrossRef]
  41. Yixuan, H.; Zongxue, X.; Hao, C.; Tiewen, F.; Donghui, W. Spatiotemporal variability of precipitation over Guangdong Province during flood seasons of 1960 to 2020. J. Hydroelectr. Eng. 2022, 41, 70–82. [Google Scholar]
  42. Fengying, W. Progresses on Climatological Statistical Diagnosis and Prediction Methods—In Commemoration of the 50 Anniversaries of CAMS Establishment. J. Appl. Meteorol. Sci. 2006, 736–742. [Google Scholar]
  43. Yan, Q. Variation of Rainfall, Temperature and Evaporation in the Region of Da Chaidan. J. Irrig. Drain. 2021, 40, 115–121. [Google Scholar] [CrossRef]
  44. Nigenare, A.; Jianli, D.; Xiangyu, G.; Qingling, B. Variation characteristics ofactual evapotranspiration and meteorological elements in the Ebinur Lake basin from 1960 to 2017. Acta Geogr. Sin. 2021, 76, 1177–1192. [Google Scholar]
  45. Cao, R.; Jiang, W.; Yuan, L.; Wang, W.; Lv, Z.; Chen, Z. Inter-annual variations in vegetation and their response to climatic factors in the upper catchments of the Yellow River from 2000 to 2010. J. Geogr. Sci. 2014, 24, 963–979. [Google Scholar] [CrossRef] [Green Version]
  46. Ming, L.; Weixia, H.; Lianzhi, Z.; Guiwen, W.; Xurong, C. Risk analysis of meteorological drought in Northeast China based on standardized precipitation evapotranspiration index. J. Arid Land Resour. Environ. 2018, 32, 134–139. [Google Scholar] [CrossRef]
  47. Wang, X.; Zhao, W.; Zhang, T.; Qiu, Y.; Ma, P.; Li, L.; Wang, L.; Wang, M.; Zheng, D.; Zhao, W. Analysis of the Characteristics of Ozone Pollution in the North China Plain from 2016 to 2020. Atmosphere 2022, 13, 715. [Google Scholar] [CrossRef]
  48. Yang, D.; Jinyong, Z.; Jing, Z.; Yicheng, F.; Wenqi, P.; Quchang, C.; Yanyan, L. Spatial Differences in Water Quality and Spatial Autocorrelation Analysis of Eutrophication in Songhua Lake. Environ. Sci. 2021, 42, 2232–2239. [Google Scholar] [CrossRef]
  49. Dai, A. Characteristics and trends in various forms of the Palmer Drought Severity Index during 1900-2008. J. Geophys. Res. Atmos. 2011, 116. [Google Scholar] [CrossRef]
  50. Mondal, S.K.; Huang, J.; Wang, Y.; Su, B.; Zhai, J.; Tao, H.; Wang, G.; Fischer, T.; Wen, S.; Jiang, T. Doubling of the population exposed to drought over South Asia: CMIP6 multi-model-based analysis. Sci. Total Environ. 2021, 771. [Google Scholar] [CrossRef]
  51. Yaning, C.; Zhi, L.; Yuting, F.; Huaijun, W.; Gonghuan, F. Research progress on the impact of climate change on water resources in the arid region of Northwest China. Acta Geogr. Sin. 2014, 69, 1295–1304. [Google Scholar]
  52. Zhang, C.; Ren, Y.; Cao, L.; Wu, J.; Zhang, S.; Hu, C.; Zhujie, S. Characteristics of Dry-Wet Climate Change in China during the Past 60 Years and Its Trends Projection. Atmosphere 2022, 13, 275. [Google Scholar] [CrossRef]
  53. Huo, Z.; Dai, X.; Feng, S.; Kang, S.; Huang, G. Effect of climate change on reference evapotranspiration and aridity index in arid region of China. J. Hydrol. 2013, 492, 24–34. [Google Scholar] [CrossRef]
  54. Li-li, L.; Lei, H.; Yong-gui, H.; Yang, G.; Ling4, P. Spatio-temporal variations of aridity index and its response to climate factors in Northwest China during 1989–2019. Chin. J. Appl. Ecol. 2021, 32, 4050–4058. [Google Scholar] [CrossRef]
  55. Wang, M.; Liu, P.; Qiao, X.; Si, W.; Liu, L. Spatio-Temporal Characteristics of Dry-Wet Conditions and Boundaries in Five Provinces of Northwest China from 1960 to 2020. Atmosphere 2021, 12, 1499. [Google Scholar] [CrossRef]
  56. Getis, A.; Ord, J.K. The Analysis of Spatial Association by Use of Distance Statistics. Geogr. Anal. 1992, 24, 189–206. [Google Scholar] [CrossRef]
Figure 1. The distribution of the topographic and meteorological stations in the study area.
Water 15 00062 g001
Figure 2. Research Framework Diagram.
Water 15 00062 g002
Figure 3. M–K mutation test (a) and trend analysis of the precipitation (b) in Xinjiang.
Water 15 00062 g003
Figure 4. Contour map of the real part of the wavelet coefficients (a) and the wavelet variance (b) of the precipitation in Xinjiang.
Water 15 00062 g004
Figure 5. Spatial distribution of the precipitation in Xinjiang.
Water 15 00062 g005
Figure 6. M–K mutation test (a) and trend analysis of the potential evapotranspiration (b) in Xinjiang.
Water 15 00062 g006
Figure 7. Contour map of the real part of the wavelet coefficients (a) and the wavelet variance (b) of the potential evapotranspiration in Xinjiang.
Water 15 00062 g007
Figure 8. Spatial distribution of the potential evapotranspiration in Xinjiang.
Water 15 00062 g008
Figure 9. M–K mutation test (a) and trend analysis of the aridity index (b) in Xinjiang.
Water 15 00062 g009
Figure 10. Contour map of the real part of the wavelet coefficients (a) and the wavelet variance (b) of the aridity index in Xinjiang.
Water 15 00062 g010
Figure 11. Spatial distribution of the aridity index in Xinjiang.
Water 15 00062 g011
Disclaimer/Publisher’s Note: The statements, opinions and data contained in all publications are solely those of the individual author(s) and contributor(s) and not of MDPI and/or the editor(s). MDPI and/or the editor(s) disclaim responsibility for any injury to people or property resulting from any ideas, methods, instructions or products referred to in the content.

