Article

Decadal Changes in Soil Water Storage Characteristics Linked to Forest Management in a Steep Watershed

by
Charles John Consignado Gunay
1,
Katsuhide Yokoyama
1,*,
Hiroshi Sakai
1,
Akira Koizumi
1 and
Kenji Sakai
2
1
Department of Civil and Environmental Engineering, Tokyo Metropolitan University, 1-1 Minami-Osawa, Hachioji, Tokyo 192-0397, Japan
2
Water Resources Administration Office, Bureau of Waterworks, Tokyo Metropolitan Government, 600 Urajukucho, Ome, Tokyo 198-0088, Japan
*
Author to whom correspondence should be addressed.
Water 2023, 15(1), 54; https://doi.org/10.3390/w15010054
Submission received: 14 November 2022 / Revised: 20 December 2022 / Accepted: 20 December 2022 / Published: 23 December 2022
(This article belongs to the Section Water Resources Management, Policy and Governance)

Abstract

:
Soil water storage properties, which are affected by land management practices, alter the water balance and flow regimes in watersheds; thus, it is highly plausible to clarify the influence of such management practices on the water storage condition by analyzing the long-term variations in discharge. In this study, the changes in soil water storage characteristics of the Ogouchi Dam watershed, which had undergone intensive forest management through the decades, were investigated using two approaches. Reported results from the rainfall–runoff correlation analysis show a gradual and steady increase in the soil water storage capacity at weaker continuous-rainfall events, i.e., uninterrupted wet days accumulating less than 70 mm. Meanwhile, the second approach utilizing the parameter calibration in the SWAT discharge model illustrated a constant trend in the runoff potential and the high possibility of a steady improvement in the soil available water capacity. Overall, the established decadal trends were able to prove the capability of sustainable forest management, i.e., thinning, regeneration cutting, multi-layer planting, deer-prevention fences, and earth-retaining fences (lined felled trees), in improving the water conservation function of the catchment.

1. Introduction

Soil water storage is recognized as a major component of water balance in catchments, yet its reliable and continuous quantification remains a challenge among hydrologists and watershed managers alike. In fact, the most accurate direct measurements of hydrological characteristics are available only for rainfall and streamflows and rarely for evapotranspiration and water storage [1]. In any terrestrial ecosystem, rainfall is the largest flux term and main input of the water budget [2,3], thereby considered the major driving force of hydrological processes [4,5], particularly impacting the amounts of soil moisture [6] and surface water and groundwater resources [7]. Streamflow, on the other hand, is one of the output components of the water balance [8,9] and generally reflects water availability. Direct measurements of streamflow have been previously utilized in understanding runoff generation processes [10], estimating subsurface flows [11,12,13], and understanding how they relate to changes in soil water storage [1,14,15,16,17,18].
Forests generally have a more powerful water conservation function than any other land cover, and it has already been well-documented that the reduction in forest cover induces the annual mean flow and peak discharge, while reforestation delays and reduces the size of such a peak [19,20,21,22]. Despite being largely covered by forests [23], Japanese catchments tend to be smaller and steeper and possess a flashy flow regime [24], resulting in higher susceptibility to flashfloods in the water-impermeable regions. As a countermeasure, sustainable maintenance of the forested areas is implemented to improve the infiltration and water retention properties of the soil, which will control the excessive flow rates. In fact, Kuehler et al. [25] previously reported that the combined effect of water retention, infiltration, and transpiration in healthy forested ecosystems can mitigate up to 7% of a city’s annual stormwater runoff in the United States. Some studies in China [26,27,28] demonstrated that the nationwide afforestation and reforestation programs played a vital role in urban flood mitigation and deep soil moisture dynamics. In Japan, the emerging concept of ecosystem-based disaster risk reduction (Eco-DRR) includes the proper maintenance and restoration of forests to mitigate hazards caused by the changing climate [29,30].
Among the numerous silvicultural practices, thinning, regeneration cutting, multi-layer planting, and installation of deer-prevention and earth-retaining fences are common forest conservation measures in Japan. Thinning, regeneration cutting, and multi-layer planting, in essence, have mutual functions of regulating the stand density, promoting favorable environmental conditions for the understory layer, and enhancing the growth and diversity of newly planted trees. Thinning, if optimal intensity has been determined, can substantially improve soil infiltration rate and water storage capacity [31,32]. Regeneration cutting alters the soil water dynamics, and hence, moisture replenishment of the subsurface layer becomes more rapid when precipitation occurs [33]. However, Ide et al. [34] claimed there was a reduction in the soil water storage capacity after regeneration cutting, as such an operation caused disturbances to the compaction of the soil. Multi-layering of different tree species has a more complex and indirect association with soil water storage capacity. Ilek et al. [35] first looked into the dynamics of litterfall and then related it to organic matter decomposition, before quantifying the forest’s ability to retain rainwater. With the recent increase in the sika deer (Cervus nippon) population that causes Japanese forests to suffer from their heavy grazing [36], the installation of deer-prevention fences becomes a widely adopted countermeasure. Previous studies reported that the security and enclosure provided by the fences were effective for recovering from excessive deer grazing [37,38] and enriching the grasslands and understory layers of the forest [39], which, in effect, influence the soil water characteristics [40,41]. Lastly, earth-retaining fences in forests, in the form of lined felled trees, serve as a slope stabilizer and runoff buffer, specifically reducing the peak flow and delaying the runoff time [42,43].
Although most of the aforementioned papers ascertained the outcomes of effective forest management on the soil water condition by employing direct measurement methods in field plots or by incorporating remote sensing techniques, such studies were designed for the short term and were highly particular to the climate event and physical condition of their respective study areas. As of writing, studies relying on fundamental data analysis and hydrological models to investigate the long-term changes in soil water conditions have yet to gain attention, which is likely due to the unavailability and inadequacy of long-term hydroclimatic records for the analysis and model evaluation. Addressing such concern, this study attempts to investigate the long-term effect of forest management on the soil water storage characteristics of a steep Japanese watershed in the past half-century. It is worth emphasizing that the selected study site did not undergo any significant land-use change and remained dominantly forested in the past 50 years; thus, the changes in soil water storage characteristics can just be attributed to the improvements in canopy and understory properties, which are the result of the continuous forest conservation efforts.
This paper specifically aims to observe the decadal changes in the soil water storage condition of the Ogouchi Dam watershed in Japan, which has been subjected to various forest management schemes through the years, using two different approaches. The first approach applies a linear correlation analysis between rainfall and runoff, estimated using the three-stage tank model, to quantify the amount of water stored in the subsurface layers of the soil for each decade. The second approach utilizes the calibration of flow-related parameters in the physically based Soil and Water Assessment Tool (SWAT) model to illustrate the trends in runoff potential and soil available water capacity. The results from the first approach, briefly explained in the study of Gunay et al. [44], conclude that long-term and sustainable forest management in the watershed has likely increased the soil water capacity through the decades. A parallel analysis utilizing the parameter adjustment function in a physically based hydrologic model is necessary to strengthen the claim and validate the earlier hypothesis. The plausibility of performing such analysis procedures relied on the well-documented climate and hydrological records possessed by the Bureau of Waterworks of the Tokyo Metropolitan Government that span over 50 years. Overall, the established trends could justify whether the water retention properties of the upstream forest have improved through the years of continuous management efforts. The increase in water infiltration and retention properties may result in a remarkable decrease in overland flow, likely reducing the transport of eroded soil to the drinking water reservoir downstream.

2. Materials and Methods

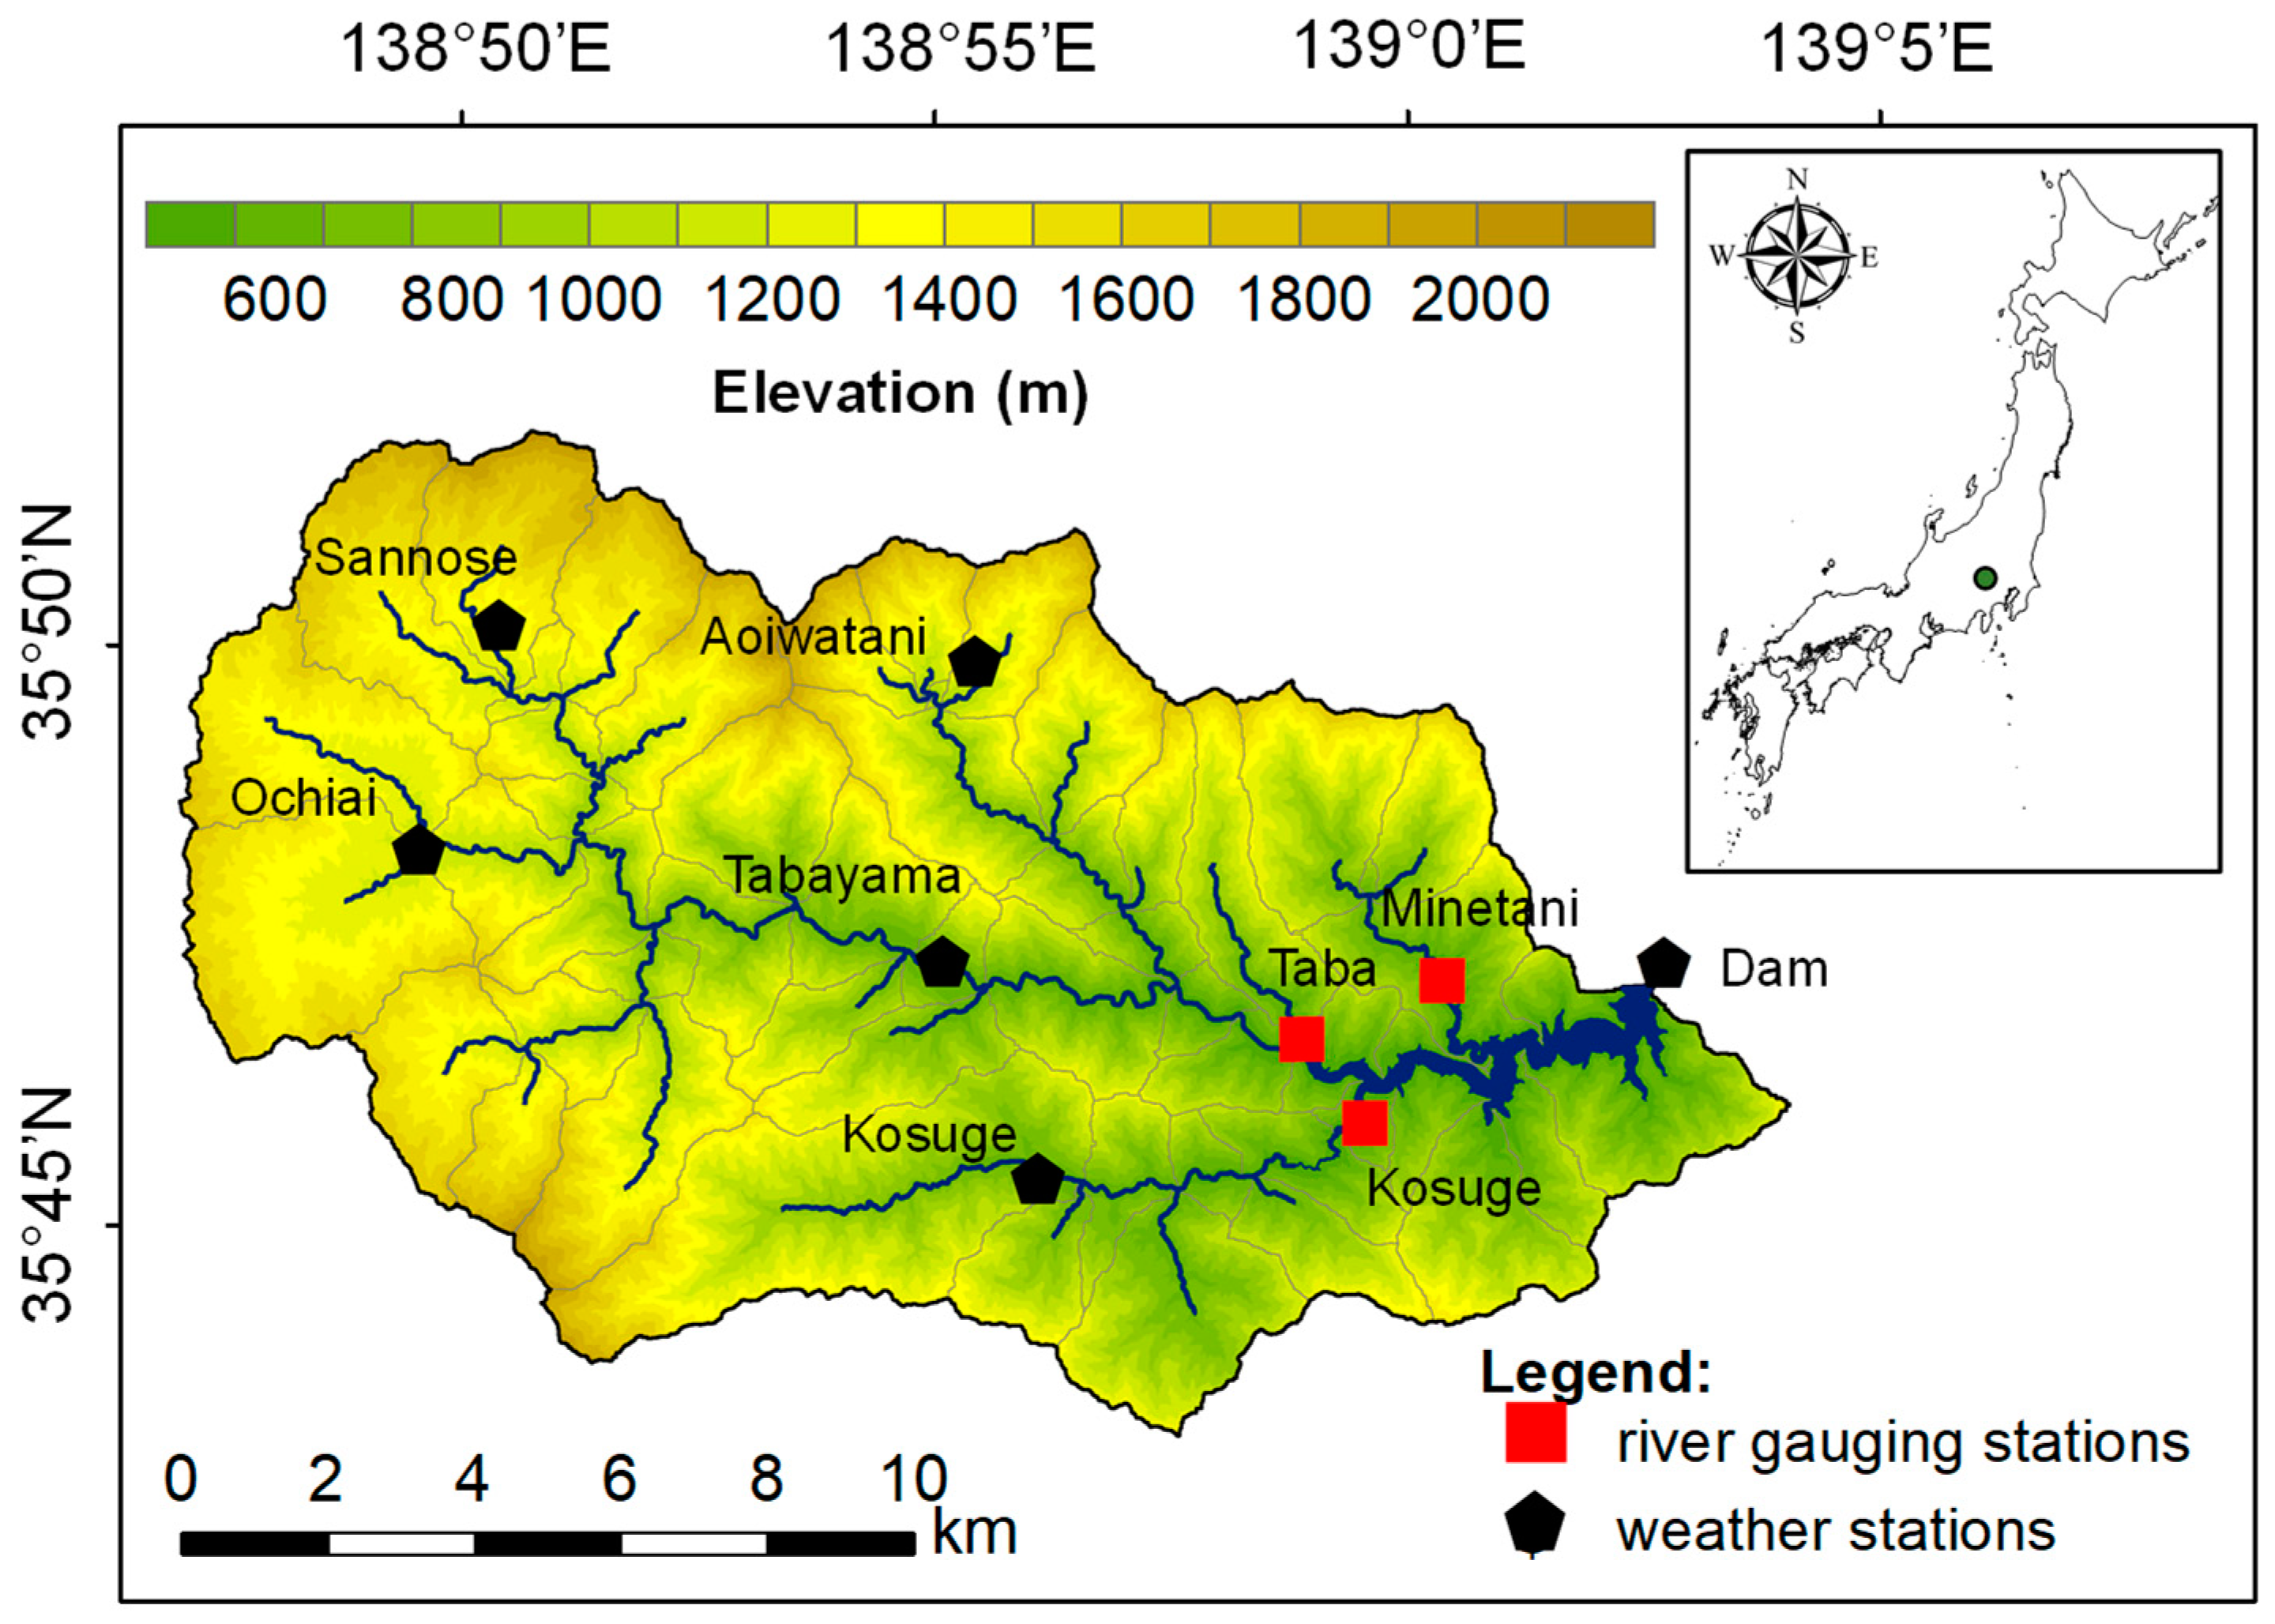
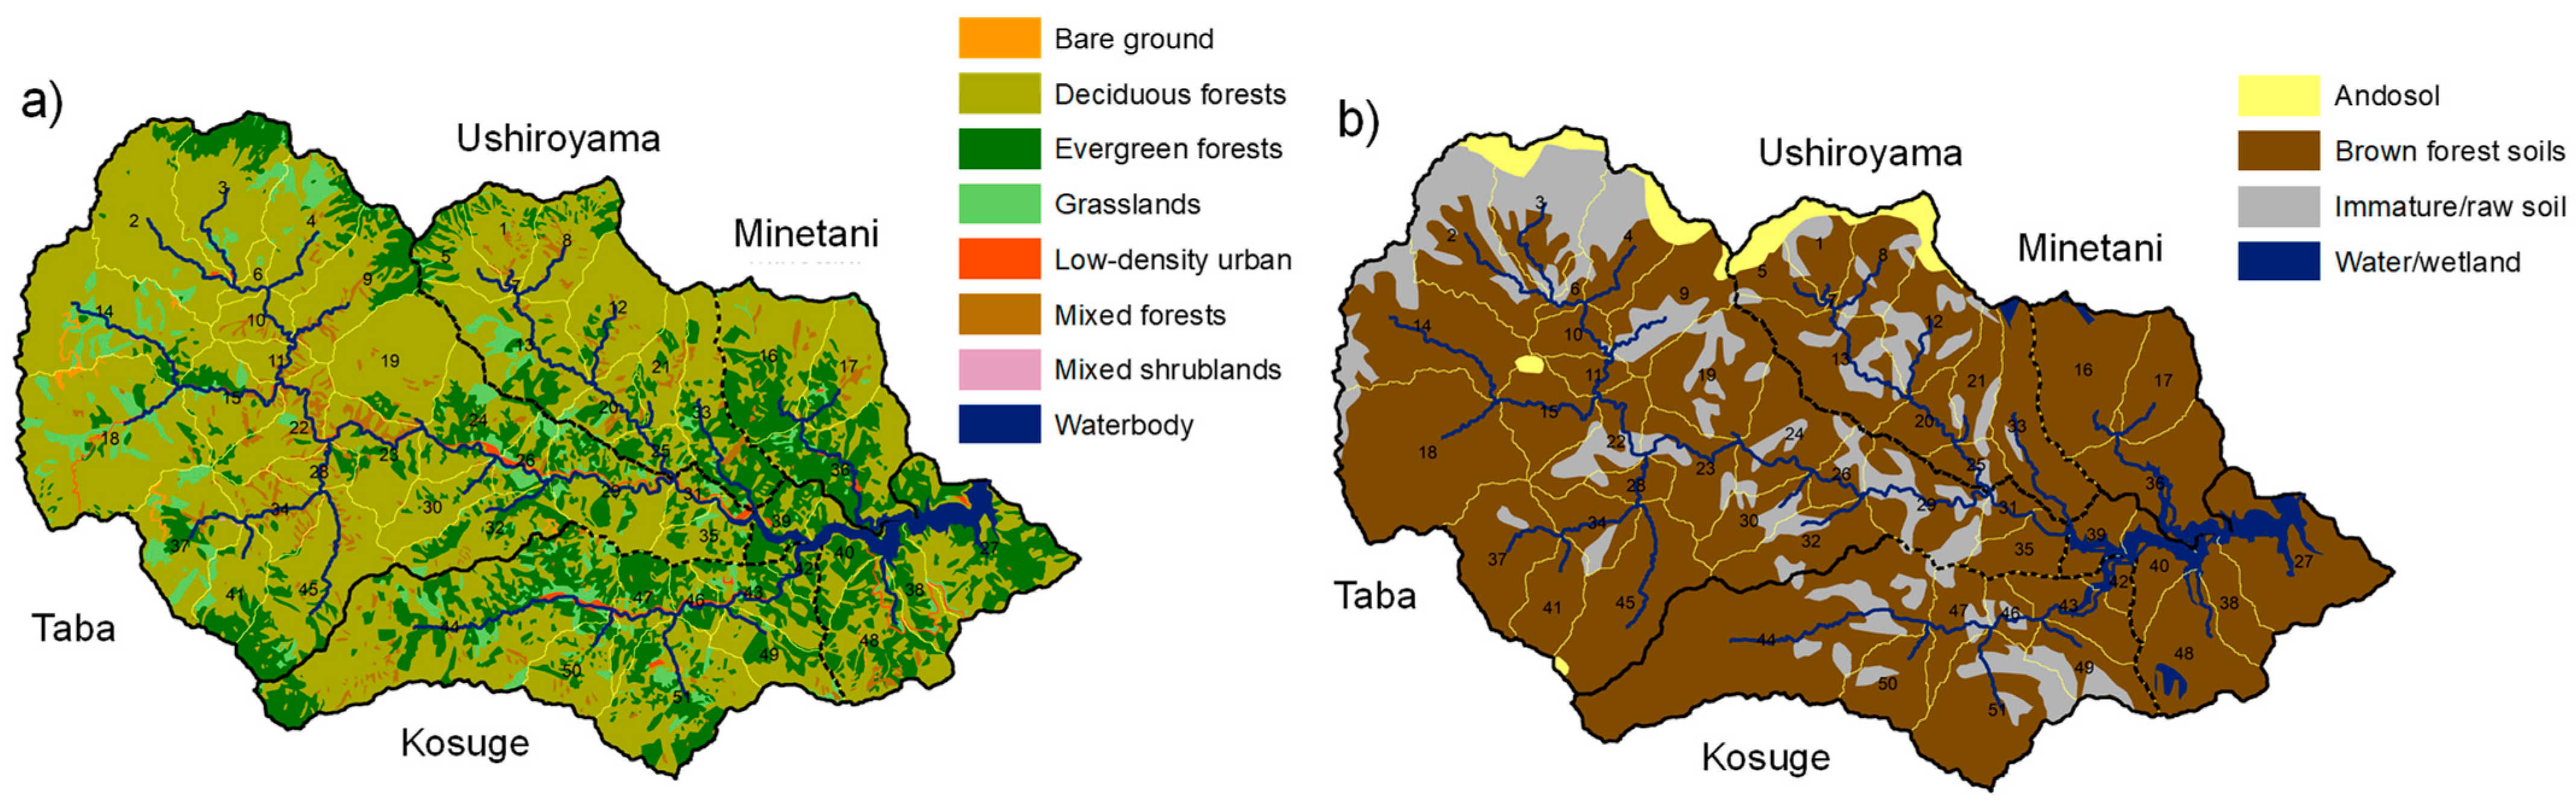
2.1. Study Area Description

The Ogouchi Reservoir is Japan’s largest drinking water supply reservoir with an effective storage capacity of 185 million m3 and a water surface area of 4.25 km2. The study area is the forested watershed in its upstream, which specifically lies between latitudes 35°43′16″–35°52′03″ N and longitudes 138°46′59″–139°04′32″ E (Figure 1), enclosing a total catchment area of 262.9 km2. The local elevation ranges from 525 to 2103 m, and the mean ground slope is 33.2°. The air temperature at the Dam station measured a daily average of 11.9 °C based on the data in the past five decades, while the precipitation from the weather stations estimated an annual basin-average amount of 1480 mm. Despite being in the center of metropolises in the Kanto region, the watershed is reported to be resilient to urban heat as the reservoir sustains a cooling effect on the microclimate of its surrounding environment [44].
The forested area in the Ogouchi Dam watershed covers more than half of the Tama River water conservation forest and is being subjected to sustainable management. Forest degradation was first recognized in 1868, and rehabilitation efforts began as early as the 1900s. At that time, the Tokyo Prefectural Government received a total of 8460 ha of Goryorin forest, which is a type of forest formerly owned and maintained by the country’s Imperial household. During the same period, the Prefectural Government converted 5100 ha of public and private forests into protected sites. From 1901 to 1955, reforestation was the primary action to meet the increasing demand for wood and timber products, but the overplanting had led to uncontrolled stand density. By 1967, the ownership was transferred to the Tokyo Metropolitan Government, and after a series of purchases and exchanges, the total managed area was 21,634 ha. Restricted logging, multi-layer and multi-species planting, regeneration cutting, and thinning were practiced in such managed areas from the 1960s to the 1990s for the purposes of erosion protection in the watershed and sedimentation control in the drinking water reservoir. At present, the Bureau of Waterworks of the Tokyo Metropolitan Government has been purchasing poorly managed private forests to achieve unified management of the water resource facilities in the catchment, including the 23,719 ha of forest which they also termed green dams. The continuous efforts to expand the area of well-managed forests in the upstream catchment can be considered the most significant cause of why the Ogouchi Reservoir has maintained its low sedimentation rate at 350 m3 km−2 per year in the past two decades [39].

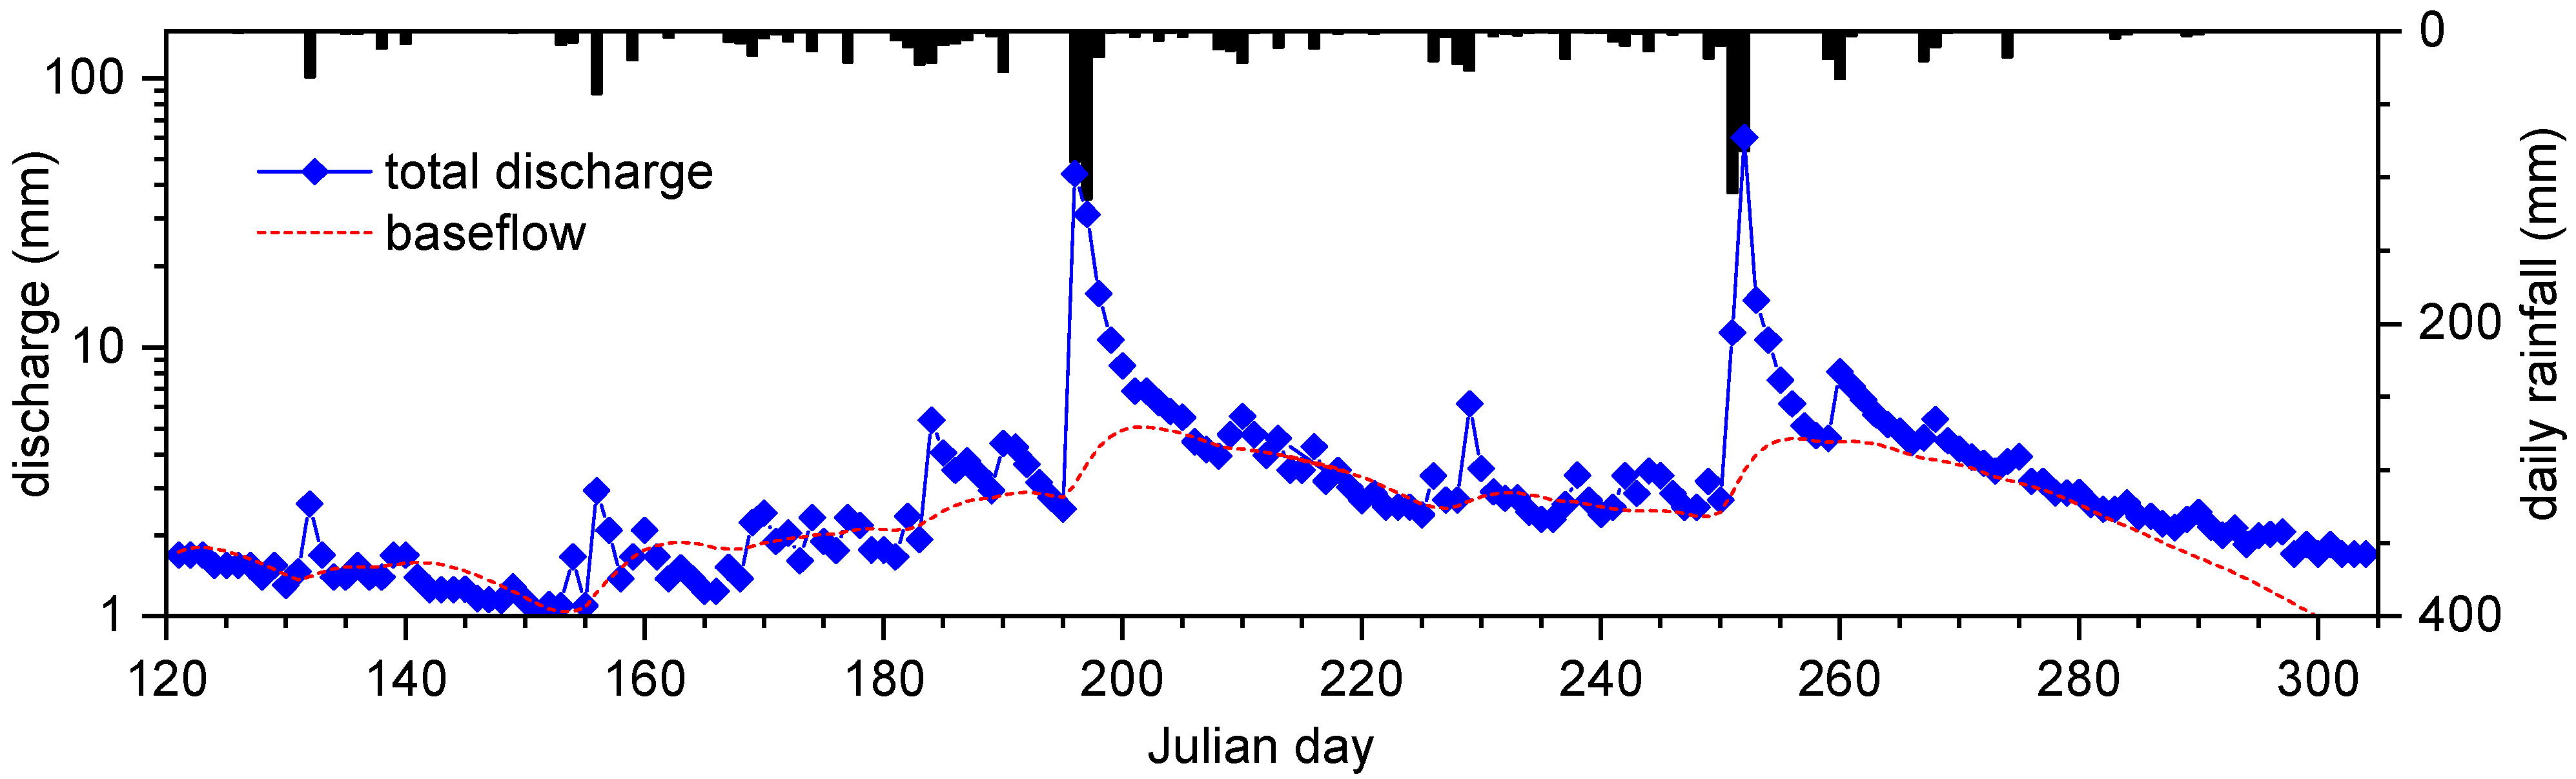
2.2. Long-Term Analysis of Rainfall and Runoff Data

The first approach in determining the decadal changes in soil water storage condition applied a linear correlation analysis between rainfall and runoff. Precipitation records from 1965 to 2015 from six individual weather stations, Aoiwatani, Dam, Kosuge, Ochiai, Sannose, and Tabayama (Figure 1), were acquired. The daily basin-average rainfall was estimated using the Thiessen polygon method. Linear correlation between rainfall and surface runoff, which was calculated using three-stage tank model [45], was established in each decade: A (1965–1974), B (1975–1984), C (1985–1994), D (1995–2004), and E (2005–2015). To illustrate a sample result of the tank model, Figure 2 illustrates the hydrograph of the daily discharge and the tank-modeled baseflow during the wet season (May–October) in 2015.
Gunay et al. [44] reported a non-significant trend and large variability of rainfall in the watershed. To neglect the effect of such great variability in precipitation, only the datasets collected during the wet months were considered. To further reduce the large number of correlation points that may potentially cause significant differences among the sample sizes for each decade, the cumulative amount of rainfall collected from continuous wet days that generated daily amounts of runoff greater than 0.50 mm was considered as one event, or in the context of the correlation plot, one point.
The soil water storage capacity (SWSC) is defined as the total amount of water stored within the plant’s root zone which controls some of the major hydrological processes [46,47]. It was estimated by computing the area bounded by the 45° line, originating at (0,0) and theoretically signifying the complete conversion of rainfall into surface runoff, and the actual linear fit of the established correlation plot. Such area was computed using integration technique, with y = x as the equation of the 45° line and a specific expression, y = f(x), as the equation of the linear correlation in each decade. The maximum and minimum continuous-rainfall amounts were assigned as the upper and lower bounds of the integral equation, respectively. With this technique, the amount of rainfall that was not converted to surface runoff was assumed to be stored in the subsurface layers of the soil.

2.3. Discharge Modeling and Parameter Adjustment in SWAT

The second approach involves the quantification of soil water parameters in each decade upon developing a reliable monthly discharge model. The physically based, semi-distributed SWAT model simulates the soil-water balance at each timestep SWt based on the initial soil water content SW0, precipitation R, runoff Q, evapotranspiration ET, percolation P, and return flow QR [48].
S W t = S W 0 + i = 1 t R i Q i E T i P i Q R i
From Equation (1), the streamflow at each timestep can be estimated as the difference between the depth of precipitation and the total water loss, which is the sum of evapotranspiration, soil water storage, and groundwater storage [49]. Then, the prediction of runoff based on rainfall excess is governed by the Soil Conservation Service (SCS) curve number equation [50].
Q s u r f = R d a y 0.2 S 2 R d a y + 0.8 S
The retention parameter S is computed based on the curve number CN, which is generally dictated by the land cover and soil hydrological group.
S = 25.4 1000 C N 10
The model requires spatial inputs such as DEM, land-cover map, and soil map, while daily rainfall and minimum and maximum air temperatures are the essential weather inputs. The DEM (Figure 1) was accessed from the available 10 m mesh altitude data from the Geospatial Information Authority of Japan (GSI). The 2013 detailed vegetation map (Figure 3a) from the Ministry of the Environment (MOE) was used for the land-cover input. Upon reclassification into SWAT-recognized land uses, it was confirmed that the watershed is 91.3% forested, which is specifically 65.3% deciduous, 23.0% evergreen, and 3.0% mixed type. Other land-cover maps created by the Ministry of Land, Infrastructure, Transport and Tourism (MLIT) reported an average forest coverage of 96.0% in the study area as early as 1976, the year when the first land-cover map of the area was developed and released publicly, up to 2016. This reveals that the watershed remained dominantly forested, and there are no documented reports or maps of land-use changes in the area for a very long period. Lastly, the soil map (Figure 3b) from the National Agriculture and Food Research Organization (NARO) verified that the catchment stands on 79.0% brown forest soils. For the climatic inputs, the time series of rainfall and minimum and maximum air temperatures were converted into pairs of text files: one file containing the coordinates and elevation where each station is installed and one file listing the historical rainfall or air temperature data.
The monthly discharge calculation prior to parameter adjustment was evaluated using five statistical indices namely Nash–Sutcliffe efficiency (NSE), root mean square error (RMSE), percent bias (PBIAS), mean absolute error (MAE), and coefficient of determination (R2). Using Table 1, the performance ratings were evaluated based on the computed values of recommended statistical indices [51].
Upon obtaining an at least Satisfactory result for each decade, the adjustments of SCS curve number (Cn2) and soil available water capacity (Sol_Awc) factors, which alter the amounts of surface and subsurface flows, were then evaluated. In SWAT, Cn2, similar to CN in Equation (3), is an empirical parameter for event-based estimation of direct runoff from rainfall excess, while Sol_Awc is the available water capacity of the soil layer and can also be described as the plant available water. The decadal trends of optimal Cn2 and Sol_Awc factors will represent the changes in soil water conditions as influenced by forest management practices.
In addition, the recursive digital filter method [13,52,53], which estimates baseflow qb using parameter filters, recession constant α, and maximum baseflow index BFImax, was used to ensure realistic and reliable predictions for both the surface and subsurface flow components of the SWAT discharge model.
q b i = 1 B F I m a x α q b i 1 + 1 α B F I m a x × q i 1 α B F I m a x

3. Results

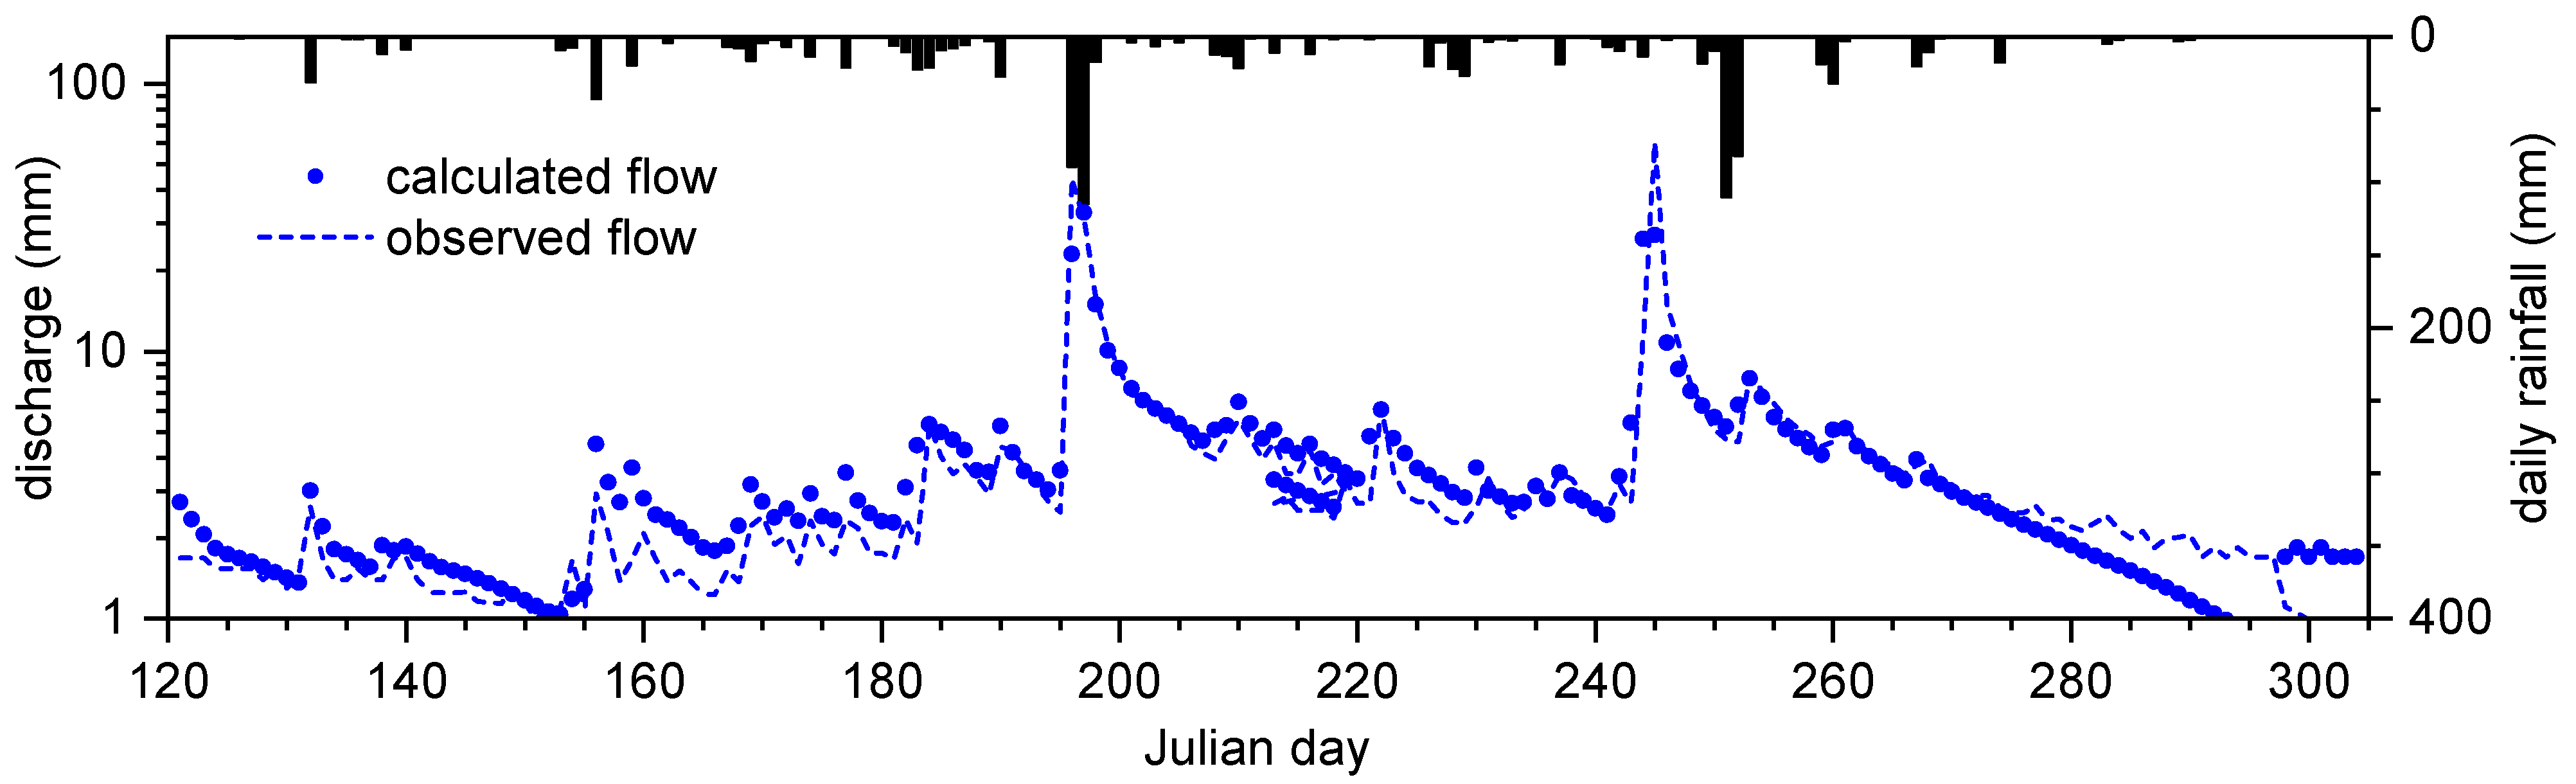
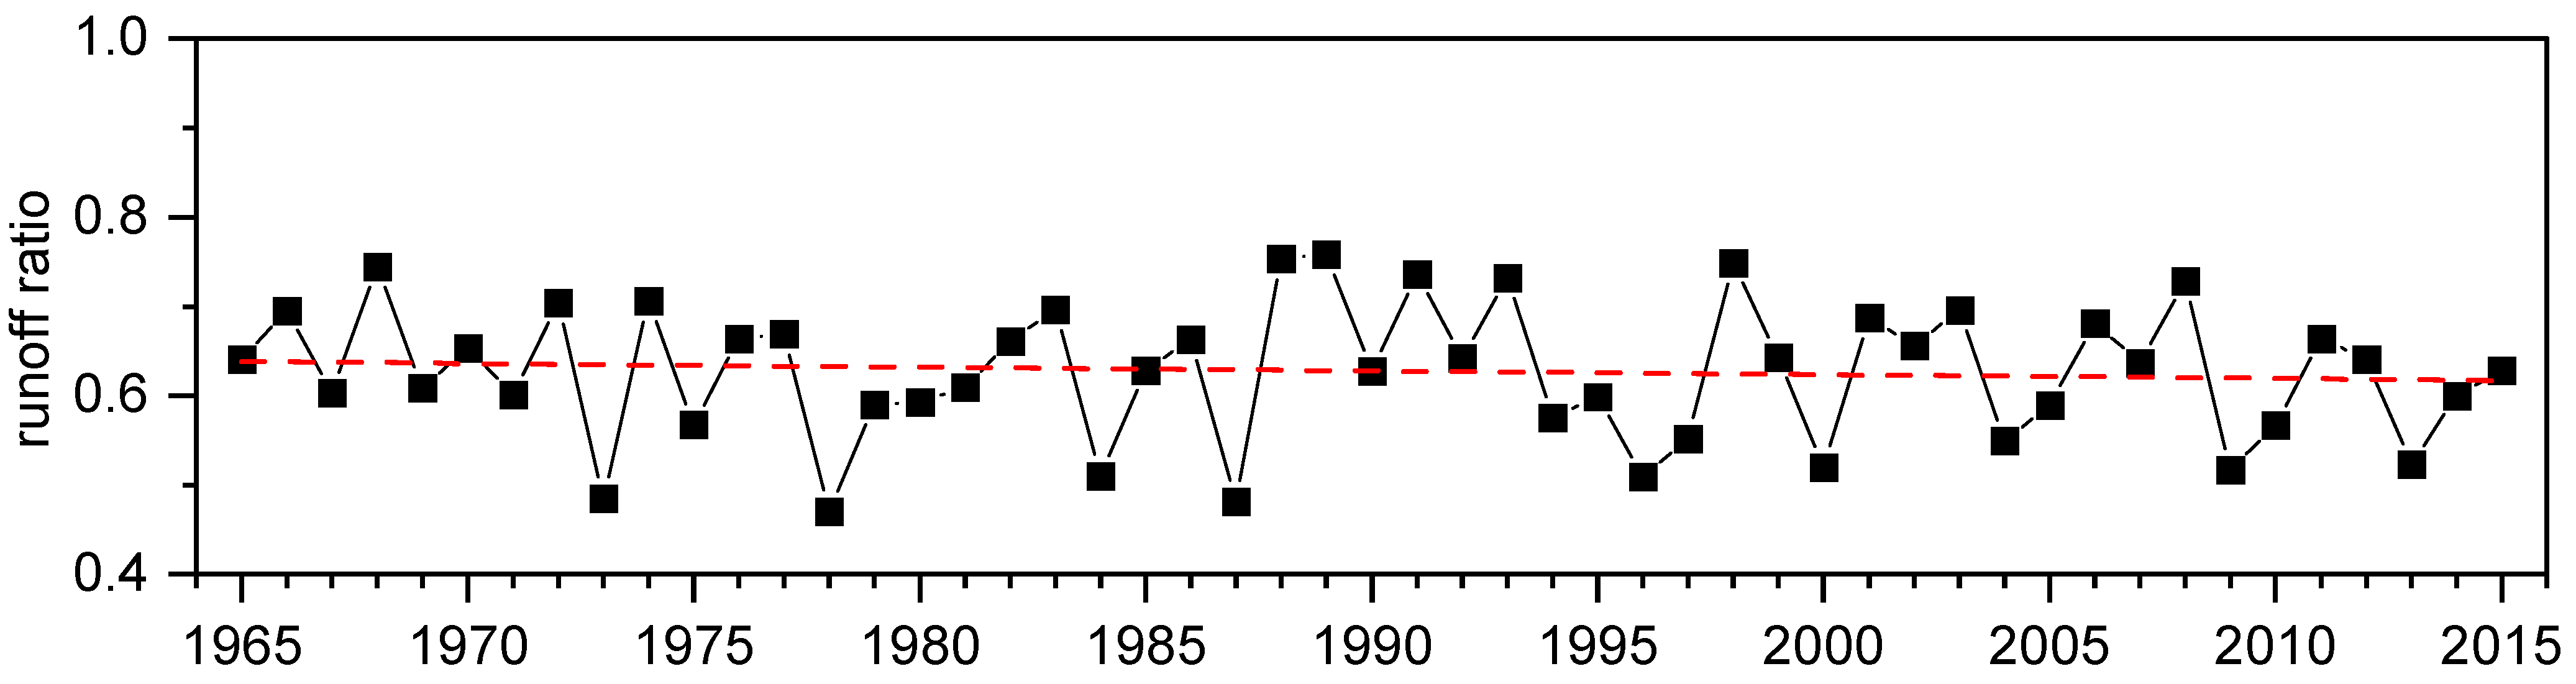
3.1. Rainfall–Runoff Correlation Plots

Figure 4 illustrates good reproducibility between the observed and estimated flow amounts in the year 2015 from using the tank model. In the most recent year in the study period, NSE between the observed and estimated value is 0.7147, while MAE and mean absolute percentage error (MAPE) are 0.9151 and 22.89%, respectively. On average, an NSE of 0.7929 and MAPE of 16.61% were computed in each year for the half-century study period. The most reliable predictions were attained in the year 1981 where NSE is 0.9670, MAE is 0.4868, and MAPE is 11.02%.
The annual discharge ratio, estimated by dividing the total discharge by the total precipitation in the watershed each year, is illustrated in Figure 5. Its values ranged from 0.47 (in 1978) to 0.76 (in 1989), with an average value of 0.63. This indicates that about 63% of precipitation is converted into surface and subsurface flows. With the time series of the discharge ratio showing a significantly decreasing trend (at α = 0.001 level of significance) at a rate of −0.0625 per year, it is highly plausible that a larger portion of water is getting stored in the soil. Moreover, accounting for the surface flows only, the discharge ratio will be about 0.25, which falls in the typical range for forests underlain by moderately permeable soils [54].
Figure 6 presents the linear correlation of runoff estimated from the tank model and rainfall events divided by decade. Isolating the rainfall events from May to October of each year, there is a very strong and significant (p-value < 0.001) correlation between the surface runoff and the continuous-event rainfall, with Pearson r values ranging from 0.9567 to 0.9895. When magnified, the decadal plots generally illustrated apparent shifts in linear slopes at the rainfall of 70 mm. It specifically implies that the amount of water stored in the soil will be different for rainfall amounts of less than and greater than 70 mm for all the decades; hence, SWSC was interpreted separately for weaker (R < 70 mm) and stronger events (R > 70 mm). This is also taking into consideration that the infiltration capacity and SWSC vary based on the duration of the continuous wet days and the saturation of the soil.
With all the plots intercepting at the origin (0,0), the linear slopes at an R of less than 70 mm showed a gradually decreasing trend. Specifically, from decade A to decade C, there is a steady decrease in linear slope, with values of 0.1938, 0.1740, and 0.1327, corresponding to decades A, B, and C, respectively. Then, a slight increase is found during the transition from decade C to decade D. The last shift in the trend of the linear slope is a decrease from decade D to E, from 0.1417 to 0.1261.
At continuous-event rainfall depths of more than 70 mm, the linear slopes showed a completely different trend. There is a sudden and large decrease in the slope of linear correlation from decade A to B, with values of 0.4554 and 0.3419, respectively. Then, an increase in the trend becomes evident from decade B up to decade D. Finally, a slight decrease in the linear slope is observed from decade D to decade E, at 0.4679 and 0.4631, respectively.
Based on these rainfall–runoff correlation plots, it can be inferred that about 19.38% of the 1–70 mm continuous-event rainfall becomes surface runoff during the 1965–1974 period, 17.40% during the 1975–1984 period, 13.27% during the 1985–1994 period, 14.17% during the 1995–2004 period, and finally, 12.61% in the most recent decade. This kind of inference, however, may only be applicable in the case of weaker continuous-rainfall events (R < 70 mm), since the number of correlation points among the decades is almost identical. The large variability of heavy rainfall occurrence during the peak typhoon season in the country (Aug–Sep) may have caused the unequal distribution of stronger continuous-rainfall events in the study area. In fact, by observing the number of correlation points at R > 70 mm alone, only decades A, B, and C can be comparable for having a precise number of points ranging from 27 to 30. Decades D and E have higher numbers of correlation points with 42 and 40, respectively, due to the increase in the number of successive wet days in their inclusive years [44].

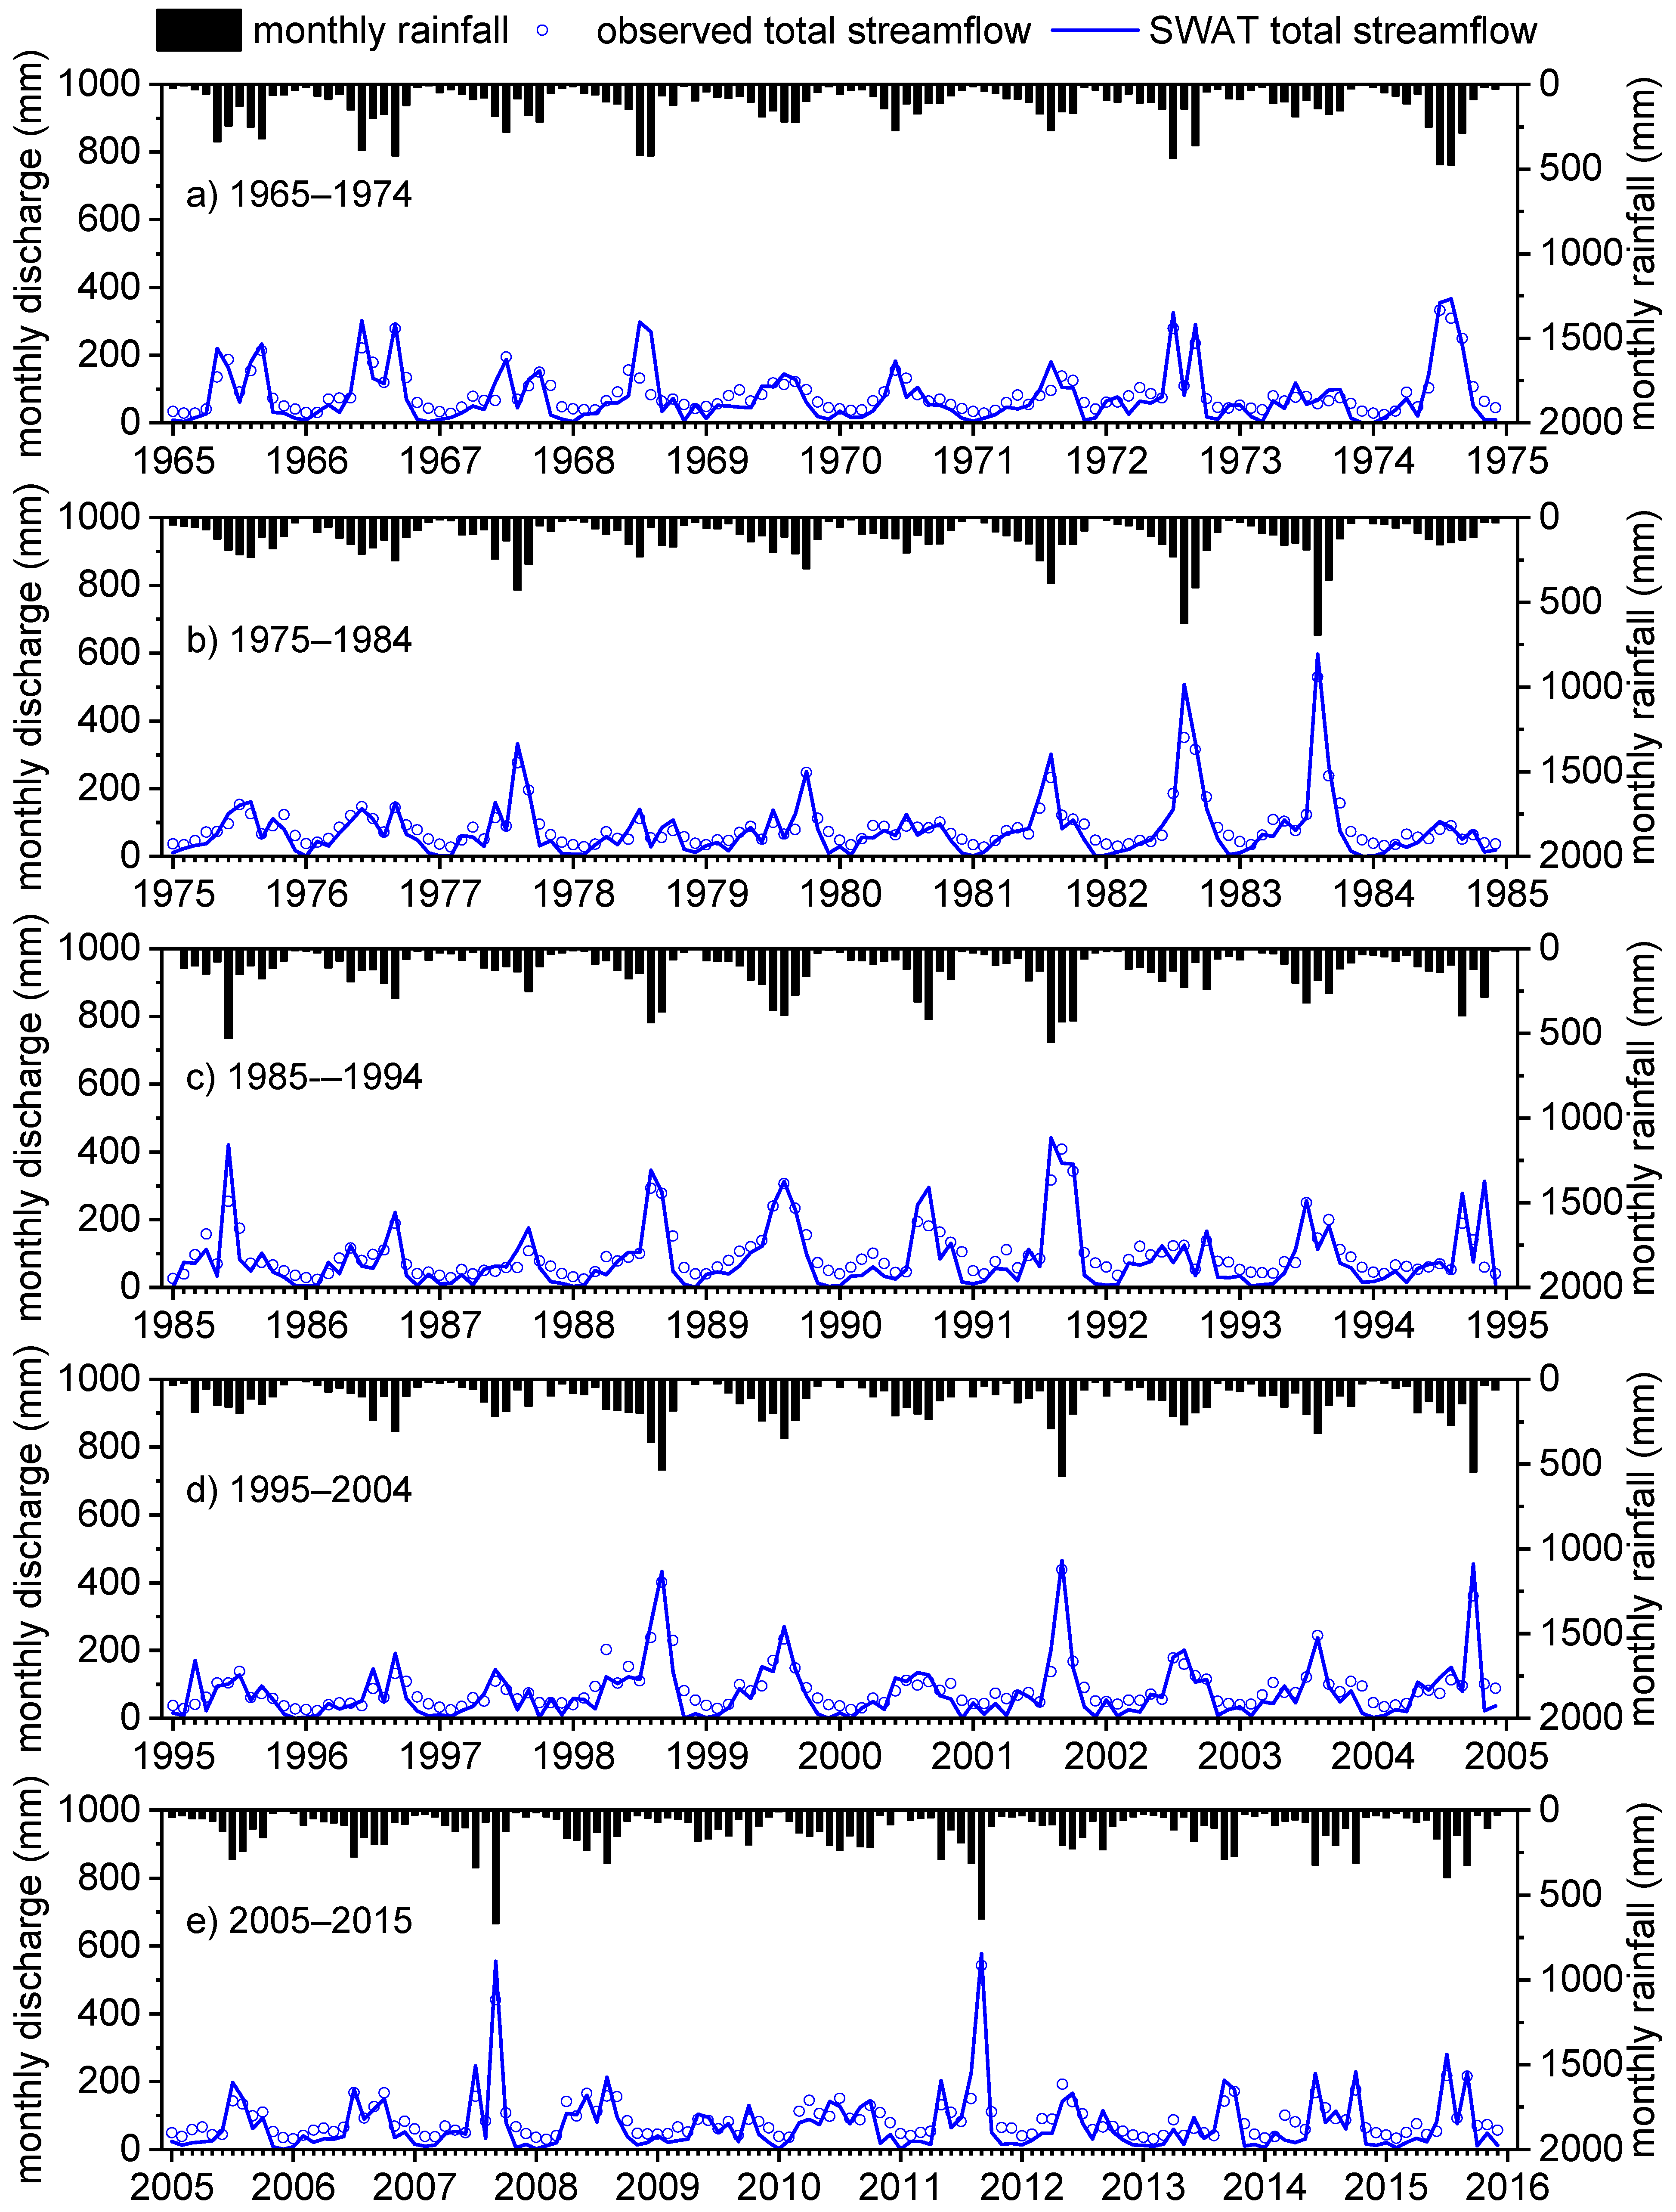
3.2. Performance of Initial SWAT Calculation per Decade

The initial predictions for the 1965–2015 study period computed an NSE of 0.6618, RMSE of 39.4820 (RSR = 0.5815), PBIAS of 12.4973, MAE of 30.2849, and R2 of 0.8361, hence an overall Good rating based on the guidelines for the systematic quantification of SWAT model accuracy [51]. Meanwhile, the decadal performance ratings (Table 2) indicated that the monthly streamflow calculation for decade C was rated as Satisfactory, decades A, D, and E were classified as Good, while the discharge prediction for decade B was considered the most accurate with a rating of Very Good. Since the performance of initial discharge predictions for all the decades exceeded the Satisfactory rating, the parameter adjustment to observe the trends in soil water condition proceeded directly.
Overall, the total streamflow hydrographs from decade A to decade E during the initial calculation (Figure 7) show that SWAT was able to reliably reproduce the high and moderate flows, especially during the rainfall-abundant months of each year. However, underestimated streamflows were apparent during the water-stressed months of October to November (post-monsoon season) and December to January (early to mid-winter) when the amount of monthly evapotranspiration exceeds the received rainfall. The underestimated values during the rainfall-scarce months can also be due to the conceptual linear one-reservoir or shallow aquifer storage system assumed by SWAT to model the baseflows [55].

4. Discussion

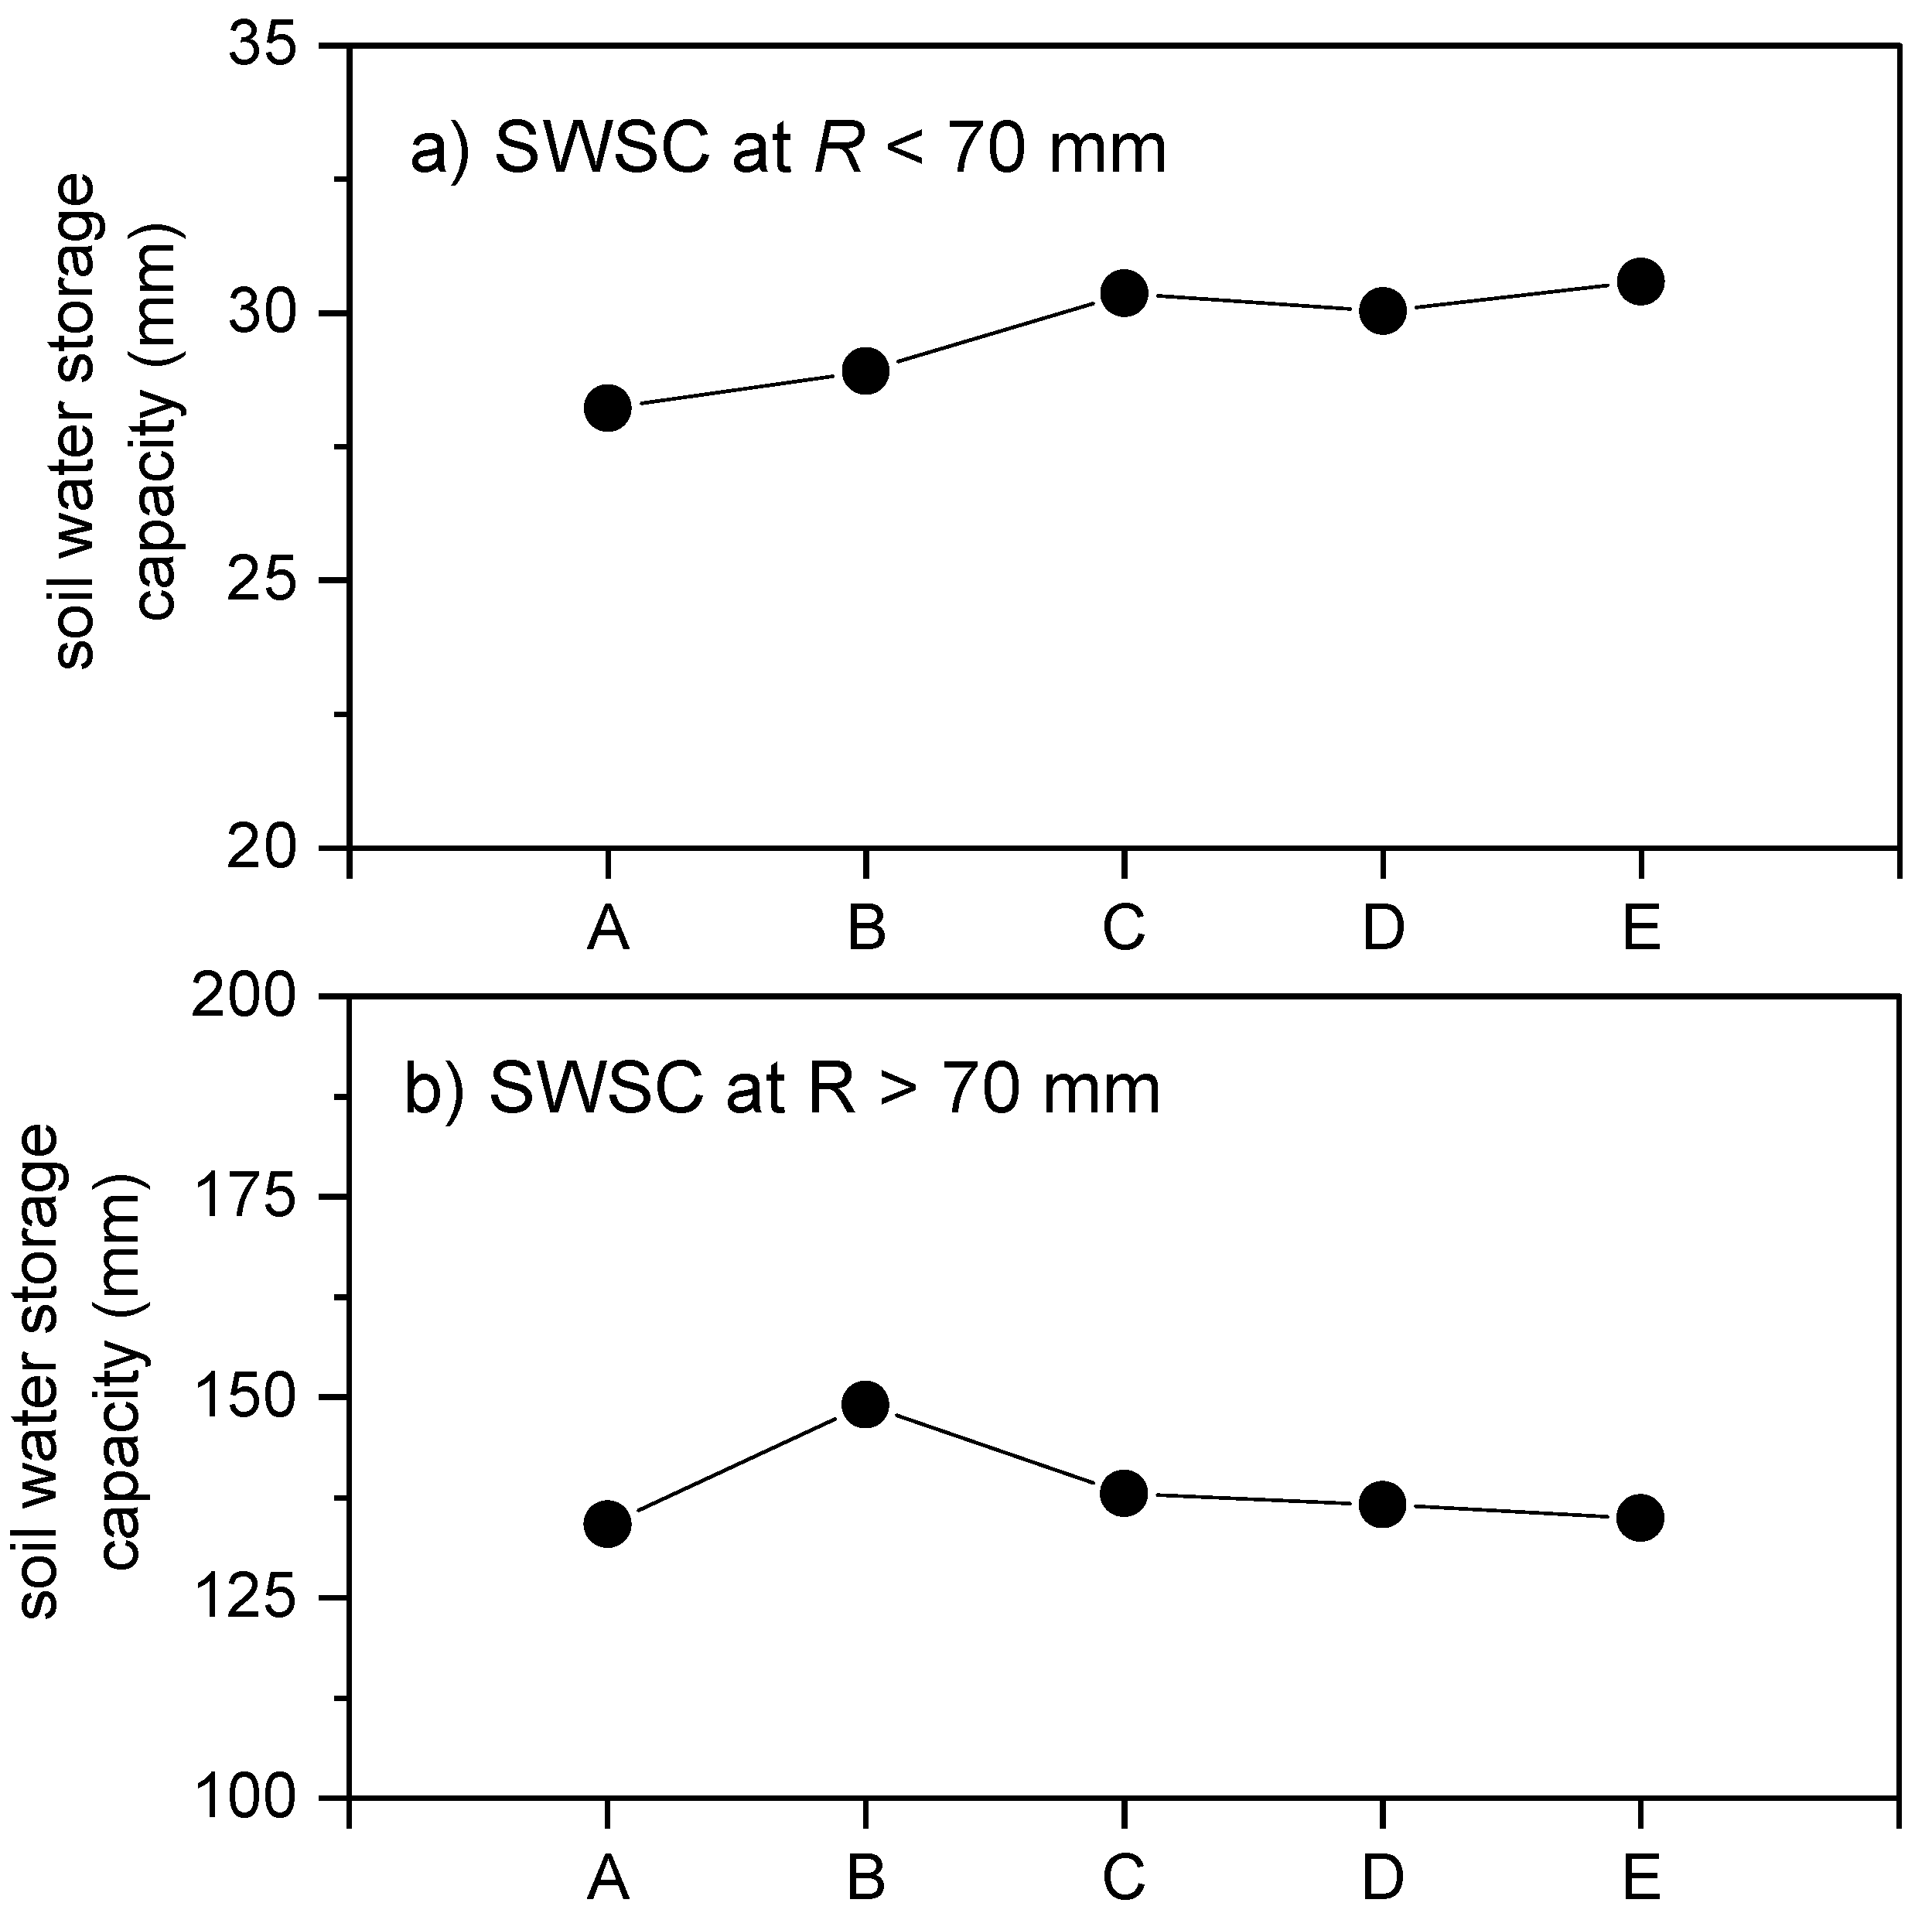
4.1. Trends in Soil Water Storage Capacity Based on Correlation Analysis

In this study, the use of rainfall–runoff correlation analysis in observing the decadal changes in the soil water storage condition was justified considering the fact that soil permeability and soil water storage in forested catchments are associated with the quantity of surface runoff generated from rainfall [1,10,11,12,13,14,15,16,17,18]. Due to the apparent shifts in slopes at an R of 70 mm, values of SWSC were plotted separately for weaker (R < 70 mm) and stronger events (R > 70 mm). The decadal trend of SWSC for weaker continuous-rainfall events (Figure 8a) presents a rapidly increasing trend from decade A to decade C and then a gradual increase from decade C to decade E. With respect to time, the Pearson coefficient r is 0.9135, and the p-value is 0.0301, hence statistically significant. At continuous-rainfall events of less than 70 mm, the soil likely does not easily become saturated, allowing water to infiltrate and be stored in its subsurface [44,56,57]. The continuous rehabilitation of abandoned and neglected forests has likely increased the infiltration capacity of the soil; hence, more water is potentially stored. Specifically, the enrichment and maintenance of a healthy understory layer through thinning and regeneration cutting in the early decades has likely caused the dramatic improvement in the infiltration properties and SWSC [58,59]. The currently adopted countermeasures of installing deer-prevention and earth-retaining fences may have additional effects on soil compaction that reduces the rate of both water infiltration and drainage [60]. While these measures reduce litter mobility [61] which enhances infiltration and water availability, the net effect on SWSC is not as large compared to the primary measures implemented during the early decades.
In contrast, stronger events of rainfall oversaturate the soil and consequently produce larger surface runoff, as illustrated in Figure 8b. Based on the present analysis, no clear trend was found for the decadal variation in SWSC at continuous-event rainfall of more than 70 mm. A stable and rapid increase was observed from decade A to decade B, but the reason for the decreasing trend in the succeeding decades needs to be clarified later.

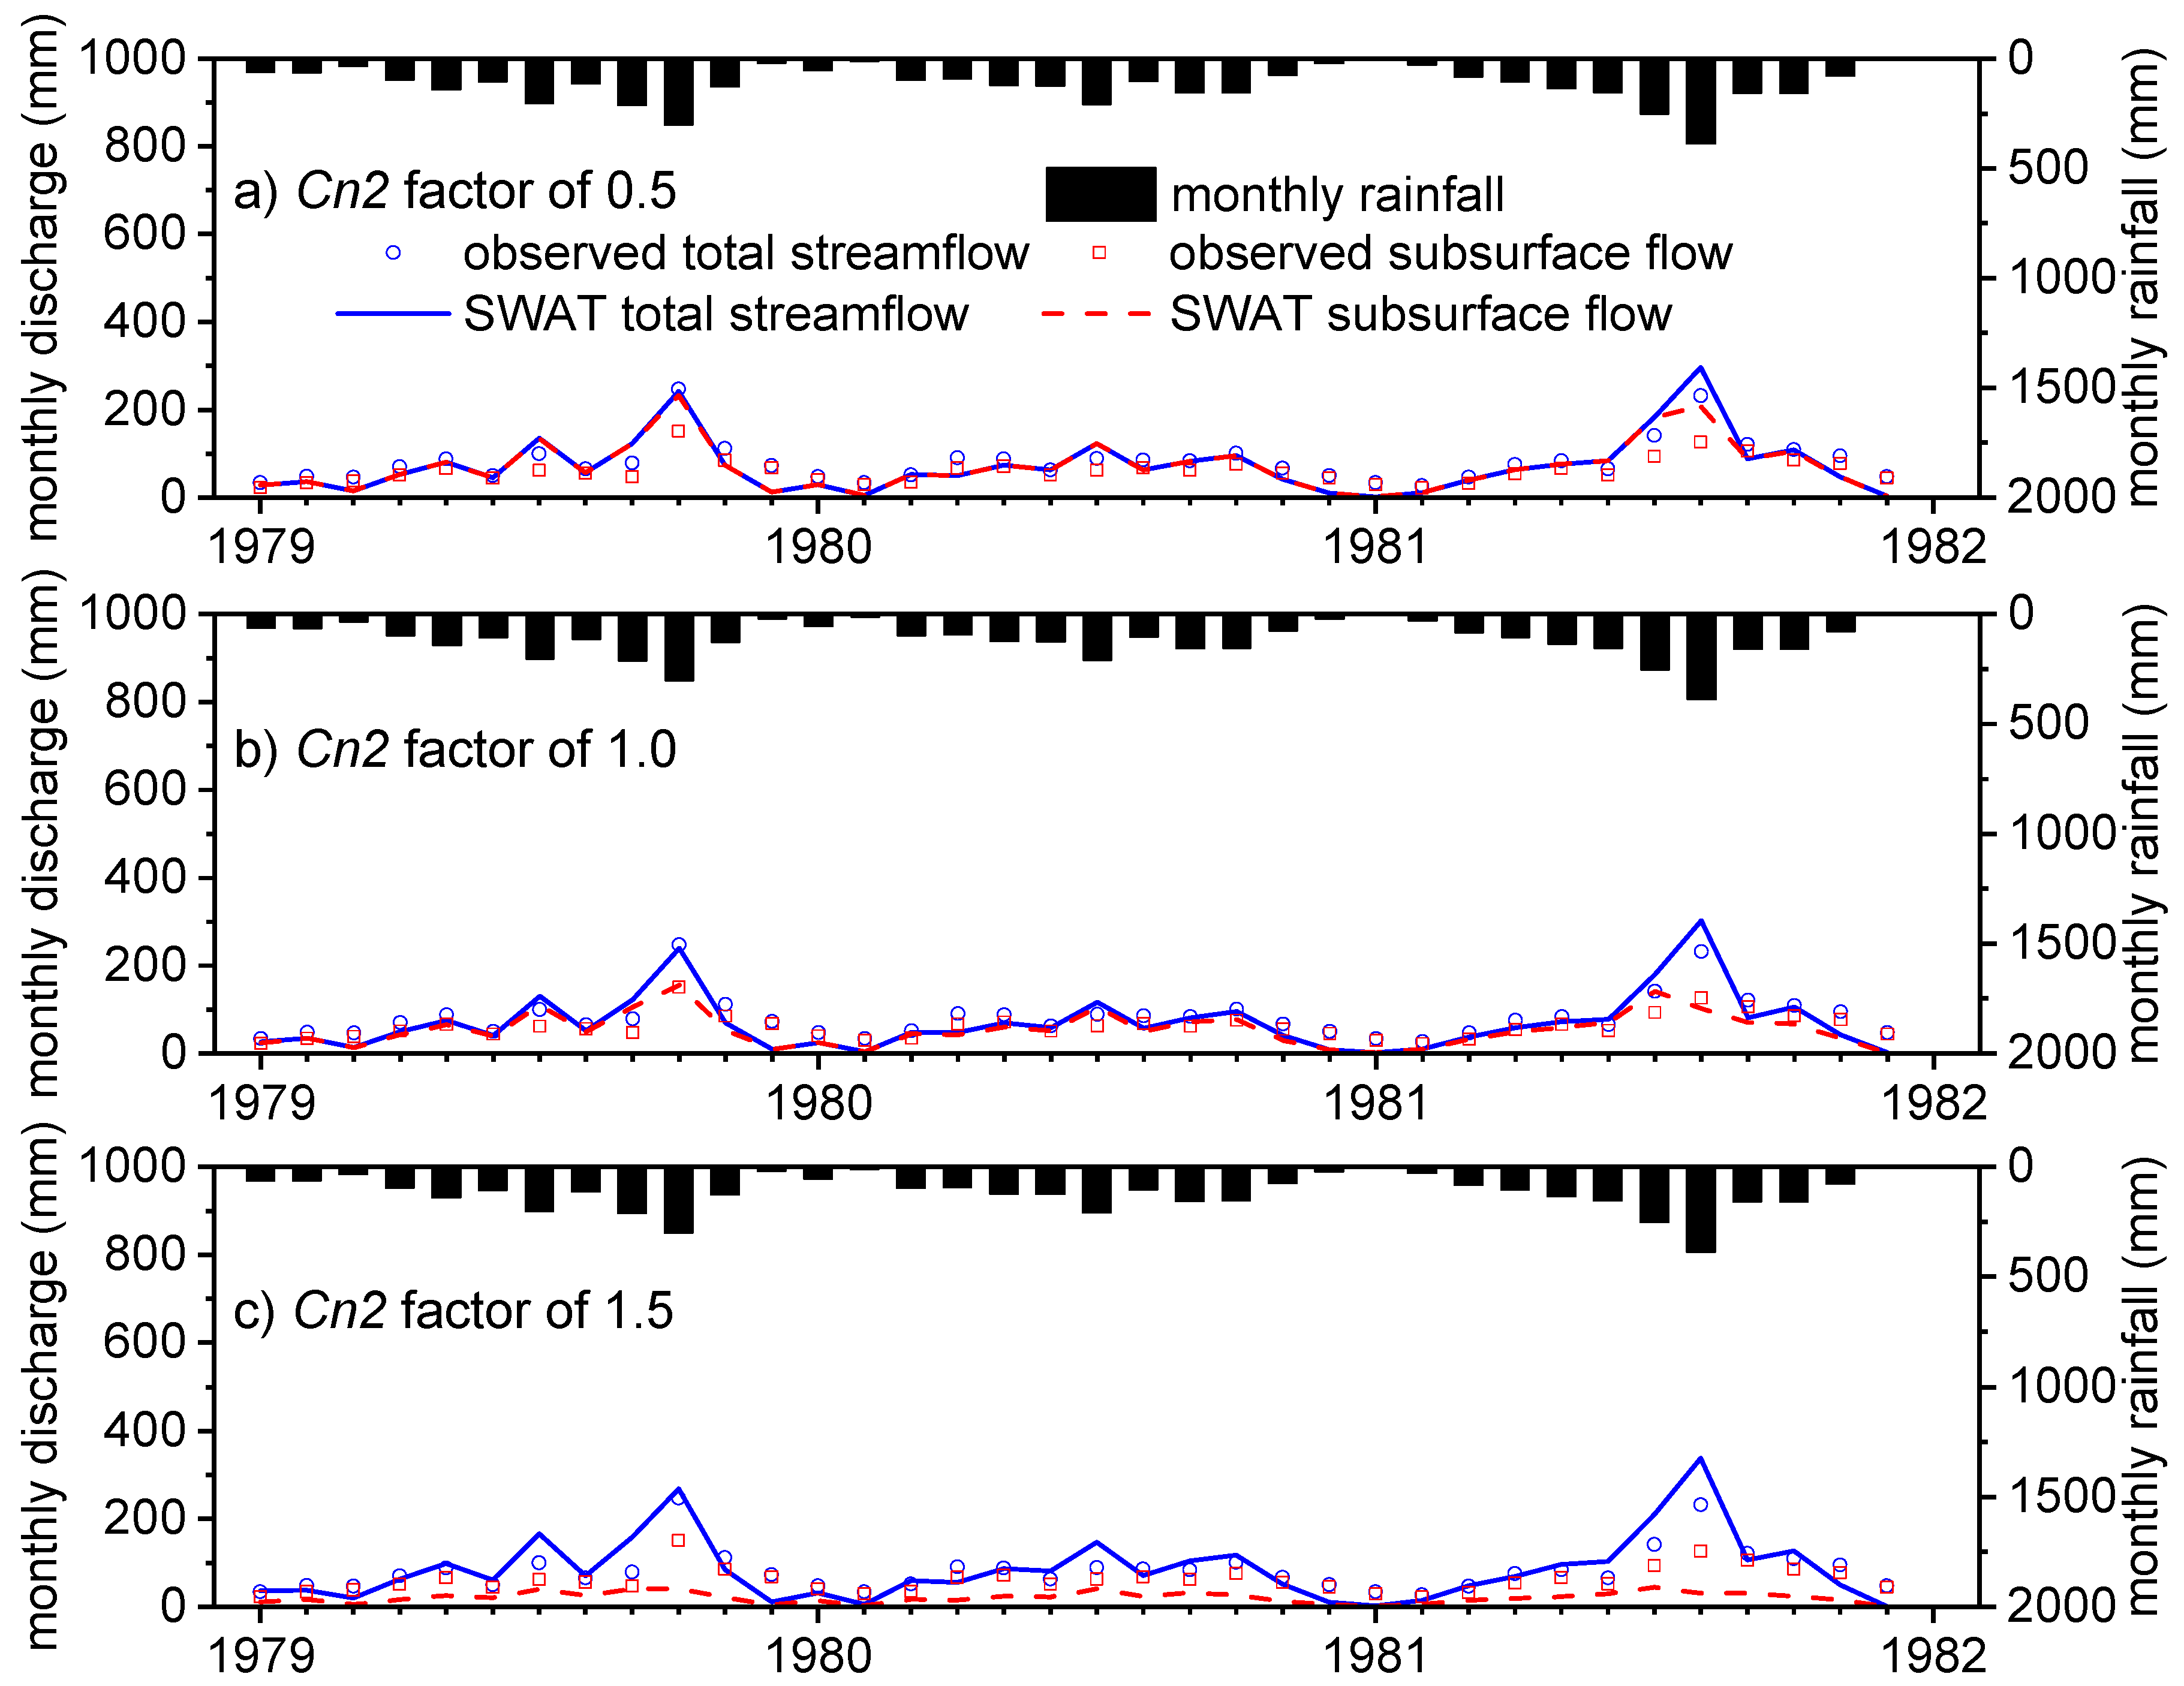
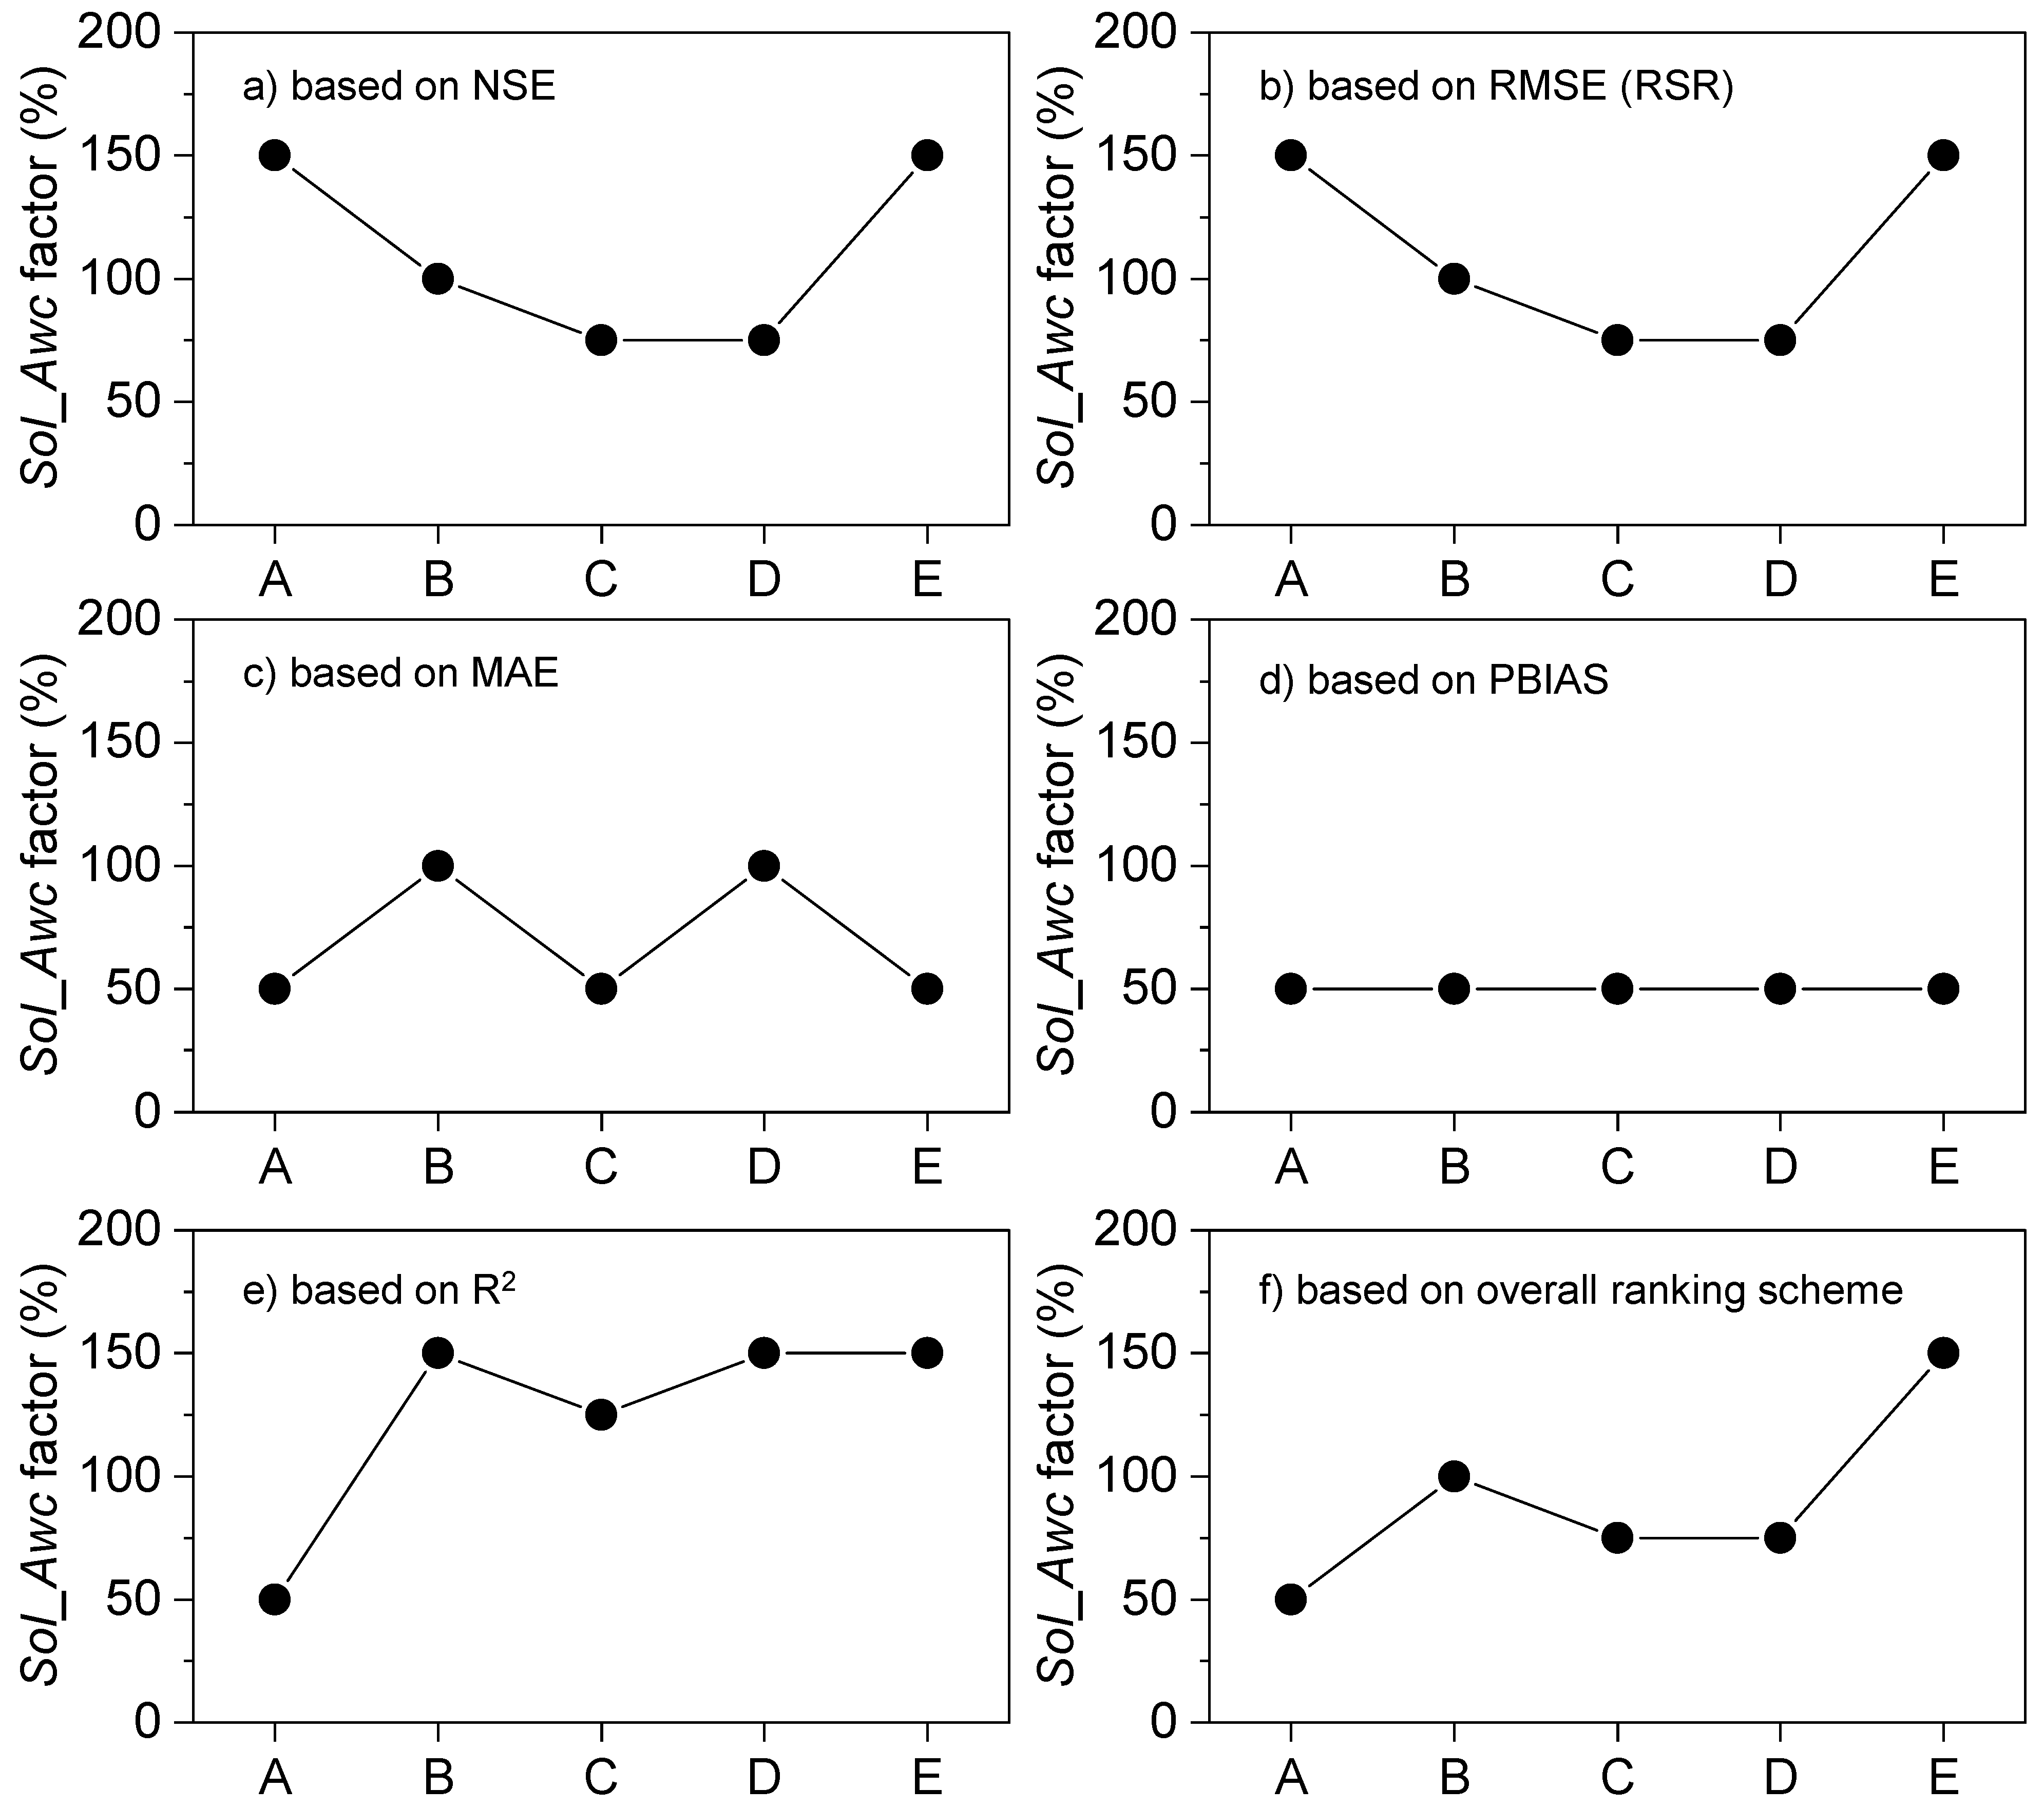
4.2. Trends in Runoff Potential and Soil Available Water Capacity Based on Parameter Evaluation in SWAT

Although the analysis method has already been reported and affirmed by some experts [44], the general conclusion from the first approach that sustainable forest management likely improved the water capacity of the soil needs to be further justified. Thus, a parallel analysis was performed using the parameter calibration function of soil-water-related parameters in the physically based SWAT hydrologic model. As mentioned previously, parameters Cn2 and Sol_Awc reflect the surface and subsurface flow regimes, as well as the soil water storage characteristics of the watershed. The curve number is used to predict how much rainfall infiltrates into the soil, and consequently, how much rainfall is converted into surface runoff based on the land cover, soil hydrological group, and level of land management [62]. Essentially, the higher the CN value, the higher the runoff potential will be [63,64]. Lower values are assigned for highly permeable soils with good infiltration characteristics. In calibrating the Cn2 factor, the initial values defined by SWAT from the spatial information contained in the maps were retained, and only the percent change in such defined Cn2 values was quantified in each decade.
In the case of improving the trend of the monthly total streamflow alone, NSE can be maximized if the Cn2 factor is 0.5, i.e., 50% of the SWAT-defined Cn2, from decade A to decade F. Considering that the initial Cn2 for forested lands underlain by brown forest soils ranges from 55 (evergreen) to 66 (deciduous), the adjusted curve number will be about 28 to 33. This large reduction in Cn2 can only be represented by well-managed forests underlain by soils with the highest possible water retention. In such an idealized scenario, the prediction of total streamflows from 1979 to 1981 (Figure 9a), the years where the most precise simulations were evident, was remarkably improved. However, when additionally compared to the filtered subsurface flows, it was found that the total streamflows had become dominated by the subsurface component, inaccurately simulating the surface flows even during the rainfall-abundant months. Comparing the hydrographs at Cn2 factors of 1.0 (Figure 9b) and 1.5 (Figure 9c), closer and more representative simulations of total and subsurface flows were apparent upon retaining the initial Cn2 value. Moreover, it was confirmed that the discharge predictions at the Cn2 factor of 1.5 computed a runoff ratio of 0.80, while the simulations at the Cn2 factor of 1.0 estimated a runoff ratio of 0.65, which is closer to the value reported from the data analysis that is 0.63 [44]. Ultimately, Cn2 remained constant at a factor of 1.0 throughout the five-decade study period.
Meanwhile, it is slightly impractical to observe the differences in the simulated subsurface flows at varying Sol_Awc factors through monthly hydrographs since such differences are only discernible on the daily scale. Similar to the Cn2 earlier, the Sol_Awc factor refers to the percent change from the initial Sol_Awc assigned by SWAT for each soil type, which in this case, ranges from 0.16 mm water/mm soil for the brown forest soil (79.0% of the watershed area) up to 0.21 mm water/mm soil for the clayey soil (2.0%). Specifically, a Sol_Awc factor of 100% reflects the original value assigned by SWAT, a factor of less than 100% indicates a decrease in soil water capacity, while a factor of more than 100% represents an increase and improvement in the soil water condition.
To proceed, the quantification of Sol_Awc factors in each decade utilized the results from the statistical evaluation of model performance. Conflicting model performance, described by unbalanced ratings between the dimensionless normalized statistic, NSE, standard regression statistic, R2, and error and bias indices, RMSE, MAE, and PBIAS, were observed. In such a situation, it is recommended to individually describe the differences in model performance based on the simulation efficiency or error variance measured by the individual index [51]. Following this statement, separate decadal trends of the Sol_Awc factor, in reference to NSE, RMSE (RSR), MAE, PBIAS, and R2, were established.
Ideally, the desired model should have high values of NSE and R2, i.e., a high level of collinearity and hydrograph reproducibility, and low values of RMSE, MAE, and PBIAS, i.e., low deviation and error when compared to the observed values. With the encountered conflict in the model performance ratings, a scoring system, initially applied by Gunay et al. [65], that ranks the factors based on their performance in each of the statistical indices is used. An example of this scoring system (Table 3) assigns a score of ‘5′ in the Sol_Awc factor of 1.00 for yielding the best discharge predictions in terms of NSE, RMSE (RSR), and MAE. However, a different Sol_Awc factor produced the best model simulations in reference to PBIAS and R2. Having the maximum overall score, the Sol_Awc factor of 1.00 best represents the soil available water capacity in decade B.
Based on the efficiency in reproducing the monthly hydrographs, represented by NSE, Figure 10a shows a rapidly decreasing trend of the Sol_Awc factor from decade A to decade C. Then, a steady increase is apparent from decade C to decade E. A similar trend can be observed in Figure 10b upon illustrating the optimal Sol_Awc factors based on RMSE (and even RSR). In these first two decadal changes from the modeling approach, Pearson coefficient r from decade B to E is 0.5477, and the p-value is 0.4523. On the other hand, the trend of representative Sol_Awc factors based on MAE (Figure 10c) showed unclear upward and downward trends, while in terms of the PBIAS (Figure 10d), a constant trend was observed. Because of the square function in their equations, NSE and RMSE are the recommended essential model indicators in understanding peak discharge at short periods, while MAE and PBIAS are the preferred indices in quantifying the deviation in low discharge at long periods [66]. Finally, based on the degree of collinearity between the simulated and measured discharge, reflected through R2, Figure 10e demonstrates a dramatic increase in the Sol_Awc factor from decade A to decade B. The trend dipped slightly in the transition from decade B to decade C, and then it increased again from decade C to decade D, becoming constant and steady at the Sol_Awc factor of 1.50 when it reaches the most recent decade. Pearson r from decade A to E based on R2 in Figure 10e is 0.7303, and the p-value is 0.1612. The resulting trend of the overall ranking scheme (Figure 10f) shows a slight decrease from decade A to decade B and a gradual upward trend from decade B to decade F. Pearson r based on the overall ranking scheme is 0.7190, and the p-value is 0.1711.
Four of the six established decadal trends were able to logically illustrate the high possibility of steady improvement in the soil water condition altering the subsurface flow rates in the watershed. However, there is no remarkable change in the Cn2 factor that controls the overland flow regimes. Its detailed quantification may also be improbable for this kind of analysis method, considering that overland flow seldom occurs in forests even at flood-producing amounts of rainfall since their high infiltration capacity usually exceeds the rainfall intensity [67]. Meanwhile, the generally increasing trend of the soil available water capacity, especially in the last two to three decades, can be attributed to the improved ground surface cover brought by the earlier mentioned forest protection practices. Thus, the decadal trends from this current approach agreed with the previous findings from the rainfall–runoff correlation analysis [44] that long-term and continuous environmental rehabilitation practices are likely to bring a positive effect on the soil water storage characteristics of the forested watershed in the long run. Aside from their remarkable effects on soil water storage and availability, the healthy and well-protected forest floor in the watershed also increases erosion resistance and, overall, can contribute to the sediment stabilization in the Ogouchi Reservoir [39].

5. Conclusions

The changes in soil water storage characteristics in the Ogouchi Dam watershed, where forest management had become more inclusive in the past two decades, were investigated in this study. Specifically, the Bureau of Waterworks of the Tokyo Metropolitan Government has been expanding its environmental rehabilitation efforts to poorly maintained and abandoned private forests in the watershed. It is hypothesized that the numerous protection measures being implemented such as thinning, regeneration cutting, multi-layer planting, installation of deer-prevention fences, and placement of earth-retaining fences in the form of lined felled trees contribute to the water conservation function of the forest. The availability of well-documented hydroclimatic records for over 50 years enabled the investigation to proceed using two different approaches. The rainfall–runoff correlation analysis earlier affirmed a steady and significant increase in the soil water storage capacity during weaker continuous-rainfall events, i.e., continuous rainy days accumulating less than 70 mm of rain. The rapid improvement in the soil water condition was evident from decade A (1965–1974) up to decade C (1985–1994), but the upward trend becomes more gradual from decade C to decade E (2005–2015). On the other hand, the parameter adjustment in the monthly discharge model in SWAT was able to practically illustrate that runoff potential remains constant. Meanwhile, the decadal trends in soil available water capacity were visualized by looking into the prediction performance of each Sol_Awc factor in accordance with some recommended statistical indices. Based on NSE, RMSE (RSR), and R2, the decadal trend established an upward trend from decade C to decade E. With the continuing rehabilitation efforts in the abandoned and neglected forests in the study site, it is expected that the improvement in the soil water storage condition will be more evident in the long run.

Author Contributions

Conceptualization, C.J.C.G. and K.Y.; Methodology, C.J.C.G. and K.Y.; Formal analysis, C.J.C.G.; Resources, K.Y., H.S., A.K. and K.S.; Data curation, C.J.C.G., K.Y. and H.S.; Writing—original draft preparation, C.J.C.G.; Writing—review and editing, K.Y. and H.S.; Supervision, K.Y.; Project administration, K.Y., H.S., A.K. and K.S.; Funding acquisition, K.Y. and K.S. All authors have read and agreed to the published version of the manuscript.

Funding

This research utilized the funding allotted for the collaborative work between Tokyo Metropolitan University and the Bureau of Waterworks of the Tokyo Metropolitan Government.

Data Availability Statement

Data were obtained from the Forest Research Section of the Bureau of Waterworks of the Tokyo Metropolitan Government (third party), and access to such data is highly restricted.

Acknowledgments

The authors would like to express their utmost gratitude to the Forest Research Section of the Bureau of Waterworks of the Tokyo Metropolitan Government for the provision of long-term climate and discharge data relevant to the analyses performed in this paper. We would also like to thank Chika Nakagawa and Liangchen Li for their valuable support during the initial stage of the investigation. Lastly, C.J.C. Gunay is grateful to the Japanese Government for funding his Ph.D. study through the MEXT Scholarship program.

Conflicts of Interest

The authors declare no conflict of interest.

References

  1. Peters, N.E.; Aulenbach, B.T. Water storage at the Panola Mountain Research Watershed, Georgia, USA. Hydrol. Process. 2011, 25, 3878–3889. [Google Scholar] [CrossRef]
  2. Chen, J.; Shao, C.; Jiang, S.; Qu, L.; Zhao, F.; Dong, G. Effects of changes in precipitation on energy and water balance in a Eurasian meadow steppe. Ecol. Process. 2019, 8, 17. [Google Scholar] [CrossRef]
  3. Vaes, G.; Willems, P.; Berlamont, J. Rainfall input requirements for hydrological calculations. Urban Water 2001, 3, 107–112. [Google Scholar] [CrossRef]
  4. Tuo, Y.; Duan, Z.; Disse, M.; Chiogna, G. Evaluation of precipitation input for SWAT modeling in Alpine catchment: A case study in the Adige river basin (Italy). Sci. Total Environ. 2016, 573, 66–82. [Google Scholar] [CrossRef] [Green Version]
  5. Paudel, S.; Benjankar, R. Integrated hydrological modeling to analyze the effects of precipitation on surface water and groundwater hydrologic processes in a small watershed. Hydrology 2022, 9, 37. [Google Scholar] [CrossRef]
  6. Zhang, Y.; Liu, J.; Xu, X.; Tian, Y.; Li, Y.; Gao, Q. The response of soil moisture content to rainfall events in semi-arid area of Inner Mongolia. Procedia Environ. Sci. 2010, 2, 1970–1978. [Google Scholar] [CrossRef] [Green Version]
  7. Karpouzos, D.K.; Baltas, E.A.; Kavalieratou, S.; Babajimopoulos, C. A hydrological investigation using a lumped water balance model: The Aison River Basin case (Greece). Water Environ. J. 2011, 25, 297–307. [Google Scholar] [CrossRef]
  8. Saito, L.; Biondi, F.; Devkota, R.; Vittori, J.; Salas, J.D. A Water balance approach for reconstructing streamflow using tree-ring proxy records. J. Hydrol. 2015, 529, 535–547. [Google Scholar] [CrossRef] [Green Version]
  9. Solander, K.; Saito, L.; Biondi, F. Streamflow simulation using a water-balance model with annually-resolved inputs. J. Hydrol. 2010, 387, 46–53. [Google Scholar] [CrossRef]
  10. Ries, F.; Schmidt, S.; Sauter, M.; Lange, J. Controls on runoff generation along a steep climatic gradient in the Eastern Mediterranean. J. Hydrol. Reg. Stud. 2017, 9, 18–33. [Google Scholar] [CrossRef]
  11. Hu, C.; Zhao, D.; Jian, S. Baseflow Estimation in typical catchments in the Yellow River Basin, China. Water Sci. Technol. Water Supply 2021, 21, 648–667. [Google Scholar] [CrossRef]
  12. Aboelnour, M.; Gitau, M.W.; Engel, B.A. A comparison of streamflow and baseflow responses to land-use change and the variation in climate parameters using SWAT. Water 2020, 12, 191. [Google Scholar] [CrossRef] [Green Version]
  13. Shao, G.; Zhang, D.; Guan, Y.; Sadat, M.A.; Huang, F. Application of different separation methods to investigate the baseflow characteristics of a semi-arid sandy area, Northwestern China. Water 2020, 12, 434. [Google Scholar] [CrossRef] [Green Version]
  14. Farrick, K.K.; Branfireun, B.A. Soil Water Storage, Rainfall and runoff relationships in a tropical dry forest catchment. Water Resour. Res. 2014, 50, 9236–9250. [Google Scholar] [CrossRef]
  15. Shi, P.; Yang, T.; Xu, C.Y.; Yong, B.; Huang, C.S.; Li, Z.; Qin, Y.; Wang, X.; Zhou, X.; Li, S. Rainfall-runoff processes and modelling in regions characterized by deficiency in soil water storage. Water 2019, 11, 1858. [Google Scholar] [CrossRef] [Green Version]
  16. Ghajarnia, N.; Kalantari, Z.; Orth, R.; Destouni, G. Close co-variation between soil moisture and runoff emerging from multi-catchment data across Europe. Sci. Rep. 2020, 10, 4817. [Google Scholar] [CrossRef] [Green Version]
  17. Crow, W.T.; Chen, F.; Reichle, R.H.; Xia, Y.; Liu, Q. Exploiting soil moisture, precipitation, and streamflow observations to evaluate soil moisture/runoff coupling in land surface models. Geophys. Res. Lett. 2018, 45, 4869–4878. [Google Scholar] [CrossRef]
  18. Sazib, N.; Bolten, J.; Mladenova, I. Exploring spatiotemporal relations between soil moisture, precipitation, and streamflow for a large set of watersheds using Google Earth Engine. Water 2020, 12, 1371. [Google Scholar] [CrossRef]
  19. Liu, W.; Xu, Z.; Wei, X.; Li, Q.; Fan, H.; Duan, H.; Wu, J. Assessing hydrological responses to reforestation and fruit tree planting in a sub-tropical forested watershed using a combined research approach. J. Hydrol. 2020, 590, 125480. [Google Scholar] [CrossRef]
  20. Farley, K.A.; Jobbágy, E.G.; Jackson, R.B. Effects of afforestation on water yield: A global synthesis with implications for policy. Glob. Chang. Biol. 2005, 11, 1565–1576. [Google Scholar] [CrossRef]
  21. Wei, X.; Li, Q.; Zhang, M.; Giles-Hansen, K.; Liu, W.; Fan, H.; Wang, Y.; Zhou, G.; Piao, S.; Liu, S. Vegetation cover—Another dominant factor in determining global water resources in forested regions. Glob. Chang. Biol. 2018, 24, 786–795. [Google Scholar] [CrossRef] [PubMed]
  22. Li, Q.; Wei, X.; Zhang, M.; Liu, W.; Giles-Hansen, K.; Wang, Y. The cumulative effects of forest disturbance and climate variability on streamflow components in a large forest-dominated watershed. J. Hydrol. 2018, 557, 448–459. [Google Scholar] [CrossRef]
  23. Matsushita, B.; Xu, M.; Onda, Y.; Otsuki, Y.; Toyota, M. Detecting forest degradation in Kochi, Japan: Ground-based measurements versus satellite (Terra/ASTER) remote sensing. Hydrol. Process. 2010, 24, 588–595. [Google Scholar] [CrossRef]
  24. Higashino, M.; Stefan, H.G. Variability and change of precipitation and flood discharge in a Japanese river basin. J. Hydrol. Reg. Stud. 2019, 21, 68–79. [Google Scholar] [CrossRef]
  25. Kuehler, E.; Hathaway, J.; Tirpak, A. Quantifying the benefits of urban forest systems as a component of the green infrastructure stormwater treatment network. Ecohydrology 2017, 10, e1813. [Google Scholar] [CrossRef]
  26. Yang, L.; Wei, W.; Chen, L.; Mo, B. Response of deep soil moisture to land use and afforestation in the semi-arid Loess Plateau, China. J. Hydrol. 2012, 475, 111–122. [Google Scholar] [CrossRef]
  27. Kabeja, C.; Li, R.; Guo, J.; Rwatangabo, D.E.R.; Manyifika, M.; Gao, Z.; Wang, Y.; Zhang, Y. The impact of reforestation induced land cover change (1990–2017) on flood peak discharge using HEC-HMS hydrological model and satellite observations: A study in two mountain basins, China. Water 2020, 12, 1347. [Google Scholar] [CrossRef]
  28. Liu, J.; Li, S.; Ouyang, Z.; Tam, C.; Chen, X. Ecological and socioeconomic effects of China’s policies for ecosystem services. Proc. Natl. Acad. Sci. USA 2008, 105, 9477–9482. [Google Scholar] [CrossRef] [Green Version]
  29. Mizuno, T.; Kojima, N.; Asano, S. The risk reduction effect of sediment production rate by understory coverage rate in granite area mountain forest. Sci. Rep. 2021, 11, 14415. [Google Scholar] [CrossRef]
  30. Moos, C.; Bebi, P.; Schwarz, M.; Stoffel, M.; Sudmeier-Rieux, K.; Dorren, L. Ecosystem-based disaster risk reduction in mountains. Earth-Sci. Rev. 2018, 177, 497–513. [Google Scholar] [CrossRef]
  31. Chen, L.; Yuan, Z.; Shao, H.; Wang, D.; Mu, X. Effects of thinning intensities on soil infiltration and water storage capacity in a Chinese pine-oak mixed forest. Sci. World J. 2014, 2014, 268157. [Google Scholar] [CrossRef] [PubMed] [Green Version]
  32. Wang, T.; Xu, Q.; Gao, D.; Zhang, B.; Zuo, H.; Jiang, J. Effects of thinning and understory removal on the soil water-holding capacity in Pinus massoniana plantations. Sci. Rep. 2021, 11, 13029. [Google Scholar] [CrossRef] [PubMed]
  33. Bethlahmy, N. First year effects of timber removal on soil moisture. Int. Assoc. Sci. Hydrol. Bull. 1962, 7, 34–38. [Google Scholar] [CrossRef] [Green Version]
  34. Ide, J.; Finér, L.; Laurén, A.; Piirainen, S.; Launiainen, S. Effects of clear-cutting on annual and seasonal runoff from a boreal forest catchment in eastern Finland. For. Ecol. Manag. 2013, 304, 482–491. [Google Scholar] [CrossRef]
  35. Ilek, A.; Kucza, J.; Szostek, M. The effect of stand species composition on water storage capacity of the organic layers of forest soils. Eur. J. For. Res. 2015, 134, 187–197. [Google Scholar] [CrossRef] [Green Version]
  36. Takatsuki, S. Effects of sika deer on vegetation in Japan: A review. Biol. Conserv. 2009, 142, 1922–1929. [Google Scholar] [CrossRef]
  37. Nagaike, T.; Ohkubo, E.; Hirose, K. Vegetation recovery in response to the exclusion of grazing by sika deer (Cervus nippon) in seminatural grassland on Mt. Kushigata, Japan. ISRN Biodivers. 2014, 2014, 1–6. [Google Scholar] [CrossRef] [Green Version]
  38. Suzuki, M. Succession of abandoned coppice woodlands weakens tolerance of ground-layer vegetation to ungulate herbivory: A test involving a field experiment. For. Ecol. Manag. 2013, 289, 318–324. [Google Scholar] [CrossRef]
  39. Gunay, C.J.; Hashimoto, Y.; Yokoyama, K.; Sakai, H.; Koizumi, A.; Sakai, K.; Kuroki, N. Estimation of erodibility coefficients based on geophysical forest properties in Ogouchi Dam watershed. J. Jpn. Soc. Civ. Eng. Ser. G (Environ. Res.) 2021, 77, I_61–I_68. [Google Scholar] [CrossRef]
  40. James, S.E.; Pärtel, M.; Wilson, S.D.; Peltzer, D.A. temporal heterogeneity of soil moisture in grassland and forest. J. Ecol. 2003, 91, 234–239. [Google Scholar] [CrossRef]
  41. Su, X.; Wang, M.; Huang, Z.; Fu, S.; Chen, H.Y.H. Forest understorey vegetation: Colonization and the availability and heterogeneity of resources. Forests 2019, 10, 944. [Google Scholar] [CrossRef] [Green Version]
  42. Ohnuki, Y.; Nik, A.R.; Noguchi, S.; Sasaki, S. Sediment discharge through buffer zones in a tropical rainforest of Peninsular Malaysia. Jpn. Agric. Res. Q. 2010, 44, 187–196. [Google Scholar] [CrossRef] [Green Version]
  43. López-Vicente, M.; Kramer, H.; Keesstra, S. Effectiveness of soil erosion barriers to reduce sediment connectivity at small basin scale in a fire-affected forest. J. Environ. Manag. 2021, 278, 111510. [Google Scholar] [CrossRef] [PubMed]
  44. Gunay, C.J.; Duka, M.; Yokoyama, K.; Sakai, H.; Koizumi, A.; Sakai, K.; Kuroki, N. Half-century analysis of climate trends and soil water storage in a steep forested catchment in Kanto metropolitan area. J. Jpn. Soc. Civ. Eng. Ser. B1 (Hydraul. Eng.) 2021, 77, I_487–I_492. [Google Scholar] [CrossRef] [PubMed]
  45. Sugawara, M. Automatic calibration of the tank model. Hydrol. Sci. Bull. 1979, 24, 375–388. [Google Scholar] [CrossRef] [Green Version]
  46. Castillo, V.M.; Gómez-Plaza, A.; Martínez-Mena, M. The role of antecedent soil water content in the runoff response of semiarid catchments: A simulation approach. J. Hydrol. 2003, 284, 114–130. [Google Scholar] [CrossRef]
  47. Seeger, M.; Errea, M.P.; Beguería, S.; Arnáez, J.; Martí, C.; García-Ruiz, J.M. Catchment soil moisture and rainfall characteristics as determinant factors for discharge/suspended sediment hysteretic loops in a small headwater catchment in the Spanish pyrenees. J. Hydrol. 2004, 288, 299–311. [Google Scholar] [CrossRef] [Green Version]
  48. Arnold, J.G.; Srinivasan, R.; Muttiah, R.S.; Williams, J.R. Large area hydrologic modeling and assessment Part I: Model development. 1998, 34, 73–89.
  49. Jiang, R.; Li, Y.; Wang, Q.; Kuramochi, K.; Hayakawa, A.; Woli, K.P.; Hatano, R. Modeling the water balance processes for understanding the components of river discharge in a non-conservative watershed. Trans. ASABE 2011, 54, 2171–2180. [Google Scholar] [CrossRef]
  50. Zhang, D.; Lin, Q.; Chen, X.; Chai, T. Improved curve number estimation in SWAT by reflecting the effect of rainfall intensity on runoff generation. Water 2019, 11, 163. [Google Scholar] [CrossRef] [Green Version]
  51. Moriasi, D.N.; Arnold, J.G.; Van Liew, M.W.; Bingner, R.L.; Harmel, R.D.; Veith, T.L. Model evaluation guidelines for systematic quantification of accuracy in watershed simulations. Trans. ASABE 2007, 50, 885–900. [Google Scholar] [CrossRef]
  52. Eckhardt, K. How to construct recursive digital filters for baseflow separation. Hydrol. Process. 2005, 19, 507–515. [Google Scholar] [CrossRef]
  53. Bosch, D.D.; Arnold, J.G.; Allen, P.G.; Lim, K.J.; Park, Y.S. Temporal variations in baseflow for the Little River experimental watershed in South Georgia, USA. J. Hydrol. Reg. Stud. 2017, 10, 110–121. [Google Scholar] [CrossRef]
  54. Goel, M.K. Runoff coefficient. In Encyclopedia of Snow, Ice and Glaciers, Encyc; Singh, V.P., Singh, P., Haritashya, U.K., Eds.; Springer: Berlin/Heidelberg, Germany, 2011. [Google Scholar]
  55. Luo, Y.; Arnold, J.; Allen, P.; Chen, X. Baseflow simulation using SWAT model in an inland river basin in Tianshan Mountains, Northwest China. Hydrol. Earth Syst. Sci. 2012, 16, 1259–1267. [Google Scholar] [CrossRef] [Green Version]
  56. Chang, Z.; Ye, X.; Zhang, J. Soil water infiltration of subalpine shrub forest in Qilian Mountains, northwest of China. Agron. J. 2021, 113, 829–839. [Google Scholar] [CrossRef]
  57. Schwartz, R.C.; Schlegel, A.J.; Bell, J.M.; Baumhardt, R.L.; Evett, S.R. Contrasting tillage effects on stored soil water, infiltration and evapotranspiration fluxes in a dryland rotation at two locations. Soil Tillage Res. 2019, 190, 157–174. [Google Scholar] [CrossRef]
  58. Picchio, R.; Mederski, P.S.; Tavankar, F. How and How much, Do harvesting activities affect forest soil, regeneration and stands? Curr. For. Rep. 2020, 6, 115–128. [Google Scholar] [CrossRef] [Green Version]
  59. Cui, Z.; Huang, Z.; Luo, J.; Qiu, K.; López-Vicente, M.; Wu, G.L. Litter cover breaks soil water repellency of biocrusts, enhancing initial soil water infiltration and content in a semi-arid sandy land. Agric. Water Manag. 2021, 255, 107009. [Google Scholar] [CrossRef]
  60. Zemke, J.J.; Enderling, M.; Klein, A.; Skubski, M. The influence of soil compaction on runoff formation. A case study focusing on skid trails at forested andosol sites. Geosci. 2019, 9, 204. [Google Scholar] [CrossRef] [Green Version]
  61. Miura, S.; Hirai, K.; Yamada, T. Transport rates of surface materials on steep forested slopes induced by raindrop splash erosion. J. For. Res. 2002, 7, 201–211. [Google Scholar] [CrossRef]
  62. Yuan, Y.; Nie, W.; Mccutcheon, S.C.; Taguas, E.V. Initial abstraction and curve numbers for semiarid watersheds in Southeastern Arizona. Hydrol. Process. 2014, 28, 774–783. [Google Scholar] [CrossRef]
  63. Lim, K.J.; Engel, B.A.; Muthukrishnan, S.; Harbor, J. Effects of initial abstraction and urbanization on estimated runoff using CN technology. J. Am. Water Resour. Assoc. 2006, 42, 629–643. [Google Scholar] [CrossRef]
  64. Woodward, D.E.; Hawkins, R.H.; Jiang, R.; Hjelmfelt, A.T.; Van Mullem, J.A.; Quan, Q.D. Runoff curve number method: Examination of the initial abstraction ratio. World Water Environ. Resour. Congr. 2003, 40685, 691–700. [Google Scholar] [CrossRef] [Green Version]
  65. Gunay, C.J.; Nakagawa, C.; Yokoyama, K.; Sakai, H.; Koizumi, A.; Iwasaki, H.; Chiba, T. Changes in soil hydrological condition of Ogouchi Dam catchment from SWAT monthly discharge analysis for 57 years. In Proceedings of Japan Water Works Association; Japan Water Works Association: Tokyo, Japan, 2020; Volume 2020, pp. 762–763. [Google Scholar] [CrossRef]
  66. Gunay, C.J.C.; Nakagawa, C.; Yokoyama, K. Analyzing long-term changes in water discharge and soil condition of Ogouchi Reservoir catchment. In Proceedings of the 22nd Congress of the International Association for Hydro-Environment Engineering and Research-Asia Pacific Division (IAHR-APD 2020), Sapporo, Japan, 14–17 September 2020. [Google Scholar]
  67. Bergeson, C.B.; Martin, K.L.; Doll, B.; Cutts, B.B. Soil infiltration rates are underestimated by models in an urban watershed in central North Carolina, USA. J. Environ. Manag. 2022, 313, 115004. [Google Scholar] [CrossRef] [PubMed]
Figure 1. Digital elevation model (DEM) and locations of river gauging and weather stations in the Ogouchi Dam watershed in Japan.
Water 15 00054 g001
Figure 2. Hydrograph of daily discharge and baseflow during the wet season (May–October) in year 2015.
Water 15 00054 g002
Figure 3. Geographical inputs in SWAT: (a) 2013 land-cover map and (b) 2019 soil map.
Water 15 00054 g003
Figure 4. Observed and calculated amounts of flow during the wet season (May–October) in year 2015 from using tank model.
Water 15 00054 g004
Figure 5. Annual time series of discharge ratio from 1965 to 2015 in the Ogouchi Dam watershed.
Water 15 00054 g005
Figure 6. Rainfall–runoff correlation plots in each decade: (a) 1965–1974, (b) 1975–1984, (c) 1985–1994, (d) 1995–2004, and (e) 2005–2015.
Water 15 00054 g006
Figure 7. Monthly total streamflow hydrographs of the initial calculation in each decade: (a) 1965–1974, (b) 1975–1984, (c) 1985–1994, (d) 1995–2004, and (e) 2005–2015.
Water 15 00054 g007
Figure 8. Decadal changes in soil water storage capacity at (a) weaker (R < 70 mm) and (b) stronger (R > 70 mm) continuous-rainfall events.
Water 15 00054 g008
Figure 9. Monthly total and subsurface flow hydrographs from 1979 to 1981 at varying Cn2 factors: (a) 0.5, (b) 1.0, and (c) 1.5.
Water 15 00054 g009
Figure 10. Decadal changes in soil available water capacity (Sol_Awc) factor based on (a) NSE, (b) RMSE (RSR), (c) MAE, (d) PBIAS, (e) R2, and (f) overall ranking scheme; Sol_Awc factor of 100% indicates the originally SWAT-assigned Sol_Awc value, which ranges from 0.16 to 0.21 mm water/mm soil.
Water 15 00054 g010
Table 1. Performance ratings for recommended statistical indices for evaluating monthly discharge simulations in SWAT.
Performance RatingsRSR *NSEPBIAS
Very good0.00 ≤ RSR ≤ 0.500.75 < NSE ≤ 1.00PBIAS < ±10
Good0.50 < RSR ≤ 0.600.65 < NSE ≤ 0.75±10 ≤ PBIAS < ±15
Satisfactory0.60 < RSR ≤ 0.700.50 < NSE ≤ 0.65±15 ≤ PBIAS < ±25
UnsatisfactoryRSR > 0.70NSE ≤ 0.50PBIAS ≥ ±25
Notes: * RSR standardizes RMSE using the standard deviation of observed data.
Table 2. Model performance of the initial streamflow calculation using default parameters.
Decade (Inclusive Years)NSERMSE (RSR)MAEPBIASR2Rating
A (1965–1974)0.551140.6292 (0.6700)30.7408+11.29220.7884Good
B (1975–1984)0.781232.8114 (0.4678)25.1448+10.61910.9074Very Good
C (1985–1994)0.554648.5011 (0.6674)35.2636+13.70740.7765Satisfactory
D (1995–2004)0.717136.5458 (0.5319)28.6352+12.67530.8416Good
E (2005–2015)0.670537.9704 (0.5741)32.7002+17.62040.8762Good
Table 3. Sample of the scoring scheme that ranks the Sol_Awc factors (case of decade B).
Sol_Awc FactorNSE
(Score)
RMSE (RSR)
(Score)
MAE
(Score)
PBIAS
(Score)
R2
(Score)
Overall Score
0.500.7677
(1)
33.8019 (0.4819)
(1)
25.8466
(4)
+9.3387
(5)
0.9072
(1)
12
0.750.7698
(4)
33.6532 (0.4798)
(4)
26.3091
(3)
+12.7516
(3)
0.9092
(3)
17
1.000.7812
(5)
32.8114 (0.4678)
(5)
25.1448
(5)
+10.6191
(4)
0.9074
(2)
21
1.250.7694
(3)
33.6818 (0.4802)
(3)
27.1401
(2)
+16.8144
(2)
0.9121
(4)
14
1.500.7692
(2)
33.6963 (0.4804)
(2)
27.4067
(1)
+18.1169
(1)
0.9130
(5)
11
Disclaimer/Publisher’s Note: The statements, opinions and data contained in all publications are solely those of the individual author(s) and contributor(s) and not of MDPI and/or the editor(s). MDPI and/or the editor(s) disclaim responsibility for any injury to people or property resulting from any ideas, methods, instructions or products referred to in the content.

