Article

Spatial and Temporal Pattern of Rainstorms Based on Manifold Learning Algorithm

1
State Key Laboratory of Simulation and Regulation of Water Cycle in River Basin, China Institute of Water Resources and Hydropower Research, Beijing 100038, China
2
Key Laboratory of Digital Twin Watershed, Ministry of Water Resources, Beijing 100038, China
3
Beijing General Hydrology Station, Beijing 100089, China
4
Shenzhen National Climate Observatory, Shenzhen 518040, China
*
Author to whom correspondence should be addressed.
Water 2023, 15(1), 37; https://doi.org/10.3390/w15010037
Submission received: 21 October 2022 / Revised: 6 December 2022 / Accepted: 20 December 2022 / Published: 22 December 2022

Abstract

:
Identifying the patterns of rainstorms is essential for improving the precision and accuracy of flood forecasts and constructing flood disaster prevention systems. In this study, we used a manifold learning algorithm method of machine learning to analyze rainstorm patterns. We analyzed the spatial–temporal characteristics of heavy rain in Beijing and Shenzhen. The results showed a strong correlation between the spatial–temporal pattern of rainstorms and underlying topography in Beijing. However, in Shenzhen, the spatial–temporal distribution characteristics of rainstorms were more closely related to the source of water vapor causing the rainfall, and the variation in characteristics was more complex and diverse. This method may be used to quantitatively describe the development and dynamic spatial–temporal patterns of rainfall. In this study, we found that spatial–temporal rainfall distribution characteristics, extracted by machine learning technology could be explained by physical mechanisms consistent with the climatic characteristics and topographic conditions of the region.

1. Introduction

Highly concentrated rainfall and large precipitation events may cause urban floods, mountain torrents, mud–rock flows, landslides, and other disasters, resulting in substantial economic losses and casualties [1,2]. The temporal and spatial distribution of hourly heavy precipitation has a good correspondence with flood disaster data. The intensity and spatial–temporal distribution of rainstorms show a clear correlation with geological disasters caused by flooding [3,4,5]. The movement direction of the rainfall center directly impacts the shape of the flood hydrograph and the change in flood peak discharge [6]. Under conditions with the same average rainfall and intensity, rainfall patterns with a rain peak in the middle or rear are more than 30% larger than flood peaks with uniform rain patterns [7,8]. A thorough understanding of the temporal and spatial variation in rainstorm patterns is essential for improving the accuracy of flood forecasting and building a flood disaster prevention system [9,10]. Previous research has contributed to advancements in the study of the spatial–temporal distribution of rainfall.
Some scholars have studied the temporal and spatial distribution of precipitation by using multiple analysis methods, combining rainfall data of different scales. Fung et al. [11] used inverse distance weighting (IDW) and ordinary kriging (OK), geographical weighted regression (GWR) and multi-scale geographical weighted regression (MGWR) to investigate spatiotemporal modeling of rainfall distribution in Peninsular Malaysia. Hitchens et al. [12] study the climatology of heavy rain events using two high-resolution precipitation datasets that incorporate both gauge observations and radar estimates. Satya et al. [13] analyzed Tropical Rainfall Measuring Mission (TRMM) data with grid spatial resolution of 0.25° × 0.25° to obtain information about the characteristics of rainfall in South Sumatra. Ndiaye et al. [14] analyzes the spatio-temporal distribution of daily rainfall data from 13 stations in the country of Senegal located in the Northwest of Africa. Chaubey, P.K. et al. [15] examined the trend in extreme rainfall events using long-term observed high-resolution gridded rainfall data (1901–2019). Audu, M.O. et al. [16] analyzed the spatial distribution and temporal trends of precipitation and its extremes over Nigeria from 1979–2013 using climate indices in order to assess climatic extremes in the country. Yeung et al. [17] simulated rainfall in the New York area of the United States using meteorological station, radar, satellite, and other observation methods combined with a mesoscale meteorological model. Viglione et al. [18] quantified the temporal and spatial distribution of rainfall. Zoccatelli et al. [19] proposed an index system based on quantitative descriptions of the temporal and spatial distribution of rainfall. Wu et al. [20] analyzed the axially symmetrical precipitation characteristics of landfall typhoons in East China using radar data and historical precipitation data from ground stations. Ngongondo et al. [21] studied the spatial and temporal characteristics of rainfall in Malawi between 1960 and 2006.
These research results are of great significance for understanding the characteristics of rainstorms in various regions. However, static indicators, such as the total amount of rainstorm and distribution of rainfall in various regions, cannot describe characteristics of rainfall changes in time and space well. Understanding dynamic characteristics, such as moving path, range of rainstorm center, is important to predict rainstorm development process, forecast the flood risk area in advance and to effectively preventing the flood and geological disasters caused by rainstorms.
In recent decades, major advancements have been made in artificial intelligence (AI) technology [22]. AI has been applied in multiple areas, including the early identification of disaster risks and water resource management [23,24,25]. Furthermore, neural network models have been widely used in many fields [26,27]. A cluster-based Bayesian network has been used to predict the longitudinal dispersion coefficient in natural rivers [28], and a deep learning method has been used for spatio-temporal flood prediction [29]. In terms of urban flood management, the integration of AI and numerical simulation models has enabled the rapid prediction of urban floods [30]. In hydrology, machine learning technology and hydrological models have been combined to construct coupled simulations for watershed runoff and sediment [31]. Manifold learning algorithms are practical data processing methods in AI technology that play major roles in high-dimensional array reduction and transfer learning.
This study presents a novel application of these machine learning algorithms in the analysis of spatial–temporal distribution characteristics of rainstorms. We examined the spatial–temporal distribution characteristics of rainfall in Beijing and Shenzhen.

2. Materials and Methods

Beijing is located in the inland region of North China and is surrounded by mountains on three sides—in the west, north, and northeast. The annual distribution of precipitation varies seasonally. Rainfall during the flood season (from June to September) accounts for approximately 85% of the total annual precipitation. Heavy rain often occurs in late July and early August and is likely to cause flood disasters. Shenzhen is located in the coastal area of South China. The distribution of rainfall here varies, both seasonally and geographically, throughout the year. Rainfall during the flood season (April to September) accounts for 86% of the total annual rainfall. The uneven spatial and temporal distribution of rainfall contributes to alternating droughts and floods [32,33]. This study evaluated 5 min rainfall data from 122 automatic weather stations in Beijing from 1999 to 2020 and 63 automatic weather stations in Shenzhen from 2008 to 2021. We analyzed and extracted the spatial–temporal rainfall distribution data for the two regions. The locations of the stations are shown in Figure 1.
In this study, 5 min rainfall measurements were used as samples, although many factors affected the accuracy of them, such as the wind conditions at the measurement site, which can be challenging during tropical rainfall. There are unreasonable values in the 5 min rainfall measurement data [34,35]. So, prior to analysis, the historical rainfall data were cleaned and screened to eliminate inaccurate data. The cleaning standards were as follows:
  • If the rainfall at a single station exceeded 10 mm in 5 min and existed in isolation, and there was no rainfall at the same station 30 min before and after the observation, it was considered an unreasonable record;
  • If the rainfall at a single station exceeded 10 mm in 5 min, but the observed data of other rain-measuring stations within a range of 5 × 5 km of the station was 0, it was considered an unreasonable record;
  • In the case of unreasonable records from a single station, the data were compared to the rainfall isosurface map of the period. If the data from the station were confirmed to be unreasonable, the interpolation results of surrounding stations within a range of 5 × 5 km were used to replace the unreasonable records of that station.
After cleaning, the data were divided into rainfall events to select samples for further analysis. The screening criteria were as follows:
  • Rainfall events were first identified. If the 5 min rainfall at all the stations was less than 0.1 mm over four consecutive hours, it was not considered effective rainfall. Two independent rainfall events were eliminated according to this standard.
  • Rainstorm samples were screened according to the yellow rainstorm warning standards of Beijing and Shenzhen. Rainstorm events were selected for further analysis.
According to the above criteria, we synthesized the historical rainfall data from Beijing and Shenzhen and categorized the rainstorm events based on duration (12 h, 24 h, and 72 h) in preparation for further analysis.

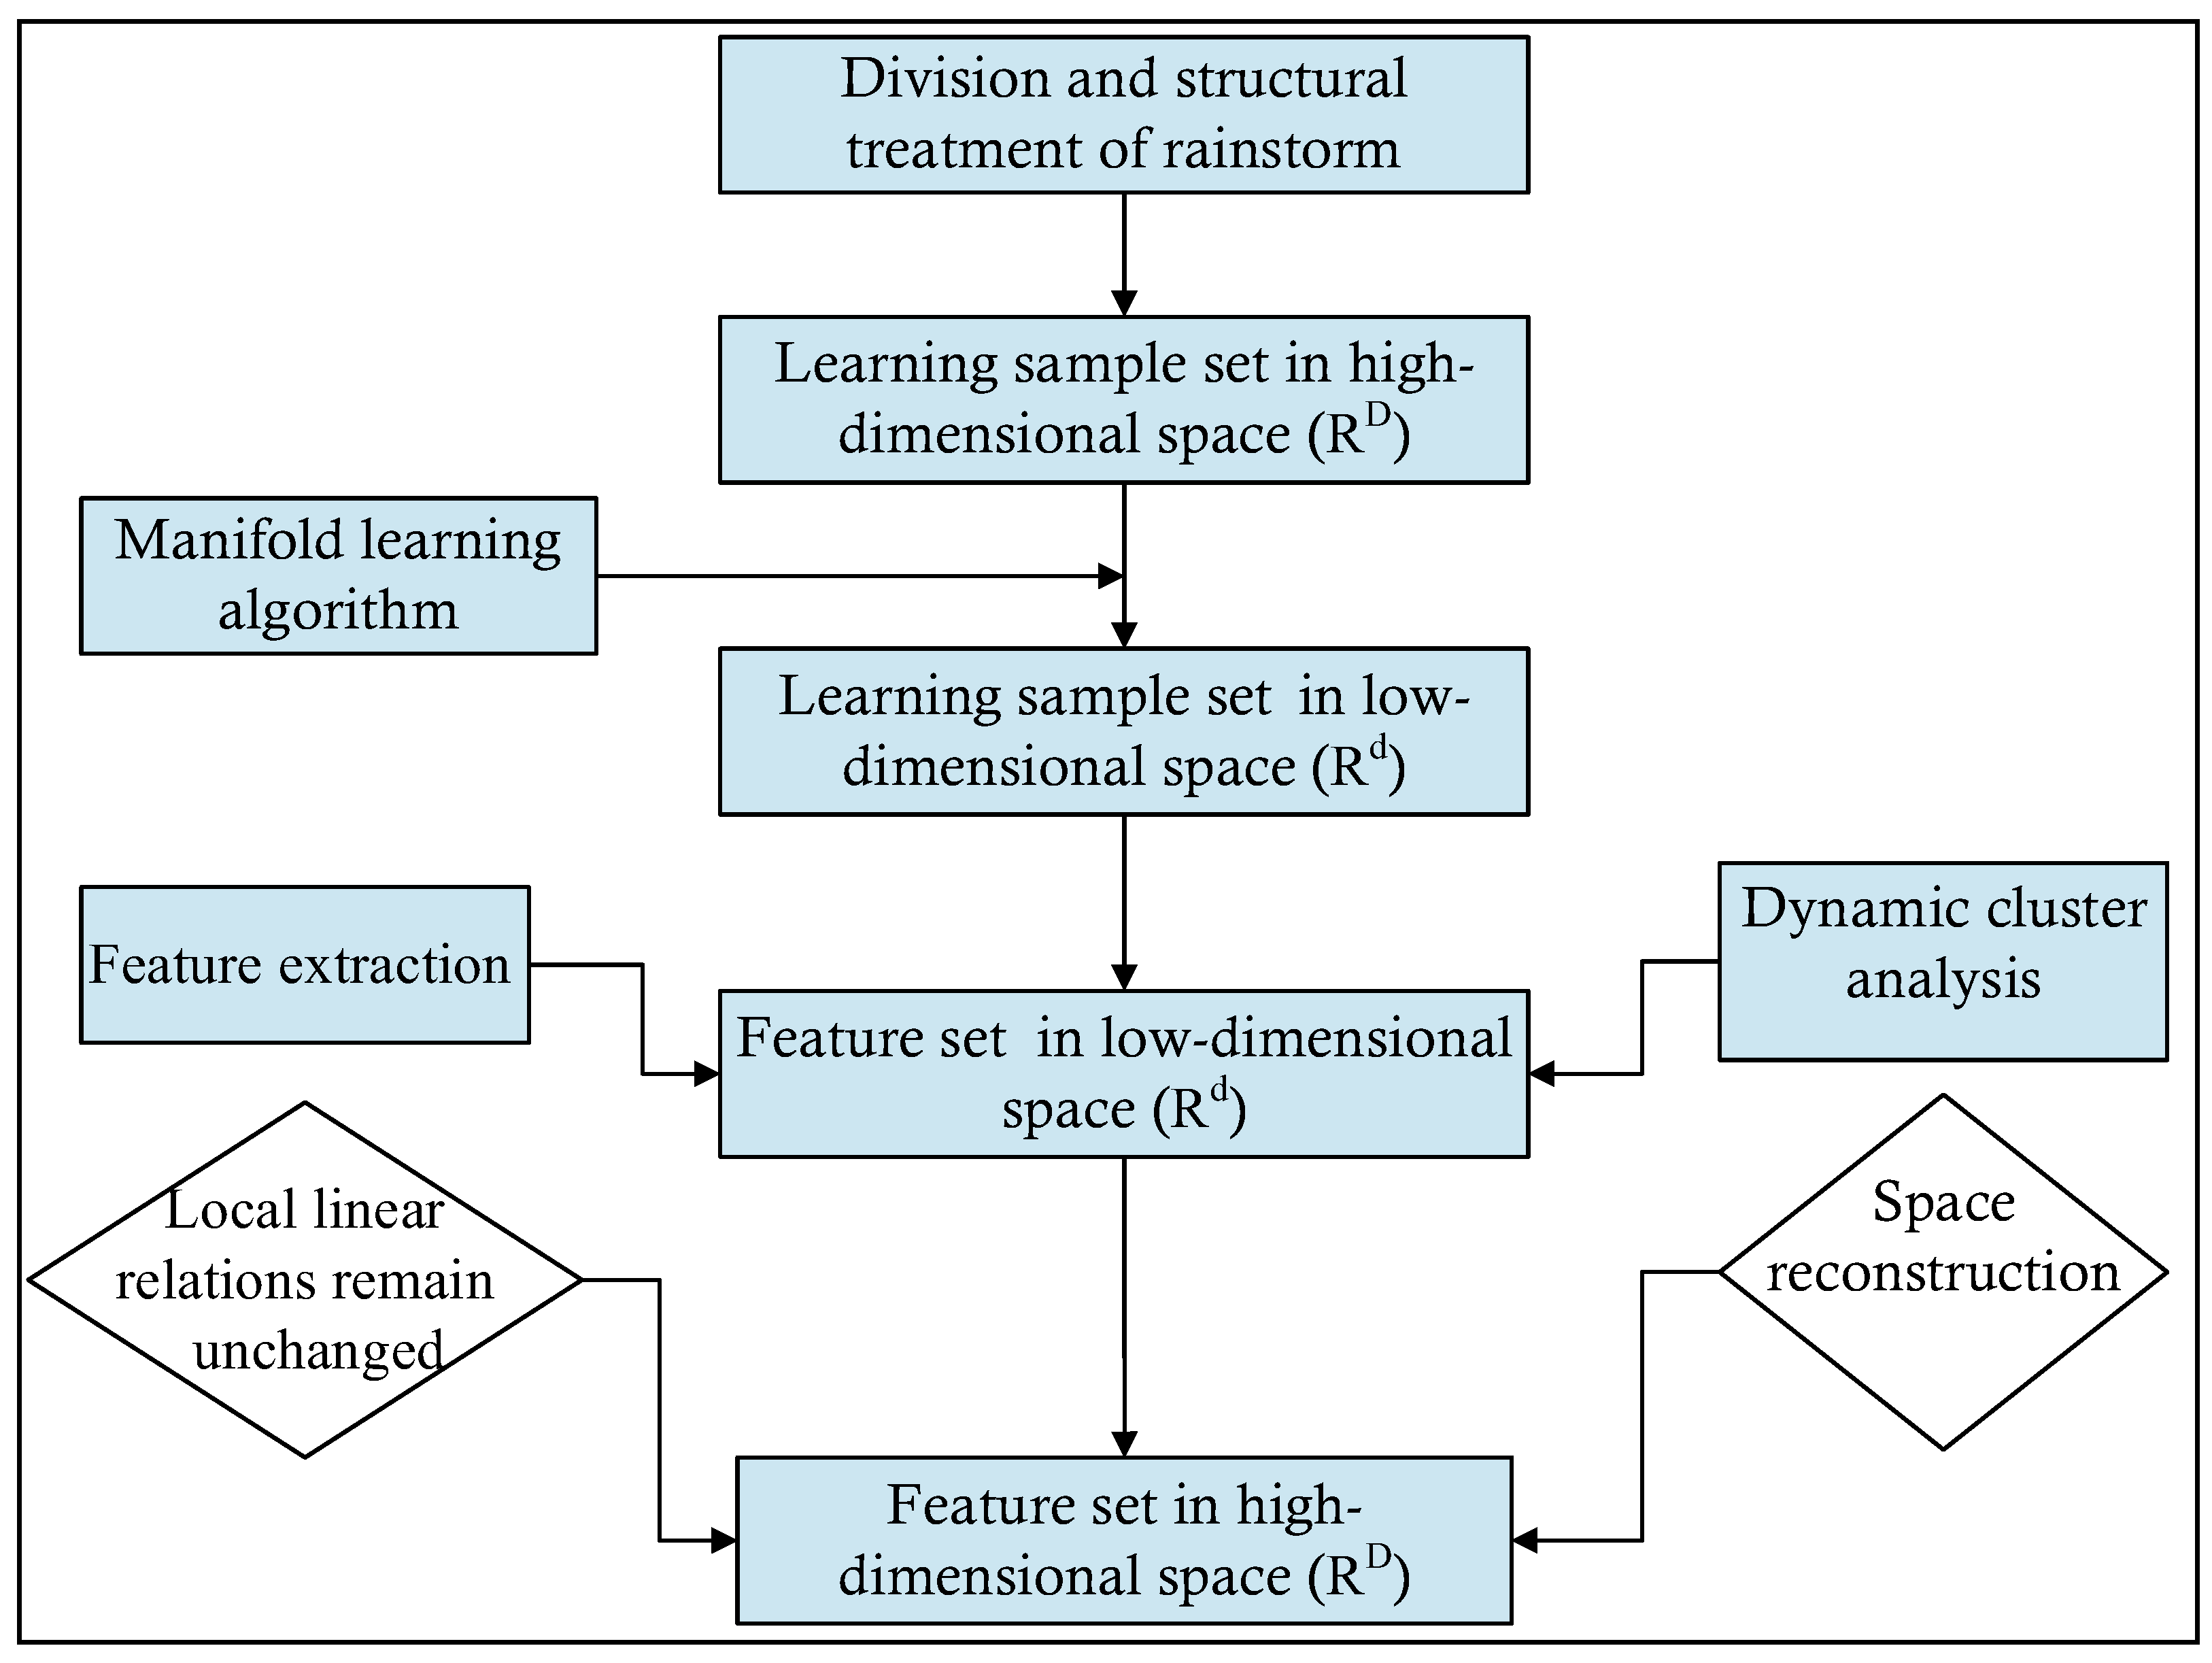
2.1. Methods and Procedures

In this study, rainstorms were divided into discrete events, and a high-dimensional matrix was constructed to describe the spatial–temporal characteristics of rainfall. The spatial–temporal dynamic development characteristics of multiple rainfall events were described as shown in Equations (1)–(3):
Ω = { X 1 , X 2 , X N }
X i = [ H 11 H 21 H s 1 H 12 H 22 H s 2 H 1 m H 2 m H s m ] ,
where Ω is the historical rainstorm samples set, including N rainstorm fields, X i is the proportion matrix for the i t h rainfall event, and H i t is the percentage of the rainfall at the i t h rainfall station to the total rainfall at all the stations in the time   t   during the i t h rainfall event, i.e.,
H i t = R i t k = 1 s R k t
where R i t is the rainfall at time   t   of rain measuring station i , i = 1   , 2   , 3     S , t = 1 ,   2 ,   3     m ,   S   is the number of rain-measuring stations, and m is the number of time periods.
Subsequently, a manifold learning algorithm was used to process the rainfall data. Furthermore, the high-dimensional array of rainfall was projected to the low-dimensional space to achieve a dimensionality reduction. Clustering and feature extraction were then performed to obtain the spatial–temporal distribution in the low-dimensional space. Following feature selection and extraction, the information required for our research was extracted.
The manifold learning algorithm applied in this study is based on the consideration that the local linear relationship between the high-dimensional and the low-dimensional spaces remains unchanged. That is to say, the array features in the high-dimensional space remain constant in the low-dimensional space. Accordingly, feature reconstruction in the high-dimensional space was conducted based on the features in the low-dimensional space. This method facilitates the extraction of the spatial–temporal distribution features of rainfall in the high-dimensional space. The specific process is shown in Figure 2.

2.2. Manifold Learning Algorithm

The high-dimensional sample database, describing the spatial–temporal distribution characteristics of rainstorms, is a nonlinear and high-dimensional data space. In this study, the locally linear embedding (LLE) algorithm was used to improve the efficiency of analysis and the accuracy of results [36]. This method is used for dimensionality reductions of nonlinear data and conducting dimensionality reduction analysis for high-dimensional data. The main features of the original data were extracted and expressed using the “effective” feature data with fewer dimensions, without reducing the intrinsic information contained in the original data.
The LLE algorithm is an unsupervised dimensionality reduction method for nonlinear data proposed by Roweis et al. [37]. It is a type of manifold learning algorithm that uses partial linearity to reflect the whole nonlinearity. This feature enables the dimensionality reduction data to maintain the original data topology. According to the LLE algorithm, each data point can be constructed using a linear-weighted combination of its neighboring points. The linear relation between x i and its surrounding samples in the high-dimensional space is the same as the partial linear relation between y i and its surrounding samples in the low-dimensional space. Therefore, the linear relationship between all samples and the classification results in the low-dimensional space d are similar to those in the high-dimensional space. The algorithm comprises three main parts:
(1) In higher dimensional space, find the K samples closest to sample x i by Euclidean distance measurement.
First, the Euclidean distance between each sample point x i and all other samples is calculated for N data points { x 1 , x 2 , x N } R D . Each x i can be linearly expressed by K samples { x i 1 , x i 2 , x i k } in its neighborhood with the nearest distance, as shown in Equation (4):
x i x ¯ i = j = 1 k w i j x j
meets the condition:
j = 1 k w i j = 1
(2) For each sample x i , the linear relationship of K nearest neighbors in its neighborhood is first determined, and the weight coefficient of the linear relationship is obtained as follows:
The LLE algorithm is used to obtain the weight coefficient   W   by solving the minimum value of Equation (4) in the constraint condition Equation (5).
W i = Z i 1 I I T Z i 1 I
Subsequently, weights W i = ( w i 1 , w i 2 , w i k ) T ( i = 1 , 2 , , N ) are obtained.
(3) It is assumed that the linear relation weight coefficient W i remains in high-dimensional and low-dimensional space within the K neighborhood. The weight coefficient W i is then used to reconstruct sample data in low dimensions and obtain x i R D y i R d , d D .
The LLE algorithm assumes that samples in high-dimensional space maintain local linear relationships in low-dimensional space, and that the weight coefficient remains unchanged.
Samples in high-dimensional space { x 1 , x 2 , x N } R D   W are mapped to a low-dimensional space by weight coefficient and become samples in low-dimensional space, { y 1 , y 2 , y N } R d . High-dimensional sample point x i , mapping   y i in low-dimensional space, can also be obtained by solving the minimum mean-square deviation.
As the detailed solution process of this algorithm was not the focus of this study, it has not been described in detail.

2.3. Dynamic Cluster Analysis and Feature Extraction

After the high-dimensional samples were dimensionally reduced by the LLE algorithm, the dynamic clustering algorithm was used to classify the dimension-reduced samples [38]. Using this algorithm, the population sample set was divided into r subsets, where the samples in each subset were the most similar and the samples between each subset were the most different. The mean value of each subset was then extracted to obtain the features of the subset. In the analysis, r sample points were randomly selected as the initial clustering center of r subsets. The distance between all samples and initial clustering centers r, were calculated, and the samples were divided into the subset of the center nearest to them to obtain the number of initial classification categories and initial subsets. We calculated the mean value of all samples of each subset to obtain the new generation cluster center. We continuously iterated the values according to the above method. When the distance between the clustering centers of generation p and generation p + 1 was within the threshold range, the calculation was considered to be convergent, and the final subset and the clustering centers of each subset were obtained.
Each subset C = { C 1 , C 2 , , C r } and the mean Z j p + 1 of each subset obtained by the above clustering method were the feature spaces of the reduced dimension dataset. However, sample x i in a higher dimensional space had the same partial linear relationship with its surrounding samples as a mapping point y i in a lower dimensional space. The samples in the subsets C = { C 1 , C 2 , , C r } in the lower dimensional space belonged to the same subset B = { B 1 , B 2 , , B r } in the higher dimensional space. The mean value S j = 1 B j x i B j x i ϵ R D of all subsets in the high-dimensional space was obtained, which also belonged to the dynamic spatial–temporal distribution characteristics of the samples in the high-dimensional space.

3. Results and Discussion
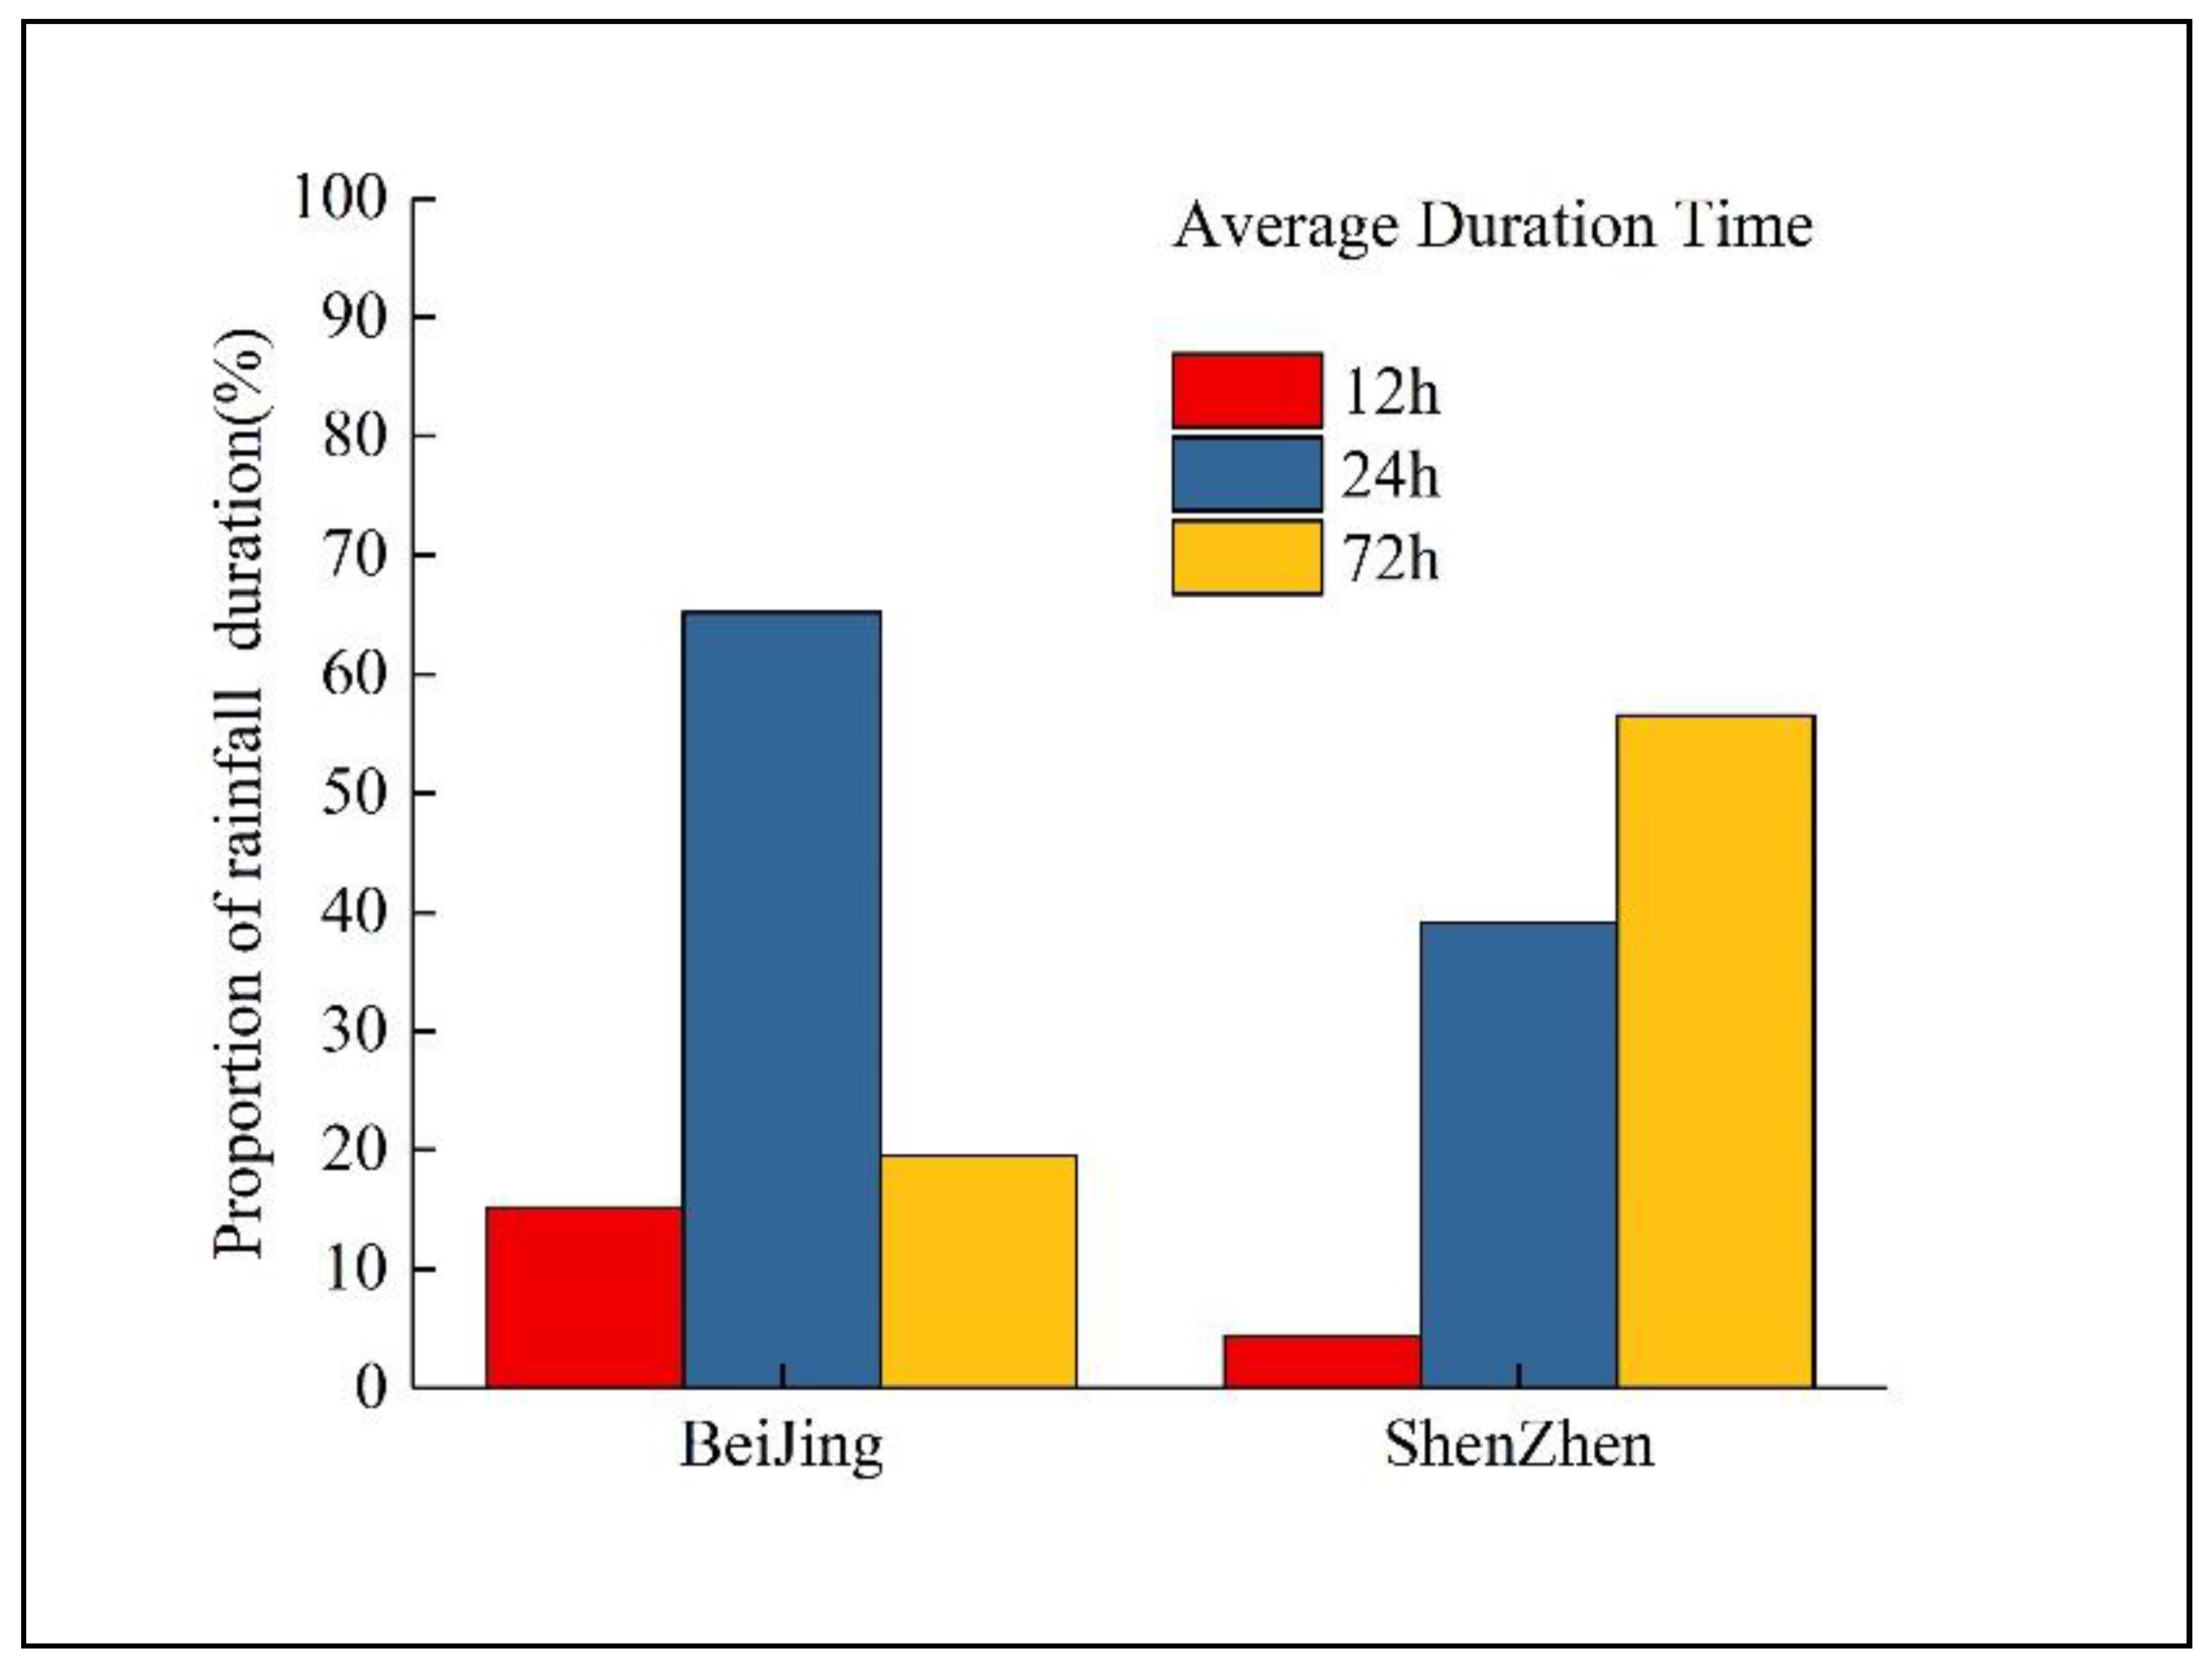
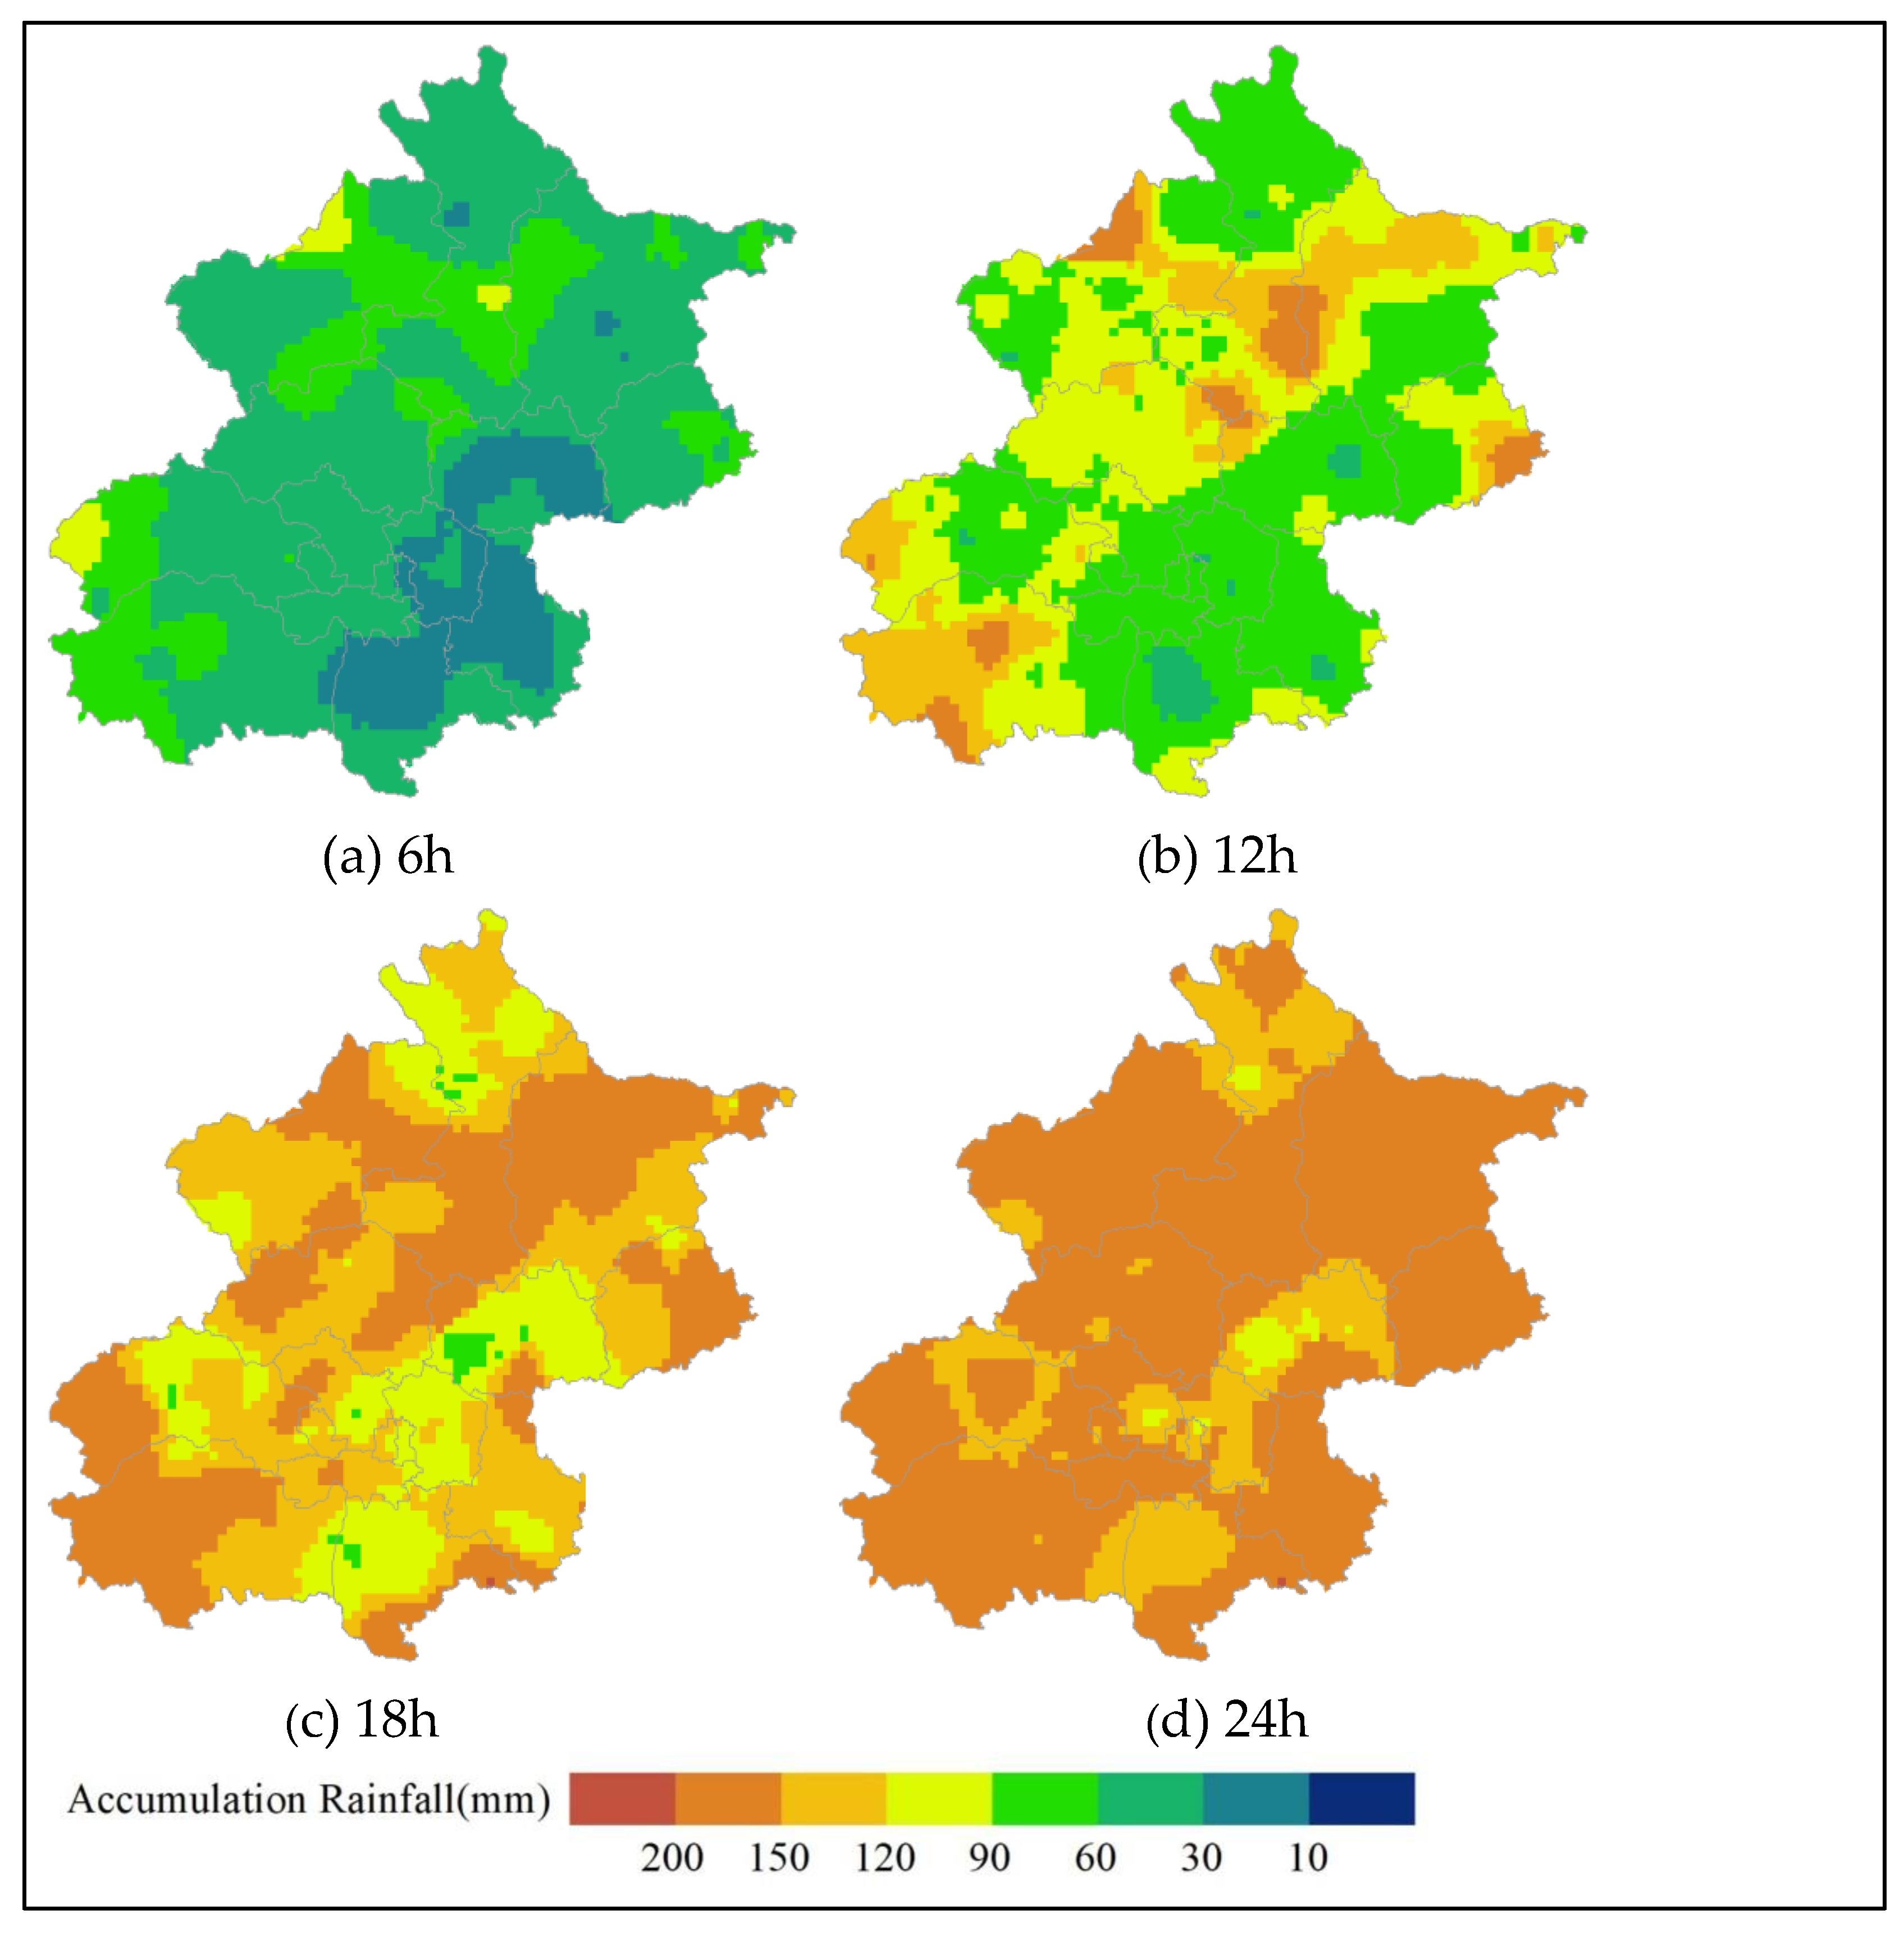
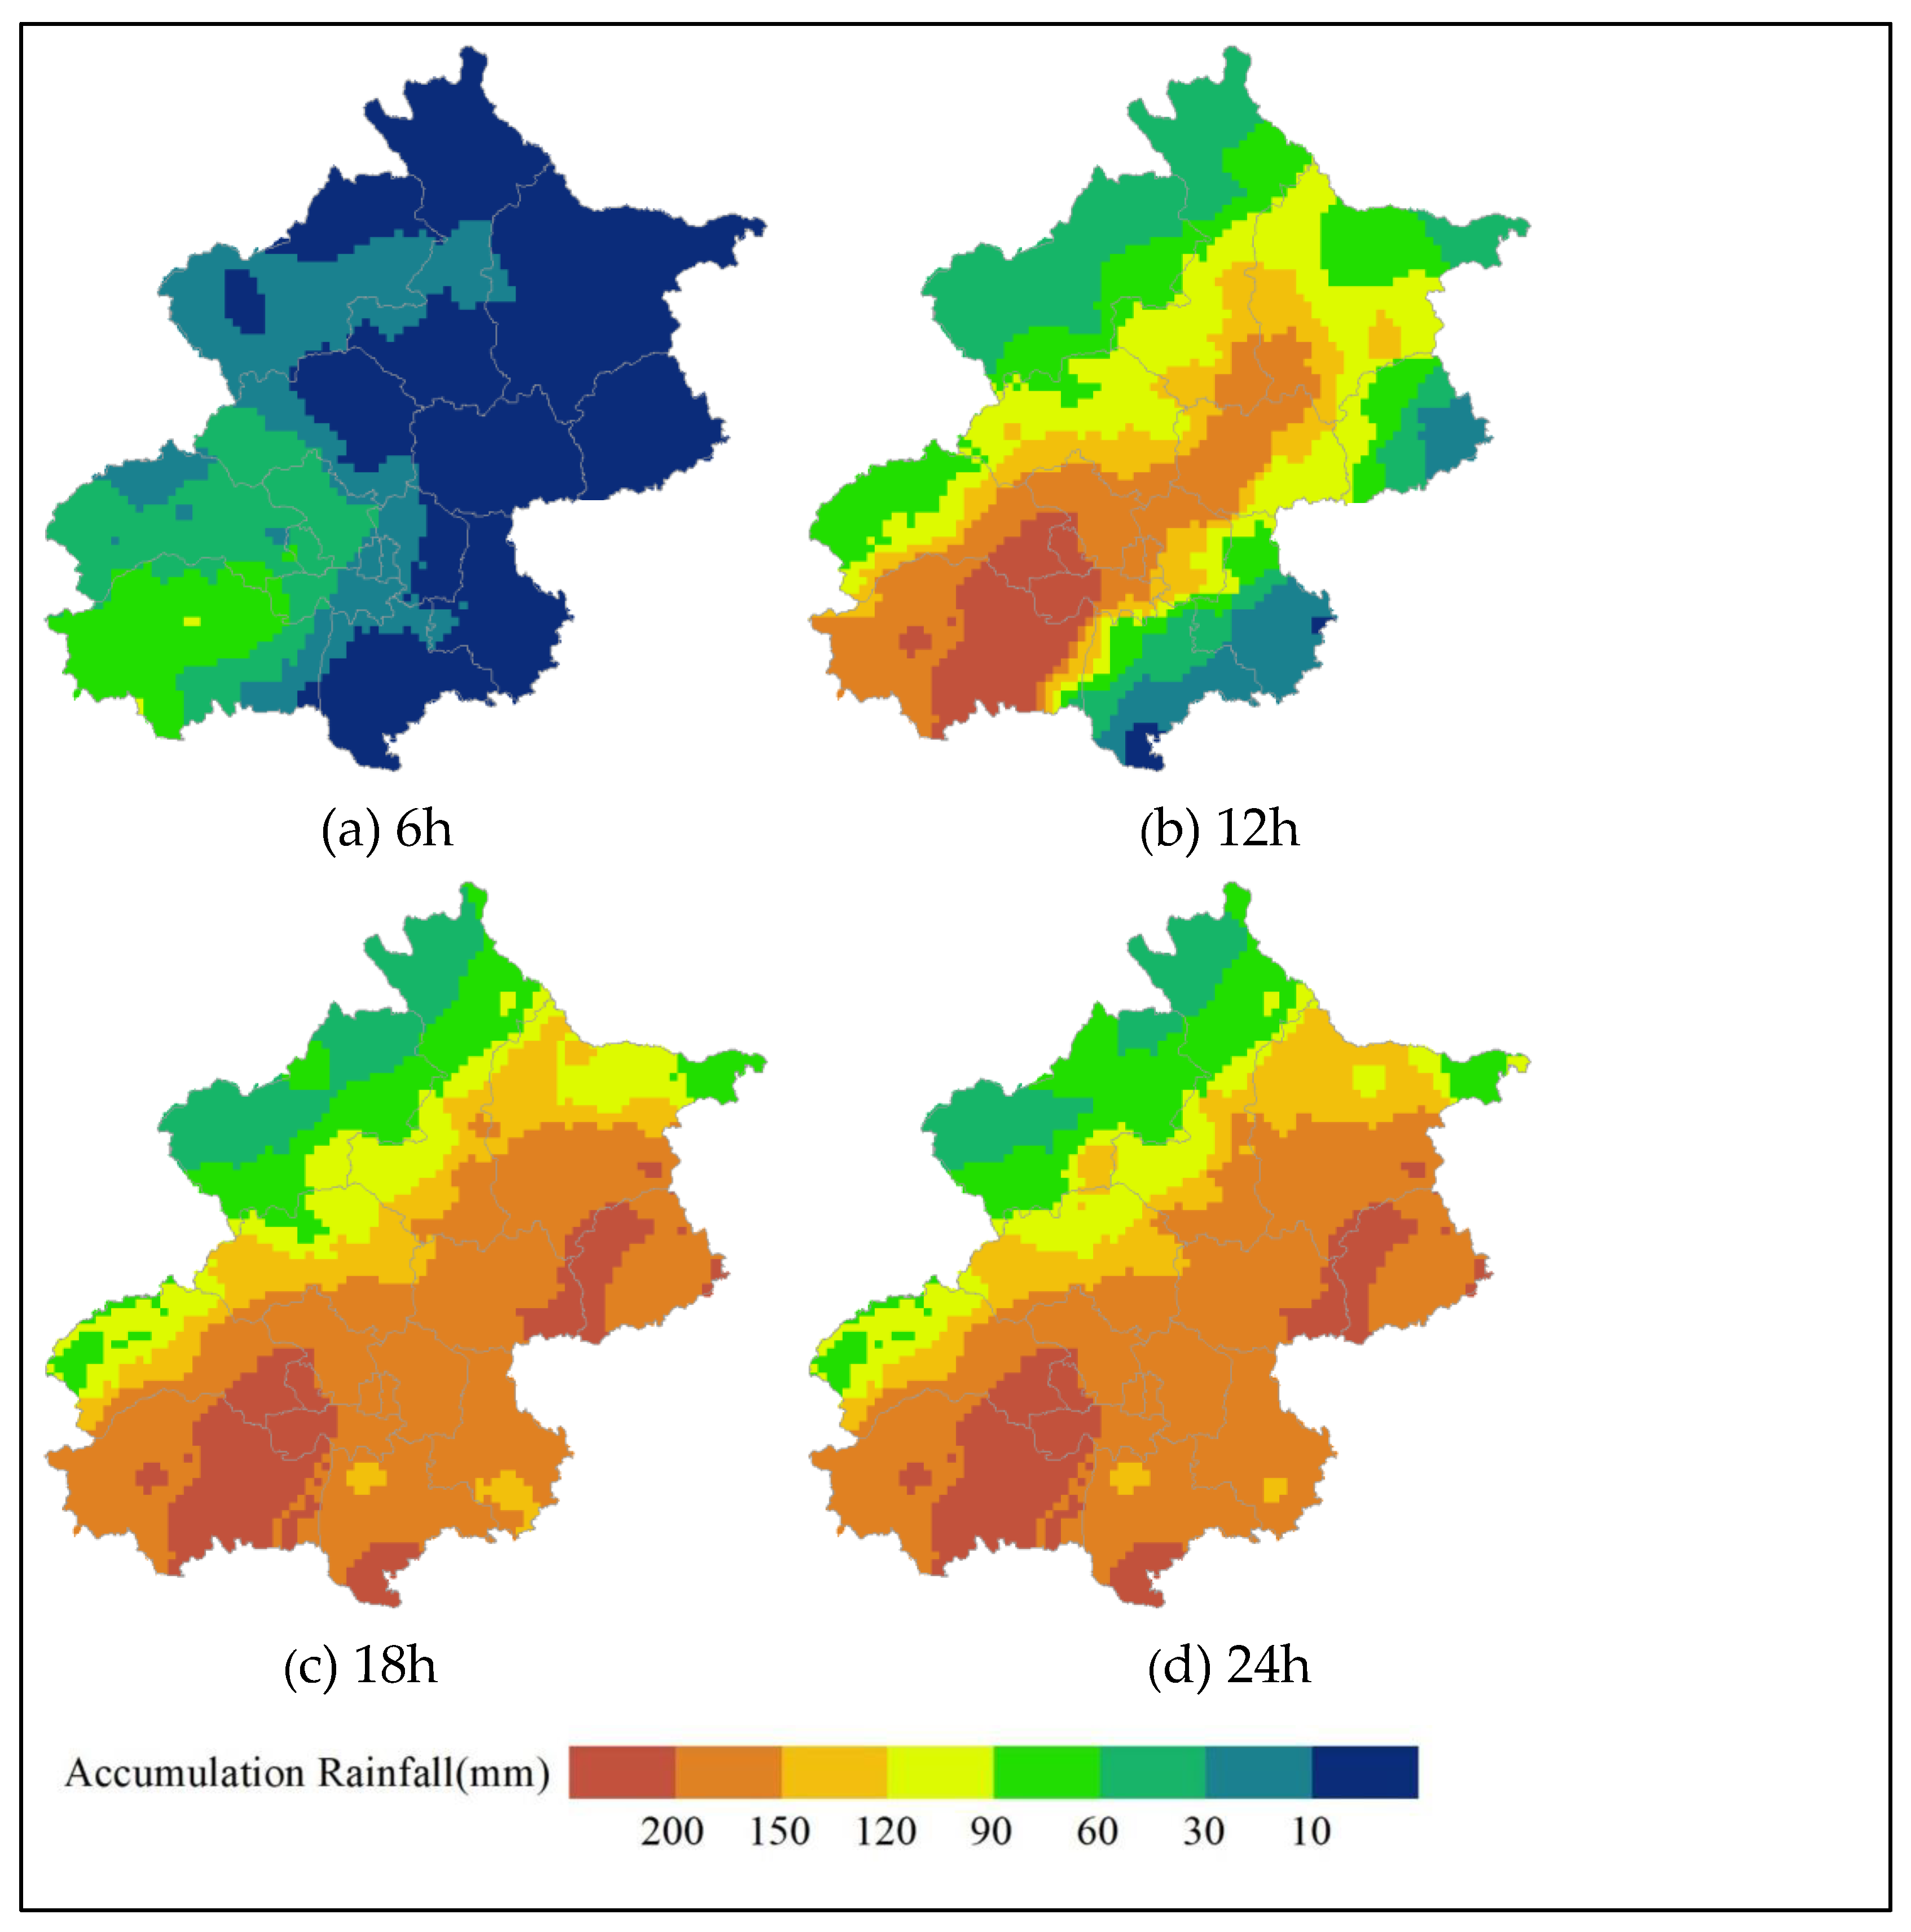
3.1. Results

As shown in Figure 3, the average duration time of heavy rain in Beijing was about 24 h, while in Shenzhen it was about 72 h. A heavy rainstorm in Beijing usually falls within one day, while a heavy rainstorm in Shenzhen typically lasts 2–3 days.
In this study, we evaluated rainstorm events lasting 24 h in Beijing and 72 h in Shenzhen. The study samples included 32 events in Beijing and 76 in Shenzhen. The spatial–temporal distribution characteristics of the rainstorms in the two cities were analyzed and extracted, and the characteristic rainstorm processes were reconstructed based on the extracted results.
Our analysis revealed major differences between Beijing and Shenzhen in the spatial–temporal distribution of rainstorms. The results of the spatial–temporal distribution characteristics analysis of the 24 h duration rainfall in Beijing are shown in Figure 4. We observed that: (1) The rainstorm started from the mountain areas in the west and north and developed in the plain area. The temporal and spatial variation of the rainstorm was relatively stable, and the mobility of the rainstorm center was not strong during rainfall. (2) The spatial and temporal distribution of the rainstorm presented a line from southwest to northeast, and the trend of the rainfall belt was consistent with that of the underlying mountain plain. (3) The distribution of precipitation was not uniform, with more precipitation in the northeast and southwest, and less precipitation in the northwest and southeast.
Heavy rain occurred in Beijing on 21 July 2012 (Figure 5). During this event, the rainfall started from the mountainous areas in the southwest and moved to the northeast. The distribution of the rainstorm zone was consistent with the trend of the underlying mountain and plain and was similar to the spatial–temporal distribution characteristics of the extracted rainfall.
Compared with Beijing, which is located in the inland area of North China, the spatial–temporal distribution characteristics of rainfall in Shenzhen were diverse. Rainstorms in Shenzhen were divided into three types based on different spatial–temporal distribution characteristics. Figure 6, Figure 7, Figure 8, Figure 9, Figure 10 and Figure 11 show the spatial–temporal distribution characteristics of each type of rainstorm in Shenzhen, along with the actual rainfall event of each type. As shown in Figure 6, this type of rain starts from the northwest and gradually moves to the southeast, with large rainfall in the north and northwest. Figure 7 shows the actual rainfall process of this type on 22 May 2009. As shown in Figure 7, the rainfall started from the northwest, and the rainfall in the western and northern regions was relatively heavier.
The second type of rainstorm, shown in Figure 8, starts from the southern and southeastern coastal areas and gradually moves to the north. The center of the rainstorm does not move significantly, and the rainfall in the southern and southeastern coastal areas is relatively heavier. Figure 9 shows the actual rainfall process of this type on 26 August 2017. As shown in the figure, the rainstorm started from the coastal areas and continued to move northward, with less rainfall in the northwest and more in the coastal areas.
The third type of rainstorm, shown in Figure 10, starts from the southeast coast and gradually moves to the north and northwest, with heavy rainfall in the east and southeast and relatively lighter rainfall in the west. Figure 11 shows the actual rainfall process of this type occurring on 12 June 2017. As shown in the figure, the rainstorm started from southeastern coastal areas and continued to move to the middle and west, with relatively lighter rainfall in the northwest and relatively heavier rainfall in the eastern and southeastern coastal areas.
These three types of rainfall, each with different spatial–temporal distribution patterns, can be explained by physical mechanisms. The first type of rainfall usually occurs from April through May. During this period, the cold air from the south is strong, while the warm and humid air masses in the southwest provide sufficient water vapor. This type of rainfall usually forms at the intersection of warm and cold air masses, and thus moves from northwest to southeast [39], and the rainfall in the northern and northwestern regions is relatively heavier. The second type of rainfall is usually caused by the southwest monsoon, which occurs from June through August. During this period, warm and humid air masses from the sea strengthen, and a large amount of water vapor is continuously brought to the shore by the southwest monsoon [40]. Therefore, this type of rainfall usually moves from the southern and southeastern coastal areas to the northern areas, with more precipitation seen in the coastal areas. The third type of rainfall is generally caused by eastern waves or typhoons, usually from the northwest Pacific Ocean [41]. This type of rain makes landfall in coastal areas southeast of Shenzhen, and then continues to move to western areas.

3.2. Discussions

Through analysis, it is found that the rainfall in Beijing in summer has a strong correlation with underlying surface topography, with obvious characteristics of rain in front of mountains, but that rainfall movement is obvious. In Shenzhen, weather conditions that cause rainfall are complex, and the temporal and spatial distribution characteristics of rainfall are also different. The correlations between the temporal and spatial distribution characteristics of rainfall and the underlying terrain conditions are weakly established. The temporal and spatial distribution characteristics of rainfall are closely related to the weather conditions and are more relevant to the source of water vapor.
In this study, machine learning algorithms are used to analyze the pattern of rainfall. Although machine learning technology cannot directly study the physical mechanisms behind rainstorms, it enables the extraction of the spatial–temporal distribution characteristics of regional rainfall through the analysis and mining of historical rainfall data. The temporal and spatial distribution pattern of characteristics has similar temporal and spatial distribution patterns to typical actual rainstorm events. This comparison shows that temporal and spatial distribution characteristics of rainfall processes are adequately representative of actual rainfall events. These features and laws are consistent with the weather conditions that cause rainfall. The extraction results can be reasonably explained by local climatic characteristics, topographic conditions, and other factors.

4. Conclusions

In this study, we analyzed the 5 min rainfall data from the last 20 years, collected by stations in Beijing and Shenzhen. We described the spatial–temporal characteristics of rainfall patterns in a high-dimensional array. We applied manifold learning algorithms to analyze and extract the spatial–temporal distribution characteristics of rainfall in Beijing and Shenzhen. The results extracted by the machine learning algorithm in this study identified physical mechanisms consistent with the climatic characteristics and topographic conditions of the region.
Our research showed that, although machine learning alone cannot fully explain the physical mechanisms of rainfall, data analysis utilizing machine learning algorithms can identify rainfall patterns and quantitative spatial–temporal characteristics. The method was put forward to analyze spatio-temporal distribution characteristics of rainfall, which can provide a basis for the design of rainfall patterns in different regions.
In the future, with the increase in data timing and the expansion of data range, the algorithm will become more objective and produce reasonable results. In this study, only the ground rainfall observation data were analyzed. The performance of the method can be improved by combining it with the use meteorological data, such as radar echo maps and meteorological cloud maps. The proposed method can be further improved to improve the accuracy of methods to identify early risk of rainstorms.

Author Contributions

Y.L. (Yesen Liu), H.R., L.Z., C.W. and Q.G. collected and processed the data; Y.L. (Yuanyuan Liu), Y.L. (Yesen Liu), H.R., S.L. and L.D. proposed the model and analyzed the results; and Y.L. (Yuanyuan Liu), Y.L. (Yesen Liu) and H.R. wrote the manuscript. All authors have read and agreed to the published version of the manuscript.

Funding

This work is supported by the National Key R&D Program of China (2022YFC3090600), and the Chinese National Natural Science Foundation (No. 51739011).

Institutional Review Board Statement

Not applicable for studies not involving humans or animals.

Informed Consent Statement

Not applicable.

Data Availability Statement

Participants of this study did not agree for their data to be shared publicly, so supporting data are not available.

Conflicts of Interest

The authors declare no conflict of interest.

References

  1. Zhang, J.Y.; Wang, Y.T.; He, R.M.; Hu, Q.F.; Song, X.M. Discussion on the urban flood and waterlog ging and causes analysis in China. Adv. Water Sci. 2016, 27, 485–491. [Google Scholar] [CrossRef]
  2. Chen, X.T. Urban Water Disasters and Strategy of Comprehensive Control of Water Disaster. J. Catastrophology 2010, 25, 10–15. [Google Scholar]
  3. Zhang, J.Y.; Wang, Y.T.; Hu, Q.F.; He, R.M. Discussion and views on some issues of the sponage city con struction in China. Adv. Water Sci. 2016, 27, 793–799. [Google Scholar] [CrossRef]
  4. Rafieeinasab, A.; Norouzi, A.; Kim, S.; Habibi, H.; Nazari, B.; Seo, D.-J.; Lee, H.; Cosgrove, B.; Cui, Z. Toward High-Resolution Flash Flood Prediction in Large Urban Areas–Analysis of Sensitivity to Spatiotemporal Resolution of Rainfall Input and Hydrologic Modeling. J. Hydrol. 2015, 531, 370–388. [Google Scholar] [CrossRef] [Green Version]
  5. Onyutha, C.; Willems, P. Influence of Spatial and Temporal Scales on Statistical Analyses of Rainfall Variability in the River Nile Basin. Dyn. Atmos. Ocean. 2017, 77, 26–42. [Google Scholar] [CrossRef]
  6. Liu, Y.S.; Liu, Y.Y.; Li, M. Influence of rainfall spatial and temporal heterogeneity on flooding process in urban rivers. S. N. Water Transf. Water Sci. Technol. 2022, 20, 317–326. [Google Scholar] [CrossRef]
  7. Wang, G.; Sun, G.; Li, J.; Li, J. The Experimental Study of Hydrodynamic Characteristics of the Overland Flow on a Slope with Three-Dimensional Geomat. J. Hydrodyn. 2018, 30, 153–159. [Google Scholar] [CrossRef]
  8. Li, Z.J.; Jiang, T.T.; Huang, P.N.; Liu, Z.Y.; An, D.; Yao, C.; Ju, X.S. Impact and analysis of watershed precipitation and topography characteristics on model simulation results. Adv. Water Sci. 2015, 26, 473–480. [Google Scholar] [CrossRef]
  9. Guo, L.; Ding, L.Q.; Sun, D.Y.; Liu, C.J.; He, B.S.; Liu, R.H. Key techniques of flash flood disaster prevention in China. J. Hydraul. Eng. 2018, 49, 1123–1136. [Google Scholar] [CrossRef]
  10. Emmanuel, I.; Payrastre, O.; Andrieu, H.; Zuber, F. A Method for Assessing the Influence of Rainfall Spatial Variability on Hy drograph Modeling. First Case Study in the Cevennes Region, Southern France. J. Hydrol. 2017, 555, 314–322. [Google Scholar] [CrossRef] [Green Version]
  11. Fung, K.F.; Chew, K.S.; Huang, Y.F.; Ahmed, A.N.; Teo, F.Y.; Ng, J.L.; Elshafie, A. Evaluation of spatial interpolation methods and spatiotemporal modeling of rainfall distribution in Peninsular Malaysia. Ain Shams Eng. J. 2021, 13, 101571. [Google Scholar] [CrossRef]
  12. Hitchens, N.M.; Brooks, H.E.; Schumacher, R.S. Spatial and temporal characteristics of heavy hourly rainfall in the United States. Mon. Weather. Rev. 2013, 141, 4564–4575. [Google Scholar] [CrossRef]
  13. Satya, O.C.; Arsali, M.; Affandi, A.K.; Mandailing, P.M. Spatial distribution and diurnal characteristics of rainfall in South Sumatra and surrounding areas based on Tropical Rainfall Measuring Mission (TRMM) data. J. Phys. Conf. Ser. 2020, 1568, 012024. [Google Scholar] [CrossRef]
  14. Ndiaye, B.; Moussa, M.A.; Wade, M.; Sy, A.; Diop, A.B.; Diop, A.D. Spatial and Temporal Distribution of Rainfall Breaks in Senegal. Am. J. Clim. Change 2021, 10, 533–560. [Google Scholar] [CrossRef]
  15. Chaubey, P.K.; Mall, R.K.; Jaiswal, R.; Payra, S. Spatio-Temporal Changes in Extreme Rainfall Events Over Different Indian River Basins. Earth Space Sci. 2022, 9, e2021EA001930. [Google Scholar] [CrossRef]
  16. Audu, M.O.; Ejembi, E.; Igbawua, T. Assessment of Spatial Distribution and Temporal Trends of Precipitation and Its Extremes over Nigeria. Am. J. Clim. Change 2021, 10, 22. [Google Scholar] [CrossRef]
  17. Yeung, J.K. Summertime Convective Rainfall in the New York City-New Jersey Metropolitan Region. Ph.D. Thesis, Princeton University, Princeton, NJ, USA, 2012. [Google Scholar]
  18. Viglione, A.; Chirico, G.B.; Woods, R.; Blöschl, G. Generalised synthesis of space-time variability in flood response: An analytical framework. J. Hydrol. 2010, 394, 198–212. [Google Scholar] [CrossRef]
  19. Zoccatelli, D.; Borga, M.; Viglione, A.; Chirico, G.B.; Blöschl, G. Spatial moments of catchment rainfall: Rainfall spatial organisation, basin morphology and flood response. Hydrol. Earth Syst. Sci. 2011, 15, 3767–3783. [Google Scholar] [CrossRef] [Green Version]
  20. Wu, D.; Zhao, K.; Yu, H.; Wang, M.J. An analysis of spatial and temporal variations in the axisymmetric precipitation structure associ ated with typhoons making landfall on the southeastern coast of China based on the Doppler radar data. Acta Meteorol. Sin. 2010, 68, 896–907. [Google Scholar]
  21. Ngongondo, C.; Xu, C.Y.; Gottschalk, L.; Alemaw, B. Evaluation of Spatial and Temporal Characteristics of Rainfall in Malawi: A Case of Data Scarce Region. Theor. Appl. Climatol. 2011, 106, 79–93. [Google Scholar] [CrossRef] [Green Version]
  22. LeCun, Y.; Bengio, Y.; Hinton, G. Deep Learning. Nature 2015, 521, 436–444. [Google Scholar] [CrossRef] [PubMed]
  23. Liu, Y.Y.; Liu, H.W.; Huo, F.L. An application of machine learning on examining spatial and temporal distribution of short duration rainstorm. J. Hydraul. Eng. 2019, 50, 773–779. [Google Scholar] [CrossRef]
  24. Liu, Y.Y.; Li, L.; Zhang, W.H.; Chan, P.W.; Liu, Y.S. Rapid Identification of Rainstorm Disaster Risks Based on an Artificial Intelligence Technology Using the 2DPCA Method. Atmos. Res. 2019, 227, 157–164. [Google Scholar] [CrossRef]
  25. Sharma, S.K. A novel approach on water resource management with Multi-Criteria Optimization and Intelligent Water De mand Forecasting in Saudi Arabia. Environ. Res. 2022, 208, 112578. [Google Scholar] [CrossRef] [PubMed]
  26. Salloom, T.; Kaynak, O.; Yu, X.B.; He, W. Proportional integral derivative booster for neural networks-based time-series prediction. Eng. Appl. Artif. Intell. 2022, 108, 104570. [Google Scholar] [CrossRef]
  27. Sadeghifar, T.; Barati, R. Application of adaptive Neuro-fuzzy inference system to estimate alongshore sediment transport rate (A real case study: Southern shorelines of Caspian Sea). J. Soft Comput. Civ. Eng. 2018, 2, 72–85. [Google Scholar]
  28. Alizadeh, M.J.; Shahheydari, H.; Kavianpour, M.R.; Shamloo, H.; Barati, R. Prediction of longitudinal dispersion coefficient in natural rivers using a cluster-based Bayesian network. Environ. Earth Sci. 2017, 76, 86. [Google Scholar] [CrossRef]
  29. Hu, R.; Fang, F.; Pain, C.C.; Navon, I.M. Rapid spatio-temporal flood prediction and uncertainty quantification using a deep learning method. J. Hydrol. 2019, 575, 911–920. [Google Scholar] [CrossRef]
  30. Liu, Y.Y.; Liu, Y.S.; Zheng, J.W. Intelligent rapid prediction method of urban flooding based on BP neural network and numerical simulation model. J. Hydraul. Eng. 2022, 53, 284–295. [Google Scholar]
  31. Bao, Z.X.; Zhang, J.Y.; Wang, G.Q.; He, R.M.; Jin, J.L.; Wang, J.; Wu, H.F. Quantitative assessment of the attribution of runoff and sediment changes based on hydrologic model and machine learning: A case study of the Kuye River in the Middle Yellow River basin. Adv. Water Sci. 2021, 32, 485–496. [Google Scholar] [CrossRef]
  32. Zheng, T.F.; Liu, X.T.; Wang, Q.L.; Yu, X. The characteristics of precipitation in Guangdong Province over the past 50 years: Dependence on rainfall intensity. J. Trop. Meteorol. 2017, 33, 212–220. [Google Scholar] [CrossRef]
  33. Luo, C.; Liu, Y.S.; Liu, Y.Y.; Mu, J.; Liu, X.P.; Feng, M.M. A smart-framework for urban flood and waterlogging analysis. China Flood Drought Manag. 2021, 31, 17–22. [Google Scholar] [CrossRef]
  34. Cauteruccio, A.; Colli, M.; Stagnaro, M.; Lanza, L.G.; Vuerich, E. In situ precipitation measurements. In Springer Handbook of Atmospheric Measurements; Springer Handbooks; Springer: Cham, Switzerland, 2021; pp. 259–400. ISBN 978-3-030-52170-7. [Google Scholar] [CrossRef]
  35. Cauteruccio, A.; Brambilla, E.; Stagnaro, M.; Lanza, L.G.; Rocchi, D. Experimental evidence of the wind-induced bias of precipitation gauges using Particle Image Velocimetry and particle tracking in the wind tunnel. J. Hydrol. 2021, 600, 126690. [Google Scholar] [CrossRef]
  36. Belkin, M.; Niyogi, P. Laplacian Eigenmaps for Dimensionality Reduction and Data Representation. Neural Comput. 2003, 15, 1373–1396. [Google Scholar] [CrossRef] [Green Version]
  37. Roweis, S.T.; Saul, L.K. Nonlinear Dimensionality Reduction by Locally Linear Embedding. Science 2000, 290, 2323–2326. [Google Scholar] [CrossRef] [Green Version]
  38. Hartigan, J.A.; Wong, M.A. Algorithm AS 136: A K-Means Clustering Algorithm. Appl. Stat. 1979, 28, 100. [Google Scholar] [CrossRef]
  39. Chen, Z.H.; He, G.B.; Cui, C.G. The coupling reaction among convective cloud cluster and moisture frontal zone and low level jet—A possible mechanism of maintenance of continuing heavy rain. J. Trop. Meteorol. 2007, 23, 246–254. [Google Scholar]
  40. Hu, Y.; Du, Y.; Luo, X. Precipitation Patterns During the “Dragon Boat Water” in South China for the Recent 49 Years. Meteor. Mon. 2013, 39, 1031–1041. [Google Scholar]
  41. Huang, R.H.; Chen, G.H. Besearch on interannual variations of tracks of tropical cyclones over northwest pacific and their physical mechanism. Acta Meteorol. Sin. 2007, 65, 683–694. [Google Scholar]
Figure 1. Study area and locations of stations whose data were used in this study.
Water 15 00037 g001
Figure 2. Schematic diagram.
Water 15 00037 g002
Figure 3. Comparison chart of rainfall with different duration.
Water 15 00037 g003
Figure 4. Temporal and spatial distribution pattern of 24 h rainfall in Beijing.
Water 15 00037 g004
Figure 5. Rainfall accumulation of rainstorm occurred on 21 July 2012 in Beijing.
Water 15 00037 g005
Figure 6. Temporal and spatial distribution pattern of the type I characteristics of 72 h rainfall in Shenzhen.
Water 15 00037 g006
Figure 7. Rainfall accumulation of rainstorm of type I occurred on 22 May 2009.
Water 15 00037 g007
Figure 8. Temporal and spatial distribution pattern of the type II characteristics of 72 h rainfall in Shenzhen.
Water 15 00037 g008
Figure 9. Rainfall accumulation of rainstorm of type II occurred on 26 August 2017.
Water 15 00037 g009
Figure 10. Temporal and spatial distribution pattern of the type III characteristics of 72 h rainfall in Shenzhen.
Water 15 00037 g010
Figure 11. Rainfall accumulation of rainstorm of type III occurred on 12 June 2017.
Water 15 00037 g011
Disclaimer/Publisher’s Note: The statements, opinions and data contained in all publications are solely those of the individual author(s) and contributor(s) and not of MDPI and/or the editor(s). MDPI and/or the editor(s) disclaim responsibility for any injury to people or property resulting from any ideas, methods, instructions or products referred to in the content.

