Article

Impact of Biochar and Graphene as Additives on the Treatment Performances of a Green Wall Fed with Greywater

1
DIATI (Department of Environment, Land and Infrastructure Engineering), Politecnico di Torino, Corso Duca degli Abruzzi 24, 10129 Turin, Italy
2
CERIS, Instituto Superior Técnico, Universidade de Lisboa, Av. Rovisco Pais, 1049-001 Lisbon, Portugal
3
IRIDRA Srl, Via La Marmora 51, 50121 Florence, Italy
4
CleanWaterCenter@PoliTo, Politecnico di Torino, Corso Duca degli Abruzzi 24, 10129 Turin, Italy
*
Author to whom correspondence should be addressed.
Water 2023, 15(1), 195; https://doi.org/10.3390/w15010195
Submission received: 18 November 2022 / Revised: 27 December 2022 / Accepted: 29 December 2022 / Published: 3 January 2023
(This article belongs to the Special Issue Biological Technology for Wastewater Treatment)

Abstract

:
The treatment of greywater (GW, wastewater share excluding toilet flush) through green walls can be beneficial for urban areas, favouring the diffusion of urban vegetation and reducing potable water consumption. Multiple challenges hinder the treatment performance of green walls, including the composition of the filtering material, the number of levels—i.e., rows—and the age of the system. This study investigated graphene as an additive (5%v) to a filtering medium made of coconut fibre, perlite and biochar in an open-air green wall with pots arranged into three levels. The performance of GW treatment was quantified by comparing the physicochemical features of inflow and outflow samples collected weekly over two months. Samples were also collected at each level of the green wall, and the performance of two analogous systems different by age for three months were compared. The results showed that graphene did not significantly improve treatment performance, except for the first level (e.g., 48% vs. 15% for COD, 72% vs. 51% for TSS, with and without graphene respectively). Moreover, GW treatment mostly happened along the first two levels of the green wall, with marginal depletion (e.g., 15% vs. 7% for NH4+-N) after three months of operational time.

1. Introduction

The interest in multipurpose ecosystem services is increasing with the intent of building more resilient cities and fulfilling the United Nations Sustainable Development Goal 11 of sustainable urban communities. Green walls are one of the existing Nature-based Solutions and provide multiple benefits in urban areas [1]: thermal and air pollution control [2,3,4], and increases in quality of life and property values [5,6,7]. The use of green walls for the treatment of greywater (GW; the portion of wastewater that excludes toilet flushing and the kitchen sink) allows a reduction of potable water consumption, transforming wastewater from a waste into a second-life resource for non-potable activities, such as toilet flushing, cooling of buildings, gardening or landscape irrigation, or street washing [8,9,10,11,12]. Even though GW is less polluted than other types of wastewater, it may include organic contaminants, surfactants, suspended solids and pathogens, low amounts of nutrients (nitrogen and phosphorus), metals and micropollutants [12].
One of the major issues in the design of treatment green walls concerns the choice of the growing medium. It must be light, suitable for plant growth and water drainage, and at the same time, must guarantee sufficient contact time for GW treatment without clogging. Different media have been tested and discussed in the recent literature, e.g., coconut fibre and perlite mixed in different proportions [13,14,15], sand [16,17], and expanded clay [13,15,18]. A mixture of coconut fibre and perlite was identified by many researchers as an efficient medium, due to its combination of light weight, hydraulic conductivity and hydraulic retention time appropriate for pollutants removal [13,14,15]. This study stems from a previous one [18] exploring the use of additives to increase the treatment performance of an optimized mixture of coconut fibre and perlite (4:1 in volume, defined as “base medium”). Specifically, the effects of the addition of compost, biochar, polyacrylate, and granular activated carbon in different percentages [19] were tested. Adding 20%v biochar significantly improved the treatment performance of the base medium towards GW, especially in nitrogen removal (47% for biochar vs. 35% for base medium), and also in removing BOD5, COD and E. coli (96%, 51% and 99%, respectively).
Graphene is a nanomaterial previously proposed [20,21] for wastewater treatment because of its high surface area and chemical reactivity, able to favour contaminants’ adsorption and oxidation processes. To our knowledge, the addition of graphene to the growing medium of a green wall has not yet been investigated. Furthermore, analyses of the efficiency of each level of a green wall in GW treatment are scarce in the scientific literature. An exception is the study by Prodanovic et al. [22], who found that the first level (out of three) was the most effective considering only three sampling dates, and that further experimental observations would be valuable to verify this finding.
The first aim of this study was to test the effect on the performance of GW treatment due to the addition of graphene (5%v) to the growing medium of a modular green wall. Specifically, graphene was added to a filtering medium composed of coconut fibre, perlite and biochar. The possible release of contaminants from the green wall was verified feeding one module with tap water (TW). Quality parameters (BOD5, COD, nitrogen compounds, total phosphorus, pH, dissolved oxygen, electric conductivity, chlorides, sulphates, anionic surfactants, E. coli and total suspended solids) were analysed weekly over two months in the inflow and outflow of a green wall exposed to open air. The second aim of the study was to investigate the influence of the geometric design of the green wall by quantifying the contribution of each level—i.e., row—of pots to the overall treatment performance. Finally, the effect of ageing on GW treatment efficiency was assessed by comparing a new module with an already existing one (three months old).

2. Materials and Methods

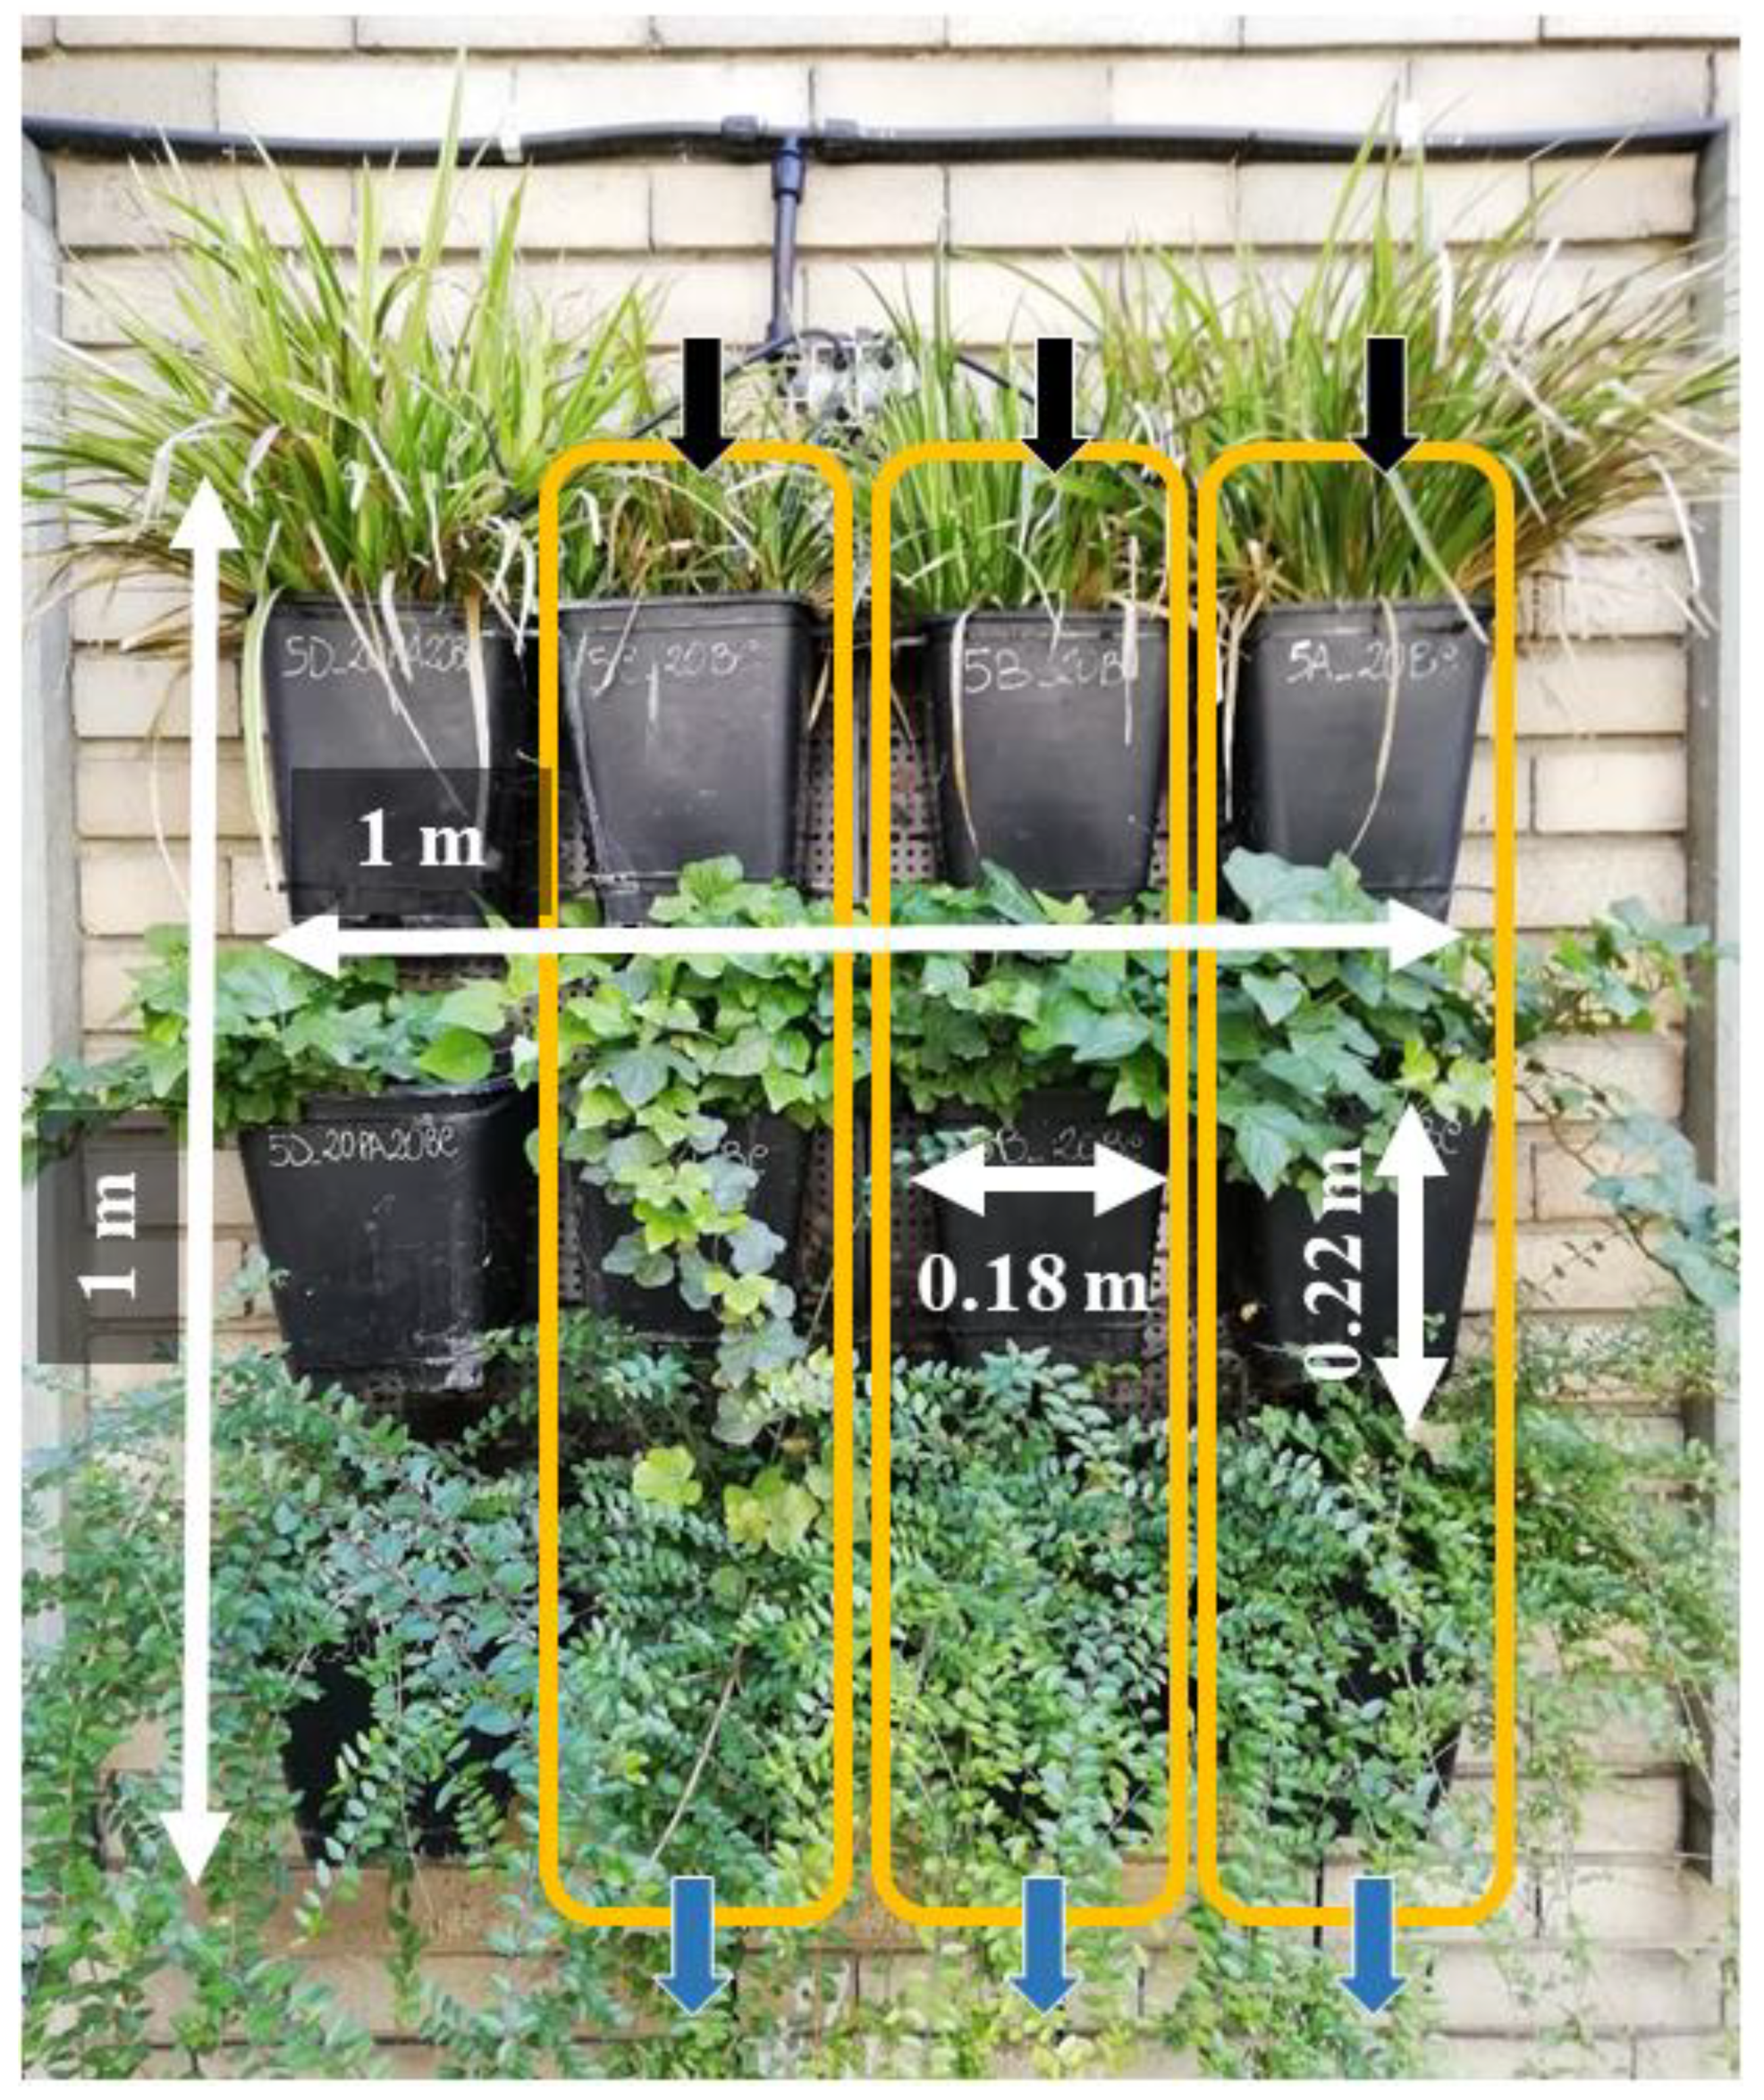
2.1. System Design and Operation

The experimental design of this study aimed to explore three issues: (1) if green walls with the same filtering medium and ages different by three months could have discrepant performances towards GW treatment; (2) if the addition of a small amount of graphene could improve the treatment performance of the green wall; (3) if some levels of the green wall provide a higher contribution to the overall treatment. The adopted green wall was based on the open-air system presented in previous studies [14,19] and was composed of pots (6.5 L bulk soil volume, 0.18 × 0.18 × 0.22 m) hung on a 1 m2 modular panel (Figure 1). Each panel was fed with a total daily volume that can be approximately assumed as the daily GW share of one person. Each pot was filled with a 0.2 m layer of filtering medium in four configurations. Following the approach described in Boano et al. [14,19], four configurations involving a mixture of 80%v base medium (coconut fibre and perlite in a 4:1 ratio) were set up (Table 1). Each configuration was made of nine pots arranged into three columns and three rows (or levels). Two configurations deployed at a three-month distance (BC_old in January 2019 and BC in April 2019) were supplemented with 20%v biochar obtained from wood chips (AgriNewTech, Torino, Italy). Two other modules (BC + GR) involved graphene supplement (5%v) to the BC configuration. The small amount was chosen considering graphene’s high efficiency and considerable cost. One of the graphene-supplemented configurations (BC + GR*) was fed with tap water (TW) and used as control.
The green wall was designed as a vertical flow system with three independent replicates (i.e., columns) for each configuration. Different plant species were selected based on aesthetic and resistance criteria after a literature review and preliminary tests [4,5,14,17,23,24,25,26], and placed in the same position for all columns (Carex morrowii, Hedera helix, Lonicera nitida from top to bottom) (Figure 1). After setup and before starting the experimental tests, all the panels were preliminarily washed for 82 consecutive hours with TW through constant flow drippers, using the same schedule adopted during the experiments (described below), to remove the finest particles and reduce the risk of clogging. During the experimental tests, each column was fed with 24 Lday−1 of GW [19,27], while the control BC + GR* configuration was fed with tap water (TW) with the same flow rate. A batch feeding mode was adopted to allow the re-oxygenation of the system, with a volume fed to each column of 1 L over 15 min followed by a resting period of 45 min. Water flowed by gravity through a 4 mm hole in the bottom of each pot. The contribution of evapotranspiration and precipitation in the Turin’s climate during spring was negligible compared to the high hydraulic loading rate (precipitation below 600 mm from April to July 2019, with a peak around 83 mm in one day, HLR 740.8 Lm−2 d−1).
Since real GW in university facilities is not fully representative of household GW, synthetic GW according to previous studies [14,19,27] was prepared weekly in a 1.5 m3 plastic tank mixed hourly, using local commercial products (Table 2). The reagents employed in the synthetic GW were purchased from Sigma-Aldrich (Burlington, MA, USA).

2.2. Sampling and Analytical Procedures
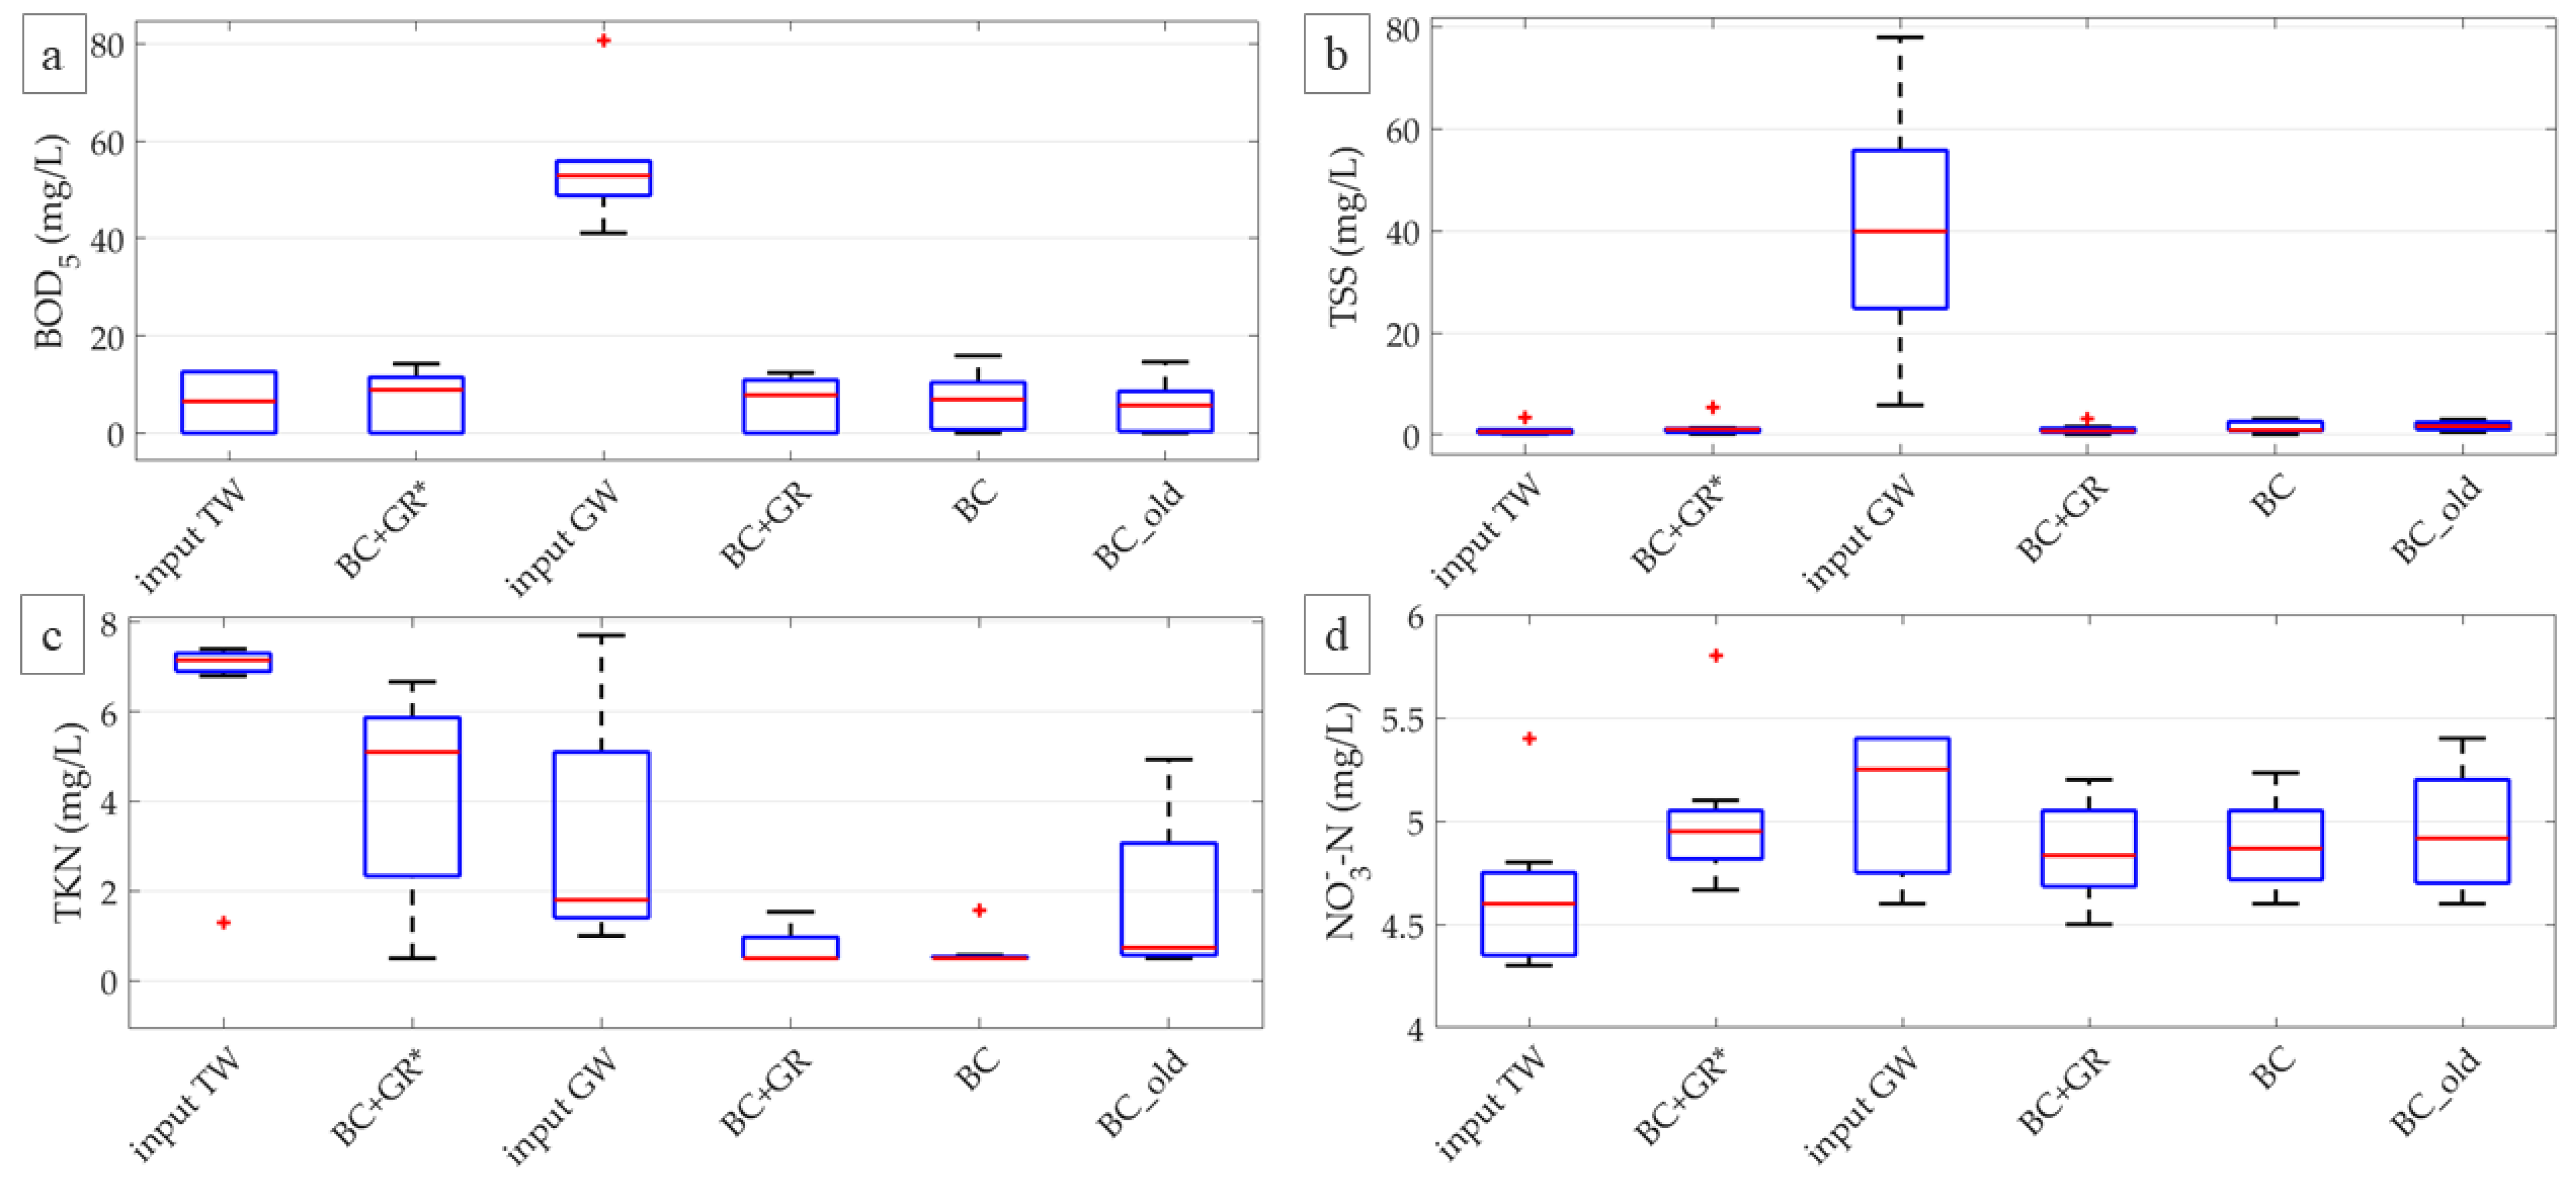
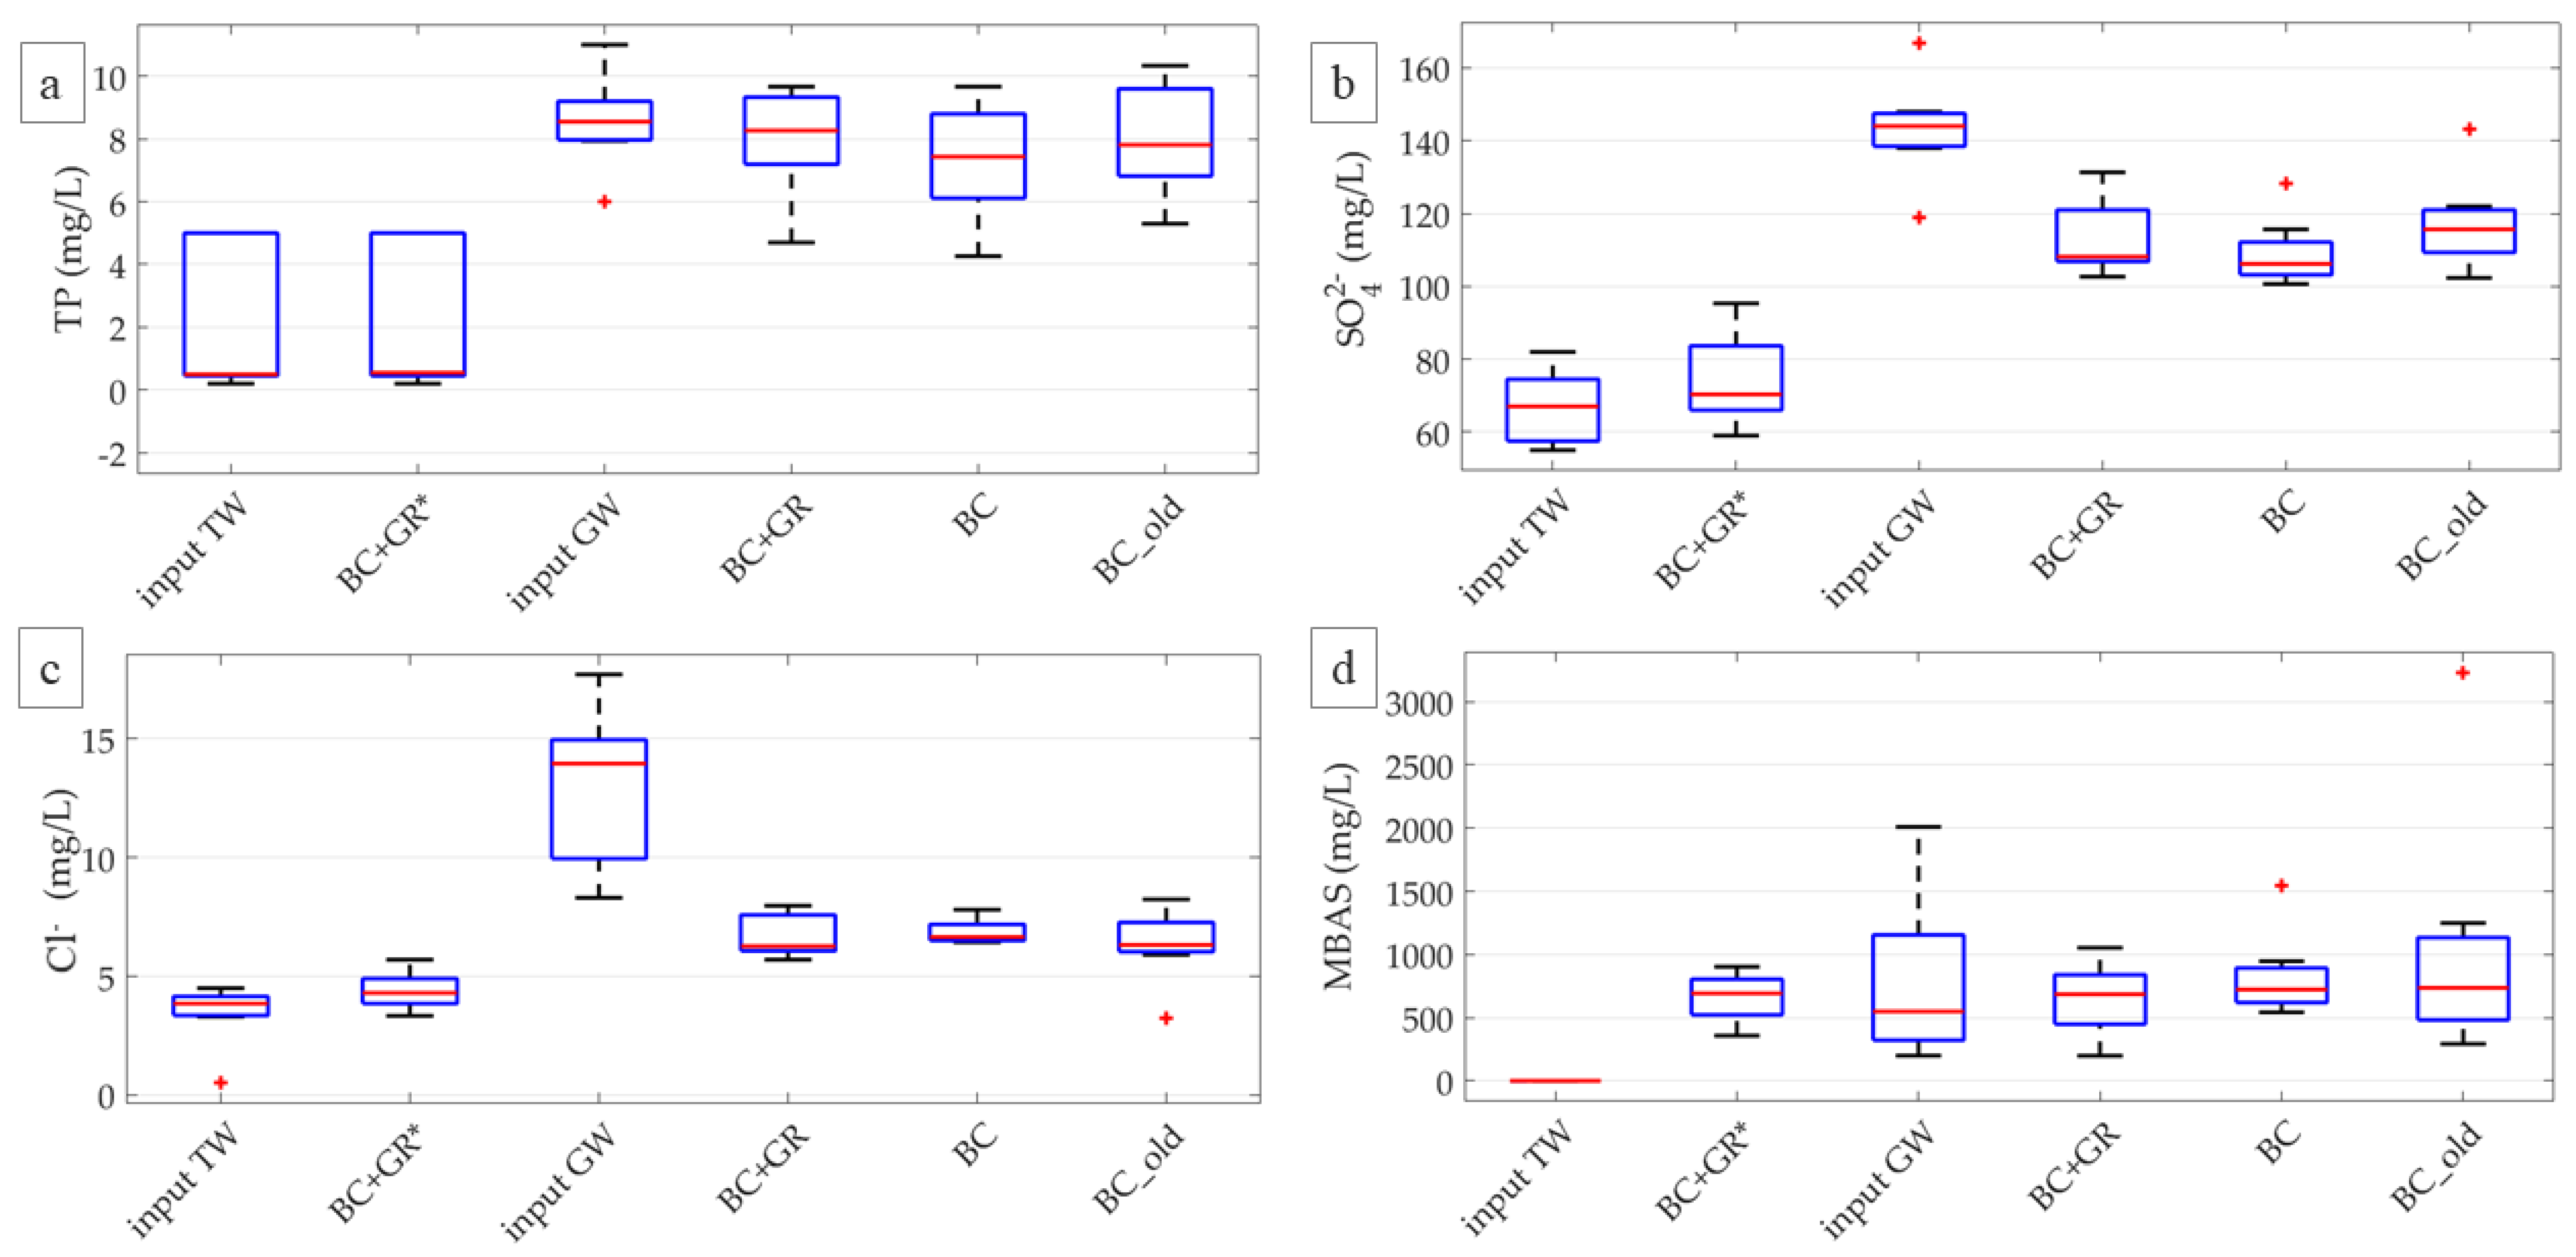
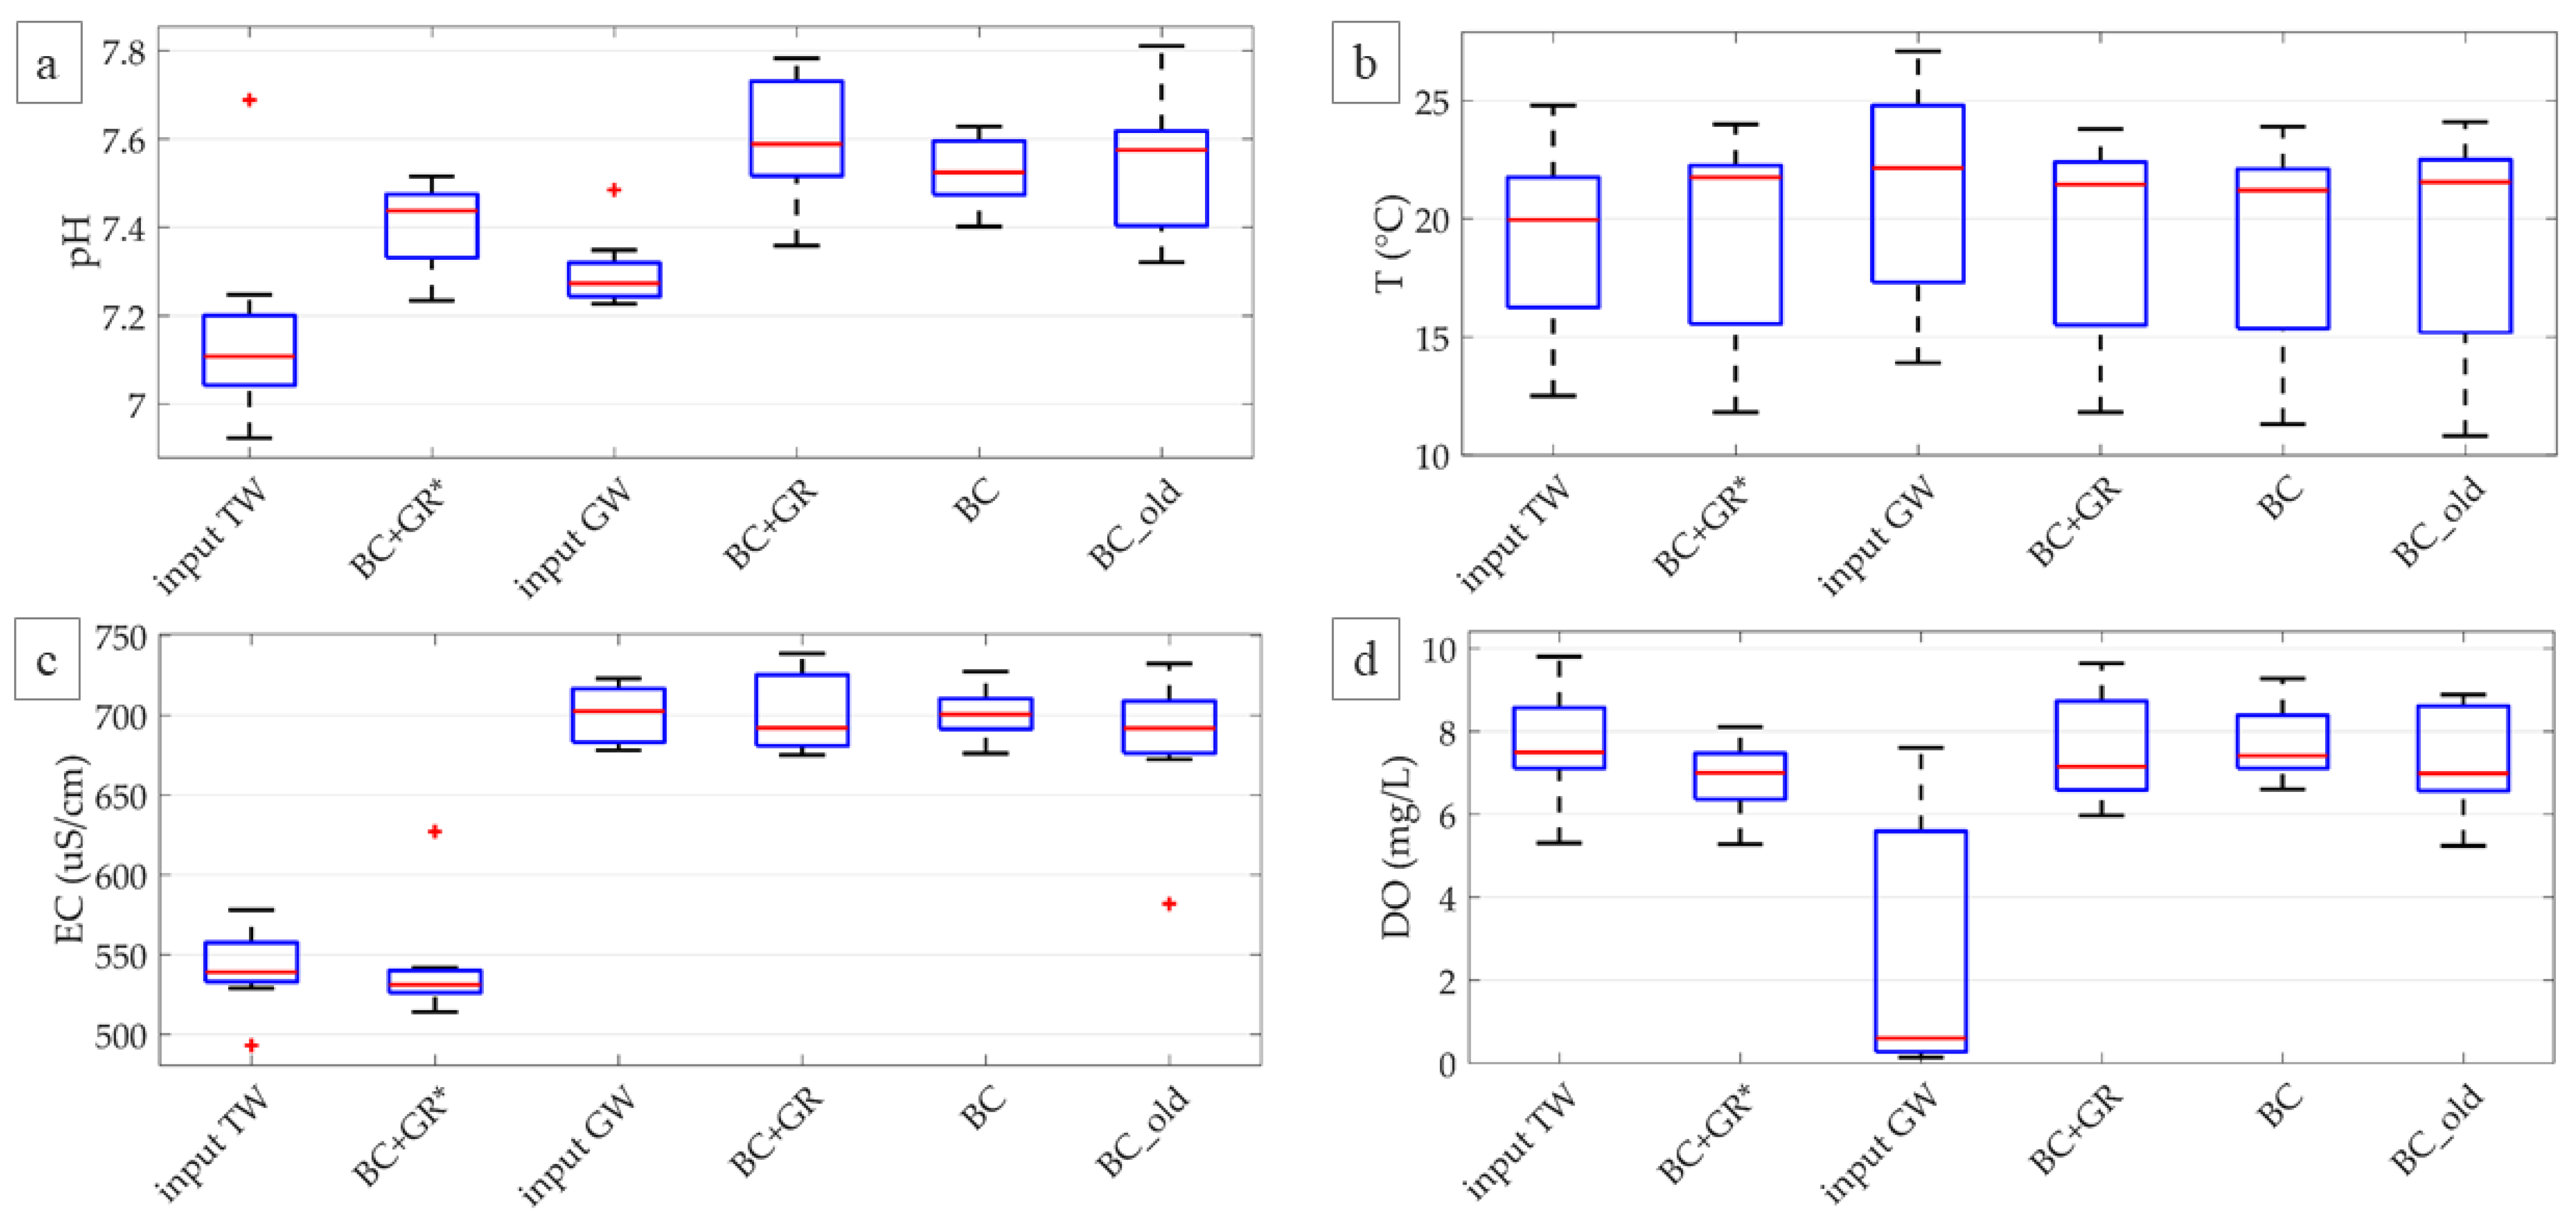
Eight weekly sampling dates have been planned from May to July 2019, collecting 140 samples in total from the output of each column (third level) and from the input GW. The output water from the first and second levels was also collected in three sampling dates. The samples were analysed on-site for temperature, pH, electric conductivity (EC), and dissolved oxygen (DO) using a WTW Multi 3320 portable 2-channel probe; sulphates, chlorides, total Kjeldahl nitrogen (TKN), nitric nitrogen (NO3-N), ammonia nitrogen (NH4+-N), total phosphorus (TP), chemical oxygen demand (COD) and methylene blue active substances (MBAS)—i.e., anionic surfactants—were analysed through NanocolorTM reagent kits, a VELP COD ECO 16 thermo-reactor (for COD, TKN and TP), and an AL450 Multidirect photometer; Total Suspended Solids (TSS) were measured via 0.45 µm cellulose membranes; BOD5 was measured through a VELP FOC 215 E incubator equipped with Oxy-top systems. E. coli concentration was measured on five sampling dates, using Colitag™ water test reagents after 24 h, following APHA standard method 9221. When the measured concentration value of any parameter was below the detection limit, the limit itself was considered during the data processing to avoid overestimating removal efficiencies.
All experimental data have been processed calculating the removal efficiency (Equation (1)), where C i n _ G W is the concentration in input GW and C o u t ¯ is the average of the concentrations of the three replicates of each configuration:
R e m _ e f f = C i n _ G W C o u t ¯ C i n _ G W
For each configuration, both concentration and removal time series are composed of eight sampling dates (each coming from the average of three samples) for all parameters, except MBAS (7 sampling dates) and E. coli (6 sampling dates).
Statistical tests were also performed to find temporal trends and significant differences in removal efficiency. A Mann-Kendal trend test was performed to identify possible monotonic temporal trends (p < 0.05). A one-tailed Student’s t-test was performed on the differences between the reference configuration and the tested configuration. Specifically, differences were calculated between measured values for the parameters measured on-site (temperature, pH, EC, DO), and between removal efficiencies for the parameters quantified off-site in the laboratory. The test evaluates the mean value of the difference between a reference configuration and the other configurations. If the mean value of these differences is significantly higher than zero, the tested configuration was considered to treat GW significantly better than the reference one (p < 0.05). Following [28], p-values were also corrected with a false discovery rate approach, which confirmed the test significance when the p-value remains below 0.05. More details on the statistical tests can be found in [19].

3. Results

3.1. Effect of System Age on Performance of Biochar Columns

The age of the system did not significantly affect the behaviour of on-site parameters (Figure 2), according to the comparison between the newer (BC) and the older (BC_old) biochar configurations. Both cases showed similar ranges for pH (BC: 7.40–7.63; BC_old: 7.32–7.81) and EC values (BC: 701 ± 16; BC_old: 683 ± 46). The BC_old configuration was characterised by a wider range in output DO concentration (5.2–8.9 mg/L) compared to BC (6.6–9.3 mg/L).
BC and BC_old showed very good removal performance for BOD5 (87.0 ± 11.8% and 88.8 ± 10.4%, respectively), and BC_old performed significantly better than BC (Table 3). The impact of age was not significant for COD removal performance (BC: 70.6 ± 5.8%; BC_old: 71.1 ± 6.1%; data not shown), with output concentrations often reaching the detection limit for both configurations. TSS removal efficiency was excellent and statistically similar for both configurations (BC: 94.0 ± 6.1%; BC_old: 93.2 ± 6.8%). Among nitrogen compounds (Figure 3), only NH4+-N removal was significantly affected by system age as BC performed significantly better than BC_old, which released small amounts of NH4+-N (BC_old: 0.15 ± 0.19 mg/L; GW: 0.06 ± 0.03 mg/L). The BC_old configuration also showed a higher variability in output concentrations for NH4+-N (0.15 ± 0.19 mg/L) as well as for TKN (1.77 ± 1.95 mg/L), while BC had a lower variability (NH4+-N: 0.04 ± 0.00 mg/L; TKN: 0.64 ± 0.37 mg/L). The average removal performance of TKN was high for BC (71.2 ± 14.6%) but scarce for BC_old (22.8 ± 95.9%); however, this difference was largely due to the variability in removal for BC_old and was not statically significant (Table 3). Low removal performance was also found for NO3-N, as expected in a vertical flow system (BC: 12.3 ± 26.9%; BC_old: 11.3 ± 27.1%).
The BC configuration performed significantly better (Table 4) for TP and SO42− removal (15.2 ± 11.6% and 23.7 ± 5.7%) compared to BC_old (6.6 ± 11.8% and 18.1 ± 6.1%, respectively). Both configurations had similarly good performance for Cl removal (BC: 43.3 ± 18.1%; BC_old: 50.1 ± 11.1%), although Cl was present in very low amounts. Age did not significantly impact on system performance in MBAS removal (Table 4), and the release of MBAS was predominant for both configurations.

3.2. Effect of Graphene Addition

3.2.1. Release from Graphene Columns

The potential release of contaminants from the base medium has been evaluated in [14], but one further analysis was performed in this study to verify the impact of graphene, which could possibly adsorb any substance released by the base medium. Thus, the output of the BC + GR* control configuration was compared with input TW for the considered physical-chemical parameters. pH (Figure 2a) increased from 7.16 ± 0.23 (average ± standard deviation) in TW to 7.40 ± 0.10 in output TW, with a slight alkalinization. Input and output water temperatures (Figure 2b; see TW and BC + GR*) were mainly influenced by the outdoor air temperature. The temperature ranged between 12.5–24.8 °C for input TW and 11.8–24.0 °C for output TW; thus, no significant difference was found for this parameter (Table 3). No significant variations were found comparing input and output samples for EC (Figure 2c) and DO (Figure 2d), and no temporal trend was identified for both parameters (Table 3 and Table 4). The limited reduction in average DO concentration (input: 7.7 ± 1.4 mg/L; output: 6.9 ± 0.9 mg/L) showed good oxygenation of the vertical unsaturated system.
Outflow samples from the control BC + GR* configuration did not significantly differ in BOD5 (7.3 ± 6.0 mg/L) compared to input TW (6.4 ± 5.8 mg/L) (Figure 3a, Table 3). COD values were also not appreciably affected by the filtering medium, since both input and output concentrations were always below the detection limit (20 mg/L, data not shown). TSS concentration in TW was very low (0.98 ± 1.23 mg/L), and showed a small but not significant increase along the columns (output 1.38 ± 1.65 mg/L) (Figure 3b, Table 3). TKN (Figure 3c) showed a non-significant decrease from 6.43 ± 2.08 mg/L in input TW to 4.22 ± 2.29 mg/L in BC + GR* output. NO3-N (Figure 3d) and NH4+-N (data not shown) did not exhibit any significant difference (Table 3) between input (4.19 ± 1.45 mg/L and 0.04 ± 0.01 mg/L, respectively) and output (5.01 ± 0.35 mg/L and 0.05 ± 0.01 mg/L, respectively), despite the very small increase in the concentrations of both compounds.
The filter medium in BC + GR* released non-significant amounts of TP (input 2.14 ± 2.37 mg/L; output 2.15 ± 2.36 mg/L; Figure 4a), Cl (input 3.46 ± 1.26 mg/L; output 4.39 ± 0.78 mg/L, Figure 4c), and SO42− (input 66.88 ± 9.79 mg/L, output 74.29 ± 12.18 mg/L, Figure 4b). On the other hand, a significant difference (Table 3) was observed between MBAS input and output concentration (0.64 ± 0.35 mg/L and 603.13 ± 290.53 mg/L, respectively), in agreement with previous results achieved with the base medium [14], suggesting that MBAS release was due to base medium regardless of the presence of biochar and graphene (Figure 4d).

3.2.2. Effect of Graphene on GW-Fed Column Performance

The impact of graphene on green wall performance has been evaluated comparing the output concentration and removal efficiency of the BC + GR configuration with the control BC configuration installed at the same time.
The parameters measured on-site did not exhibit any temporal trend for both configurations (Table 4). The slight increase in pH was similar for BC and BC + GR configurations (input GW 7.30 ± 0.08, BC 7.53 ± 0.08, BC + GR 7.60 ± 0.14). EC was not influenced by the addition of graphene, and no relevant difference was found between input GW values (701 ± 18 µS/cm) and the two considered configurations (BC 701 ± 16 µS/cm and BC + GR 701 ± 25 µS/cm) (Figure 2c). For BC and BC + GR configurations, the DO content increased (Figure 2d) from a low-oxygen condition in input (2.58 ± 3.14 mg/L) to aerobic conditions in output characterised by similar distributions for BC (7.7 ± 0.9 mg/L) and BC + GR (7.6 ± 1.3 mg/L).
Both configurations exhibited high BOD5 removal performance (87.0 ± 11.8% for BC and 87.0 ± 10.6% for BC + GR) that remained constant over time (Table 4). The BOD5 range was 41.1–80.1 mg/L for input GW and decreased to 0–15.9 mg/L and 0–12.4 mg/L for BC and BC + GR, respectively (Figure 3a). COD concentration was 70.9 ± 16.4 mg/L in GW and output concentrations were always below the detection limit of 20.0 mg/L for both BC and BC + GR, reaching a removal efficiency around 70.6% for both mixes. Instead, TSS removal was significantly better for BC + GR than for BC (Table 3); however, TSS removal performance was excellent for both configurations (around 94%), and concentrations decreased from 40.6 ± 22.7 mg/L in GW to 1.45 ± 1.14 mg/L in BC and 1.03 ± 0.96 mg/L in BC + GR (Figure 3b). Considering nitrogen compounds, neither temporal trends (Table 4) nor significant differences (Table 3) were found for the removal performance of BC and BC + GR configurations. TKN removal was high (71.2 ± 14.6% and 64.7 ± 24.0%, respectively), starting from a range of 1.00–7.70 mg/L in input GW and often decreasing below the detection limit (0.5 mg/L) in both configurations. Removal of NO3-N and NH4+-N were respectively around 12% and 26% for both configurations. The moderate removal performances were probably due to the low concentrations in input GW (NO3-N: 7.18 ± 6.00 mg/L, NH4+-N: 0.06 ± 0.03 mg/L) and, for NO3-N, to the aerobic conditions that prevented denitrification.
The addition of graphene did not significantly influence the removal performance of TP, SO42−, Cl and MBAS (Figure 4) compared to the BC configuration (Table 3). Concentrations in input GW were 8.56 ± 1.44 mg/L for TP, 143.25 ± 13.30 mg/L for SO42−, 12.96 ± 3.35 mg/L for Cl and between 20.00–2010.00 mg/L for MBAS. Removal performances were quite low for these parameters for both configurations (TP 15.2 ± 11.6%|6.8 ± 13.0%, SO42− 23.7 ± 5.7%|20.6 ± 8.07%, Cl 43.3 ± 18.1%|44.8 ± 18.9% for BC|BC + GR respectively). An average release was observed for MBAS (−111 ± 258% for BC and −22 ± 77% for BC + GR). However, these values are influenced by the presence of a few outliers because concentrations fluctuated considerably over the sampling dates, as reflected by the high standard deviation values of removal efficiency. No temporal trend was found for any configuration regarding these parameters (Table 4).
E. coli concentration was adopted as biological indicator of output water quality. This parameter was analysed in five sampling dates, showing excellent performance for all configurations fed with GW. Even though the number of samples did not allow statistical comparison of the removal performances, the average removal efficiency was higher than 3 log units in all configurations, starting from an average E. coli concentration of 7 × 10⁴ MPN/100 mL in GW.

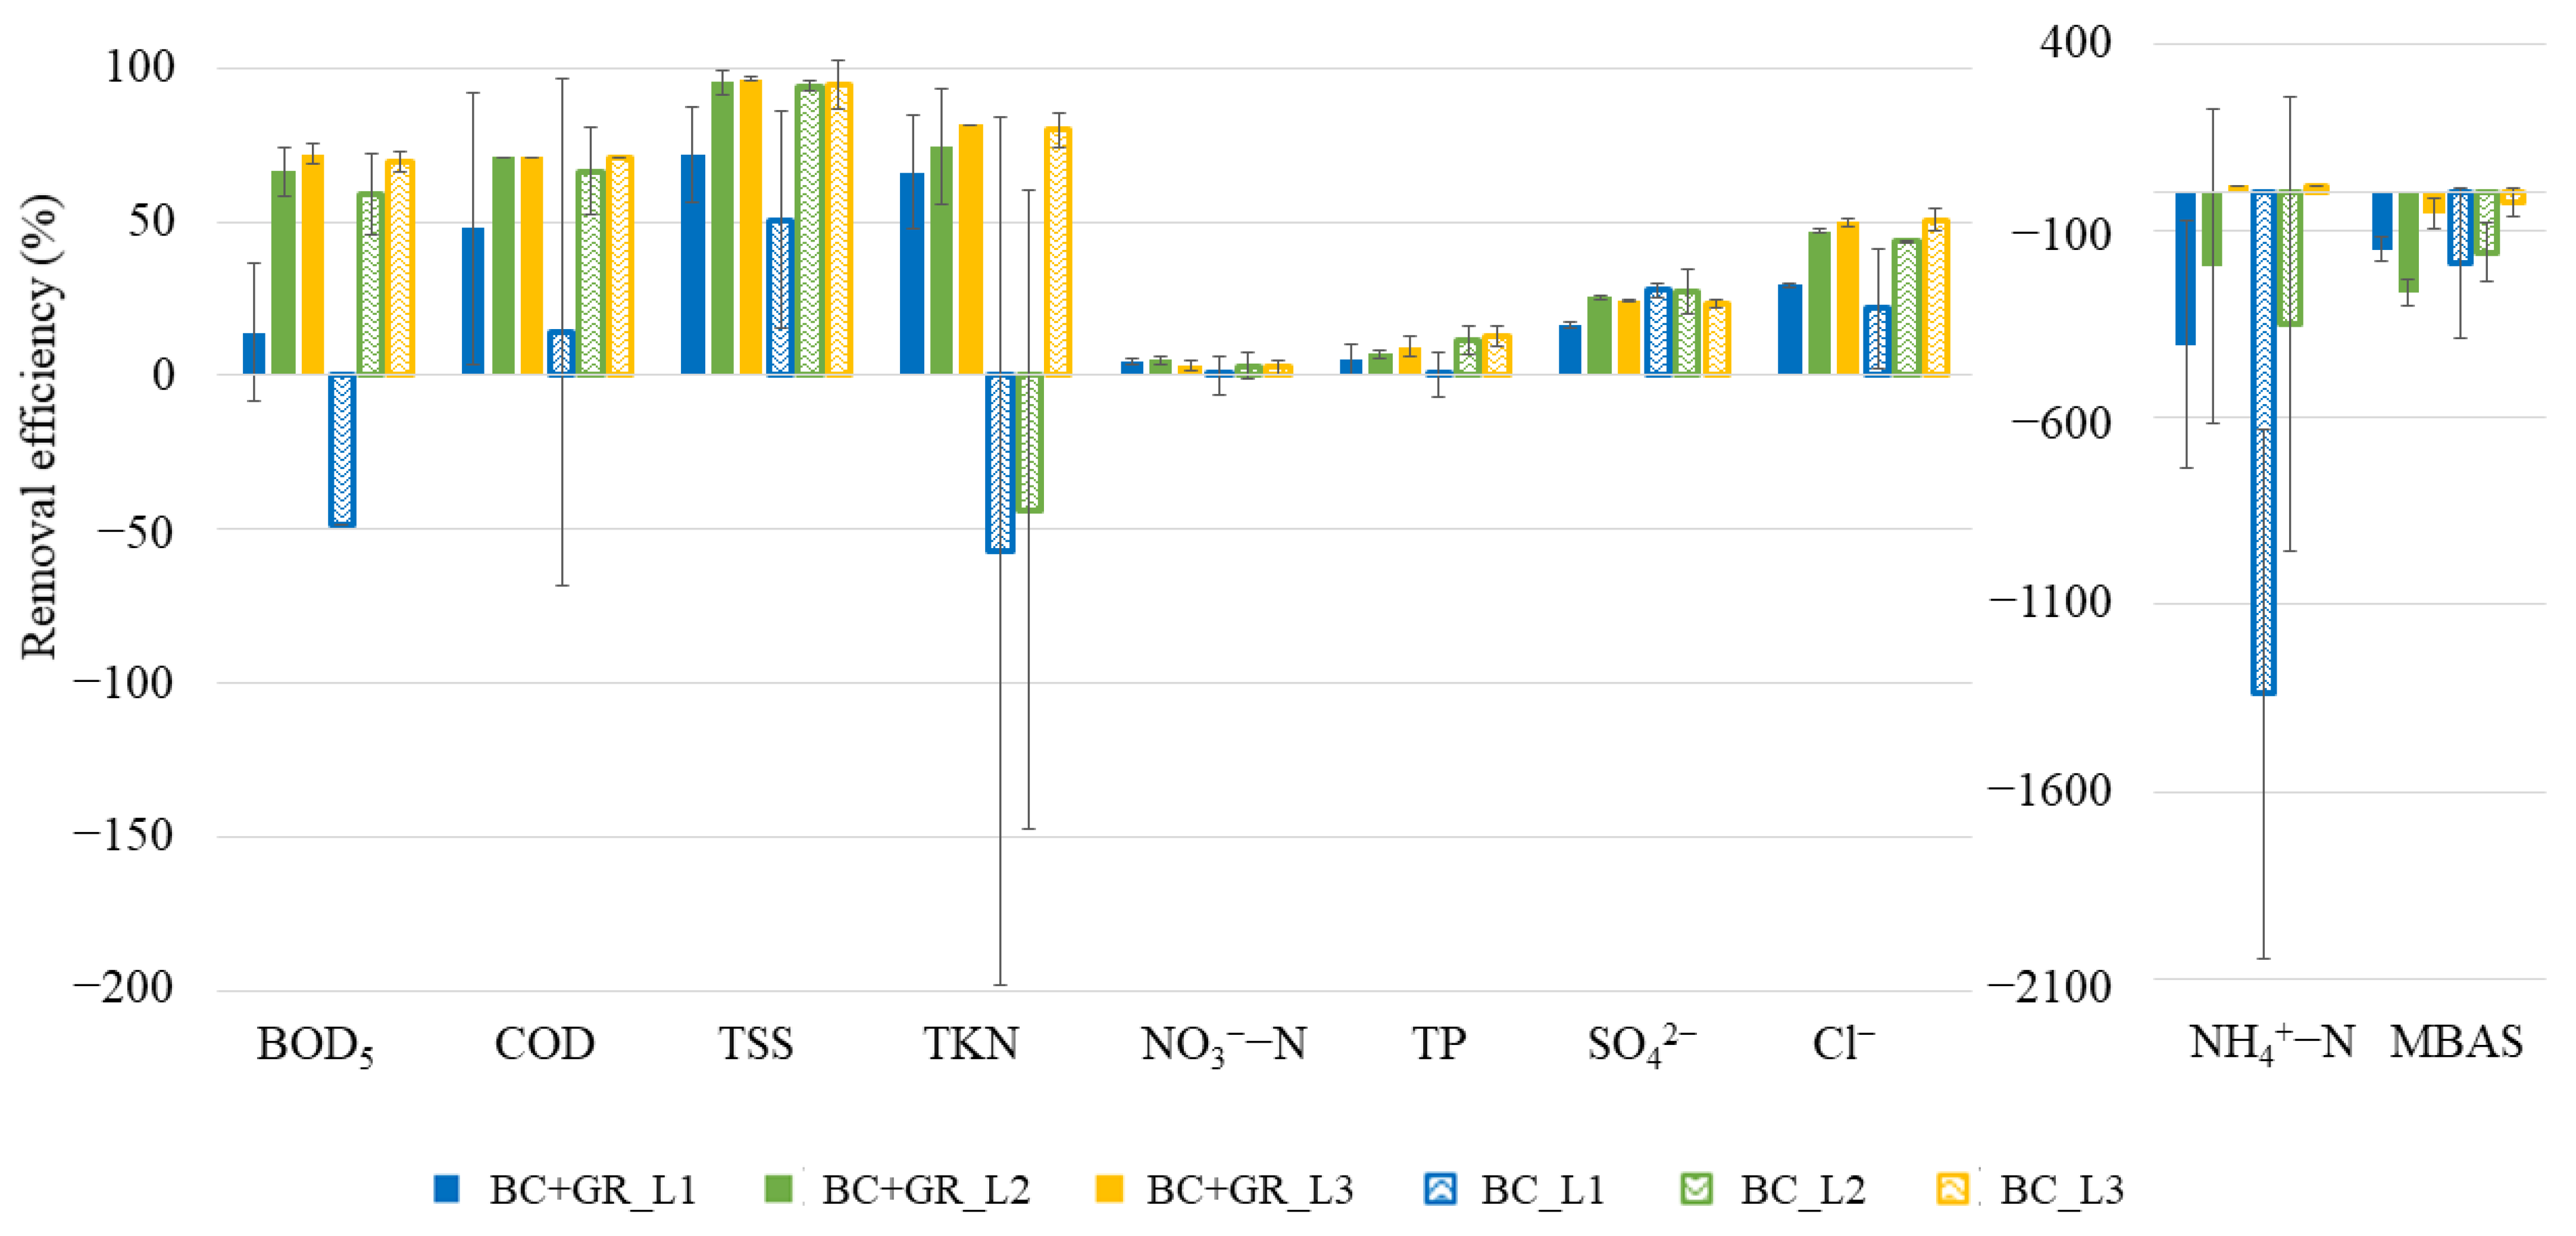
3.3. Effect of Different Levels on Removal Efficiency

Figure 5 displays the average removal efficiency after each level (i.e., row) of treatment for the two configurations with (BC + GR) and without graphene (BC) with the same age. The two configurations showed similar behaviour along the flow direction: the first and second levels together contributed to the most of removal, even though the first level of BC showed worse performances compared to BC + GR. For some parameters (i.e., BOD5 and TKN) there was even a release from the first level of BC. However, the performances of BC and BC + GR became similar in the second level (except for TKN). This behaviour suggests that the benefits of graphene were mostly visible for the first level, but the presence of the second level compensated the lower performance of the first level of BC. In general, the third level provided a marginal contribution to the removal efficiency for both configurations since the increase in performance was not relevant compared to the second level (except for TKN for BC). In the three sampling dates when intermediate levels were sampled, MBAS were released in both configurations and three levels were not enough to remove all the anionic surfactants.

4. Discussion

The biochar configuration showed a limited decrease in treatment performance after three months of operational time (BC_old) compared to a more recent configuration (BC). Removal performances for NH4+-N, TP and SO42− were lower for the older configuration compared to the new one. However, the differences in removal performance were limited for both TP and SO42−; a release of NH4+-N was observed from the older configuration, even though the outflow concentration was small (0.15 ± 0.19 mg/L). On the other hand, the older configuration was more efficient in removing BOD5 compared to the new one. Additional studies over longer monitoring periods on older green walls are required in the future to confirm these results on the performance of GW treatment [29].
The analysis of the configuration fed with tap water (BC + GR*) revealed that the addition of graphene did not cause any significant release of contaminants. The only relevant exception was the limited release of MBAS, which was, nevertheless, similar to the release observed in tap water in a previous system without graphene [14], and was hence not related to the additive itself. In general, the output values of the analysed parameters are congruent with a previous study based on coconut fibre and perlite fed with TW [14]. This finding opens the path to the possibility of employing graphene as an additive for the growing medium of a green wall and hence the prospect of evaluating if any advantage in terms of removal efficiency arises from the addition of graphene.
Considering the configurations fed with GW, no significant difference was found regardless of the inclusion of graphene. Output pH was coherent with literature values [19,22,29,30,31,32,33,34] and there was a slight increase compared to input values, possibly due to the mixture of coconut coir and perlite. EC was also close to literature values [19,29,30,35] for both mixes; DO concentrations demonstrated the good aeration of the system along the columns, which was as expected considering the characteristics of vertical flow systems [14,19,23]. BOD5 removal performances were satisfactory for both configurations, coherent with literature values [32,33], even if slightly lower than other studies that report performances over 95% [30,31,34,35,36]. COD removal was good (around 70%) but lower than many studies that removed over 80% [22,29,30,31,32,34,36], while TSS removal over 90% was also congruent with evidence in the literature [17,22,23,30,31,34]. The removal of nitrogen compounds was higher than in previous studies [14,19,32,36] but lower than in some literature cases [22,29,30,33,34], possibly due to the relatively low nitrogen concentrations of the current study. Input values of TP were within the literature range [22,23,32] while removal efficiency results were lower compared to literature evidence [19,22,32], even if TP removal varies widely among studies [17,19,22]. TP removal was found to be lower for BC + GR than for BC, but the difference was not statistically significant. MBAS showed very high variability in input GW and output samples. However, since the 25th and 75th percentiles are comparable for input and output samples of all configurations, average values were likely influenced by a few possible outliers, suggesting that MBAS results are affected by more uncertainty than other parameters. E. coli removal efficiency was excellent, as expected from performances reported in previous green wall studies [14,19,22,35]. Overall, no evidence was found in the present study that the addition of graphene significantly improves the system’s performance compared to the other configurations. Apparently, the benefits provided by the inclusion of graphene were marginal (and limited to the first level of the system) compared to the already high treatment performance of the other materials (e.g., coconut fibre, perlite and biochar) used as filter media. Considering the higher costs, the use of graphene is not recommended in the practical application of green walls for GW treatment, except for very compact systems with a single level of pots. However, it should be stressed that graphene could still contribute to removing specific compounds (e.g., organic micropollutants) that were not analysed in this work.
In terms of the removal efficiency of each level of treatment, the study by Prodanovic et al. [22] found that the first level was the most effective for GW treatment. However, our analysis showed that the second level of treatment also contributed remarkably to removal efficiency. The difference probably derives from the different operational conditions of the studies in terms of HLR and filter medium composition. For the present study, even though the performance of each level could have been influenced by the plant type, the experimental design was not aimed at specifically analysing this contribution, since no variation of plant position among levels was performed. However, previous studies [23,37] report a relatively limited impact of plant species on removal efficiency, and the low contribution of the third level observed in the present study suggests that the overall number and height of treatment levels play a pivotal role in treatment efficiency. Further studies considering a higher number of samples are warranted to obtain more evidence on the role of each level in removal performances, thus helping the correct design of green walls for GW treatment.
For all configurations, the characteristics of treated GW are in line with many country regulations and guidelines (e.g., Germany, United Kingdom, and Canada) [1]. TP concentration could represent a problem for some more restrictive regulations (e.g., Italy), and in these cases, additional levels of treatment could be added to reach the requirements for reuse in irrigation, street washing or household contexts (e.g., toilet flushing). Future studies should provide more information about the resilience of the system toward GW variations, in terms of flow rate and composition, in order to better understand the green wall performance in realistic conditions with actual GW application and to allow a deeper comparison with other decentralised treatment systems [38].

5. Conclusions

The mix of coconut fibre, perlite, biochar and graphene showed good performance for most of the tested parameters. The removal of BOD5, COD, TSS and nitrogen compounds was satisfactory, and E. coli removal efficiency was excellent. In terms of removal efficiency, the operational time determined a slight decrease in treatment performance for some parameters (TP, SO42− and NH4+-N).
The possible release of compounds from graphene was evaluated by testing a configuration fed with tap water, and the analysis revealed that the addition of graphene did not cause any significant release of contaminants compared to the original filtering medium. However, the benefits provided by the addition of graphene were significant only for the first level of the green wall. Instead, no evidence was found that graphene significantly improved the whole system’s performance compared to the configuration without graphene (i.e., coconut fibre, perlite and biochar), probably because of the already high treatment performance of the other materials in the filter medium.

Author Contributions

Conceptualization, methodology and supervision: F.B. and S.F.; writing—original draft preparation: E.C.; experimental investigation: E.C. and A.C.; writing—review and editing: all authors; funding acquisition and project administration: F.B. All authors have read and agreed to the published version of the manuscript.

Funding

This research was funded by Compagnia di San Paolo through the project “SuperGreen—SUstainable Purification of wastewatER with GREEN walls”.

Data Availability Statement

The data presented in this study are available on request from the corresponding author.

Acknowledgments

The authors declare no competing financial interest. The authors gratefully acknowledge AgriNewTech (www.agrinewtech.com/en/ accessed on 26 December 2022) for providing the biochar.

Conflicts of Interest

The authors declare no conflict of interest.

References

  1. Boano, F.; Caruso, A.; Costamagna, E.; Ridolfi, L.; Fiore, S.; Demichelis, F.; Galvão, A.; Pisoeiro, J.; Rizzo, A.; Masi, F. A review of nature-based solutions for greywater treatment: Applications, hydraulic design, and environmental benefits. Sci. Total Environ. 2020, 711, 134731. [Google Scholar] [CrossRef] [PubMed]
  2. Priya, U.K.; Senthil, R. A review of the impact of the green landscape interventions on the urban microclimate of tropical areas. Build. Environ. 2021, 205, 108190. [Google Scholar] [CrossRef]
  3. Blanco, I.; Convertino, F.; Schettini, E.; Vox, G. Energy analysis of a green façade in summer: An experimental test in Mediterranean climate conditions. Energy Build. 2021, 245, 111076. [Google Scholar] [CrossRef]
  4. Cameron, R.W.F.; Taylor, J.E.; Emmett, M.R. What’s “cool” in the world of green façades? How plant choice influences the cooling properties of green walls. Build. Environ. 2014, 73, 198–207. [Google Scholar] [CrossRef] [Green Version]
  5. Castellar da Cunha, J.A.; Arias, C.A.; Carvalho, P.; Rysulova, M.; Canals, J.M.; Pérez, G.; Bosch, M.G.; Morató, J.F. “WETWALL”—An innovative design concept for the treatment of wastewater at an urban scale. Desalin. Water Treat. 2018, 109, 205–220. [Google Scholar] [CrossRef] [Green Version]
  6. Francis, R.A.; Lorimer, J. Urban reconciliation ecology: The potential of living roofs and walls. J. Environ. Manag. 2011, 92, 1429–1437. [Google Scholar] [CrossRef] [PubMed]
  7. Medl, A.; Stangl, R.; Florineth, F. Vertical greening systems—A review on recent technologies and research advancement. Build. Environ. 2017, 125, 227–239. [Google Scholar] [CrossRef]
  8. Pearlmutter, D.; Pucher, B.; Calheiros, C.S.C.; Hoffmann, K.A.; Aicher, A.; Pinho, P.; Stracqualursi, A.; Korolova, A.; Pobric, A.; Galvão, A.; et al. Closing water cycles in the built environment through nature-based solutions: The contribution of vertical greening systems and green roofs. Water 2021, 13, 2165. [Google Scholar] [CrossRef]
  9. Allen, L.; Christian-Smith, J.; Palaniappan, M. Overview of Greywater Reuse: The Potential of Greywater Systems to Aid Sustainable Water Management; Pacific Institute: Cedar Rapids, IA, USA, 2010; ISBN 9781893790292. [Google Scholar]
  10. Arden, S.; Ma, X. Constructed wetlands for greywater recycle and reuse: A review. Sci. Total Environ. 2018, 630, 587–599. [Google Scholar] [CrossRef]
  11. Maimon, A.; Gross, A. Greywater: Limitations and perspective. Curr. Opin. Environ. Sci. Health 2018, 2, 1–6. [Google Scholar] [CrossRef]
  12. Capodaglio, A.G. Taking the water out of “wastewater”: An ineluctable oxymoron for urban water cycle sustainability. Water Environ. Res. 2020, 92, 2030–2040. [Google Scholar] [CrossRef] [PubMed]
  13. Prodanovic, V.; Hatt, B.; McCarthy, D.; Zhang, K.; Deletic, A. Green walls for greywater reuse: Understanding the role of media on pollutant removal. Ecol. Eng. 2017, 102, 625–635. [Google Scholar] [CrossRef]
  14. Boano, F.; Caruso, A.; Costamagna, E.; Fiore, S.; Demichelis, F.; Galvão, A.; Pisoeiro, J.; Rizzo, A.; Masi, F. Assessment of the Treatment Performance of an Open-Air Green Wall Fed with Graywater under Winter Conditions. ACS EST Water 2021, 1, 595–602. [Google Scholar] [CrossRef]
  15. Pradhan, S.; Helal, M.I.; Al-Ghamdi, S.G.; Mackey, H.R. Performance evaluation of various individual and mixed media for greywater treatment in vertical nature-based systems. Chemosphere 2020, 245, 125564. [Google Scholar] [CrossRef] [PubMed]
  16. Masi, F.; Rizzo, A.; Bresciani, R.; Edathoot, A.; Patwardhan, N.; Panse, D. Greywater Treatment and Reuse in a Municipal Office in Pune by Vertical Gardens. Sustain. Sanit. Pract. 2016, 25, 28–33. [Google Scholar]
  17. Fowdar, H.S.; Hatt, B.E.; Breen, P.; Cook, P.L.M.; Deletic, A. Designing living walls for greywater treatment. Water Res. 2017, 110, 218–232. [Google Scholar] [CrossRef]
  18. Masi, F.; Bresciani, R.; Rizzo, A.; Edathoot, A.; Patwardhan, N.; Panse, D.; Langergraber, G. Green walls for greywater treatment and recycling in dense urban areas: A case-study in Pune. J. Water Sanit. Hyg. Dev. 2016, 6, 342–347. [Google Scholar] [CrossRef] [Green Version]
  19. Boano, F.; Costamagna, E.; Caruso, A.; Fiore, S.; Chiappero, M.; Pisoeiro, J.; Rizzo, A.; Masi, F.; Galv, A. Evaluation of the influence of filter medium composition on treatment performances in an open-air green wall fed with greywater. J. Environ. Manag. 2021, 300, 113646. [Google Scholar] [CrossRef]
  20. Wang, N.; Zhang, Y.; Zhu, F.; Li, J.; Liu, S.; Na, P. Adsorption of soluble oil from water to graphene. Environ. Sci. Pollut. Res. 2014, 21, 6495–6505. [Google Scholar] [CrossRef]
  21. Nidheesh, P.V. Graphene-based materials supported advanced oxidation processes for water and wastewater treatment: A review. Environ. Sci. Pollut. Res. 2017, 24, 27047–27069. [Google Scholar] [CrossRef]
  22. Prodanovic, V.; Hatt, B.; Mccarthy, D.; Deletic, A. Green wall height and design optimisation for effective greywater pollution treatment and reuse. J. Environ. Manag. 2020, 261, 110173. [Google Scholar] [CrossRef] [PubMed]
  23. Kotsia, D.; Deligianni, A.; Fyllas, N.M.; Stasinakis, A.S.; Fountoulakis, M.S. Converting treatment wetlands into “treatment gardens”: Use of ornamental plants for greywater treatment. Sci. Total Environ. 2020, 744, 140889. [Google Scholar] [CrossRef] [PubMed]
  24. Pérez, G.; Rincón, L.; Vila, A.; González, J.M.; Cabeza, L.F. Behaviour of green facades in Mediterranean Continental climate. Energy Convers. Manag. 2011, 52, 1861–1867. [Google Scholar] [CrossRef]
  25. Rysulova, M.; Kaposztasova, D.; Vranayova, Z. Green Walls as an Approach in Grey Water Treatment. In IOP Conference Series: Materials Science and Engineering; IOP Publishing: Bristol, UK, 2017; p. 072049. [Google Scholar]
  26. Serra, V.; Bianco, L.; Candelari, E.; Giordano, R.; Montacchini, E.; Tedesco, S.; Larcher, F.; Schiavi, A. A novel vertical greenery module system for building envelopes: The results and outcomes of a multidisciplinary research project. Energy Build. 2017, 146, 333–352. [Google Scholar] [CrossRef]
  27. Diaper, C.; Toifl, M.; Storey, M.V. Greywater Technology Testing Protocol. In CSIRO: Water for a Healthy Country National Research Flagship; CSIRO Australia: Canberra, Australia, 2008. [Google Scholar]
  28. Benjamini, Y.; Hochberg, Y. Controlling the false discovery rate: A practical and powerful approach to multiple testing. J. R. Stat. Soc. Ser. B 1995, 57, 289–300. [Google Scholar] [CrossRef]
  29. Pucher, B.; Zluwa, I.; Spörl, P.; Pitha, U.; Langergraber, G. Evaluation of the multifunctionality of a vertical greening system using different irrigation strategies on cooling, plant development and greywater use. Sci. Total Environ. 2022, 849, 157842. [Google Scholar] [CrossRef]
  30. Gattringer, H.; Claret, A.; Radtke, M.; Kisser, J.; Zraunig, A.; Rodriguez-Roda, I.; Buttiglieri, G. Novel vertical ecosystem for sustainable water treatment and reuse in tourist resorts. Int. J. Sustain. Dev. Plan. 2016, 11, 263–274. [Google Scholar] [CrossRef] [Green Version]
  31. Bakheet, B.; Prodanovic, V.; Deletic, A.; McCarthy, D. Effective treatment of greywater via green wall biofiltration and electrochemical disinfection. Water Res. 2020, 185, 116228. [Google Scholar] [CrossRef]
  32. Dal Ferro, N.; De Mattia, C.; Gandini, M.A.; Maucieri, C.; Stevanato, P.; Squartini, A.; Borin, M. Green walls to treat kitchen greywater in urban areas: Performance from a pilot-scale experiment. Sci. Total Environ. 2021, 757, 144189. [Google Scholar] [CrossRef]
  33. Lakho, F.H.; Vergote, J.; Ihsan-Ul-Haq Khan, H.; Depuydt, V.; Depreeuw, T.; Van Hulle, S.W.H.; Rousseau, D.P.L. Total value wall: Full scale demonstration of a green wall for grey water treatment and recycling. J. Environ. Manag. 2021, 298, 113489. [Google Scholar] [CrossRef]
  34. Lakho, F.H.; Qureshi, A.; Novelli, L.D.D.; Depuydt, V.; Depreeuw, T.; Van Hulle, S.W.H.; Rousseau, D.P.L. Performance of a green wall (Total Value WallTM) at high greywater loading rates and Life Cycle Impact Assessment. Sci. Total Environ. 2022, 821, 153470. [Google Scholar] [CrossRef] [PubMed]
  35. Estelrich, M.; Vosse, J.; Comas, J.; Atanasova, N.; Costa, J.C.; Gattringer, H.; Buttiglieri, G. Feasibility of vertical ecosystem for sustainable water treatment and reuse in touristic resorts. J. Environ. Manag. 2021, 294, 112968. [Google Scholar] [CrossRef] [PubMed]
  36. Zraunig, A.; Estelrich, M.; Gattringer, H.; Kisser, J.; Langergraber, G.; Radtke, M.; Rodriguez-Roda, I.; Buttiglieri, G. Long term decentralized greywater treatment for water reuse purposes in a tourist facility by vertical ecosystem. Ecol. Eng. 2019, 138, 138–147. [Google Scholar] [CrossRef]
  37. Prodanovic, V.; McCarthy, D.; Hatt, B.; Deletic, A. Designing green walls for greywater treatment: The role of plants and operational factors on nutrient removal. Ecol. Eng. 2019, 130, 184–195. [Google Scholar] [CrossRef]
  38. Cecconet, D.; Callegari, A.; Hlavínek, P.; Capodaglio, A.G. Membrane bioreactors for sustainable, fit-for-purpose greywater treatment: A critical review. Clean Technol. Environ. Policy 2019, 21, 745–762. [Google Scholar] [CrossRef]
Figure 1. One of the four tested modules of the green wall system.
Water 15 00195 g001
Figure 2. Values of the parameters measured on-site on input (TW and GW) and output samples from all configurations ((a): pH, (b): Temperature, (c): EC, (d): DO). Median value (red line), 25th and 75th percentiles (blue box), range (black whiskers) and outliers (red cross) are shown.
Water 15 00195 g002
Figure 3. Values of the parameters measured off-site on input (TW and GW) and output samples from all configurations ((a): BOD5, (b): TSS, (c): TKN, (d): NO3-N). Median value (red line), 25th and 75th percentiles (blue box), range (black whiskers) and outliers (red cross) are shown.
Water 15 00195 g003
Figure 4. Values of the parameters measured off-site on input (TW and GW) and output water from all configurations ((a): TP, (b): SO42−, (c): Cl, (d): MBAS). Median value (red line), 25th and 75th percentiles (blue box), range (black whiskers) and outliers (red cross) are shown.
Water 15 00195 g004
Figure 5. Removal efficiency for different treatment levels.
Water 15 00195 g005
Table 1. Details on the tested configurations (% by volume).
ConfigurationInputTested Mixture (ID)Deployment Date
biochargreywater64% coconut fibre + 16% perlite+ 20% biochar (BC_old)January 2019
greywater64% coconut fibre + 16% perlite + 20% biochar (BC)April 2019
biochar + graphenegreywater61% coconut fibre + 15% perlite + 19% BC + 5% Graphene (BC + GR)April 2019
tap water61% coconut fibre + 15% perlite + 19% BC + 5% Graphene (BC + GR*)April 2019
Table 2. Composition of the synthetic greywater (GW) used in this study.
ProductBrandAmount (g) in 100 L
BodycreamLeocrema1.50
ToothpastePasta del Capitano3.25
DeodorantSauber and Prep1.00
HandsoapDermomed72.00
LaundrySoft15.00
Na2SO4analytical grade3.50
NaHCO3analytical grade2.50
Na2PO4analytical grade3.90
Claybentonitic5.00
Boric acidanalytical grade0.14
Lactic acidanalytical grade2.80
Table 3. p-values of the t-Student test comparing removal efficiency of each configuration. Bold numbers indicate that the tested configuration performed significantly better that the reference one. Asterisks confirm the test significance after false discovery rate adjustment. NaN occurs when all values were below the detection limit.
Does BC configuration perform significantly better than the others? (on removal efficiency)
BOD5CODTSSTKNNO3-NNH4+-NTPSO42−ClMBAS
BC_old0.973NaN0.2430.0940.0920.048 *0.007 *0.003 *0.8300.391
BC + GR0.498NaN0.9550.1770.798NaN0.1230.1390.8420.846
Does BC_old configuration perform significantly better than the others? (on removal efficiency)
BOD5CODTSSTKNNO3-NNH4+-NTPSO42−ClMBAS
BC0.027NaN0.7570.9060.9080.9520.9930.9970.1700.609
BC + GR0.241NaN0.9750.9170.9870.9520.5090.8640.2380.818
Does BC + GR configuration perform significantly better than the others? (on removal efficiency)
BOD5CODTSSTKNNO3-NNH4+-NTPSO42−ClMBAS
BC0.502NaN0.045 *0.8230.202NaN0.8770.8610.1580.154
BC_old0.759NaN0.025 *0.0830.013 *0.048 *0.4910.1360.7620.182
Is the output concentration of BC + GR* significantly higher than input TW? (on concentrations)
BOD5CODTSSTKNNO3-NNH4+-NTPSO42−ClMBAS
0.110NaN0.0690.9290.0660.3610.0990.0960.0920.000
Table 4. p-values of Mann-Kendall test on on-site parameters measurements and laboratory parameter removal efficiency. Bold numbers indicate an increasing trend (p < 0.05) in the temporal series; asterisks confirm the trend after false discovery rate adjustment. NaN occurs when all values in a data set are below the detection limit.
Parameters
MixpHTECDOBOD5CODTSSTKNNO3-NNH4+-NTPSO42−ClMBAS
BC0.7110.1081.0000.1080.4521.0000.2660.4541.0001.0000.7110.7110.0190.368
BC_old0.1740.1080.7110.2300.2600.8790.0631.0000.5360.2880.9020.7110.9020.764
BC + GR0.0350.1081.0000.0350.1811.0000.3860.3860.2121.0000.1741.0000.2660.764
BC + GR*0.7110.0350.3860.0631.000NaN0.7070.0630.4541.0000.5920.1740.7111.000
Disclaimer/Publisher’s Note: The statements, opinions and data contained in all publications are solely those of the individual author(s) and contributor(s) and not of MDPI and/or the editor(s). MDPI and/or the editor(s) disclaim responsibility for any injury to people or property resulting from any ideas, methods, instructions or products referred to in the content.

