


Impact of Inorganic Solutes’ Release in Groundwater during Oil Shale In Situ Exploitation

Abstract
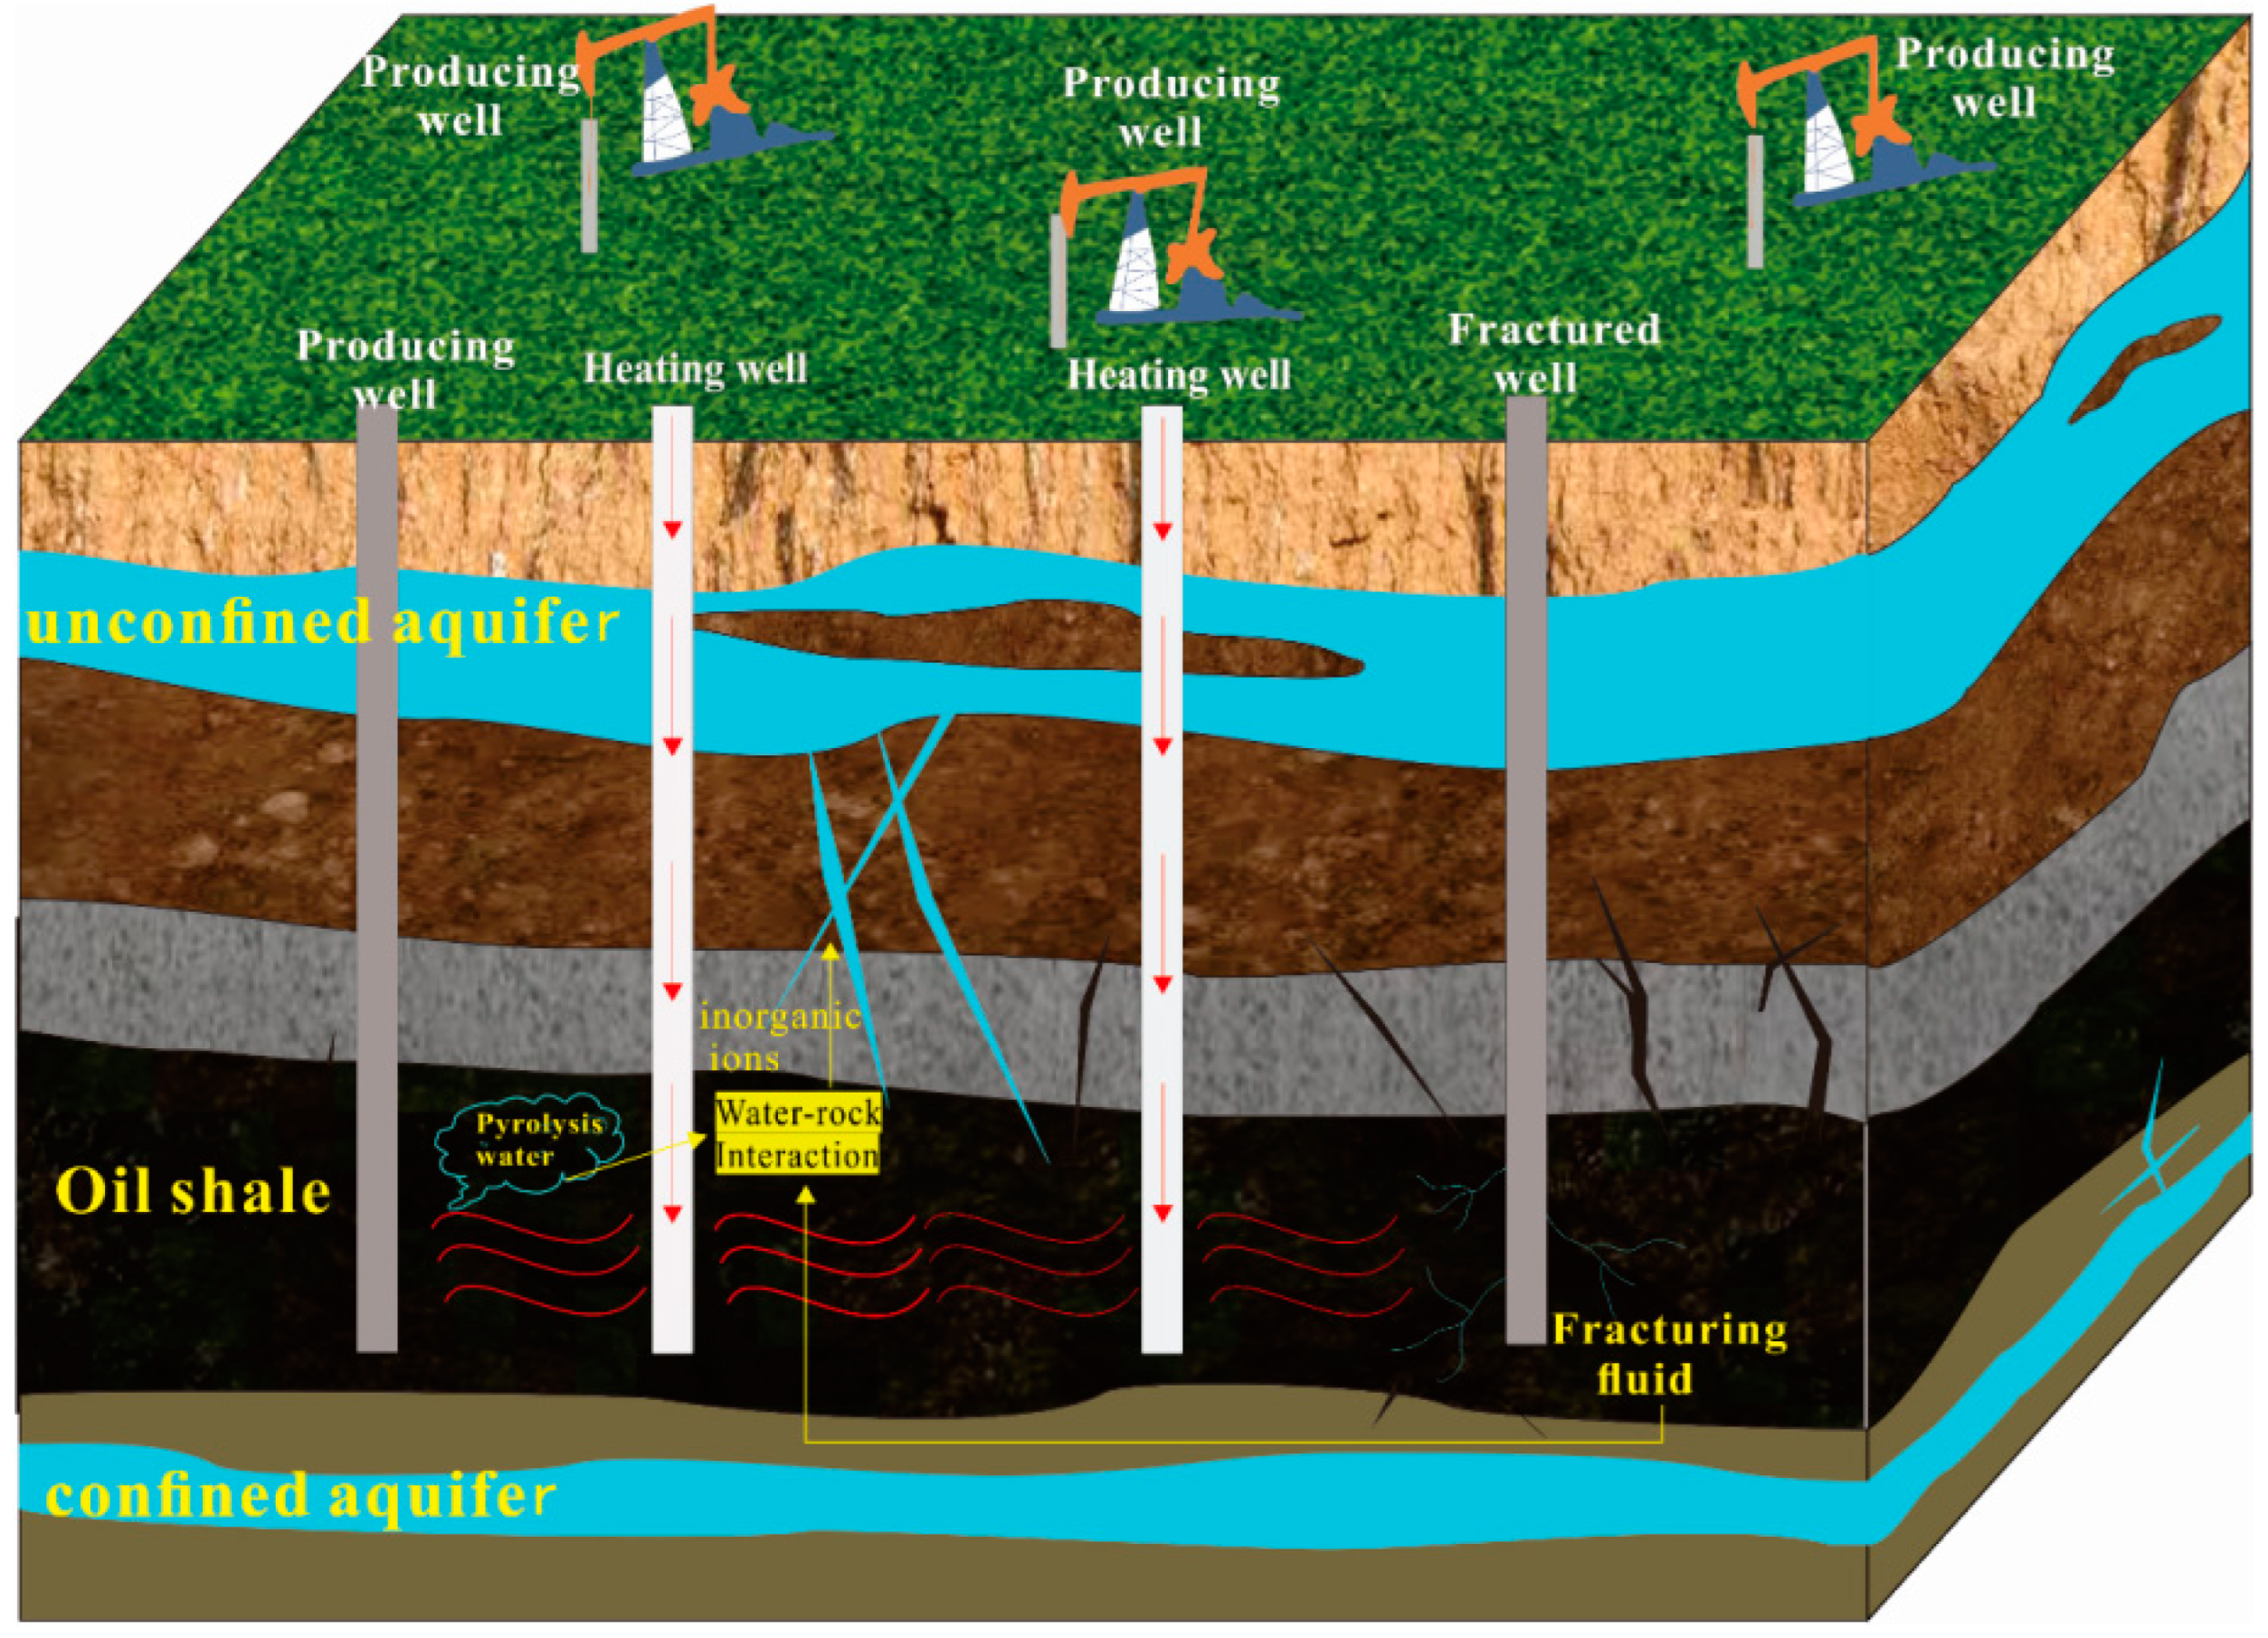
1. Introduction
2. Materials and Methods
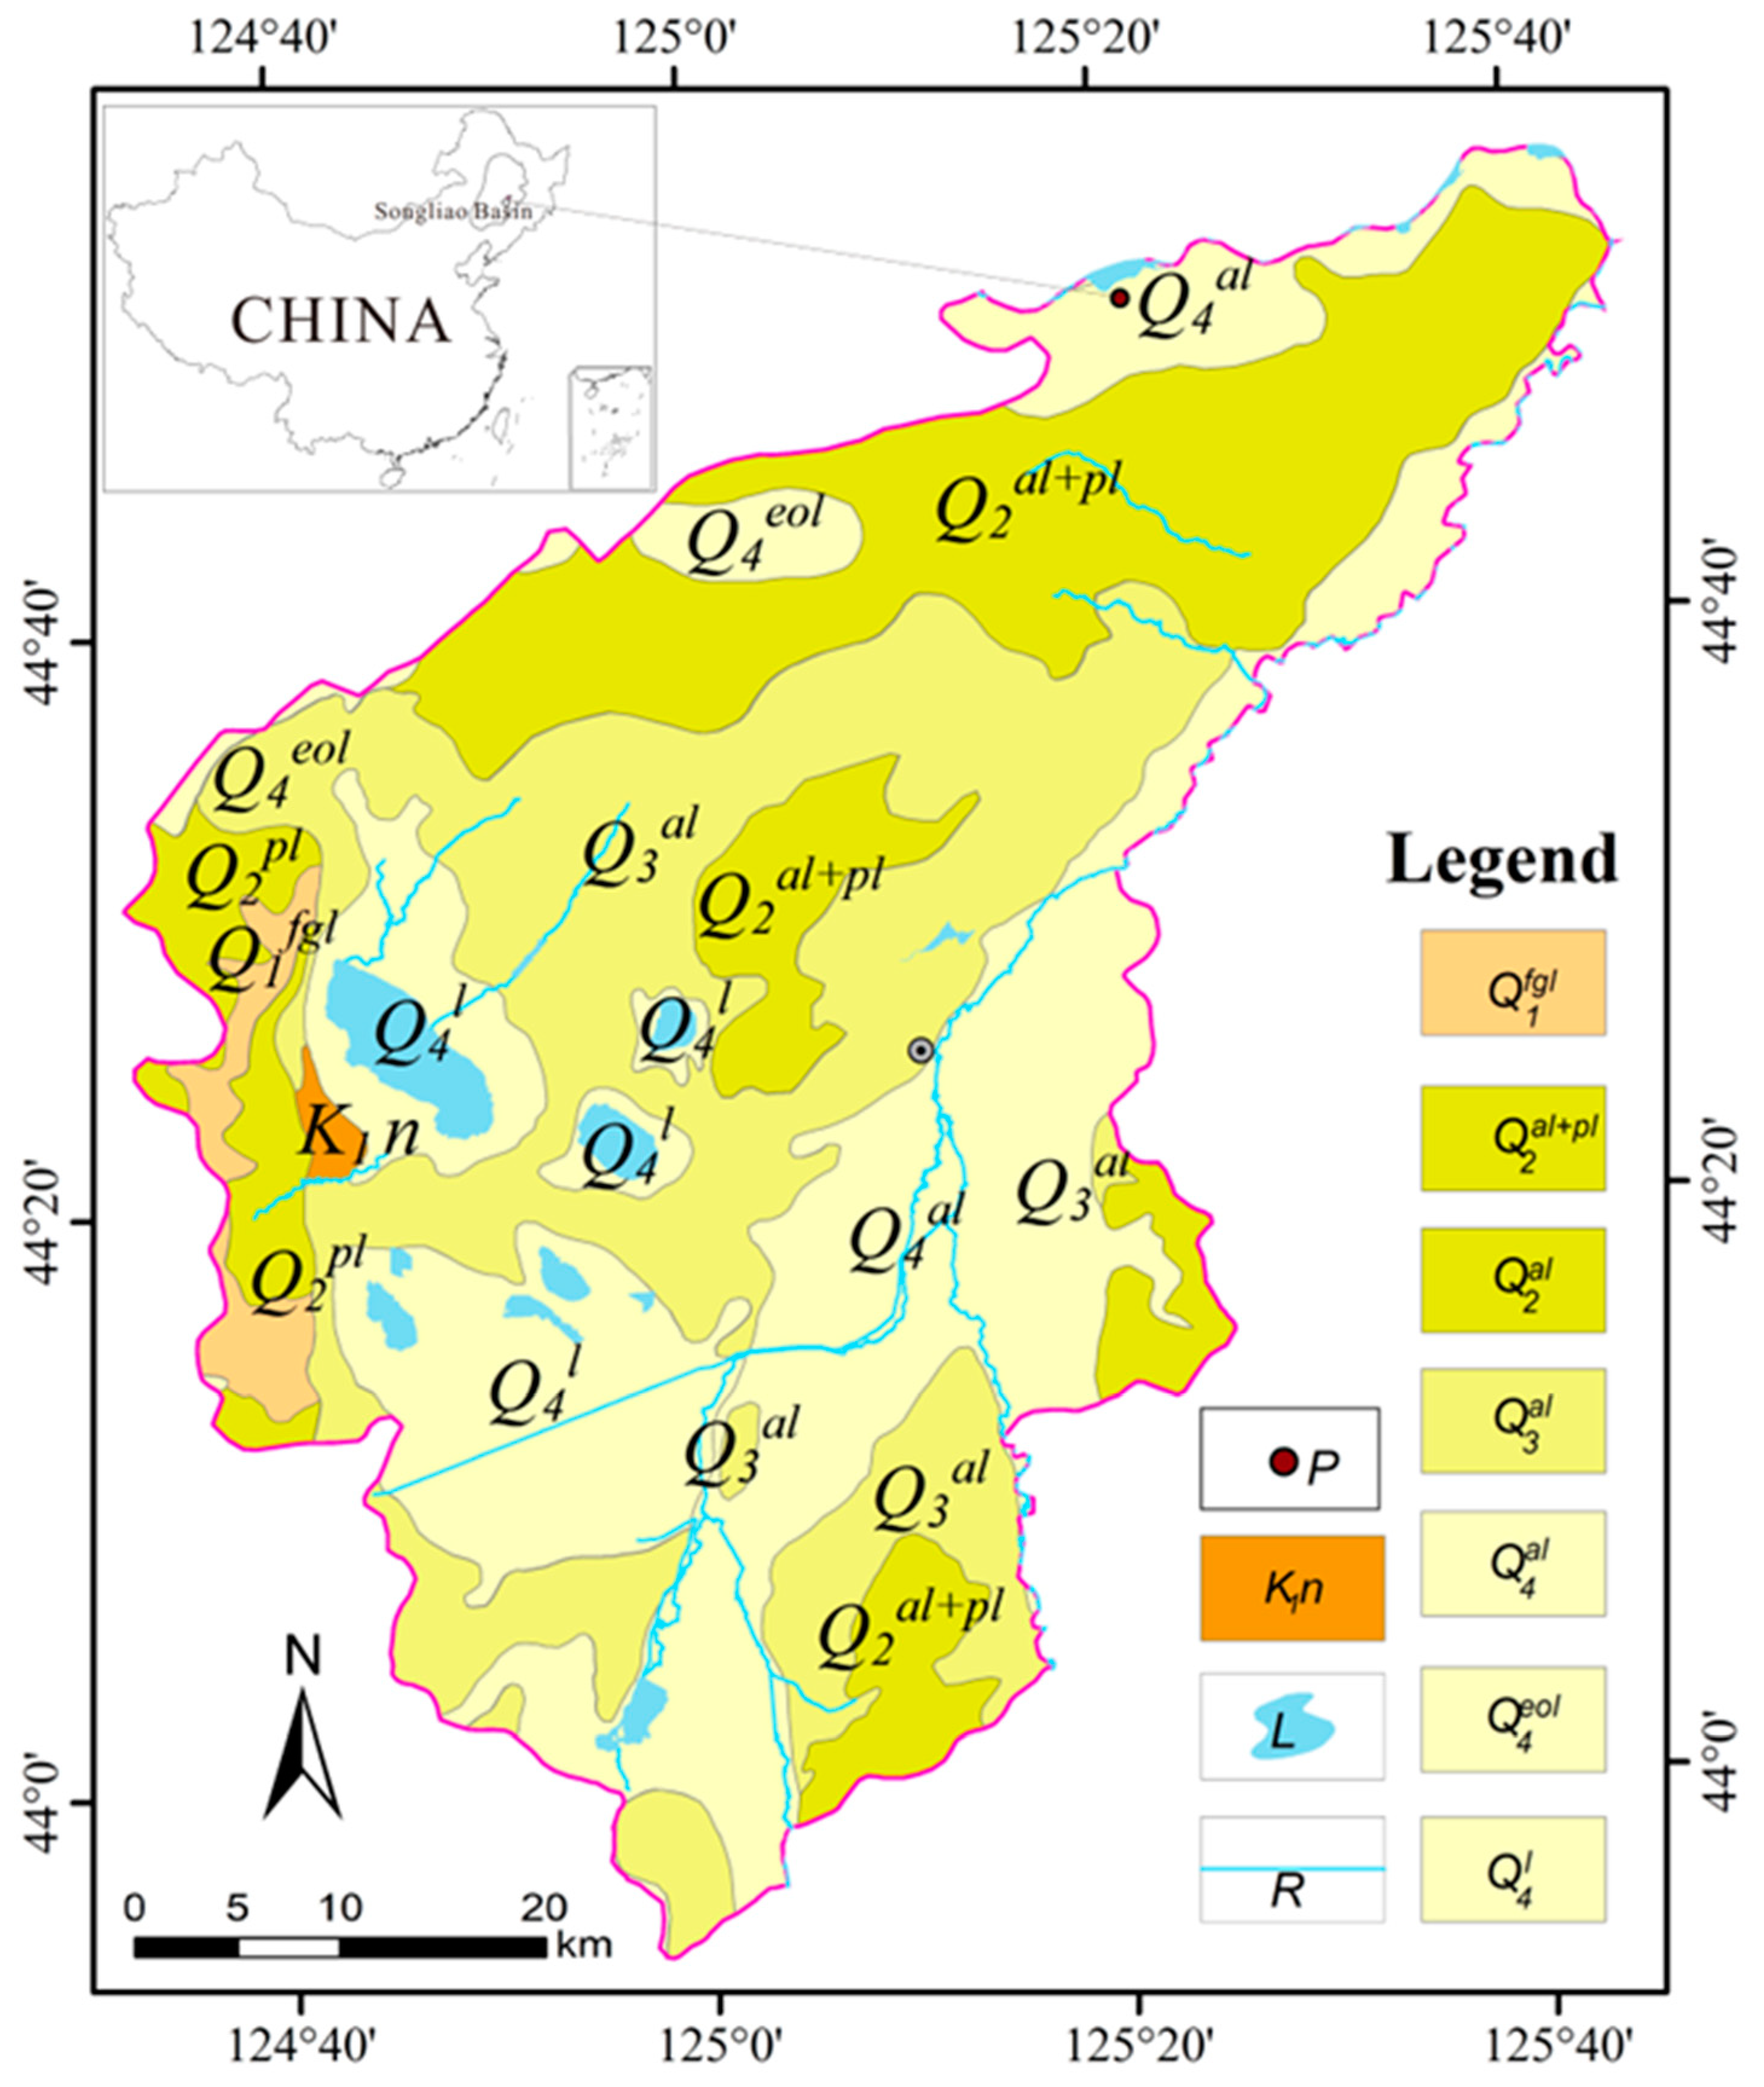
2.1. Study Area and Samples
2.2. Experiment of Water–Rock Interaction
2.3. Cation and Anion Content Determination
2.4. Analysis Method of Data
3. Results
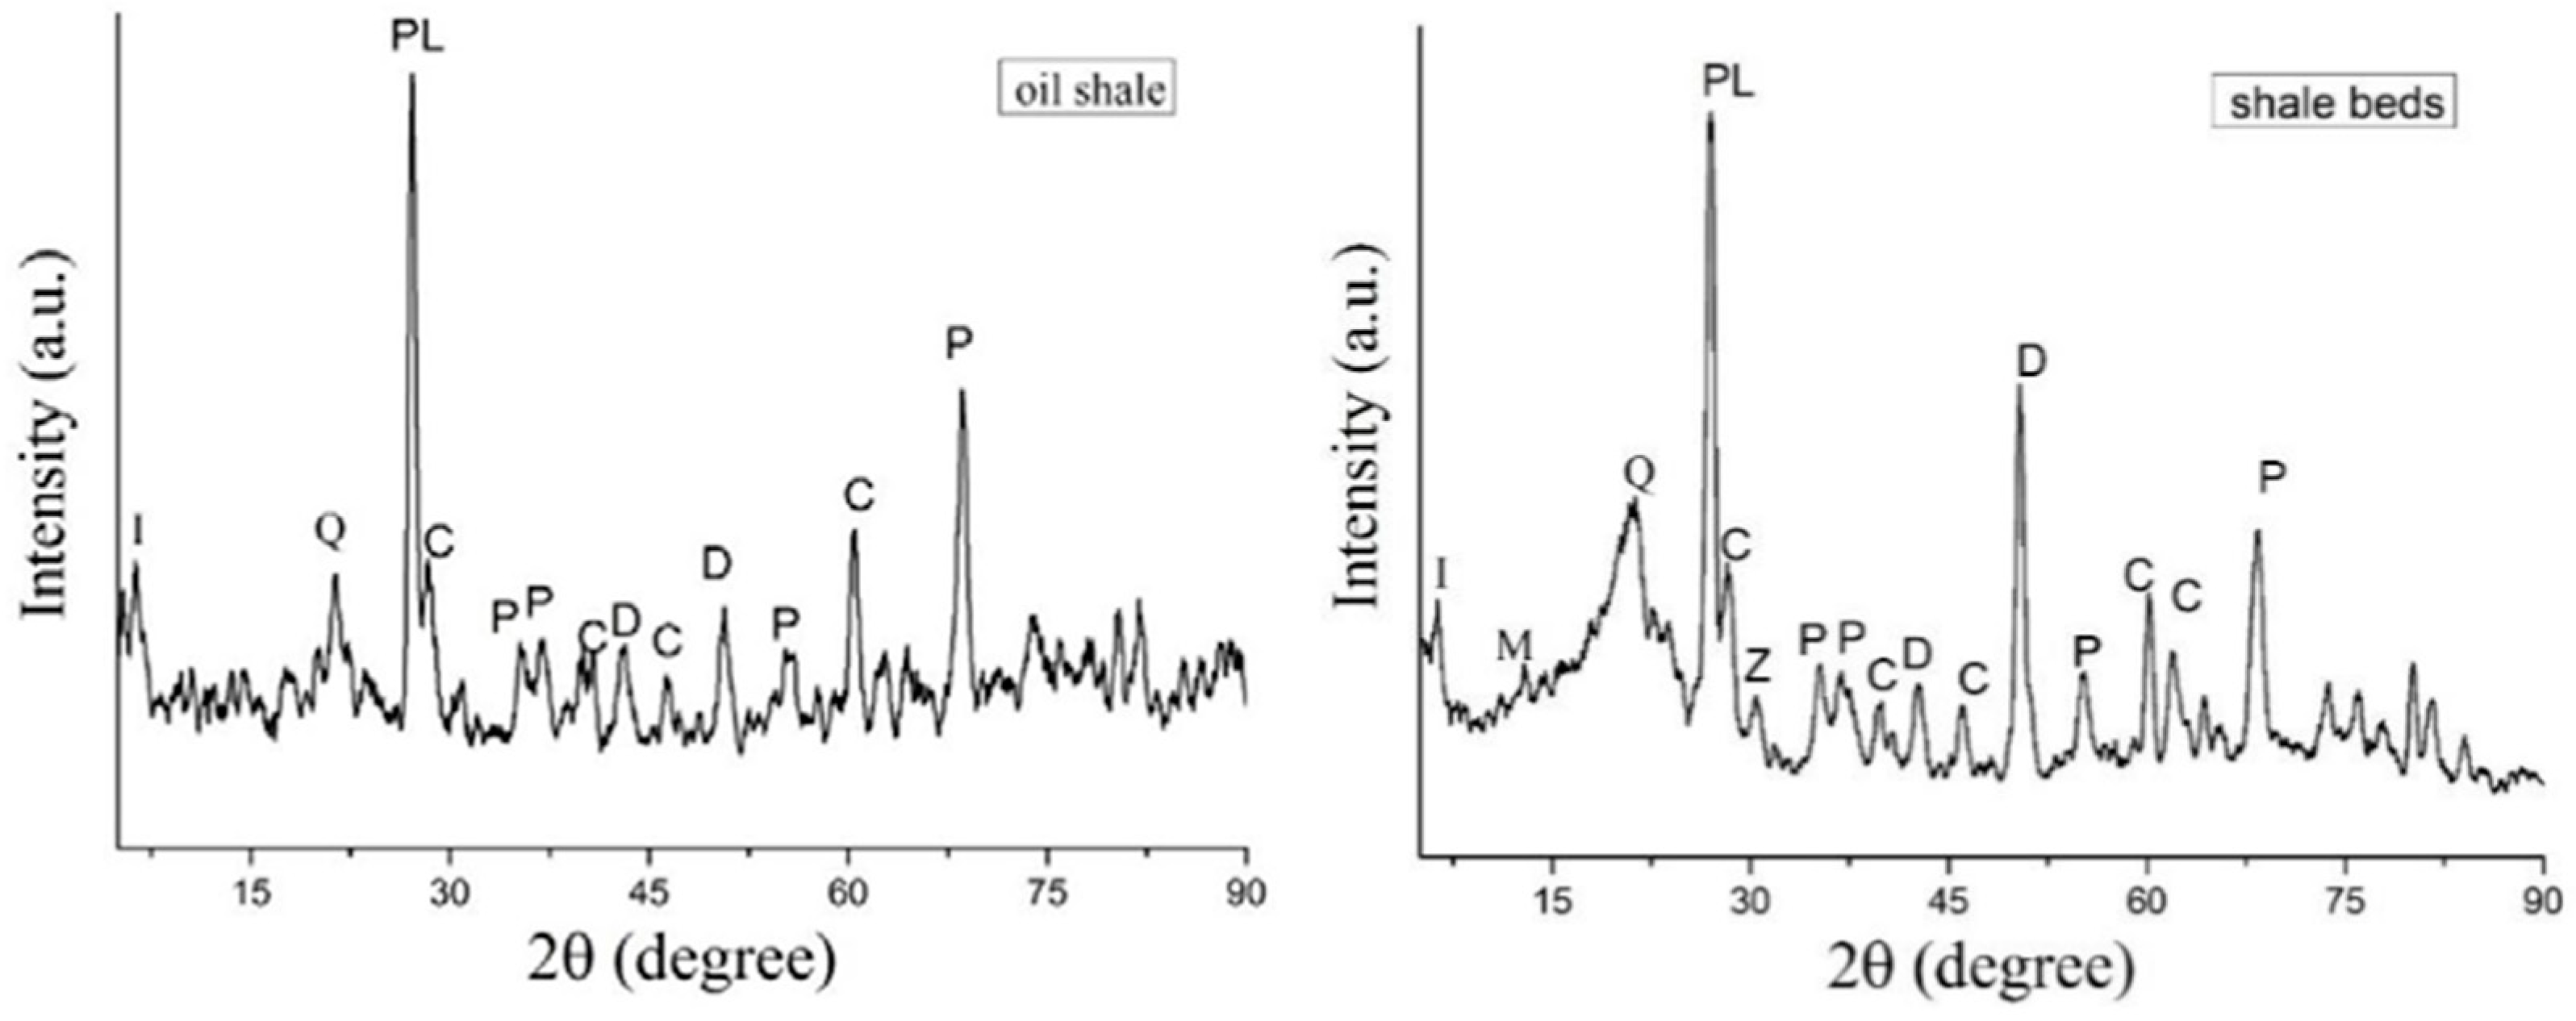
3.1. Mineral Composition of Samples
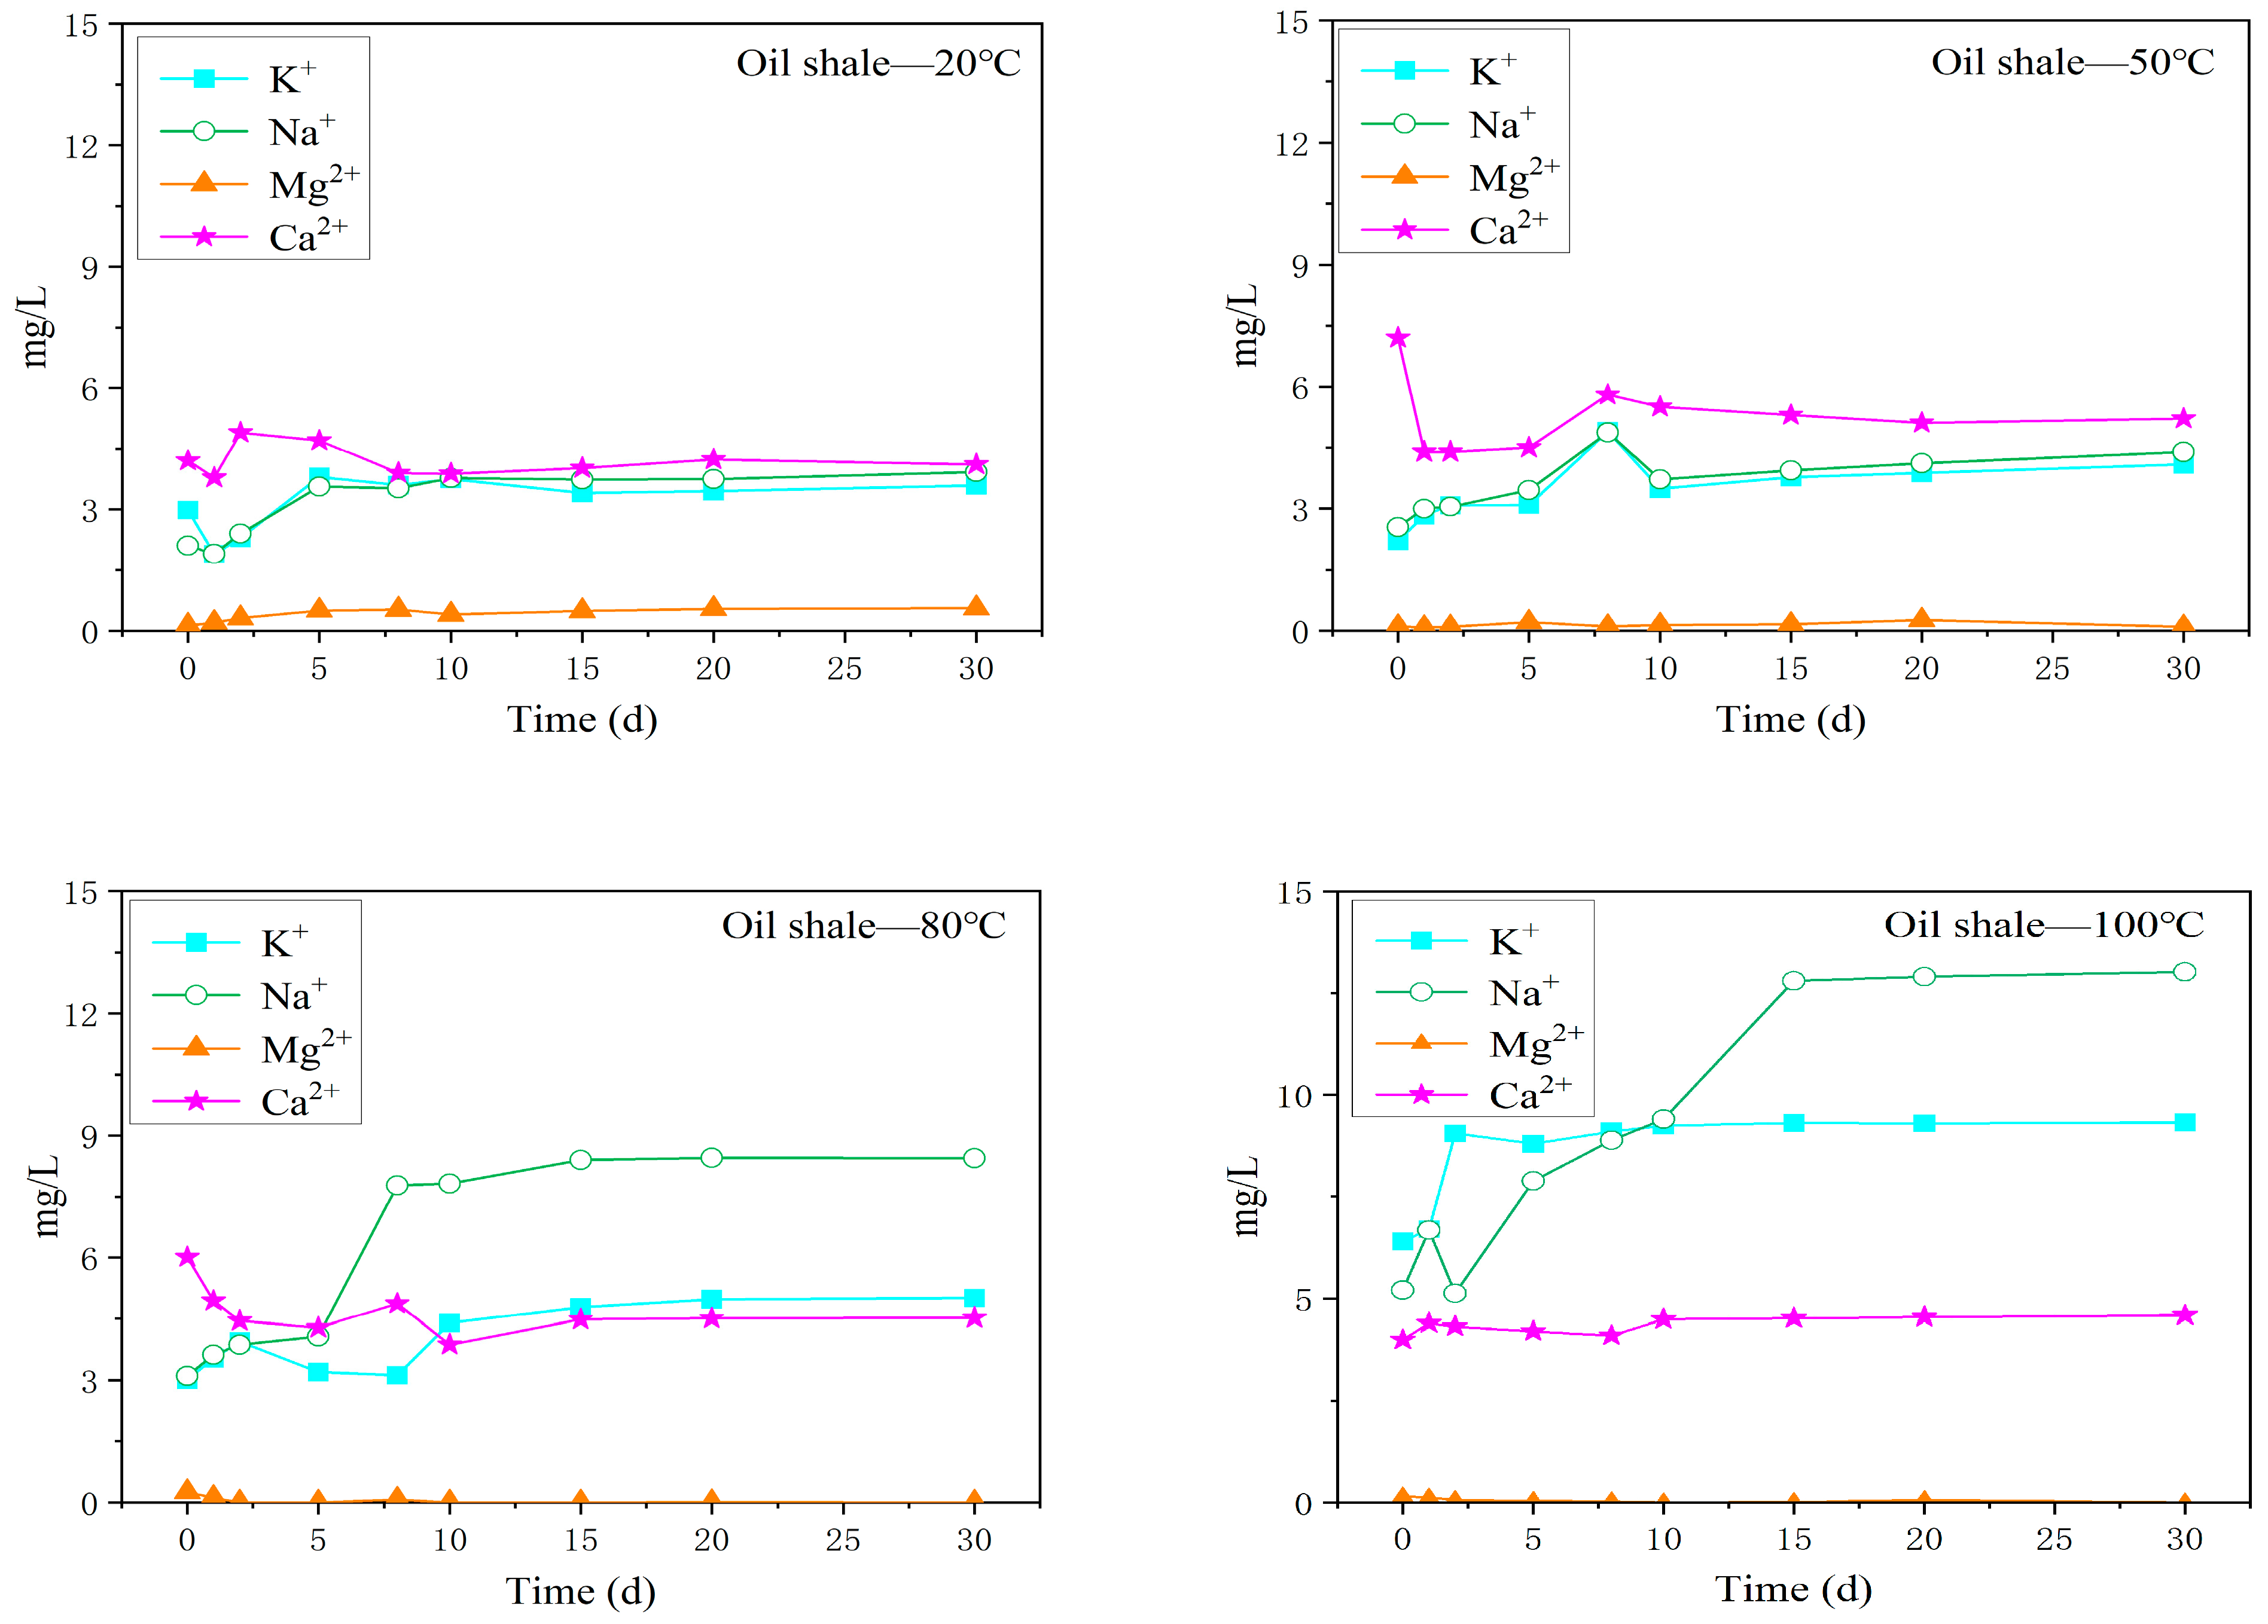
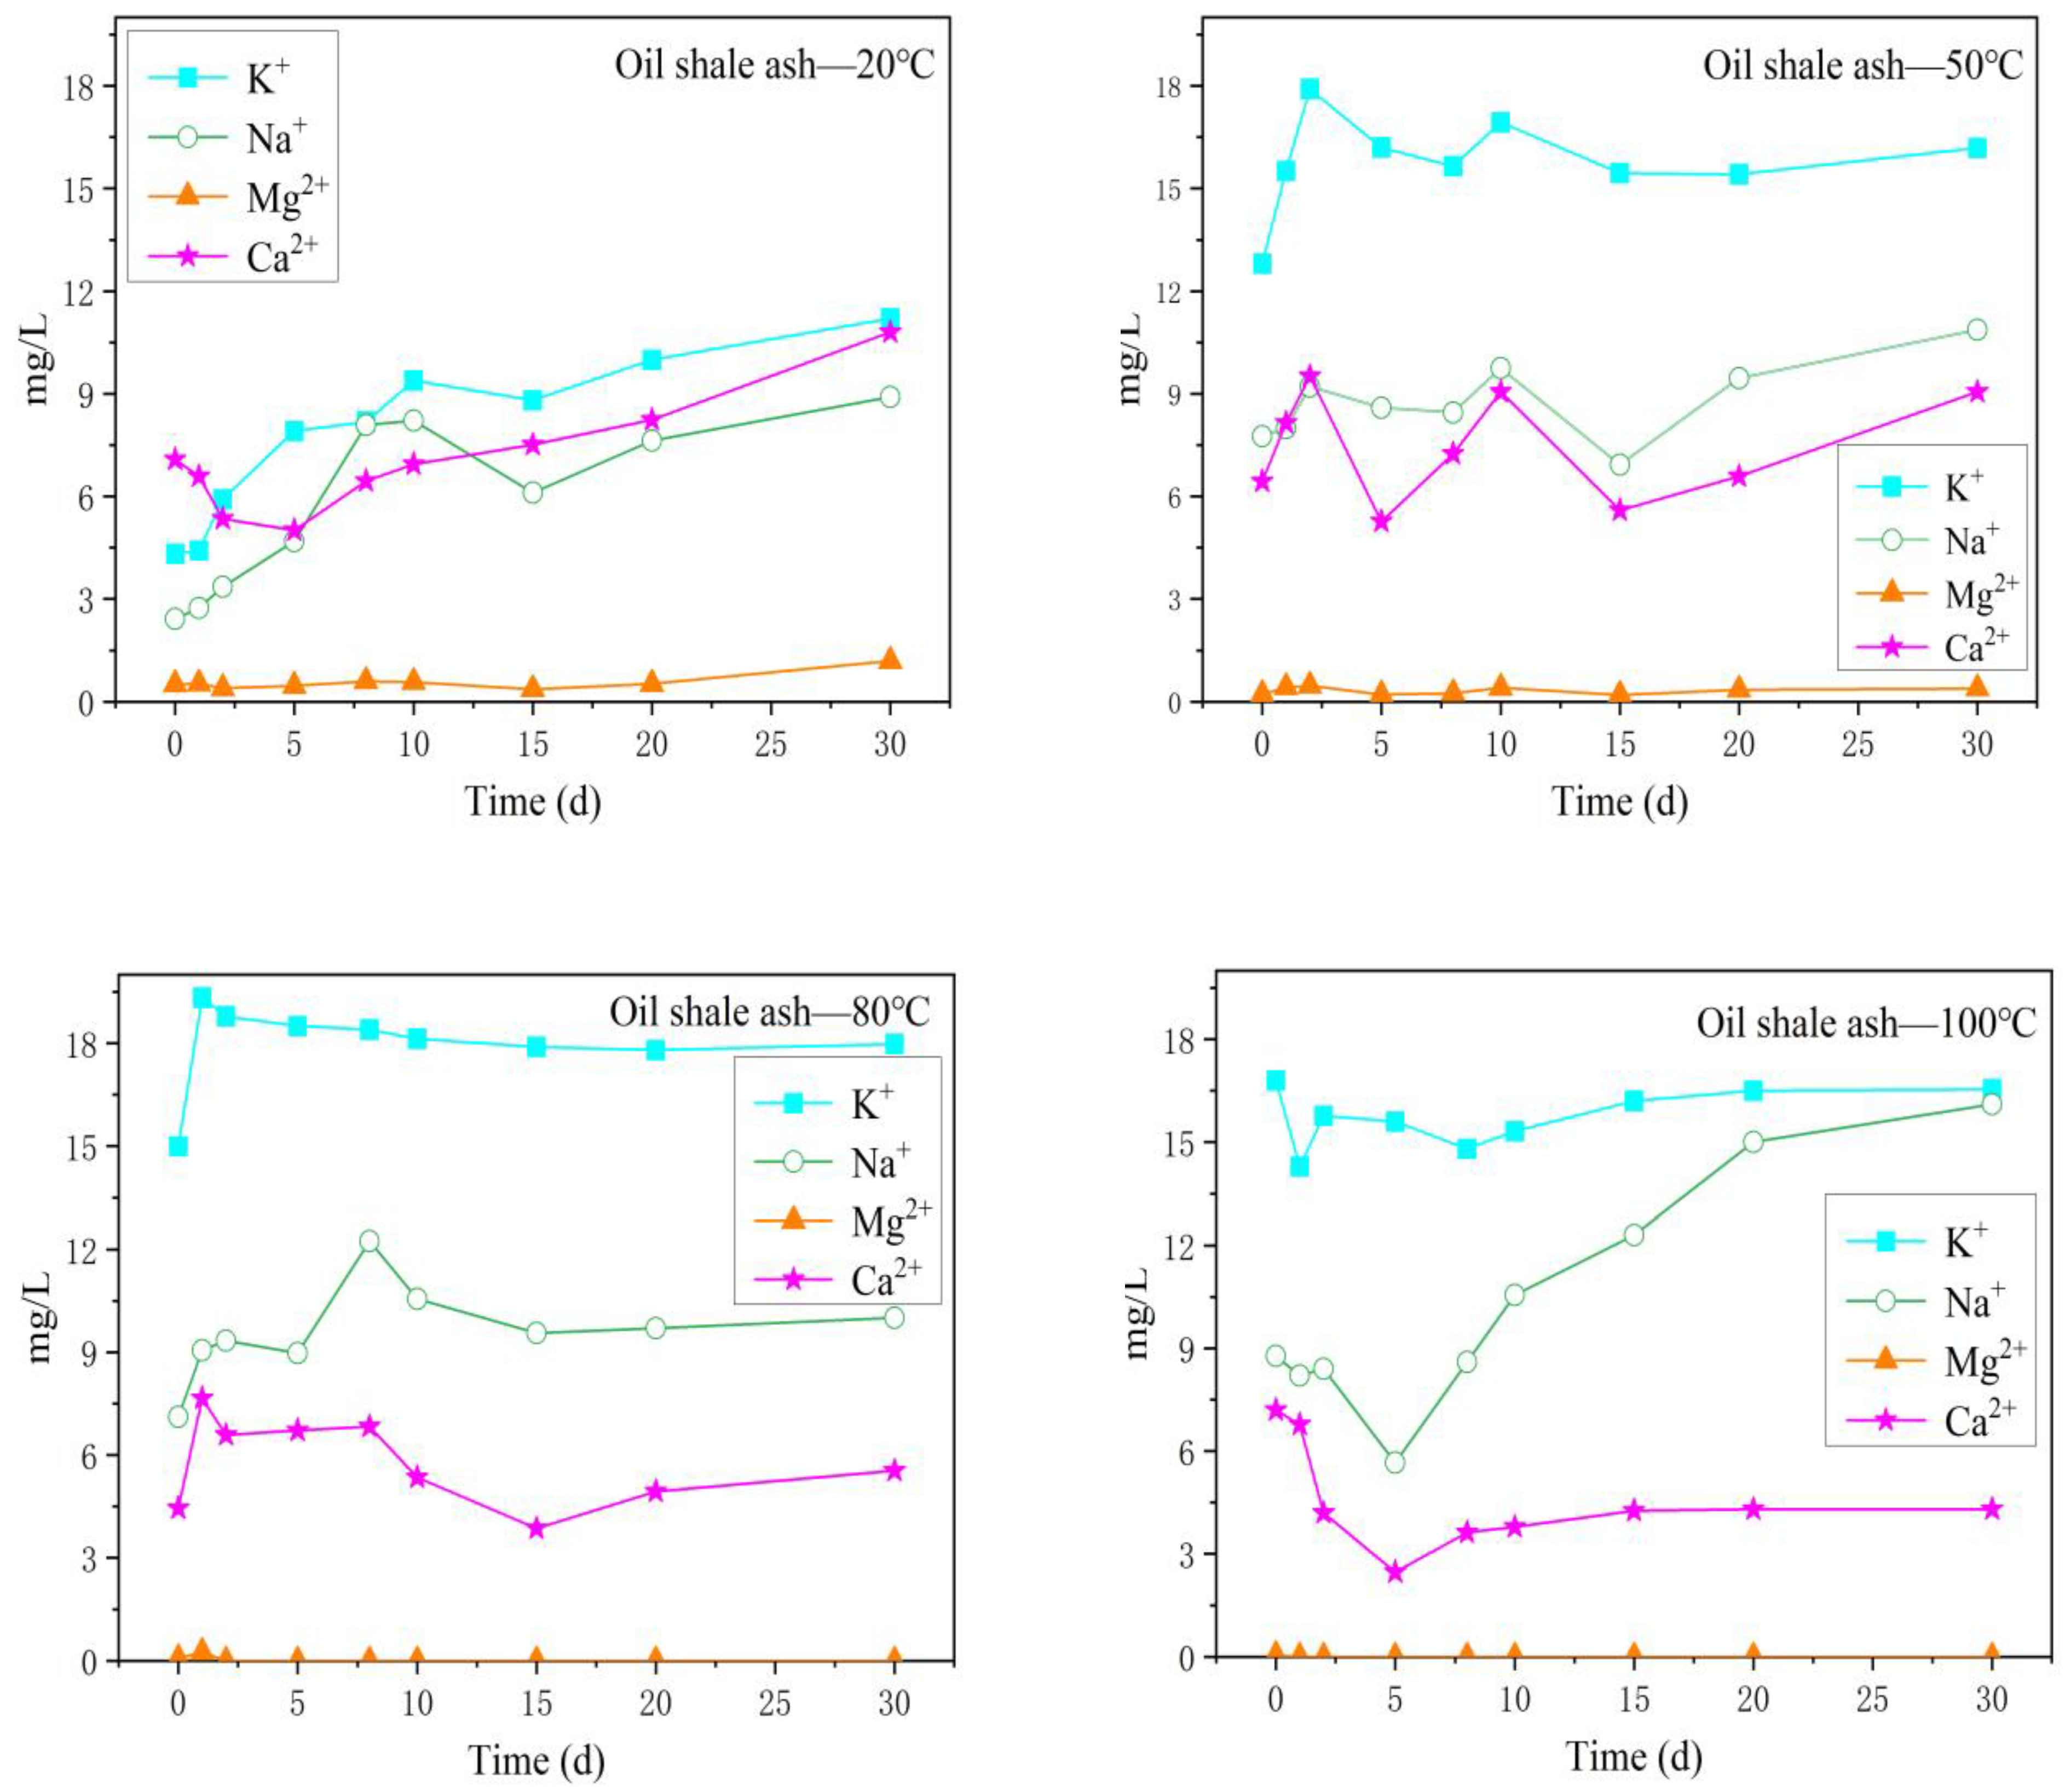
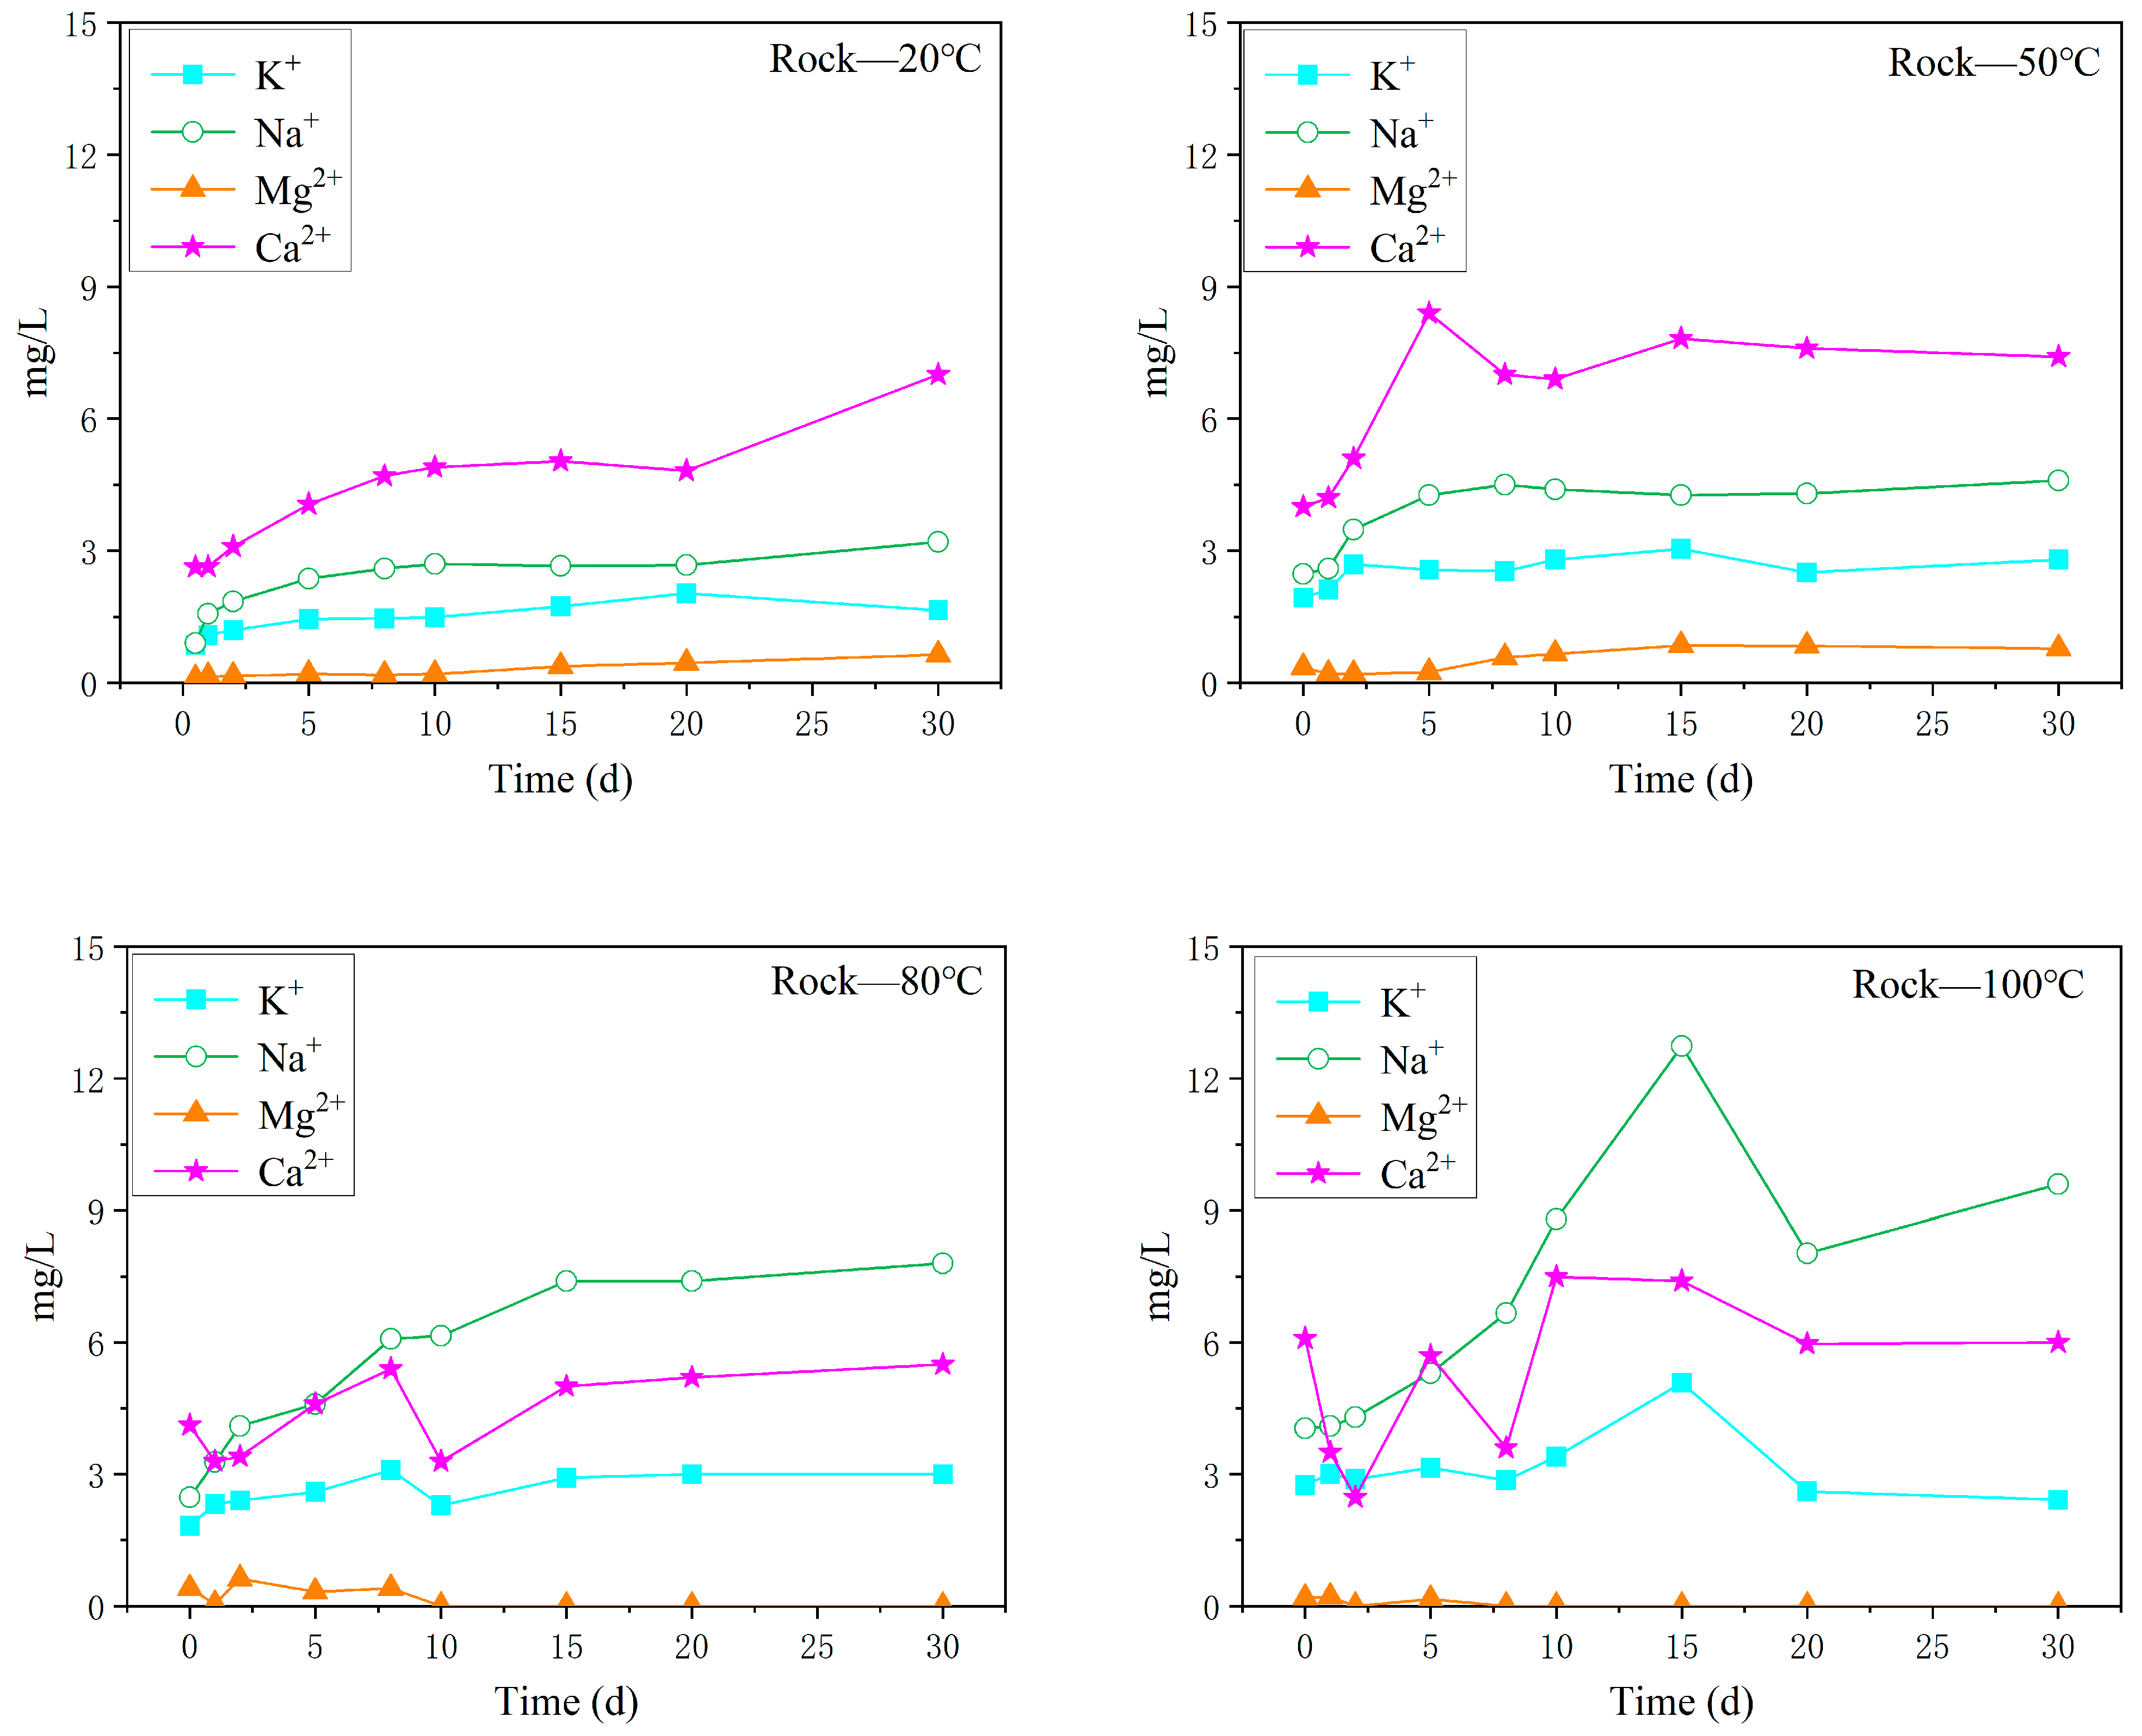
3.2. Main Cation Variation Characteristics
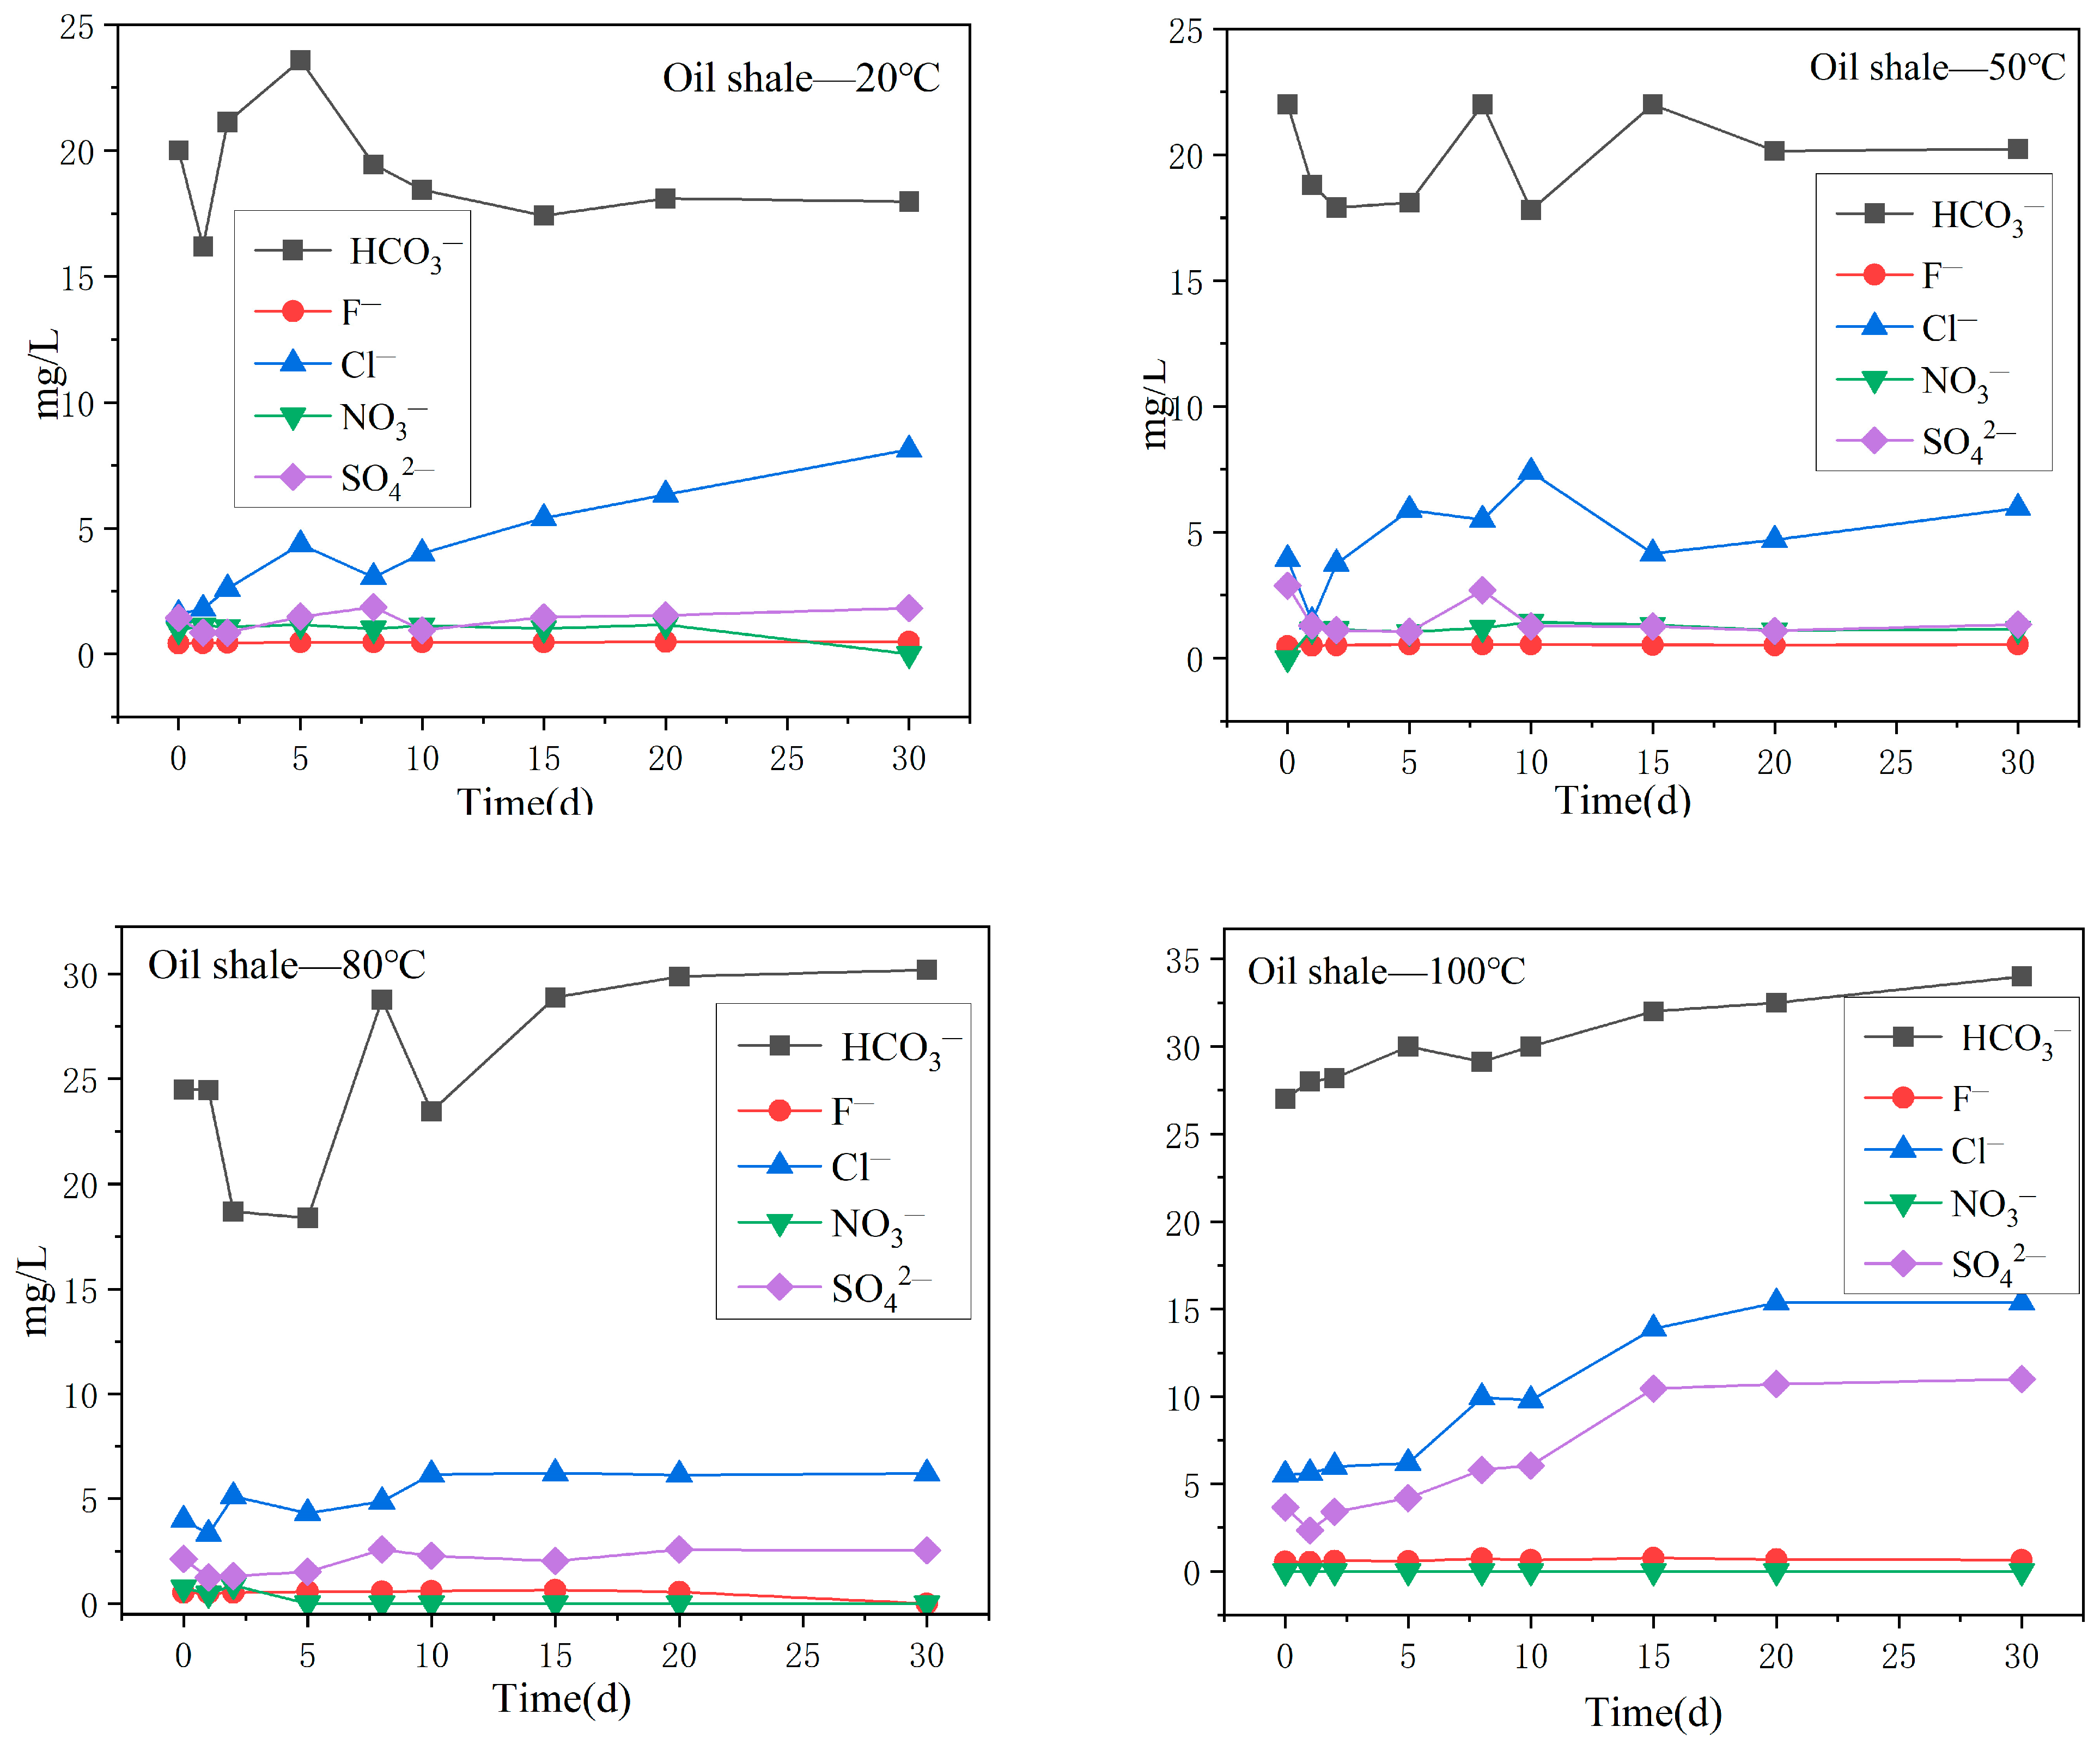
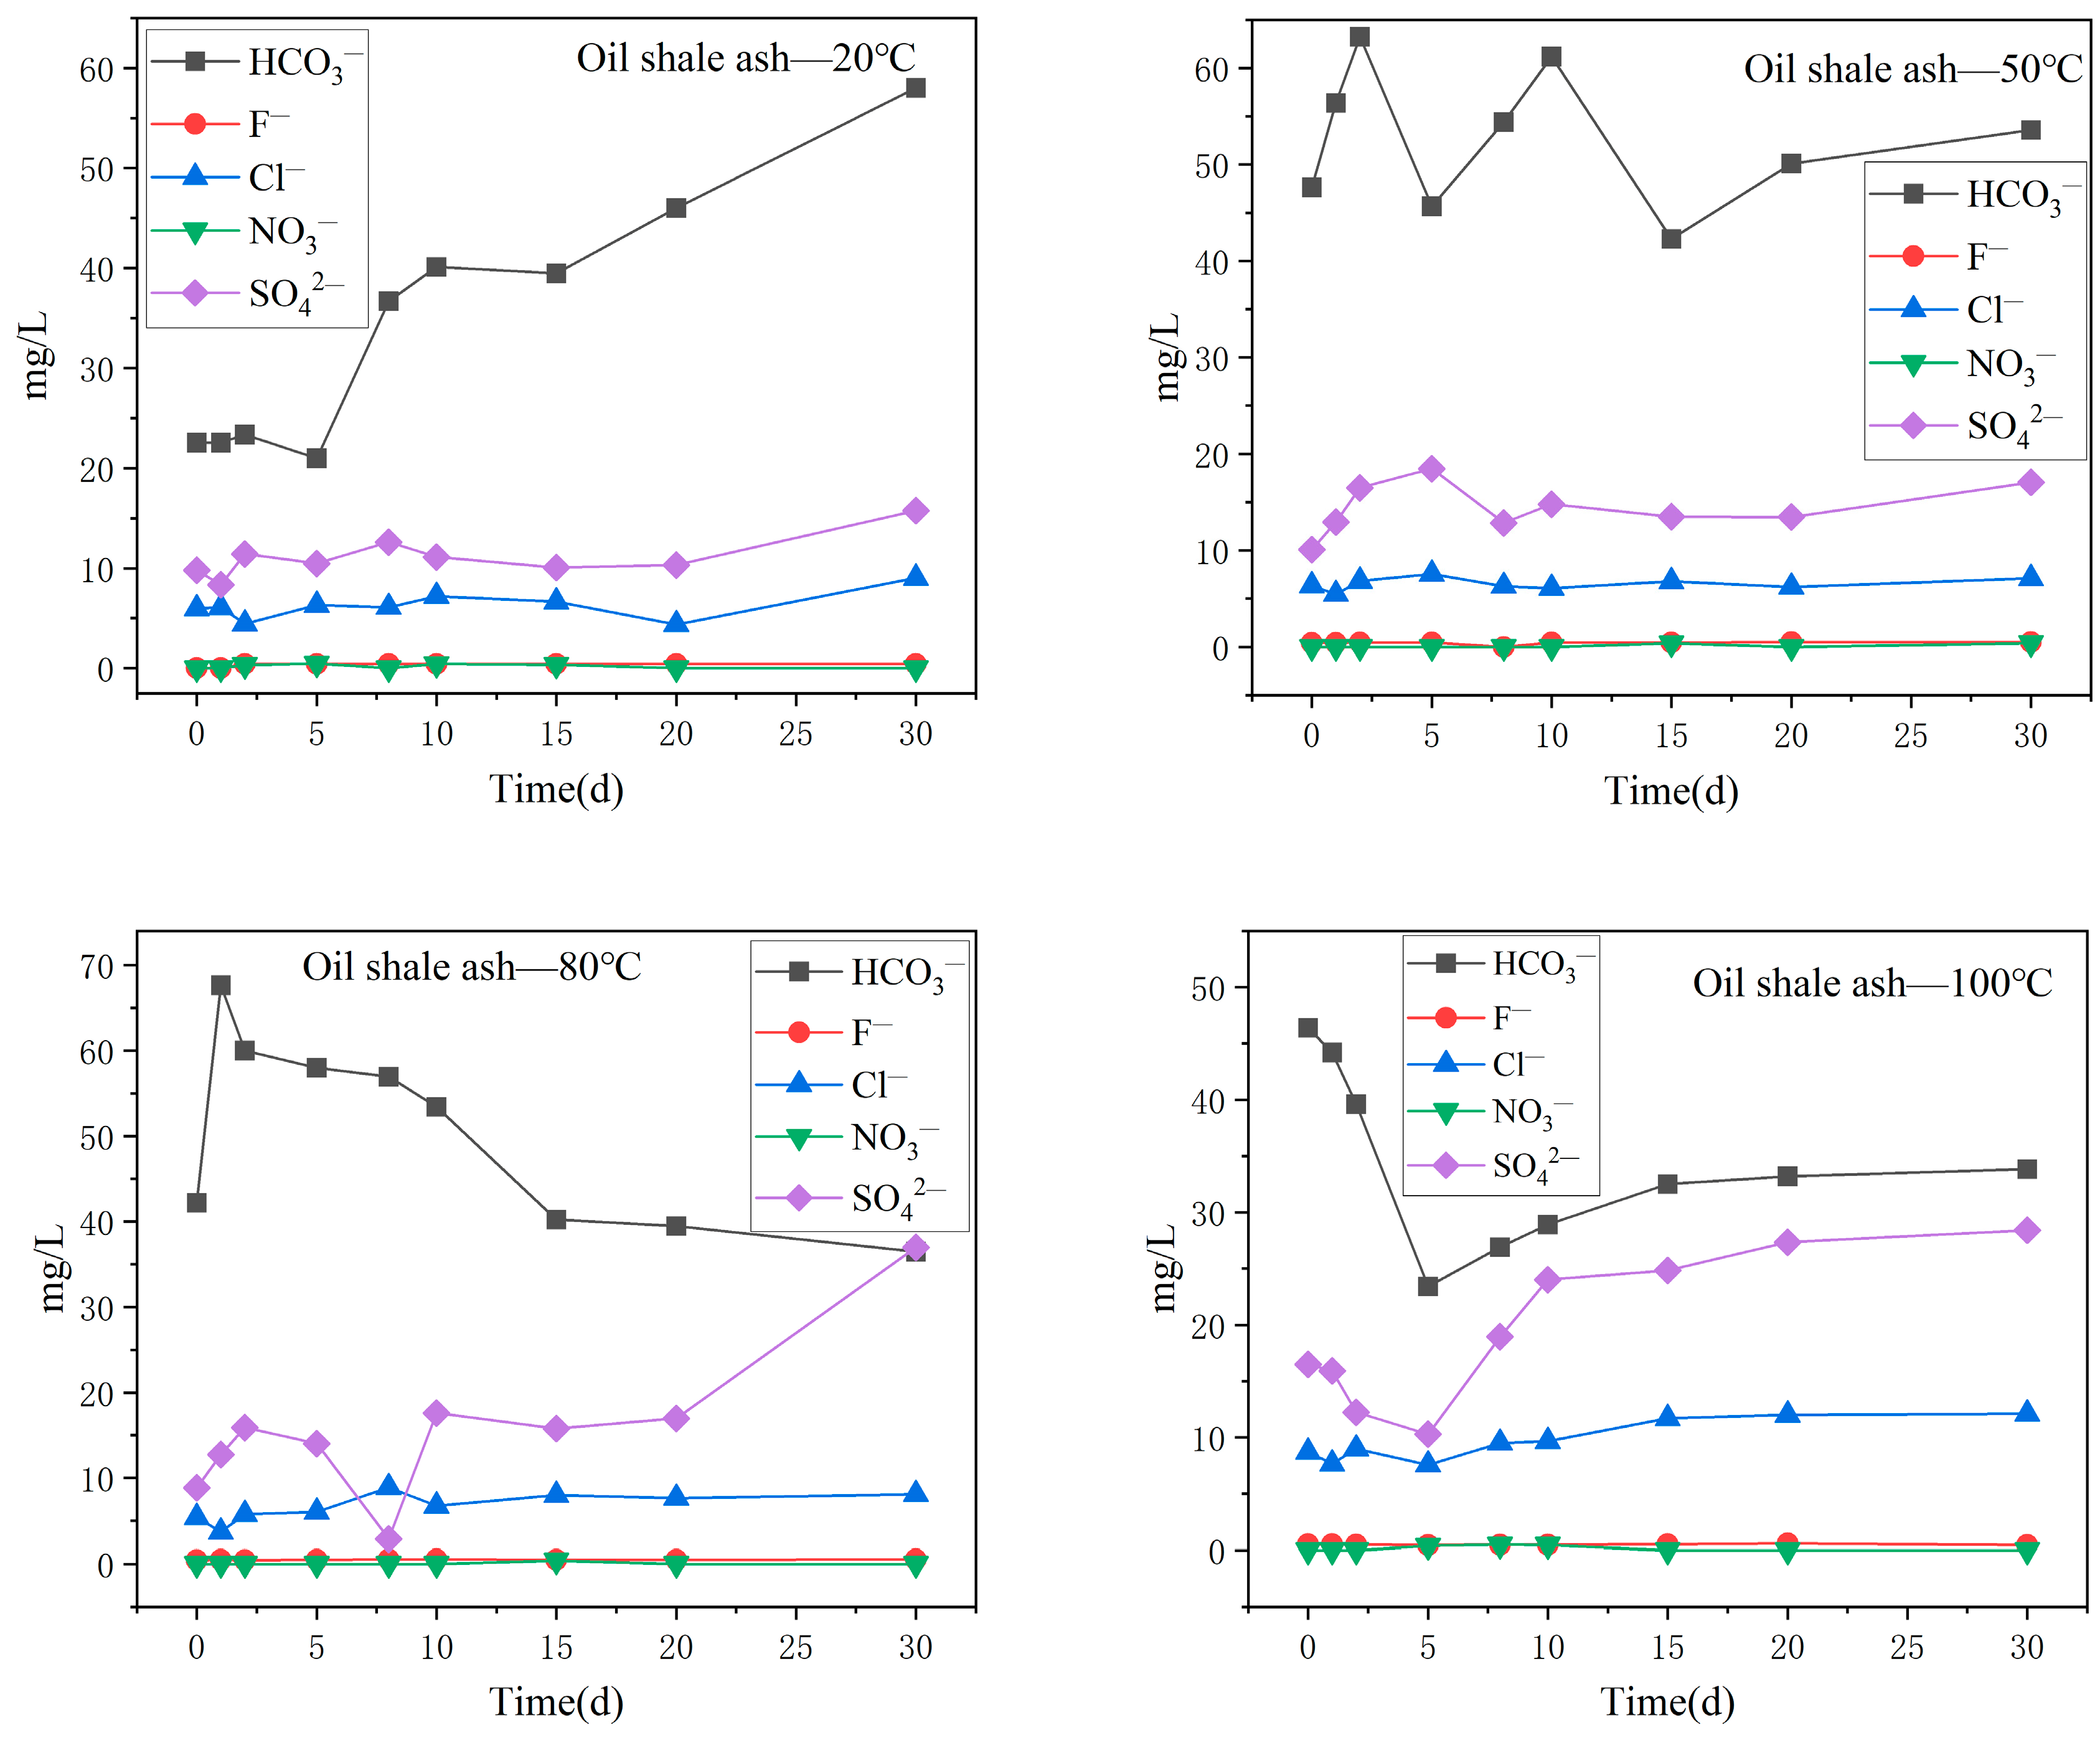
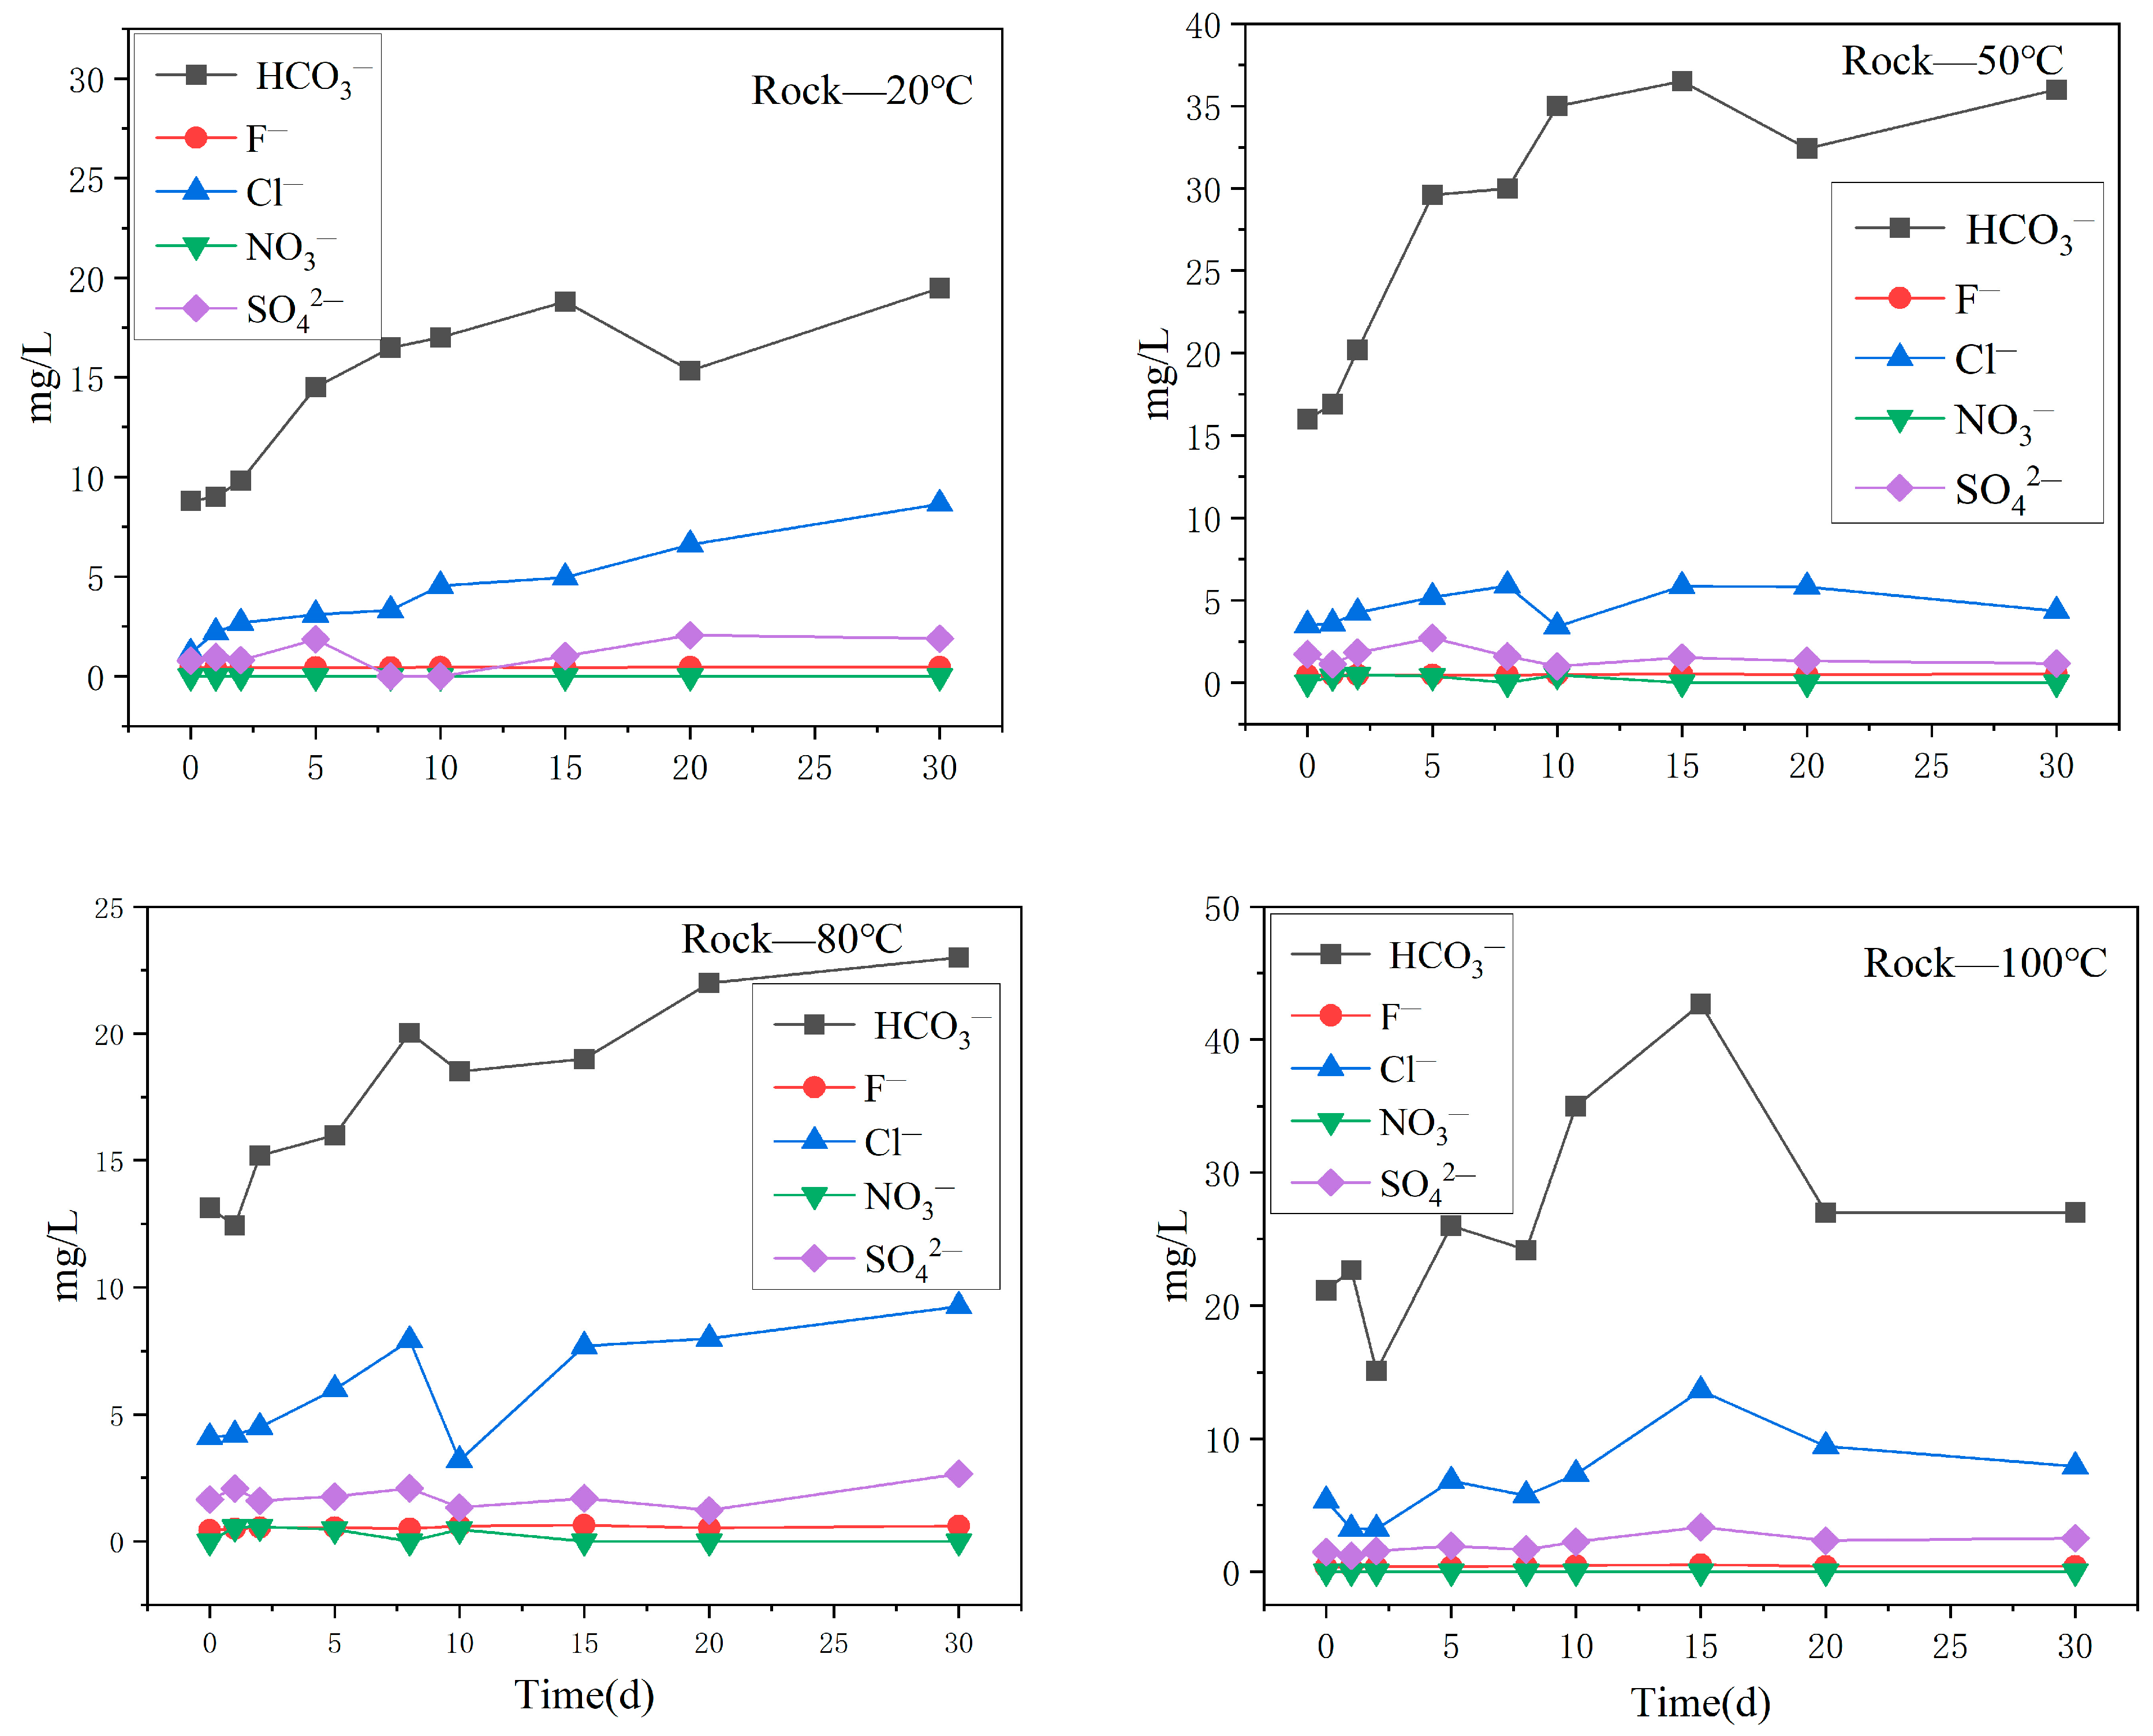
3.3. Main Anion Variation Characteristics
4. Discussion
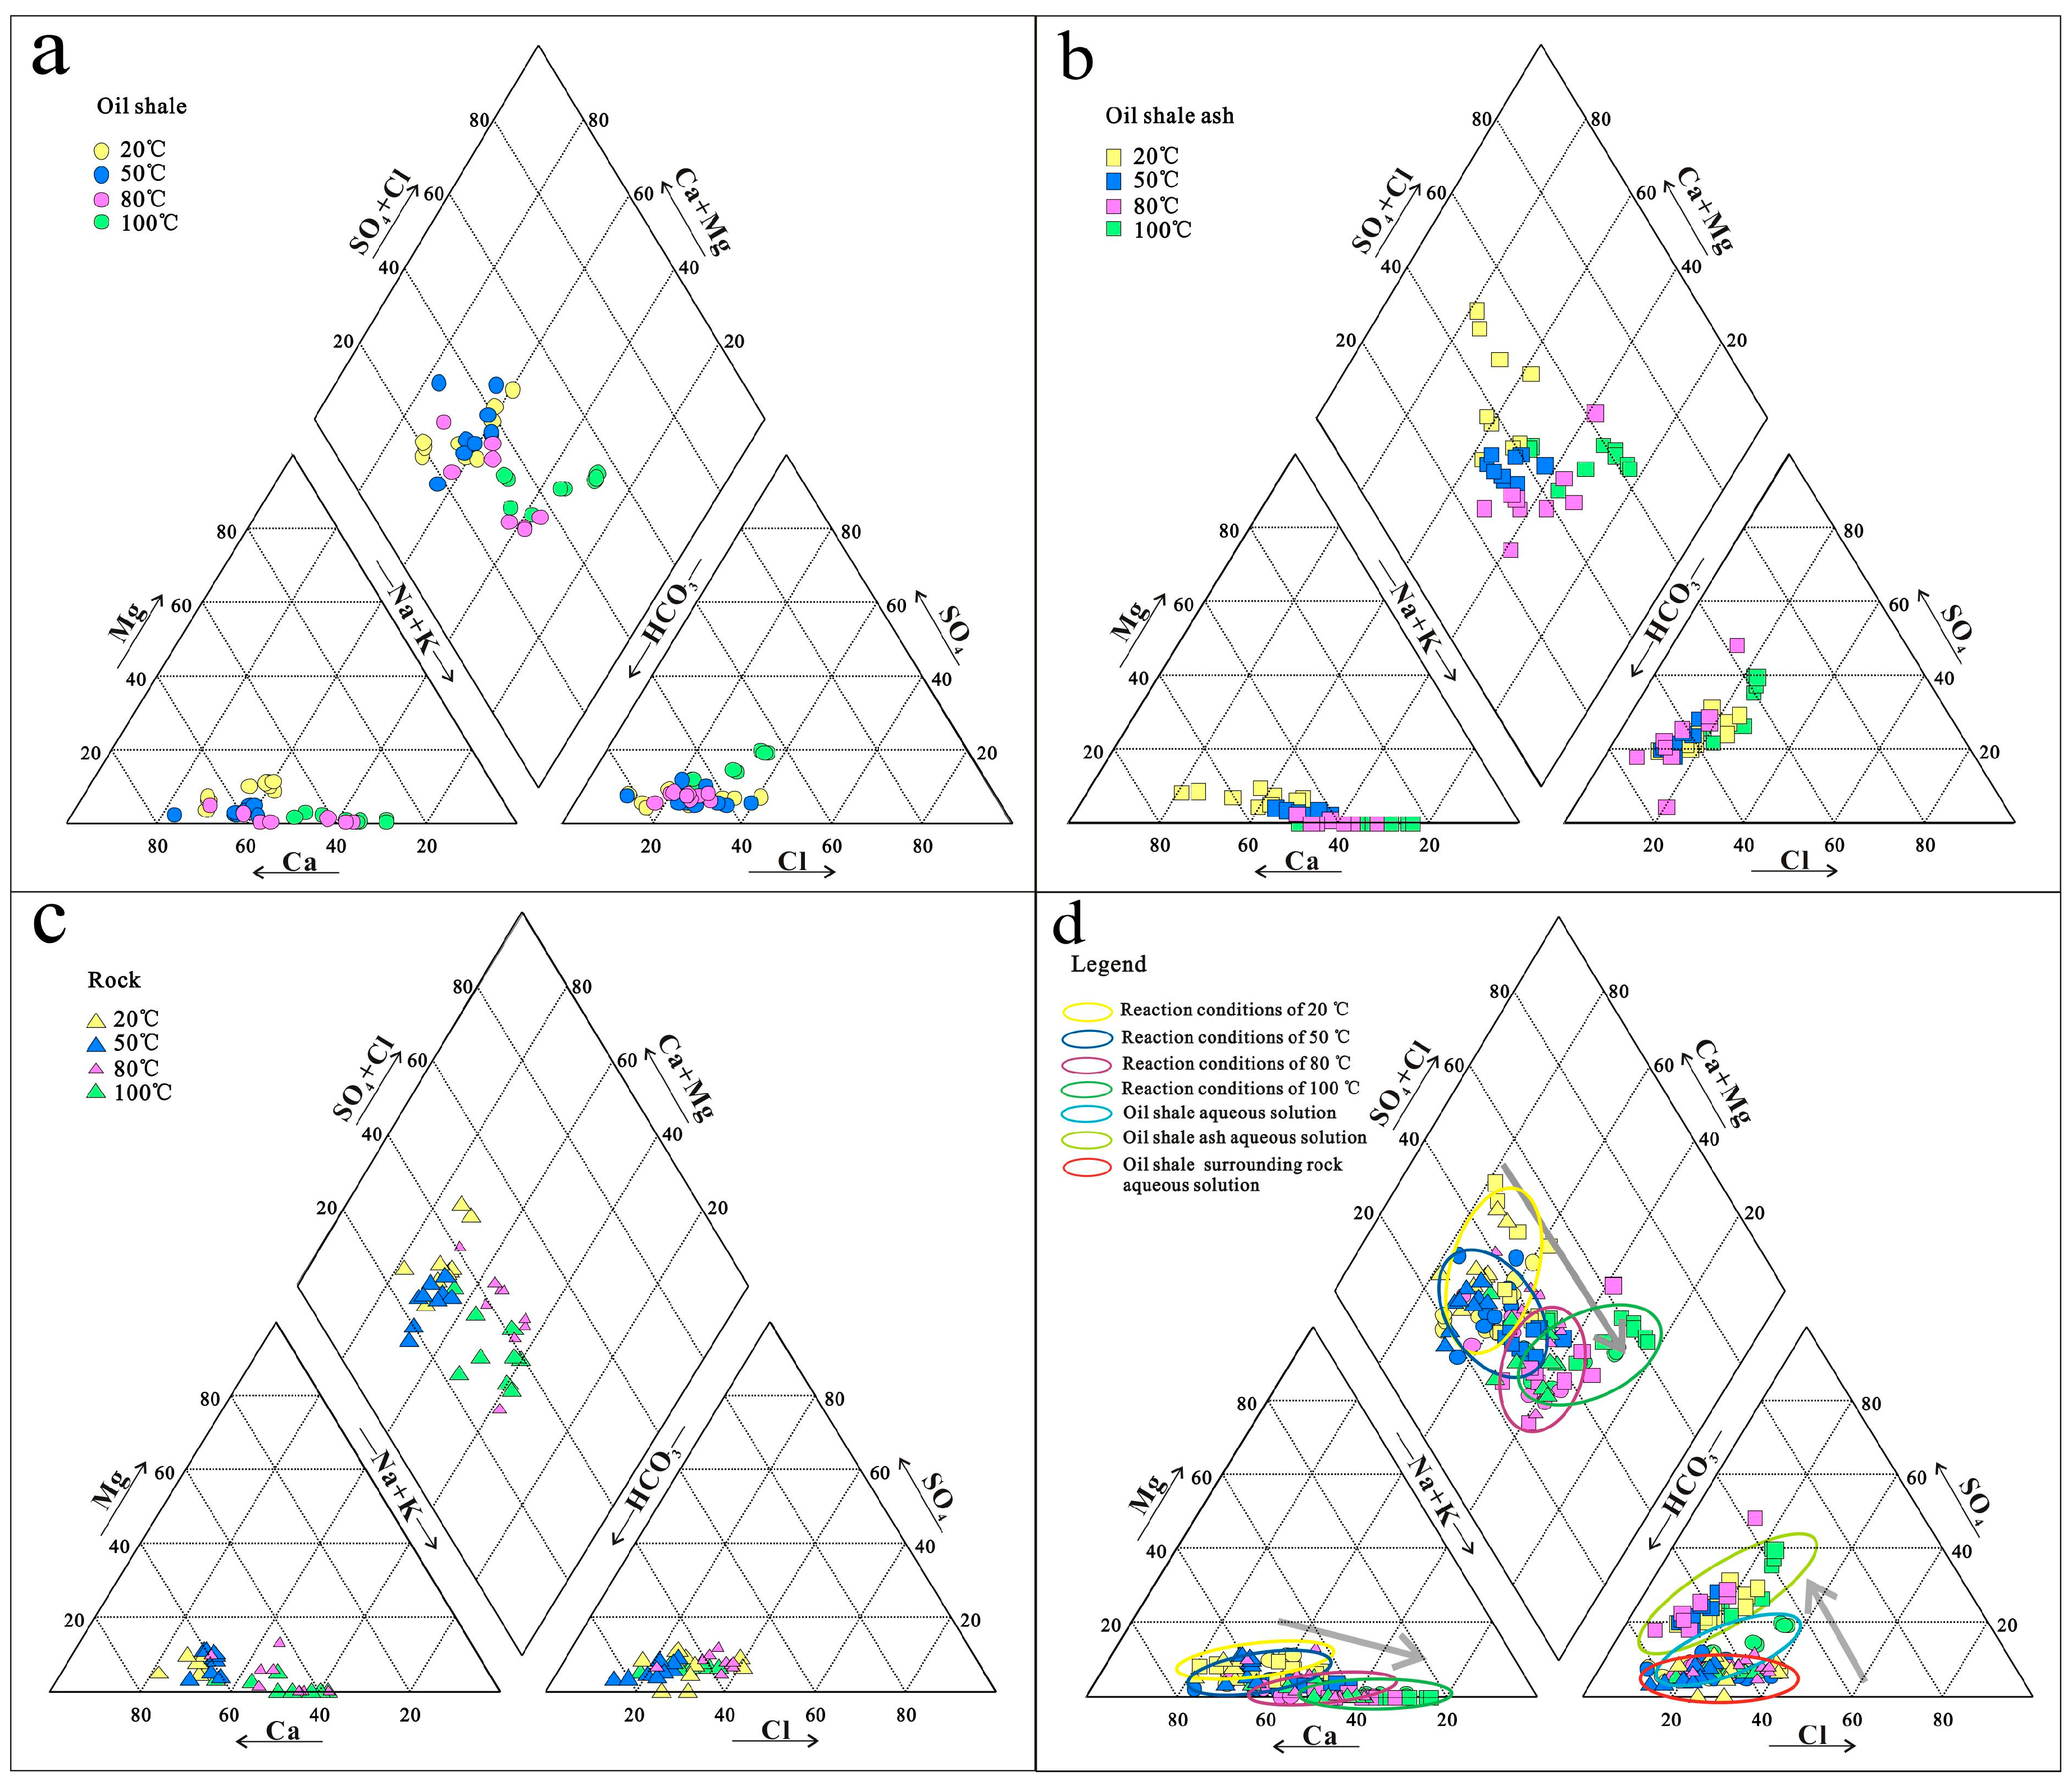
4.1. Changes in the Water Chemistry
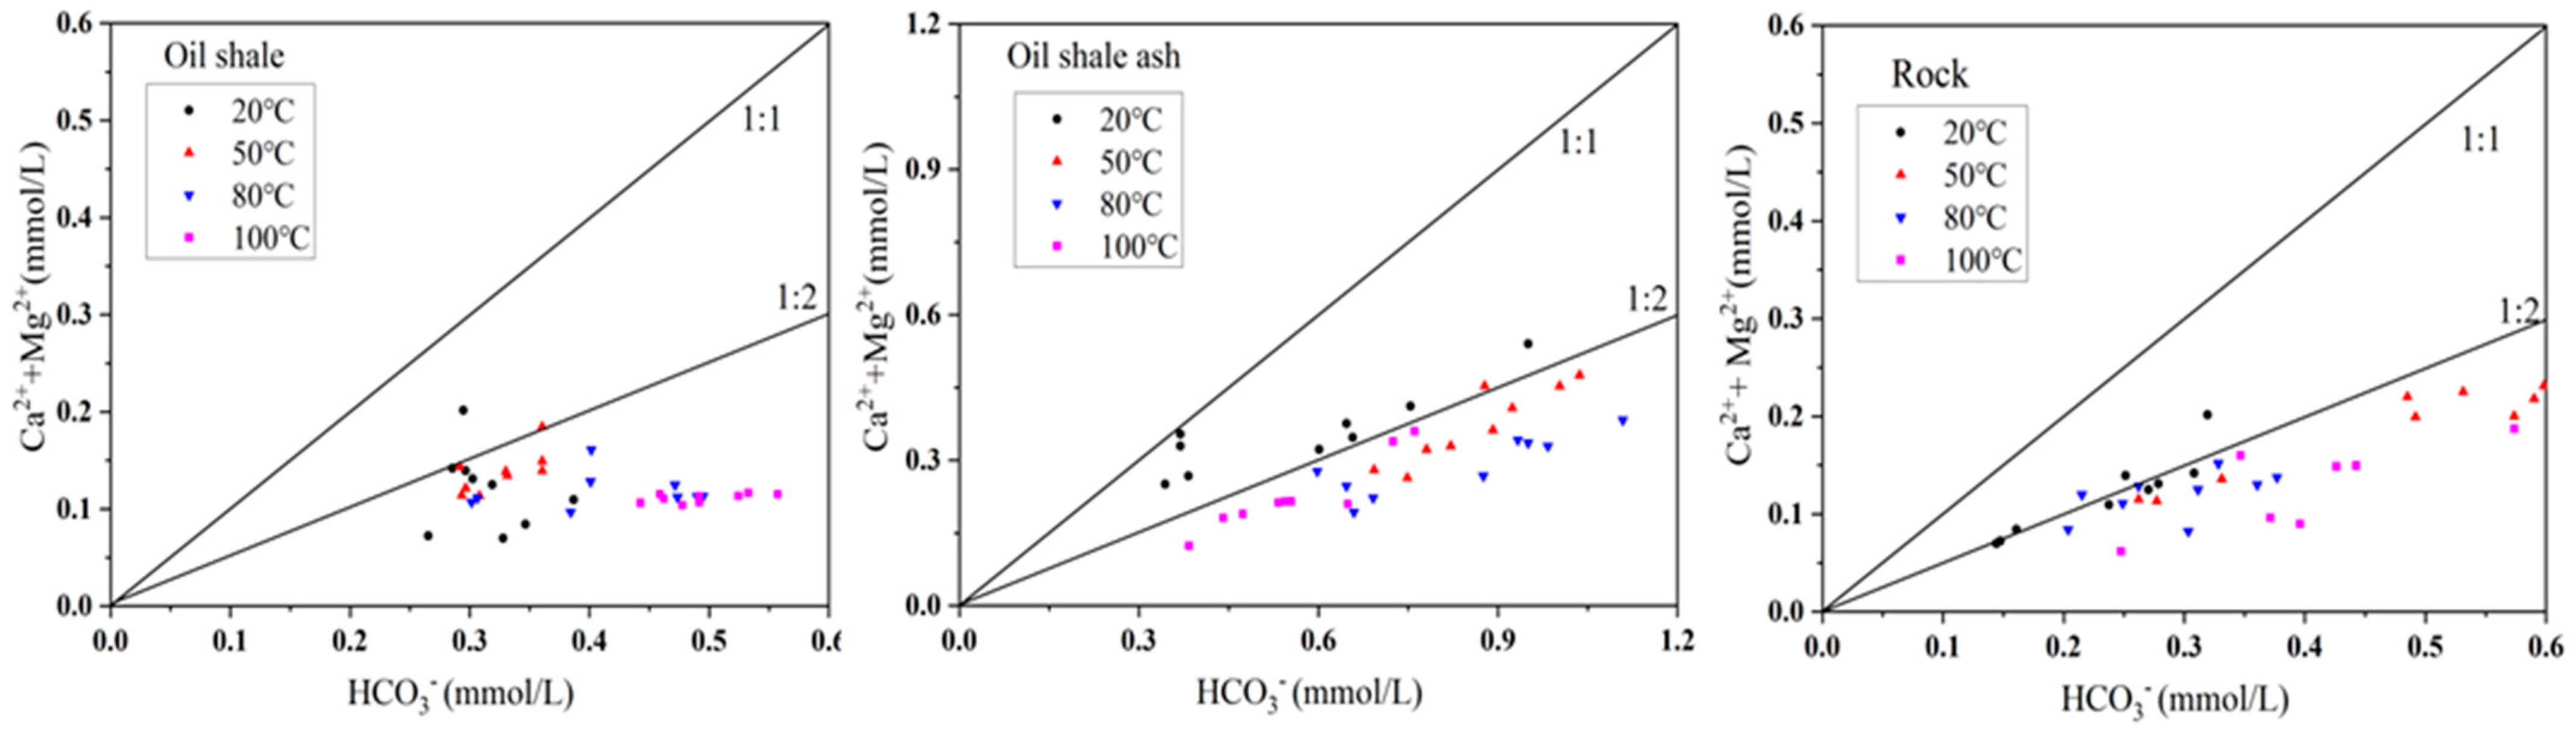
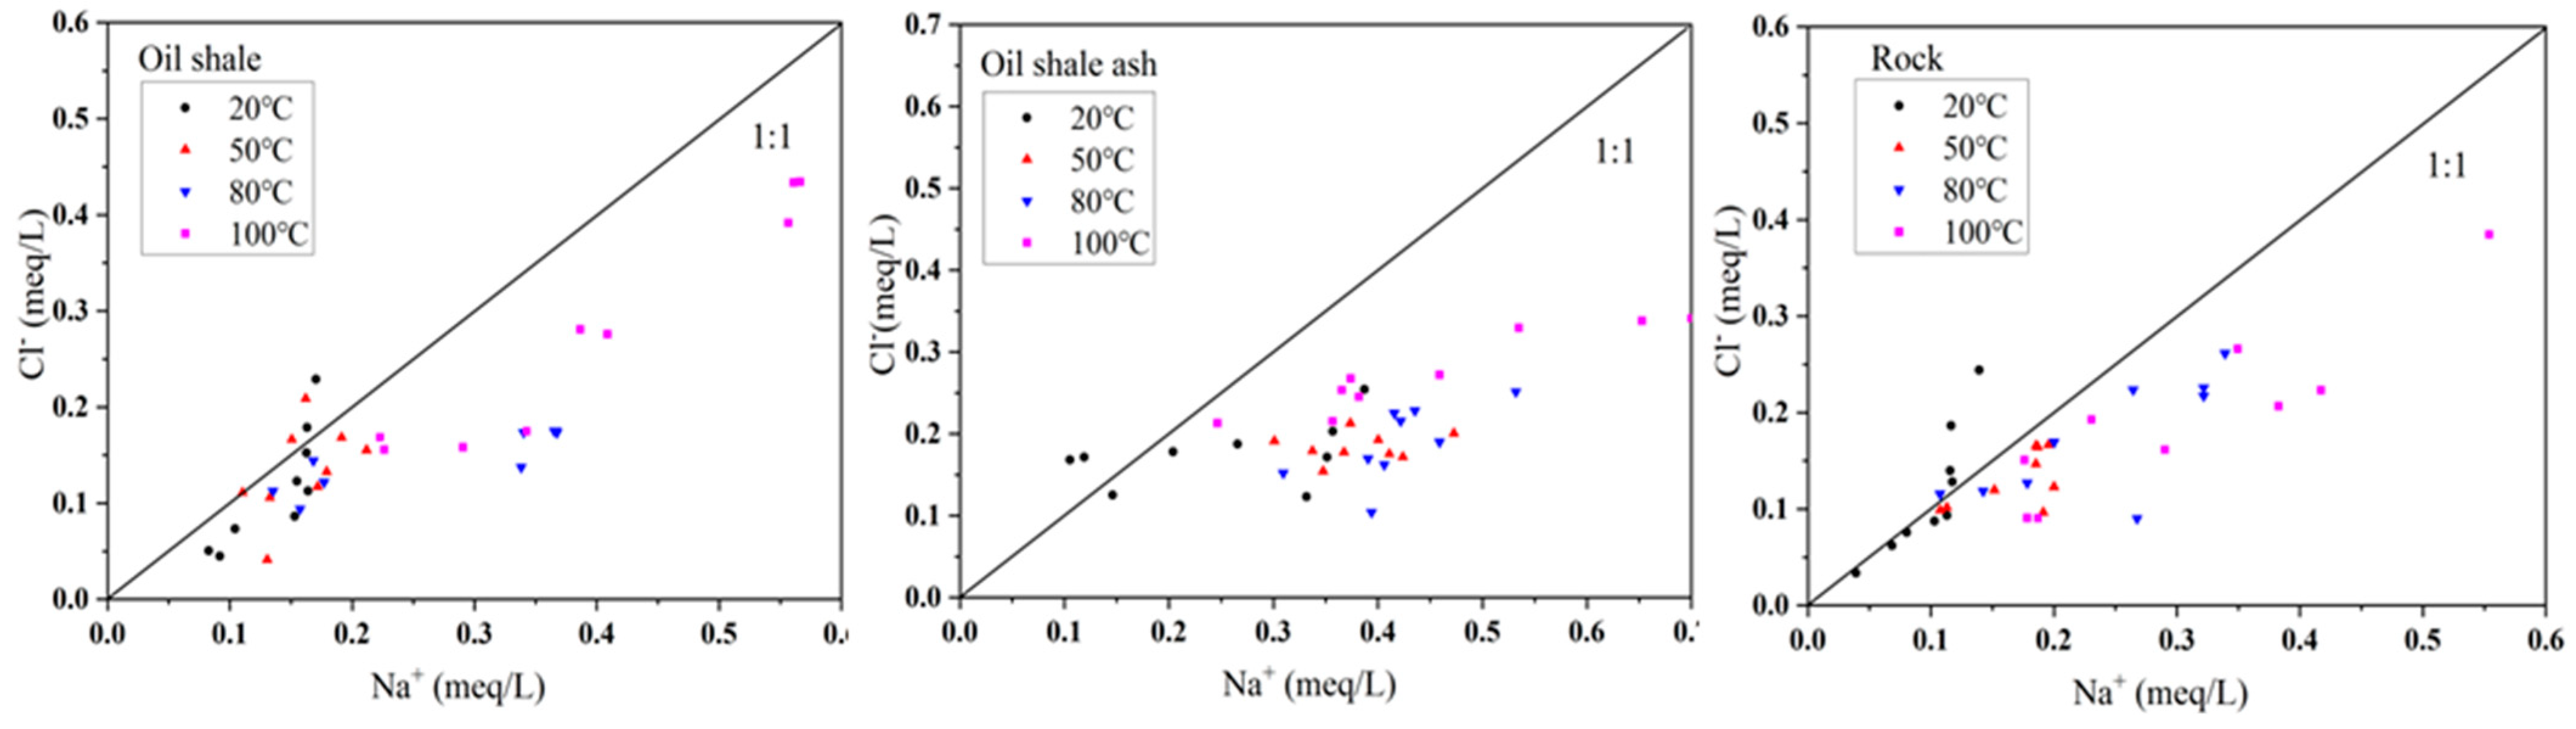
4.2. The Source of the Major Components
4.3. Formatting
5. Conclusions
- (1)
- With the increase of the temperature and reaction time, the content of the ions in the three aqueous solutions increased. The Ca2+ content in the aqueous solution was the highest under the 20 °C and 50 °C temperature conditions, and Na+ became the principal cation at 80 °C and 100 °C. HCO3− was always the main anion in the aqueous solution under the different reaction conditions.
- (2)
- Under the different reaction conditions, the ion content in the oil shale–ash aqueous solution changed the most. The water quality of the oil shale–ash aqueous solution was changed into HCO3-SO4-Na-K at 80 °C and 100 °C. This indicates that the pyrolytic oil shale was more likely to participate in the reaction when it came into contact with the water. Attention should be paid to the isolation of reservoirs and aquifers after oil shale in situ exploitation.
- (3)
- The source of the main components in the aqueous solution was identified by factor analysis. The results showed that the mineral type had the greatest influence on the ionic components, followed by the temperature, reaction time, and organic matter content in the rocks.
Author Contributions
Funding
Institutional Review Board Statement
Informed Consent Statement
Data Availability Statement
Acknowledgments
Conflicts of Interest
References
- Yang, Q.; Zhang, X.; Xu, S.; Wang, Z.; Guo, W. Low-temperature co-current oxidizing pyrolysis of oil shale: Study on the physicochemical properties, reactivity and exothermic characters of semi-coke as heat generation donor. J. Pet. Sci. Eng. 2022, 216, 110726. [Google Scholar] [CrossRef]
- Yang, H.; Duan, Y. A feasibility study on in-situ heating of oil shale with injection fluid in China. J. Petrol. Sci. Eng. 2014, 122, 304–317. [Google Scholar] [CrossRef]
- Roehner, R.; Panja, P.; Deo, M. Reducing gas flaring in oil production from shales. Energy Fuel 2016, 30, 7524–7531. [Google Scholar] [CrossRef]
- Zhang, P.; Lu, S.; Li, J.; Zhang, J.; Xue, H.; Chen, C. Comparisons of SEM, Low-Field NMR, and Mercury Intrusion Capillary Pressure in Characterization of the Pore Size Distribution of Lacustrine Shale: A Case Study on the Dongying Depression, Bohai Bay Basin, China. Energy Fuels 2017, 31, 9232–9239. [Google Scholar] [CrossRef]
- Hu, S.Y.; Xiao, C.L.; Jiang, X.; Liang, X.J. Potential Impact of In-Situ Oil Shale Exploitation on Aquifer System. Water 2018, 10, 649. [Google Scholar] [CrossRef]
- Jaber, J.O.; Probert, S.D. Environmental-impact assessment for the proposed oil-shale integrated tri-generation plant. Appl. Energy 1999, 62, 169–209. [Google Scholar] [CrossRef]
- Liu, Z.; Yang, D.; Hu, Y.; Shao, J. Low temperature nitrogen adsorption analysis of pore structure evolution in in-situ pyrolysis of oil shale. J. Xi’an Univ. Sci. Technol. 2018, 38, 738–741. [Google Scholar]
- Jiang, X.; Han, X.; Cui, Z. New technology for the comprehensive utilization of Chinese oil shale resources. Energy 2007, 32, 772–777. [Google Scholar] [CrossRef]
- Han, X.; Niu, M.; Jiang, X. Combined fluidized bed retorting and circulating fluidized bed combustion system of oil shale: 2. Energy and economic analysis. Energy 2014, 74, 788–794. [Google Scholar] [CrossRef]
- Pan, Y.; Zhang, X.M.; Liu, S.H.; Yang, S.C.; Ren, N. A review on technologies for oil shale surface retort. Chem. Soc. Pak. 2012, 34, 1331–1338. [Google Scholar]
- Qian, J.L.; Wang, J.Q.; Li, S.Y. World Oil Shale Utilization and Its Future. J. Jilin Univ. 2016, 36, 877–887. [Google Scholar] [CrossRef]
- Gavrilova, O.; Vilu, R.; Vallner, L. A life cycle environmental impact assessment of oil shale produced and consumed in Estonia. Resour. Conserv. Recycl. 2010, 55, 232–245. [Google Scholar] [CrossRef]
- Velts, O.; Uibu, M.; Rudjak, I.; Kallas, J.; Kuusik, R. Utilization of oil shale ash to prepare PCC: Leachibility dynamics and equilibrium in the ash-water system. Energy Procedia 2009, 1, 4843–4850. [Google Scholar] [CrossRef]
- Trikkel, A.; Kuusik, R.; Martins, A.; Pihu, T.; Stencel, J.M. Utilization of Estonian oil shale semicoke. Fuel Process. Technol. 2008, 89, 756–763. [Google Scholar] [CrossRef]
- Gross, S.A.; Avens, H.J.; Banducci, A.M.; Sahmel, J.; Panko, J.M.; Tvermoes, B.E. Analysis of BTEX groundwater concentrations from surface spills associated with hydraulic fracturing operations. J. Air Waste Manag. Assoc. 2013, 63, 424–432. [Google Scholar] [CrossRef] [PubMed]
- Arthur, M.A.; Cole, D.R. Unconventional Hydrocarbon Resources: Prospects and Problems. Elements 2014, 10, 257–264. [Google Scholar] [CrossRef]
- Jefimova, J.; Irha, N.; Reinik, J.; Kirso, U.; Steinnes, E. Leaching of polycyclic aromatic hydrocarbons from oil shale processing waste deposit: A long-term field study. Sci. Total. Environ. 2014, 481, 605–610. [Google Scholar] [CrossRef]
- Jefimova, J.; Kirso, U.; Urb, G.; Steinnes, E.; Reinik, J.; Irha, N. Leachability of Trace Elements from the Aged and Fresh Spent Shale Deposit—A Field Study. Oil Shale 2013, 30, 456. [Google Scholar] [CrossRef]
- Hu, S.Y.; Wu, H.; Liang, X.J.; Xiao, C.L.; Zhao, Q.S.; Cao, Y.Q.; Han, X.R. A preliminary study on the eco-environmental geological issue of in-situ oil shale mining by a physical model. Chemosphere 2022, 287, 131987. [Google Scholar] [CrossRef]
- Hu, S.Y.; Xiao, C.L.; Liang, X.J.; Cao, Y.Q.; Wang, X.; Li, M. The influence of oil shale in situ mining on groundwater environment: A water-rock interaction study. Chemosphere 2019, 228, 384–389. [Google Scholar] [CrossRef]
- Brandt, A.R. Converting oil shale to liquid fuels: Energy inputs and greenhouse gas emissions of the shell in situ conversion process. Environ. Sci. Technol. 2008, 42, 7489–7495. [Google Scholar] [CrossRef] [PubMed]
- Hu, S.Y.; Xiao, C.L.; Liang, X.J.; Cao, Y.Q. Influence of water-rock interaction on the pH and heavy metals content of groundwater during in-situ oil shale exploitation. Oil Shale 2020, 37, 104. [Google Scholar] [CrossRef]
- Amy, G.L. Contamination of groundwater by organic pollutants leached from in-situ spent shale. Off. Sci. Tech. Inf. Tech. Rep. 1978, 3, 37–44. [Google Scholar] [CrossRef][Green Version]
- Wang, H.; Zhang, W.; Qiu, S.W.; Liang, X.J. Release characteristics of Pb and BETX from in situ oil shale transformation on groundwater environment. Sci. Rep. 2021, 11, 16166. [Google Scholar] [CrossRef] [PubMed]
- Erg, K. Changes in groundwater sulphate content in estonian oil shale mining area. Oil Shale 2006, 22, 275–289. [Google Scholar] [CrossRef]
- Lv, H.; Liu, M.; Su, X.S.; Lin, G.Y. Determination of biogeochemical processes in oil-contaminated aquifer using principal component analysis. J. Cent. South Univ. 2013, 44, 3552–3560. [Google Scholar]
- Gao, Y.; Li, X.; Hua, X.G. Analysis of Groundwater Chemical Characteristics in Red Bed of Chengdu Based on SPSS. Pearl River 2016, 37, 36–42. [Google Scholar] [CrossRef]
- Yang, R.; Zhou, J.L.; Wei, X.; Chen, F.Y.; Lei, M.; Chen, J.S. Hydrochemical characteristics and evolution of groundwater in the eastern plain of Hotian Prefecture, Xinjiang. Environ. Chem. 2022, 41, 1367–1379. [Google Scholar] [CrossRef]
- Zhang, F.; Jin, Z.D.; Yu, J.M.; Zhou, Y.K.; Zhou, L. Hydrogeochemical processes between surface and groundwaters on the northeastern Chinese Loess Plateau: Implications for water chemistry and environmental evolutions in semi-arid regions. J. Geochem. Explor. 2015, 159, 115–128. [Google Scholar] [CrossRef]


| Kaiser–Meyer–Olkin Test | 0.553 | |
| Bartlett Test Result | Approximate chi-squared | 1046.244 |
| df | 78 | |
| Sig. | 0.000 | |
| Initial Eigenvalue | |||
|---|---|---|---|
| Common Factor | Eigenvalues | Variance Contribution Rate (%) | Cumulative Variance Contribution Rate (%) |
| 1 | 4.407 | 33.903 | 33.903 |
| 2 | 2.302 | 17.71 | 51.613 |
| 3 | 1.682 | 12.941 | 64.554 |
| 4 | 1.387 | 10.669 | 75.223 |
| Parameter | Factor 1 | Factor 2 | Factor 3 | Factor 4 | Commonality |
|---|---|---|---|---|---|
| K+ | 0.939 | −0.125 | −0.016 | −0.054 | 0.901 |
| Na+ | 0.784 | −0.318 | 0.456 | 0.088 | 0.931 |
| HCO3− | 0.884 | 0.205 | 0.073 | 0.132 | 0.846 |
| SO42− | 0.876 | −0.078 | 0.023 | −0.052 | 0.777 |
| Temperature | 0.293 | −0.784 | 0.187 | 0.223 | 0.786 |
| Mg2+ | −0.106 | 0.881 | 0.047 | 0.043 | 0.791 |
| Ca2+ | 0.488 | 0.66 | 0.142 | 0.215 | 0.74 |
| Time | 0.139 | 0.209 | 0.799 | −0.011 | 0.701 |
| Cl− | 0.506 | −0.279 | 0.658 | 0.091 | 0.775 |
| F− | −0.072 | −0.423 | 0.527 | −0.262 | 0.53 |
| Fe2+ | −0.127 | −0.001 | 0.521 | 0.49 | 0.527 |
| Lithology | −0.141 | 0.123 | −0.094 | 0.824 | 0.723 |
| NO3− | −0.354 | 0.139 | −0.063 | −0.776 | 0.751 |
Disclaimer/Publisher’s Note: The statements, opinions and data contained in all publications are solely those of the individual author(s) and contributor(s) and not of MDPI and/or the editor(s). MDPI and/or the editor(s) disclaim responsibility for any injury to people or property resulting from any ideas, methods, instructions or products referred to in the content. |
© 2022 by the authors. Licensee MDPI, Basel, Switzerland. This article is an open access article distributed under the terms and conditions of the Creative Commons Attribution (CC BY) license (https://creativecommons.org/licenses/by/4.0/).
Share and Cite
Li, Q.; Lu, L.; Zhao, Q.; Hu, S. Impact of Inorganic Solutes’ Release in Groundwater during Oil Shale In Situ Exploitation. Water 2023, 15, 172. https://doi.org/10.3390/w15010172
Li Q, Lu L, Zhao Q, Hu S. Impact of Inorganic Solutes’ Release in Groundwater during Oil Shale In Situ Exploitation. Water. 2023; 15(1):172. https://doi.org/10.3390/w15010172
Chicago/Turabian StyleLi, Qingyu, Laijun Lu, Quansheng Zhao, and Shuya Hu. 2023. "Impact of Inorganic Solutes’ Release in Groundwater during Oil Shale In Situ Exploitation" Water 15, no. 1: 172. https://doi.org/10.3390/w15010172
APA StyleLi, Q., Lu, L., Zhao, Q., & Hu, S. (2023). Impact of Inorganic Solutes’ Release in Groundwater during Oil Shale In Situ Exploitation. Water, 15(1), 172. https://doi.org/10.3390/w15010172