Article

Health Risks in a Brazilian Cerrado Population Due to Pathogens Transmitted through Water and Land Use Conditions

by
Débora Pereira da Silva
1,*,
Nolan Ribeiro Bezerra
2,
Raviel Eurico Basso
1,
Maria da Natividade Vieira
3 and
Paulo Sérgio Scalize
1
1
Graduate Program in Environmental Sciences—CIAMB, Dean of Graduate Studies—PRPG, Federal University of Goiás, Goiânia CEP 74045-155, Goiás, Brazil
2
Department of Academic Areas II, Federal Institute of Education, Science and Technology of Goiás, Goiânia CEP 74055-110, Goiás, Brazil
3
Faculty of Sciences, University of Porto, 4169-007 Porto, Portugal
*
Author to whom correspondence should be addressed.
Water 2023, 15(1), 158; https://doi.org/10.3390/w15010158
Submission received: 22 November 2022 / Revised: 21 December 2022 / Accepted: 27 December 2022 / Published: 31 December 2022
(This article belongs to the Special Issue Tropical Rivers and Wetlands in the Anthropocene)

Abstract

:
Cryptosporidium and Giardia are pathogenic agents which cause risk to public health. The goal of this research was to evaluate the risk of infection by cryptosporidiosis and giardiasis in a population of the Cerrado biome and its relation to land use. Raw water samples were collected from 41 different surface sources of the state of Goiás (Brazil). The parasites were quantified via the membrane filtration method. The probability of an individual contracting an infection after consuming contaminated water was estimated using the quantitative microbial risk assessment. Generally, the analyzed watersheds (WS) presented Giardia cysts in 63.4% of the samples (<LD at 116.67 cysts/L) and Cryptosporidium oocysts in 87.8% of the samples (<LD at 300 oocysts/L). The WS with pasture predominance were statistically associated with the presence of Cryptosporidium, in which the possible contamination source is the excrements of animals. There is a greater risk of giardiasis. It is concluded that there is a need to implement improvement actions regarding environmental quality and the management of the use and occupation of surface sources in the Cerrado Biome, in order to reduce the spreading of diseases and negative impacts to the local population.

Graphical Abstract

1. Introduction

The Brazilian Cerrado is a very diversified biome which occupies around 25% of the national territory, taking up an estimated area of approximately two million square kilometers [1].
Nowadays, the Cerrado area belonging to the state of Goiás is constituted by a considerable variety of urban and rural population. The latter presents different cultural references, being denominated as traditional peoples and communities by the 3rd Article, item I of the Decree n. 6.040 [2], including the indigenous, caiçaras, riparian, rubber tappers, remaining quilombolas, and agrarian reform settlers, among others. Due to historical factors, financial limitations, and the political and geographical isolation of the urban municipal building, rural communities face more difficulties in obtaining access to health and sanitation public services [3]. Therefore, this situation favors the contraction of infectious and waterborne parasitic diseases, such as the acute diarrheal diseases (ADD). Such diseases prevail in urban and rural areas, due to the difficulty of access to potable water, sanitation and health units [4].
In countries in development such as Brazil, the sources of waterborne diseases are sub-notified due to the difficulties tied to vigilance and notification systems [5]. The ADD caused by infectious agents had more incidences in the year of 2010 in the state of Goiás (Brazil), with 92.883 cases notified in the general population, while in the age range of children with 4 years and below, such a group being more vulnerable, there were 62.900 cases [6].
In the scope of public health, water represents a source of waterborne gastrointestinal diseases (GI) when contaminated by both treated and untreated domestic sewers, which are sent into the surface sources used for consumption and recreational activities [7]. Among the infection agents, there are the protozoans, particularly the Cryptosporidium spp. and the Giardia spp., which in recent years have been responsible for several waterborne-disease outbreaks around the world [5,8].
In order to mitigate the impacts on population health, the UN adopted a group of global objectives in order to improve people’s quality of life, among these are the Sustainable Development Goals (SDG 6), with goals to be reached by 2030, including achieving universal and equitable access to potable water, in a safe manner, covering both urban and rural environments [9].
Among the actions which can be implemented to fulfill UN’s goals is the preservation of most common native vegetation (savannah and countryside) in the Cerrado Biome, as they contribute to the maintenance of water resources [10] and interfere in the parasitic quality of raw water [11]. In addition, surface water destined for human-consumption water supply systems and solutions should be monitored, as established in Brazil by the Decree n. 888 of the Ministry of Health [12].
Besides these actions, it is possible to estimate the daily and annual risk of infection, by pathogens, of the population, which allows to infer the possible contamination of water for human use through micro-organisms of fecal origin. The quantitative microbial risk assessment (QMRA) is an alternative, which uses a mathematical model combined with contamination scenarios, dose–response relationship, population at risk, exposure routes and information of the treatment barriers, when existing, and also pathogenic-agent-specific characteristics [13]. The potential effects of pathogenic exposure, daily and annual, must be inferior to the accepted risk of infection per 10,000 inhabitants (10−4) [14]. This risk has also been quantified in watercourses in the United States [15], Costa Rica [16], Brazil [17,18,19] and Canada [20].
There are several risk factors which cause threats to the Cerrado, particularly the deficit in inspection, deforestation, unorderly expansion of the agricultural and livestock farming borders, forest fires and environmental contaminant agents which provoke water and soil pollution. Thus, considering that the Cerrado Biome has the richest hydrological net in Brazil [21], covering the source of three important South-American watersheds, São Francisco, Tocantins-Araguaia and Paraná [22], it is of extreme importance to study the probability of infection from the consumption of surface-source water located in the urban and rural areas of this Biome.
In this context, this study aimed to evaluate the annual risk of infection by cryptosporidiosis and giardiasis in a population in the Cerrado biome and its relationship to risk factors coming from land use and occupation.

2. Materials and Methods

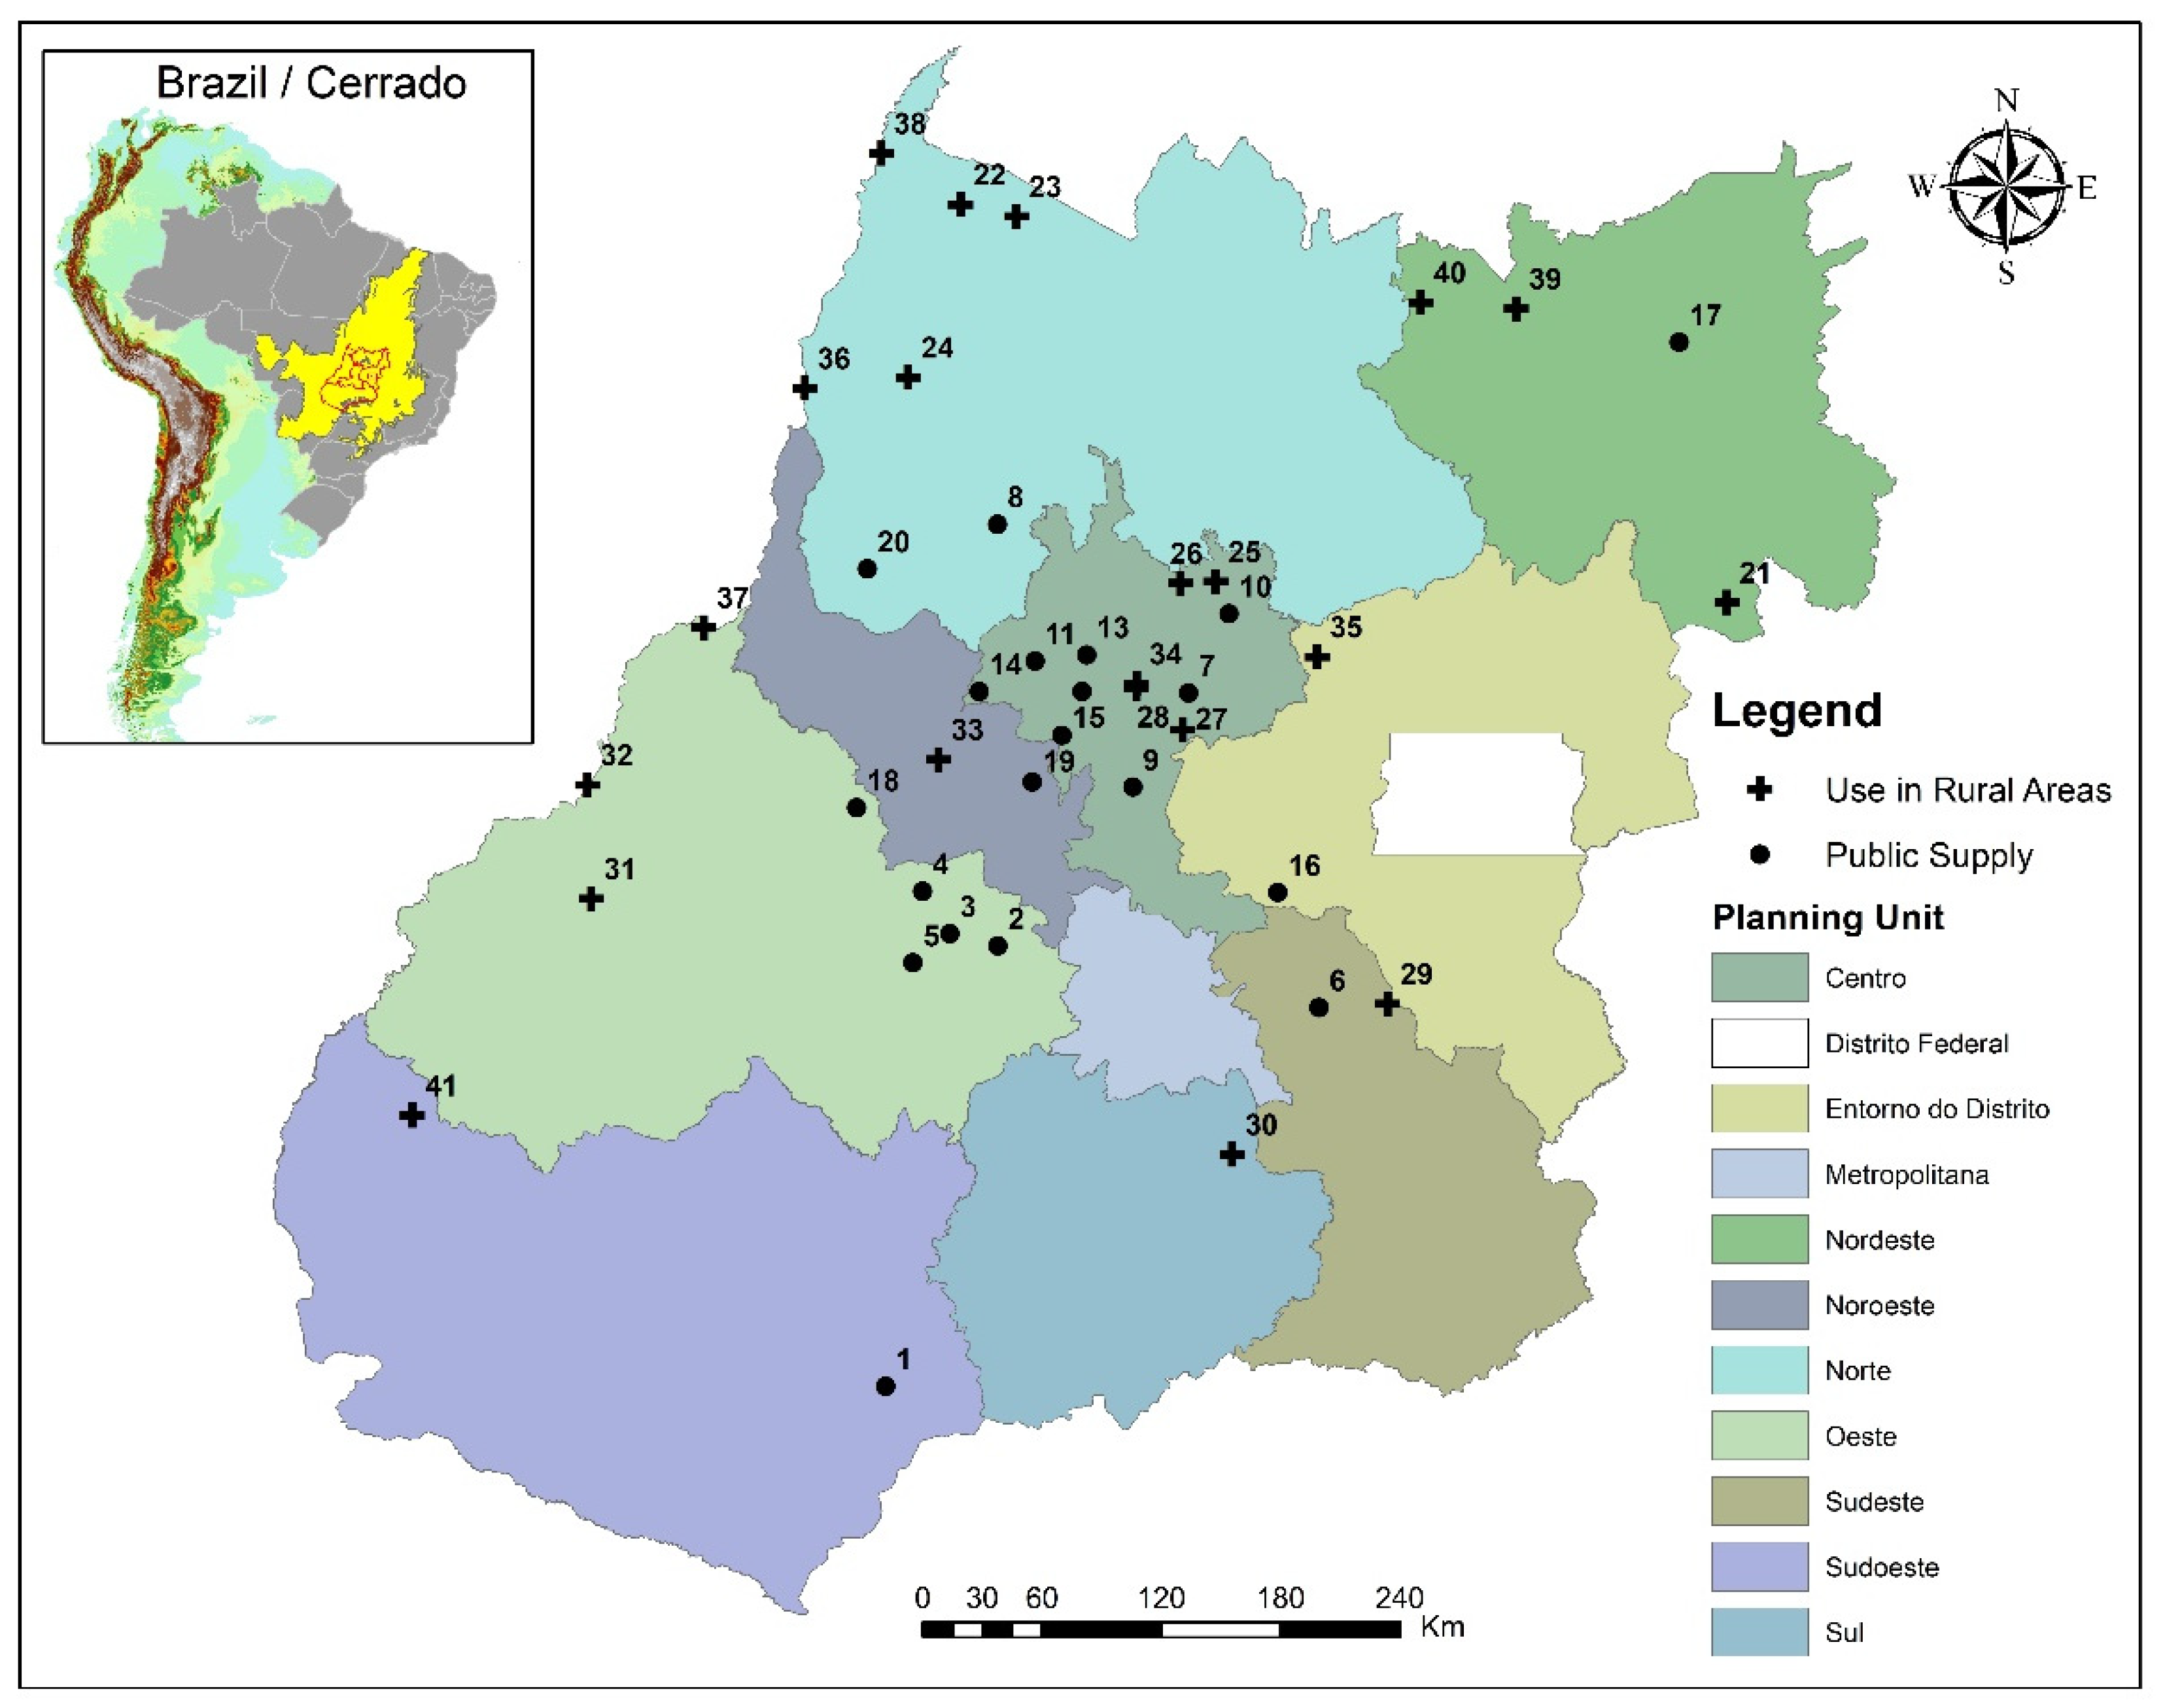
2.1. Area of Study and Sampling

The area of study covers 41 watersheds (WS) of the state of Goiás, all of these with their respective sources belonging to the Brazilian Cerradoi biome [10], with humid tropical predominant climate [23].
Of the outlined WS, 51.2% (21/41) (Figure 1) are located in rural communities (quilombola, riparian or agrarian reform settlements), where the consumption of untreated raw water is common, due to the challenges of universalization of sanitation services, the local economic hardships and lack of knowledge or resistance to the process of disinfection using chlorine [3]. Besides that, the surface sources are commonly used for leisure activities, domestic services, food growing and other similar activities.
The remaining 48.8% of the watersheds (20/41) (Figure 1) are related to places where collection for public supply is conducted, the monitoring of protozoans in raw water being extremely important [24], given that the possible contamination of the water sources, failures in the treatment process and contamination of reservoirs were responsible for 82% of the outbreaks of waterborne diseases reported between 2011 and 2016 [5].
In order to contribute to the decision making regarding planning and management of hydric resources, the sampling points were distributed among Hydric Resources Planning and Management Units in Figure 1 [25].
The collection of raw water was conducted in punctual manner in all the 41 watersheds’ outlets, between September 2019 and October 2020, considering the accessibility conditions.

2.2. Collection and Parasitological Analysis

For the quantification analyses of (oo)cysts of the protozoans Cryptosporidium spp. and Giardia spp., 20 liters of raw-water sample were collected from each point, and stored within polyethylene recipient, previously cleaned with elution solution (Tween 80 at 0.1%). Next, the samples were transported under refrigeration to the Water Analyses Laboratory (LAnA) located in the School of Civil and Environmental Engineering (EECA) of the Federal University of Goiás (UFG), where the analyses were conducted. For this, the Membrane Filtration method was applied (MF) [26,27] with the application of direct Immunofluorescence Assay (FA) in the blades preparation step, employing the Kit Merifluor® (Meridian Bioscience Diagnostics, Cincinnatti, EUA).
The (oo)cysts were detected by the bright fluorescent apple-green color; absence of pores or appendixes; side of 8–18 μm length, 5–15 μm width and oval format for Giardia cysts; size of 4–6 μm in diameter and sphere format for Cryptosporidium oocysts [28]. The results were expressed in (oo)cysts/L, calculated using Equation (1) [29].
CP = N º   of   ( oo ) cysts   visualized Volume   of   analyzed   sediment   ( μ L ) × Volume   of   obtained   sediment   ( μ L ) Volume   filtered   from   the   sample   ( L )
where:
CP = Protozoan concentration ((oo)cysts/L).
In the quality control tests to verify the method’s reliability, three samples of 2 L of ultra-pure water were contaminated with (oo)cysts obtained from the inoculum of (oo)cysts from the Kit Merifluor®.

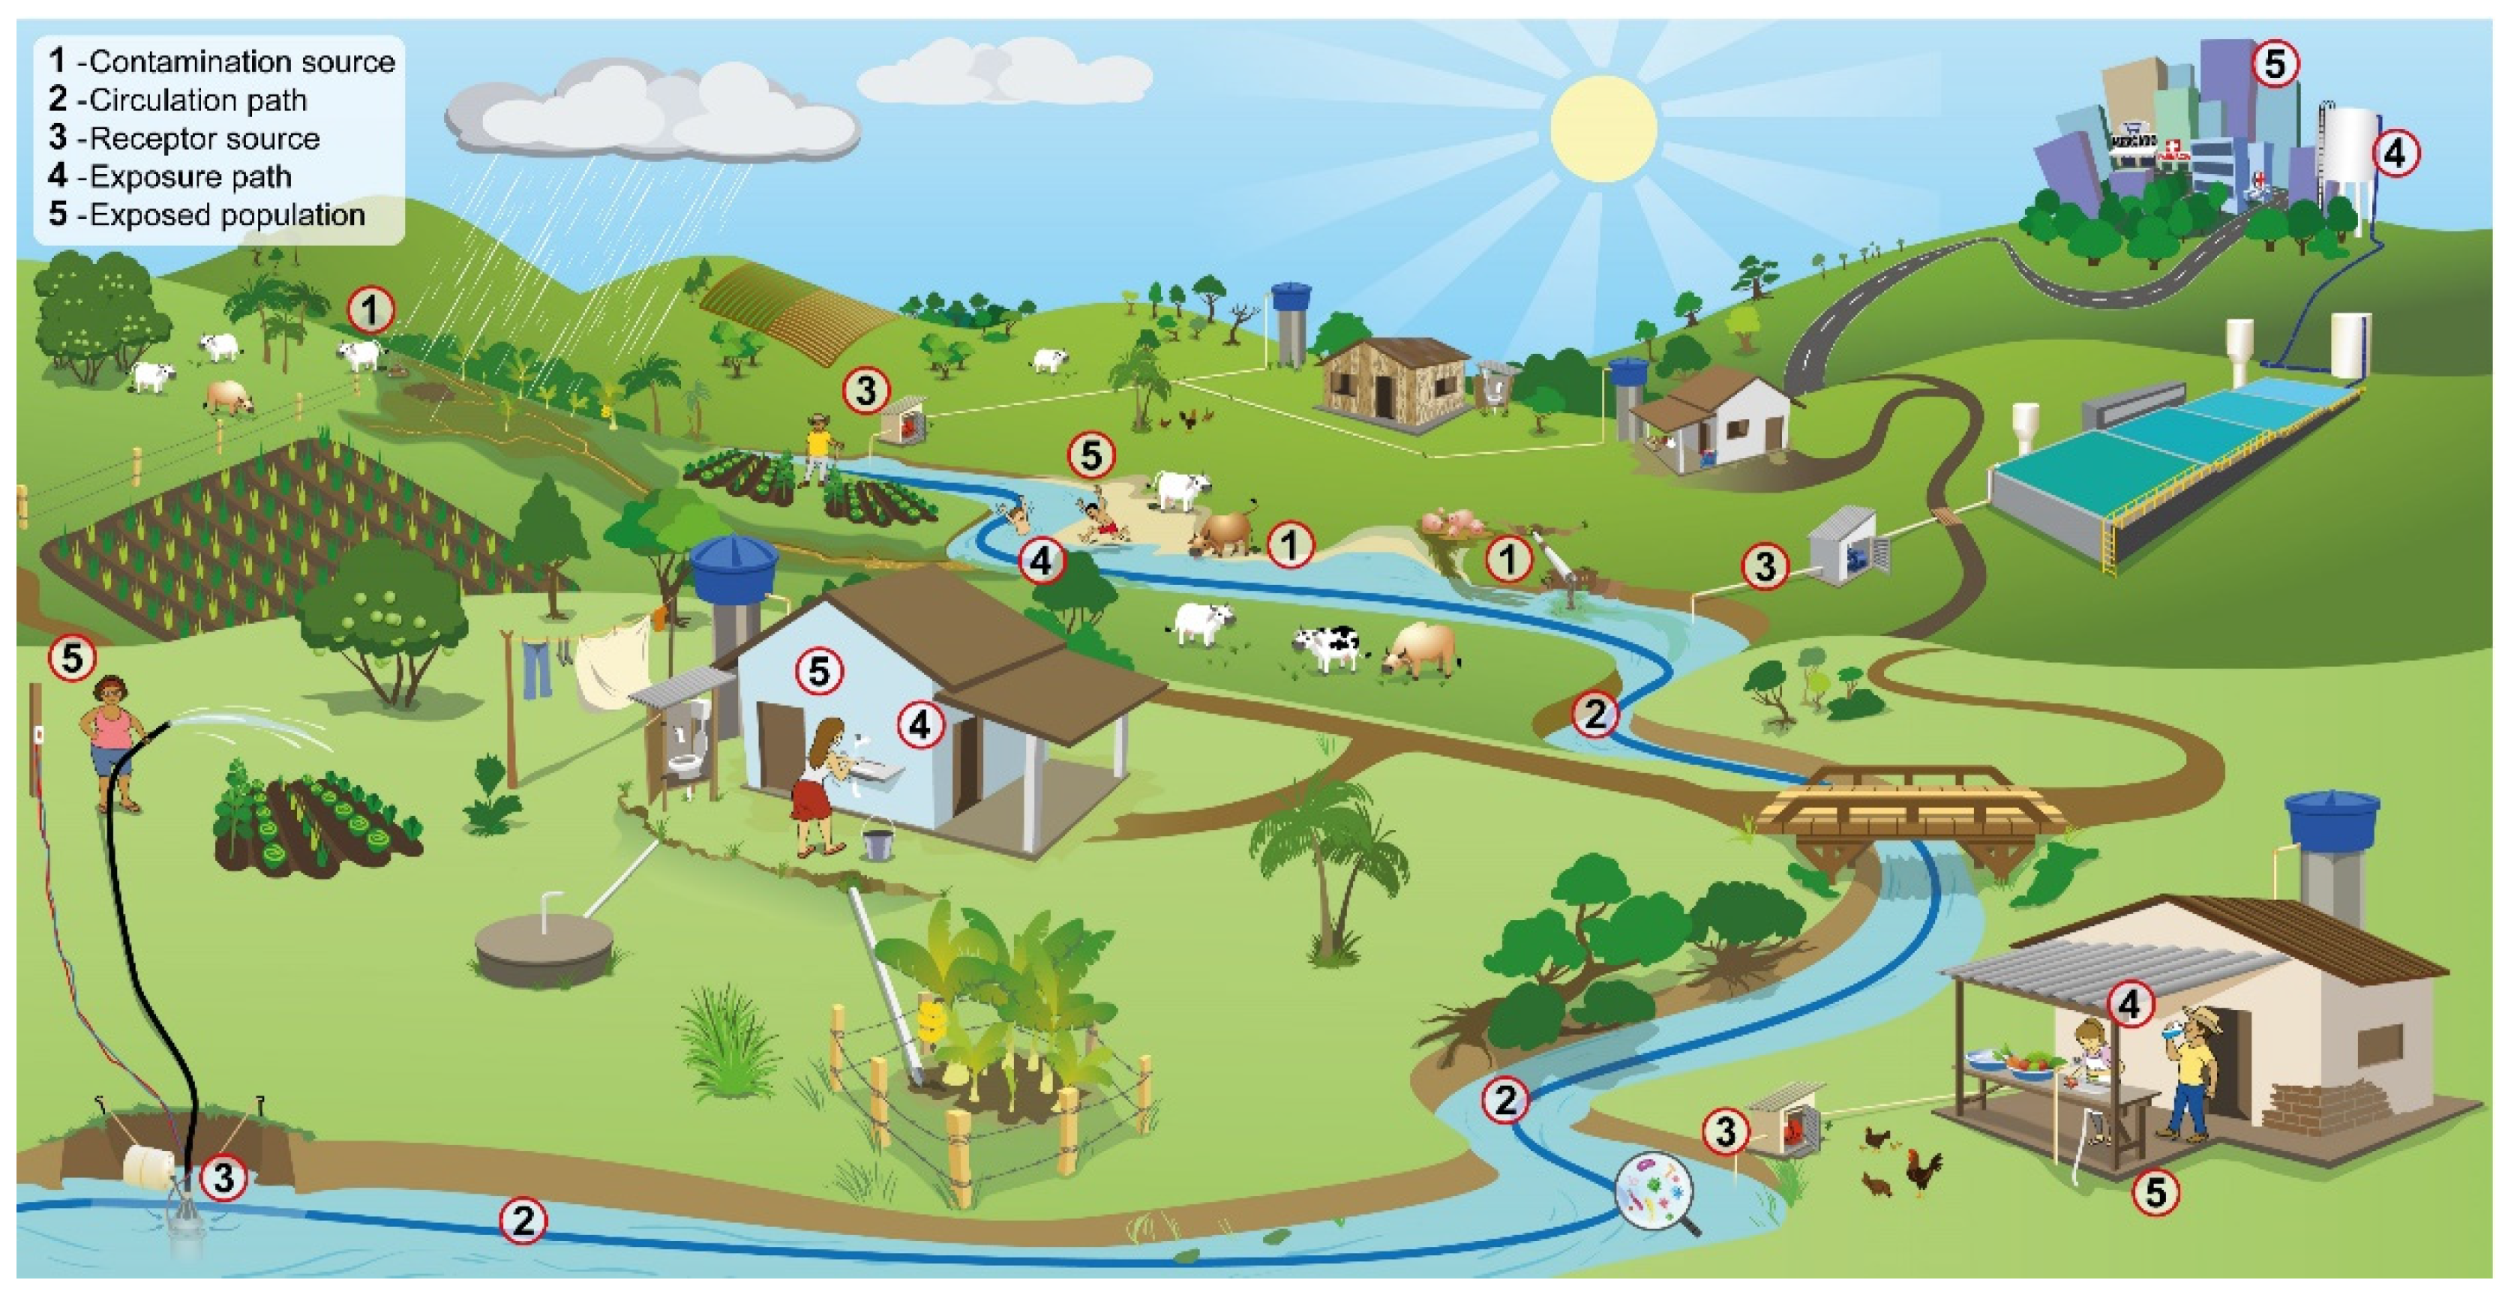
2.3. Probability of Infection

The probability of micro-biological infection risk was determined by QMRA [13]. It is an evaluation model developed in the following steps: (i) identification of dangerous agents or ‘pathogen-reference’; (ii) exposure evaluation; (iii) dose-response evaluation; and (iv) risk characterization [13]. This study did not analyze clinical cases of cryptosporidiosis and giardiasis in the population residing in rural and urban areas of the Brazilian Cerrado.
The pathogen reference selected in this study were the Giardia spp. and Cryptosporidium spp. (oo)cysts. In the case of pathogen concentration below the method’s limit of detection (LD), the minimum concentration of 1 (oo)cysts/L was adopted, according to USEPA [28], given that the analyses considered as absent underestimate the risk.
The exposure meaning analyzed was the ingestion of raw water from surface source, considering a scenario of consumption without previous treatment, similar to other published studies [20,30,31]. Thus, the worst case possible was adopted, due to possible failures in the treatment system, which could cause infections in the exposed population [5]. The possible means of exposure are illustrated in Figure 2.
Equation (2) was adopted to estimate the amount of pathogens ingested by an individual in a single exposure event [13].
d = N T r .10 R . V
where d is the average dose of Giardia spp. and Cryptosporidium spp. (oo)cysts ingested in each exposure event; N is the average concentration of the aforementioned (oo)cysts in the consumed water; Tr is the rate of recovery of the pathogen’s quantification method; R is the rate of pathogen removal in water treatment (%); and V is the per-capita consumption of water ingested per day (L/day).
The dose-response evaluation results are of experimental studies on the effects on the health of the population exposed to concentrations of Giardia spp. and Cryptosporidium spp. (oo)cysts ingested by the population [13]. To estimate the probability of infection for a single exposure, an exponential mathematical method was used (Equation (3)), which has already been used in previous research [14,31,32].
P Inf ( d ) = 1 e ( d . r )
where PInf(d) is the probability of daily infection for a single exposure; d is the average dose of pathogens ingested per exposure (Equation (2)); amd r is the characteristic parameter of dose–response interaction.
Regarding the characterization of risk, the annual infection probability was estimated from Equation (4) [13]. Due to the inexistence of a limit value in Brazil for the characterization of acceptable risk, the USEPA [14] concept of acceptable risk of annual infection of 10−4 was adopted. This level is appropriate to guarantee the safety of water destined for human consumption [33].
P Inf ( a ) = 1 [ 1 P Inf ( d ) ] n
where PInf(a) is the probability of annual infection resulting from n exposures to the same dose; and n is the number of exposures per year.
The parameters used to determine the probability of infection are presented in Table 1 for the pathogen reference used in this study

2.4. Characterization of Land Use and Occupation

The area of each watershed was outlined in automated form by the GRASS tool, an extension available within the software QGIS® (version 3.18) from the use of the algorythm r. watershed, based on data from the digital elevation models do Shuttle Radar Topography Mission (SRTM), in 30 m resolution, made available by the United States Geological Survey (USGS).
The data on use and occupation of land were extracted from the database in Colletion 3.1 of MapBiomas, concerning the year of 2017 [34] and categorized into forest, non-forest natural formation, pasture, agriculture, agricultural and pasture mosaic, area without vegetation and water bodies.

2.5. Statistical Analysis
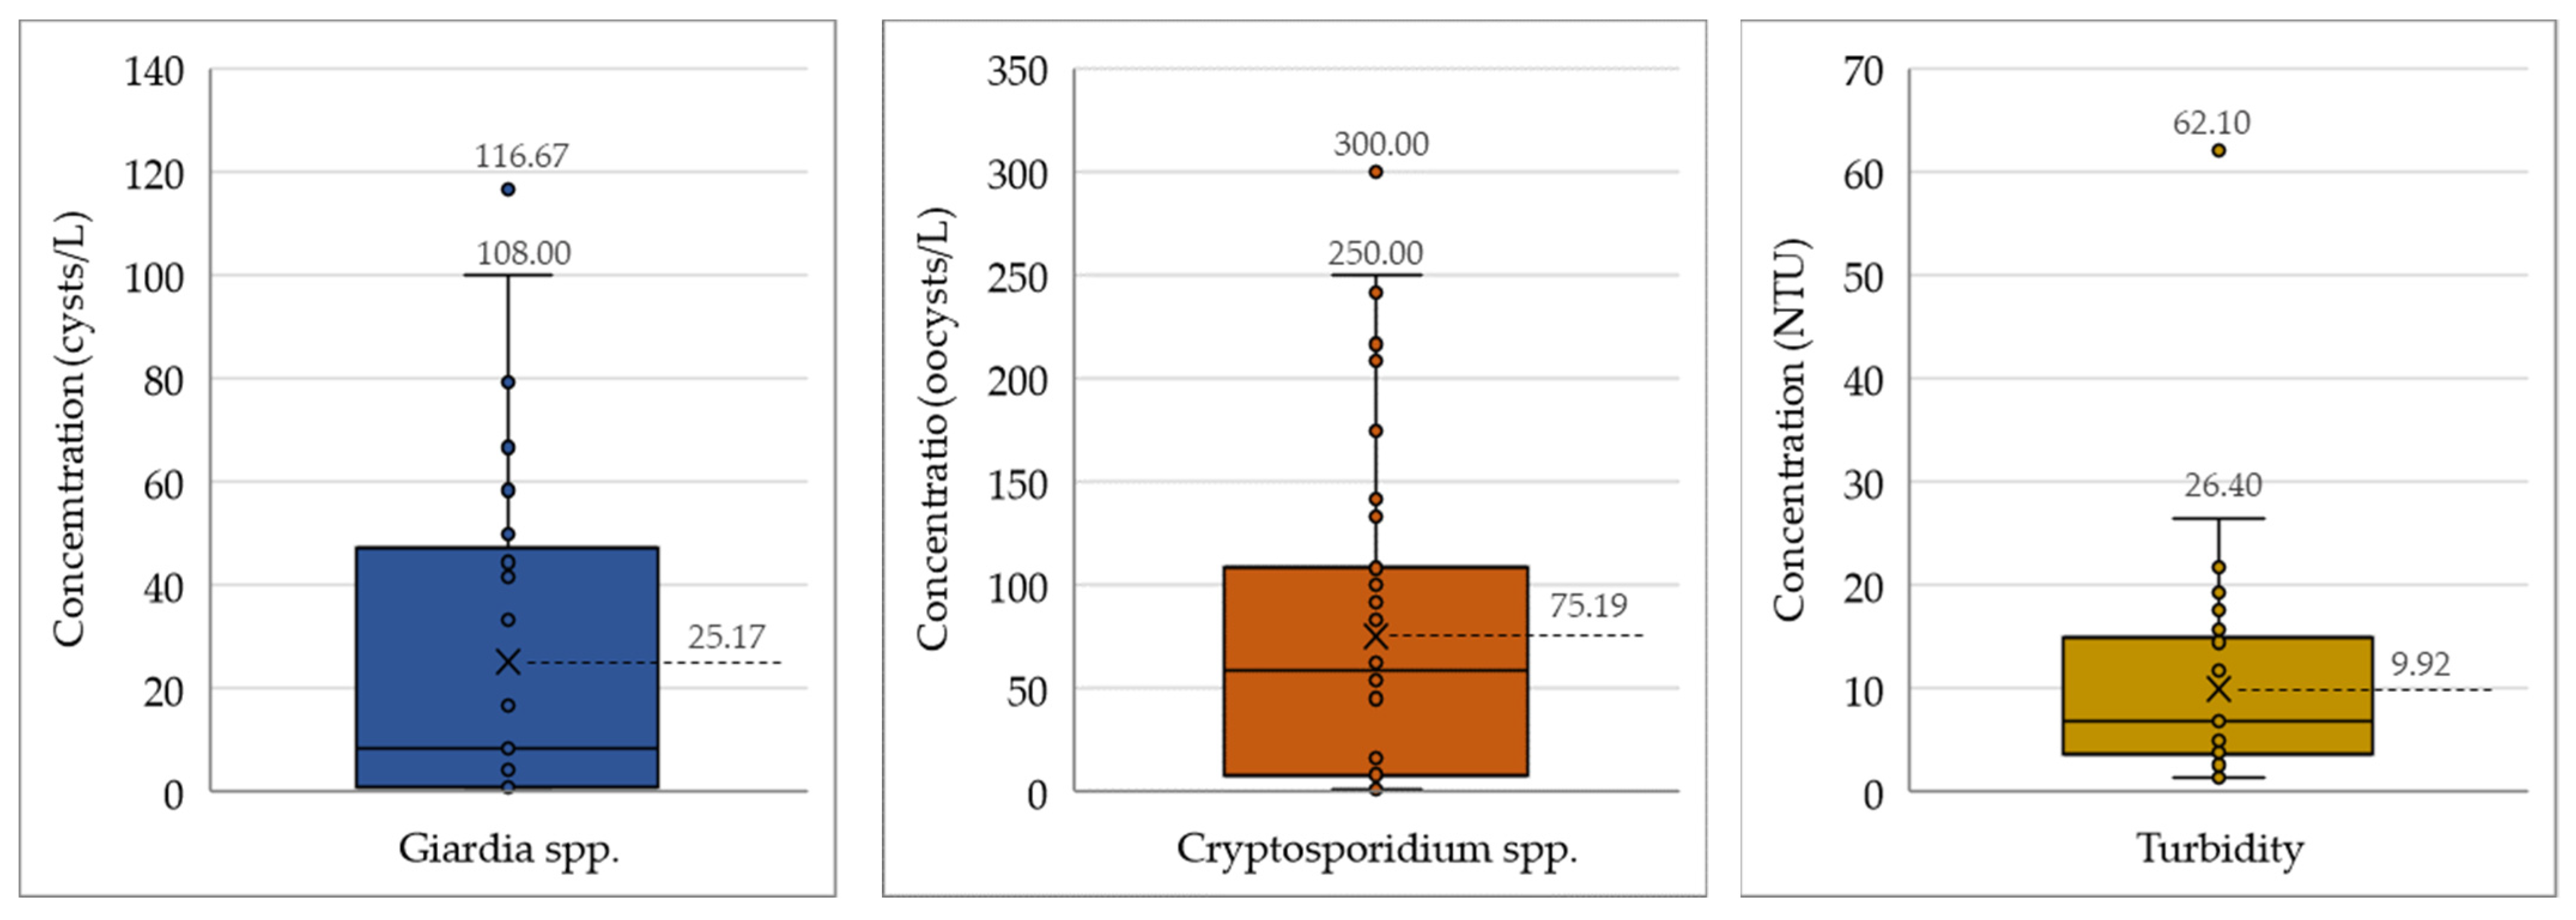
Using the Pearson’s correlation analysis, we determined of the association of Giardia spp. cysts and Cryptosporidium spp. oocysts concentration among themselves and qualitative/quantitative variables (land use and occupation, watershed area and raw-water turbidity), through the program R 4.0.2 [35].
From the correlation’s result, a model was proposed to preview, with certain precision, the quantitative of (oo)cysts of the protozoans to be identified in the raw-water sample, from the characterization of the watershed. For this, a linear and/or multiple regression was used, considering only the variables which presented better correlations with the protozoan (oo)cysts concentration.
Seeking to find the association to the concentration of protozoans and the main typologies of land use and occupation, multiple correspondence analysis (MCA) was used in the program R 4.0.2 [35] using the FactoMineR (for analysis) and Factoextra (for data visualization). For this, the data regarding forest, agriculture and pasture were classified as “below 30%”, “between 30 and 50%”, “between 50 and 80%” and “above 80%”. The concentration of Giardia spp. was characterized as “below 0.05 cysts/L” and “above 0.05 cysts/L”, in conformity to the alert level of 0.03 to 0.05 cysts/L suggested by [36] and the concentration of Cryptosporidium spp. as “below 0.3 oocysts/L’ and “above 0.3 oocysts/L”, according to the alert level of 0.1–0.03 oocysts/L [37].
This exploratory technique allows the visualization of the association between different qualitative variables in a graphic. The value of “cos2” varies from 0 to 1, parameter which defines the quality of the correlation coefficient of the active variables with the studied dimensions, if the sum of “cos2” is next to one (1), the variable is well-represented by the adopted dimensions [38].
Cluster analysis was adopted for the definition of parameter groups which possess characteristics in common.

3. Results

The results revealed prevalence of the (oo)cysts of Giardia spp. and Cryptosporidium spp. protozoans in watercourses in the state of Goiás (Table 2), particularly the surface sources with identification (ID) 1, 14 and 18, which presented the maximum values of 116.67 cysts/L and 300 oocysts/L (Figure 3). The average value of Giardia spp. and Cryptosporidium spp. was, respectively, 25.17 cysts/L and 75.19 oocysts/L (Figure 3). Of the total amount of analyzed samples, 63.4% were positive for Giardia cysts and 87.8% for Cryptosporidium oocysts.
The turbidity results (Table 2) obtained in each surface source studied (Figure 1) were distributed between 1.37 and 62.10 NTU; the maximum value of 62.10 NTU belongs to Palmeiras Creek (ID 18) (Figure 3). The values are in accordance with Brazilian regulations for freshwater bodies, classes 1, 2 or 3, used for human consumption after treatment, which establishes Turbidity ≤ 100 NTU [39].
In all the analyzed watersheds, the annual infection risk by the pathogen reference surpassed the acceptable risk of 10−4 [14] in the magnitude of at least 9.94 × 10³; therefore, the surface sources presented unfavorable parasitological conditions for human consumption. The results indicated an annual risk in all surface sources analyzed of 1.00 for Giardia cysts (Table 2) and of 9.94 × 10⁻¹ for Cryptosporidium oocysts in Poções Creek (ID16), Pombal River (ID25), Retiro Creek (ID31), Gameleira Creek (ID34) and Macaco Creek (ID40), whereas the other sampling points an presented infection probability equal to 1.00. Thus, the average annual risk caused by oocyst was of 9.99 × 10⁻¹ (Table 2).
The results of land use and occupation are presented in Table 3 and Figure 4 and categorized in forest, non-forest natural formation, pasture, agriculture, agricultural and pasture mosaic, area without vegetation and water bodies.
Generally, the watersheds are predominantly occupied by agribusiness activities, in which the average percentage of pasture identified was of 51.68% (CV 0.45), while forests were 36.98% (CV 0.59) and agriculture 7.31% (CV 1.76) (Figure 4). The WS of Morcego Creek (ID 17) has the maximum percentage of forest (99.53%) and the Retiro Creek of pasture (87.80%), as shown in Table 3 and Figure 4.
The watershed with a percentage of man-made cover of the type pasture above 50%, such as the basins with ID 2–5, 7, 9, 11, 12, 14, 15, 18–20, 22–24, 31–33 and 36–38 present a greater risk of infection of parasitic diseases, as they are associated to elevated protozoan concentration above the alert level (Figure 5). The watersheds with ID 8, 10, 17, 21, 25, 27, 28, 34, 35, 39 and 40 seem better preserved and with a smaller contamination risk, due to the high incidence of forests at a percentage above 50% (Figure 5).
In Table 4, the results of Pearson’s linear correlation for the presence of (oo)cysts of Giardia and Cryptosporidium are presented, as well as the qualitative/quantitative variables.
The application of the multiple regression model allowed for the obtaining of Equation (5) for the estimated concentration of Giardia spp. cysts in a surface source based on the area percentage of a watershed occupied by forest and the mosaic of agriculture and pasture, which presented an R2 of 0.25, and a minimum percentage error of 5%, and a maximum of 769%. For the estimation of Cryptosporidium spp. oocysts, Equation 6 was obtained through the simple linear regression between oocysts and the percentage of area occupied by pasture, which presented an R2 of 0.28, and a minimum and maximum percentage error of 2% and 1301%, respectively.
concentration   of   cysts = 32.08 0.35 forest   area + 3.45 mosaic   area
concentration   of   oocysts = 22.87 + 1.89 pasture   area
Figure 5 shows the distribution of variables along two dimensions of the MCA, with greater dispersion along the horizontal axis. These two first dimensions explain 54.20% of the variability in the group of analyzed data, being that the parameters “pasture between 30 and 50%”, “forest above 80%”, “pasture below 30%”, “pasture between 50 and 80%” and “concentration ‘above 0.3 oocysts/L’ and ‘below 0.3 oocysts/L’” were well-represented by the two dimensions, as verified by the gradient which indicates the “cos2” value next to one (1). The other variables need more than two dimensions to perfectly represent the data.
The group of qualitative variables were organized into four cluster groups (Figure 6). In the first group, the concentration of Cryptosporidium below 0.3 oocysts/L was better associated to the occurrence of pasture below 30% and forest above 80%. In the third group, the concentrations above 0.3 oocysts/L and 0.05 cysts/L were better associated to pasture above 50%, followed by the percentage of forest below 50% and agriculture below 30% (Figure 6). In a fourth group, the concentration of Giardia below 0.05 cysts/L is identified in WS with occurrence of forest and agricultural areas between 50 and 80, indicating, thus, that the less man-made interference watersheds suffer, that is, with more forest and less pasture, the less susceptible they are to the occurrence of these protozoans and, consequently, they have a lower risk of parasitic diseases.

4. Discussion

The inspection of the quality of water sources, particularly the parasitological conditions, is of imperative importance, since the protozoan Cryptosporidium spp. and Giardia spp. present high infectiousness, survive for long periods of time in the environment and are resistant to the traditional process of disinfection of water with chlorine [24,40,41,42]. The ingestion of few (oo)cysts may cause infection in a susceptible host [43].
The negative impacts to public health due to parasitological quality of the surface sources in the Brazilian Cerrado may spread to larger extensions, trespassing the national border, since this Biome contains the spring of the three biggest watersheds in South America [44]. The inspection of parasitological contamination may allow managers in the health sector to identify the source of contamination and establish necessary actions to limit transmission and prevent outbreaks [8].
In general, the concentration of pathogens in different surface sources of the Brazilian Cerrado (Table 2 and Figure 1) was superior to other research which analyzed the same hydric environmental compartment, such as in one important water gathering watershed in the Southeast region of Brazil, where the maximum concentration of 3.4 cysts/L and 0.1 oocysts/L [2] was identified. Another example was on South Nation River and Grand River, in Canada, with average values of 0.1076 and 0.1550 Cryptosporidium spp./L oocysts, respectively [30].
For each sampled location, it was assumed that there would be no water treatment barriers or that treatment technology was ineffective in the removal and deactivation of pathogens; hence, the GI disease annual infection risk from the consumption of water without previous treatment presented an average value of 1.00 of Giardia and 9.99 × 10⁻¹ for Cryptosporidium (Table 2); thus, all the analyzed surface sources exceed the acceptable risk of 10−4 established by USEPA [14].
Besides facing a significant challenge to implement actions of hydric intervention, once that they lack resources and professionals with technical knowledge and experience [31].
The QMRA results, the standard method to evaluate giardiasis and cryptosporidiosis infection risk in developing countries [44], indicated greater worry with the annual average infection risk by Giardia spp. ( P Inf ( a ) = 1 ) (Table 2). In research conducted in Canadian supply sources, the probability of annual infection by Giardia spp. cysts was 9.2 times the risk of contamination by cryptosporidiosis [31].
It is observed that for the calculation of QMRA, it was considered that all the (oo)cysts were infectious for humans; therefore, the absence of investigation into the ineffectiveness of the (oo)cysts constitutes a significant limitation of the model [15], given that only the species of C. hominis and C. parvum [45,46] and G. duodenalis [47] cause diseases in human beings. In possession of that information, the results of risk are analyzed in a liberal manner [48], as they help in understanding the risks related to the pathogen and non-pathogen species present in the water.
Besides that, the risk of infection probability calculation method adopted in this research, as well as in other works [15,20,30], did not take into consideration that immune-compromised individuals, such as the elderly, children, pregnant women and HIV carriers are more vulnerable to the infection by these pathogens.
In Brazil, there are no epidemiological data on cryptosporidiosis and giardiasis in the studied regions, since these do not belong to the list of diseases of compulsory notification in public and private health services, according to Portaria nº 888 [12]. However, even in the absence of these data considered a gold standard, Burch [49] proved that the QMRA is a valid method to predict disease rates due to cryptosporidium and giardia, after comparing the results obtained with epidemiological measurements of outbreaks of gastrointestinal diseases.
Despite, in this study, the risk of giardiasis being greater, at a world level such behavior was diverging: the reports of waterborne protozoan disease outbreaks between the years of 2011 and 2016 had as etiologic agent the Cryptosporidium spp. in 67% of the cases and Giardia spp. in 37% [5]. In the period between 2017 and 2020, the percentage was 76% and 19%, respectively [8]. In Goiás, the incidence of ADD was of 15.50 per one thousand inhabitants in the year of 2010 [6]; therefore, it is worthy of detailed epidemiologic investigation into infectious waterborne diseases in municipalities [12].
The statistical analysis (Table 4) revealed that the concentration of cysts found was moderately correlated to the mosaic of agriculture and pasture (0.452) and it was inversely related to the percentage of forest area (−0.327), while the presence of oocysts was better associated with the presence of pasture (0.532), indicating that the greater the pasture area, the greater the concentration of protozoans. In addition to this indicator, it was also observed that the presence of oocysts is related to turbidity; it presented a linear correlation of 0.455. The influence of conditions of land use in the parasitology quality of the surface sources was confirmed in the study conducted in Costa Rica, where the presence of urban areas promoted greater protozoan concentration [16].
Table 4 shows that there is moderate correlation among the water-quality parameters. For example, when the turbidity increases there will be a significant count of Cryptosporidium spp. oocysts in the environmental samples, similar to the results obtained in raw-water samples in Australia, in which turbidity was related to greater concentration of Giardia and Cryptosporidium [50].
The population residing in the watersheds with pasture percentage above 50% is more susceptible to infections (Table 3, Figure 3 and Figure 4), given that this type of land use was associated to a concentration above alert level of 0.03 to 0.05 cysts/L [36] and 0.1–0.3 oocysts/L [37], in which a single sample above these limits increases the exposure to protozoans identified in the watershed of Olho D’água Creek (ID 14) and Palmeiras Creek (ID 18) (Table 2), in which pasture was predominant in 71.19% and 81.14%, respectively (Table 3).
These results suggest that the excrements of bovines can be a pollution source for the analyzed surface sources. The watersheds with predominant urban areas in Costa Rica presented a greater concentration of pathogens and the urban sewage spill was characterized as the main pollution source, hence there being no seasonal variation in the protozoan concentration [16].
The use of land identified as agriculture, with percentages between 50 and 80%, was statistically related to the concentration of Giardia spp. below 0.05 cysts/L (Figure 3 and Figure 4). This type of soil is partially recommended for water-collection basins for supply, given that it has the capacity of retaining microbial polluters [51].
The watersheds with forest percentage above 50% (Figure 3 and Figure 4) may indicate that the source is protected, given that the incidence of (oo)cysts is below the alert level of 0.03 to 0.05 cysts/L [36] and 0.1–0.3 oocysts/L [37]. However, in general, these surface sources also present unfavorable parasitological conditions to human consumption, given that the risk of infection surpassed the preconized limit by USEPA [14] and the passage of (oo)cysts through the treatment barriers might compromise the population’s health and cause GI disease outbreaks [31].
The transitions of land use of the Cerrado biome, until 2019, indicated a deforestation of 46%, being that 31% of the areas were transformed into pasture, 9% into soy plantations, 2% into sugarcane plantation and 2% in other cultures [10], corroborating, thus, to the results that the use of land has effects regarding the risk of protozoan infection, given that the low indexes of protection of this biome affect the vital hydric resources [44].
The estimator models of protozoan (oo)cysts hereby developed, despite presenting great error amplitude, make it possible to realize a preliminary evaluation of the presence of the aforementioned from informations of use and occupation of land and they can contribute with data for water safety plans (WSP), based on the identification of risk scenarios related to the type of land use in WS.

5. Conclusions

The presented work allowed to conclude that:
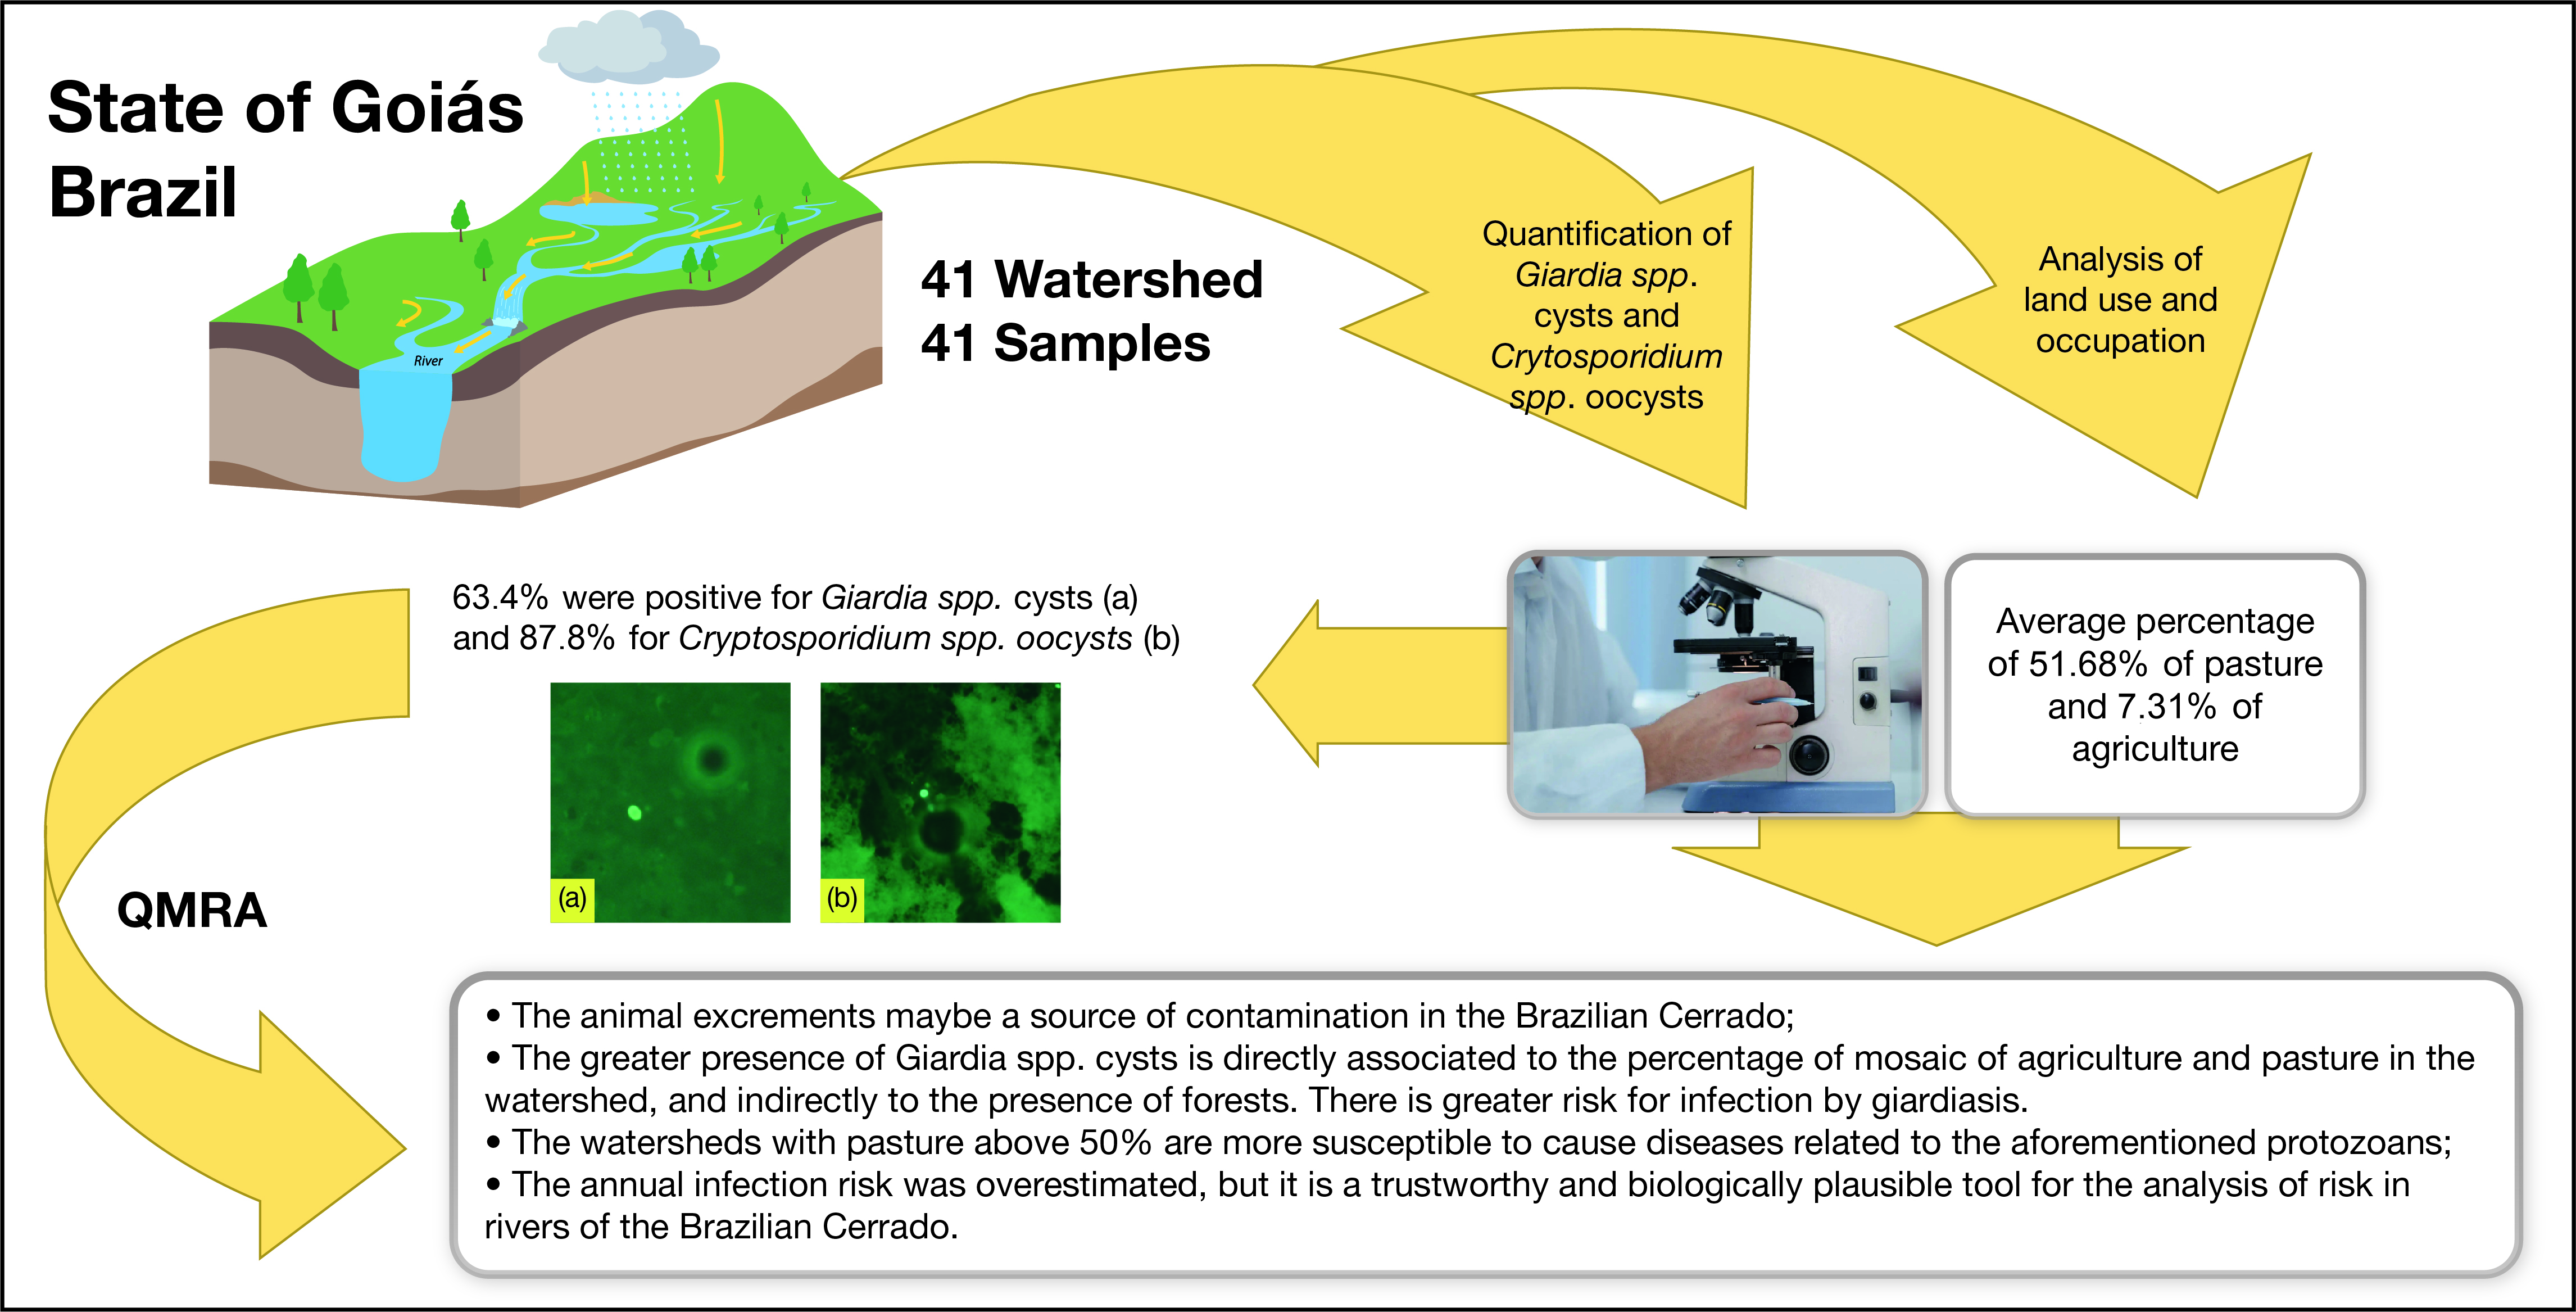
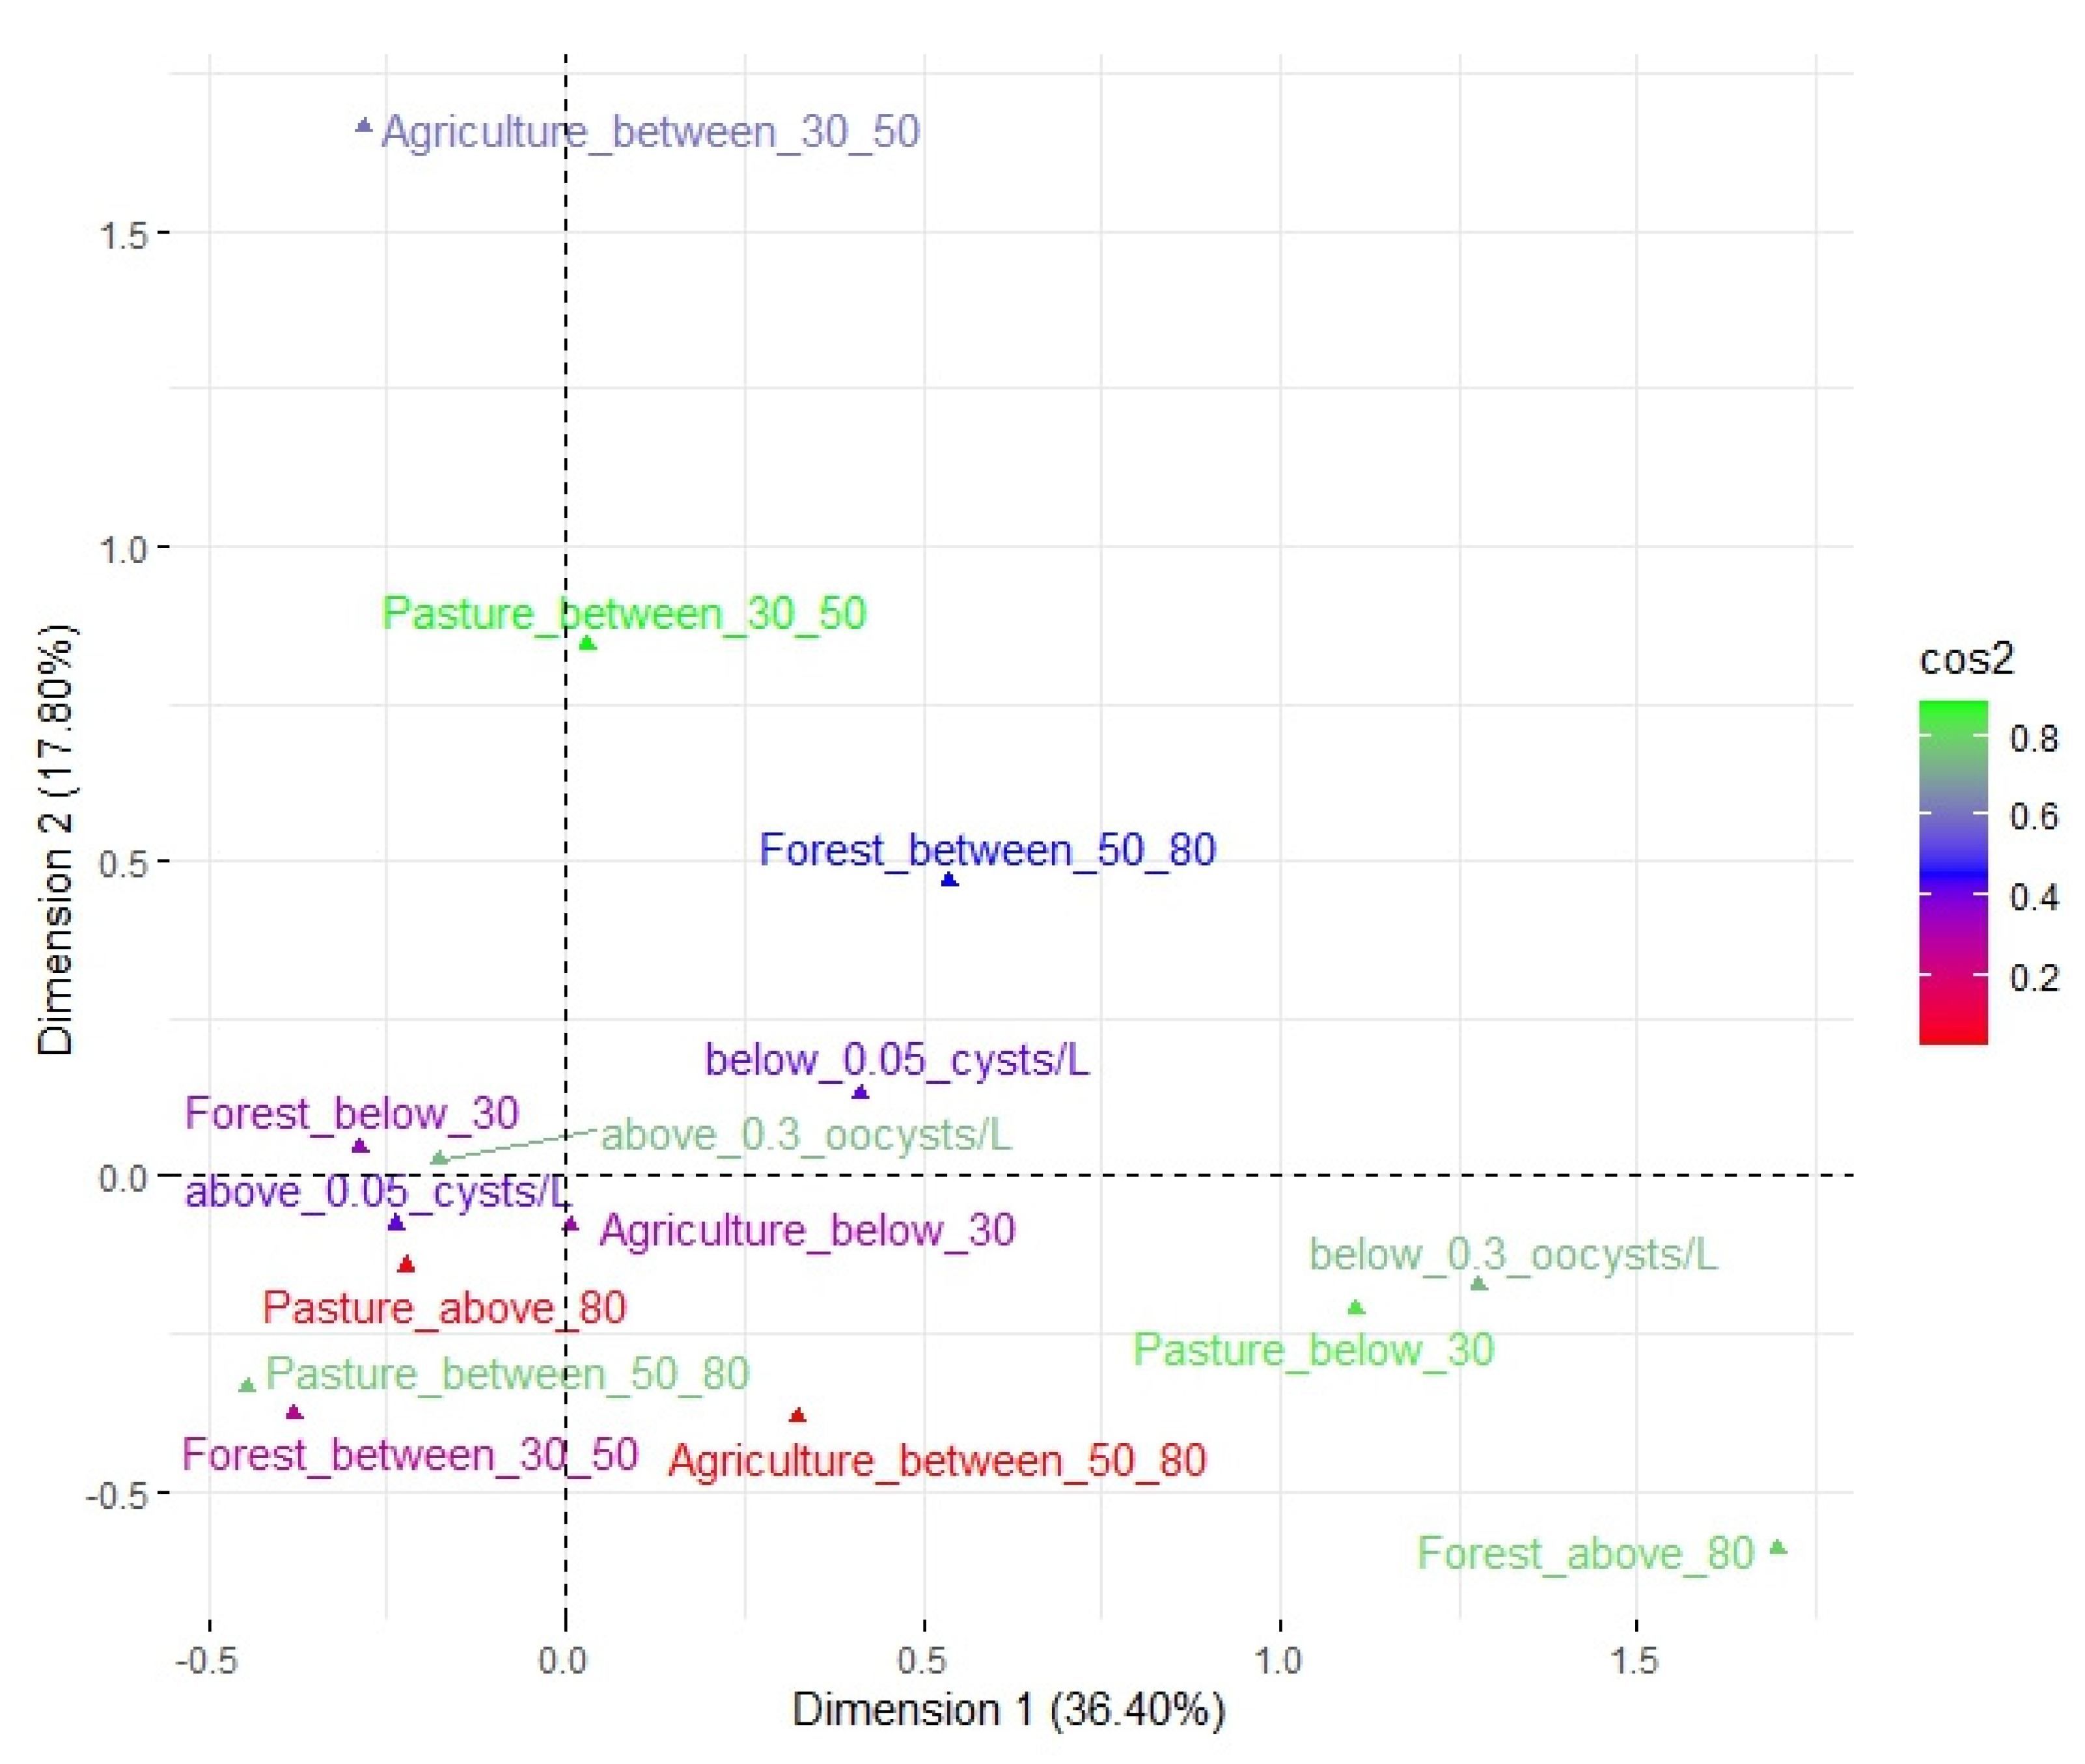
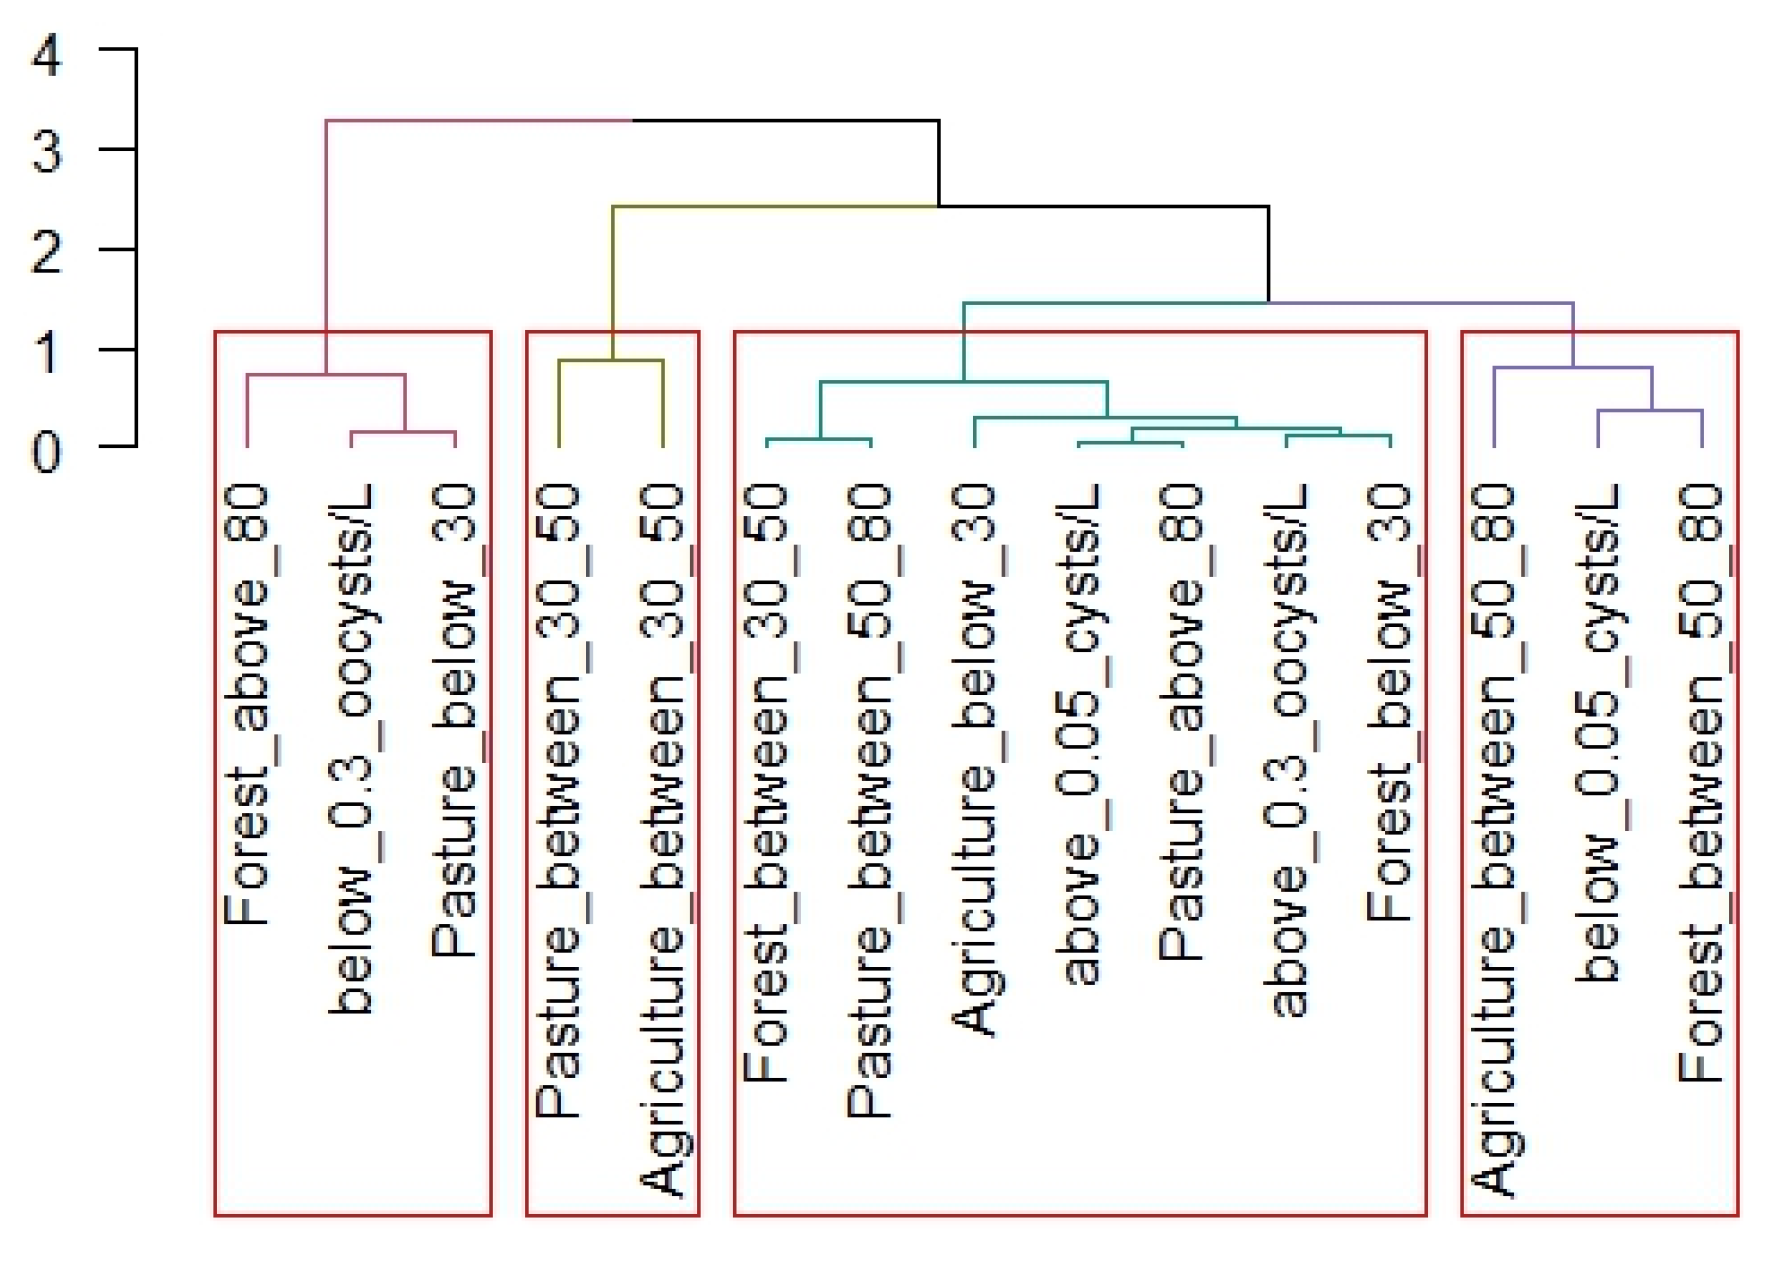
  • Animal excrements may be a source of contamination in the Brazilian Cerrado, that is, a potential risk to public health. Given that, the greater presence of Cryptosporidium spp. oocysts is associated to watersheds with greater use by pasture and lesser presence of forests
  • The greater presence of Giardia spp. cysts is directly associated to the percentage of mosaic of agriculture and pasture in the watershed, and indirectly to the presence of forests. There is greater risk for infection by giardiasis.
  • The watersheds with pasture above 50% are more susceptible to cause cryptosporidiosis or giardiasis infection, and those with forest above 50% as safer due to a lower concentration of the protozoans. However, all waters are inadequate for consumption without previous treatment.
  • The annual infection risk was overestimated, but it is a trustworthy and biologically plausible tool for the analysis of risk in rivers of the Brazilian Cerrado, which contribute to three massive South American watersheds.
Finally, the studied surface sources located in the Brazilian Cerrado possess high incidence of Giardia spp. cysts and Cryptosporidium spp. oocysts. These little systems require financial investment, environmental quality action improvements and management of the use and occupation of land to mitigate the risks to the health of the population.

6. Recommendations

  • A detailed epidemiological investigation in the cases of ADD in the analyzed municipalities is recommended for validating the estimated risk of infection using the QMRA.
  • It is recommended to amplify the temporal period for sample collection and the acquisition of data regarding use and occupation of land in better resolutions to improve the precision of the (oo)cysts estimator model.

Author Contributions

Conceptualization, D.P.d.S. and P.S.S.; methodology, D.P.d.S.; formal analysis, D.P.d.S. and R.E.B.; investigation, D.P.d.S.; resources, P.S.S.; data curation, D.P.d.S., R.E.B. and P.S.S.; writing—original draft preparation, D.P.d.S., N.R.B., R.E.B., M.d.N.V. and P.S.S.; writing—review and editing, D.P.d.S. and P.S.S.; supervision, N.R.B., M.d.N.V. and P.S.S.; project administration, D.P.d.S. and P.S.S. All authors have read and agreed to the published version of the manuscript.

Funding

This research was funded by National Health Foundation (FUNASA), through the project enti-tled: Sanitation and Environmental Health in Rural and Traditional Communities in Goiás (SanRural)—TED 05/2017. This study was financed in part by the Coordenação de Aperfeiçoamento de Pessoal de Nível Superior—Brasil (CAPES)—Finance Code 001.

Data Availability Statement

Not applicable.

Acknowledgments

We are grateful for the support of the technical team that performed the samples collection activities in the field. Also, the authors would like to thank Maykell Guimarães and Natã Silva Nazareno for providing the figures.

Conflicts of Interest

The authors declare no conflict of interest. The funders had no role in the design of the study; in the collection, analyses, or interpretation of data; in the writing of the manuscript; or in the decision to publish the results.

References

  1. Ministério do Meio Ambiente. Available online: https://www.icmbio.gov.br/cbc/conservacao-da-biodiversidade/biodiversidade.html (accessed on 15 November 2022).
  2. Brasil. Decreto nº 6.040, de 07 de Fevereiro de 2007. Available online: https://www.planalto.gov.br (accessed on 15 November 2022).
  3. Fundação Nacional de Saúde. Programa Nacional de Saneamento Rural; Ministério da Saúde e Fundação Nacional de Saúde: Brasília, Brazil, 2019.
  4. Sato, A.P.S.; Waldman, E.A. Trajetória das doenças infecciosas no Brasil nos últimos 50 anos: Um contínuo Desafio. Rev. Saúde Pública (RSP) 2016, 50, 68–85. [Google Scholar]
  5. Efstratiou, A.; Ongerth, J.E.; Karanis, P. Waterborne transmission of protozoan parasites: Review of worldwide outbreaks-An update 2011–2016. Water Res. 2017, 114, 14–22. [Google Scholar] [CrossRef] [PubMed]
  6. Secretaria de Vigilância em Saúde. Sistema Nacional de Vigilância em Saúde: Relatório de Situação: Goiás, 5th ed.; Ministério da Saúde: Brasília, Brazil, 2011; 34p.
  7. Cheng, H.W.A.; Lucy, F.E.; Graczyk, T.K.; Broaders, M.A.; Tamang, L.; Connolly, M. Fate of Cryptosporidium parvum and Cryptosporidium hominis oocysts and Giardia duodenalis cysts during secondary wastewater treatments. Parasitol. Res. 2009, 105, 689. [Google Scholar] [CrossRef] [PubMed]
  8. Ma, J.Y.; Li, M.Y.; Qi, Z.Z.; Fu, M.; Sun, T.F.; Elsheikha, H.M.; Cong, W. Waterborne protozoan outbreaks: An update on the global, regional, and national prevalence from 2017 to 2020 and sources of contamination. Sci. Total Environ. 2022, 806, 150562. [Google Scholar] [CrossRef] [PubMed]
  9. Nações Unidas Brasil. Available online: https://brasil.un.org/pt-br/sdgs (accessed on 13 November 2022).
  10. Rodrigues, A.A.; Macedo, M.N.; Silvério, D.V.; Maracahipes, L.; Coe, M.T.; Brando, P.M.; Shimbo, J.Z.; Rajão, R.; Soares Filho, B.; Bustamante, M.M.C. Cerrado deforestation threatens regional climate and water availability for agriculture and ecosystems. Glob. Chang. Biol. 2022, 28, 6807–6822. [Google Scholar] [CrossRef]
  11. Dias, G.M.F.; Bevilacqua, P.D.; Bastos, R.K.X.; Oliveira, A.A.; Campos, G.M.M. Giardia spp. e Cryptosporidium spp. em agua de manancial superficial de abastecimento contaminada por dejetos humano e animal. Arq. Bras. De Med. Vet. E Zootec. 2008, 60, 1291–1300. [Google Scholar] [CrossRef]
  12. Brasil. Portaria nº 888 de 04 de maio de 2021. Available online: https://bvsms.saude.gov.br/bvs/saudelegis/gm/2021/prt0888_07_05_2021.html (accessed on 13 November 2022).
  13. Haas, C.N.; Rose, J.B.; Gerba, C.P. Quantitative Microbial Risk Assessmen, 2nd ed.; John Wiley & Sons, Inc.: Hoboken, NJ, USA, 2014; p. 449. [Google Scholar]
  14. USEPA. National Primary Drinking Water Regulations: Disinfectants and Disinfection Byproducts; Office of the Federal Register: Washington, DC, USA, 1998. Available online: https://www.federalregister.gov/d/98-32887 (accessed on 1 September 2019).
  15. Gitter, A.; Mena, K.D.; Wagner, K.L.; Boellstorff, D.E.; Borel, K.E.; Gregory, L.F.; Gentry, T.J.; Karthikeyan, R. Human health risks associated with recreational waters: Preliminary approach of integrating quantitative microbial risk assessment with microbial source tracking. Water 2020, 12, 327. [Google Scholar] [CrossRef] [Green Version]
  16. Morales, E.; Ibarra, G.; Reyes, L.; Barrantes, K.; Achí, R.; Chacón, L. Disease burden from simultaneous exposure of Cryptosporidium sp. and Giardia sp. and land use vulnerability assessment in a Costa Rican drinking water system. Microb. Risk Anal. 2022, 21, 100213. [Google Scholar] [CrossRef]
  17. Bataiero, M.O.; Araujo, R.S.; Nardocci, A.C.; Matté, M.H.; Sato, M.I.Z.; Lauretto, M.D.S.; Razzolini, M.T.P. Quantification of Giardia and Cryptosporidium in surface water: A risk assessment and molecular characterization. Water Supply 2019, 19, 1823–1830. [Google Scholar] [CrossRef]
  18. Cristiane Pinto, K.; de Souza Lauretto, M.; Navarro Gonzalez, M.I.J.; Sato, M.I.Z.; Nardocci, A.C.; Razzolini, M.T.P. Assessment of health risks from recreational exposure to Giardia and Cryptosporidium in coastal bathing waters. Environ. Sci. Pollut. Res. 2020, 27, 23129–23140. [Google Scholar] [CrossRef]
  19. Silva, D.P.; Reis, Y.P.; Bezerra, N.R.; Carneiro, L.C.; Scalize, P.S. Risk to human health from protozoan (oo)cysts in water treatment plants. Eng. Sanitária E Ambient. 2021, 26, 845–854. [Google Scholar] [CrossRef]
  20. Krkosek, W.; Reed, V.; Gagnon, G.A. Assessing protozoan risks for surface drinking water supplies in Nova Scotia, Canada. J. Water Health 2016, 14, 155–166. [Google Scholar] [CrossRef] [PubMed] [Green Version]
  21. Goiás. Plano Estadual de Recursos Hídricos do Estado de Goiás: Produto 5; Secretaria de Estado de Meio Ambiente e Desenvolvimento Sustentável: Goiânia, Brazil, 2015. [Google Scholar]
  22. Lima, J.E.F.W.; Silva, E.M. Estimativa da superficial do Cerrado brasileiro. In Cerrado: Ecologia, Biodiversidade e Conservação, 1st ed.; Scariot, A., Souza-Silva, J.C., Felfili, J.M., Eds.; Ministério do Meio Ambiente: Brasília, Brazil, 2005; pp. 61–72. [Google Scholar]
  23. Köppen, W. Climatologia: Com um Estudio de los Climas de la Tierra, 1st ed.; Fondo de Cultura Economica: Buenos Aires, Mexico, 1948; p. 478. [Google Scholar]
  24. WHO. Guidelines for Drinking-Water Quality: Fourth Edition Incorporating the First and Second Addenda, 4th ed.; World Health Organization: Geneva, Switzerland, 2022; Available online: https://www.who.int/publications/i/item/9789241549950 (accessed on 15 November 2022).
  25. Goiás. Resolução nº 26 de 05 de Dezembro de 2012. Available online: https://www.meioambiente.go.gov.br/transpar%C3%AAncia/legisla%C3%A7%C3%A3o.html#cerhi (accessed on 15 November 2022).
  26. Franco, R.M.B.; Rocha-Eberhardt, R.; Cantusio Neto, R. Occurrence of Cryptosporidium oocysts and Giardia cysts in raw water from the Atibaia river, Campinas, Brazil. Rev. Do Inst. De Med. Trop. De São Paulo 2001, 43, 109–111. [Google Scholar] [CrossRef]
  27. Shepherd, K.M.; Wyn-Jones, A.P. An evaluation of methods for the simultaneous detection of Cryptosporidium oocysts and Giardia cysts from water. Appl. Environ. Microbiol. 1996, 62, 1317–1322. [Google Scholar] [CrossRef] [PubMed] [Green Version]
  28. EPA 816 -R-12-001; Method 1623.1 Cruptosporidium an Giardia in Water by Filtration/IMS/FA. Office of Water (MS-140). United States Enviromental Protection Agency: Washington, DC, USA, 2012.
  29. Cantusio Neto, R.; Franco, R.M.B. Ocorrência de oocistos de Cryptosporidium. e cistos de Giardia em diferentes pontos do processo de tratamento de água, em Campinas, São Paulo, Brasil. Hig. Aliment. 2004, 18, 52–59. [Google Scholar]
  30. Lapen, D.R.; Schmidt, P.J.; Thomas, J.L.; Edge, T.A.; Flemming, C.; Keithlin, J.; Neumann, N.; Pollari, F.; Ruecker, N.; Simhom, A.; et al. Towards a more accurate quantitative assessment of seasonal Cryptosporidium infection risks in surface waters using species and genotype information. Water Res. 2016, 105, 625–637. [Google Scholar] [CrossRef]
  31. Murphy, H.M.; Thomas, M.K.; Schmidt, P.J.; Medeiros, D.T.; McFadyen, S.; Pintar, K.D.M. Estimating the burden of acute gastrointestinal illness due to Giardia, Cryptosporidium, Campylobacter, E. coli O157 and norovirus associated with private wells and small water systems in Canada. Epidemiol. Infect. 2016, 144, 1355–1370. [Google Scholar] [CrossRef] [Green Version]
  32. Razzolini, M.T.P.; Santos, T.F.S.; Bastos, V.K. Detecção de cistos/oocistos de Giardia e Cryptosporidium em bacias hidrográficas e fontes de água potável em áreas urbanas do Brasil. J. De Água E Saúde 2010, 8, 399–404. [Google Scholar] [CrossRef] [Green Version]
  33. Gerba, C.P. Risk Assessment. In Environmental Microbiology, 1st ed.; Maier, R.M., Pepper, I.L., Gerba, C.P., Eds.; Academic Press: San Diego, CA, USA, 2000; pp. 557–570. [Google Scholar]
  34. MAPBIOMAS. Available online: https://mapbiomas.org/colecoes-mapbiomas-1?cama_set_language%20=pt-br (accessed on 1 August 2020).
  35. R: A Language and Environment for Statistical Computing. R. Available online: http://softlibre.unizar.es/manuales/aplicaciones/r/fullrefman.pdf (accessed on 6 November 2022).
  36. Wallis, P.M.; Erlandsen, S.L.; Isaac-Renton, J.L.; Olson, M.E.; Robertson, W.J.; Van Keulen, H. Prevalence of Giardia cysts and Cryptosporidium oocysts and characterization of Giardia spp. isolated from drinking water in Canada. Appl. Environ. Microbiol. 1996, 62, 2789–2797. [Google Scholar] [CrossRef] [Green Version]
  37. Haas, C.N.; Rose, J.B. Developing an action level for Cryptosporidium. J. Am. Water Work. Assoc. 1995, 87, 81–84. [Google Scholar] [CrossRef]
  38. MCA––Multiple Correspondence Analysis in R: Essentials. Available online: http://www.sthda.com/english/articles/31-principal-component-methods-in-r-practical-guide/114-mca-multiple-correspondence-analysis-in-r-essentials/ (accessed on 9 November 2022).
  39. Brasil. Resolução do CONAMA nº 357, de 17 de Março de 2005. Available online: https://www.icmbio.gov.br/cepsul/images/stories/legislacao/Resolucao/2005/res_conama_357_2005_classificacao_corpos_agua_rtfcda_altrd_res_393_2007_397_2008_410_2009_430_2011.pdf (accessed on 16 December 2022).
  40. USEPA. Use of Micobial Risk Assessment in Setting EPA Drinking Water Standards; Office of the Federal Register: Washington, DC, USA, 1992.
  41. Karanis, P. Giardia and Cryptosporidium: Occurrence in Water Supplies. Encycl. Environ. Health 2011, 1, 946–954. [Google Scholar] [CrossRef]
  42. Thompson, R.C.A. The zoonotic significance and molecular epidemiology of Giardia and Giardiasis. Vet. Parasitol. 2004, 126, 15–35. [Google Scholar] [CrossRef] [PubMed]
  43. Franco, R.M.B.; Hachich, E.M.; Sato, M.I.S.; Naveira, R.M.L.; Silva, E.D.C.; Campos, M.M.D.C.; Cantusio Neto, R.; Cerqueira, D.A.; Branco, N.; Leal, D.A.G. Performance evaluation of different methodologies for detection of Cryptosporidium spp. and Giardia spp. in water for human consumption to meet the demands of the Environmental Health Surveillance in Brazil. Epidemiol. E Serviços De Saúde 2012, 21, 233–242. [Google Scholar] [CrossRef]
  44. Hunter, P.R.; De Sylor, M.A.; Risebro, H.L.; Nichols, G.L.; Kay, D.; Hartemann, P. Quantitative microbial risk assessment of cryptosporidiosis and giardiasis from very small private water supplies. Risk Anal. Int. J. 2011, 31, 228–236. [Google Scholar] [CrossRef] [PubMed]
  45. Xiao, L. Molecular epidemiology of cryptosporidiosis: An update. Exp. Parasitol. 2010, 1, 80–89. [Google Scholar] [CrossRef]
  46. Ryan, U.N.A.; Fayer, R.; Xiao, L. Cryptosporidium species in humans and animals: Current understanding and research needs. Parasitology 2014, 141, 1667–1685. [Google Scholar] [CrossRef] [Green Version]
  47. Lane, S.; Lloyd, D. Current Trends in Research into the Waterborne Parasite Giardia. Crit. Rev. Microbiol. 2002, 28, 123–147. [Google Scholar] [CrossRef]
  48. Quon, H.; Allaire, M.; Jiang, S.C. Assessing the Risk of Legionella Infection through Showering with Untreated Rain Cistern Water in a Tropical Environment. Water 2021, 13, 889. [Google Scholar] [CrossRef]
  49. Burch, T. Validation of quantitative microbial risk assessment using epidemiological data from outbreaks of waterborne gastrointestinal disease. Risk Anal. 2019, 39, 599–615. [Google Scholar] [CrossRef]
  50. Petterson, S.R.; Signor, R.S.; Ashbolt, N.J. Incorporating method recovery uncertainties in stochastic estimates of raw water protozoan concentrations for QMRA. J. Water Health 2007, 5, 51–65. [Google Scholar] [CrossRef] [Green Version]
  51. Bergion, V.; Sokolova, E.; Åström, J.; Lindhe, A.; Sörén, K.; Rosén, L. Hydrological modelling in a drinking water catchment area as a means of evaluating pathogen risk reduction. J. Hydrol. 2017, 544, 74–85. [Google Scholar] [CrossRef]
Figure 1. Location of the sampling points destined towards public supply and use by rural areas distributed among the Hydric Resources Planning and Management Units of the state of Goiás (source: drafted by the authors).
Water 15 00158 g001
Figure 2. Graphical representation of exposure sources of cryptosporidiosis and giardiasis in rural and urban environments (source: drafted by the authors).
Water 15 00158 g002
Figure 3. Variation in Giardia spp., Cryptosporidium spp. and turbidity parameters, outliers values, upper limit and mean.
Water 15 00158 g003
Figure 4. General results of land use and occupation, containing average, minimum (min.), maximum (max.) and coefficient of variation (CV) values.
Water 15 00158 g004
Figure 5. Bi−plot graphic containing the degree of association between variables and the dimensions of the multiple correspondence analysis.
Water 15 00158 g005
Figure 6. Dendrogram of the qualitative variables used in the multiple correspondence analysis distributed into four cluster groups.
Water 15 00158 g006
Table 1. Parameters used to determine the probability of infection by (oo)cysts of Giardia spp. and Cryptosporidium spp. pathogens through the exponential mathematic method.
ParameterPathogen-ReferenceReference
Giardia ssp.Cryptosporidium ssp.
V (L/day) 122[24]
Tr (%)78.160.6[19]
R (log)00NA
r *0.01990.0042[13]
n (days)365365NA
Notes: 1 Needed water volume for purposes of health; however, this value can vary due to climate conditions, level of activity throughout the day and diet. * The values in parameter “r” were defined by [13] considering the Cryptosporidium parvum e Giardia lambia species. NA = not applicable.
Table 2. Summary of the concentration of pathogens identified in raw water, the limit of detection of each sample, probability of annual infection and main use of the analyzed water.
IDSurface Source NameTurbidity (NTU)Giardia
(cysts/L)
Cryptosporidium
(oocysts/L)
LD
((oo)cysts/L)
Pinf(a)
Giardia 1
Pinf(a)
Cryptosporidium 1
1Pedras Creek PS5.98116.67133.338.331.001.00
2Boa Esperança Creek PS6.86100.00175.008.331.001.00
3São Manoel Creek PS6.8066.67208.338.331.001.00
4Cerrado Creek PS7.1958.33216.678.331.001.00
5Santana Creek PS12.4066.6766.678.331.001.00
6Dirceu Creek PS5.9358.33108.338.331.001.00
7Anda Só Creek PS11.9016.67108.338.331.001.00
8Forquilha Creek PS2.1116.6762.504.171.001.00
9Pari River PS7.38<LD8.338.331.001.00
10Barro Alto Creek PS7.47<LD58.338.331.001.00
11Novo River PS4.9950.0066.678.331.001.00
12Almas River PS4.8458.3366.678.331.001.00
13Jatobá Creek PS2.448.3316.674.171.001.00
14Olho D’água Creek PS16.30116.67250.0016.671.001.00
15Uru River PS2.6479.1754.174.171.001.00
16Poções Creek PS6.95<LD<LD4.171.009.94 × 10−1
17Morcego Creek PS4.99<LD8.338.331.001.00
18Palmeiras Creek PS62.1041.67300.008.331.001.00
19Café Creek PS15.7<LD8.334.171.001.00
20Barreirinha Creek PS4.698.3345.001.671.001.00
21Santa Maria Creek UR7.48<LD11.671.671.001.00
22Formiga Creek UR14.516.6791.678.331.001.00
23Mata Creek UR15.48.33208.338.331.001.00
24São Jorge Creek UR15.88.33241.678.331.001.00
25Pombal River UR3.59<LD<LD8.331.009.94 × 10−1
26Fundo Creek UR18.233.33141.678.331.001.00
27Santa Família Creek UR3.571.6710.001.671.001.00
28Pica Pau Creek UR1.37<LD8.331.671.001.00
29São Sebastião Creek UR2.624.174.174.171.001.00
30Sucuapara Creek UR4.14<LD4.174.171.001.00
31Retiro Creek UR19.3<LD<LD8.331.009.94 × 10−1
32Araguaia River UR7.74<LD22.2211.111.001.00
33Água Limpa Creek UR21.74.1712.504.171.001.00
34Gameleira Creek UR3.678.33<LD4.171.009.94 × 10−1
35Affluent of Maranhão RiverUR2.118.334.174.171.001.00
36Landi Creek UR3.8<LD100.0016.671.001.00
37Araguaia River UR11.816.6783.3316.671.001.00
38Araguaia River UR5.07<LD88.8922.221.001.00
39Cachoeirinha Creek UR1.3844.4466.6711.111.001.00
40Macaco Creek UR17.6<LD<LD5.561.009.94 × 10−1
41Grande Creek UR26.4<LD16.678.331.001.00
Average1.009.99 × 10−1
Notes: 1 PInf(a) is the probability of annual infection; PS = public supplying; UR = use in the rural environment; LD = Limit of Detection.
Table 3. Data regarding land use and occupation in the watersheds (WS).
IDWS Area (km2)Forest (%)Non-Forest Natural Formation (%)Pasture (%)Agriculture (%)Mosaic of Agriculture and Pasture (%) 1Area without Vegetation (%)Water Bodies (%)
1216.0124.340.7045.6111.2018.160.000.00
228.5123.950.3375.330.390.000.000.00
3132.2115.500.0371.614.758.020.000.10
439.3412.530.0186.320.910.230.000.00
527.6714.400.0383.122.430.000.030.00
614.9326.290.6835.9528.497.570.930.10
791.2228.280.7351.8313.674.830.000.66
811.7562.700.1237.170.000.000.000.00
9908.5329.820.3766.402.920.370.130.00
1033.8351.814.2040.880.162.720.160.07
11217.6929.450.1761.142.526.670.010.03
1210,984.7132.400.6952.236.937.120.380.25
1318.2912.200.1124.1650.2711.730.001.53
1425.1228.050.8671.100.000.000.000.00
153534.7032.360.3754.3412.140.440.360.00
1626.3829.000.0036.6028.820.005.580.00
178.2099.530.000.450.000.000.010.00
1842.3218.290.0081.140.000.000.560.05
1918.1121.250.0073.834.410.000.510.00
2010.6513.280.0086.550.000.000.100.08
21428.6262.090.0026.568.360.002.950.04
2214.0723.180.0075.990.000.000.730.11
23202.1629.980.0069.700.060.000.080.24
24126.3121.410.0077.970.020.000.010.60
25138.0775.610.0023.330.960.000.060.05
2642.1935.780.0054.249.870.000.030.08
2779.8950.210.0049.680.020.000.030.06
2812.8858.950.0040.710.350.000.000.00
29150.4426.493.9631.0438.240.000.160.11
3036.5312.920.0439.0747.640.000.040.30
3116.5211.070.0087.801.130.000.000.00
3251,161.8836.203.9651.687.640.000.270.25
338.8029.430.0670.290.000.000.010.22
345.5182.020.0217.110.850.000.000.00
355.0766.667.4525.890.000.000.000.00
3651.2636.711.3360.560.260.000.520.62
3768,117.8134.183.5955.316.270.000.280.38
38117,515.7034.082.8058.214.030.000.270.61
3929.9856.9831.788.960.000.002.290.00
4033.3384.670.0013.750.000.000.501.08
41128.4042.097.4345.543.940.000.380.62
Average36.981.7551.687.311.660.420.20
Note: 1 The mosaic of agriculture and pasture indicates the WS areas in which it was not possible to identify if they represented agriculture or pasture.
Table 4. Result of the correlation of Pearson among Giardia spp. cysts and Cryptosporidium spp. oocysts, and of the aforementioned with qualitative/quantitative variables.
VariableGiardiaCryptosporidium
Area (km2)−0.139−0.010
Turbidity (NTU)0.0270.455
Giardia spp. (cysts/L)1.0000.581
Cryptosporidium spp. (oocysts/L)0.5811.000
LD ((oo)cysts/L) 0.2180.412
Forest (%)−0.327−0.418
Non-forest natural formation (%)0.017−0.086
Pasture (%)0.2770.532
Agriculture (%)−0.066−0.232
Mosaic of agriculture and pasture (%)0.4520.132
Area without vegetation (%)−0.129−0.173
Water bodies (%)−0.290−0.058
Disclaimer/Publisher’s Note: The statements, opinions and data contained in all publications are solely those of the individual author(s) and contributor(s) and not of MDPI and/or the editor(s). MDPI and/or the editor(s) disclaim responsibility for any injury to people or property resulting from any ideas, methods, instructions or products referred to in the content.

