Article

Role of Seasons in the Fate of Dissolved Organic Carbon and Nutrients in a Large-Scale Surface Flow Constructed Wetland

1
Laboratoire Réactions et Génie des Procédés, Université de Lorraine, CNRS, 1 Rue Grandville, CEDEX F-54001, BP 20451 Nancy, France
2
Grand Reims, CEDEX F-51000, CS 80036 Reims, France
3
LTSER-Zone Atelier du Bassin de la Moselle, Laboratoire Réactions et Génie des Procédés, 1 Rue Grandville, CEDEX F-54001, BP 20451 Nancy, France
*
Author to whom correspondence should be addressed.
Water 2022, 14(9), 1474; https://doi.org/10.3390/w14091474
Submission received: 8 April 2022 / Revised: 30 April 2022 / Accepted: 1 May 2022 / Published: 4 May 2022
(This article belongs to the Section Ecohydrology)

Abstract

:
The role of seasons in the removal of dissolved organic carbon (DOC), nutrients and in changes in the spectral properties of dissolved organic matter (DOM) in a large-scale surface flow constructed wetland (SF-CW) receiving reclaimed water and composed of three basins with different vegetation patterns was studied. Dissolved nitrogen removal efficiencies within the three basins in summer (>50%) and winter (<30%) were significantly different. SF-CW water is enriched in DOC in spring and summer with average outlet concentrations above 8 mg·L−1. UV-visible indices, such as the specific absorbance at 254 nm or the spectral slope between 275 and 295 nm, did not vary over the seasons; thus, the basins did not change DOM aromaticity and average molecular weight. Synchronous fluorescence spectra showed variations in terms of protein-like and humic-like substances, the latter being more sensitive to photodegradation. A lab-scale photodegradation experiment confirmed that radiation from the sun was responsible for this decrease, showing this process could alter the composition of DOM at full-scale. DOM variations result from a seasonal competition between release by vegetation and photodegradation. These results validate the necessity for long-term monitoring of SF-CWs, and the utility of rapid optical methods to monitor DOC.

Graphical Abstract

1. Introduction

Wastewater treatment plant effluents contain dissolved organic matter (DOM), such as humic acids, proteins, carbohydrates, or other anthropogenic compounds (e.g., pharmaceutical and personal care product residues) that may not be removed during their passage through wastewater treatment plants (WWTPs) [1]. Thus, significant amounts of DOM may be released via WWTPs directly into receiving environments. In addition, during tertiary treatment and depending on the characteristics of the DOM, the addition of chlorine for disinfection purposes to eliminate pathogens can result in the formation of carcinogenic byproducts such as trihalomethanes [2].
Many surface-flow constructed wetlands (SF-CWs) are used as a finishing treatment stage for WWTP effluents [3,4,5,6,7] to eliminate residual concentrations of nutrients, pathogens and micropollutants by adsorption on sediments, uptake by plants, precipitation, biodegradation or photodegradation [8,9,10,11,12]. These nature-based systems require little energy and offer a shelter for fauna (particularly for avifauna) and a possible pleasant landscape to citizens.
Although many parameters are monitored in SF-CWs, such as nitrogen and phosphorus, the fate of DOM is still poorly monitored. However, DOM plays an important role in aquatic environments, thus its quantification and characterization are not trivial. Depending on its origins and physicochemical properties, it can serve as a substrate for microorganisms, attenuate the amount of light entering the water column [13,14], transport pollutants [15], and increase or decrease the bioavailability of contaminants [16,17,18].
In seminatural environments such as SF-CWs, transfer from the DOM pool to the particulate organic matter (POM) pool is possible through adsorption on mineral particles in suspension via different mechanisms (hydrogen bonding, van der Waals forces and ligand exchange) or colloidal formation by aggregation of various kinds of organic matter (humic substances, polysaccharides and proteins) [19]. However, the two main processes allowing the transformation of DOM within aquatic environments are photodegradation and biodegradation. These two processes can allow the elimination of DOM through the production of carbon dioxide (CO2) or methane (CH4) when the oxidation or fermentation is complete or the transformation into byproducts, if it is partial [20]. Furthermore, aquatic plants growing within CWs can release dissolved organic carbon (DOC) [21,22,23,24], serving as substrate for the establishment of a bacterial community [25]. DOM release occurs naturally by the leaching of soluble organic matter, but the actions of microorganisms accelerate the release process by biodegrading plants [25,26].
Biodegradation often results in the rapid loss of small labile aliphatic organic matter, carbohydrates and proteins [22,27,28]. However, it can also release high molecular weight (HMW) aromatic carbon compounds, such as humic-like compounds produced as a byproduct of the degradation of organic matter [29,30]. The photodegradation of DOM occurs if the molecule can absorb certain wavelengths of sunlight (direct photodegradation), or if it is exposed to reactive oxygen species (ROS) formed by the photodegradation of photosensitizers (indirect photodegradation). Photodegradation in aquatic environments can lead to the shift of HMW substances to smaller photoproducts [31,32].
The spectral properties of DOM provide information on the source and composition of these elements at a relatively low cost. Optical methods are fast and can be used routinely, without any reagent, by plant operators. The specific absorbance at 254 nm (SUVA254) is proportional to the percentage of aromatic carbon in the DOM [33]. Helms et al. [34] showed that the S275–295 spectral slope (calculated by a linear fit of the log-transformed absorption coefficient between 275 and 295 nm) was negatively correlated with DOM molecular weight. The ratio of absorbance at 254 nm and 365 nm (E2/E3) is also related to the relative size of the DOM molecules [35]. Synchronous fluorescence applied to DOM allows for the rapid identification of fluorescent compounds present in aquatic environments by isolating peaks from the initial fluorescence spectrum [36]. This can be useful to know the composition of the DOM, as well as the changes it may have undergone. There are few studies on how SF-CWs change the characteristics of DOM.
Furthermore, in temperate climates the seasons are marked by large variations in solar radiation and temperature [37]. These will greatly modify certain parameters within CWs, such as the establishment of aquatic vegetation, the water temperature and the amount of UV penetrating in the water, which can attenuate or increase the various processes allowing the transformation of DOM in addition to those allowing the removal of phosphorus and nitrogen. The effect of seasons on the removal efficiencies of these nutrients in CWs built in a temperate climate is still poorly studied, as such research requires long-term monitoring of the CWs. We hypothesized that warmer and sunnier seasons will remove them more efficiently in such SF-CWs under this climate.
This study aimed to provide new information on the seasonal fate of nitrogen, phosphorus and DOM under a temperate climate in a large SF-CW fed by an urban WWTP effluent. The fate of DOM has been further characterized using optical methods (absorbance and fluorescence). These methods are largely used in natural aquatic environments and rarely in nature-based solutions for urban wastewater treatment. In order to confirm the influence of sun, the effects of photodegradation on DOM characteristics were also studied in the laboratory on samples taken from the SF-CW inlet. In large-scale SF-CWs, vegetation monitoring is often a challenge, and here the issue was solved by the use of high-resolution satellite images.

2. Materials and Methods

2.1. Study Area

The 6-hectare AZHUREV SF-CW was built in 2017 at the border of Saint-Brice Courcelles and Merfy, France (49°16′36.011″ N, 3°58′31.553″ E). At that latitude the theoretical day length varies between 8 and 14 h (Figure S1a). The climate is oceanic, with the daily average temperature under shelter varying between 5 °C and 20 °C (Figure S1b), and an effective monthly number of hours of sun between 50 and 300 (Figure S1c).
The SF-CW (Figure 1) is composed of three basins (350 × 50 m), supplied in parallel by reclaimed wastewater. When the water exits the SF-CW, it passes through a natural reed bed and a pond before being discharged into the Vesle River, the final receiving body. The basins’ soil was compacted to avoid infiltration and potential pollution of the groundwater table. Each basin was initially planted with different amounts of Phragmites australis. The areas with low water depths (30 cm) were planted in 2017, while the nonplanted areas have a water depth of approximately 50 cm. Basin 1 (B1) has no planted vegetation, and basins 2 (B2) and 3 (B3) have planted vegetation cover rates of 20% and 40%, respectively. In spring and summer, opportunistic species such as Ceratophyllum demersum, Ceratophyllum submersum, Lemna gibba, Lemna minor, Wollfia sp. and Cladophora sp. develop in the basins.
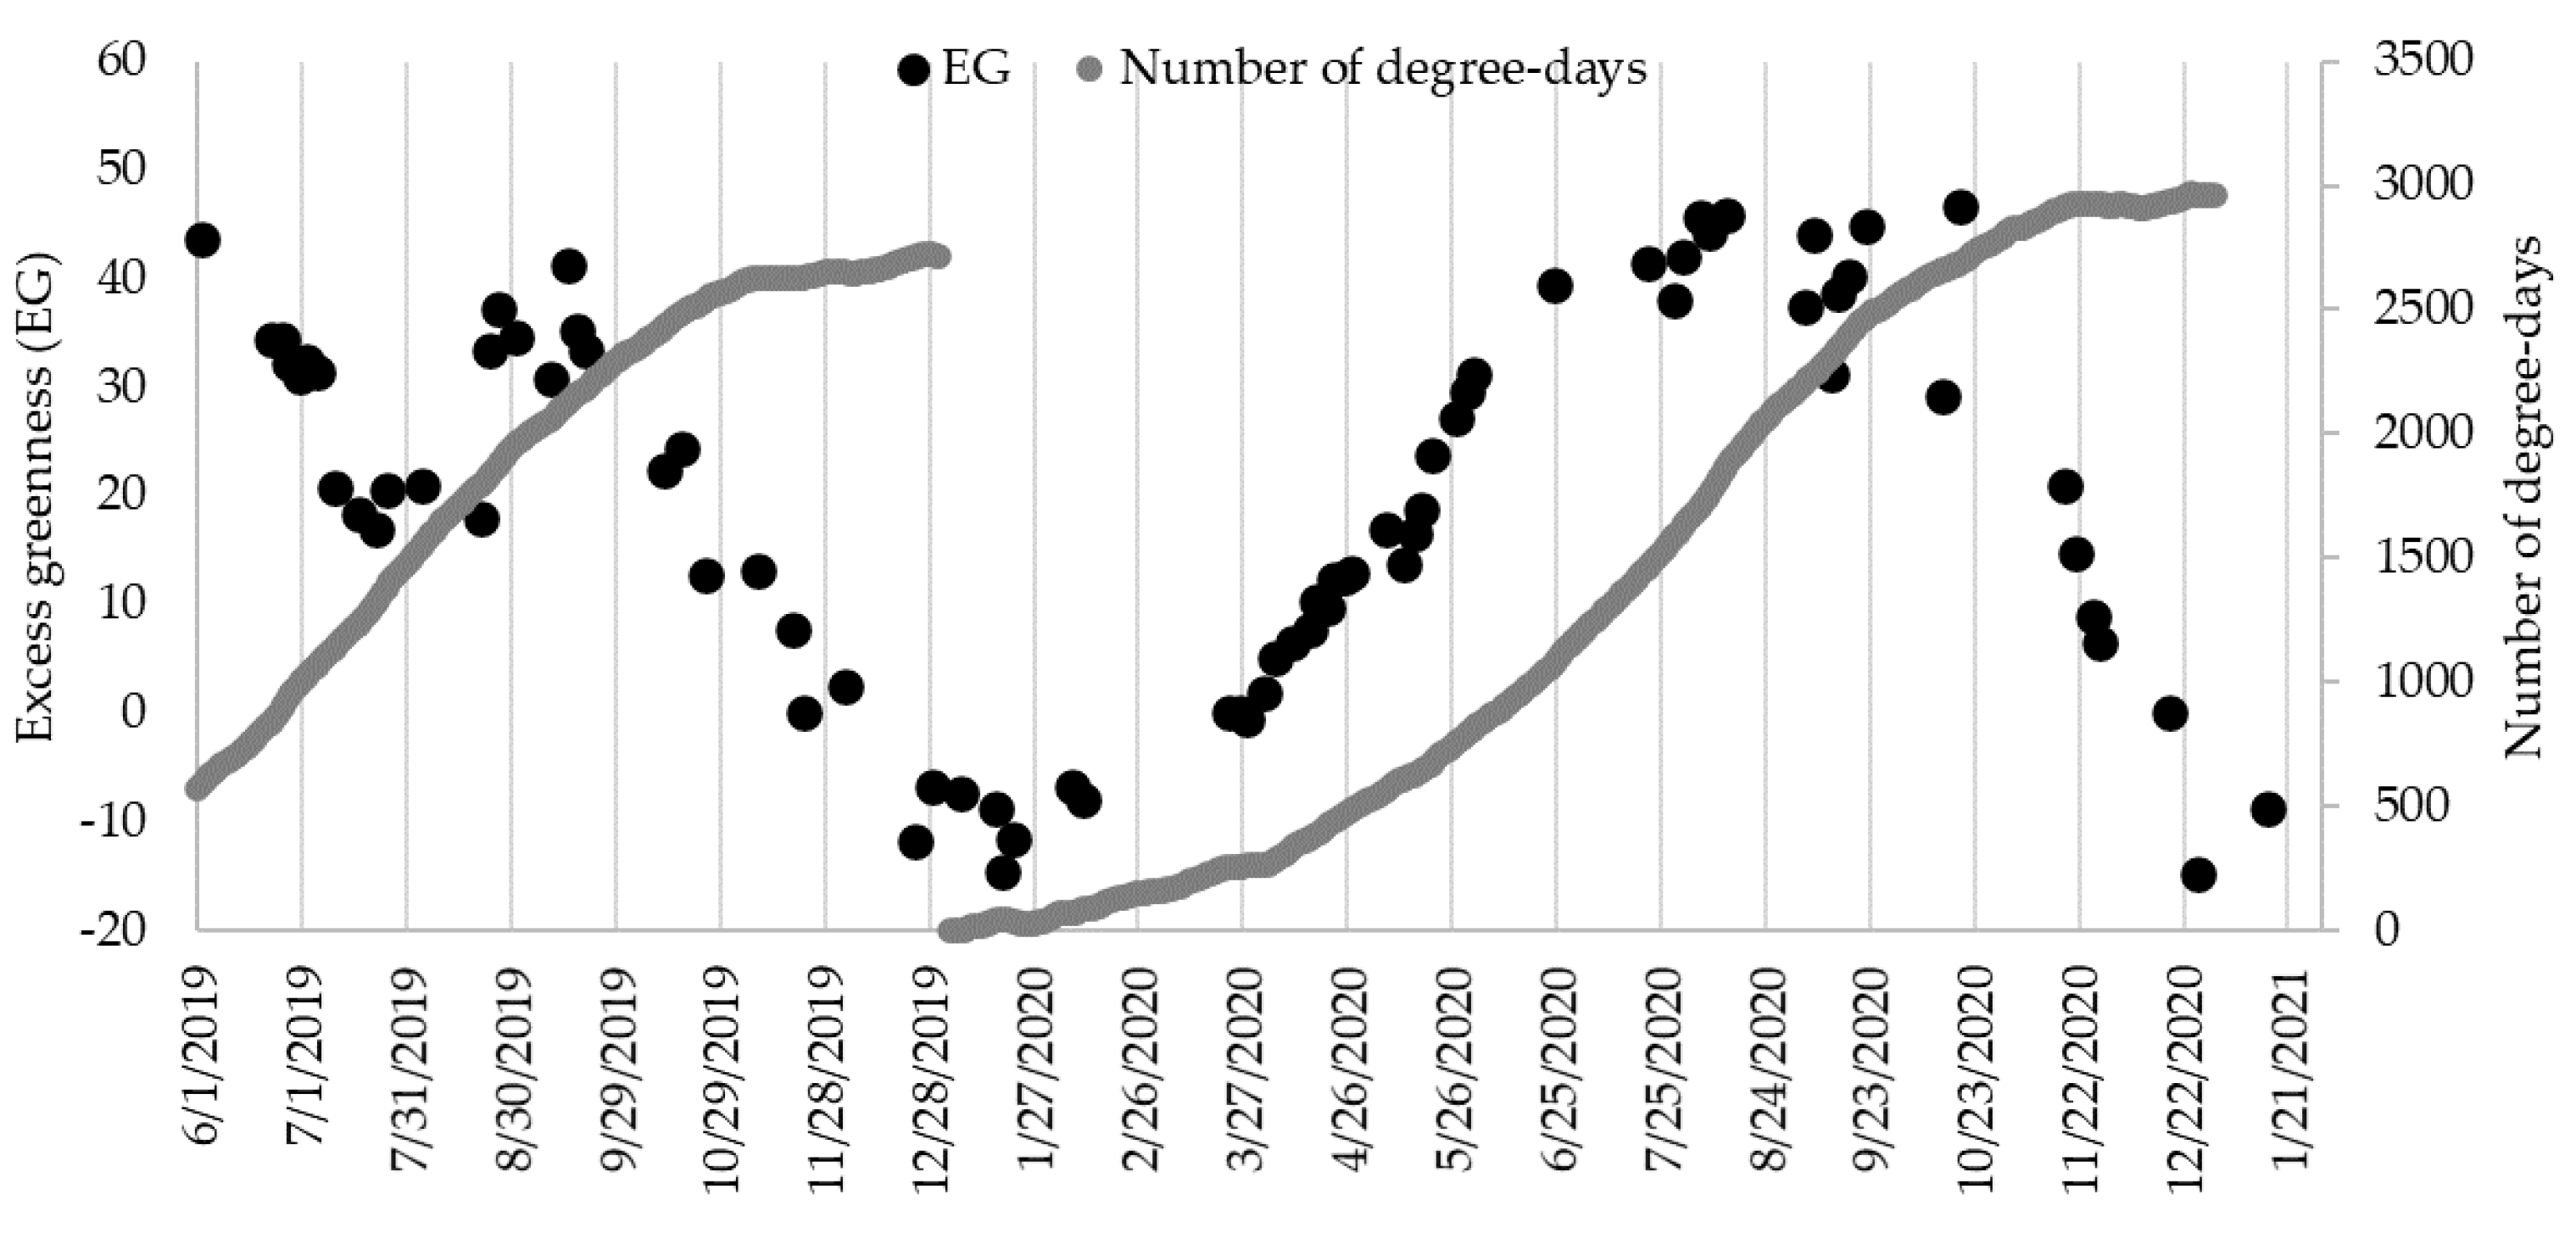
The floating and emerged vegetation were checked regularly on Sentinel-2 satellites images (spatial resolution = 10 m, time resolution ≈ 3 days, depending upon cloudiness) (https://scihub.copernicus.eu/, accessed on 31 March 2022), and the red (R), green (G) and blue (B) spectral band images (Figure S2) were generated. The average excess greenness (EG) has been used to monitor globally the development of the floating and emerged vegetation, as a function of the sum of the degree days [38]:
E G = 2 G R + B
where R, G and B are the average intensities of the red, green and blue bands, respectively, measured over the area enclosing the three basins. This descriptor is based on visible light channels and its variations can be easily checked by the user. The degree day is defined with respect to the reference temperature of 4 °C [39]:
D D = T m a x + T m i n 2 4
where Tmin and Tmax are the minimal and maximal temperatures (in °C) under shelter, measured at the closest weather station (Reims-Prunay, 49°11′51″ N, 4°11′05″ E).
During dry weather, the SF-CW is receiving treated wastewater from the Grand Reims WWTP (activated sludge process with a capacity of 470,000 equivalent inhabitants) via the distribution canal. During rain episodes, the SF-CW is only fed by urban runoff. During the study, the theoretical hydraulic residence time of each basin varied from 4 to 7 days. The average flow was 150 m3·h−1 (8% of the total WWTP effluent flow rate) and was reasonably constant (CV = 19%) throughout the study. The water temperature was measured at the exit of the three basins using autonomous probes (CTD-diver, SDEC, Reignac-sur-Indre, France), with a sampling period of 15 min.

2.2. Sampling

For this study, 21 sampling campaigns were considered, from June 2019 to January 2021 (approximately one per month), with the collection of water samples at the inlets (B1in, B2in and B3in) and outlets of the basins (B1out, B2out and B3out). The seasons are defined as follows: winter (December, January and February), spring (March, April and May), summer (June, July and August) and autumn (September, October and November).
The SF-CW was fed exclusively by reclaimed wastewater from the WWTP for these campaigns. All samples were collected in 500-milliliter HDPE bottles previously washed with diluted nitric acid, rinsed with ultrapure water, and transported in iceboxes in the dark to the laboratory. They were filtered through 1-micrometer pore size glass microfiber syringe filters (GF/B, Whatman™). The filtered samples were placed in 100-milliliter high-density polyethylene bottles and stored at 4 °C before use.

2.3. Chemical Analyses

The pH values of the water samples were measured using a Hach HQ40d pH meter, and the conductivity was measured using a Hach CDM210 conductometer. After filtration through 0.45-micrometer nominal pore size regenerated cellulose syringe filters (Phenomenex®), nitrates were determined by ion chromatography (Thermo Scientific Dionex iCS 3000) [40]. Orthophosphates (oPs) and ammonium (N-NH4) were quantified by spectrophotometric methods with a HACH DR 2400 spectrophotometer (HACH PhosVer3 detection method 8048 for orthophosphates [41], and Nessler micro-method adapted from HACH method 8038 [42]). DOC and total dissolved nitrogen (TN) were measured using a total organic carbon (TOC) analyzer (TOC-VCHS/TNM-1, Shimadzu, Japan) [43]. The quantification limit was 0.5 mg·L−1 for DOC and TN, 0.02 mg·L−1 for N-NH4 and 0.05 mg·L−1 for nitrates.

2.4. Spectroscopy

All measurements were performed at ambient temperature (≈20 °C). UV–visible spectra were collected using a Shimadzu UV-2600 spectrophotometer (Kyoto, Japan) using a 1 cm path-length quartz cell. Spectra were scanned from 200 to 600 nm using 1-nanometer steps. The absorbances at 250 nm and 365 nm were used to calculate the E2/E3 ratio [44]. SUVA254 was obtained by dividing the absorbance at 254 nm (m−1) (A254) by the DOC concentration (mg·L−1). The spectral slope S275–295 was calculated using log-transform linear regression between 275 and 295 nm [34].
The synchronous fluorescence spectra were collected on a Hitachi F-2500 (Krefeld, Germany) fluorimeter. The excitation wavelength range was 230–600 nm with a constant offset (Δλ = 50 nm) between the excitation and emission wavelengths using a 1 cm path-length quartz cell. The scanning speed was 300 nm·min−1, the wavelength increment was 1 nm, and the slit widths were set to 2.5 nm. The spectra were corrected for Raman scattering by measuring the Raman peak of ultrapure water (excitation wavelength = 350 nm, emission wavelength range 380 to 410 nm) [45]:
F R λ = F λ A r p
where Fλ is the measured fluorescence intensity of a sample at emission wavelength λ in arbitrary units (A.U.), Arp is the sum of the intensity of the Raman peak at every wavelength, and F is the fluorescence at emission wavelength λ calibrated to Raman units (R.U.). Then, an inner-filtering correction was applied [46]:
F c o r r = F R λ .10 A e x + A e m 2
where Aex et Aem are the absorbance values at the current excitation (λex) and emission wavelengths (λem), and Fcorr the corrected fluorescence intensity. Spectral decomposition was applied as described in Assaad et al. [36] using lab-developed software embedded in a Fortran code. Each fluorophore i is represented by a Gauss function, with the following:
f i λ = a i .   e λ b i 2 2 c i 2
where ai is the height of the peak (i.e., fluorophore pseudo-concentration), bi is the position of the center of the peak, and ci is related to the peak width. Then, the decomposed fluorescence peak of the ultrapure water was subtracted from each sample.

2.5. Irradiation Experiments

Photolysis experiment A was run in triplicate with 3.5-milliliter PMMA (poly(methyl)methacrylate) (Fischer Scientific, Illkirch, France) cells filled with a SF-CW influent sample. The cells were placed at a 1-cm distance from an ultraviolet (UV)-A lamp (T-15 L, Vilber) emitting at 365 nm. At designated time intervals (0, 2, 12 and 24 h) synchronous fluorescence spectra were collected directly using the PMMA cells. The UV-visible spectra were collected after transfer of the samples into a quartz cuvette. Irradiation of ultrapure water was performed under the same conditions.
Photolysis experiments B and C were run on B1in samples for two of the 21 campaigns (February and June 2020) corresponding to two different seasons (winter and summer). Photodegradation experiments were conducted with 3.5-milliliter PMMA cells, which were placed at a 1-cm distance from a solar spectra fluorescent tube (JBL Solar Natur, 15 W). At designated time intervals (0, 2, 5, 24, 48 h), synchronous fluorescence spectra were collected directly using the PMMA cells. Irradiation of ultrapure water was performed under the same conditions.

2.6. Statistics

Experimental results were statistically evaluated using RStudio version 1.2.1335. Data normality was checked with a Shapiro–Wilk test, which is well adapted to small sample sizes. Comparisons between inlet and outlet were performed with parametric paired Student’s t-tests. The Student’s t-test is one of the most commonly used techniques for testing a hypothesis on the basis of a difference between two sample means, when data follow a normal distribution and are paired. The existence of correlations between outlets was analyzed by using one-way ANOVA (parametric statistics). The one-way ANOVA is one of the most commonly used techniques for testing a hypothesis on the basis of a difference between more than two sample means, when data follow a normal distribution and are independent. Differences were considered significant when p < 0.05.

3. Results and Discussion

3.1. Weather Conditions and Vegetation

Table 1 summarizes the weather conditions during the period of study, in addition to the water temperature at the exit of the basins. Cladophora sp. was the first species to develop in spring (usually in April) and covered quickly the open water areas, contributing to the progressive greening of the basins (Figure 2). Lemna sp. started to develop a little later: by denying access to sunlight for algae, Lemna sp. gradually induced the algae senescence and decomposition in early summer. A second outburst of algae usually occurred in late summer. Mid-September was the peak of vegetation for all species. The actual cover rate of the basins can be higher than 80% in summer and is a function of the development of Lemna sp., and of the wind which displaces them easily.

3.2. Evolution of pH, Conductivity, DOC, Nitrogen Species and o-Ps

The three inlets were grouped under the name “inlet” as they receive the same reclaimed wastewater. During these 21 campaigns, the average TN, DOC and o-Ps contents at the inlets of the basins were 2.3 ± 0.6 mg·L−1, 7.3 ± 0.8 mg·L−1 and 1.4 ± 0.4 mg·L−1 (Table 2), respectively.
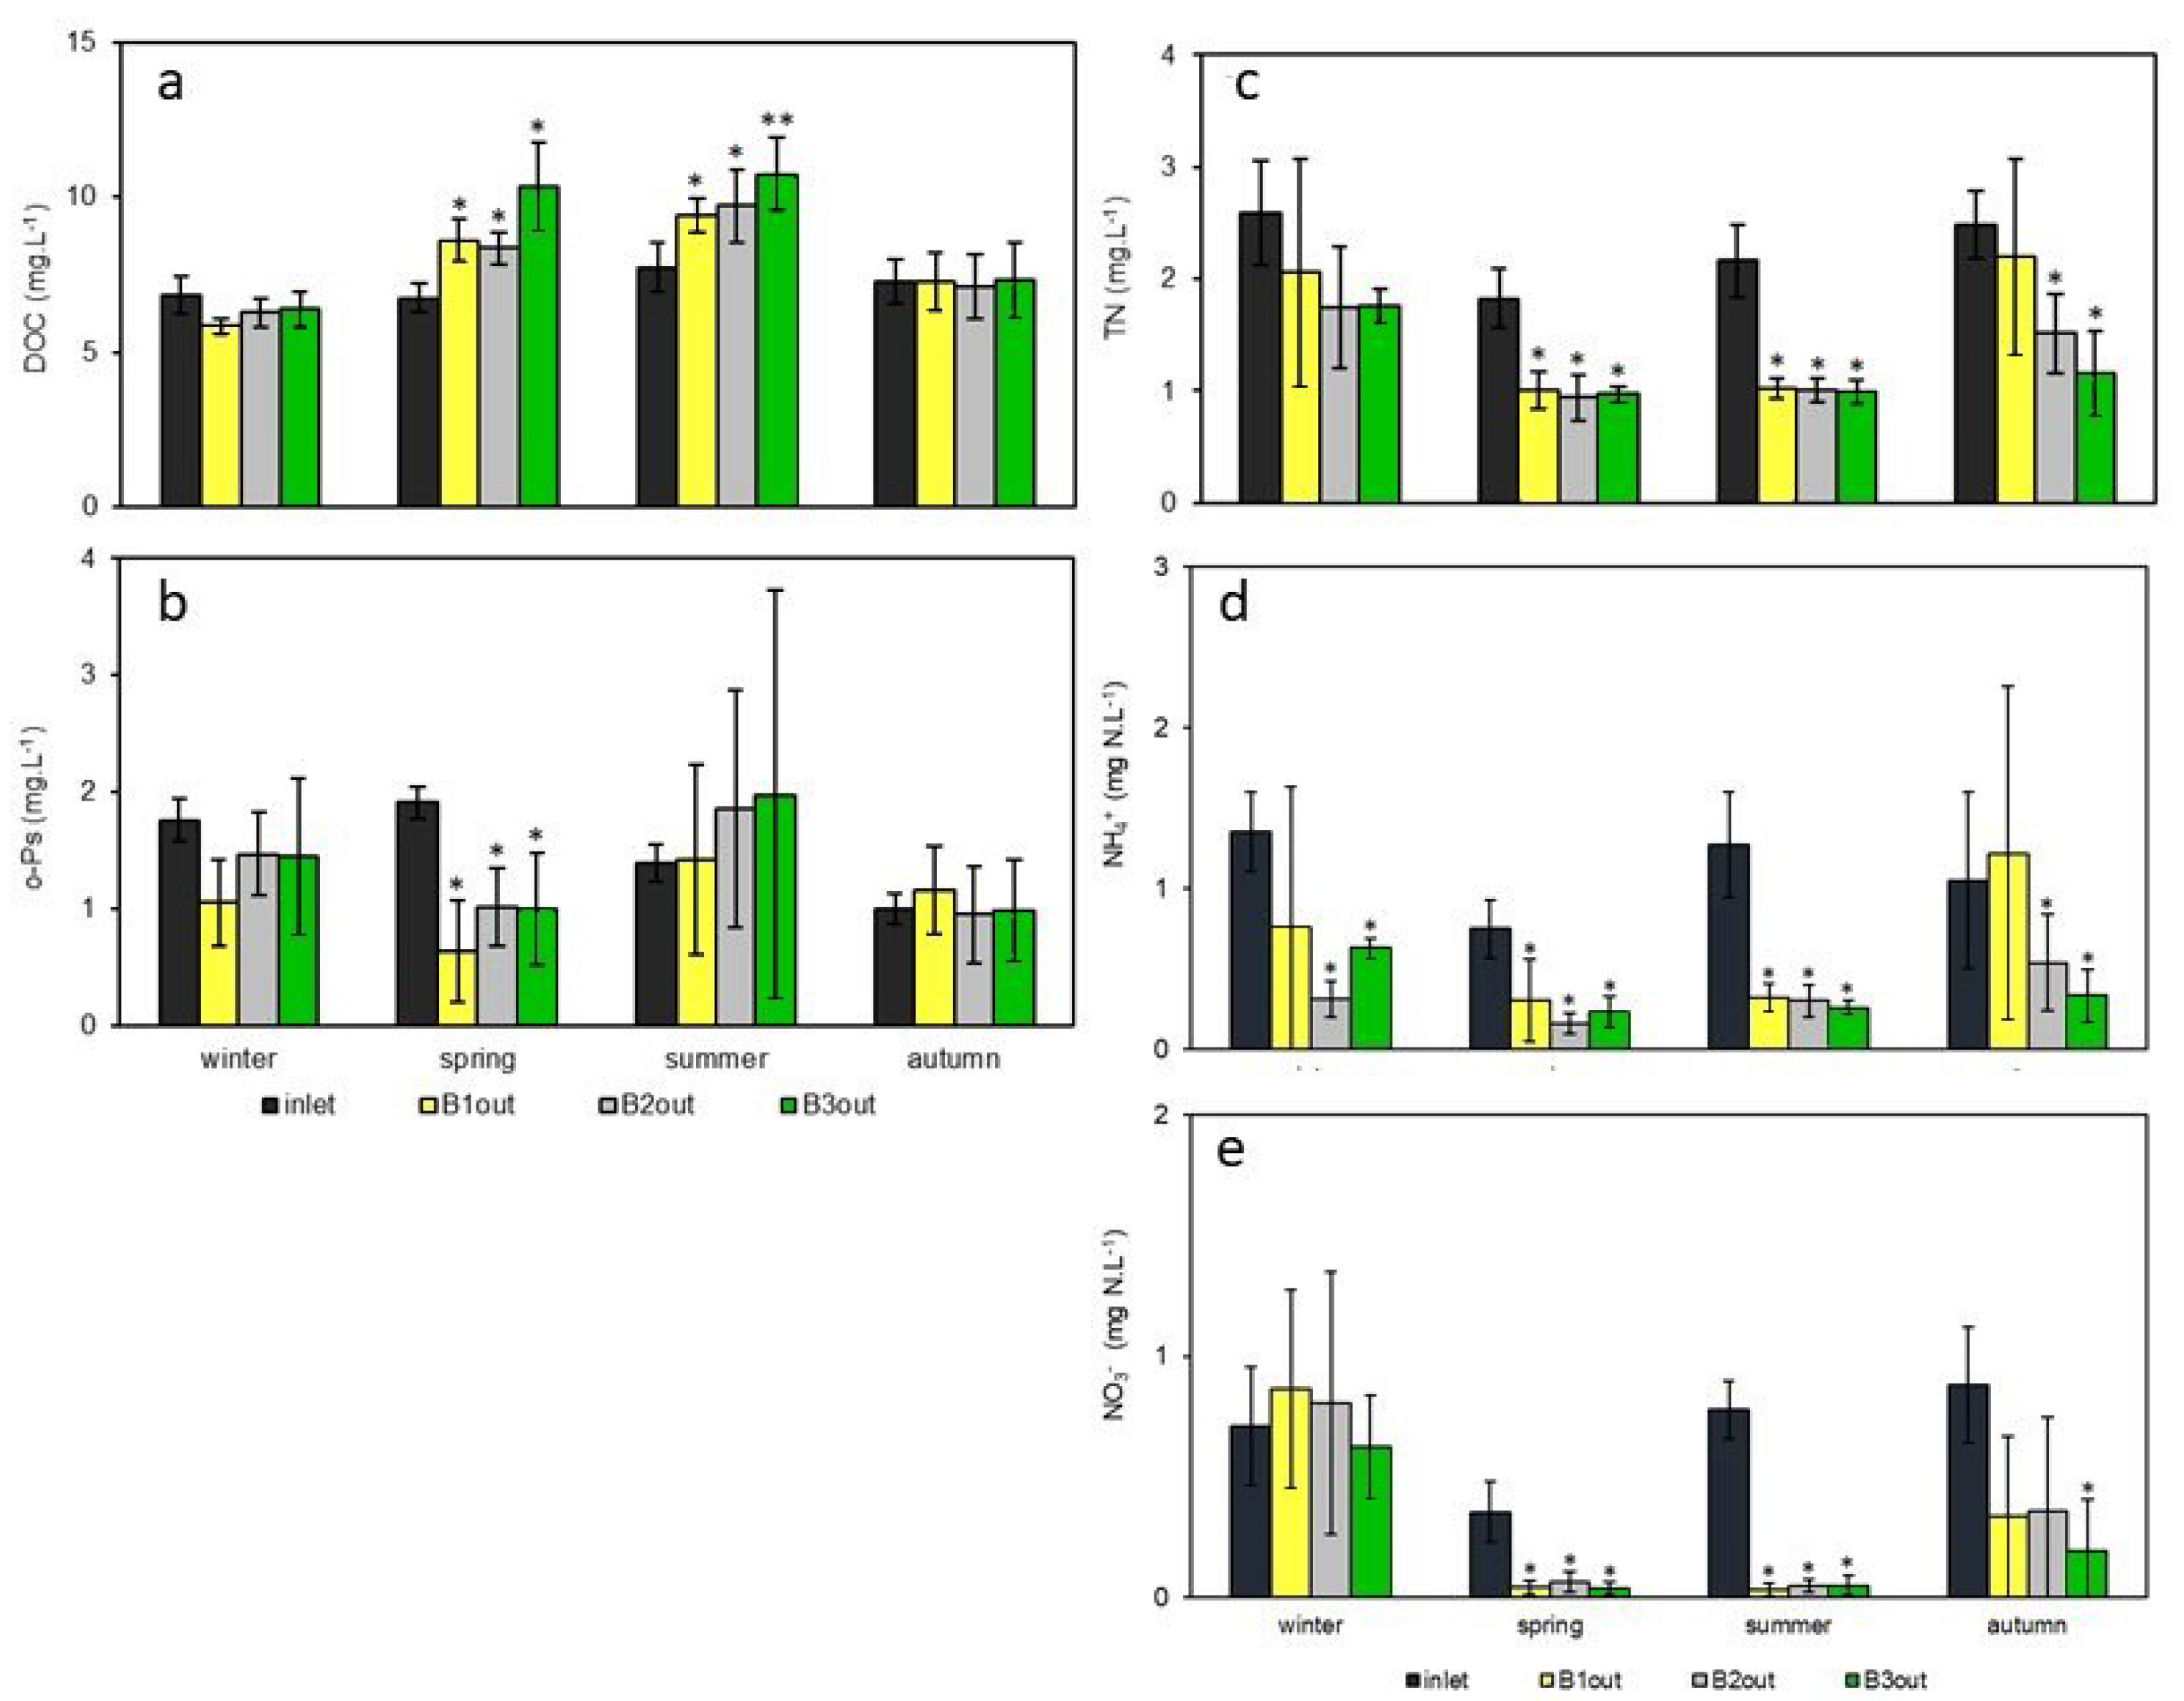
Overall, these parameters changed little within the SF-CW except for TN, ammonium and nitrates, which decreased significantly between the inlet and outlets of the three basins. The average treatment efficiency for TN was between 30% (B1) and 53% (B3) (Table S1). Nitrification (NH4+ to NO3)/denitrification (NO3 to N2/N2O), uptake by aquatic plants and microorganisms (NH4+/NO3 to organic N) and ammonia volatilization are mechanisms often encountered in CWs [8,47]. Here, pH is well buffered (7.8 ± 0.2 at inlet and 7.9 ± 0.3 at outlets); therefore, ammonia loss by volatilization is negligible since it generally requires a pH level above 9.3 [8]. The other mechanisms mentioned above are dependent on living organisms and should be dependent on temperature and sunlight variations. During this study, summer was warmer and sunnier than winter (Table 1). For this reason, seasonal variations were evaluated, and the average concentrations at the inlet and outlet of the basins as a function of the seasons are shown in Figure 3.
The data show a sustained and stable removal of TN. However, the removal efficiency of N-species was different according to the season. The mean concentrations in TN (Figure 3c) at the basin outlets were lower in summer (about 1 mg·L−1) than in winter (about 2 mg·L−1) (Table S1). The removal efficiencies for B1 were higher in summer (55%) than in autumn (24%) and winter (10%) and the removal efficiencies for B2 and B3 were higher in summer (57% and 57%, respectively) than in winter (19%, and 31%, respectively) (Table S2).
The mean concentration in ammonium at the outlets of the three basins was significantly different from the mean concentration at the inlet in spring and summer (Figure 3d). It is also different for B2 and B3 in winter and autumn. The large standard deviations observed in winter and autumn for B1 do not allow us to draw any solid conclusion.
In the case of nitrates (Figure 3e), there was a significant difference between inlet and outlet for the three basins in spring and summer when the vegetation was actively developing. In winter and autumn there was no difference between inlet and outlet, except for B3 in autumn.
These results demonstrate a seasonal effect influenced by the reduced temperatures in the winter. Temperature is a key environmental factor in nitrogen removal kinetics, as it regulates the activity of nitrifying and denitrifying bacteria in CWs [48]. The overall rate of nitrate removal was higher in the summer than in the winter [49]. Mietto et al. [50] showed that the activity of denitrifying bacteria in a CW is generally more intense with a temperature above 14.2 °C. During autumn, the higher yields in B2 and B3 were caused by the planted plants that allow the development of additional bacteria that attach to their underwater parts (stem lower section, root, rhizome), resulting in a greater bacterial biomass, and therefore a greater bacterial activity in spite of decreasing temperatures (Table 1) [51]. In addition to supporting bacteria, aquatic plants take up nitrogen for their growth, and their development is dependent on temperature and solar radiation (photosynthesis). The two forms of nitrogen generally used for assimilation are NH4+ and NO3 [52,53,54,55]. Rooted plants rely primarily on nutrient uptake from sediment, whereas for no rooted plants, water is the primary source of nutrients [53]. Although the uptaken amount is plant-specific, the uptake of nitrogen by plants was a significant mechanism during spring and summer in temperate climates, and this contributed to the good efficiency of the basins during these two seasons compared to autumn and winter. Production of NH4+ in autumn by the decomposition of Ceratophyllum sp. cannot be excluded: it may be the reason for the high NH4+ concentration observed in B1, as the basin is hosting a large amount of this species.
The water flowing through the basins was enriched in DOC in spring and summer (Figure 3a), with concentrations for B1out, B2out and B3out above 8 mg.L−1, and treatment efficiencies for B1, B2 and B3 of −21, −24 and −53%, respectively, in the spring and −27, −25 and −38%, respectively, in the summer (Table S2). This result is contrary to different studies showing that DOC content can decrease as a result of photodegradation and biodegradation [56,57,58,59], which are major processes in CWs. However, these studies were run with DOC types which differ largely from those in ours. Mostofa et al. [56] and Bowen et al. [59] studied river DOM, Hansen et al. [58] worked with peat soil, algae and plants (Schoenoplectus acutus, Typha spp., and Oryza sativa, which do not populate our SF-CW) leachates. Aquatic plants growing within CWs can exude DOC via their roots or leaves for rootless plants. These compounds can serve as food for the establishment of a bacterial community [14,22,25], or inhibit the growth of other plants [60,61,62]. These plants may also release DOC when they are in contact with water after their death by bacterial degradation of the POM [63]. The exudation hypothesis seems most likely, since the increase in DOC at the outlet of the basins relative to the inlet occurs exclusively when the aquatic plants were developing or when they were mature, i.e., in spring and summer, even though there was a turnover of submerged aquatic plants between spring and summer within the CW. Spring is favorable for Cladophora sp. which goes into senescence in early summer to give way to other aquatic plants. These algae will be degraded by microorganisms, which releases DOC. No difference was seen between planted and nonplanted basins, since proportionally there were more opportunistic submerged plants than planted plants in the basins.
o-Ps were very poorly eliminated within the basins, with removal efficiency being highly variable. Spring seemed to be the most favorable season, since there was significant difference between the inlet and the three outlets (Figure 3b), but the outlet concentrations were similar over the seasons (Table S3). The two main mechanisms for phosphorus removal within CWs are uptake by plants, and adsorption to the substrate. The contribution of microorganisms remains small [64]. Phosphorus removal in CWs is the most effective in systems where water is filtered through the substrate [8], such as horizontal flow and vertical flow CWs [65]. In a free surface CW, as here, the main part of the water does not come into contact with the substrate; therefore, this mechanism is seldom solicited. On the other hand, the decrease in o-Ps in the spring was probably induced by the development of aquatic plants. o-Ps uptake by plants is highest during the early growth phase [8]. Feijoó et al. [66] and Gao et al. [67] also showed that macrophytes are most effective at removing phosphorus during the spring but also in the autumn, which was not noted here. Aquatic plants do not have the same affinity for phosphorus [68] or the same need to grow, which leads to variations in their ability to store phosphorus [69,70]. Of course, these values are specific to this study and would potentially differ if experimental conditions were changed. During the summer, the CW was an o-Ps release zone when Cladophora sp., which grew in the spring, entered senescence and was degraded; the CW was and an o-Ps sink when other plants (L. minor, L. gibba, C. submersum, C. demersum and Wollfia sp.) were growing in July and August.

3.3. DOM Characterization

The increase in DOC between the inlets and the outlets of the basins was an incentive for a further characterization of DOM using optical methods.

3.3.1. UV-Visible Spectra

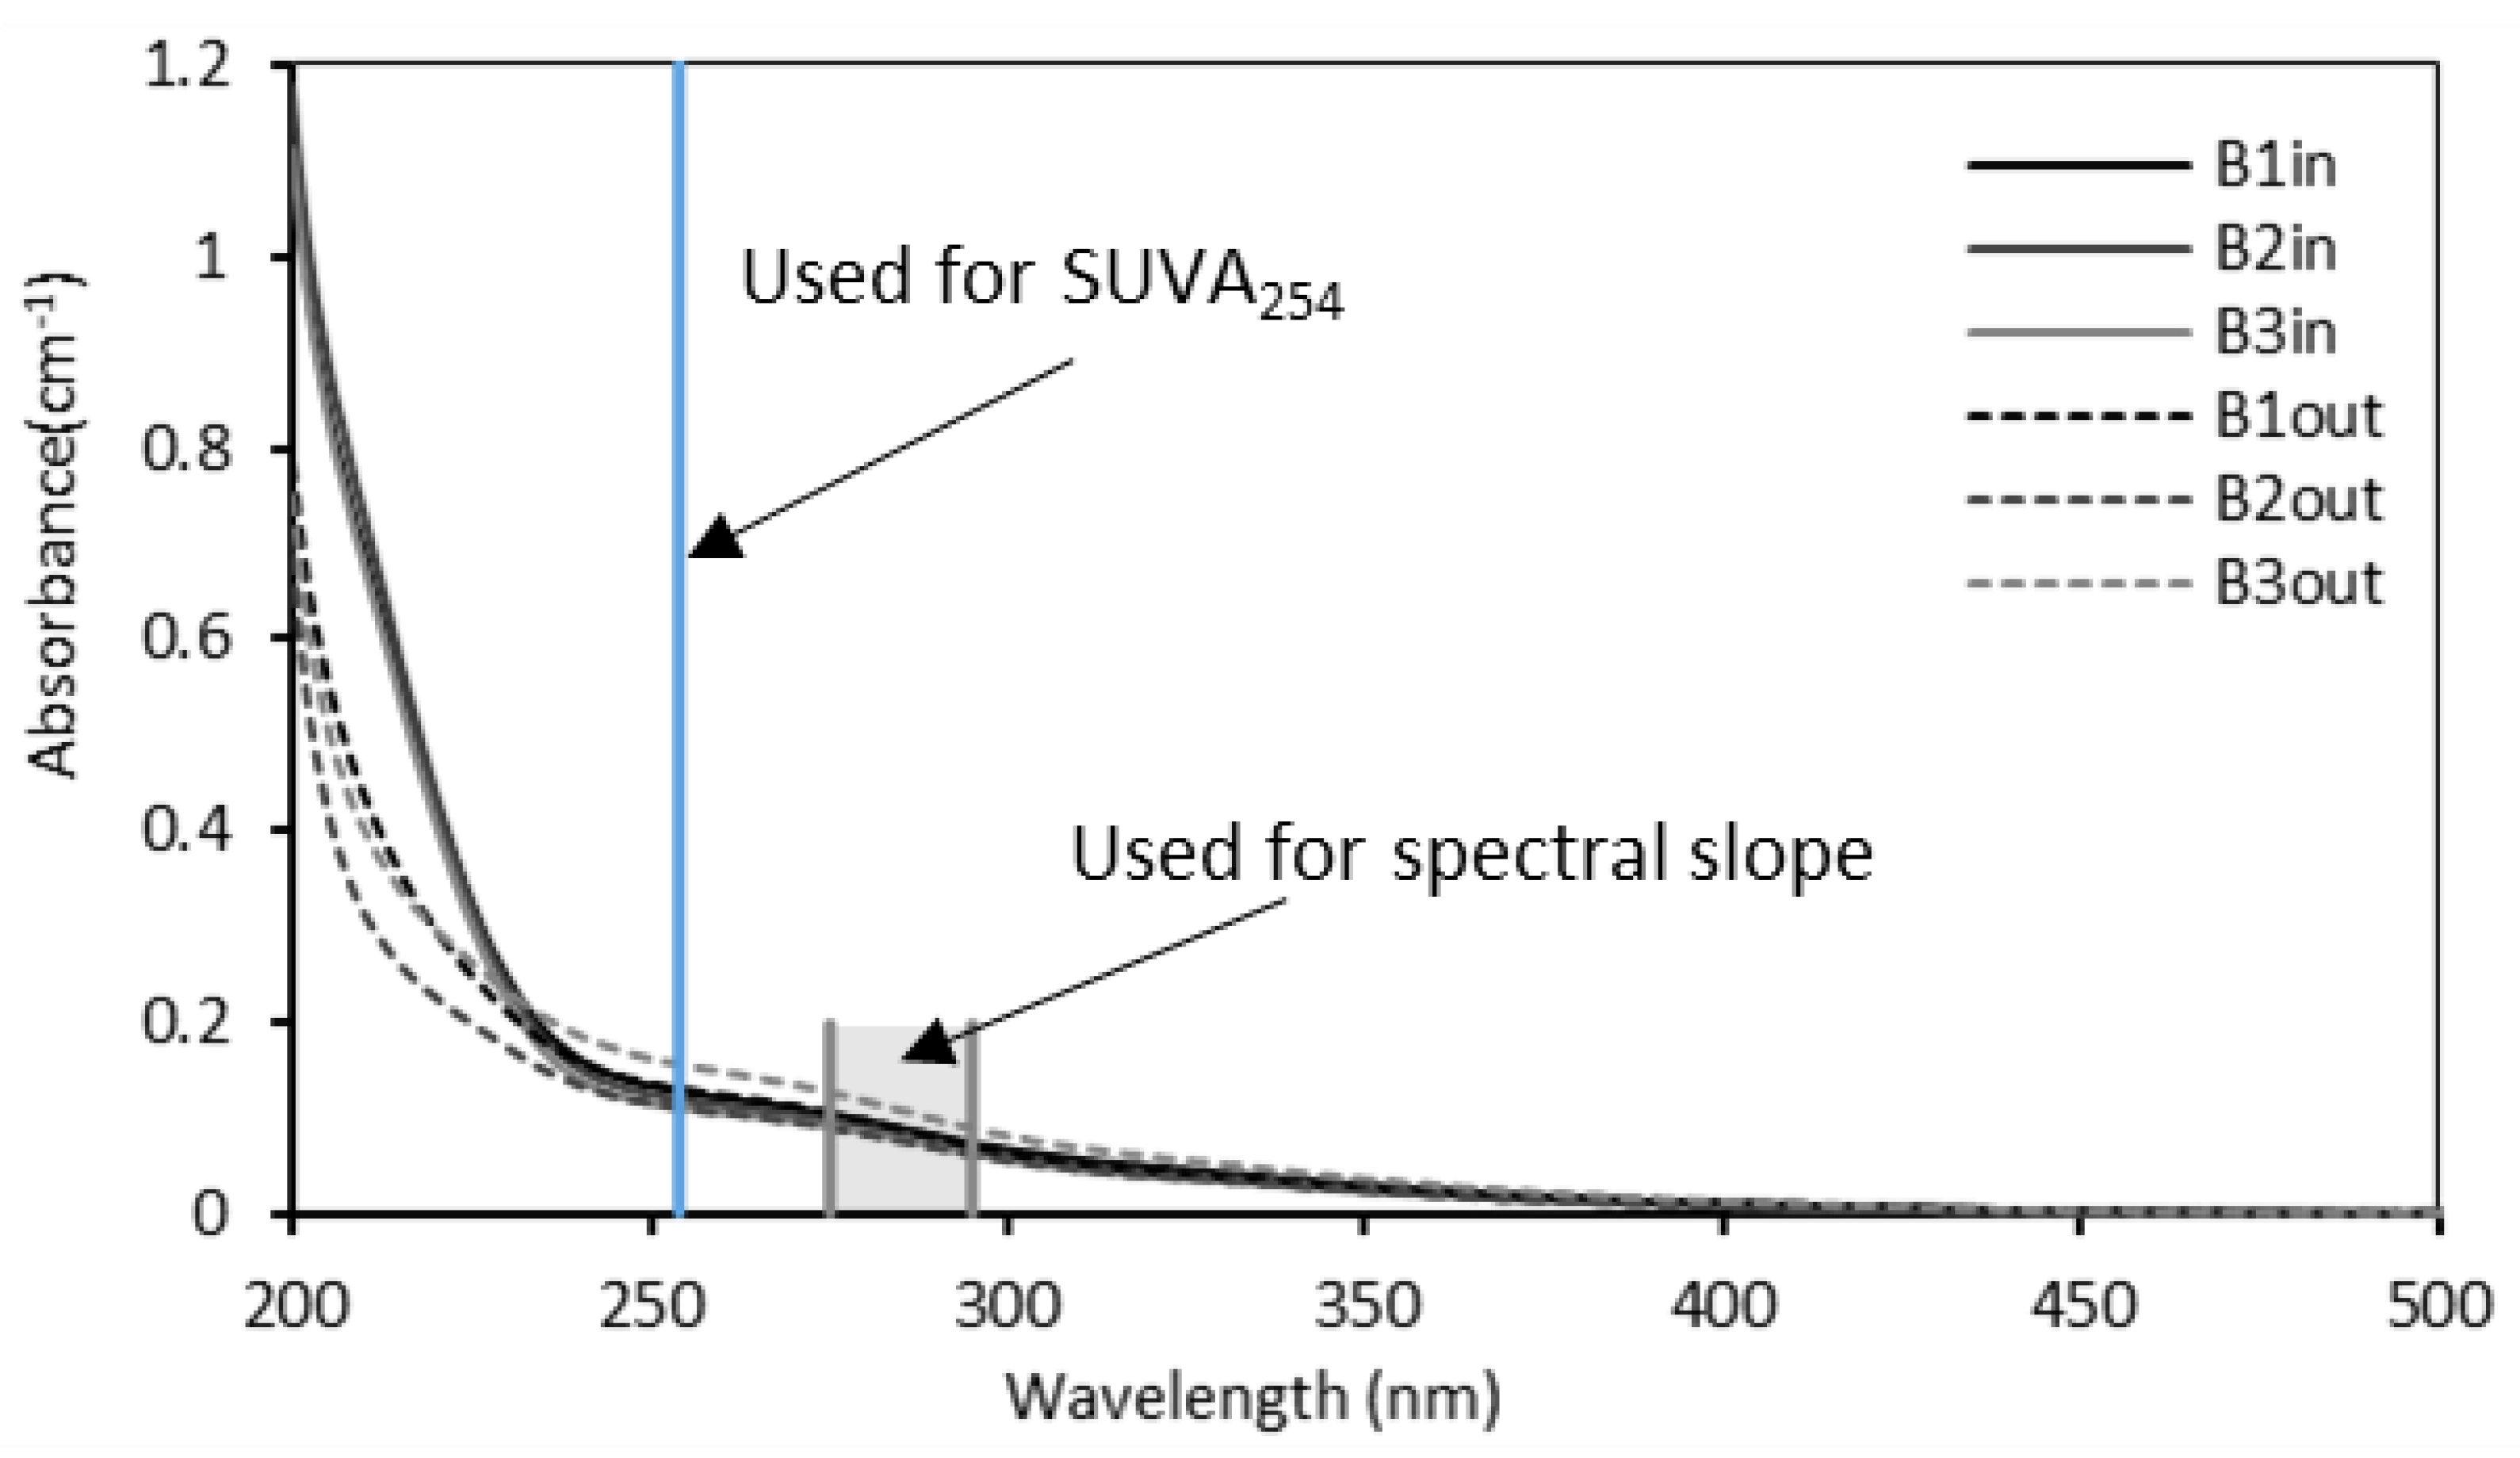
The UV-visible spectra provide information on the characteristics of DOM in the basins after calculating the S275–295, E2/E3 and SUVA254 indices. An example is provided in Figure 4.
The average SUVA254 values for the inlets and outlets ranged from 2.1 to 2.2 L·mg C−1 ·nm−1 (Table 3). This ratio describes the hydrophobicity and hydrophilicity of DOM in water; a SUVA > 4 indicates mainly hydrophobic and especially aromatic material, whereas a SUVA < 3 illustrates mainly hydrophilic material [71]. DOC with SUVA less than 2 contains less than 20% aromaticity [33]. All the sampling points show values close to 2, thus the DOC contains few aromatics. There was no significant difference between the inlets and outlets of the basins during the 21 campaigns. As SUVA254 is proportional to the percentage of aromatics [33], there is no change in this percentage. As this index is dependent on DOC (A254/DOC) and DOC contents are higher at the outlet than at the inlet of the basins during the spring and summer (Figure 2a), SUVA254 should decrease during these seasons. However, the DOC released by aquatic plants by exudation [60,61,62] or when degraded by microorganisms may contain some aromatic compounds [26,72,73,74,75], represented by A254, which counterbalances the effect of DOC in SUVA254. This leached DOC depends on the macrophyte species; it can differ, for example, in color and C/nutrient ratio [76], in percentage of humic-like matter and photo-reactivity [77], and in the percentages of proteins, amino acids and carbohydrates [78]. Macrophyte DOC is less aromatic than terrestrial DOC but has similar or higher aromaticity than phytoplankton DOC [78]. Freshly leached labile material from plants and algae has a SUVA254 < 2.5 L·mg C−1 ·nm−1 [58], such that there are very few aromatic compounds released from aquatic plants.
According to literature, S275–295 and E2/E3 are negatively correlated with molecular weight [34,44]. Here, they were not significantly different between the outlets and the inlets of the basins, which would suggest that there is no alteration of DOC from the point of view of molecular weight. When S275–295 and E2/E3 increase, it can be due to photodegradation, which degrades mainly high molecular weight compounds [57]. The 24-h photodegradation experiment A conducted in triplicate in the laboratory with a UV lamp on the WWTP effluent validates this hypothesis (Figure 5). After 24 h of exposure to a UV lamp, S275–295 and E2/E3 increased from 0.018 ± 0.000 to 0.023 ± 0.000 and from 6.0 ± 0.1 to 7.8 ± 0.2, respectively.
Thus, the absence of variation in these indices between the outlets and the inlets of the basins suggests (a) that the two processes did not operate within the basins or (b) that the actions of the two processes were of the same intensities that stabilized them. According to the season, these hypotheses could be validated since there is a decline in these processes during the autumn and winter as a result of the decrease in water temperature, which reduces the bacterial metabolism (biodegradation), and the decrease in the amount of solar radiation reaching the surface of the basins (photodegradation). Conversely, there was an increase in these processes during the spring and summer. UV-visible indices show some limitations in explaining the processes undergone by DOC [58].

3.3.2. Fluorescence Spectra

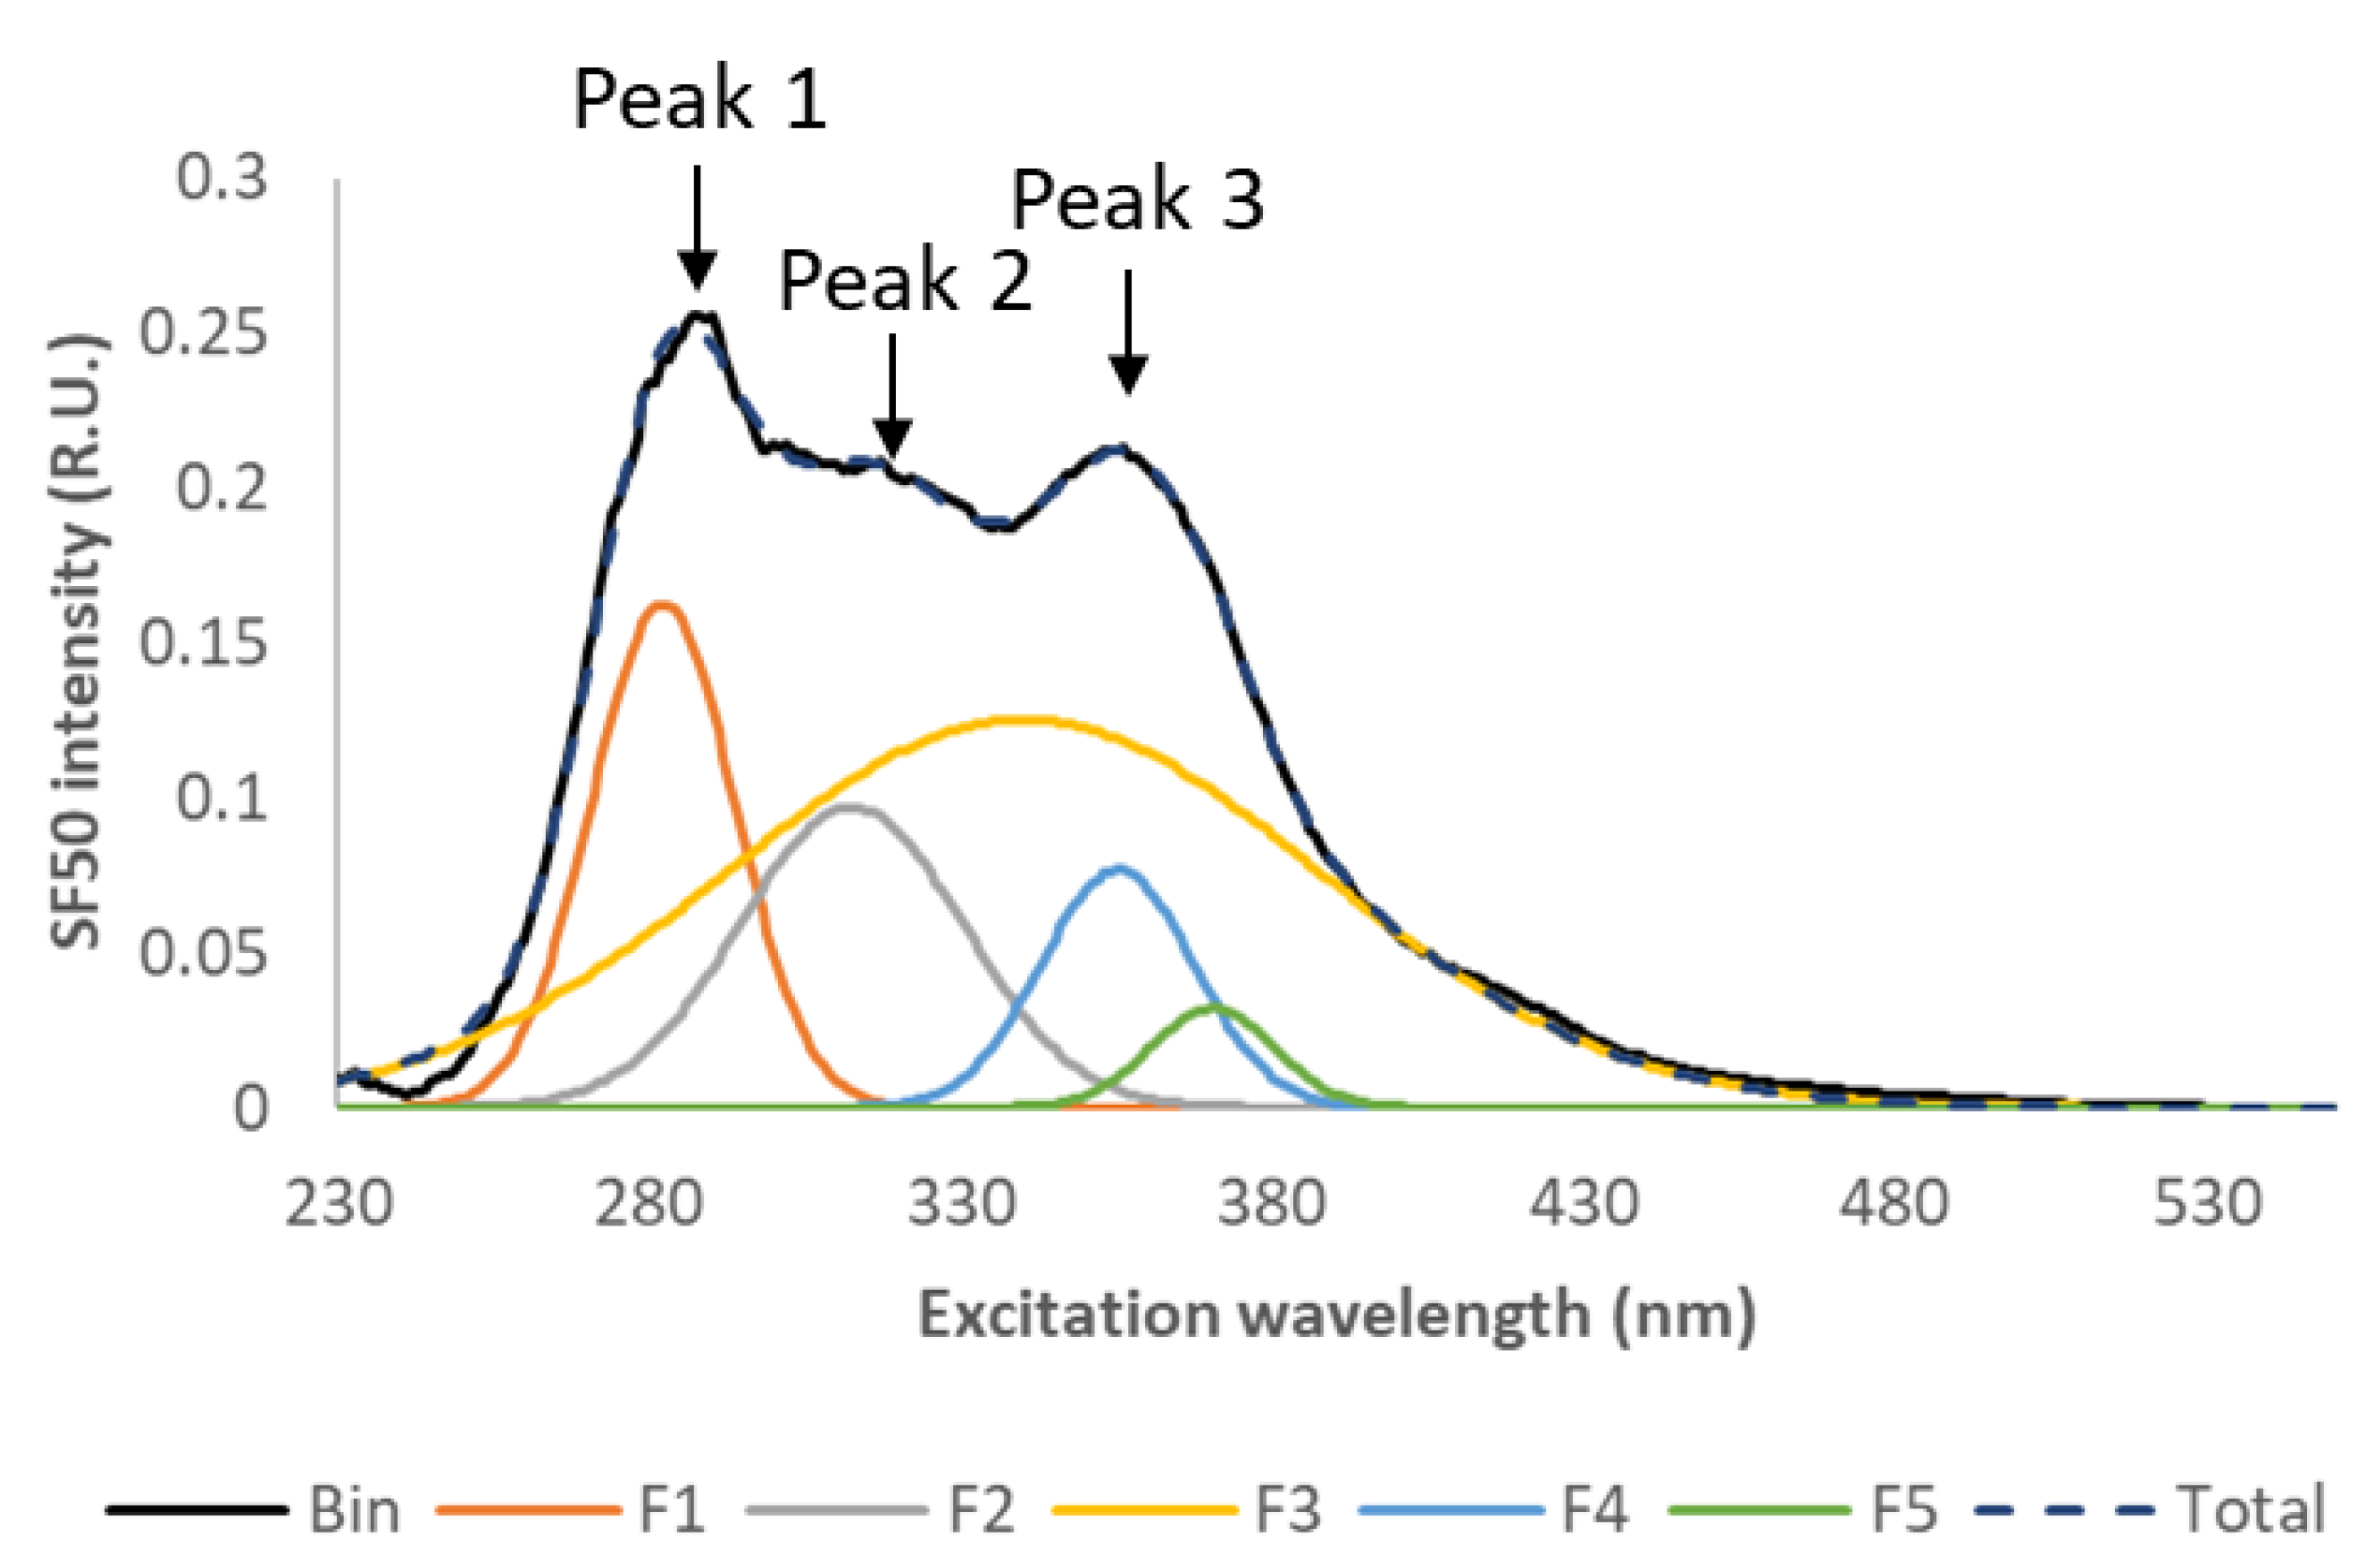
Three fluorescence peaks were observed in the synchronous fluorescence spectrum of B1in (Figure 6). Peak 1 (max approximately at λex = 270–290 nm) is associated with protein-like substances [49,50,51,52,53,54,55,56,57,58,59,60,61,62,63,64,65,66,67,68,69,70,71,72,73,74,75,76,77,78,79,80]. Peak 2 (max approximately λex = 320 nm) and peak 3 (max approximately λex = 350–360 nm) are attributed to humic-like substances [79,80]. These peaks can be further associated to five fluorophores, as determined by spectral deconvolution. Their characteristic wavelengths (bi) are 280 nm (F1), 310 nm (F2), 340 nm (F3), 355 nm (F4) and 370 nm (F5). F1 is associated to protein-like substances, and F2 to F5 to humic-like substances. F3 fluorescence contributes to the whole wavelength range and has an influence on peak 1 fluorescence.
When comparing the synchronous fluorescence spectra between the inlet and the outlet in winter and summer (Figure 7) it appears that there was a decrease for the intensities of the three peaks, but this was less pronounced in winter.
As photodegradation is a major process that can modify the characteristics of DOM [57,81,82,83,84,85,86,87], the evolution of the synchronous fluorescence intensities of the protein-like substances, represented by F1 and of the humic-like substances (represented by the sum of the intensities of F2 to F5) were plotted as a function of time for the photolysis experiment A, run with a UV-A lamp (Figure 8b). Protein-like substances are less sensitive to photolysis than humic-like substances, as their fluorescence decreased by 30% during the experiment, against 76% for the fluorescence related to humic-like substances.
In order to be more realistic concerning the irradiation conditions, experiments B and C were run with a solar lamp for 48 h (Figure 9). Under these conditions, the synchronous fluorescence spectrum collected at the end of experiment C was close to the spectrum collected at the exit of B1 in June 2020. For the winter sample, the photolysis effect observed in the lab was stronger than the one observed on the field.
Figure 10 compares the SF50 intensities related to protein-like and to humic-like substances for the three basins according to the season (n = 21). The lowest protein-like fluorescence intensities were recorded in winter and spring, but globally there was no drastic change between inlet and outlet. The humic-like fluorescence intensities at the outlet were always lower than those at the inlet, whatever the season. This is in agreement with the findings of Mostafa et al. [56], Hur et al. [81] and Clark et al. [85] who have shown that the decrease in fluorescence intensity of humic-like compounds is more important than that of protein-like compounds after a period of photolysis.
The decrease in intensity of the fluorophores comes either from the transformation of the fluorescent DOM into DOM without particular optical properties, from the total oxidation of these molecules into CO2 [20], or from their transformation into CH4 by anaerobic fermentation. The DOC released from aquatic plants in the spring and summer does not seem to alter the fluorescence spectrum, unless the apparent stability of the protein-like substances compared to humic-like substances is related to aquatic plants that can release these compounds. Protein-like compounds would be less sensitive to the removal process of this CW than humic-like fluorophores. It is not possible to extrapolate this to all CWs because the opposite can also exist [83,84,85,86]. This will depend on the type of CW, the origin and quantity of the inlet DOM, the latitude, the residence time, and the type and quantity of the vegetation. Many studies [18,21,24,86,88] showed that the fresh labile material leached from plants and algae is composed mainly of carbohydrates, which are relatively hydrophilic substances with low aromatics, as well as proteins, amino acids and peptides. The quantity of humic substances released seems negligible. According to Fu et al. [88], the proportion of humic-like and protein-like fluorescent components can be similar but it will depend on the algae or aquatic plants. No leaching experiments have been performed with plants growing in the CW, thus it is difficult to conclude on this subject. Despite this, there was a decrease in fluorescence between input and output for these different fluorophores. In summer, the coverage of the basins by Lemna sp. may hinder partially photolysis, but there was always a thin layer of water above the plants exposed to UV radiation, which is more powerful in summer than in winter.

4. Conclusions

Within large-scale SF-CWs under temperate climates, the fate of DOC, nitrogen species and o-Ps is more or less seasonally dependent. The most favorable season to eliminate nitrogen is summer (>50%), whereas DOC is released during this period. o-Ps are hardly removed throughout the year by SF-CWs. Optical characteristics, which can be easily measured, are very complementary to DOC analysis to investigate the fate of DOM in SF-CWs. According to E2/E3, SUVA254 and the spectral slope S275–295, the DOC absorbance global characteristics in this SF-CW did not change, and these results differ from other studies. This apparent stability is attributed to the combination of several phenomena with inverse effects, such as photodegradation, exudation of organics by plants, etc. Synchronous fluorescence spectra show differences between the inlet and the outlet, which is attributed to photolysis that affects more humic-like substances than protein-like substances. Although it has not been studied here, biodegradation could also modify the fluorescence spectra. Our future challenge is to identify the DOM released by the most abundant aquatic plants in this SF-CW (Ceratophyllum sp., Lemna sp., Cladophora sp. and Phragmites australis), and to assess the long-term effect of seasons on such large-scale SF-CWs with a more sophisticated feeding pattern (alternation of reclaimed wastewater and stormwater).

Supplementary Materials

The following supporting information can be downloaded at https://www.mdpi.com/article/10.3390/w14091474/s1: Figure S1: (a) Day length at the location and effective number of sun in 2019, 2020 and 2021; (b) mean temperatures under shelter in 2019, 2020 and 2021, compared to the mean minimal, maximal and mean values over the 2013–2021 period; (c) mean total number of hours of sun per month in 2019, 2020 and 2021, compared to the mean values over the 2013–2021 period. Figure S2: Different views of the SF-CW from the Sentinel-2 satellite. Table S1: TN concentrations at the outlet of B1, B2 and B3 and its removal according to the seasons. Table S2: DOC concentrations at the outlet of B1, B2 and B3 and its removal according to the seasons. Table S3: o-Ps concentrations at the outlet of B1, B2 and B3 and its removal according to the seasons.

Author Contributions

Conceptualization, N.M. and M.-N.P.; methodology, N.M.; validation, N.M., N.A. and M.-N.P.; investigation, N.M. and M.-N.P.; resources, C.P.; data curation, N.M.; writing—original draft preparation, N.M.; writing—review and editing, N.A. and M.-N.P.; supervision, N.A. and M.-N.P.; project administration, C.P. and M.-N.P.; funding acquisition, C.P. and M.-N.P. All authors have read and agreed to the published version of the manuscript.

Funding

This research was funded by the Urban Community of Grand Reims, the MEDDE, the Agence de l’Eau Seine-Normandie and the LTSER Zone Atelier du Bassin de la Moselle.

Data Availability Statement

Not applicable.

Conflicts of Interest

The authors declare no conflict of interest.

References

  1. Zhang, Y.; Geißen, S.-U.; Gal, C. Carbamazepine and diclofenac: Removal in wastewater treatment plants and occurrence in water bodies. Chemosphere 2008, 73, 1151–1161. [Google Scholar] [CrossRef] [PubMed]
  2. Zhang, Y.; Marrs, C.F.; Simon, C.; Xi, C. Wastewater treatment contributes to selective increase of antibiotic resistance among Acinetobacter spp. Sci. Total Environ. 2009, 407, 3702–3706. [Google Scholar] [CrossRef]
  3. Matamoros, V.; García, J.; Bayona, J.M. Organic micropollutant removal in a full-scale surface flow constructed wetland fed with secondary effluent. Water Res. 2008, 42, 653–660. [Google Scholar] [CrossRef] [PubMed]
  4. Hijosa-Valsero, M.; Matamoros, V.; Sidrach-Cardona, R.; Martín-Villacorta, J.; Bécares, E.; Bayona, J.M. Comprehensive assessment of the design configuration of constructed wetlands for the removal of pharmaceuticals and personal care products from urban wastewaters. Water Res. 2010, 44, 3669–3678. [Google Scholar] [CrossRef] [PubMed]
  5. Mustafa, A. Constructed wetland for wastewater treatment and reuse: A case study of developing country. Int. J. Environ. Sci. Dev. 2013, 4, 20–24. [Google Scholar] [CrossRef] [Green Version]
  6. Matamoros, V.; Rodríguez, Y.; Bayona, J.M. Mitigation of emerging contaminants by full-scale horizontal flow constructed wetlands fed with secondary treated wastewater. Ecol. Eng. 2017, 99, 222–227. [Google Scholar] [CrossRef]
  7. Ergaieg, K.; Miled, T.B. Full-scale hybrid constructed wetlands monitoring for decentralized tertiary treatment of municipal wastewater. Arab. J. Geosci. 2021, 14, 1407. [Google Scholar] [CrossRef]
  8. Vymazal, J. Removal of nutrients in various types of constructed wetlands. Sci. Total Environ. 2007, 380, 48–65. [Google Scholar] [CrossRef]
  9. Khan, S.; Ahmad, I.; Shah, M.T.; Rehman, S.; Khaliq, A. Use of constructed wetland for the removal of heavy metals from industrial wastewater. J. Environ. Manag. 2009, 90, 3451–3457. [Google Scholar] [CrossRef]
  10. Dunne, E.J.; Coveney, M.F.; Marzolf, E.R.; Hoge, V.R.; Conrow, R.; Naleway, R.; Lowe, E.F.; Battoe, L.E. Efficacy of a large-scale constructed wetland to remove phosphorus and suspended solids from Lake Apopka, Florida. Ecol. Eng. 2012, 42, 90–100. [Google Scholar] [CrossRef]
  11. Mathon, B.; Coquery, M.; Miège, C.; Vandycke, A.; Choubert, J.-M. Influence of water depth and season on the photodegradation of micropollutants in a free-water surface constructed wetland receiving treated wastewater. Chemosphere 2019, 235, 260–270. [Google Scholar] [CrossRef] [PubMed]
  12. Kaur, R.; Talan, A.; Tiwari, B.; Pilli, S.; Sellamuthu, B.; Tyagi, R.D. Constructed wetlands for the removal of organic micro-pollutants. In Current Developments in Biotechnology and Bioengineering; Varjani, S., Pandey, A., Tyagi, R.D., Ngo, H.H., Larroche, C., Eds.; Elsevier: Amsterdam, The Netherlands, 2020; pp. 87–140. [Google Scholar] [CrossRef]
  13. Cory, R.M.; Harrold, K.H.; Neilson, B.T.; Kling, G.W. Controls on dissolved organic matter (DOM) degradation in a headwater stream: The influence of photochemical and hydrological conditions in determining light-limitation or substrate-limitation of photo-degradation. Biogeosciences 2015, 12, 6669–6685. [Google Scholar] [CrossRef] [Green Version]
  14. Reitsema, R.E.; Meire, P.; Schoelynck, J. The future of freshwater macrophytes in a changing world: Dissolved organic carbon quantity and quality and its interactions with macrophytes. Front. Plant Sci. 2018, 9, 629. [Google Scholar] [CrossRef] [PubMed]
  15. Pan, B.; Ghosh, S.; Xing, B. Nonideal binding between dissolved humic acids and polyaromatic hydrocarbons. Environ. Sci. Technol. 2007, 41, 6472–6478. [Google Scholar] [CrossRef] [PubMed]
  16. Doig, L.E.; Liber, K. Influence of dissolved organic matter on nickel bioavailability and toxicity to Hyalella azteca in water-only exposures. Aquat. Toxicol. 2006, 76, 203–216. [Google Scholar] [CrossRef]
  17. Li, Y.; Wang, H.; Xia, X.; Zhai, Y.; Lin, H.; Wen, W.; Wang, Z. Dissolved organic matter affects both bioconcentration kinetics and steady-state concentrations of polycyclic aromatic hydrocarbons in zebrafish (Danio rerio). Sci. Total Environ. 2018, 639, 648–656. [Google Scholar] [CrossRef]
  18. Liu, S.; Feng, W.; Song, F.; Li, T.; Guo, W.; Wang, B.; Wang, H.; Wu, F. Photodegradation of algae and macrophyte-derived dissolved organic matter: A multi-method assessment of DOM transformation. Limnologica 2019, 77, 125683. [Google Scholar] [CrossRef]
  19. He, W.; Chen, M.; Schlautman, M.A.; Hur, J. Dynamic exchanges between DOM and POM pools in coastal and inland aquatic ecosystems: A review. Sci. Total Environ. 2016, 551–552, 415–428. [Google Scholar] [CrossRef]
  20. Ward, C.P.; Cory, R.M. Complete and partial photo-oxidation of dissolved organic matter draining permafrost soils. Environ. Sci. Technol. 2016, 50, 3545–3553. [Google Scholar] [CrossRef]
  21. Castillo, C.R.; Sarmento, H.; Álvarez-Salgado, X.A.; Gasol, J.M.; Marraséa, C. Production of chromophoric dissolved organic matter by marine phytoplankton. Limnol. Oceanogr. 2010, 55, 446–454. [Google Scholar] [CrossRef] [Green Version]
  22. Hur, J.; Lee, B.-M.; Shin, H.-S. Microbial degradation of dissolved organic matter (DOM) and its influence on phenanthrene–DOM interactions. Chemosphere 2011, 85, 1360–1367. [Google Scholar] [CrossRef] [PubMed]
  23. McIntyre, A.M.; Guéguen, C. Binding interactions of algal-derived dissolved organic matter with metal ions. Chemosphere 2013, 90, 620–626. [Google Scholar] [CrossRef] [PubMed]
  24. Liu, S.; Zhu, Y.; Meng, W.; He, Z.; Feng, W.; Zhang, C.; Giesy, J.P. Characteristics and degradation of carbon and phosphorus from aquatic macrophytes in lakes: Insights from solid-state 13C NMR and solution 31P NMR spectroscopy. Sci. Total Environ. 2016, 543, 746–756. [Google Scholar] [CrossRef] [PubMed]
  25. Qi, Y.; Xue, Y.; Wang, X. Release and microbial degradation of dissolved organic carbon and nitrogen from Phragmites australis and Suaeda salsa in the wetland of the Yellow River Estuary. J. Oceanogr. Mar. Res. 2017, 5, 160. [Google Scholar] [CrossRef]
  26. Maie, N.; Jaffé, R.; Miyoshi, T.; Childers, D.L. Quantitative and qualitative aspects of dissolved organic carbon leached from senescent plants in an oligotrophic wetland. Biogeochemistry 2006, 78, 285–314. [Google Scholar] [CrossRef]
  27. Xiaobing, L.; Jianming, Z.; Congqiang, L.; Zhongqing, W.; Fushun, W.; Guojiang, W.; Ronggui, H. Enzymatic and microbial degradation of organic matter in Lake Hongfeng, Guizhou Province, China. Chin. J. Geochem. 2004, 23, 81–88. [Google Scholar] [CrossRef]
  28. Kirchman, D.L. Microbial proteins for organic material degradation in the deep ocean. Proc. Natl. Acad. Sci. USA 2018, 115, 445–447. [Google Scholar] [CrossRef]
  29. Kosinkiewicz, B. Humic-like substances of bacterial origin. I. Some aspects of the formation and nature of humic-like substances produced by Pseudomonas. Acta Microbiol. Pol. 1977, 26, 377–386. [Google Scholar]
  30. Shimotori, K.; Omori, Y.; Hama, T. Bacterial production of marine humic-like fluorescent dissolved organic matter and its biogeochemical importance. Aquat. Microb. Ecol. 2009, 58, 55–66. [Google Scholar] [CrossRef]
  31. Lou, T.; Xie, H. Photochemical alteration of the molecular weight of dissolved organic matter. Chemosphere 2006, 65, 2333–2342. [Google Scholar] [CrossRef]
  32. Wilske, C.; Herzsprung, P.; Lechtenfeld, O.J.; Kamjunke, N.; von Tümpling, W. Photochemically induced changes of dissolved organic matter in a humic-rich and forested stream. Water 2020, 12, 331. [Google Scholar] [CrossRef] [Green Version]
  33. Weishaar, J.L.; Aiken, G.R.; Bergamaschi, B.A.; Fram, M.S.; Fujii, R.; Mopper, K. Evaluation of Specific Ultraviolet Absorbance as an indicator of the chemical composition and reactivity of dissolved organic carbon. Environ. Sci. Technol. 2003, 37, 4702–4708. [Google Scholar] [CrossRef] [PubMed]
  34. Helms, J.R.; Stubbins, A.; Ritchie, J.D.; Minor, E.C.; Kieber, D.J.; Mopper, K. Absorption spectral slopes and slope ratios as indicators of molecular weight, source, and photobleaching of chromophoric dissolved organic matter. Limnol. Oceanogr. 2008, 53, 955–969. [Google Scholar] [CrossRef] [Green Version]
  35. De Haan, H.; De Boer, T. Applicability of light absorbance and fluorescence as measures of concentration and molecular size of dissolved organic carbon in humic Lake Tjeukemeer. Water Res. 1987, 21, 731–734. [Google Scholar] [CrossRef]
  36. Assaad, A.; Pontvianne, S.; Corriou, J.-P.; Pons, M.-N. Spectrophotometric characterization of dissolved organic matter in a rural watershed: The Madon River (N-E France). Environ. Monit. Assess. 2015, 187, 188. [Google Scholar] [CrossRef]
  37. Weaver, A.J.; Eby, M.; Wiebe, E.C.; Bitz, C.M.; Duffy, P.B.; Ewen, T.L.; Fanning, A.F.; Holland, M.M.; MacFadyen, A.; Matthews, H.D.; et al. The UVic earth system climate model: Model description, climatology, and applications to past, present and future climates. Atmos. Ocean 2001, 39, 361–428. [Google Scholar] [CrossRef] [Green Version]
  38. Reid, A.M.; Chapman, W.K.; Prescott, C.E.; Nijland, W. Using excess greenness and green chromatic coordinate colour indices from aerial images to assess lodgepole pine vigour, mortality and disease occurrence. Forest Ecol. Manag. 2016, 374, 146–153. [Google Scholar] [CrossRef]
  39. Soetaert, K.; Hoffmann, M.; Meire, P.; Starink, M.; van Oevelen, D.; Van Regenmortel, S.; Cox, T. Modeling growth and carbon allocation in two reed beds (Phragmites australis) in the Scheldt estuary. Aquat. Bot. 2004, 79, 211–234. [Google Scholar] [CrossRef]
  40. ISO10304-1; Water Quality—Determination of Dissolved Anions by Liquid Chromatography of Ions—Part 1: Determination of Bromide, Chloride, Fluoride, Nitrate, Nitrite, Phosphate and Sulfate. International Organization for Standardization: Geneva, Switzerland, 2017.
  41. Standard Methods Committee of the American Public Health Association, American Water Works Association, Water Environment Federation. 4500-p phosphorus. In Standard Methods For the Examination of Water and Wastewater; Lipps, W.C., Baxter, T.E., Braun-Howland, E., Eds.; APHA Press: Washington, DC, USA, 2018. [Google Scholar] [CrossRef]
  42. NF T90-015; Determination of Ammonium. Association Française de Normalisation: La Plaine Saint-Denis, France, 1975.
  43. ISO 21793; Water Quality—Determination of Total Organic Carbon (TOC), Dissolved Organic Carbon (DOC), Total Bound Nitrogen (TNb), Dissolved Bound Nitrogen (DNb), Total Bound Phosphorus (TPb) and Dissolved Bound Phosphorus (DPb) after Wet Chemical Catalysed Ozone Hydroxyl Radical Oxidation (COHR). International Organization for Standardization: Geneva, Switzerland, 2020.
  44. Peuravuori, J.; Pihlaja, K. Molecular size distribution and spectroscopic properties of aquatic humic substances. Anal. Chim. Acta 1997, 337, 133–149. [Google Scholar] [CrossRef]
  45. Lawaetz, A.J.; Stedmon, C.A. Fluorescence intensity calibration using the Raman scatter peak of water. Appl. Spectrosc. 2009, 63, 936–940. [Google Scholar] [CrossRef]
  46. Lakowicz, J.R. Instrumentation for Fluorescence Spectroscopy. In Principles of Fluorescence Spectroscopy; Lakowicz, J.R., Ed.; Springer: Boston, MA, USA, 2006; pp. 27–61. [Google Scholar] [CrossRef]
  47. Lee, C.; Fletcher, T.D.; Sun, G. Nitrogen removal in constructed wetland systems. Eng. Life Sci. 2009, 9, 11–22. [Google Scholar] [CrossRef]
  48. Hua, Y.; Peng, L.; Zhang, S.; Heal, K.V.; Zhao, J.; Zhu, D. Effects of plants and temperature on nitrogen removal and microbiology in pilot-scale horizontal subsurface flow constructed wetlands treating domestic wastewater. Ecol. Eng. 2017, 108, 70–77. [Google Scholar] [CrossRef]
  49. Van Oostrom, A.J.; Russell, J.M. Denitrification in constructed wastewater wetlands receiving high concentrations of nitrate. Water Sci. Technol. 1994, 29, 7–14. [Google Scholar] [CrossRef]
  50. Mietto, A.; Politeo, M.; Breschigliaro, S.; Borin, M. Temperature influence on nitrogen removal in a hybrid constructed wetland system in Northern Italy. Ecol. Eng. 2015, 75, 291–302. [Google Scholar] [CrossRef]
  51. Huang, J.; Cai, W.; Zhong, Q.; Wang, S. Influence of temperature on micro-environment, plant eco-physiology and nitrogen removal effect in subsurface flow constructed wetland. Ecol. Eng. 2013, 60, 242–248. [Google Scholar] [CrossRef]
  52. Best, E.P.H. Effects of nitrogen on the growth and nitrogenous compounds of Ceratophyllum demersum. Aquat. Bot. 1980, 8, 197–206. [Google Scholar] [CrossRef]
  53. Cedergreen, N.; Madsen, T.V. Nitrogen uptake by the floating macrophyte Lemna minor. N. Phytol. 2002, 155, 285–292. [Google Scholar] [CrossRef]
  54. Tylova-Munzarova, E.; Lorenzen, B.; Brix, H.; Votrubova, O. The effects of NH4+ and NO3 on growth, resource allocation and nitrogen uptake kinetics of Phragmites australis and Glyceria maxima. Aquat. Bot. 2005, 81, 326–342. [Google Scholar] [CrossRef]
  55. Eliašová, A.; Hrivnák, R.; Štefánová, P.; Svitok, M.; Kochjarová, J.; Oťaheľová, H.; Novikmec, M.; Pal’ove-Balang, P. Effects of ammonium levels on growth and accumulation of antioxidative flavones of the submerged macrophyte Ceratophyllum demersum. Aquat. Bot. 2021, 171, 103376. [Google Scholar] [CrossRef]
  56. Mostofa, K.M.G.; Yoshioka, T.; Konohira, E.; Tanoue, E. Photodegradation of fluorescent dissolved organic matter in river waters. Geochem. J. 2007, 41, 323–331. [Google Scholar] [CrossRef]
  57. Lee, M.-H.; Hur, J. Photodegradation-induced changes in the characteristics of dissolved organic matter with different sources and their effects on disinfection by-product formation potential: Photodegradation-induced changes in the characteristics of dissolved organic matter. CLEAN Soil Air Water 2014, 42, 552–560. [Google Scholar] [CrossRef]
  58. Hansen, A.M.; Kraus, T.E.C.; Pellerin, B.A.; Fleck, J.A.; Downing, B.D.; Bergamaschi, B.A. Optical properties of dissolved organic matter (DOM): Effects of biological and photolytic degradation. Limnol. Oceanogr. 2016, 61, 1015–1032. [Google Scholar] [CrossRef] [Green Version]
  59. Bowen, J.C.; Kaplan, L.A.; Cory, R.M. Photodegradation disproportionately impacts biodegradation of semi-labile DOM in streams. Limnol. Oceanogr. 2020, 65, 13–26. [Google Scholar] [CrossRef]
  60. Amorim, C.A.; de Moura-Falcão, R.H.; Valença, C.R.; de Souza, V.R.; Moura, A.N. Allelopathic effects of the aquatic macrophyte Ceratophyllum demersum L. on phytoplankton species: Contrasting effects between cyanobacteria and chlorophytes. Acta Limnol. Bras. 2019, 31, e21. [Google Scholar] [CrossRef] [Green Version]
  61. Gross, E.M.; Erhard, D.; Iványi, E. Allelopathic activity of Ceratophyllum demersum L. and Najas marina ssp. intermedia (Wolfgang) Casper. Hydrobiologia 2003, 506–509, 583–589. [Google Scholar] [CrossRef] [Green Version]
  62. Dong, J.; Chang, M.; Li, C.; Dai, D.; Gao, Y. Allelopathic effects and potential active substances of Ceratophyllum demersum L. on Chlorella vulgaris Beij. Aquat. Ecol. 2019, 53, 651–663. [Google Scholar] [CrossRef]
  63. Moran, M.A.; Hodson, R.E. Dissolved humic substances of vascular plant origin in a coastal marine environment. Limnol. Oceanogr. 1994, 39, 762–771. [Google Scholar] [CrossRef] [Green Version]
  64. Vymazal, J.; Kröpfelová, L. Wastewater Treatment in Constructed Wetlands with Horizontal Sub-Surface Flow; Environmental Pollution; Springer: Dordrecht, The Netherlands, 2008. [Google Scholar] [CrossRef]
  65. Saeed, T.; Al-Muyeed, A.; Afrin, R.; Rahman, H.; Sun, G. Pollutant removal from municipal wastewater employing baffled subsurface flow and integrated surface flow-floating treatment wetlands. J. Environ. Sci. 2014, 26, 726–736. [Google Scholar] [CrossRef]
  66. Feijoó, C.; Giorgi, A.; Ferreiro, N. Phosphate uptake in a macrophyte-rich Pampean stream. Limnologica 2011, 41, 285–289. [Google Scholar] [CrossRef] [Green Version]
  67. Gao, J.; Xiong, Z.; Zhang, J.; Zhang, W.; Obono Mba, F. Phosphorus removal from water of eutrophic Lake Donghu by five submerged macrophytes. Desalination 2009, 242, 193–204. [Google Scholar] [CrossRef]
  68. Song, M.; Li, M.; Liu, J. Uptake characteristics and kinetics of inorganic and organic phosphorus by Ceratophyllum demersum. Water Air Soil Pollut. 2017, 228, 407. [Google Scholar] [CrossRef]
  69. Güsewell, S.; Koerselman, W. Variation in nitrogen and phosphorus concentrations of wetland plants. Perspect. Plant Ecol. Evol. Syst. 2002, 5, 37–61. [Google Scholar] [CrossRef]
  70. Jesus, J.M.; Danko, A.S.; Fiúza, A.; Borges, M.-T. Effect of plants in constructed wetlands for organic carbon and nutrient removal: A review of experimental factors contributing to higher impact and suggestions for future guidelines. Environ. Sci. Pollut. Res. Int. 2018, 25, 4149–4164. [Google Scholar] [CrossRef]
  71. Sillanpää, M. Natural Organic Matter in Water: Characterization and Treatment Methods; Elsevier: Amsterdam, The Netherlands, 2015. [Google Scholar]
  72. Osborne, T.Z.; Inglett, P.W.; Reddy, K.R. The use of senescent plant biomass to investigate relationships between potential particulate and dissolved organic matter in a wetland ecosystem. Aquat. Bot. 2007, 86, 53–61. [Google Scholar] [CrossRef]
  73. Pellerin, B.A.; Hernes, P.J.; Saraceno, J.; Spencer, R.G.M.; Bergamaschi, B.A. Microbial degradation of plant leachate alters lignin phenols and trihalomethane precursors. J. Environ. Qual. 2010, 39, 946–954. [Google Scholar] [CrossRef]
  74. Nishimura, S.; Maie, N.; Baba, M.; Sudo, T.; Sugiura, T.; Shima, E. Changes in the quality of chromophoric dissolved organic matter leached from senescent leaf litter during the early decomposition. J. Environ. Qual. 2012, 41, 823–833. [Google Scholar] [CrossRef]
  75. Yuan, D.; Zhao, Y.; Guo, X.; Zhai, L.; Wang, X.; Wang, J.; Cui, Y.; He, L.; Yan, C.; Kou, Y. Impact of hydrophyte decomposition on the changes and characteristics of dissolved organic matter in lake water. Ecol. Indic. 2020, 116, 106482. [Google Scholar] [CrossRef]
  76. Cuassolo, F.; Bastidas Navarro, M.; Balseiro, E.; Modenutti, B. Leachates and elemental ratios of macrophytes and benthic algae of an Andean high altitude wetland. J. Limnol. 2011, 70, 168. [Google Scholar] [CrossRef]
  77. Cuassolo, F.; Navarro, M.B.; Balseiro, E.; Modenutti, B. Effect of light on particulate and dissolved organic matter production of native and exotic macrophyte species in Patagonia. Hydrobiologia 2016, 766, 29–42. [Google Scholar] [CrossRef]
  78. Qu, X.; Xie, L.; Lin, Y.; Bai, Y.; Zhu, Y.; Xie, F.; Giesy, J.P.; Wu, F. Quantitative and qualitative characteristics of dissolved organic matter from eight dominant aquatic macrophytes in Lake Dianchi, China. Environ. Sci. Pollut. Res. 2013, 20, 7413–7423. [Google Scholar] [CrossRef]
  79. Coble, P. Characterization of marine and terrestrial DOM in seawater using excitation-emission matrix spectroscopy. Mar. Chem. 1996, 51, 325–346. [Google Scholar] [CrossRef]
  80. Hur, J.; Hwang, S.-J.; Shin, J.-K. Using synchronous fluorescence technique as a water quality monitoring tool for an urban river. Water Air Soil Pollut. 2008, 191, 231–243. [Google Scholar] [CrossRef]
  81. Chupakova, A.A.; Chupakov, A.V.; Neverova, N.V.; Shirokova, L.S.; Pokrovsky, O.S. Photodegradation of river dissolved organic matter and trace metals in the largest European Arctic estuary. Sci. Total Environ. 2018, 622–623, 1343–1352. [Google Scholar] [CrossRef]
  82. Palma, D.; Sleiman, M.; Voldoire, O.; Beauger, A.; Parlanti, E.; Richard, C. Study of the dissolved organic matter (DOM) of the Auzon cut-off meander (Allier River, France) by spectral and photoreactivity approaches. Environ. Sci. Pollut. Res. 2020, 27, 26385–26394. [Google Scholar] [CrossRef]
  83. Sardana, A.; Cottrell, B.; Soulsby, D.; Aziz, T.N. Dissolved organic matter processing and photoreactivity in a wastewater treatment constructed wetland. Sci. Total Environ. 2019, 648, 923–934. [Google Scholar] [CrossRef]
  84. Hur, J.; Jung, K.-Y.; Jung, Y.M. Characterization of spectral responses of humic substances upon UV irradiation using two-dimensional correlation spectroscopy. Water Res. 2011, 45, 2965–2974. [Google Scholar] [CrossRef]
  85. Clark, C.D.; De Bruyn, W.J.; Brahm, B.; Aiona, P. Optical properties of chromophoric dissolved organic matter (CDOM) and dissolved organic carbon (DOC) levels in constructed water treatment wetland systems in southern California, USA. Chemosphere 2020, 247, 125906. [Google Scholar] [CrossRef]
  86. Yao, Y.; Li, Y.; Guo, X.; Huang, T.; Gao, P.; Zhang, Y.; Yuan, F. Changes and characteristics of dissolved organic matter in a constructed wetland system using fluorescence spectroscopy. Environ. Sci. Pollut. Res. 2016, 23, 12237–12245. [Google Scholar] [CrossRef]
  87. Liu, S.; Zhu, Y.; Liu, L.; He, Z.; Giesy, J.P.; Bai, Y.; Sun, F.; Wu, F. Cation-induced coagulation of aquatic plant-derived dissolved organic matter: Investigation by EEM-PARAFAC and FT-IR spectroscopy. Environ. Pollut. 2018, 234, 726–734. [Google Scholar] [CrossRef]
  88. Fu, X.; Du, H.; Xu, H. Comparison in UV-induced photodegradation properties of dissolved organic matters with different origins. Chemosphere 2021, 280, 130633. [Google Scholar] [CrossRef]
Figure 1. The surface flow constructed wetland. Modified from Google Earth (Google Inc., 2017), (image date: 28 June 2018). The stars correspond to the sampling points.
Water 14 01474 g001
Figure 2. Excess greenness over the basins and annual number of degree-days during the period of study.
Water 14 01474 g002
Figure 3. Variations in (a) DOC, (b) o-Ps, (c) TN, (d) ammonium and (e) nitrates according to the seasons for the inlet and the three outlets (B1out, B2out and B3out). * indicates a significant difference (Student’s t-test) between the seasons (* p < 0.05, ** p < 0.01). The sample size (n) varies seasonally for the inlet (winter: n (8); spring: n (11); summer: n (22); autumn: n (17)) and outlets (winter: n (3); spring: n (4); summer: (8); autumn: n (7)).
Water 14 01474 g003
Figure 4. Examples of UV-vis spectra collected from 18 June 2020 samples.
Water 14 01474 g004
Figure 5. Spectra collected during lab-scale photolysis experiment A with an enlargement of the zone used for the calculation of SUVA254 and the spectral slope S275–295.
Water 14 01474 g005
Figure 6. Synchronous fluorescence spectrum for B1in (sampling date: 16 June 2020).
Water 14 01474 g006
Figure 7. Synchronous fluorescence spectra in winter (5 February 2020) and summer (16 June 2020) at the inlet and outlet of B1.
Water 14 01474 g007
Figure 8. Synchronous fluorescence spectra of protein-like substances and humic-like substances (a) and evolution of the protein-like and humic-like SF50 intensities during the photolysis experiment A (run in triplicate) (b).
Water 14 01474 g008
Figure 9. Synchronous fluorescence spectra during the photolysis experiments B (5 February 2020) and C (16 June 2020).
Water 14 01474 g009
Figure 10. Comparison of protein-like and humic-like SF50 intensities at the outlets versus the inlets of the three basins as a function of the season.
Water 14 01474 g010
Table 1. Average air temperature under shelter (°C) and number of sunlight hours (h·month−1) for the different seasons during the period of study. Values to the right of (±) are the standard deviations.
SeasonMonthsAverage Air
Temperature (°C)
Number of Sunlight Hours (h·month−1)Average Water Temperature (°C)
(Min–Max)
WinterDecember, January,
February
5.6 ± 1.479 ± 376.5 ± 2.5
(0.2–14.1)
SpringMarch, April, May9.9 ± 2.4216 ± 5314.5 ± 4.5
(3.6–25.8)
SummerJune, July, August18.7 ± 1.3232 ± 3820.5 ± 2.0
(14.7–28.2)
AutumnSeptember, October,
November
11.7 ± 4.3132 ± 6012.5 ± 3.6
(3.6–22.3)
Table 2. Water quality at the inlet and the three outlets (B1out, B2out and B3out). Values to the right of (±) are the standard deviations. Values with different superscript letters (a, b) within each parameter are significantly different (p < 0.05) (n = 21).
pHConductivity
(µS·cm−1)
DOC
(mgC·L−1)
TN
(mgN·L−1)
N-NH4
(mgN·L−1)
N-NO3
(mgN·L−1)
o-Ps
(mgPO4·L−1)
Inlet7.8 ± 0.2 a928 ± 117 a7.3 ± 0.8 a2.3 ± 0.6 a0.9 ± 0.4 a0.9 ± 0.8 a1.4 ± 0.4 a
B1out7.9 ± 0.3 a849 ± 114 a8.1 ± 1.5 a1.6 ± 0.7 b0.7 ± 0.8 a0.3 ± 0.4 b1.2 ± 0.6 a
B2out7.9 ± 0.3 a854 ± 109 a7.9 ± 1.4 a1.2 ± 0.4 b0.4 ± 0.3 b0.3 ± 0.4 b1.4 ± 0.6 a
B3out7.9 ± 0.3 a832 ± 101 a8.5 ± 1.8 a1.1 ± 0.3 b0.3 ± 0.2 b0.2 ± 0.3 b1.4 ± 0.8 a
Table 3. UV-visible indices (SUVA254, S1 and E2/E3) of the inlet and the three outlets (B1out, B2out and B3out) (n = 21). Values to the right of (±) are the standard deviations. Values with different superscript letters (a) within each parameter are significantly different (p < 0.05).
SUVA254
(L·mgC−1·nm−1)
S275–295E2/E3
Inlet2.1 ± 0.2 a0.015 ± 0.001 a5.1 ± 0.06 a
B1out2.2 ± 0.3 a0.016 ± 0.001 a5.1 ± 0.07 a
B2out2.1 ± 0.3 a0.015 ± 0.005 a5.3 ± 0.06 a
B3out2.2 ± 0.2 a0.016 ± 0.001 a5.3 ± 0.05 a
Publisher’s Note: MDPI stays neutral with regard to jurisdictional claims in published maps and institutional affiliations.