Article

Ecological and Health Risk Assessment of Heavy Metals in Soils from Recycled Lead Smelting Sites

1
College of Geosciences and Engineering, North China University of Water Resources and Electric Power, Zhengzhou 450046, China
2
Collaborative Innovation Center for Efficient Utilization of Water Resources, Zhengzhou 450046, China
*
Author to whom correspondence should be addressed.
Water 2022, 14(9), 1445; https://doi.org/10.3390/w14091445
Submission received: 28 March 2022 / Revised: 22 April 2022 / Accepted: 27 April 2022 / Published: 30 April 2022

Abstract

:
In this study, 258 soil samples were collected to determine the total content and each speciation fraction of chromium (Cr), manganese (Mn), copper (Cu), zinc (Zn), cadmium (Cd), and lead (Pb) in the soil by inductively coupled plasma mass spectrometry (ICP-MS), and their potential ecological and human health risks were assessed using the geo-accumulation index (Igeo), risk assessment code (RAC), and health risk assessment. The results showed that: (1) The mean concentrations of heavy metals (HMs) (mg/kg) in the surface soil of the site were in the order of Pb (1921.77) > Mn (598.21) > Zn (162.29) > Cr (84.65) > Cu (15.16) > Cd (1.8), with the mean values of Cd and Pb exceeding the local background values by 164 and 725 times. (2) In the vertical direction, Cr, Mn, and Pb have no tendency to migrate downward; Cd and Zn demonstrate a strong ability to migrate. (3) The bioavailability of Cd is the highest in the surface soil, followed by Mn and Pb; in the soil below a depth of 0.5 m, the prevalent form of HMs is its residual state (F4). (4) The degree of Igeo pollution of each HMs is: Pb > Cd > Zn > Cr = Mn = Cu, where Pb pollutes the environment to an extremely contaminated level and Cd causes heavy pollution thereof. According to the RAC results, Cd in the surface soil poses a high risk to the environment, and Pb and Mn pose a moderate risk; meanwhile, with the increase of depth, the risk posed by Cd and Mn to the ecosystem shows a tendency to increase. Health risk evaluation indicated that respiratory intake was the main pathway affecting the carcinogenic risk (CR) and hazard quotient (HQ) of HMs, where Pb and Cr were the main hazard factors for non-CR and Cr was the main carcinogenic factor. This study can provide scientific guidance and technical support for soil risk control or remediation of HM-contaminated sites.

1. Introduction

Recently, with the continuous increases in urbanization, many industrial enterprises have gradually moved out of the city, ceased production, or closed. These remaining plots are redeveloped and utilized as urban construction land. The activities of these enterprises have resulted in the production and discharge of large quantities of HMs. However, it is well known that unregulated waste discharge and disposal in industrial areas results in the release of large amounts of HMs into the soil and groundwater [1,2,3]. Soil and groundwater continue to be contaminated in legacy sites of certain heavily contaminated enterprises [4,5]. HM contamination at these sites has received widespread attention due to the increased level of environmental protection [6,7]. One study showed that emissions from a European lead smelter during the production process caused very serious contamination of the surrounding soil mainly with contaminants Cd, Pb, and Zn, but also small amounts of arsenic (As), mercury (Hg), antimony (Sb), and indium (In) [8,9]. In China, a study by Wang et al. also showed that the accumulation of Pb in the plant was closely related to smelting activities [10]. HMs in soils are bio-toxic, persistent, and bio-accumulative, and exist in the environment for a long time. They accumulate through the food chain and eventually collect in the human body, endangering people’s health [11,12]. Therefore, an ecological and human health risk assessment of the site is required before redevelopment and reuse.
Biological effectiveness is usually defined as the extent to which HMs in the soil are taken up and used by plants [13]. Most of the early studies on soil contamination focused on the analysis of total HMs, but soil total HMs in most cases can only provide limited information on their biological effectiveness. In contrast, the risk of HMs to human health does not only depend on their content but is determined to a greater extent by their fractionation in the soil [14,15]. As defined by the International Association of Applied Chemistry, speciation analysis can expound how HMs are combined with soil components and in what form they are present [16]. The continuous extraction method is to reflect the mobility and bio-effectiveness of HMs in soil by using different extractants to simulate the selection of different environmental conditions for different species of HMs and extracting the HMs in different binding forms in the sample in a step-by-step manner, so as to provide a more realistic evaluation of the environmental impact produced by HMs. A simplified three-step sequential extraction method (BCR) and a reference standard for quality control (CRM 601) were proposed and established by the European Community Bureau of Reference (ECBR) in 1987 [17], which classifies metallic elements into four forms: acid extractable, reducible, oxidizable, and residual forms.
Ecological and health risk assessments are appropriate tools used to evaluate the potential adverse effects of different pollutants on the environment and human health. According to Karimian’s analysis of HMs in Tehran landfill soils, concentrations of Pb, Cu, Zn, Cr, and Ni in soils are mainly influenced by anthropogenic activities; in residential areas, the incremental lifetime cancer risk in adults is higher than in children [18]. Xing et al. used the potential ecological risk index to assess the Beijing Mentougou mining area, where the highest potential risk index for Hg was 668.53 [19]. Ohiagu et al. utilized Contamination Factor (CF), Pollution Load Index (PLI), Geo-accumulation Index (Igeo), Enrichment Factor (EF), Potential Ecological Risk Factor (PERF), and Potential Ecological Risk Index (PERI) to estimate the ecological risk of HMs in a domestic waste dump at Onne seaport in Rivers State, Nigeria and found that the area is heavily contaminated with Cd [20]. Ma et al. assessed the concentration of HMs in street dust in relocated industrial areas in Tiexi District, Shenyang City, China, using the health risk evaluation method proposed by the U.S. National Environmental Protection Agency, and discovered severe HM contamination in street dust in some areas, but it did not present a carcinogenic risk (CR) [21]. At contaminated industrial sites, the sources of HM contamination are usually associated with industry-related production [22,23,24]. Therefore, understanding the impact of production activities on ecological and health risks cannot only control pollution at the source, but also provide reference significance for environmental remediation of legacy sites.
The present study explored the total concentration and speciation of Cr, Mn, Cu, Zn, Cd, and Pb in soil in chemical form at an abandoned recycled lead site in Zhoukou, Henan Province, China. The contamination of HMs in soils of the study area was evaluated by using the Igeo [25]. Risk assessment code (RAC) was employed to assess the level of risk posed by the release of HMs into the environment [26]. The health risk of HMs to nearby residents was quantified using the model parameters specified in the Technical Guidelines for Risk Assessment of Soil Contamination of Land for Construction (HJ 25.3–2019). The purpose of this study is, firstly, to reveal the distribution characteristics of HMs in the soil of the site; secondly, to ascertain its contamination level and potential release risk. This research may provide a scientific basis for the protection of the soil environment of the legacy contaminated site as well as the control and remediation of HM pollution, which has important practical significance for the protection of urban ecology, sustainable development, and the health of residents.

2. Materials and Methods
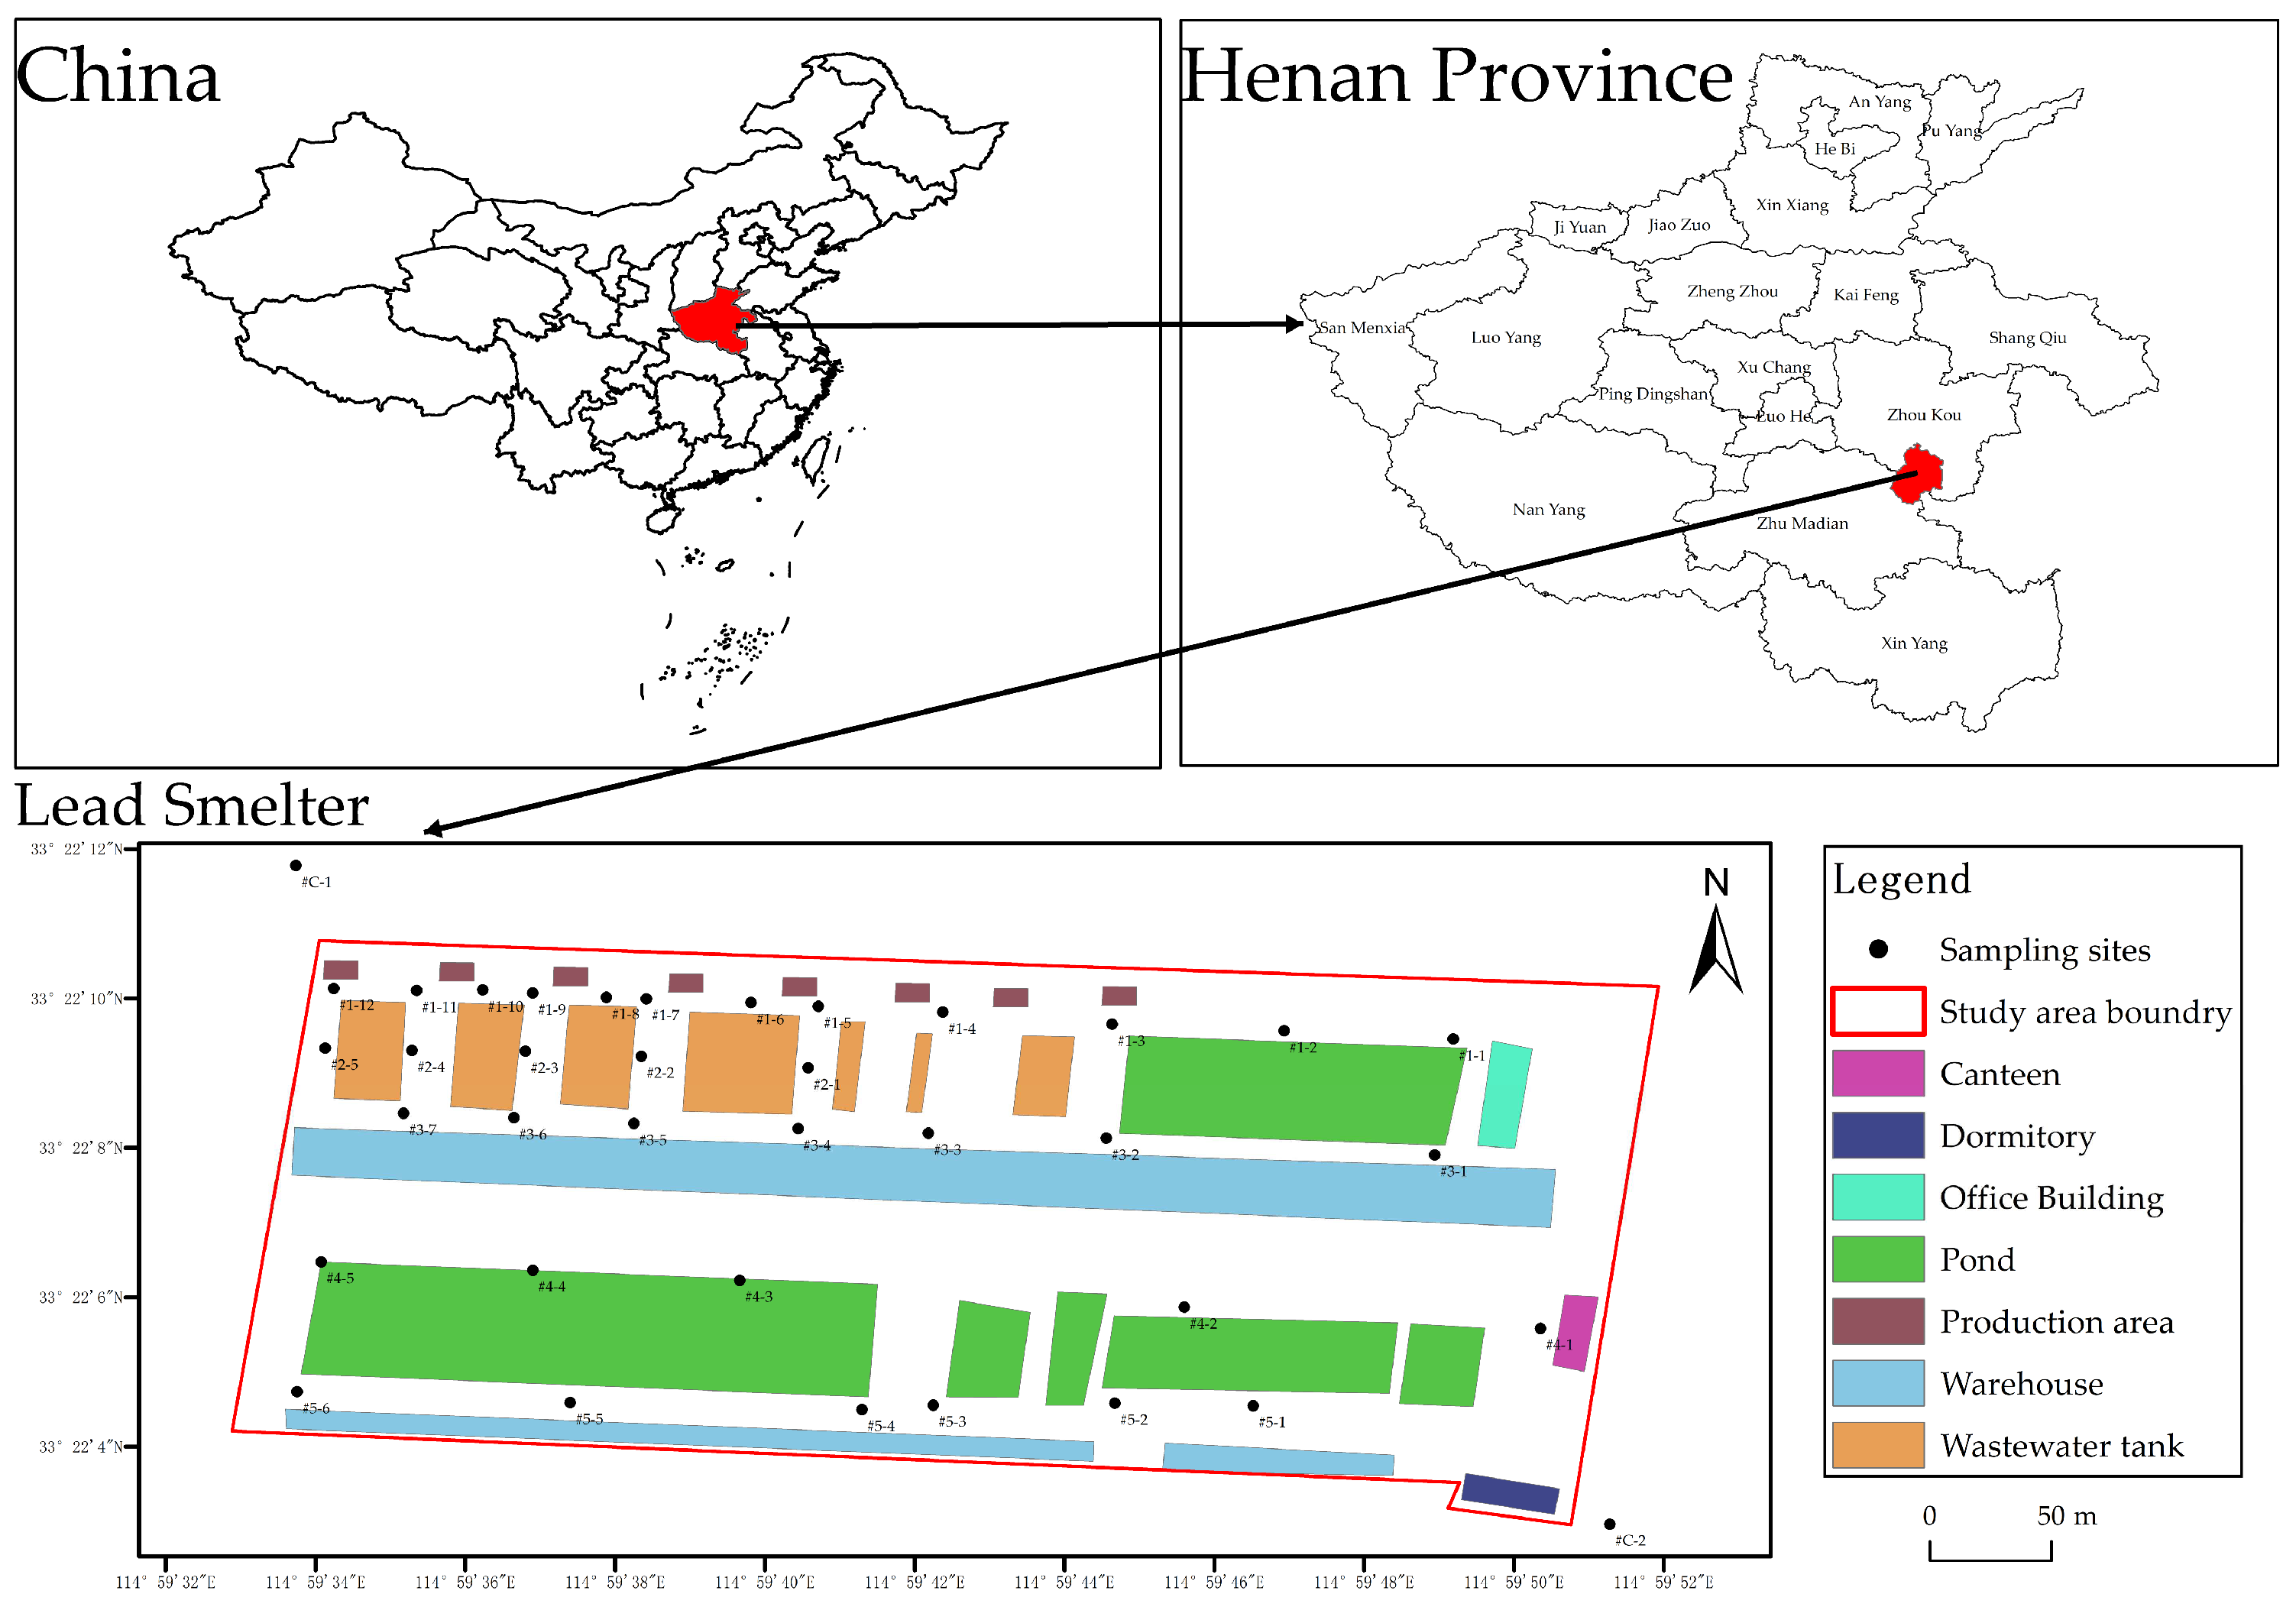
2.1. Study Area

The study site, located in Zhoukou, Henan Province, China (114°59′ E and 33°22′ N), is an abandoned recycled lead smelter covering an area of approximately 96,700 m2. The study area has a warm-temperate monsoonal continental climate with four distinct seasons. The average summer temperature is 26.9 °C and the average winter temperature is 1.9 °C. Due to the influence of monsoon circulation, southeast monsoon prevails in summer with an annual average wind speed of 2.21 m/s. The surface soil is mainly tidal, and there are multiple layers of powdered clay in the subsoil layer. Figure 1 displays the geographical location of the plant in Henan Province and all sampling points. The plant, which used a wet process for pretreatment and then pyrometallurgical production of recycled lead from 2013–2015, has ceased operations. The production area is located in the northwest part of the site, mainly smelting old batteries. During the process of production and raw material storage, many exhaust gases and wastewater were generated. Therefore, more sampling points were set up in the production area.

2.2. Sample Collection and Pretreatment

According to the Technical Guidelines for Monitoring during Risk Control and Remediation of Soil Contamination of Land for Construction (HJ 25.2–2019), 37 sampling points were deployed and a total of 258 soil samples were collected in the study area to evaluate the spatial distribution of HMs in October 2021. Each sample was collected at depths (0–200 mm for the surface layer, 200–500 mm for the subsurface layer, and 1 m for the deep sample collection interval) and marked according to depth (Figure 1). The entire process from sample receipt to data reporting in the laboratory implements the requirements of the Code for the Accreditation Criteria for the Competence of Testing and Calibration Laboratories (CNAL/AC01: 2005) for sample preservation and quality assurance. The internal quality assurance and control measures of the laboratory, such as setting up blank samples, parallel samples and matrix spiking during analysis, sample retention time and temperature, complied with the specified requirements.
Each of the 258 soil samples was collected with a wooden shovel, placed in polyethylene self-sealing bags, and delivered to the laboratory for storage under refrigeration (0 to −4 °C) within 24 h. The soil samples were freeze-dried and homogenized by grinding, using an agate mortar and pestle until the material could pass through a 200-mesh nylon sieve at room temperature, and set aside in self-sealing polyethylene bags.

2.3. Laboratory Analysis

2.3.1. Total HM Analysis

Each pre-treated sample was accurately weighed to 0.2 ± 0.0001 g and poured into the PTFE digestion tank. The specimen was wetted with a small amount of deionized water, then 6 mL of nitric acid, 2 mL of hydrofluoric acid, and 2 mL of hydrochloric acid were added in sequence. The specimen was covered with a lid and put it into the microwave digestion apparatus, which was then started. When the apparatus stopped working, the liquid inside was cooled to room temperature and the specimen was transferred to a PTFE crucible on a hotplate heated to 120 °C to drive off the excess acid, then heating was stopped until the liquid evaporated to a viscous consistency. After cooling to room temperature, measurements were made after fixing the volume with 1% nitric acid into a 50 mL volumetric flask.

2.3.2. HM Speciation Analysis

In this study, the HMs in the samples could be divided into four fractions using a modified BCR continuous extraction method. Each sample was weighed to 0.8 ± 0.0001 g into a polyethylene centrifuge tube as shown in Table 1. First, 32 mL of 0.11 M acetic acid was added and shaken for 16 h to extract the acid extractable state (F1). To the residue obtained in the previous step, 32 mL of 0.5 M hydroxylamine hydrochloride at pH 1.5, was added and shaken for 16 h to extract the reducible state (F2). Eight milliliters of 8.8 M hydrogen peroxide at pH 2, was added to the residue of the previous step and the specimen was shaken intermittently for 1 h. The specimen was then ablated at high temperature in a water bath at 85 °C for 1 h. The lid was opened, and evaporation continued until 1–2 mL of liquid remained in the centrifuge tube; another 8 mL of 8.8 M hydrogen peroxide at pH 2 was added, and the specimen was ablated in a water bath at 85 °C for one more hour, then the lid was opened until 2–3 mL of liquid remained and was cooled to room temperature. Then, 40 mL of 1 M ammonium acetate at pH 2 was added and shaken for 16 h to extract the oxidizable state (F3). The residue from the previous step was freeze-dried and ground, passed through a 200-mesh nylon sieve, and weighed to 0.2 ± 0.0001 g into a PTFE digestion tank, which was used to determine the residual state (F4), in the same way as was used for the total HM analysis. In the above procedure, if not otherwise specified, shaking was performed end-over-end at room temperature with 30 rpm; the extraction process was performed by centrifuging at 3000 rpm for 20 min, and the supernatant was passed through a 0.22 μm aqueous filter membrane and stored under refrigeration. To the residue, 15 mL of deionized water was added, shaken for 15 min, and the supernatant was poured off after centrifugation, and the washed residue was used for the next experiment. All glassware, polyethylene centrifuge tubes and PTFE digestion tanks used in the experiments have been soaked in 20% nitric acid overnight in advance and then rinsed with deionized water and dried.
Finally, Cr, Mn, Cu, Zn, Cd, and Pb in soil were studied by inductively coupled plasma mass spectrometry (ICP-MS, Agilent 7800, Santa Clara, CA, USA).

2.3.3. Quality Control

The reagents used in the experiments were of analytical grade and deionized water (PIRELAB flex, ELGA) with a resistivity of 18.2 MΩ.
During the digestion and ICP-MS tests, 10% of the samples were randomly selected as parallel replicate experiments three times, and the quality of the results was checked using blanks and national soil standards (GBW 07401). To ensure the accuracy of the results, the instrument was cleaned and checked by testing a deionized water sample after every 12 samples tested when using ICP-MS. Parallel samples, reagent blanks and national soil standards (GBW 07436) were also used for quality control during the BCR sequential extraction. The recoveries of each HM ranged from 85% to 115% with standard deviations of less than 5% between parallel samples.

2.4. Soil Risk Assessment

2.4.1. Geo-Accumulation Index

The geo-accumulation index was proposed by Muller (working at the University of Heidelberg, Germany) [25], to reveal the relationship between total HMs and environmental background values and to evaluate the degree of accumulation of HMs in soil, calculated via Equation (1).
I g e o = log 2 C i K × B i
where Igeo is the geo-accumulation index, Ci represents the measured concentration of HM element i (mg/kg), Bi denotes the environmental background value of the element, and the background value of soil elements in Henan Province was selected for evaluation in this study [27], and K is a constant, usually assigned the value of 1.5. Based on the Igeo results, the degree of HM pollution was classified into seven classes as shown in Table 2.

2.4.2. RAC

The RAC that was first proposed by Perrin et al. [26] was used to evaluate the ecological risk of HMs based on the ratio of the acid extractable state (F1) content to the total amount, calculated via Equation (2).
R A C = C F 1 C t o t × 100 %
where CF1 is the content of the acid extractable state (F1) and Ctot denotes the total amount of HMs. The larger the RAC index, the greater the migration capacity and release risk of HMs, and therefore the environmental risk is divided into five classes, as shown in Table 3.

2.4.3. Human Health Risk Assessment

To protect human health, protect the ecological environment, enhance supervision and management of construction land environmental protection, and regulate soil contamination of construction land, the Chinese Ministry of Ecology and Environment issued a standard [28] and developed a health risk assessment model. In this study, the volatility of all six HMs was relatively small, so that oral ingestion, dermal contact, and inhalation of soil particles were considered as the main exposure pathways. For the CR and non-CR of single HM, the mathematical expressions are given in Equations (3)–(8), where the meanings and values of various parameters are listed in Table 4.
C R o i s = O I S E R c a × C s u r × S F o
C R p i s = P I S E R c a × C s u r × S F i
C R n = C R o i s + C R p i s
H Q o i s = O I S E R n c × C s u r R f D o × S A F
H Q p i s = P I S E R n c × C s u r R f D i × S A F
H I = H Q o i s + H Q p i s
where CR and CRn represent the CR of each pathway of a single HM and the total CR of those HMs, respectively. According to HJ 25.3–2019, the acceptable CR of a single HM is CRn ≤ 10−6, while CRn ≥ 10−4 may be harmful to humans [29]. HQ and HI denote the non-carcinogenic risk hazard quotient (HQ) and the total risk HQ of each pathway for a single HM, respectively. According to the value of HQ or HI, the acceptable HQ for a single HM is HI ≤ 1.

2.5. Statistical Analysis

Sampling points were mapped using ArcGIS 10.2 and kriging interpolation was used to describe the spatial distribution of HMs in the topsoil. Data were analyzed using SPSS 22.0 (IBM Inc., New York, NY, USA) and plotted using Origin 2021 (OriginLab Inc., Northampton, MA, USA).

3. Results and Discussion

3.1. Soil Concentration of HMs

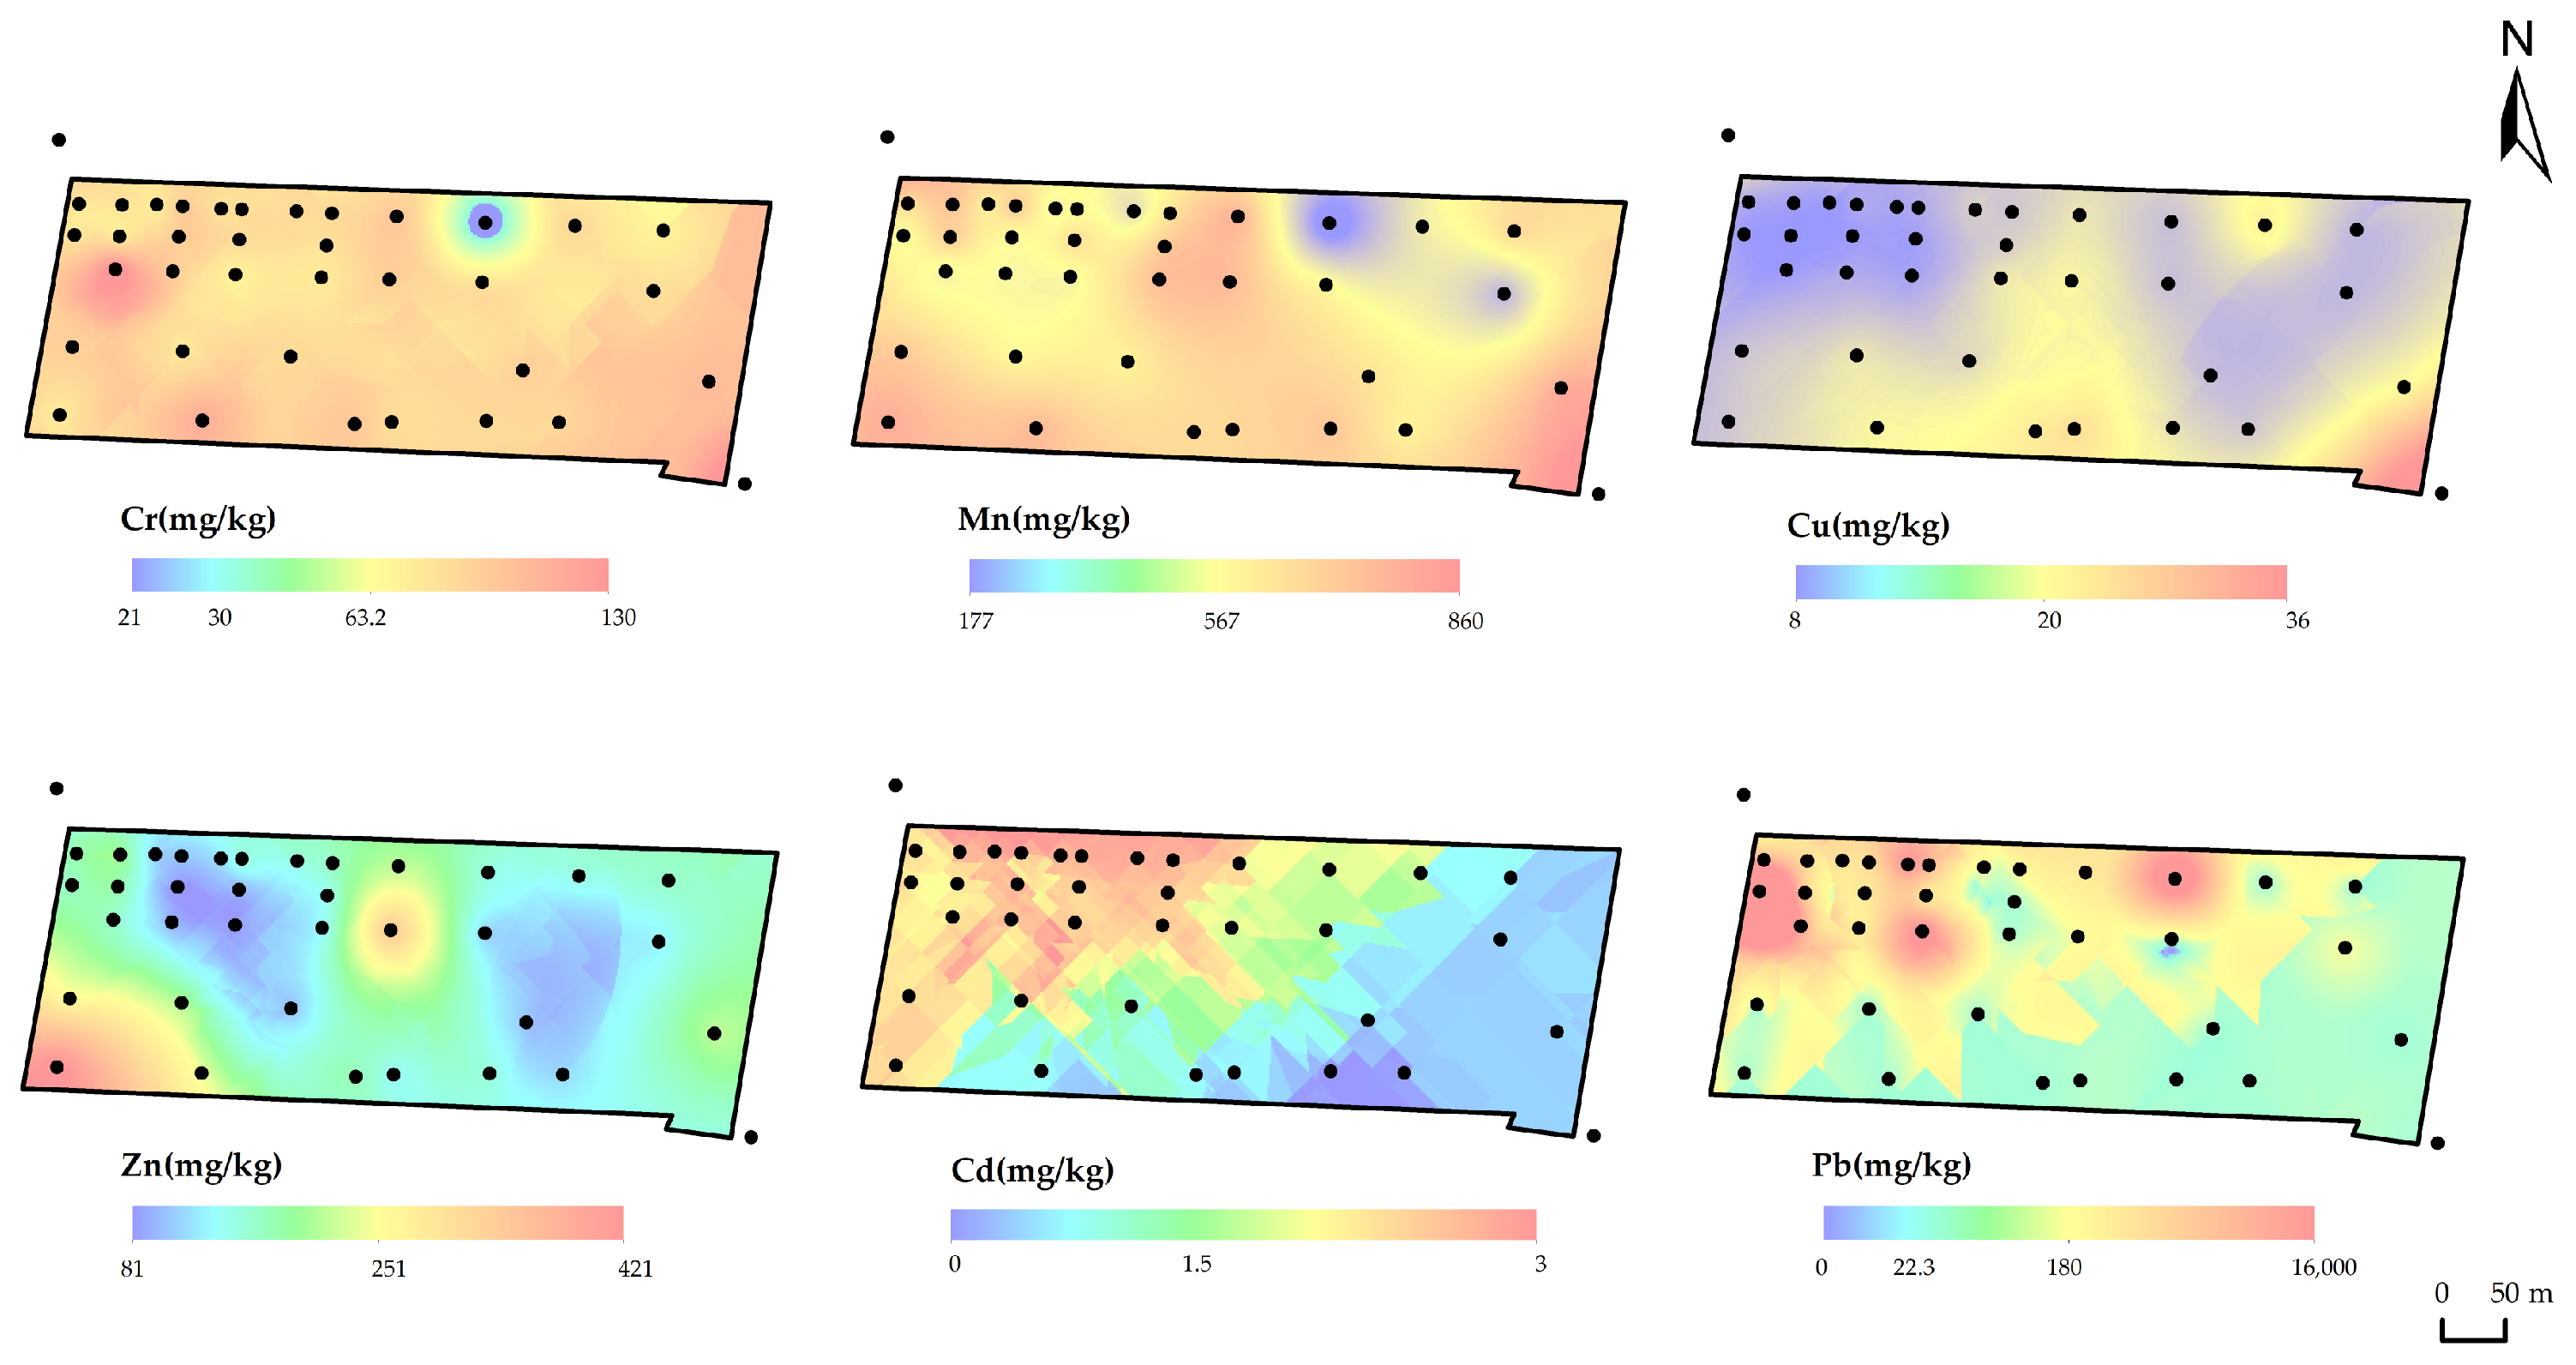
3.1.1. Characteristics of HM Distributions in Surface Soil (0–0.2 m)

The descriptive statistics of the concentrations of the six HMs in the 37 surface soil samples from the study area are displayed in Table 5. The mean concentration for Cr, Mn, Zn, Cd, and Pb were 84.65, 598.21, 162.29, 1.80, and 1921.77 mg/kg, respectively, which exceeded the local background values. The mean concentration of Cu was 15.16 mg/kg, which did not exceed the soil background value (20.00 mg/kg). Among them, Cd and Pb were greater than the local background values by 164 and 725 times (0.065 mg/kg and 22.3 mg/kg, respectively), causing a significant impact on the soil environment. This is related to the site production process [4], which is the same as the results of Luo’s study [30]. Compared with the control values in GB 36600–2018, the highest Pb exceeded the control value by 20 times. The coefficient of variation (CV) values for Cr, Mn, Zn, Cd, and Pb were 0.22, 0.25, 0.69, 0.59, 1.33, and 1.67, respectively, with Cu, Zn, Cd, and Pb characterized by strong variability (CV > 0.5). This finding indicates that the concentrations of these four HMs are highly variable and not uniformly distributed in the soils of the study area, with high spatial heterogeneity and the presence of zones of abnormally high values.
As shown in Figure 2, the spatial distribution of different HMs in the surface soil differed. The results show that Cr, Cd, Mn, and Pb were enriched in the production area in the north-western part of the study area, matching the results of Tao et al. [37] This is mainly because the process of re-cycling lead-acid batteries causes some HMs to flow into the air and soil, which eventually leads to the enrichment of HMs in the production area of the site [4].

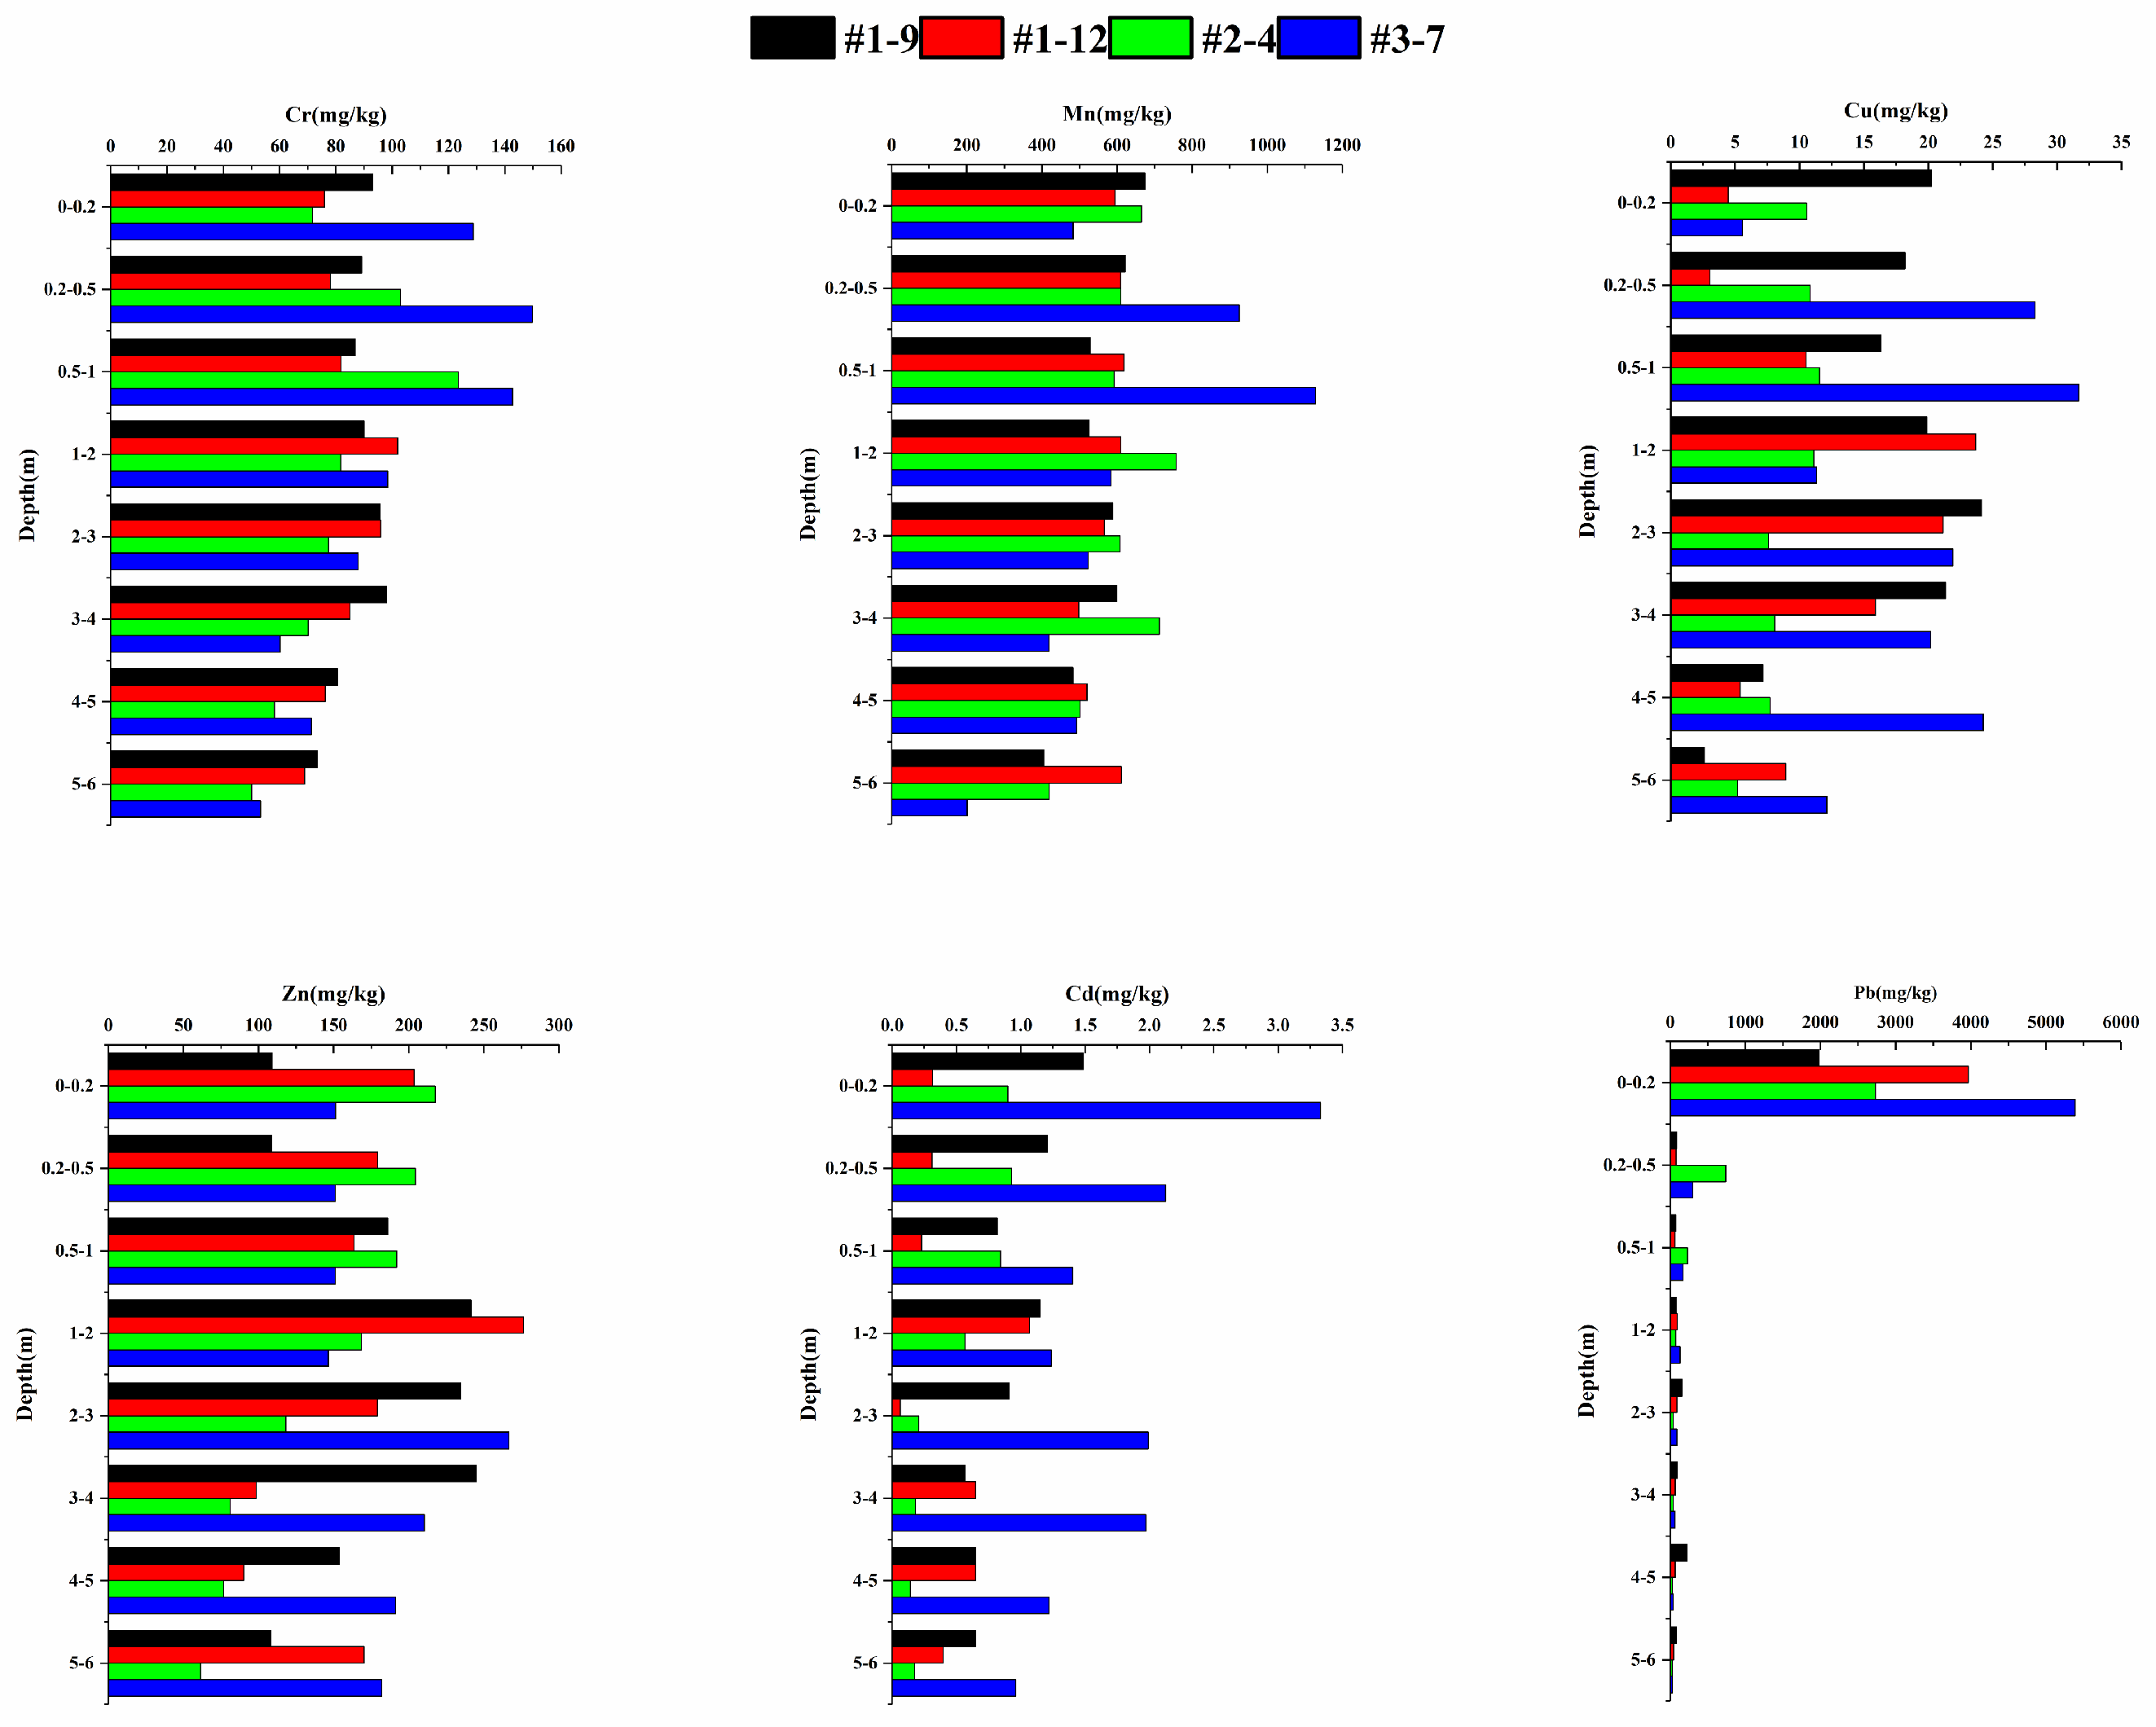
3.1.2. Vertical Distribution of HM Concentration

According to the actual stratification of the site, after counting the data of HM content in different depths of soil layers at each sampling point, a total of eight depths of 0–0.2 m, 0.2–0.5 m, 0.5–1 m, 1–2 m, 2–3 m, 3–4 m, 4–5 m, and 5–6 m were plotted on the production area points (#1–9, #1–12, #2–4, and #3–7) with high concentrations of HM fold line graph (Figure 3). From the surface to the bottom of the soil, the highest Pb concentration occurred in the range of 0–0.2 m, followed by a rapid decrease at depths below 0.2 m. This finding indicated that Pb accumulates in the surface layer of the soil during production and has no tendency to migrate downward. This also suggested that the source of Pb is anthropogenic, which is in line with the characteristics of the smelting site. From the top to the bottom of the profile, the maximum concentrations of Cr, Mn, and Cd remained in the range of 0–1 m, which decreased with increasing depth below 1 m. The concentration of Cu and Zn in the soil profile decreased slightly with fluctuations from top to bottom.
Compared with the background values of soils in Henan Province, the concentration of Cr, Mn, and Pb in the selected north-west area within 6 m were close to the local background values, but the surface HMs concentration were all higher than the background values. This finding implied that the accumulation of these HMs at the soil surface was mainly caused by anthropogenic sources during the smelting of recycled Pb, and the migration capacity decreased when the depth was greater than 0.2 m without a downward migration trend; however, the concentration of both Cd and Zn on the profile exceeded the background values, indicating that they were likely to be more influenced by the production of recycled lead [30]. The complex distribution characteristics of Cd and Zn on the profile may be related to their strong migration ability and high mobility in the soil [38]. The concentration of Cu in the surface soil was close to the background value, which has little correlation with soil depth, maintaining similar concentrations at different depths. This result indicated that the concentration of Cu may have little relationship with the production of this smelter, which is the same as the results of Rieuwerts et al. [39].

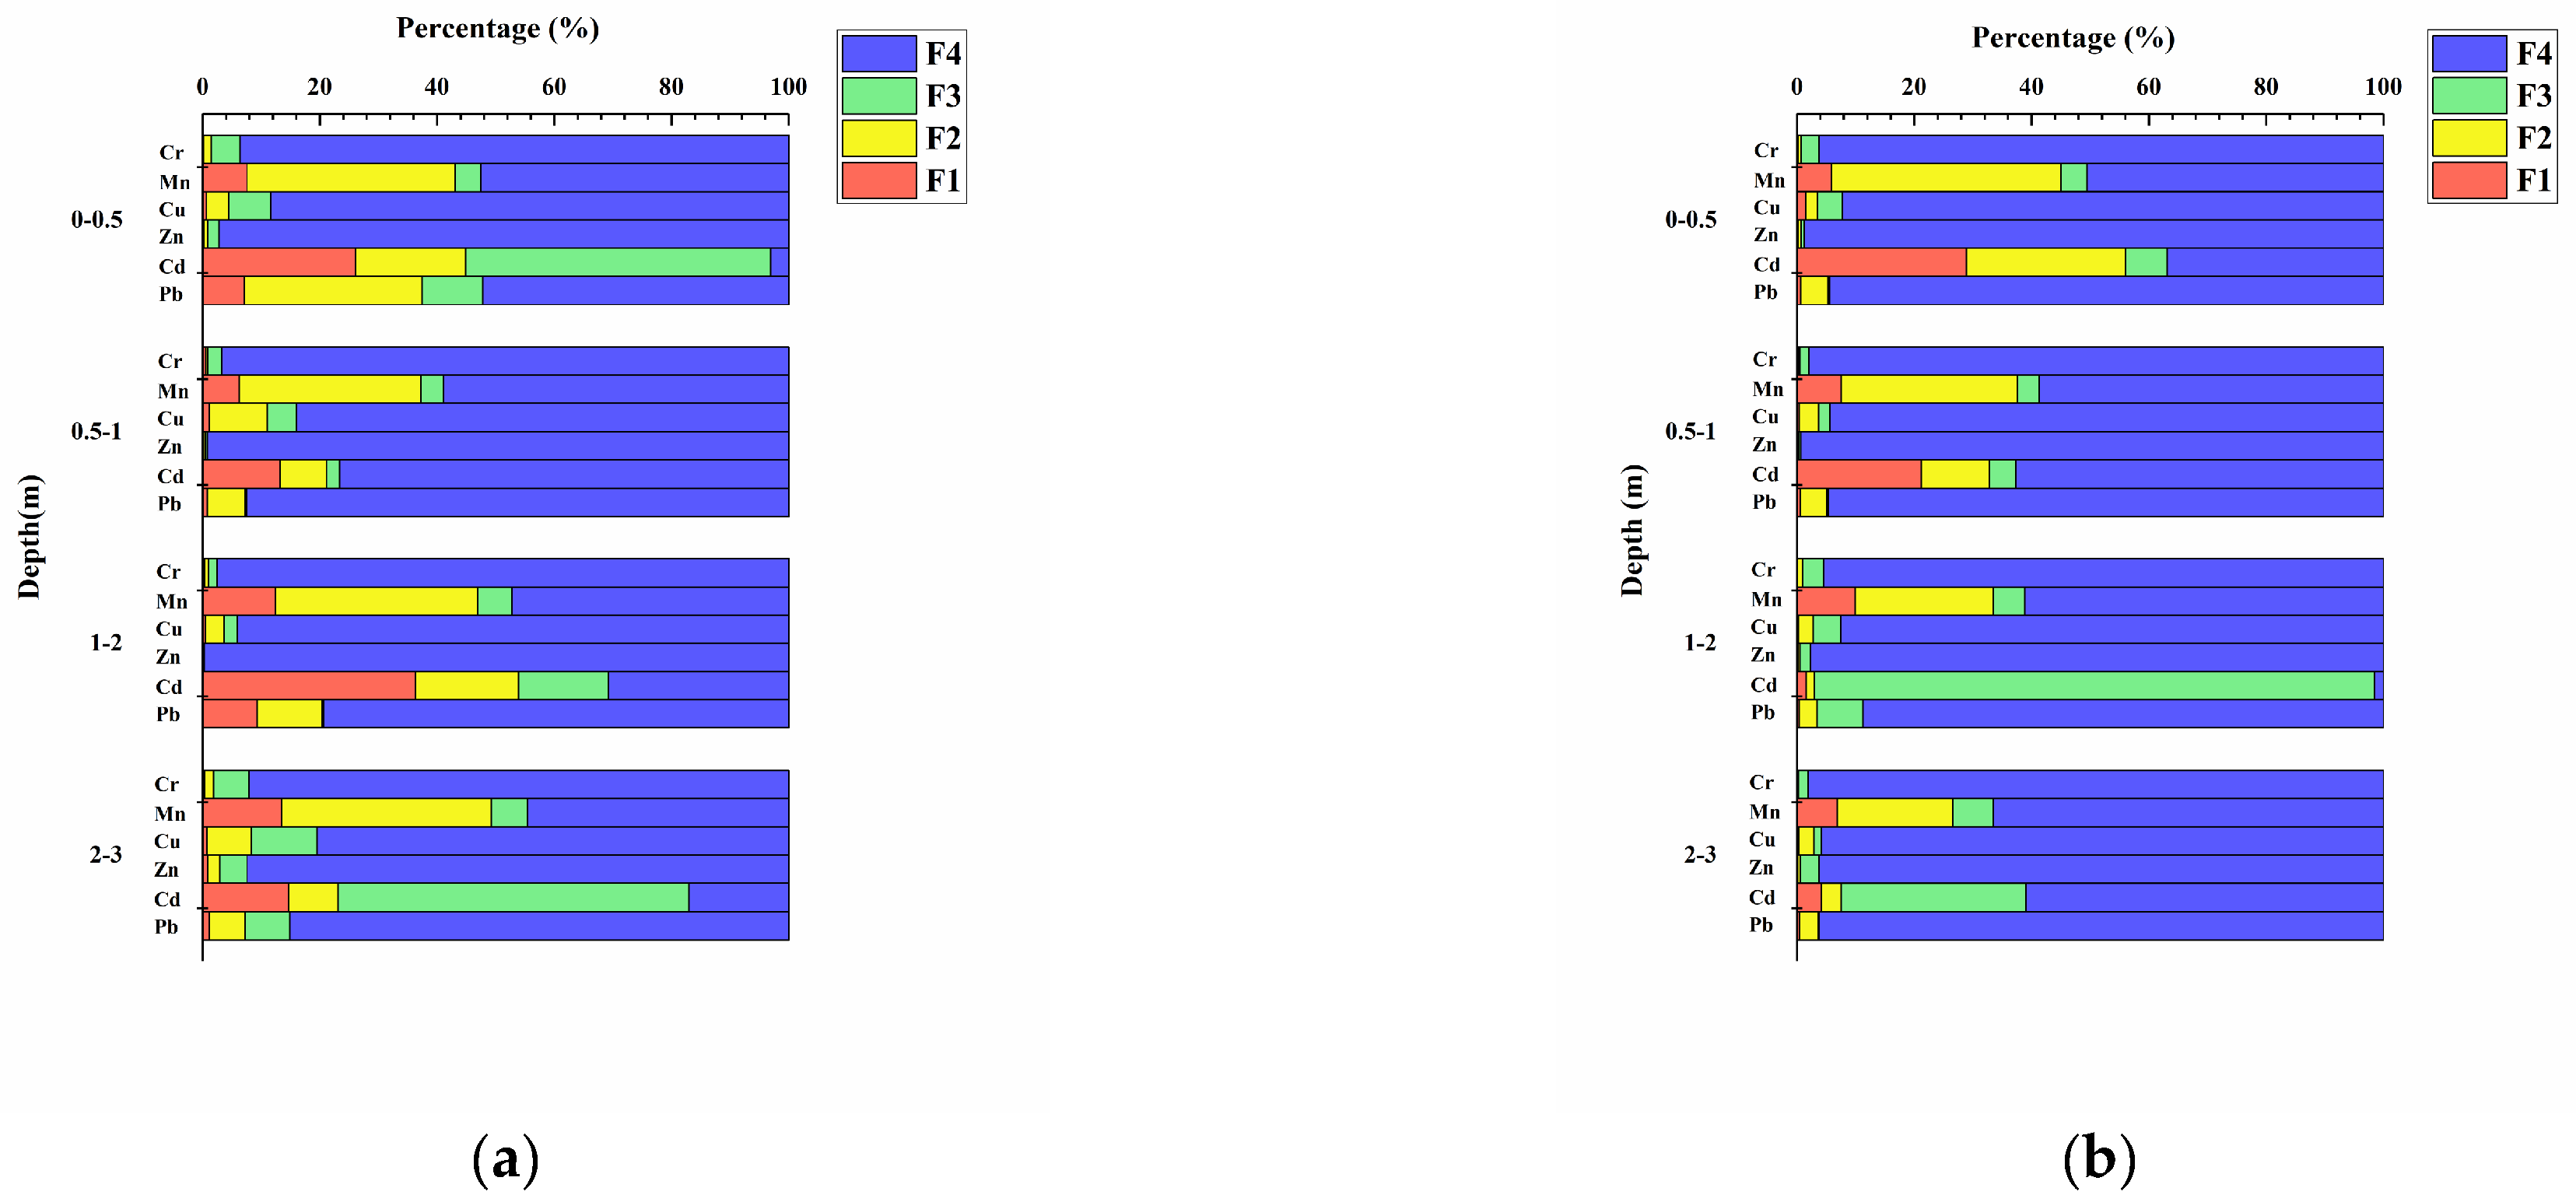
3.1.3. Speciation Analysis of HMs in Soil of the Study Area

The presence of different speciation of HMs in soils causes differences in their release capacity in different soil environments, implying that HM morphology is more convincing for environmental pollution assessment than total HM studies. Based on the previous investigation of the spatial distribution of total HMs at the site, soil samples from the more severely polluted production areas in the north-westerly direction were selected for speciation analysis tests (#1–7 to #1–12, #2–2 to #2–5, and #3–5 to #3–7), and the test results are demonstrated in Table S1. Since Pb is more affected by anthropogenic influence in some areas and other HMs exhibit a general pattern, the soil points were divided into two categories according to the trend of the percentage distribution characteristics of Pb speciation at different depths, as shown in Figure 4. The α category, represented by #1–7, was characterized by a higher proportion of non-residual fractions (F1 + F2 + F3) than F4 in the topsoil and accumulated mainly in F2, both of which indicated that Pb originated from anthropogenic manufacturing processes [40,41,42]; in the β-category, Pb was commonly found in F4, indicating that Pb in these places was not influenced much by anthropogenic factors, taking #1–12 as an example. In summary, Cr, Cu, and Zn showed similar distribution in the soil environment of the production area, with the first three forms accounting for less than 10% of the total concentration. Mn was mostly found in F2, evincing its strong binding ability to Fe and Mn oxides in the soil samples [43] Cd was mainly present in the F3 form and bound to natural and anthropogenic organic matter mainly through complexation and chelation [44]. In soils below a depth of 0.5 m, Cr, Cu, Zn, and Pb were mainly detected in the residual state (F4), suggesting that these HMs may be of natural origin in deeper soils [45].

3.2. Ecological Risk Assessment

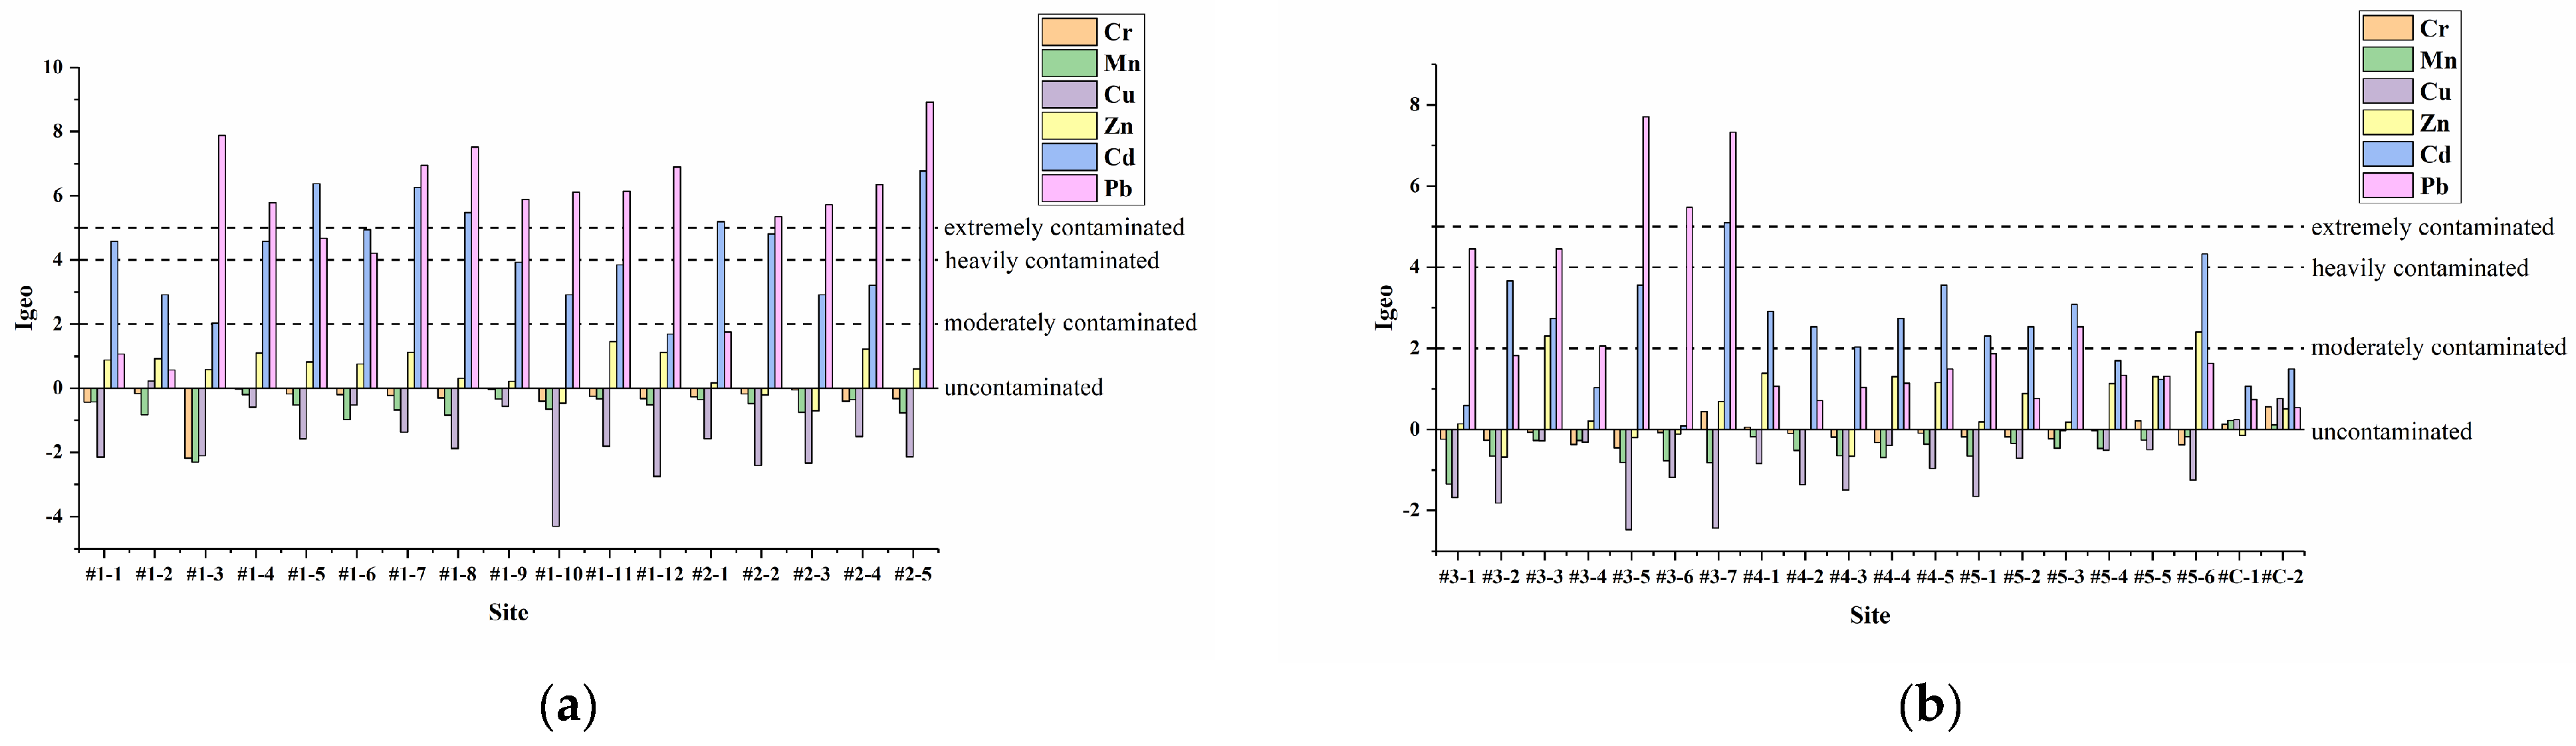
3.2.1. Geo-Accumulation Index (Igeo)
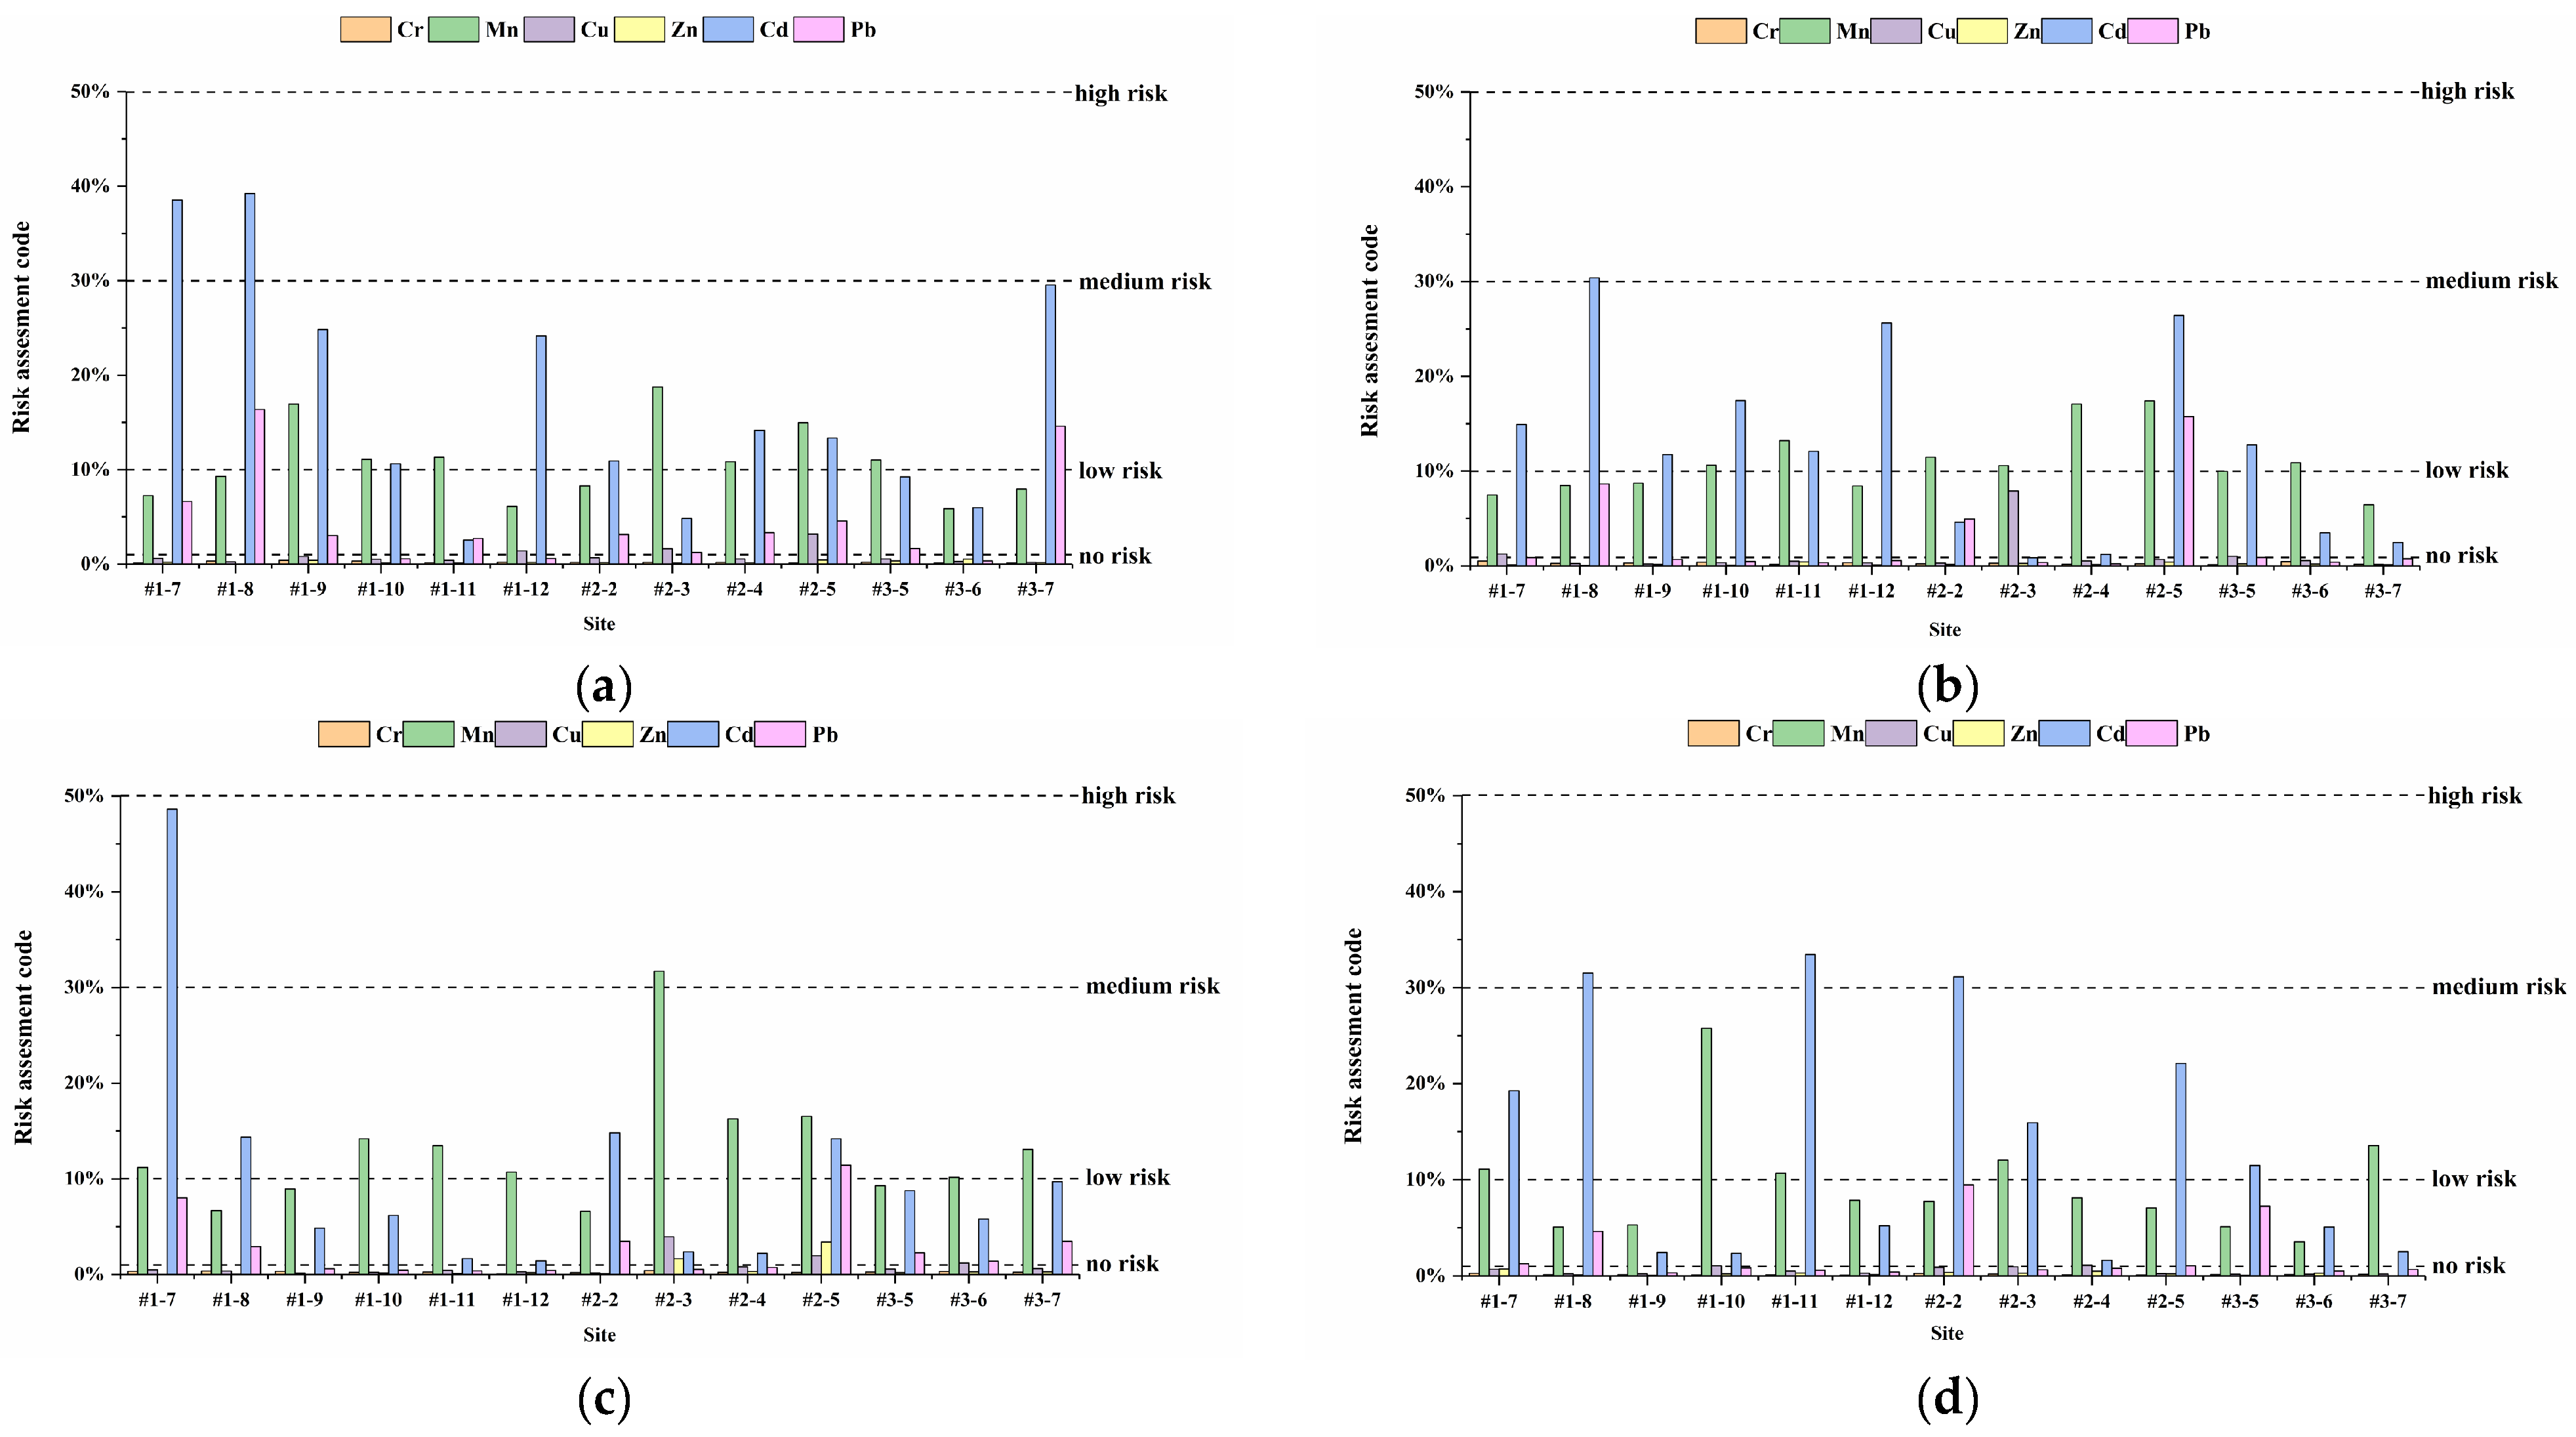
Igeo was applied to evaluate the current state of surface soil contamination in the study area, and the contamination risk levels of the six HMs were classified according to the grading criteria of the contamination levels of Igeo (Table 2); as shown in Figure 5, the values of Igeo for Cr, Mn, and Cu were all less than 0, and the values of Zn were between 0 and 2. Some 35% of the sites had values of Cd between 2 and 4, 14% between 4 and 5, and 16% greater than 5. The values of Pb in 11% were between 4–5 and the value of Pb in 46% thereof was greater than 5. The results showed that Cr, Mn, and Cu had uncontaminated; Zn had from uncontaminated to moderately contaminated; 35% of Cd ranged from moderately to heavily contaminated, 14% from heavily to extremely contaminated, and 16% was in a state of extreme contamination; 11% of Pb was heavily to extremely contaminated, and 46% was in a state of extreme pollution. The sample sites subject to extreme contamination are located in the production area of the site, which indicates that the HMs posing a risk of severe environmental contamination may be related to anthropogenic production activities.

3.2.2. RAC

Based on the results of speciation analysis, RAC was adopted to assess the risk of HMs release from the soil in the production area profile. As shown in Figure 6, the RAC values of Cr, Cu, and Zn in the topsoil were generally less than 10%, and the RAC values of Mn and Pb were within the range of 1030%, while the values of Cd exceeded 30% at a few sample points. From 0.5–1 m soil, the RAC values of HMs were all less than 30%; at 1–2 m, except for Cd in #1–7 and Mn in #2–3, the RAC values of all other sample points were less than 20%; at 2–3 m, except for Cd and Mn at some sample points, the RAC values of all other HMs were less than 10%. The results showed that Cr, Cu, and Zn in the topsoil were of negligible risk to the environment, Mn and Pb posed moderate risks, and Cd at some sample points posed a high risk. It has been shown that the particle size of soil profile gradually became smaller, and the percentage of F1 species of Cr, Cu, Zn, and Pb had positive correlation with the particle size, while Cd and Mn showed negative correlations therewith [46,47]. The release risk of Cr, Cu, Zn, and Pb gradually decreased with increasing depth, while the release risk of Cd and Mn increased at some sample sites, which might be related to the nature of soil profile in the study area.

3.3. Health Risk Assessment

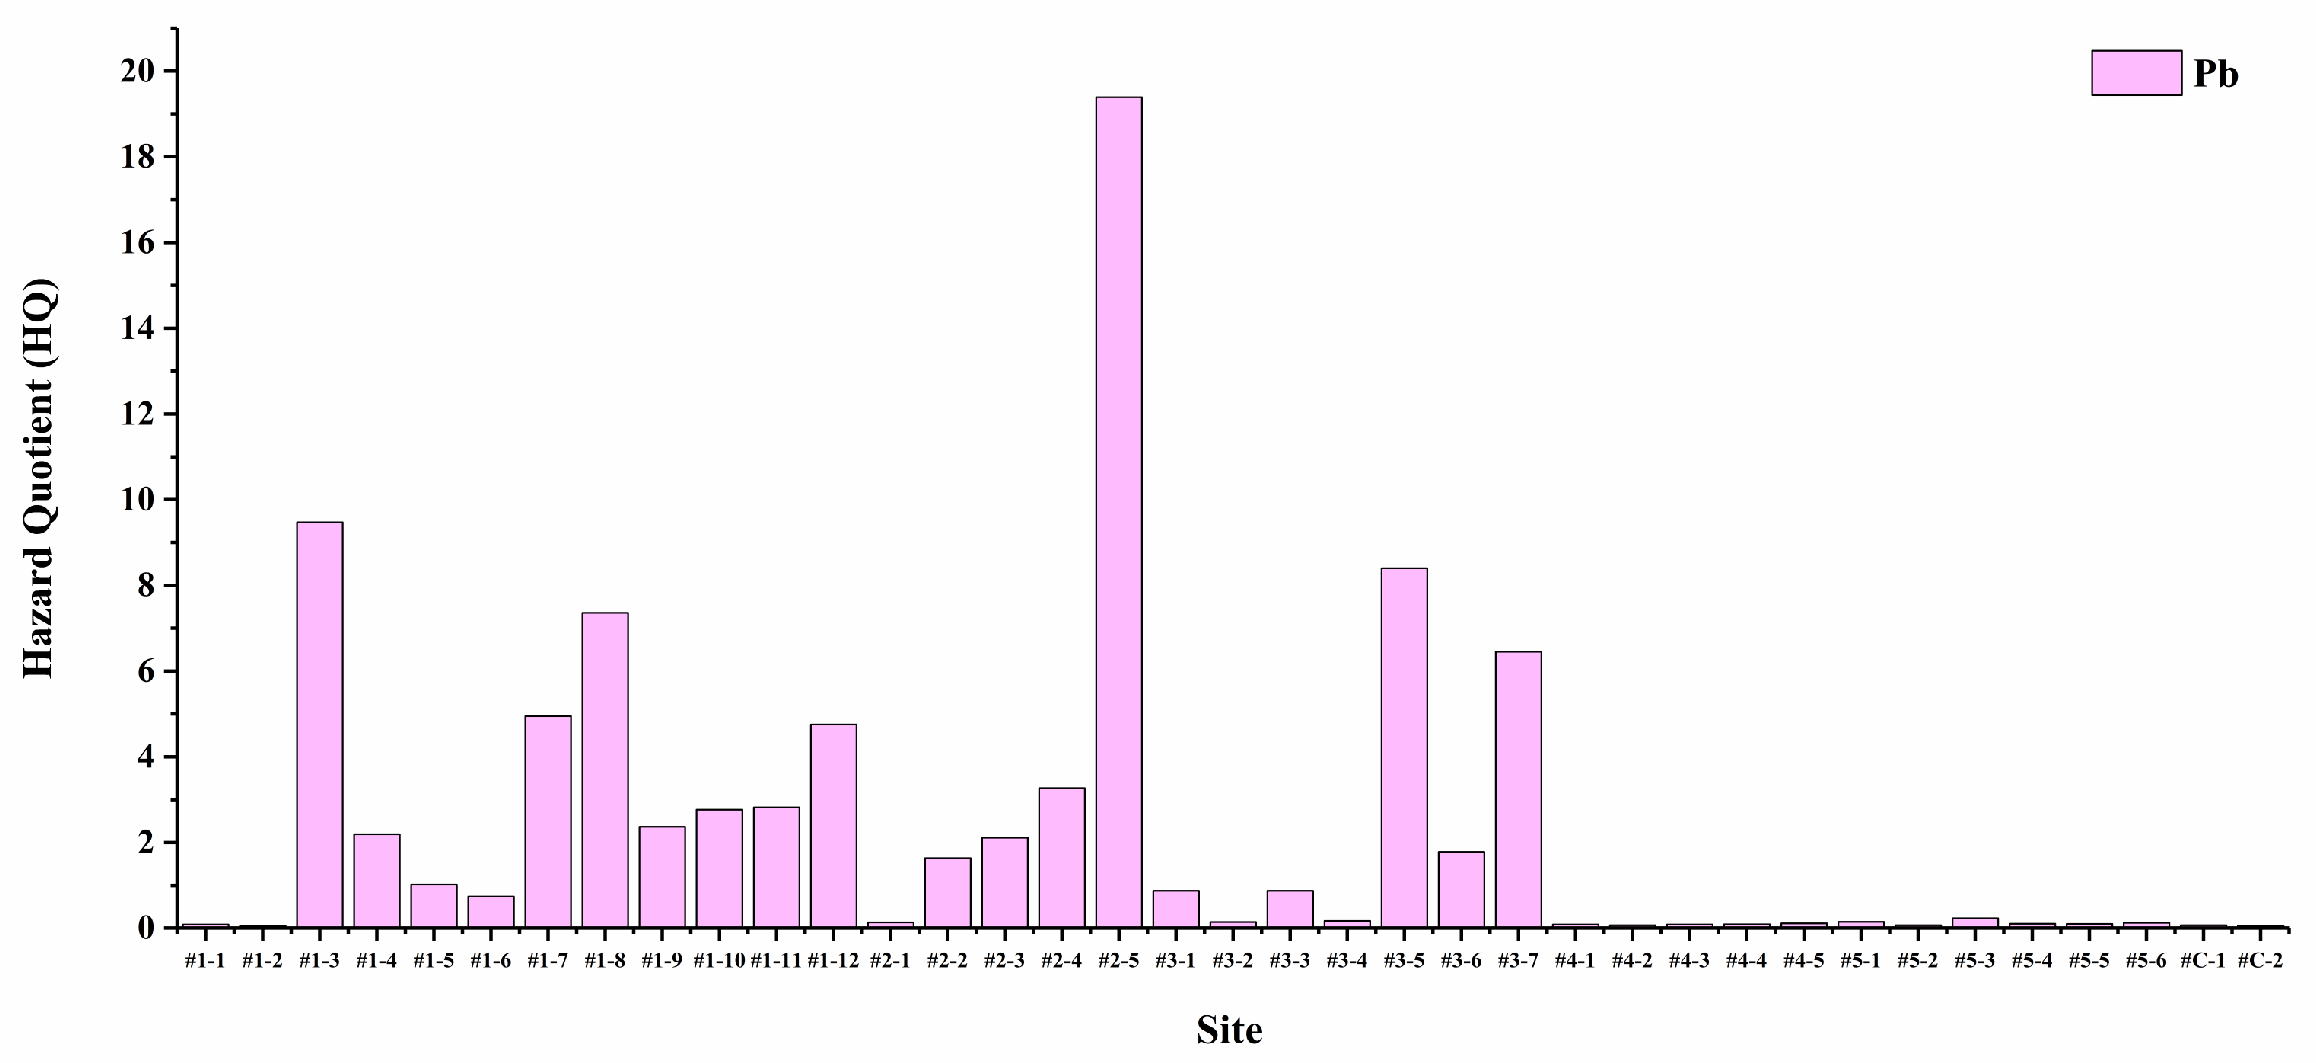
3.3.1. Hazard Quotient (HQ)

According to the classification of land use types in HJ 25.3–2019, the site is an industrial site, which belongs to class II, and its HM health risk evaluation was considered only for adults. The HQs of six HMs for adults at the site through two exposure pathways, oral ingestion and inhalation of soil particles, were calculated, as shown in Table 6. The results implied that Cr and Pb exerted significant non-carcinogenic health effects, while Mn, Cu, Zn, and Cd had acceptable non-carcinogenic health effects. In terms of exposure routes, inhalation of soil particles was the main exposure route. Soil ingestion by adults working in contaminated sites was small and the main exposure route was respiration. The severe exceedance of HQ for the oral ingestion route of Pb was mainly associated with to the high concentration of Pb in the surface soil of the production area of the site, as shown in Figure 7. The HQ at some sample sites exceeds the upper limit of the tolerance interval (HQ = 1) by a factor of 19, and soil remediation is urgently needed to reduce the risk to human health.

3.3.2. Carcinogenic Risk (CR)

Only Cr and Cd were evaluated for CR under the inhaled soil particle pathway, as shown in Table 7. Because SFo was not applicable for any of the six HMs, and the inhalation unit carcinogenic rate (IUR) was only applicable for Cr and Cd. The CR was compared with the target value of 10–4 to assess the presence of Cr and Cd CRs in adults. The CR for Cd in the topsoil of the study area was 1.74 × 10⁻⁶ less than the target value and therefore the CR of Cd in the study area was negligible. The CR for Cr was 5.47 × 10⁻⁴ greater than the target value, indicating that adults in the vicinity may develop cancer due to respiratory ingestion of contaminated soil particles.

4. Conclusions

The concentrations of HMs (Cr, Mn, Cu, Zn, Cd, and Pb) at different depths within a recycled lead smelting site were evaluated. The concentration of HMs in the surface soil of the study site all exceeded the background values, and the maximum concentrations were found mainly in the production area to the north-west. The maximum concentrations of Cr, Mn, and Pb were mainly concentrated in the surface soil at 0–0.2 m, and the concentrations at a depth of around 6 m were close to the background values, with no downward migration trend; the concentration of Cd and Zn in the whole profile exceeded the background values, with a strong migration capacity. Compared with other HMs, the proportion of bioavailable fraction of Pb and Cd in surface soil was higher and the bioavailability was relatively high. Values of Igeo indicated that Pb caused severe pollution of the surrounding environment, Cd led to moderate pollution to the environment in some areas, and other HMs posed negligible risk of pollution. RAC indicated that Cd in surface soils posed a high risk to the environment; the risk of release of Cr, Cu, Zn, and Pb decreased with increasing depth, but there was a trend of increasing risk of release of Cd and Mn. Human health risk assessment models revealed a serious non-CR in the study area. Among these HMs, Pb had the highest HQ, and the main exposure route was via respiratory intake. Cr had some CRs, and the exposure route was also respiratory intake. These results implied that without regulated treatment and regular testing, HM concentrations in soil at legacy sites can still have significant human and environmental impacts even after plant closure.

Supplementary Materials

The following supporting information can be downloaded at: https://www.mdpi.com/article/10.3390/w14091445/s1, Table S1: Speciation analysis test results.

Author Contributions

Conceptualization, F.Y.; methodology, J.Z. and S.L.; formal analysis, J.Z.; investigation, J.Z. and S.L.; data curation, J.Z.; writing—original draft preparation, J.Z.; writing—review and editing, F.Y. and Z.L.; visualization, J.Z.; funding acquisition, Z.L. All authors have read and agreed to the published version of the manuscript.

Funding

This research was funded by the National Natural Science Foundation of China (Grant Nos. 41402225 and 41972261) and the Key Scientific Research in Universities in Henan Province (Grant No. 21A170014).

Data Availability Statement

Not applicable.

Conflicts of Interest

The authors declare no conflict of interest.

References

  1. Akter, S.; Rahman, M.O.; Hasan, M.; Tushar, S.I.; Sarkar, M.H.; Mamun, K.M.; Kabir, M.J.; Rahman, M.S.; Abedin, M.J.; Begum, B.A.; et al. Source Apportionment of Heavy Metal Contaminated Soil Around a Urea Fertilizer Factory and Probabilistic Risk Assessment of Human Health. Available online: https://www.researchgate.net/publication/352387464_Source_Apportionment_of_Heavy_Metal_Contaminated_Soil_Around_a_Urea_Fertilizer_Factory_and_Probabilistic_Risk_Assessment_of_Human_Health (accessed on 12 April 2022).
  2. Guemiza, K.; Coudert, L.; Metahni, S.; Mercier, G.; Besner, S.; Blais, J.-F. Treatment technologies used for the removal of As, Cr, Cu, PCP and/or PCDD/F from contaminated soil: A review. J. Hazard. Mater. 2017, 333, 194–214. [Google Scholar] [CrossRef] [PubMed] [Green Version]
  3. Khalid, S.; Shahid, M.; Niazi, N.K.; Murtaza, B.; Bibi, I.; Dumat, C. A comparison of technologies for remediation of heavy metal contaminated soils. J. Geochem. Explor. 2016, 182, 247–268. [Google Scholar] [CrossRef] [Green Version]
  4. Zhang, Q.Y. The Current Status on the Recycling of Lead-acid Batteries in China. Int. J. Electrochem. Sci. 2013, 8, 6457–6466. [Google Scholar]
  5. Wu, Z.-Y.; Zhang, L.-N.; Xia, T.-X.; Jia, X.-Y.; Li, H.-Y.; Wang, S.-J. Quantitative Assessment of Human Health Risks Based on Soil Heavy Metals and PAHs Sources: Take a Polluted Industrial Site of Beijing as an Example. Environ. Sci. 2020, 41, 4180–4196. [Google Scholar]
  6. Wu, Z.; Zhang, L.; Xia, T.; Jia, X.; Wang, S. Heavy metal pollution and human health risk assessment at mercury smelting sites in Wanshan district of Guizhou Province, China. RSC Adv. 2020, 10, 23066–23079. [Google Scholar] [CrossRef]
  7. Sungur, A.; Soylak, M.; Ozcan, H. Fractionation, Source Identification and Risk Assessments for Heavy Metals in Soils near a Small-Scale In-dustrial Area (Çanakkale-Turkey). Soil Sediment Contam. Int. J. 2019, 28, 213–227. [Google Scholar] [CrossRef]
  8. Sterckeman, T.; Douay, F.; Proix, N.; Fourrier, H. Vertical distribution of Cd, Pb and Zn in soils near smelters in the North of France. Environ. Pollut. 2000, 107, 377–389. [Google Scholar] [CrossRef]
  9. Sterckeman, T.; Douay, F.; Proix, N.; Fourrier, H.; Perdrix, E. Assessment of the Contamination of Cultivated Soils by Eighteen Trace Elements Around Smelters in the North of France. Water Air Soil Pollut. 2002, 135, 173–194. [Google Scholar] [CrossRef]
  10. Wang, J.; Su, J.; Li, Z.; Liu, B.; Cheng, G.; Jiang, Y.; Li, Y.; Zhou, S.; Yuan, W. Source apportionment of heavy metal and their health risks in soil-dustfall-plant system nearby a typical non-ferrous metal mining area of Tongling, Eastern China. Environ. Pollut. 2019, 254, 113089. [Google Scholar] [CrossRef]
  11. Cai, L.-M.; Xu, Z.-C.; Qi, J.-Y.; Feng, Z.-Z.; Xiang, T.-S. Assessment of exposure to heavy metals and health risks among residents near Tonglushan mine in Hubei, China. Chemosphere 2015, 127, 127–135. [Google Scholar] [CrossRef]
  12. Qu, L.; Huang, H.; Xia, F.; Liu, Y.; Dahlgren, R.A.; Zhang, M.; Mei, K. Risk analysis of heavy metal concentration in surface waters across the rural-urban interface of the Wen-Rui Tang River, China. Environ. Pollut. 2018, 237, 639–649. [Google Scholar] [CrossRef] [PubMed] [Green Version]
  13. Kirkham, M.B. Cadmium in plants on polluted soils: Effects of soil factors, hyperaccumulation, and amendments. Geoderma 2006, 137, 19–32. [Google Scholar] [CrossRef]
  14. Impellitteri, C.A.; Saxe, J.K.; Cochran, M.; Janssen, G.M.C.M.; Allen, H.E. Predicting the bioavailability of copper and zinc in soils: Modeling the partitioning of potentially bioavailable copper and zinc from soil solid to soil solution. Environ. Toxicol. Chem. Int. J. 2010, 22, 1380–1386. [Google Scholar] [CrossRef]
  15. Sastre, J.; Hernández, E.; Rodrıguez, R.; Alcobé, X.; Vidal, M.; Rauret, G. Use of sorption and extraction tests to predict the dynamics of the interaction of trace elements in agricultural soils contaminated by a mine tailing accident. Sci. Total Environ. 2004, 329, 261–281. [Google Scholar] [CrossRef] [PubMed]
  16. Kot, A.; Namiesńik, J. The role of speciation in analytical chemistry. Trends Anal. Chem. 2000, 19, 69–79. [Google Scholar] [CrossRef]
  17. Rauret, G. Extraction procedures for the determination of heavy metals in contaminated soil and sediment. Talanta 1998, 46, 449–455. [Google Scholar] [CrossRef]
  18. Karimian, S.; Shekoohiyan, S.; Moussavi, G. Health and ecological risk assessment and simulation of heavy metal-contaminated soil of Tehran landfill. RSC Adv. 2021, 11, 8080–8095. [Google Scholar] [CrossRef]
  19. Xing, X.Y.; Xin, Y.G.; Li, H.Q.; Nan, S.; Ting, P.X. Spatial Distribution and Pollution Characteristics of Heavy Metals in Soil of Mentougou Mining Area of Beijing City, China. J. Agric. Resour. Environ. 2016, 33, 499–507. [Google Scholar]
  20. Ohiagu, F.O.; Lele, K.C.; Chikezie, P.C.; Verla, A.W.; Enyoh, C.E. Pollution Profile and Ecological Risk Assessment of Heavy Metals from Dumpsites in Onne, Rivers State, Nigeria. Chem. Afr. 2021, 4, 207–216. [Google Scholar] [CrossRef]
  21. Ma, Z.X.; Ren, W.X.; Xue, B.; Zhang, L.M.; Geng, Y.; Sun, L.N. Human health risk assessment of heavy metal pollutants in redevelopment brownfield area. Ecol. Sci. 2014, 33, 963–971. [Google Scholar]
  22. Wang, R.; Deng, H.; Jia, Z.-M.; Wang, J.-B.; Yu, F.; Zeng, Q.-Q. Spatial Distribution Characteristics, Pollution, and Ecological Risk Assessment of Soil Heavy Metals Around Mercury Mining Areas. Environ. Sci. 2021, 42, 3018–3027. [Google Scholar]
  23. Tan, J.-H.; Duan, J.-C.; Ma, Y.-L.; Yang, F.-M.; Cheng, Y.; He, K.-B.; Yu, Y.-C.; Wang, J.-W. Source of atmospheric heavy metals in winter in Foshan, China. Sci. Total Environ. 2014, 493, 262–270. [Google Scholar] [CrossRef] [PubMed]
  24. Liu, J.; Liu, Y.J.; Liu, Y.; Zhang, A.N. Quantitative contributions of the major sources of heavy metals in soils to ecosystem and human health risks: A case study of Yulin, China. Ecotoxicol. Environ. Saf. 2018, 164, 261–269. [Google Scholar] [CrossRef] [PubMed]
  25. Muller, G. Index of Geoaccumulation in Sediments of the Rhine River. GeoJournal 1969, 2, 109–118. [Google Scholar]
  26. Berstel, J.; Perrin, D. Theory of Codes; Academic Press: New York, NY, USA, 1985; pp. 1–433. [Google Scholar]
  27. Meng, X.-F.; Guo, J.-M.; Yang, J.-X.; Yang, J.; Zheng, G.-D.; Qiao, P.-W.; Bian, J.-L.; Chen, T.-B. Spatial Distribution and Risk Assessment of Heavy Metal Pollution in Farmland Soils Surrounding a Typical Industrial Area of Henan Province. Environ. Sci. 2021, 42, 900–908. [Google Scholar]
  28. The institution is Ministry of Ecology and Environment. PRC Technical Guidelines for Risk Assessment of Soil Contamination of Land for Construction; China Environment Publishing Group: Beijing, China, 2019; pp. 1–53. [Google Scholar]
  29. Michael, A. Soil elemental concentrations, geoaccumulation index, non-carcinogenic and carcinogenic risks in functional areas of an informal e-waste recycling area in Accra, Ghana. Chemosphere 2019, 235, 908–917. [Google Scholar]
  30. Bin, L.Z.; Fu, C.; Yuan, Z.W.; Yan, F.Q.; Liang, Z.S.; Jing, M. Heavy Metal Contamination and Health Risk Assessment in the Soil Surrounding a Secondary Lead Plant. Environ. Sci. Technol. 2018, 41, 197–207. [Google Scholar]
  31. Lu, S.; Wang, Y.; Teng, Y.; Yu, X. Heavy metal pollution and ecological risk assessment of the paddy soils near a zinc-lead mining area in Hunan. Environ. Monit. Assess. 2015, 187, 627. [Google Scholar] [CrossRef]
  32. Huang, X.; Zhu, Y.; Ji, H. Distribution, speciation, and risk assessment of selected metals in the gold and iron mine soils of the catchment area of Miyun Reservoir, Beijing, China. Environ. Monit. Assess. 2013, 185, 8525–8545. [Google Scholar] [CrossRef]
  33. Zhiyuan, W.; Zhang, D.; Tianxiang, X.; Xiaoyang, J. Soil Heavy Metals Contamination of a Typical Calcium Carbide Slag Dump Sites: Source Apportionment and Risk Assessment. Available online: https://www.researchgate.net/publication/349267980_Soil_Heavy_Metals_Contamination_of_a_Typical_Calcium_Carbide_Slag_Dump_Sites_Source_Apportionment_and_Risk_Assessment (accessed on 12 April 2022).
  34. Edori, O.S.; Iyama, W. Assessment of Heavy Metals pollution in Soils within Hot Mix Asphalt Plants Vicinity in Port Harcourt, Rivers State, Nigeria. Pharm. Chem. J. 2021, 8, 24–32. [Google Scholar]
  35. Liu, D.; Wang, F. Heavy Metal Pollution in Street Dusts from Different Functional Zones of Luoyang City and Its Potential Ecological Risk. Environ. Sci. 2012, 33, 253–259. [Google Scholar]
  36. The institution is Ministry of Ecology and Environment. PRC Soil Environmental Quality-Risk Control Standard for Soil Contamination of Development Land; China Environment Publishing Group: Beijing, China, 2018; pp. 1–18. [Google Scholar]
  37. Tao, H.; Guo, H.; Wang, Y.; He, Y.; Liu, W.; Chen, Y.; Shen, J. Distribution Characteristics and Ecological Risk Assessment of Pb in Soil at a Typical Lead Battery Sites. Environ. Sci. Technol. 2017, 40, 143–148. [Google Scholar]
  38. Cui, X.; Geng, Y.; Sun, R.; Xie, M.; Feng, X.; Li, X.; Cui, Z. Distribution, speciation and ecological risk assessment of heavy metals in Jinan Iron & Steel Group soils from China. J. Clean. Prod. 2021, 295, 126504. [Google Scholar] [CrossRef]
  39. Rieuwerts, J.S.; Farago, M.; Cikrt, M.; Bencko, V. Heavy Metal Concentrations in and Around Households Near a Secondary Lead Smelter. Environ. Monit. Assess. 1999, 58, 317–335. [Google Scholar] [CrossRef]
  40. Burt, R.; Wilson, M.A.; Keck, T.J.; Dougherty, B.D.; Strom, D.E.; Lindahl, J.A. Trace element speciation in selected smelter-contaminated soils in Anaconda and Deer Lodge Valley, Montana, USA. Adv. Environ. Res. 2003, 8, 51–67. [Google Scholar] [CrossRef]
  41. Kaasalainen, M.; Yli-Halla, M. Use of sequential extraction to assess metal partitioning in soils. Environ. Pollut. 2003, 126, 225–233. [Google Scholar] [CrossRef]
  42. Rodríguez, L.; Ruiz, E.; Alonso-Azcárate, J.; Rincón, J. Heavy metal distribution and chemical speciation in tailings and soils around a Pb–Zn mine in Spain. J. Environ. Manag. 2009, 90, 1106–1116. [Google Scholar] [CrossRef]
  43. Gao, L.; Wang, Z.; Li, S.; Chen, J. Bioavailability and toxicity of trace metals (Cd, Cr, Cu, Ni, and Zn) in sediment cores from the Shima River, South China. Chemosphere 2018, 192, 31–42. [Google Scholar] [CrossRef]
  44. Zhang, C.; Shan, B.; Tang, W.; Dong, L.; Zhang, W.; Pei, Y. Heavy metal concentrations and speciation in riverine sediments and the risks posed in three urban belts in the Haihe Basin. Ecotoxicol. Environ. Saf. 2017, 139, 263–271. [Google Scholar] [CrossRef]
  45. Jahromi, F.A.; Keshavarzi, B.; Moore, F.; Abbasi, S.; Busquets, R.; Hooda, P.S.; Jaafarzadeh, N. Source and risk assessment of heavy metals and microplastics in bivalves and coastal sediments of the Northern Persian Gulf, Hormogzan Province. Environ. Res. 2021, 196, 110963. [Google Scholar] [CrossRef]
  46. Wu, T.; Li, X.P.; Cai, Y.; Ai, Y.W.; Sun, X.M.; Yu, H.T. Geochemical behavior and risk of heavy metals in different size lead-polluted soil particles. China Environ. Sci. 2017, 37, 4212–4221. [Google Scholar]
  47. Luo, G.; Han, Z.; Xiong, J.; He, Y.; Liao, J.; Wu, P. Heavy metal pollution and ecological risk assessment of tailings in the Qinglong Dachang antimony mine, China. Environ. Sci. Pollut. Res. 2021, 28, 33491–33504. [Google Scholar] [CrossRef] [PubMed]
Figure 1. Location of sampling sites in the study area.
Water 14 01445 g001
Figure 2. Concentration distribution of HMs in topsoil of the site.
Water 14 01445 g002
Figure 3. Statistics pertaining to HM concentration with depth.
Water 14 01445 g003
Figure 4. Distribution of HM forms in the vertical direction, (a) #1–7; (b) #1–12.
Water 14 01445 g004
Figure 5. Igeo statistics of surface soil HMs at each sample site, (a) #1–1 to #2–5; (b) #3–1 to #C–2.
Water 14 01445 g005
Figure 6. RAC statistics of HMs in soil at different depths in the production area: (a) 0–0.5 m; (b) 0.5–1 m; (c) 1–2 m; (d) 2–3 m.
Water 14 01445 g006
Figure 7. Distribution of HQois values of Pb in the surface soil of each sample site.
Water 14 01445 g007
Table 1. Modified BCR continuous extraction method.
StepFractionExtractantExperimental Process
F1Extractable32 mL of 0.11 M CH3COOHShaking at room temperature for 16 h
F2Reducible32 mL of 0.5 M NH3OH·HCl (pH 1.5)Shaking at room temperature for 16 h
F3Oxidizable8 mL of 8.8 M H2O2 (pH 2)Shaking at room temperature for 1 h and digested at 85 °C for 1 h
Add 8 mL of 8.8 M H2O2 (pH 2) againShaking at 85 °C for 1 h
Cool, add 40 mL of 1 M CH3COONH4 (pH 2)Shaking at room temperature for 16 h
F4ResidualAir-dried, 6 mL of HNO3, 2 mL of HCl, 2 mL of HFMicrowave digestion
Table 2. Values of Igeo and the pollution level.
Igeo ValueIgeo ClassPollution Level
Igeo ≤ 00Uncontaminated
0 < Igeo ≤ 11Uncontaminated to moderately contaminated
1 < Igeo ≤ 22Moderately contaminated
2 < Igeo ≤ 33Moderately to heavily contaminated
3 < Igeo ≤ 44Heavily contaminated
4 < Igeo ≤ 55Heavily to extremely contaminated
Igeo ≥ 56Extremely contaminated
Table 3. Category of RAC.
RACClassRisk Assessment Levels
<1%0No risk
1–10%1Low risk
11–30%2Medium risk
31–50%3High risk
>50%4Very high risk
Table 4. Exposure model parameters.
ParameterMeaningValue
OISERcaOral ingestion of soil exposure (carcinogenic)3.64573 × 10⁻⁷
OISERncOral ingestion of soil exposure (non-carcinogenic)1.1083 × 10⁻⁶
PISERcaSoil exposure to inhaled soil particulate matter (carcinogenic)3.42058 × 10⁻⁹
PISERncSoil exposure to inhaled soil particulate matter (non-carcinogenic)1.03986 × 10⁻⁸
CsurConcentration of HMs in surface soilPresent study
SFoOral ingestion of carcinogenic slope factors-
SFiRespiratory inhalation carcinogenic slope factorCr 51.14483
Cd 7.671724
RFDoOral reference dosesCr 1.503
Mn 0.14
Cu 0.04
Zn 0.3
Cd 0.001
Pb 0.00185
RFDiRespiratory inhalation reference doseCr 2.3463 × 10⁻⁵
Cd 2.3463 × 10⁻⁶
SAFSoil allocation factor0.5
Table 5. HM concentrations of surface soil and related site background values (mg/kg).
HMsCrMnCuZnCdPbReference
Min.21.01171.981.5257.780.1148.75This study
Max.139.88994.1750.97495.6310.6716,184.7Id.
Mean84.65598.2115.16162.291.81921.77Id.
S.D.18.3147.1710.4196.222.393213.39Id.
C.V. (%)22256959133167Id.
Hunan Lead and Zinc Mining144.3-1123361.5792.1Data from Ref. [31]
Beijing Gold Mine215.25-65.39133.90.86134.25Data from Ref. [32]
Typical Calcium Carbide Slag Dumps in Qiqihar26.98-11.7232.570.0326.41Data from Ref. [33]
Tehran landfill82.23994.6676.73113.040.3641.16Data from Ref. [18]
Hot-Mix Asphalt Plants in Nigeria83.3711.9232.4390.334.739.27Data from Ref. [34]
Soil Background Values in Henan63.25672062.50.06522.3Data from Ref. [35]
Intervention Value30-8000-47800Data from Ref. [36]
Table 6. HQ results for each HM exposure pathway.
ElementHQoisHQpisHI
Cr0.0046152.7737612.778376
Mn0.350444-0.350444
Cu0.031078-0.031078
Zn0.044366-0.044366
Cd0.1473470.5892160.736563
Pb85.19633-85.19633
Table 7. CR results for each exposure pathway of Cr and Cd.
ElementCRoisCRpisCRn
Cr-5.47 × 10−45.47 × 10−4
Cd-1.74 × 10−61.74 × 10−6
Publisher’s Note: MDPI stays neutral with regard to jurisdictional claims in published maps and institutional affiliations.

