1. Introduction
Due to their relatively low cost and unique properties, the world production of plastics increased exponentially from 2 million tonnes in the 1950s to 368 million tonnes in 2019 [
1], and approximately 60% of used plastic materials were disposed of as waste. It is estimated that at least 8 million tonnes of plastic waste generated in coastal regions ended up in the oceans each year [
2]. Another study by Eriksen et al. [
3] estimated that there is a minimum of 5.25 trillion pieces of plastic pieces floating on the ocean surface worldwide. Among these plastic contaminants, microplastics (MPs), i.e., plastic pieces with sizes ranging from 1 μm to 5 mm, are found to be significantly more abundant than larger pieces and pose higher risks to the environment. It is evident that MPs can cause wide ranging effects on organisms from sub-cellular to ecosystem levels [
4]. The magnitude of effects largely depends on their physicochemical parameters, including polymeric structure, chemical composition, size, buoyancy, and abundance in the environment [
5]. For this reason, quantification and characterization of MPs are of fundamental importance for ecotoxicological assessment.
To assess MPs abundance, visual identification is often used to differentiate MPs from natural materials [
6]. However, the results are strongly affected by observer bias, resolution of microscope and relative abundance of the sample matrix [
7]. Therefore, many studies used Fourier transform infrared (FTIR) or Raman spectroscopy to further confirm the identity of the detected particles. Although vibrational spectroscopic methods benefit from their reliability and non-destructive nature, they have limitations of long measurement time and that only a small subset of the sample with larger sizes can be detected [
8]. Earlier studies applied attenuated total reflectance (ATR) FTIR to obtain the spectrum from a smaller particle, but it is only limited to characterize MPs with size > 100 μm [
9]. Further advances have therefore been applied, including FTIR coupled with a confocal microscope (known as μFTIR). It expands the lower size limit of detection to theoretically 10 µm in diameter but the major disadvantages are the long measurement time (>20 h for one 55 mm diameter filter paper) and the requirement of continuous consumption of liquid nitrogen to cool down the mercury cadmium telluride (MCT) detector [
8,
10,
11,
12]. Recently, some studies [
13,
14] developed another optical method to the identify MPs with size ≥ 20 μm from other objects with similar size (e.g., diatoms) by using a holographic fingerprint. A number of digital holograms were constructed by holographic interferometer, where a digital hologram with multiple objects will be segmented in order to identity each single object separately using fractal features. Apart from optical approaches, some destructive analytical techniques are also available, such as pyrolysis gas chromatography (Py-GCMS) [
15] and thermal desorption (TDS) GCMS [
16]. It can accurately identify the polymer chemical compositions and the concentration in volumetric units with a suggested lower size limit of 100 µm [
6].
Fluorescent dyes provide an alternative approach for the detection of plastic particles. Maes et al. [
17] first reported the use of Nile red (NR) fluorescence staining to tag MPs, where stained MPs could be identified under microscope with the illumination of a blue LED. This method requires only a short incubation period for staining MPs and provides a very high recovery rate (96.6%). More importantly, the advantage of this method is the ability to detect very small MPs down to 20 µm when coupled with an automated image analysis software. Other than image analysis, Kaile et al. [
18] proposed the use of flow cytometry to detect and quantify fluorescence-emitting MPs. Flow cytometry is a very sensitive instrument to detect light scattering and fluorescence signals, so it allows rapid quantification of fluorescence stained (e.g., NR) MPs. It has been extensively used in detecting and analyzing microparticles, including chemicals, cells, and microbials in liquid samples, which are focused hydrodynamically into a stream to make them flow one by one and pass through incident light beams from one or more lasers. Parameters such as scatter and fluorescence of lights are measured by sensitive photomultiplier tubes, where information such as size (forward scatter), surface roughness/granularity (side scatter), and fluorescence by pigments or dye markers can be determined [
19]. Other than its sensitivity, one of the major advantages of flow cytometry is the avoidance of human subjectivity since the entire process does not require the visual interpretation of particles. The protocol developed by Kaile et al. [
18] was still very preliminary as it involved only spiking sufficiently large amount of single type MPs in ultrapure water, but the results are very encouraging as they explored the possibility in detecting small MPs more accurately.
In this study, we proposed to extend the use of flow cytometry in detecting and quantifying small MPs (1–50 µm) in environmental water samples. To reduce the effect of matrices (e.g., organic carbon), the method would pre-concentrate MPs in environmental water samples by vacuum filtration, followed by re-dissolving MPs into a smaller volume of solvent, oxidizing organic matters using hydrogen peroxide (H2O2), staining MPs by fluorescence dye and finally quantifying MPs by flow cytometry. In order to validate the method, different types of polymers at different levels were quantified by flow cytometry individually. Besides, interference introduced by organic carbon, the effectiveness of wet oxidation by hydrogen peroxide and the desorption efficiency of MPs from pre-concentration filter membranes were evaluated. The recovery and accuracy of MP counts by flow cytometry were compared with conventional visual identification under a microscope. In addition, environmental water samples will be analyzed by the validated method.
2. Materials and Methods
2.1. Reagents and Chemicals
Polystyrene (PS) (10.5 ± 1.0 µm, spherical) was purchased from Cospheric LLC (Santa Barbara, CA, USA). Irregular shaped low-density polyethylene (LDPE) (11.7 ± 0.6 µm), polypropylene (PP) (19.7 ± 1.0 µm), polyvinyl chloride (PVC) (4.2 ± 0.2 µm), and acrylonitrile butadiene styrene (ABS) (19.3 ± 1.0 µm) were purchased from Special Plastic Lang Chemical (Dongguan, China). Poly(methyl methacrylate) (PMMA) (18.3 ± 0.4 µm) and polylactic acid (PLA) (9.1 ± 1.0 µm) were purchased from Zhonglian Plastic Chemical Technology (Jiangmen, China). Irregular shaped self-fluorescent PS (1.0 µm) was purchased from the Baseline Chromtech Research Centre (Tianjin, China). Calibration PS beads in different sizes were obtained from ThermoFisher Scientific (Waltham, MA, USA) (for 1 and 10 µm in sizes) and Cospheric LLC (Santa Barbara, CA, USA) (for 38 µm in size). Unless specified, all chemicals used were analytical reagent (AR) grade. 30% Hydrogen peroxide (Ph Eur grade) was obtained from VWR Chemicals BDH (Radnor, AP, USA). Tween 20 was purchased from Santa Cruz Biotechnology, Inc. (Dallas, TX, USA). Ethanol (95%) was purchased from Honeywell Research Chemicals (Charlotte, NC, USA). Nile red was purchased from Signa-Aldrich Corp. (St. Louis, MI, USA). Ultrapure water was produced by the Milli-Q water system (Merck Millipore, Hong Kong, China).
2.2. Application of Surfactant, Wet Oxidation, Fluorescence Dye Staining and Flow Cytometric Determination
NR was selected among other fluorescent dyes as it was comparatively selective to the polymer surfaces. We followed the optimized procedure for MPs staining and operation of flow cytometer reported by Kaile et al. [
18] with some modifications. Briefly, an NR stock solution (1 mg mL
−1) was prepared by dissolving NR in 95% ethanol. The solution was stored at 4 °C in the dark until use. For each experiment described below, Tween 20 was first added to each sample to achieve the final concentration at 0.1% (
w/
v) to facilitate suspension of MPs in the solution [
20]. For samples requiring wet oxidation, an equal volume of 30% hydrogen peroxide was added and the mixture was incubated at 70 °C for 5 h [
21]. After wet digestion, 1 mL of the mixture was cooled down to room temperature and was stained with 10 µL NR stock solution for 10 min.
Subsequently, the stained mixtures were analyzed by flow cytometry (Bio-rad ZE5 Cell Analyzer, Hercules, CA, USA). A target laser with 488/10 nm was used for the excitation and 583/30 nm (orange) or 509/24 nm (green) was used for emission filters. The trigger was set to 0.01% forward scatter, and the photomultiplier tubes (PMT) voltages were set at 140 for forward scatter (FSC), 280 for side scatter (SSC), 615 for 509/24 nm and 425 for 583/30 nm. The samples were analyzed at a flow rate of 0.4 µL s
−1 and a total sample volume of 100 µL was used for each run. To distinguish between stained MPs and background signals with NR precipitates, a reagent blank composed of Tween 20 at 0.1% (
w/
v) in ultrapure water stained with NR was used to determine the background for correction (
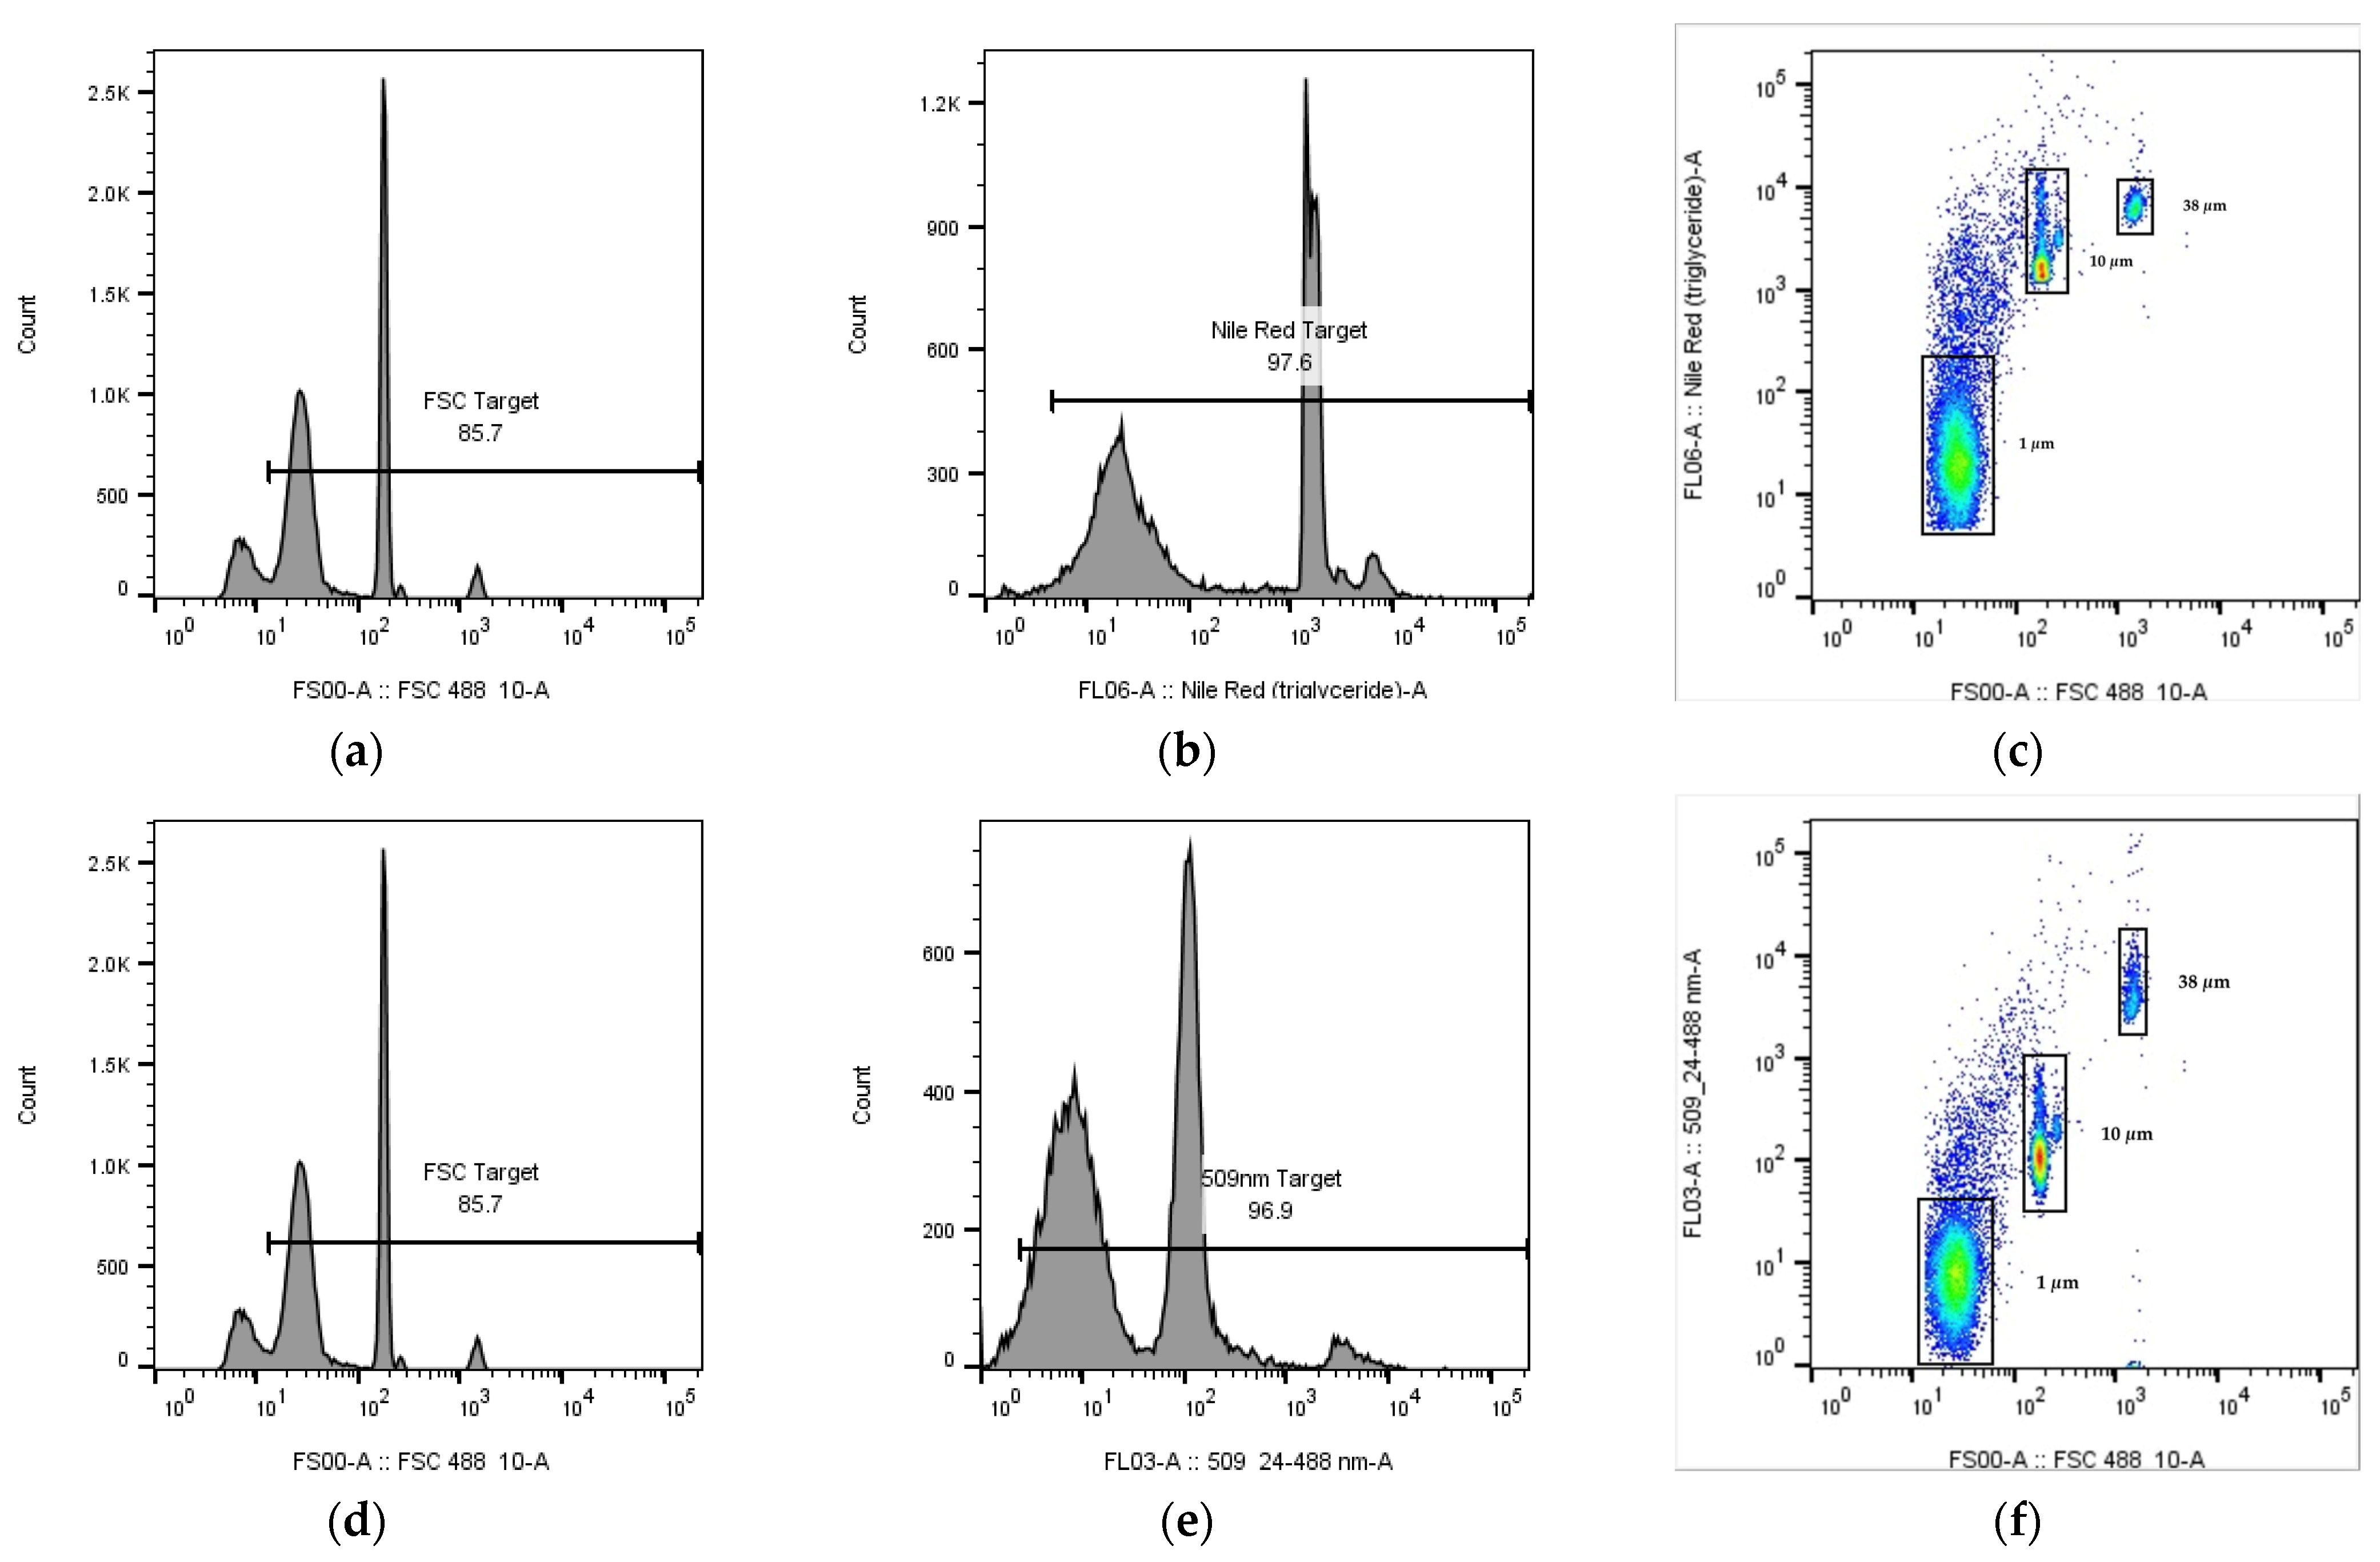
Figure 1a for emission at 583 nm and
Figure 1c for emission at 509 nm). To calibrate the diameter of MPs and to control the minimum particle size (i.e., 10 µm for comparison study between flow cytometry and microscopic identification; or 1 µm for the other study) to be quantified, a set of PS calibration beads (1, 10 and 38 µm) were analyzed (
Figure 1b for emission at 583 nm and
Figure 1d for emission at 509 nm). After each run, the instrument was flushed by ultrapure water to reduce the cross contamination [
22].
To reduce the background signal, the FSC signal below the designated size and particles with little NR emission signal were gated. For example, in the analysis of PS calibration beads (1, 10 and 38 µm) with emission filter at 583 nm (
Figure 1b), when plotting the signal count of FSC (
Figure 2a), the signal peak contributed by the calibration beads were distinguishable from the background with smaller sizes, where gating can be applied to reduce the background signals. Apart from the gating of particles with smaller sizes, as shown in
Figure 2b, gating can be applied to remove signals from NR contaminated particles with little fluorescence. The resulting flow cytometric signal plots of NR fluorescence vs. FSC after gating was shown in
Figure 2c. All analysis of MPs between 1–50 µm with emission filter at 583 nm were gated using these settings. On the other hand, for emission filters set at 509 nm, background signals were gated using the same approach (
Figure 2d–f), and the resulting settings were applied to all of the analysis of MPs between 1–50 µm.
2.3. Preparation MPs Stock and Working Solutions and Evaluate the Selectivity of NR Staining
Seven commonly found MPs with different hydrophobicity and density, including PS, LDPE, PP, PMMA, PVC, PLA and ABS were chosen to validate the quantitation method by flow cytometry. The individual stock solution of each MP was prepared by mixing 5 mg of MPs into 20 mL of ultrapure water with Tween 20 at 0.1% (w/v), and the number of particles in the solution was calculated by the material’s density and mean diameter. Next, three concentrations (400 particle mL−1, 4000 particle mL−1, 40,000 particle mL−1) of working MP solutions were prepared by serial dilution with ultrapure water with Tween 20 at 0.1% (w/v). To determine the selectivity of staining, the particles were observed under an upright fluorescence microscope (Olympus BX 40) at 400× using a blue excitation range of 450–480 nm (Olympus U-MWB) and an emission filter at 515 nm. The effect of autofluorescence of polymers was also evaluated without NR staining of the MPs working solutions to determine any interferences present.
2.4. Comparison of Accuracy of Flow Cytometry with Visual Identification
The accuracy of the present method using flow cytometry was compared with the conventional visual identification of MPs. Known concentrations (400, 4000 and 40,000 particles mL
−1, determined by the mean diameter and density of MPs) of each type of polymer was quantified by both visual identification under optical microscope and flow cytometry. For visual identification, each type of stained MP was quantified by an upright fluorescence microscope (Olympus BX 40) at 400× using a blue excitation range of 450–480 nm (Olympus U-MWB) with an emission filter at 515 nm. The MP counts were estimated using a Neubauer haemocytometer (Hamburg. Germany) or Sedgewick Rafter Counting Chamber S50 (Graticules Optics, Tonbridge, UK) [
23]. 100 μL of each water sample (
n = 7) was added to a haemocytometer and was viewed under an optical microscope (Optika, Ponteranica, Italy) with 100–400× magnification. The number of MPs in one set of 16 squares were counted. In this experiment, we only compared the MPs fraction ranging from approximately 10–50 μm for the two methods, as it was not possible to visually count anything smaller than this size range under 400× magnification. For the flow cytometric determination with the emission filter at 583 nm, FSC-488 signals for MPs below 10 μm (by comparing with calibration standards) were gated to obtain particle counts between 10–50 μm, and the signals of the emission filter’s wavelength was gated to reduce particles with little fluorescence.
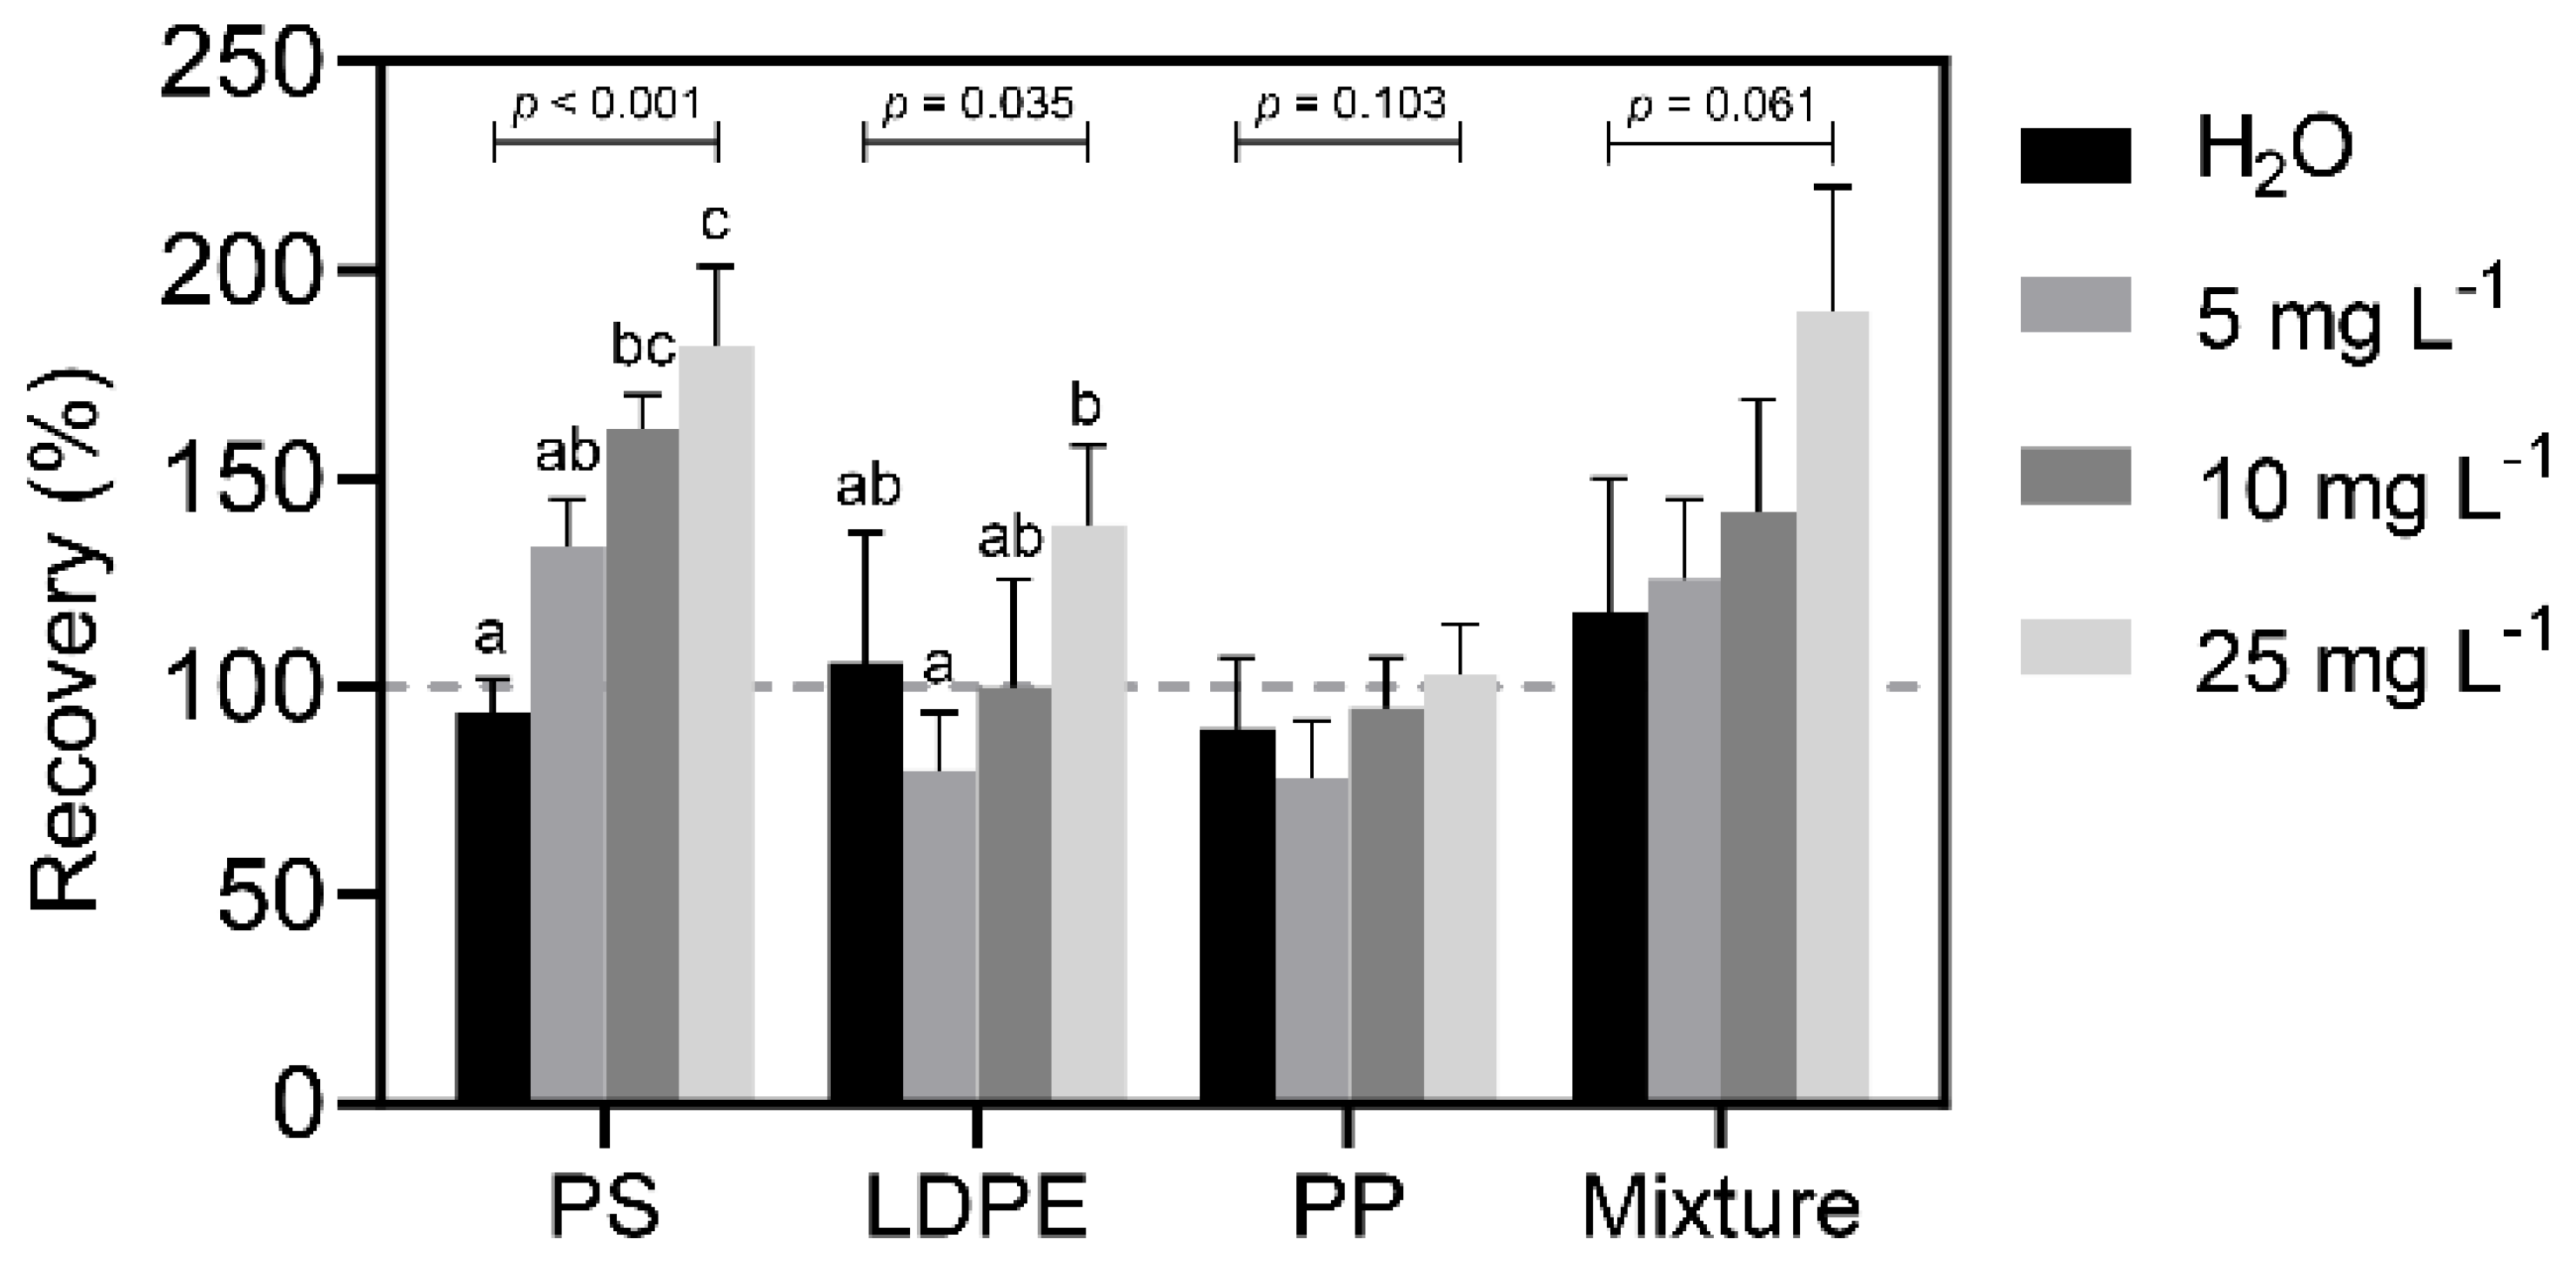
2.5. Evaluation of the Interference by Organic Carbon
One of the concerns is the specificity of NR staining to organic matters in environmental water samples [
6]. To evaluate the effect of interferences by organic matters, standard organic carbon (i.e., potassium hydrogen phthalate, KHP) was spiked to the ultrapure water (
n = 7) to achieve different concentrations of organic carbon at 5, 10, 25 mg carbon L
−1, followed by the addition of Tween 20 (0.1% (
w/
v)) and wet oxidation with H
2O
2. To determine the interference removal efficiency, the experiment is repeated but without the treatment of wet oxidation. The amount of particles present was determined by flow cytometry with the emission filter at 583 nm after staining with NR stock solution. Another experiment was conducted to further evaluate any interferences present in mixed MPs. The known amount (900 particle mL
−1) of individual types of polymers (LDPE, PP and PS) and equal ratio (1:1:1) of the three types of polymers were spiked into different levels of KHP working solutions, followed by the addition of Tween 20, wet oxidation with H
2O
2, NR staining and flow cytometric analysis.
2.6. Selection of Membrane Filter for Pre-Concentration of MPs
To reduce background signals caused by matrices, it is suggested to pre-concentrate MPs in a large volume of samples by filtration, where the MPs retained on the filter membrane would be desorbed into a small volume of ultrapure water (10 mL). A series of filter membranes with a diameter at 47 mm made of different materials were examined to determine the efficiency in filtration and desorption, including a 0.45 µm mixed cellulose esters (MCE) membrane filter (Toyo Roshi Kaisha, Ltd., Tokyo, Japan), 0.22 µm nylon membrane filter (Filtrex, Milano, Italy), a 0.22 µm polycarbonate membrane filter (GVS Filter Technology, Bologna, Italy), a 1.6 µm glass microfibre membrane filter (CHMLAB, Terrassa, Spain) and a 0.45 µm cellulose nitrate membrane filter (Sartorius Stedim Biotech, Goettingen, Germany). Four thousand particles of PS (size ~10 µm) were spiked to 1 L of ultrapure water (n = 3) and filtered by corresponding filter membrane through vacuum filtration (with vacuum pressure at 15 In. Hg). The resulting MCE membrane filter with MPs was soaked in a solution of 10 mL of ultrapure water with Tween 20 at 0.1% (w/v). A pair of metal tweezers was used to handle the MCE membrane filter to facilitate the desorption of MPs. The resulting solution will undergo NR staining and quantification by flow cytometry with the emission filter at 583 nm.
2.7. Evaluation of the Efficiency of Pre-Concentration of MPs in Environmental Water Samples
To evaluate the performance of the pre-concentration/desorption processes in environmental samples, 5 L of each of ultrapure water and seawater samples (n = 9) were filtered through a 0.45 µm MCE membrane filter to remove all MPs. A known amount (4000 particles) of a mixture of three polymer types (i.e., LDPE, PP or PS) in equal ratio (1:1:1) was spiked to the filtered ultrapure water and seawater. MPs in the spiked filtrates were collected by a 0.45 µm MCE membrane filter through vacuum filtration (with vacuum pressure at 15 In. Hg), and the resulting MCE membrane filter with MPs was soaked in a solution of 10 mL of ultrapure water with Tween 20 at 0.1% (w/v). A pair of metal tweezers was to be used to handle the MCE membrane filter to facilitate the desorption of MPs. The resulting solution will undergo wet oxidation, NR staining and quantification by flow cytometry with the emission filter at 583 nm.
2.8. Determination of MPs from Environmental Seawater Samples
5 L of seawater samples (
n = 3) were collected at Ma Liu Shui Ferry Pier and Tsuen Wan West, Hong Kong in July 2021 and April 2022, respectively (
Figure 3). The samples were collected at a depth of approximately 1 m using a water sampler (Wildco Instruments, Yulee, FL, USA), which was pre-cleaned three times with filtered ultrapure water. The organic carbon contents of the environmental water samples collected at Ma Liu Shui Ferry Pier and Tsuen Wan West were found to be 2.18 mg/L and 2.32 mg/L, respectively. The sample was stored at 4 °C and transferred back to the laboratory within 1 h. Before analysis by the general procedure above, all seawater samples were kept at 4 °C until analysis.
Prior to analysis, each water sample was sieved through a 50 µm stainless steel mesh to remove all particulates larger than the upper limit of the flow cytometer. Filtrate containing MPs smaller than 50 µm was then filtered in vacuum through a 0.45 µm MCE membrane filter, where the resulting MCE member filter was suspended in 10 mL ultrapure water with Tween 20 (0.1% (w/v)). A pair of metal tweezers was used to handle the MCE membrane filter to facilitate the desorption of the MPs in aqueous solution. The resulting solution underwent wet oxidation, NR staining and quantification by flow cytometry or microscope. For the seawater samples collected at Tsuen Wan West, a recovery study of the flow cytometry was conducted by spiking 8000 particles L−1 of self-fluorescent PS (with size in 1 µm) prior to filtration, the addition of Tween 20, wet oxidation with H2O2, NR staining and flow cytometric analysis. A method blank is prepared by extracting particles from 5 L ultrapure water and dissolving in 10 mL ultrapure water with Tween 20 (0.1% (w/v)) for the background correction. For flow cytometric determining recovery and accuracy of self-fluorescent PS, a target laser with a wavelength of 405/10 nm was used for the excitation of self-fluorescent PS together with the use of 420/10 nm for the emission filter. To compare the accuracy and recovery of the two NR fluorescence wavelengths, a target laser with wavelength 488/10 nm was used for the excitation, where the emission at both 583/30 nm (orange) and 509/24 nm (green) were evaluated.
2.9. Quality Control and Prevention of Contamination
Unless specified, all experiments were done in at least triplicate. All glassware was rinsed with ultrapure water and pyrolyzed in a muffle furnace at 450 °C for 5 h to remove all residual organics. To minimize airborne contamination, all glassware was covered with aluminum foil before use. All reagents including the NR stock solution, 30% hydrogen peroxide and 0.1% Tween 20 (w/v) solution were filtered through a 0.22 µm MCE syringe filter before use. Blanks including reagent blanks (n = 3) and method blanks (n = 3) were conducted in every batch of analysis to identify any contamination. A washing step was included after each run to avoid cross-contamination of MPs between samples. The signal was gated to remove particles with smaller sizes and with little NR staining.
2.10. Data Analyses
All statistical analyses were performed using Minitab 18. Sets of statistical analyses were designated for each objective. The recoveries of each polymer type were compared using one sample t-test. Pearson’s correlation was used to determine any linear correlation between total organic carbon (TOC) and the signals from flow cytometry. To explore any interference to the MPs recoveries in the presence of KHP, one-way ANOVA with post-hoc Tukey’s test was used. Two-sample t-tests were used to determine any significant difference of between the flow cytometer and microscopic identification. Unless otherwise stated, parameters with p value less than 0.05 were considered as significant difference.
4. Discussion
A method was developed to rapidly identify and quantify MPs using flow cytometry in this study. Apart from wet digestion that also required other quantitation methods, the quantification process time only required <10 min per sample. Compared to microscopic identification, the present method using flow cytometry is less labour intensive and does not require special training. Besides, identification of MPs visually is often subjective and easily introduces false positive results [
6]. With the use of NR fluorescence staining, it can provide easier identification of MPs for both visual and flow cytometric determination and can increase selectivity and reduce subjectivity.
In this study, 95% of ethanol was chosen as the solvent to dissolve NR, which was found to have good staining performance as other solvents such as dimethyl sulfoxide, (DMSO) reported by Kaile et al. [
18]. Before finalizing the testing method, several concentrations of NR (i.e., 100 μg/mL, 10 μg/mL and 1 μg/mL) were tried to see the optimal conditions. Similar to the finding from Kaile et al. [
18], the best concentration was found to be 10 μg/mL (data not shown). An increase in NR concentration would increase the effect of aggregation of the unabsorbed NR, where precipitation and aggregation of the unabsorbed NR would create FSC signals of particles with size less than 1 μm (
Figure 1) that can be removed by background signal gating. Use of gating can control the size fraction of MPs being monitored, where the lowest detection size was approximately 1 μm in our existing setup. The instrumental detection limit of MPs by NR staining is defined as the lowest fluorescence signal produced by the stained MPs that can be detected by the flow cytometry, where a decrease in NR concentration may decrease the sensitivity as some MPs were not stained properly. On the other hand, NR precipitation was observed at the bottom of the container after the overnight storage of samples. Therefore, NR staining should be conducted freshly on the same day of measurement. Apart from the use of NR, Tween 20, a surfactant, was added (0.1% (
w/
v)) to water samples to reduce the surface tension and to maintain MPs in suspension [
28], which would not affect the staining of NR. The addition of Tween 20 can improve the repeatability of MPs, especially for LDPE, PP and PVC, as it can improve the homogeneity of MPs in aqueous solution. Although the surface tension of aqueous solution may be affected by numerous factors, including salinity, the effect caused by an increase in salinity in sea water samples is small when compared to the addition of Tween 20 (0.1% (
w/
v)).
For the accuracy in quantifying different MPs, as shown in
Table 1, the mean recoveries of visual inspection (
n = 7) were found to be 70.2–127% that were comparable to other studies using visual identification [
29,
30,
31]. The concentration of MPs in each of the solutions was determined by the mean diameter of MPs, where deviations in diameter of the MPs may contribute to the percentage variations and sometimes lead to recovery over 100%. Some studies using microscopic identification reported that misidentification due to interference by plastic-like particles with similar morphology were often over 20% and can be up to 70% for transparent particles [
32]. Except for some extreme results of PVC and PMMA in specific concentrations, the mean recovery of all MPs quantified by flow cytometry were comparable to visual identification. In general, most of the results were found to be statistically the same between the two methods, except some results in PS, PMMA and ABS. For PS and PMMA, visual identification performed better, as the recoveries were closer to 100%, while flow cytometry provided a more accurate result for ABS. As PS used in this study was spherical where the others were irregular in shape, variations in results were thus not related to the shape but rather the types of MPs. Nonetheless, accuracy and recoveries were satisfactory in the MPs in both methods, with the overall average recoveries of 101% and 95.2% for flow cytometry and visual identification, respectively.
The maximum standard deviations by flow cytometer (40.5%) were found to be better than when using visual inspection (57.3%), especially at low concentrations, as it may be easy to overlook small MPS with weak fluorescence manually. For MP types with higher density at room temperature, such as PMMA, PVC and PLA, larger variations were observed in both determination methods. These MP types would easily sink to the bottom due to their higher specific gravity with water, and poor mixing of these MPs would introduce larger variation during subsampling, stirring or shaking of samples during flow cytometric analysis and subsampling of water samples by haemocytometer for visual identification can improve the mixing MPs and repeatability of both methods.
In assessing MPs in environmental water samples, the methods used should be able to remove organic matters in the matrix in order to avoid false positive signals. Various chemical digestion methods including oxidative, acidic and alkaline digestions were proposed [
33]. Al-Azzawi et al. [
20] conducted a study to evaluate the performance of different digestion methods, where digestions using 30% hydrogen peroxide + sulphuric acid, 2M hydrochloric acid, 32% sodium hydroxide, 65% nitric acid would alter the surface and cause melting of MPs; and H
2O
2 and Fenton reactions are the most effective protocols to remove organic matters. Wet digestion with 30% H
2O
2 was thus chosen in this study and results showed that the wet digestion can reduce false positive signals caused by organic carbon by 47.7–66.8% (
Table 2). For environmental water samples, an average interference ranging from 10 to 38 MPs counts per 100 μL would thus contribute to the residual organic content. Such interference would not only affect quantification by flow cytometry, but also other NR staining quantitation approaches (e.g., visual identification). The effect caused by this interference would be more significant when the sample contains low MPs content, which can be alleviated by the pre-concentration of MPs in environmental water samples to increase the sample counts.
A pre-concentration process was thus introduced by vacuum filtration of environmental water (volume = 5 L) through membrane filtration, prior to re-dissolving MPs from the filter to a small volume of solvent (i.e., 10 mL of ultrapure water with Tween 20 at 0.1% (
w/
v)). The pre-concentration process not only can reduce the sample volume to increase the sensitivity and detection limit, but can also reduce the effect of interferences from the sample matrix by removing soluble organic carbon and inorganic salts. Removing inorganic salts in seawater by filtration can lower the surface tension caused by salinity and maintain the suspension of MPs in the final aqueous solution. From the results obtained (
Figure 8), no significant effect was observed to the quantitation of MPs that are caused by slight variations in surface tension. In this study, a 500-fold concentration was conducted to the seawater samples, where no significant interference was observed under such concentration. The choice of filter membrane is critical to the % recovery and the MCE filter was chosen as it can provide a satisfactory desorption efficiency (
Figure 7). The maximum volume of environmental water sample would be subjected to the suspended solids content that would overload the filter. A comparison study conducted by Zheng et al. revealed that filtration of 5 L of environmental water sample by membrane filter can retain more microplastics than the use of sieve pre-concentration and Manta trawling with larger sample volumes [
34]. Five litres of seawater samples collected in this study were capable to be completely filtered by a single 47 mm diameter MCE filter. The % recoveries in both sample matrices were found to be satisfactory, where MPs retained on the MCE filter were successfully desorbed by the use of tweezers and no significant interference was observed from the matrices. Desorption of MPs from MCE filters with the assistance of ultrasound was not recommended, as it may generate a large number of fractured particles from the MPs [
35]. The use of sample pre-concentration can enhance the detection limit and sensitivity of flow cytometry quantification and thus improve the accuracy in quantification. To compare the consistency of MPs between flow cytometry and microscope identification, a seawater sample from Ma Liu Shui Ferry Pier of Hong Kong (
Figure 3) was collected and analyzed, where results of the MP counts (10–50 μm) obtained by flow cytometry were not significantly different from those using visual identification. Another seawater sample was obtained at the shore of Tsuen Wan West, where a known amount of small-size (1 μm) self-fluorescent PS was spiked and the recovery was found to be satisfactory by using self-excitation (emission filter at 420 nm). Furthermore, MPs quantified by both NR emission filters (583 nm and 509 nm) were found to be consistent, even though the FSC background signal with emission filter at 509 nm was found very close to the calibration bead with a size at 1 μm (
Figure 1d). Comparing the results of microplastics between 10–50 μm and 1–50 μm of the environmental samples, the abundance of MPs was increased significantly when the size decreased (1–10 μm vs. 10–50 μm), the finding was similar to the study by Eriksen et al. [
3].
All in all, the method that consists of pre-concentration of MPs by vacuum filtration, hydrogen peroxide wet digestion, NR fluorescent staining and flow cytometric determination was validated, which is capable to quantify MPs with size from 1–50 μm from environmental fresh water and seawater samples. The method showed comparable results with visual identification using microscopy and advantages such as extended MPs size range, higher subjectivity, faster in quantification time and less trained personnel required. Further studies to explore organic carbon digestion and other specific fluorescence staining techniques can further reduce the interferences and improve specificity of the flow cytometric method. As demonstrated by Kaile et al. [
18] flow cytometry is capable of detecting MPs with sizes as low as 0.2 μm; reduction of interference from different environmental sample matrices and precipitation from NR can further reduce the background signal at the range below 1 μm and improve the size range of determination.
The recent development of coupling polarization analysis and machine learning with the holographic flow cytometric platform [
36] can distinguish some natural microfibres from synthetic ones without the use of fluorescent dyes. Although the current polarization-resolved technique focused on single-item analysis rather than in high-throughput field study of environmental water samples, it has the potential in identifying plastic material types and reducing false positive signals caused by unspecific fluorescence dye tagging. Another emerging fluorescence staining-free technique by the use of digital holography [
13,
14,
37] can provide more information to the morphological structure of MPs and other small entities, where a larger sample volume of sample than flow cytometry can be handled. However, the holographic technique is still hindered by larger MPs size (≥ 20 μm, depends on the space-bandwidth product of the system), the data-intensive acquisition process and lengthy post-processing times. Enhancements in camera pixel size and computer processor speed and refinement of machine learning algorithms and databases can make coupling of holography with flow cytometry possible so as to further improve the method performance and capabilities in identification of material types.


