1. Introduction
Freshwater resources are particularly vulnerable to the consequences of climate change. A general increase in temperature can promote eutrophication of surface waters [
1,
2], whereas more frequent extreme weather events, such as heavy rainstorms and longer drought periods, may impact the availability of safe drinking water, especially in water-stressed regions such as the Mediterranean. Temperature is a crucial determinant of water quality, since it influences microbial dynamics such as uncontrolled proliferation that can facilitate biofilm formation [
3,
4]. In a global warming scenario where water temperature is expected to rise, a potential change in microbial biodiversity can occur and can involve the emergence of some opportunistic bacteria in drinking water [
3].
Pressures on water resources and quality are further exacerbated by the growing concentration of human populations in metropolitan areas and intensification of industrial activities [
5]. In such a scenario, the provision of sufficient safe water for all citizens is an increasing challenge for water production management at drinking water treatment plants (DWTP).
The aim of a DWTP is to bring source water up to established drinking water quality standards by removing organic materials and pathogens and by reducing the total bacteria, with or without residual disinfectants. Current regulations to guarantee the safety of water for human consumption are still focused on monitoring culturable fecal indicators and heterotrophic bacteria plate counts (HPC). Although the European Directive (EU) 2020/2184 states that drinking water must be free of the fecal indicators
Escherichia coli and intestinal enterococci, it does not stipulate upper limits for HPC but rather only the absence of abnormal changes; thus, each member state is responsible for defining a threshold for what constitutes an acceptable level of change. That minimum change in microbial water quality is defined as biological stability [
6], and the aim is to provide drinking water to consumers with the same quality achieved in DWTPs. However, unwanted changes may occur during operational procedures or in distribution networks, and studies have shown that, during the potabilization process, water with a stable HPC may have a variable microbial composition and abundance that is undetectable by conventional methods [
7,
8,
9]. Moreover, the water microbiome may contain opportunistic pathogens and other underexplored diversity. Therefore, alternative approaches are needed for a better understanding of microbiomes in water systems to improve water management from source to tap.
High-throughput sequencing techniques, such as 16S rRNA metabarcoding, have the potential to provide in-depth information that complements standard bacterial quality parameters, and they can help to generate a more accurate picture of microbial communities at different water treatment stages. Several water microbiome studies based on 16S rRNA amplicon sequencing have described microbial composition in DWTPs and distribution networks, which differs according to the water source (e.g., river [
10,
11,
12,
13,
14], lake [
15], groundwater [
13,
16] or seawater [
17]).
A critical parameter in water quality monitoring is the sampling procedure, which needs to ensure the integrity and representativeness of the sampled water. Analyzing large volumes can be an effective approach to detect low-concentration targets. In recent years, dead-end ultrafiltration (DEUF) using hollow fiber filters has emerged as an effective sampling technique based on size exclusion, allowing for good simultaneous recoveries of bacteria, viruses and protozoa from large volumes of water (up to 1100 L) [
18,
19,
20]. Advantages of using DEUF methods include an all-in-one concentrating procedure for microbes; an improved sample representativity (in comparison with conventional small-volume concentration methods); and the ability to detect low numbers of microbes, including biothreat agents [
21], waterborne pathogens [
19,
22,
23] or indicators [
24] in large-volume water samples without filter clogging. However, very few studies have applied this method to study microbial biodiversity in the field of water, and they have been mainly focused on distribution networks [
8,
25,
26]. To the best of our knowledge, this is the first study of a full-scale DWTP using 16S rRNA metabarcoding with hollow fiber ultrafiltration methods.
The main goal of this work is to assess the effects of different treatment stages on bacterial communities in a full-scale DWTP. By combining conventional microbial water quality analysis based on the European Directive (EU) 2020/2184 with 16S rRNA metabarcoding, we hope to achieve a more in-depth description of the microbial baseline in the DWTP to evaluate process performance and for the detection of process instability.
2. Materials and Methods
2.1. Sample Collection
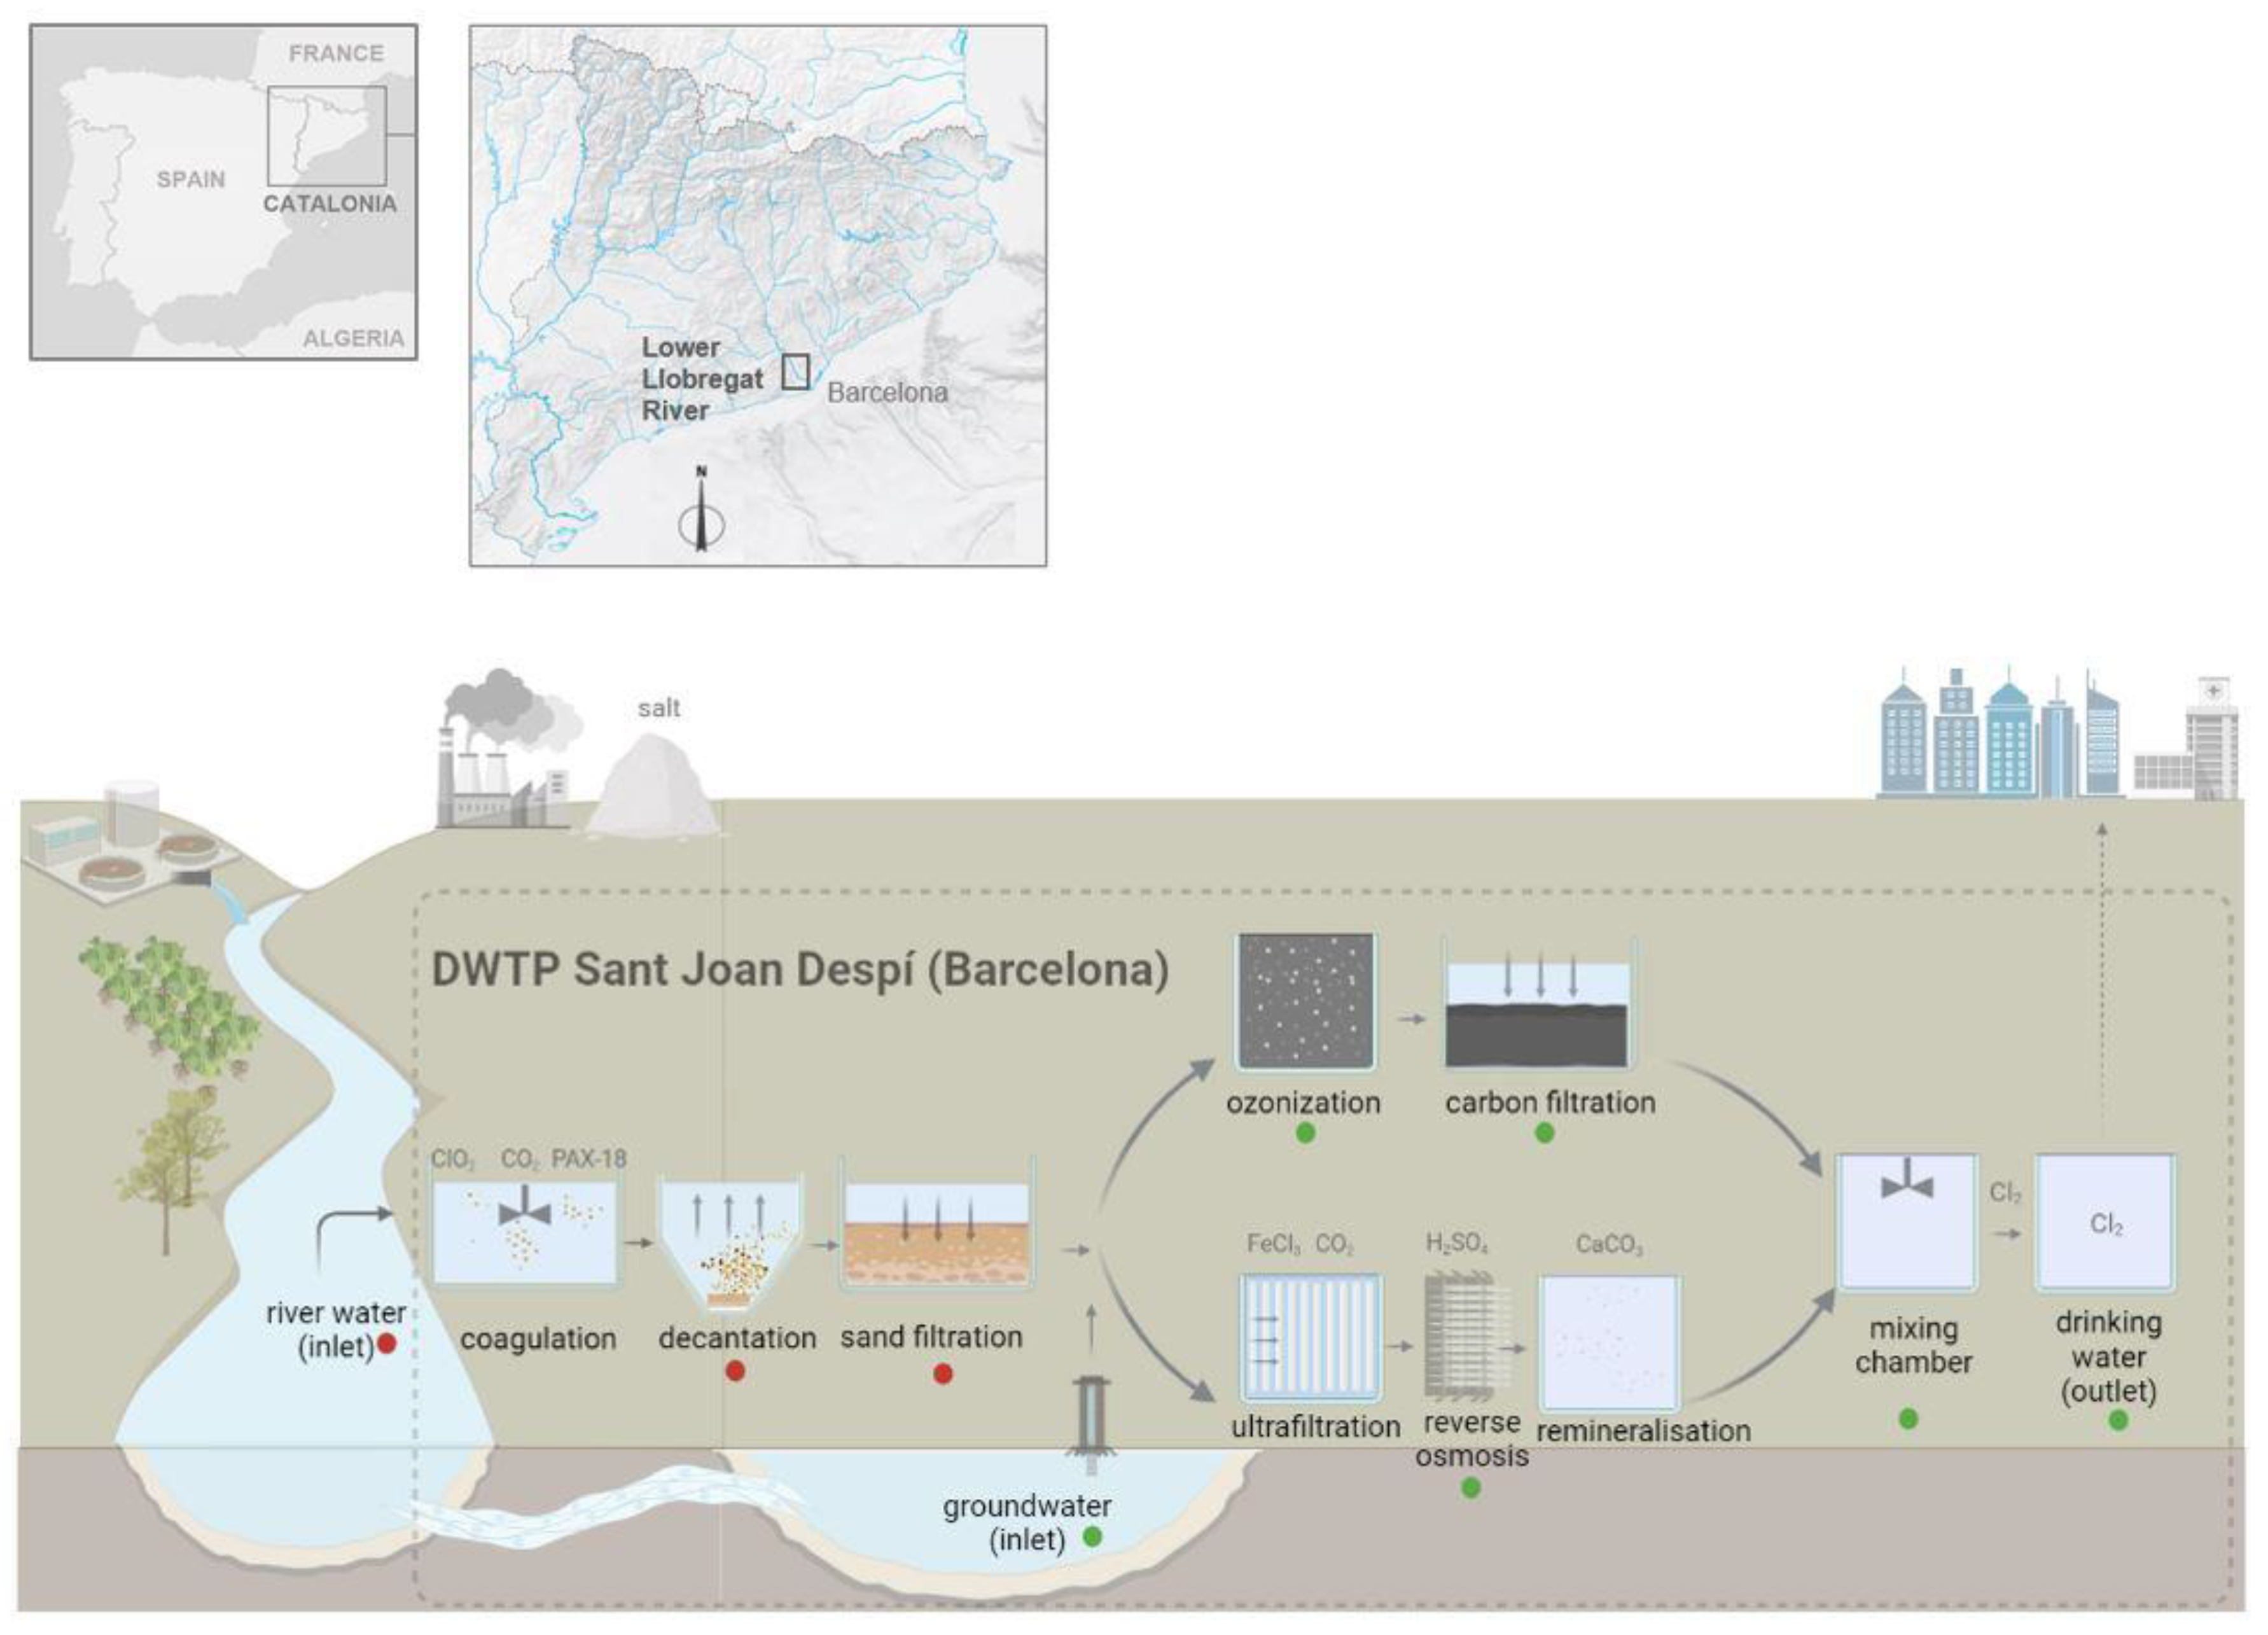
The study was carried out in a full-scale DWTP in Sant Joan Despí, Barcelona (Catalonia, northeastern Spain) between 2018 and 2019. This large supply system, located in the lower Llobregat River Basin, has an average production capacity of ~345,000 m
3 a day, which provides drinking water to more than 3.2 million inhabitants in the Barcelona metropolitan area. The complexity of the treatment applied is determined by distinctive features, such as scarcity of water resources (22 m
3/s average flow rate), irregular Mediterranean-type rainfall (from drought to flood) and the influence of industrial and agriculture activities upstream, including potash mining and wastewater treatment plants, on raw water quality (
Figure 1). In summary, the plant has two sources of water (river and groundwater). Surface water from the Llobregat River is pumped into the DWTP and cleaned of sand and gravel, before undergoing sequential treatments. The pretreatment stages consist of coagulation/flocculation of organic matter and an initial disinfection with chlorine dioxide, followed by decantation to eliminate flocculants. Subsequently, sand filtration is performed to retain smaller particles held in suspension. The pretreated water then converges with groundwater intake, and both are pumped into two independent treatment lines: one based on conventional processes of ozonization and filtration by granular activated carbon, and the other based on advanced treatments, namely, ultrafiltration, reverse osmosis and remineralization. The water from both lines is mixed in a chamber and stabilized, and then it is treated with chlorine (0.5–1.5 mg/L residual chlorine) in a separated tank before being pumped into the distribution network.
Eight sampling campaigns were carried out over one year, covering seasons of high and low temperatures and avoiding big rainfall episodes, as the aim was to determine bacterial populations under usual DWTP operative conditions.
A total of 72 water samples were collected at nine different stages of treatment of the DWTP (
Figure 1): river water (RW, n = 8) and groundwater (GW, n = 8) intake, decantation (DEC, n = 8), sand filtration (SF, n = 8), ozonization (OZ, n = 8), carbon filtration (CF, n = 8), reverse osmosis (RO, n = 8), mixed chamber (MIX, n = 8) and post-chlorinated water (DW, n = 8). Sampling sites were classified into two groups according to microbial load: river water and pretreatment stages (RW, DEC, SF) (high microbial load), and groundwater and conventional/advanced treatments (GW, OZ, CF, RO, MIX, DW) (lower microbial load). Sampling and processing conditions were different for each group, as described below.
For the first group (pretreatment stages), 2 L of water was collected in polyethylene sterile bottles with sodium thiosulfate (24 mg/L). For the second group (treatment stages), higher volumes were sampled (from 100 to 1100 L/sample) by dead-end hollow fiber ultrafiltration (DEUF) [
18,
19,
20] using Rexeed™ 25-A filters (Asahi Kasei Medical Co, Tokyo, Japan) of 30 KDa size exclusion. The sampling procedure took several hours (2 to 8.5 h). Chlorinated samples were pretreated with sodium thiosulfate (24 mg/L). All samples were transported to the laboratory at 4 °C for further analyses within 24 h.
Surface Water Contamination Episode and Changes in Operational Procedures
One additional sampling campaign was carried out during a contamination episode affecting the Llobregat River, which forced the DWTP to change its routine operational conditions. The contamination was due to the leakage of brine from a 120 km-long collector that runs parallel to the river and discharges brine produced by potash mining upstream into the sea (for more information about the collector, see Martin-Alonso [
27]). To prevent this pollution spill from entering the DWTP, the RW intake was stopped, and the DWTP continued operating only with GW, which does not undergo any of the pre-treatments. The water was treated with CF and chlorination but not with OZ, which was stopped to reduce subproduct bromate formation, nor with RO, as this process produces brine and is discharged into the same collector, which needed to be empty for the required repair. Sampling was carried out at two sites, GW (n = 1) and CF (n = 1), four days after the DWTP had changed to these operating conditions. Microbial water quality parameters were also analyzed.
2.2. Sample Processing and Nucleic Acid Extraction
For the first group (pretreatment stages), different volumes of water were filtered through 0.22 μm polycarbonate membranes (Millipore, Molsheim, Alsace, France): RW (250 mL), DEC (500 mL–750 mL) and SF (750 mL–1 L). Each filter was placed face down in a sterile flask containing 5 mL of Ringer’s solution 1:4 and was eluted by sonication (40 kHz) for 4 min in a Branson Ultrasonics CPX 3800 h ultrasonic water bath (Fischer Scientific, Madrid, Spain), keeping the sample on ice to avoid overheating, and then the sample was vortexed for 1 min. The resulting eluate (ca. 5 mL), containing biomass detached from the membrane, was used for genomic DNA extraction. The remaining original sample was used to determine culturable microbial indicators.
For the second group (treatment stages), water samples were concentrated by Rexeed filters and were eluted in the backflush mode using a peristaltic pump at 1 L/min and 500 mL of phosphate-buffered saline solution (0.5 mL of 1% Antifoam (Sigma-Aldrich, Saint Louis, MO, USA), 10% Tween 80 (Scharlab, Sentmenat, Barcelona, Spain) and 0.5 mL of 10% NaPP (Sigma-Aldrich, Saint Louis, MO, USA)). The Rexeed eluate volume of 500–650 mL was divided to be used for different purposes: a total of 120–170 mL was kept for the culture-based analysis, and the remaining volume (or until filter clogging) was further reduced by centrifugation at 3500× g using Centricon®70 plus (Merck, Darmstatd Germany) to a 2–4 mL concentrate for nucleic acid extraction.
DNA from samples was extracted using the automated MagNA Pure LC DNA Isolation Kit III (Bacteria, Fungi) (Roche Diagnostics GmbH, Mannheim, Germany), as described below. To obtain a maximum DNA yield, pre-isolation and external lysis steps were applied prior to extraction to reduce eluate volumes. Sample eluates (2 mL) were centrifuged for 10 min at 8000× g at 4 °C, and the supernatants were discarded. After the addition of a premixed lysis buffer (130 µL) (Roche Diagnostics GmbH, Germany) and proteinase K (20 µL) (Roche Diagnostics GmbH, Germany), the sample was incubated for 10 min at 65 °C. To enhance cell lysis and inactivate potentially pathogenic organisms in the sample, a boiling step was performed, in which the samples were heated at 95 °C for 10 min and then cooled on ice for 1 min.
For sample eluates with high viscosity or large pellets, additional steps were carried out, as recommended by the manufacturer. In summary, mechanical homogenization was performed to enhance lysis of bacterial cells, in which up to 0.40 g of 0.5 mm-diameter silica glass beads (Sigma-Aldrich, Saint Louis, MO, USA) were transferred to the sample tubes. Samples were homogenized by vortexing for 30 s and cooled for 1 min in a cooling block. The samples were then centrifuged for 5 min at 17,000× g, and the supernatant was placed in an Eppendorf tube to undergo the same pre-isolation steps as the other samples described above, except for the first centrifugation.
After the pre-isolation protocol, samples were transferred into the sample cartridge for automatic nucleic acid extraction. DNA quality was verified by visualization on 0.8% agarose electrophoresis gel, and the concentration was measured with a Qubit dsDNA HS Assay Kit on a Qubit 3.0 Fluorometer (Invitrogen, Waltham, MA, USA).
2.3. Microbial Water Quality Analysis
All samples were processed within 12 h of collection and were processed for microbial water quality according to the European Directive (EU) 2020/2184 [
28], which is based on the analysis of culturable bacterial indicators and heterotrophic bacteria.
The heterotrophic bacteria were cultured by mass inoculation according to the ISO Standard 6222:1999 [
29]. Different sample volumes (0.001–1 mL) were inoculated in duplicate in ISO Water Plate Count Agar (WPCA) (Oxoid, Basingstoke, UK) at 22 ± 2 °C for 72 h ± 3 h.
The enumeration of culturable total coliform bacteria and
E. coli based on the ISO Standard 9308-2:2012 [
30] was performed simultaneously using a Colilert 18
® test kit and a Quanti-Tray
®/2000 (Idexx, Westbrook, ME, USA) with 100 mL sample volumes. Only for river water, samples were diluted 1/10 and 1/100. After being transferred to the Quanti-Tray/2000 blister-pack, the samples were incubated at 36 ± 2 °C for 18 + 4 h.
Vegetative cells and spores of
Clostridium perfringens were enumerated using membrane filtration and an internal validation method based on UNE-EN ISO 7937 (2005) [
31] and UNE-EN 26461-2 (1995) [
32]. Different sample volumes (100, 10, 1 and 0.1 mL) were filtered through a 0.22 µm-pore-size mixed cellulose ester membrane filter (Millipore, Molsheim, France). The filter was placed face up on tryptose sulfite cycloserine agar (Oxoid, Basingstoke, UK), with D-Cycloserine selective supplement and 4-methylumbelliferylphosphate (Merck, Darmstadt, Germany), and it was anaerobically incubated at 44 ± 1 °C for 21 ± 3 h inside a jar with anaerobic gas generating sachets Genbox anaer (BioMérieux, Marcy l’Etoile, France) and an Anaerotest™ anaerobic indicator strip (Merk, Darmstadt, Germany). To enumerate
C. perfringens, plates were examined under long-wave UV light, and those presenting fluorescence were counted as positive results.
The detection and enumeration of intestinal enterococci were carried out using a membrane filtration method based on the ISO Standard 7899-2:2000 [
33]. Serial dilutions of water samples (100, 10, 1 and 0.1 mL) were filtered through a 0.45 µm-pore-size mixed cellulose ester filter (Millipore, Darmstadt, Germany). The filter was placed on Slanetz and Bartley agar (Merck, Darmstadt, Germany) and incubated at 36 °C ± 2 °C for 44 ± 4 h. Colonies with red pigmentation were considered presumptive and were confirmed as intestinal enterococci if they turned brown or black after incubation at 44 °C for 4 h on bile esculin azide agar (Merck, Darmstadt, Germany).
Somatic coliphages (SOMCPH) were concentrated and enumerated by a double-layer agar method adapted from ISO 10705-2:2000 [
34] and ISO 10705-3:2003 [
35,
36]. Samples were processed by direct inoculation or membrane filtration depending on the matrix. For RW samples, 0.1 mL and 1 mL were analyzed by direct inoculation. For the first group of samples (pretreatment stages), membrane filtration of 500–1000 mL was needed, whereas for the second group (GW and treatment stages), volumes ranging from 6 to 10 mL were processed by direct inoculation, as they corresponded to eluates concentrated by Rexeed.
2.4. Physicochemical and Climatological Data
A range of physicochemical data was measured in situ during sampling: sample temperature (°C), conductivity (µs/cm), turbidity (NTU), pH, ammonium (mg NH4+/L), total organic carbon (TOC: mg C/L), percentages of RW and GW intake, river flow rate (m3/s) and residual amounts of the disinfectants chlorine dioxide, ozone and chlorine (ppm).
Climatological data were also recorded in the Sant Joan Despí DWTP meteorological station and retrieved from the Meteorological Service of Catalonia, including temperature (°C), relative humidity (%) and rainfall (mm/24 h).
2.5. Metabarcoding by 16S rRNA Gene Amplicon Sequencing
To characterize bacterial diversity in the water ecosystem, metabarcoding was performed by paired-end amplicon sequencing. Two-run metabarcoding was applied to a total of 104 samples: 72 DWTP samples, 2 event samples, 8 additional samples used to check reproducibility between the different runs, 16 whole-procedure blanks (from each sampling to sequencing), 4 negative controls (from PCR to sequencing), and 2 positive controls (ZymoBIOMICS™ microbial community DNA standard (mock community) (Zymo research, Irvine, CA, USA)). A total of 6 DWTP samples were removed from the dataset, as they presented low reads and were sequenced in a third run.
2.5.1. PCR Amplification of DNA
The 16S rRNA V4 genomic region was amplified by PCR using barcoded primers 515F and 806R [
37]. A detailed list containing the sequences of primers, sample barcodes and leading Ns can be found in
Table S1. For all samples (5–10 ng total DNA), PCR was performed using 10 µL of AmpliTAQ gold 360 Master Mix (Applied Biosystems, Bedford, MA, USA), 0.16 µL of bovine serum albumin, 1.84 or 5.84 µL of nuclease-free water, 2 µL of primer mix (4 µL of each 5 μM forward and reverse primer and 72 µL water) and 2 or 6 µL of sample-extracted DNA in a total volume of 20 µL per sample. PCR cycling conditions followed the protocol of Caporaso [
37]. Briefly, the reaction started with a denaturation procedure held at 95 °C for 3 min. Then, 35 amplification cycles were set at 94 °C for 45 s, 50 °C for 60 s and 72 °C for 90 s. A final extension of 10 min at 72 °C was added. All samples were run with negative and positive controls of PCR blanks and mock communities, respectively. The PCR products were checked by visualization on 1% agarose gel containing purple 6x loading dye and by a reference 1 Kb DNA extension ladder marker (Invitrogen, Waltham, MA, USA).
2.5.2. Amplicon Multiplexing, Library Preparation and Illumina Sequencing
Multiplexing of samples was performed by pooling 10 µL of each barcoded amplicon. Library preparation consisted of PCR amplicon clean-up by the MinElute PCR Purification Kit (Qiagen, Hilden, Germany), and DNA quantification consisted of purified PCR products by the Qubit dsDNA BR Assay Kit (Invitrogen, Waltham, MA, USA). The DNA PCR-free protocol was used to prepare a multiplexed paired-end library for Illumina sequencing by the NEXTflex PCR-Free DNA Sequencing Kit (Bioo Scientific, Austin, TX, USA). The library was quantified by qPCR using the NEBNext Library Quant Kit (Illumina, San Diego, CA, USA), and the NEBioCalculator web tool was used for qPCR NGS library quantification (
https://nebiocalculator.neb.com/, accessed on 26 July 2019) to achieve optimal cluster densities and therefore an optimal sequence output. Multiplexed libraries with barcoded samples were spiked with 1% bacteriophage PhiX genome (PhiXControl Library; Illumina, San Diego, CA, USA) and were sequenced by the Illumina Miseq platform using the 600-cycle 2 × 300 bp paired-end sequencing MiSeq Reagent Kit v3 (Illumina, San Diego, CA, USA) with a loading concentration of 20 pM.
2.5.3. Bioinformatic Analyses
The resulting FASTQ files were checked for quality (>90% of bases with a Phred quality score >Q30), processed and analyzed using Cutadapt [
38], DADA 2 [
39], QIIME2 [
40] and Phyloseq [
41] pipelines. Cutadapt was used to demultiplex samples (assign sequences to their sample) and to trim adapters, primers, barcodes and leading Ns from sequencing reads. A DADA 2 workflow was performed to denoise the sequences.
Firstly, quality filtering and the trimming of sequences was set to 200 bp (for forward reads) and 190 bp (for reverse reads) with a maximum number of expected errors allowed per read set at 1 (EE = 1). Then, samples with zero reads and low-quality sequences were deleted. Filtered sequences were dereplicated, the forward and reverse reads were aligned and merged, chimeras were removed and an amplicon sequence variant (ASV) table was obtained. Taxonomy was assigned to the resulting sequence variants with a pre-trained Naive Bayes classifier [
42] using the SILVA SSU 138 reference database and was imported to the phyloseq R package for microbiome analyses.
To obtain more accurate profiling of microbial communities, the decontam R package [
43] was used to remove sequences derived from contaminating DNA present in extraction or sequencing reagents that may interfere with samples.
2.6. Data Analyses
Statistical analyses were performed using the statistical software R version 4.0.5 (
https://www.r-project.org, accessed on November 2021). For water quality, data were log
10(x + 1) transformed, and the Kruskal–Wallis test was used to assess differences in culturable and molecular parameters throughout the DWTP.
The phyloseq package [
41] was used to analyze and visualize sequencing data.
Biodiversity was evaluated by analyzing the relative abundance of reads with the vegan package. Chao1 and Shannon indices were used to study alpha diversity. Beta diversity was also explored, representing sample groups (treatment stages) in a non-metric multidimensional scaling (NMDS) matrix by Bray–Curtis dissimilarities. Temperature impact was measured with both alpha (Pearson correlation) and beta diversity (PERMANOVA analysis). SIMPER analyses were also performed by the vegan package to identify which amplicon sequence variants contributed most to the differences between the DWTP stages. SourceTracker2 [
44] was used to estimate the influence of the water source and treatment stages on the bacterial communities downstream.
3. Results
3.1. Sample Collection, and Physicochemical and Climatological Data
Climatological data as well as basic DWTP operating conditions are summarized in
Table S2. Temperatures ranged from 11.5 to 29.5 °C, and humidity ranged from 44 to 71%. Episodes of rainfall 24 h before sampling were reported in 2 out of 8 samplings (N1 and N8), but the amounts were small (0.4 and 2.9 mm, respectively). When moderate or heavy rainfall occurred, sampling was postponed to avoid large weather-induced differences between samples. River flow rate ranged between 5.39 and 135 m
3/s.
Some operational data were also measured: the percentage of RW or GW intake and the percentage of water processed by conventional or advanced treatments (
Table S2). In 2 out of 8 samplings, RW accounted for almost 100% of water intake for the treatment procedure, whereas both RW and GW were used for the rest of the sampling.
Physicochemical data recorded for samples are synthesized in
Table S3. Regarding temperature, RW was more variable than GW, averaging at 15 °C (5.6–23.4 °C). In contrast, GW presented a more stable temperature throughout the sampling campaign, with an average of 18 °C (16.1–20.2 °C). The average temperature of the final drinking water was 18 °C (8.5–25.3 °C).
3.2. Culturable Water Quality Indicators
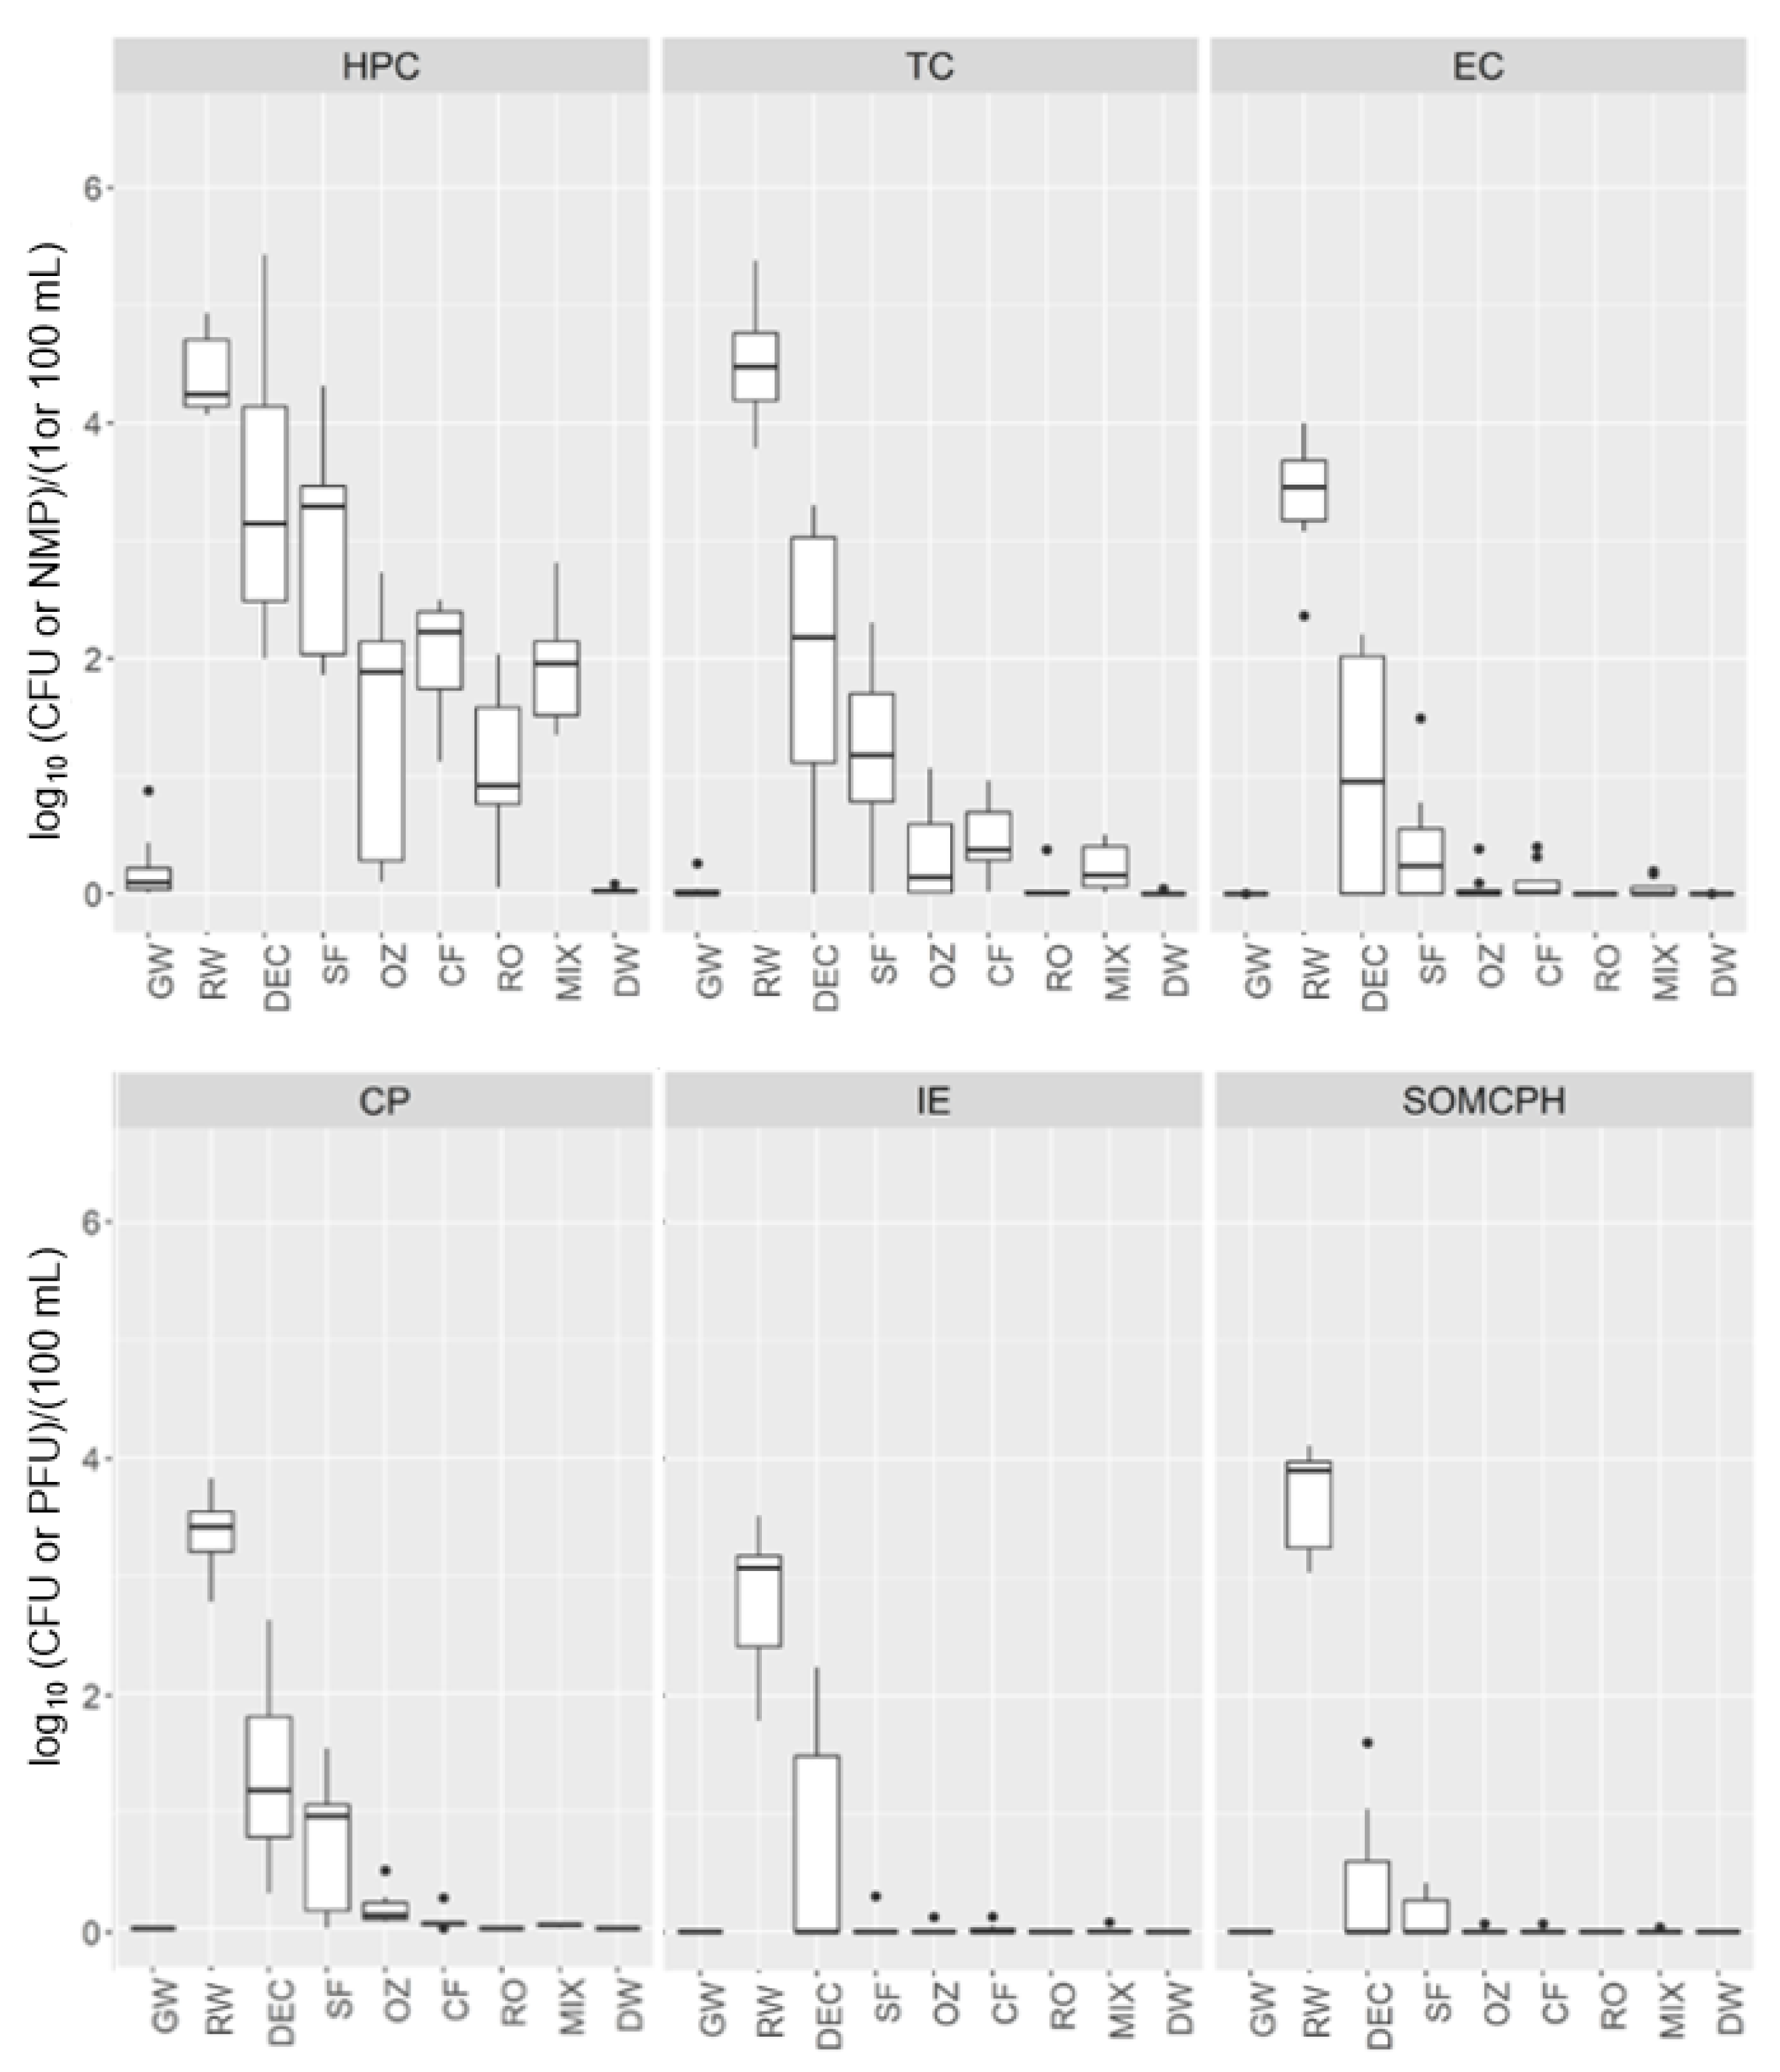
The quality of all water samples taken from the DWTP was examined by determining culturable fecal indicators, as shown in
Figure 2. The data obtained follow a non-normal distribution, and the water quality varied at each sampling point. The Kruskal–Wallis test was significant for each culturable indicator at all DWTP stages (
p < 0.00001).
RW samples had the highest concentration of bacterial indicators (average CFU/100 mL or NMP/100 mL: 3 log10 intestinal enterococci (IE), 3.5 log10 Clostridium perfringens (CP), 3.6 log10 E. coli (EC) and 4.7 log10 total coliforms (TC)), as well as the highest concentration of viral indicator somatic coliphages (SOMCPH; average 3.8 log10 PFU/100 mL) and HPC (average 4.5 log10 CFU/mL), whereas for GW, all water quality parameters were negative except for the HPC, with very few colonies (<7 CFU/mL) observed in some samples.
The dynamics of microbial indicators varied throughout DWTP processing. Samples from the pretreatment stages had a high HPC, especially at DEC (average 4.58 log10 CFU/mL), being similar to those of the RW intake. After the SF stage, the HPC was reduced by an average of 1 log with respect to the DEC stage. Subsequently, a 2 and 3 log reduction in HPC was observed after the conventional and advanced treatments, respectively.
In addition, DEC and SF samples presented a 2 and 3 log reduction in TC, EC and CP, a 1.5 and 4 log reduction in IE and a 3 and 4 log reduction in SOMCPH, respectively. However, although TC decreased after DEC and SF and were further reduced by CF, their complete removal required RO. Thus, TC reduction was 4 log by conventional treatment and 5 log by advanced processing. The same trends were observed for the other indicators (EC, CP and IE), with 4 log reductions achieved by conventional treatment and 5 to 6 log removal by advanced treatment.
In the MIX samples, the HPC was similar to that of CF (~2 log10 CFU/mL); TC levels were very low, ranging from 0.03 to 2.2 NMP/100 mL; and IE was detected in one sample (0.2 CFU/100 mL).
The DEUF method revealed the presence of microbial indicators below the detection limit of the standard ISO methods (<1 CFU/100 mL), thereby allowing a more accurate determination of the efficiency of the different treatments. Thus, positive results for C. perfringens were obtained until CF, whereas TC, EC, IE and SOMCPH were detected further downstream until the MIX, with negative results in the post-chlorination water. All microbial indicators after chlorination were below the limits established by European drinking water regulations, with the HPC revealing no or very few colonies (<0.2 CFU/mL).
3.3. Metabarcoding
An overview of the metabarcoding results according to sequencing depth and diversity at all treatment stages is shown in
Table 1.
After carrying out quality filtering, the 16S dataset of all DWTP samples comprised a total of 9,995,538 reads with an average of ~138,826 reads per sample (ranging from 40,959 to 274,999 reads). Negative controls ranged from 1627 to 6627 reads. Overall, the number of ASVs obtained by denoising was 10,039.
3.4. Diversity Analysis
The microbial diversity of the 72 water samples was investigated by ASV analysis. After rarefaction at the minimum number of reads obtained in the dataset (40,959), alpha and beta diversity were studied. The rarefaction curves show that all samples reached a plateau, suggesting good representation of bacterial communities (
Figure S1).
3.4.1. Alpha Diversity Patterns
Species richness and diversity were examined by analyzing the average relative abundances of ASVs using the species richness estimate (Chao1) and the Shannon diversity index for each sample (
Table 1 and
Figure 3). Different trends in richness and diversity were observed according to the processing stage of the DWTP.
The Chao index was higher for GW (731) than for RW (525). In pretreatment, a decrease in richness was observed at DEC (448), followed by a slight increase after SF (561). During the conventional treatment, a decrease was observed after OZ (378), followed by a huge increase after the subsequent CF (691), which produced the second highest richness value overall. In the advanced treatment, RO led to a considerable reduction in richness, producing the third lowest value (432). In the mixing chamber, richness increased again (583), only to be significantly reduced by the final chlorination (314). Thus, the lowest number of ASVs were obtained after OZ and in the final drinking water, whereas the highest number of reads corresponding to different ASVs within samples were found in GW, in CF and in the MIX.
Shannon indices reveal high diversity in all DWTP samples, with the values ranging from 3.3 to 5.2, showing a similar trend to that of the Chao index, with only minor differences at certain stages. Although diversity was slightly higher in GW (5.17) than in RW (4.65), the difference is not statistically significant (p = 0.67). After DEC (4.07), diversity values significantly reduced (p < 0.01) and remained the same after SF (4.19). In the conventional treatment, OZ led to a small reduction in diversity (3.66), which then increased significantly (p < 0.01) after CF (4.87). Similar values were obtained between RO (4.32) and SF samples as well as between MIX (4.8) and CF samples. Regarding species richness, chlorination drastically reduced diversity (3.34, p = 0.0001). Thus, the lowest diversity values, indicating a more uniform species composition, were obtained after OZ and in the final drinking water, whereas the GW samples, followed by CF and MIX samples, had the highest values.
Alpha diversity was also analyzed by the Kendal correlation between the relative abundance of each ASV, and no significant correlation was found.
3.4.2. Beta Diversity Patterns
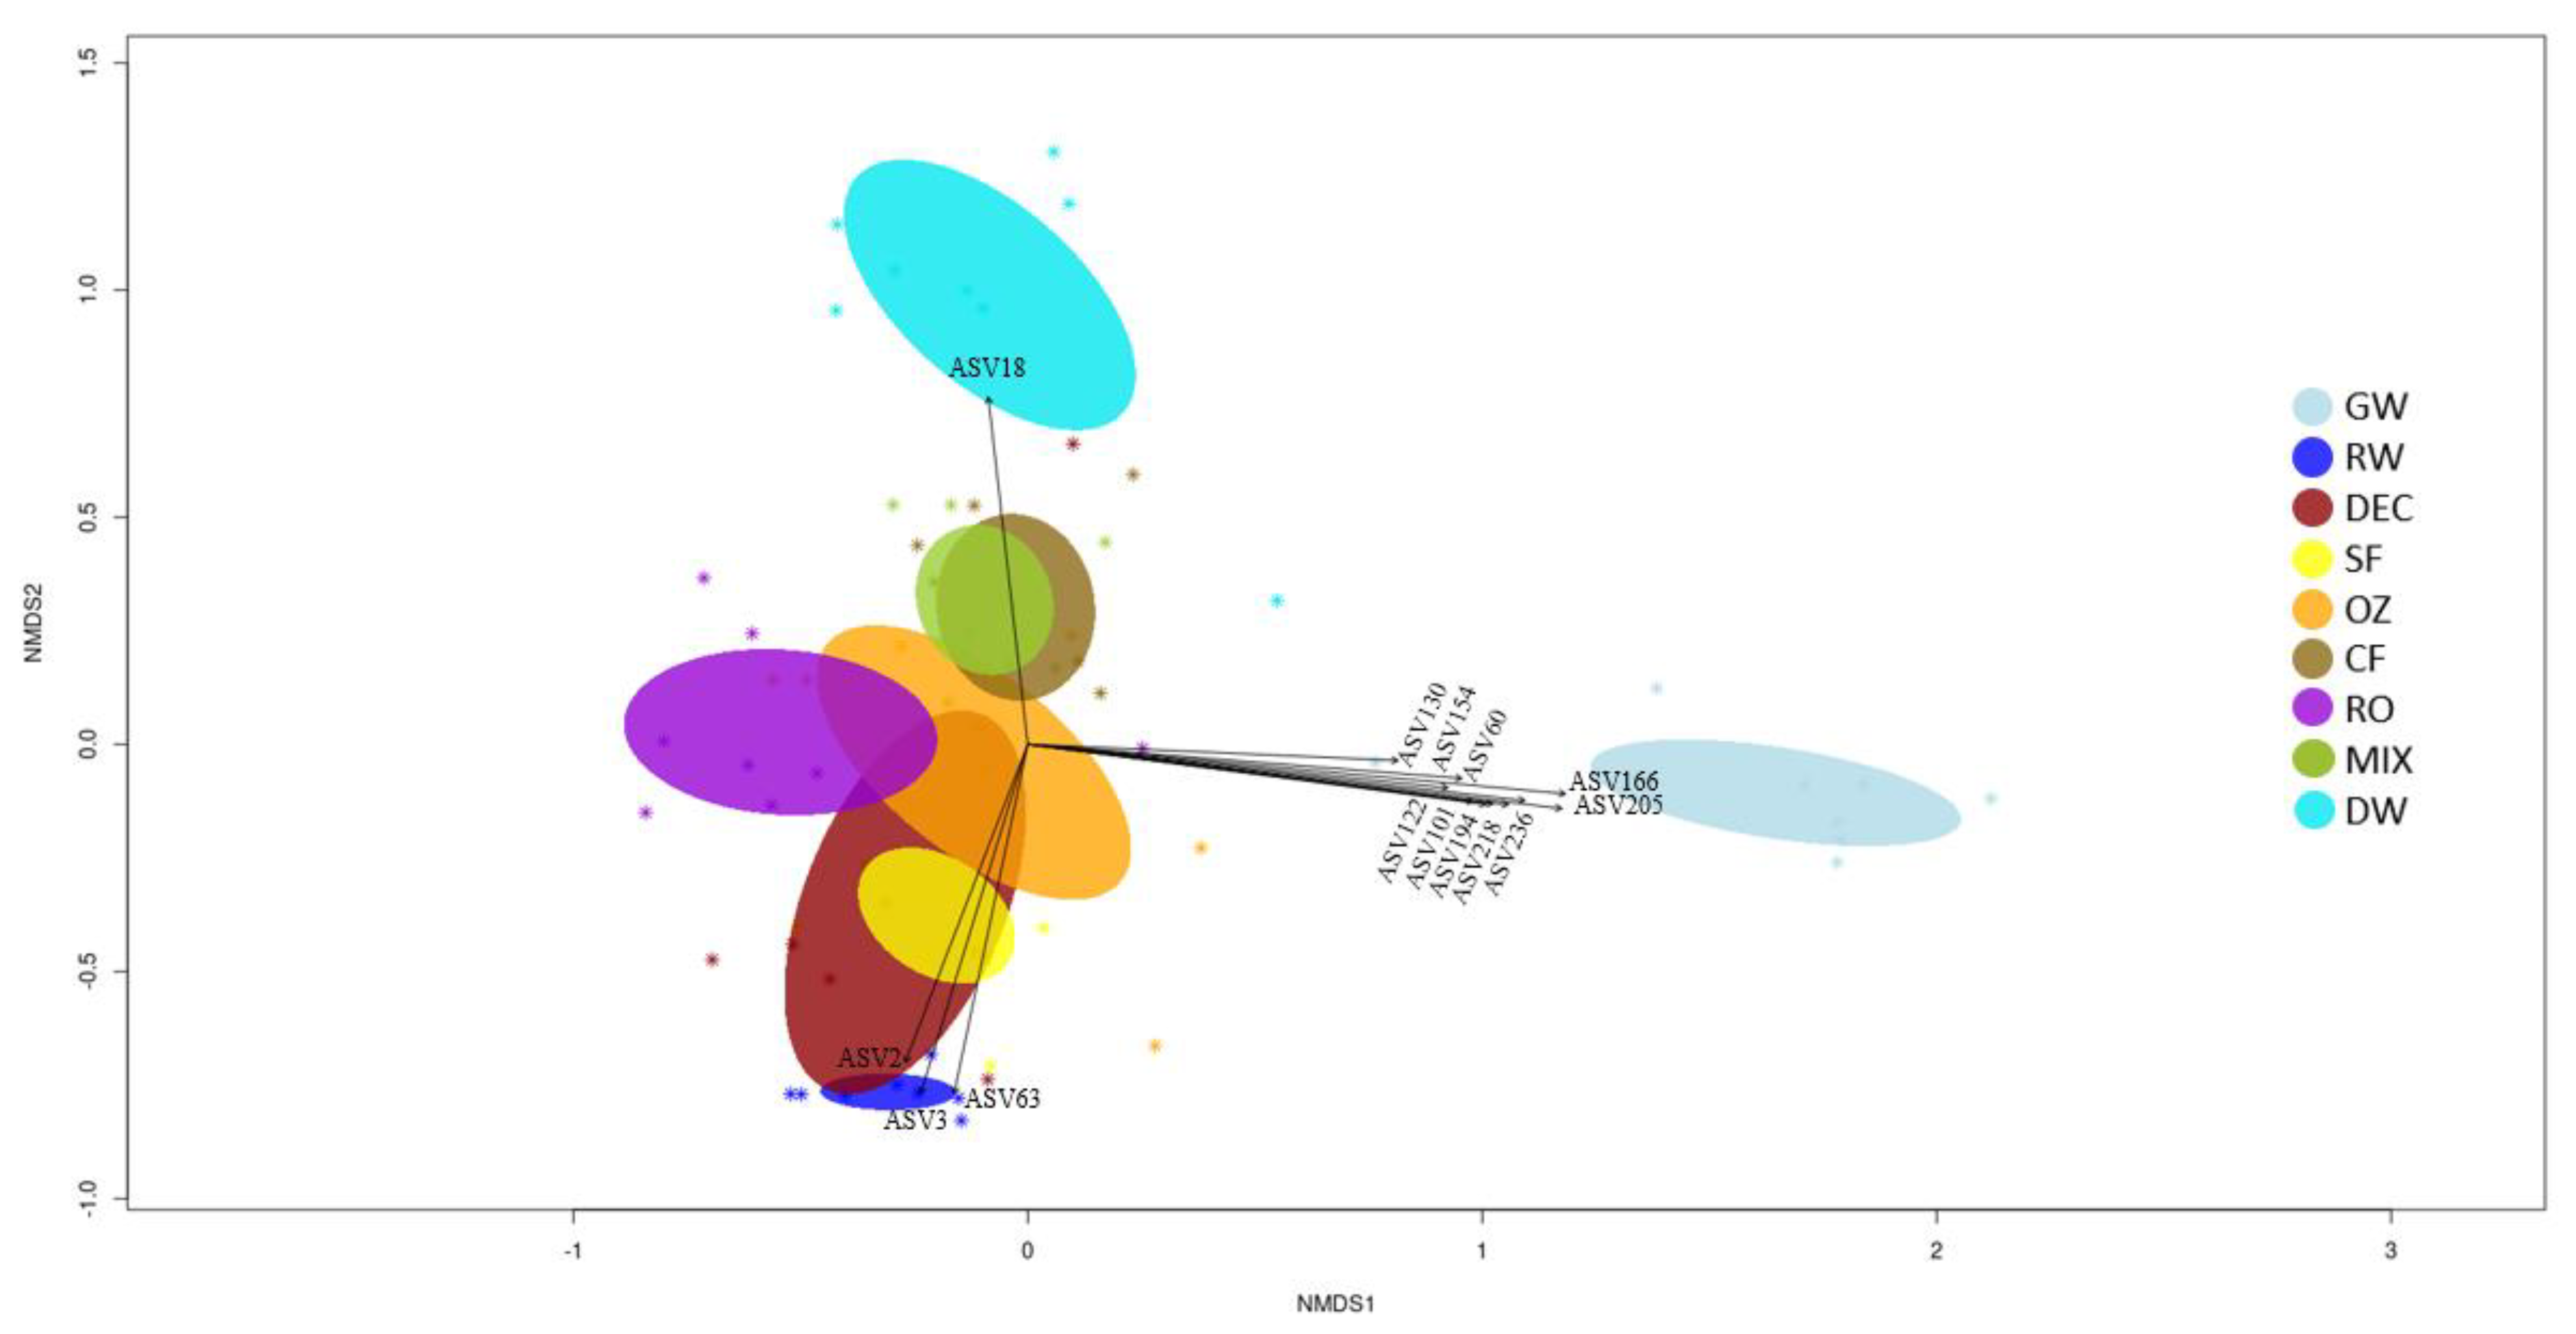
To explore differences in the bacterial community between different steps of the potabilization process, non-metric multidimensional scaling (NMDS) plots were constructed using the Bray–Curtis coefficient of sequencing results. Samples are represented, and ellipses indicate standard deviation of within-sample variance (
Figure 4). All the eight samplings corresponding to the same matrices cluster together, although with a certain dispersion. GW and RW intakes are clearly separated along the second axis, and both are also separated from DW along the first and second axis. One of the GW samples (N4) is separate from the others, corresponding to a period when the DWTP was operating with 100% RW (as shown in
Table 1).
A partial overlap between ellipses appears for pretreatment stages and for conventional (OZ, CF) and advanced treatments (RO), and an overlap can be observed between SF and DEC samples and between FC and MIX samples.
The ten most abundant ASVs (
p < 0.001) in DWTP samples at each treatment stage were vectorized into the Bray–Curtis nMDS representation (
Figure 4). Samples of GW, RW and DW are clearly separated from these stages.
Significant vectors that separate GW samples along the first axis correspond to Planctomycetota [ASV60 (Candidatus Brocardia), ASV130 and ASV154 (GWA2-50-13 family)], Patescibacteria [ASV218 (UBA9983 order) and ASV236 (Candidatus Giovannonibacteria order)], Verrucomicrobiota [ASV101, ASV122 and ASV194 (Candidatus Omnitrophus)] and unclassified others [ASV166 (unclassified bacteria) and ASV205 (unclassified Myxococcota)]. Along the second axis, it can be seen that ASV18 was influential for the chlorinated samples (DW), and ASV2, ASV3 and ASV63 best describe RW intake. RW was mainly represented by Proteobacteria (unclassified Comamonadaceae family and Limnohabitans,) and Bacteroidota (Flavobacterium), whereas Cyanobacteria (Candidatus Obscuribacter) particularly defined the chlorinated samples.
3.4.3. Bacterial Communities at Each Treatment Stage
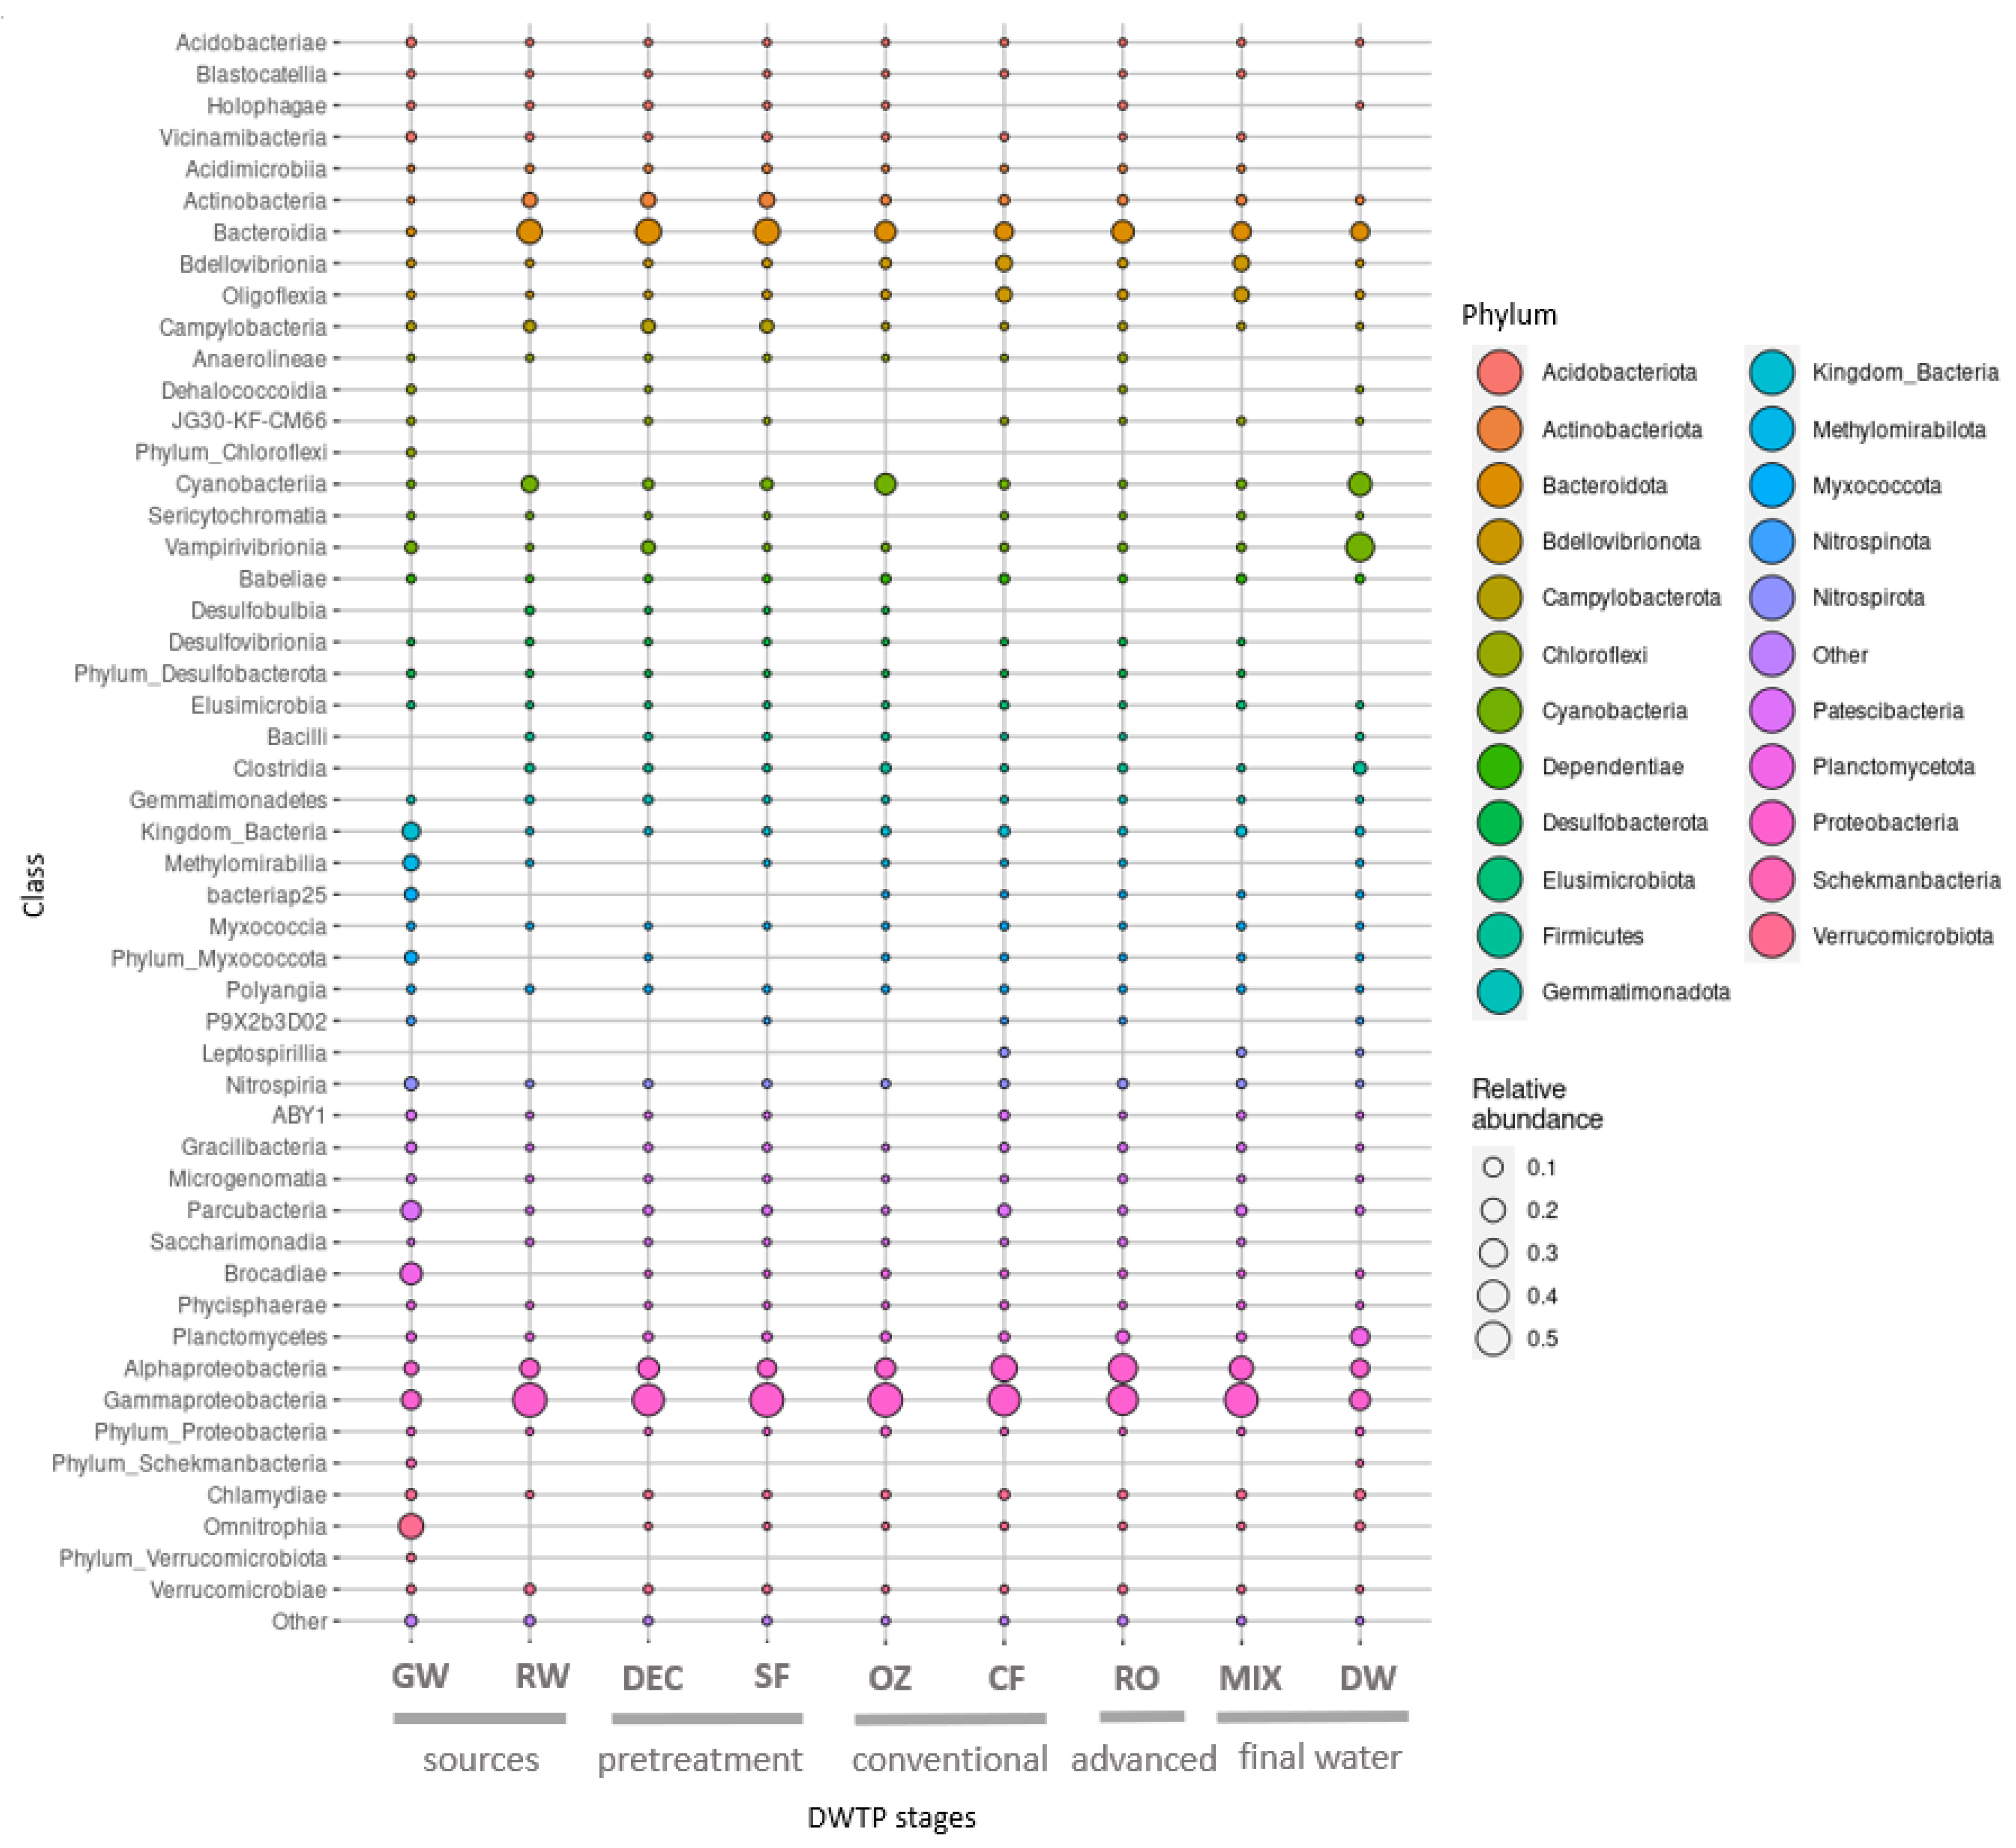
The samples from water sources and treatments presented variable taxonomic profiles, although some consistencies in taxa were observed throughout the DWTP. The taxonomy results at the DWTP based on the relative abundance of reads on a phylum and class level are shown in
Figure 5.
The most abundant phylum throughout the DWTP was Proteobacteria (ranging from 57% to 73%), except in the final post-chlorination drinking water (21%). Bacteroidota (0.8–27%) and Bdellovibrionota (1–12%) were the second and third most abundant phyla at all stages.
Among Proteobacteria, the class Gammaproteobacteria predominated throughout the DWTP, and Alphaproteobacteria increased after DEC, CF, RO and the MIX. Bacteroidia was the second most dominant class in RW and pretreatment samples, undergoing a reduction downstream. The most abundant Proteobacteria genus corresponded to Limnohabitans.
For a more detailed taxonomy for all samples at different hierarchy levels, see the Krona diagrams in
Figure S2.
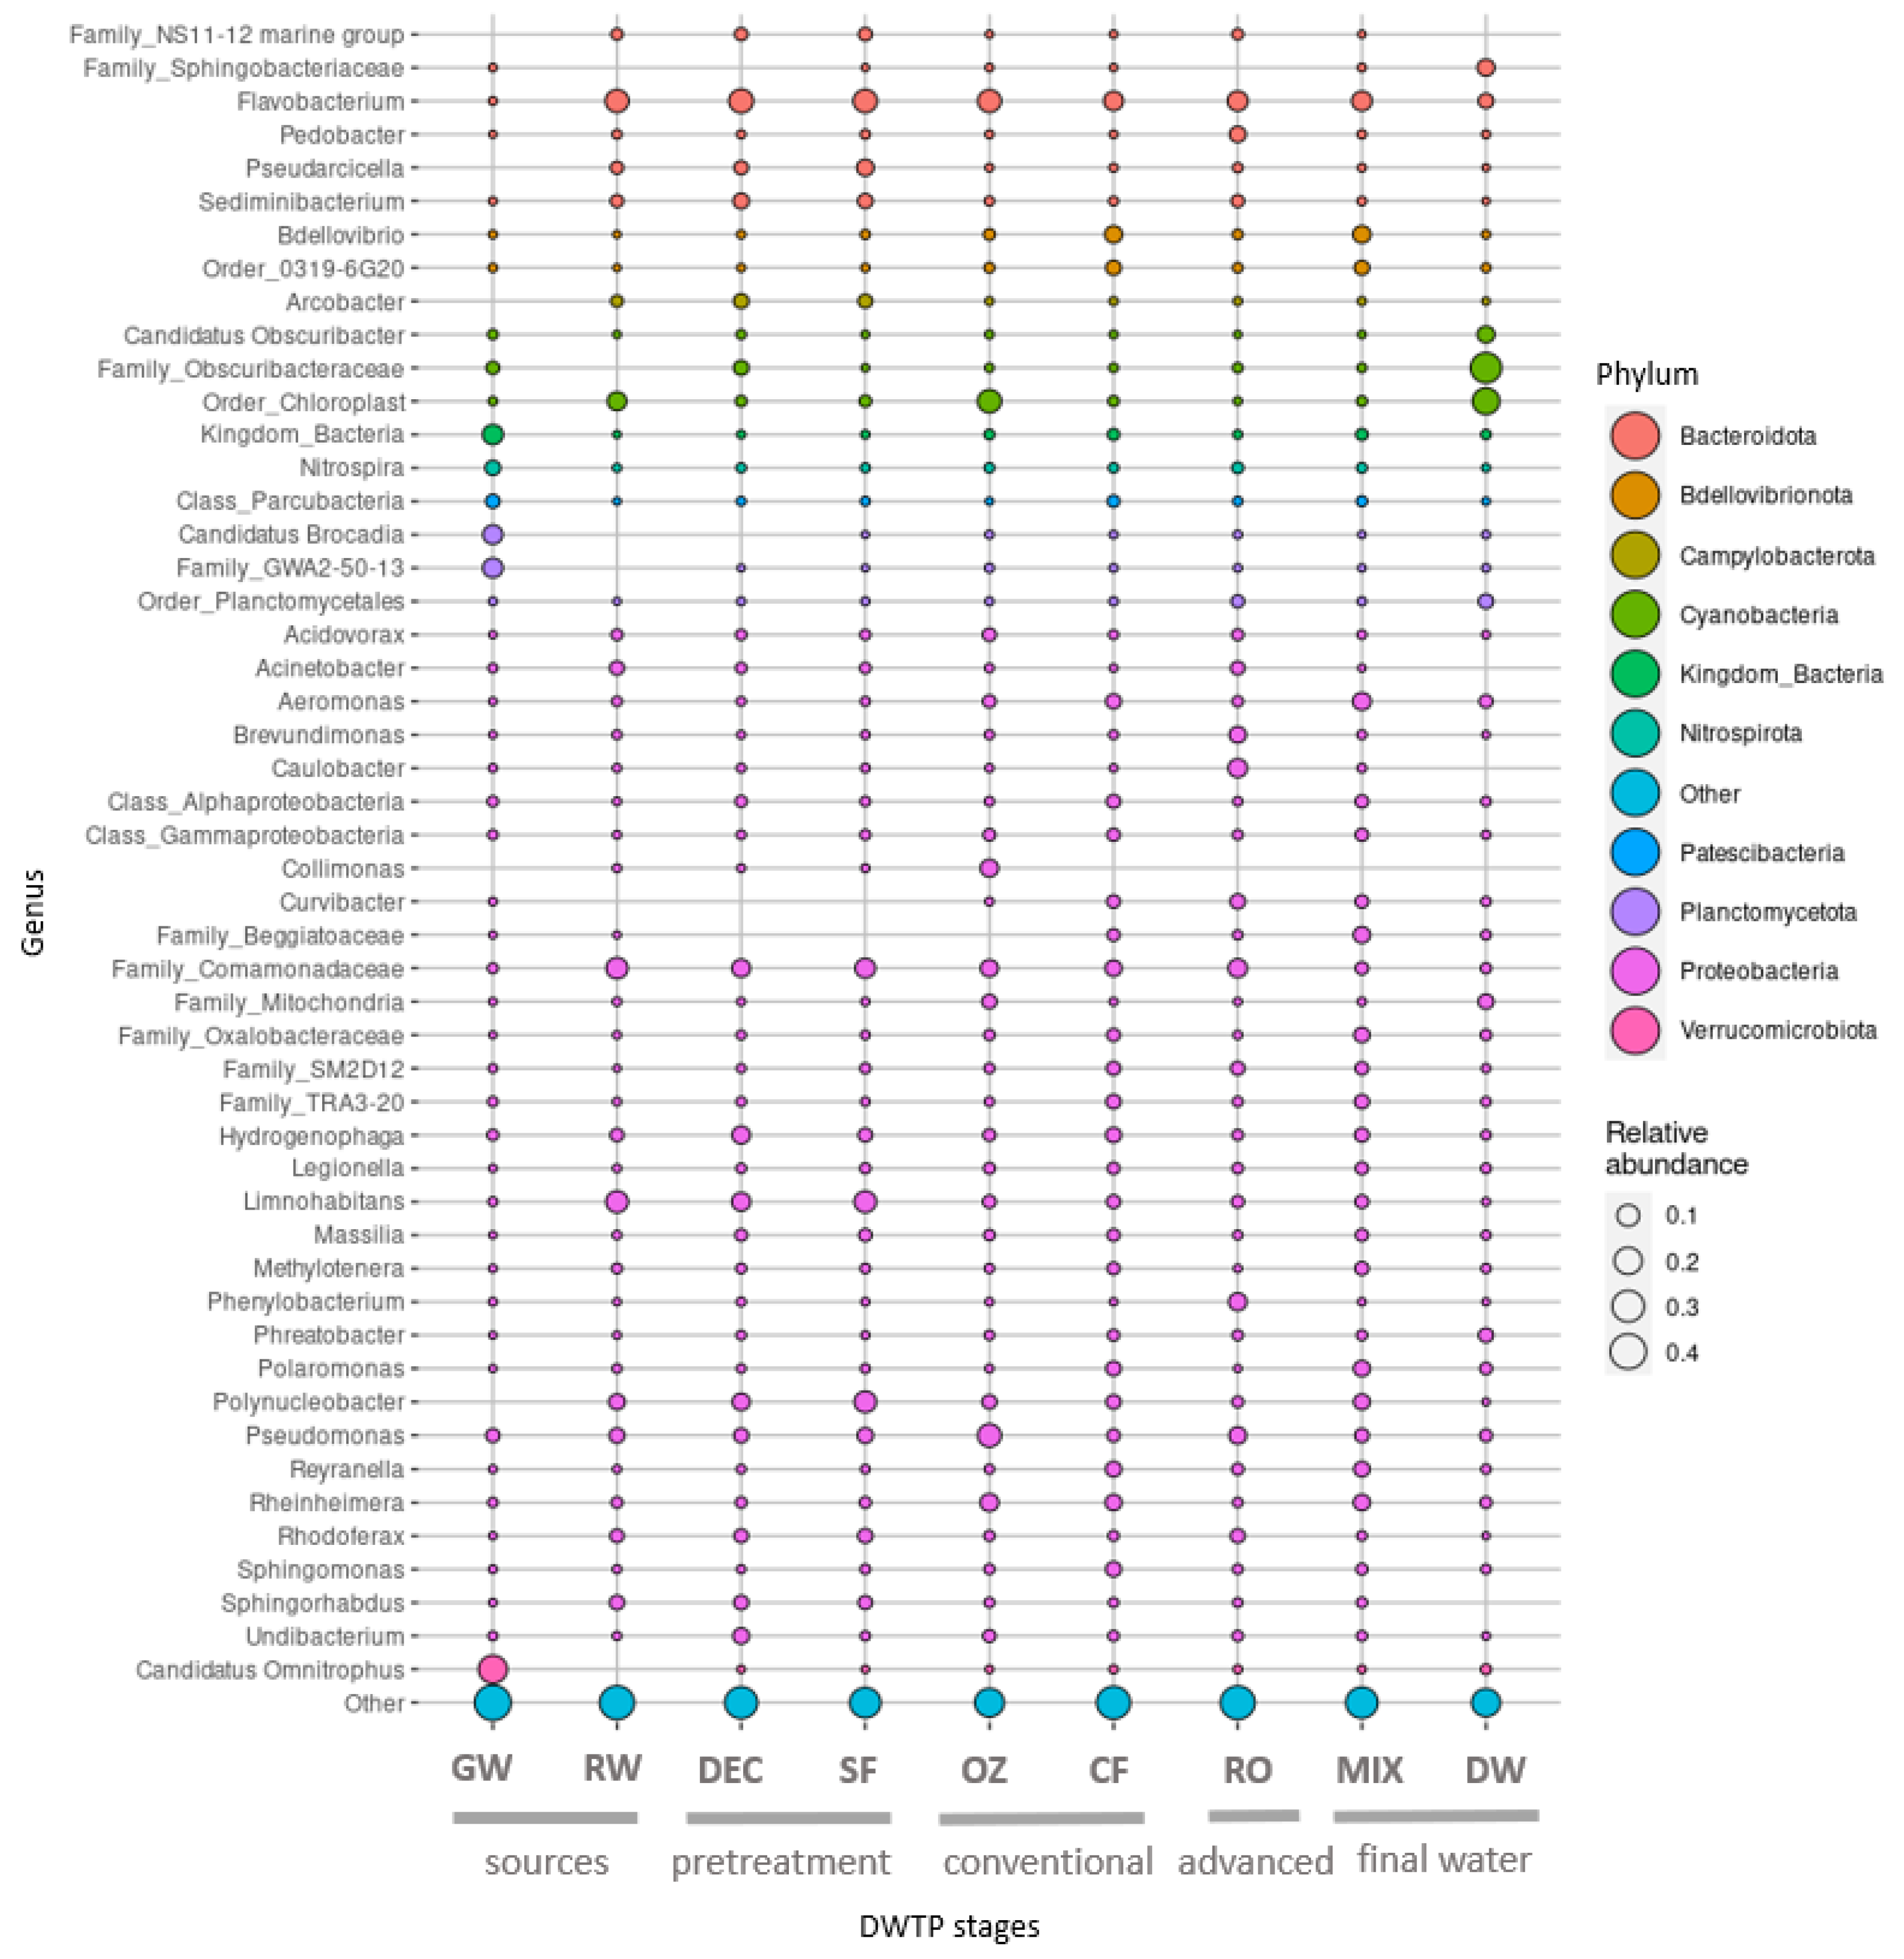
The top 50 ASVs correspond to approximately 41% of the total microbial composition in all the DWTP samples and belong to a total of 33 genera.
Taxonomy profiles of the two different water sources differed considerably in terms of phyla. Although the GW community showed higher phyla variability, ASVs were mainly affiliated to Verrucomicrobiota (25%), Planctomycetota (17%), Patescibacteria (15%) and Proteobacteria (14%). These were followed by unclassified bacteria (8%) and Methylomirabilota (5%), among others, and Candidatus Omnitrophus (23%) was the most abundant genus. In RW, Proteobacteria predominated (63%), followed by Bacteroidota (21%), Cyanobacteria (6%) and Actinobacteriota (5%), and the most abundant genera were
Limnohabitans (12%) and
Flavobacterium (11%) (
Figure 6).
In pretreatment, profiles of phylum, class and genus were similar between DEC and SF samples, and the most abundant genera were Limnohabitans (7% and 10%, respectively) and Flavobacterium (14% and 15%, respectively). These genera were also dominant in RW.
In the conventional treatment, the first significant shift in bacterial distribution was observed after OZ, which resulted in a clear increase in Cyanobacteria (19%) and a slight decrease in Bacteroidota (11%), and the community remained dominated by Proteobacteria (63%). A reduction in Campylobacteriota (0.09%) and Actinobacteriota (0.8%) was also apparent. The most abundant genera were Flavobacterium (9%), Collimonas (8%) and Pseudomonas (8%), although a higher number of reads were affiliated to an unclassified Chloroplast order (18%). In the following CF step, Proteobacteria and Bacteroidota remained largely unchanged. However, Cyanobacteria (1%) abundance was lower, and Bdellovibrionota (11%) was higher. The reads corresponded, above all, to Proteobacteria (70%), Bdellovibrionota (10%) and Bacteroidota (9%). The genera Flavobacterium (7%), Bdellovibrio (5%), Rheinheimera (4%), Aeromonas (3%) and Pseudomonas (2%) were the most abundant.
After RO, the proportion of Proteobacteria (73%) was higher compared to SF and GW samples, whereas Bacteroidota abundance (16%) was higher than in GW but lower than in SF. Abundance of Patescibateria (1%), Plactomycetota (3%) and Verrucomicrobiota (1%) was lower than in GW but was similar to SF samples. Flavobacterium (8%), Caulobacter (7%), unculturable Comamonadaceae (7%) and Pseudomonas (5%) were the most common genera found.
In the MIX, where the conventional and advanced treatments converge, the taxonomy patterns were very similar to CF samples, with Proteobacteria (69%), Bacteroidota (12%) and Bdellovibrionota (12%) predominating. The most abundant genera were Flavobacterium (7%) and Bdellovibrio (6%), and Legionella was also found (2%).
Finally, the biggest shift in bacterial composition was observed in DW, where the predominant phylum was Cyanobacteria (56%). Notable proportions of Proteobacteria (21%) and Bacteroidota (8%) were also found, but the former was much less abundant than in the MIX. Firmicutes (3%) increased 100-fold, whereas the dominant genera belonged to the family Obscuribacteraceae (31%) and an unclassified Chloroplast order (20%).
3.5. Core Bacterial Communities at the DWTP
Taxa shared across the different samples were identified to determine the core communities in the DWTP and at each treatment stage. Although no ASVs were shared among all samples at all sampling sites, different core ASVs were found at each treatment stage, as shown in
Table 1. Very few core ASVs were detected in samples of DEC and OZ (3 out of 2244 and 4 out of 1942, respectively), corresponding to the genera
Limnohabitans, Porphyrobacter and
Sediminibacterium in DEC samples and
Aeromonas,
Polynucleobacter,
Porphyrobacter and
Sphingorhabdus in OZ samples.
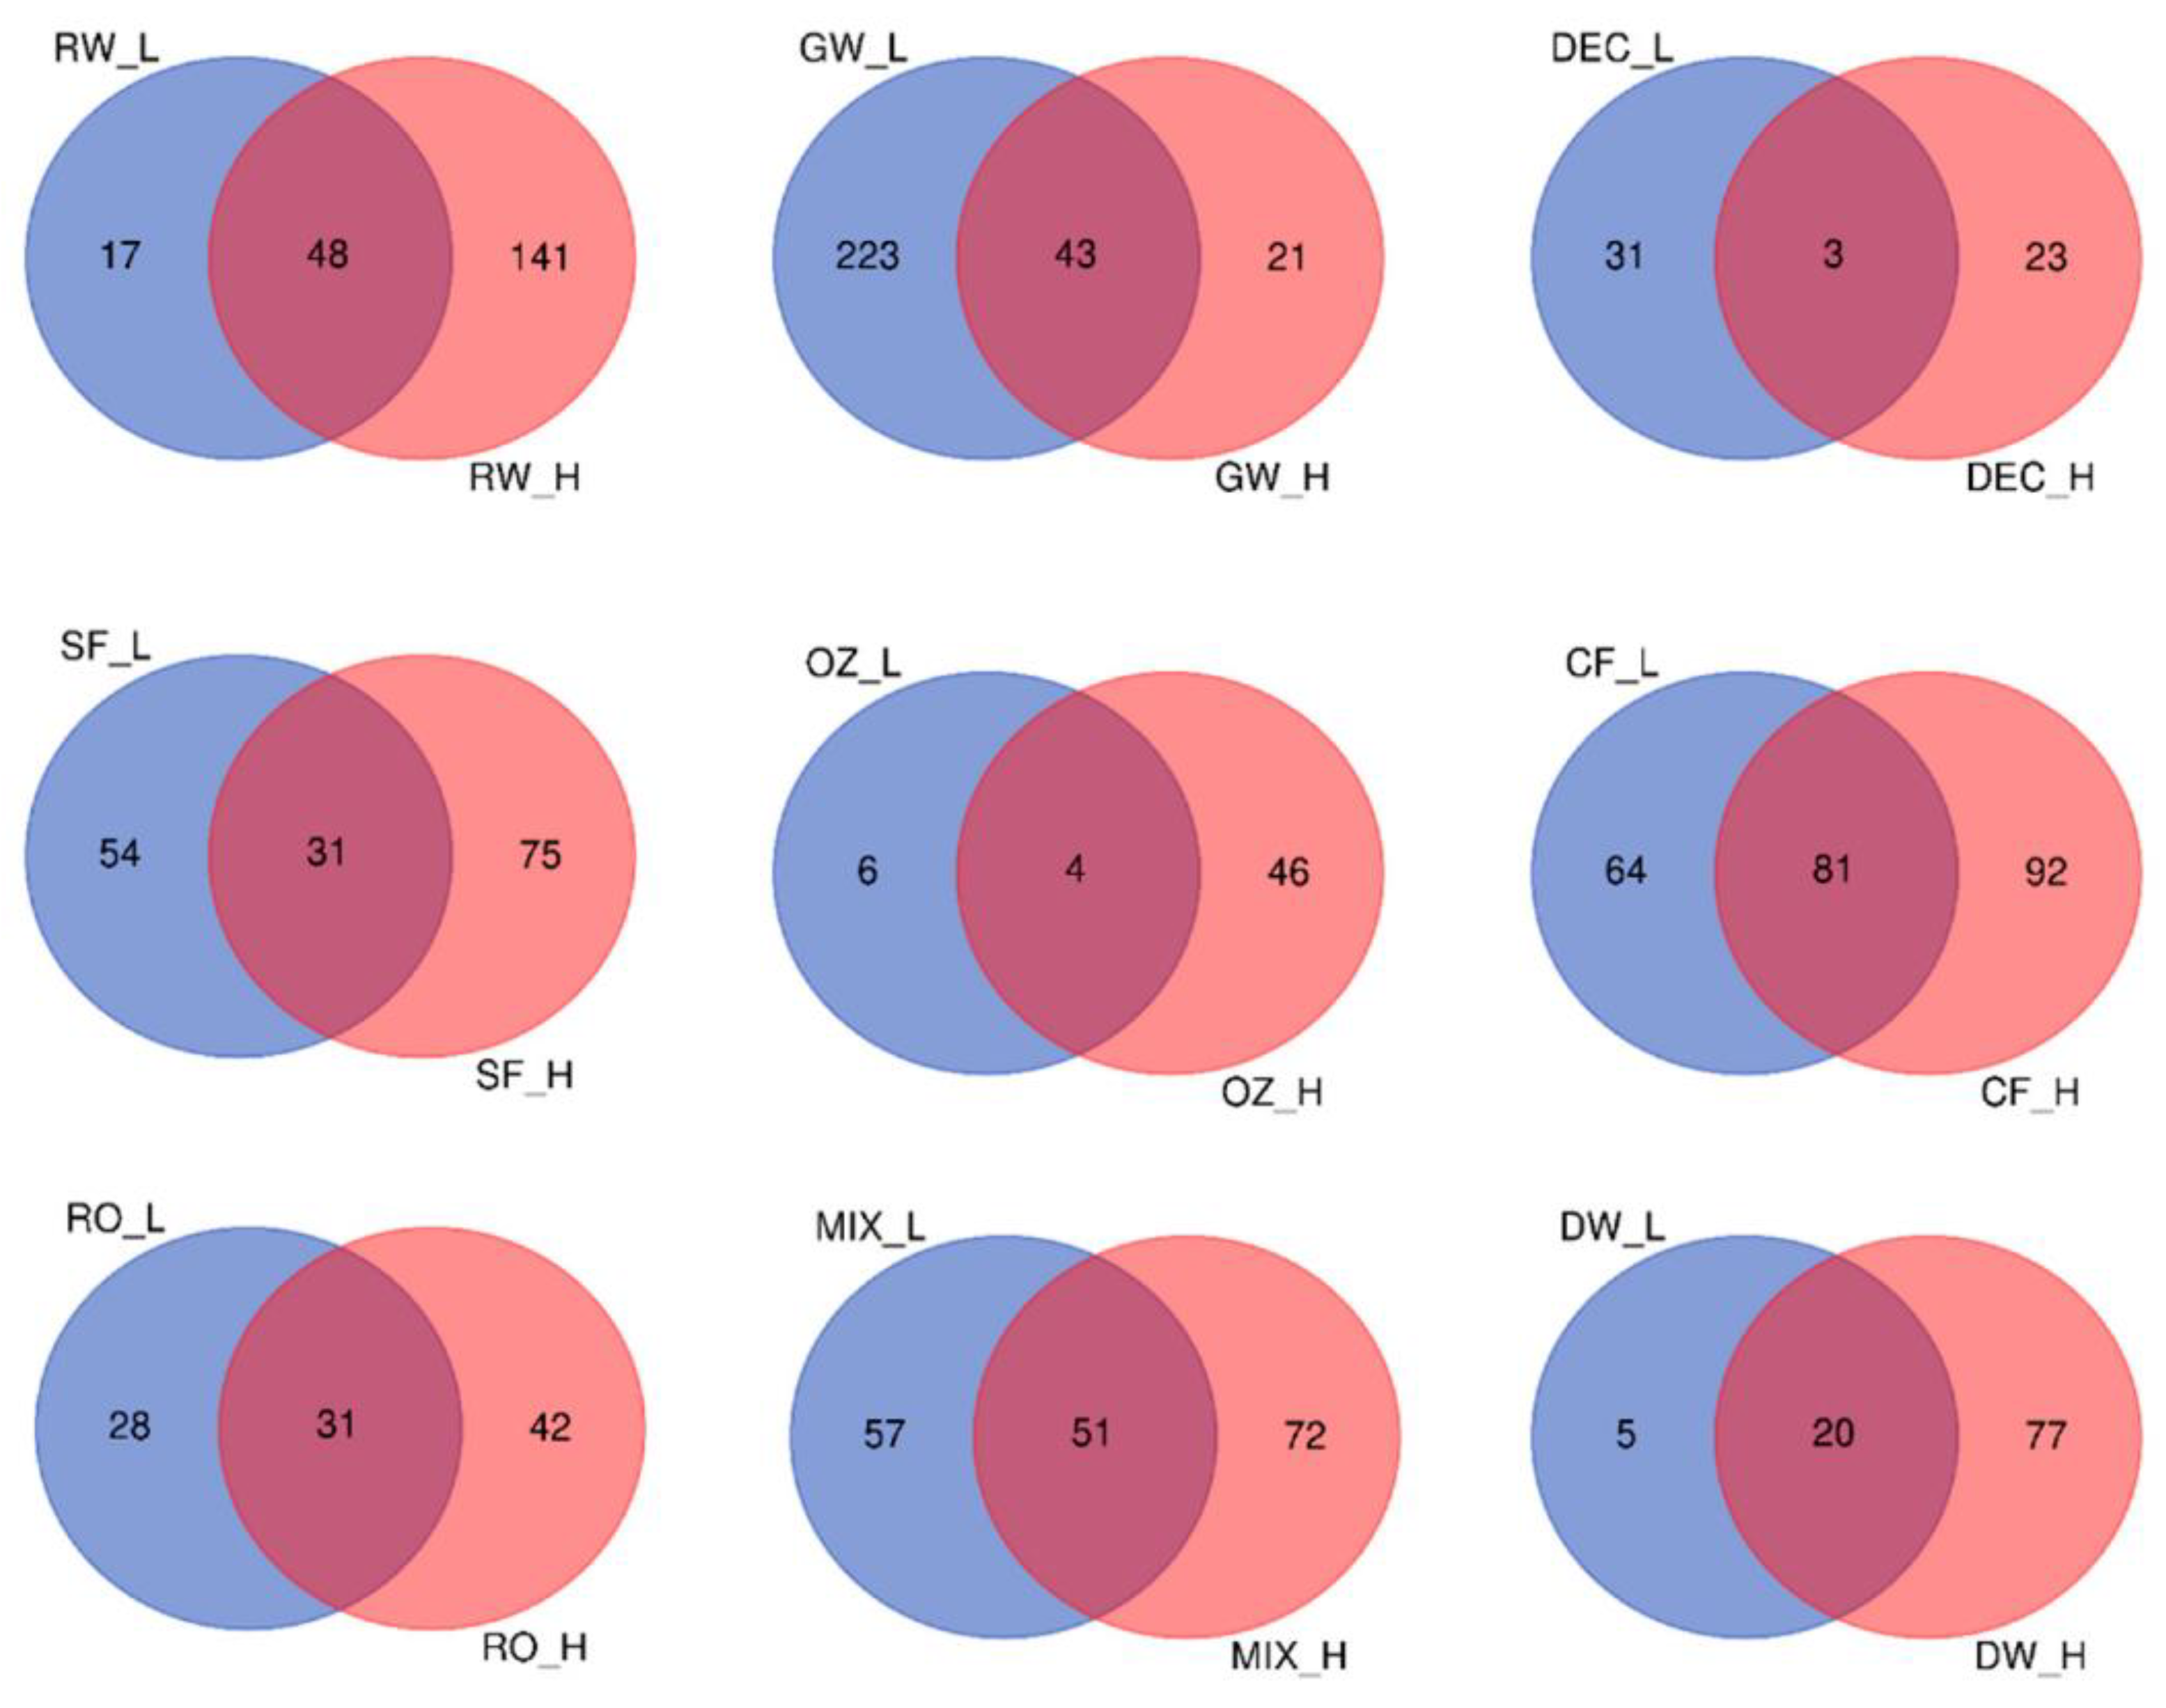
Conversely, when samples were clustered according to ambient temperature (low ≤ 18 °C and high ≥22 °C), differences in core communities were observed. The samples from the pretreatment steps until the MIX had very few ASVs in common: ASV2 (
Limnohabitans) and ASV161 (
Reyranella) at low temperatures and only ASV 16 (
Aeromonas) at high temperatures. On the other hand, samples had more core ASVs at high than at low temperatures, except for GW and DEC. Venn diagrams showing the number of unique core ASVs and shared ASVs between high and low temperatures are provided in
Figure 7.
3.6. Impact of Temperature on Bacterial Communities
A moderate positive correlation between alpha diversity (Shannon index) and ambient temperature was found for some of the treatment stages, including DEC (r = 0.73) and CF (r = 0.83). A lower correlation was also found at other stages, but their values are not significant (RW r = 0.57, SF r = −0.30; OZ r = 0.37, RO r = 0.51, MIX r = 0.31, DW r = 0.31).
Beta diversity correlation with temperature was examined by permutational multivariate analysis of variance (PERMANOVA) of rarefied ASVs based on a Bray–Curtis dissimilarity matrix (
Table S4). PERMANOVA analysis gave significant results for the temperature factor.
Regarding taxonomy profiles at high (HT) and low temperatures (LT) (
Figure S3), differences in bacterial composition were found in some stages.
The bacterial composition in GW remained quite similar. In contrast, a moderate (non-significant) correlation with temperature was observed in RW, where Proteobacteria was always dominant (~70%). However, Bacteroidota was more abundant at LT (28%) than at HT (19%), and Actinobacteriota abundance was 10-fold greater at HT (8%) than at LT (0.8%). The main genera at LT were Flavobacterium (24%), Limnohabitans (22%) and unknown Comamonadaceae (14%). The abundance of the latter remained unchanged when temperatures increased, but a reduction was observed in Flavobacterium (7%).
Temperature was responsible for a significant shift in DEC samples; at LT, Bacteroidota was the major phylum (51%), followed by Proteobacteria (34%) and Campylobacterota (14%), whereas at HT, Proteobacteria dominated (84%), Bacteroidota abundance decreased (15%), and no reads of Campylobacterota were obtained. The predominant genus at LT was Flavobacterium (41%), and at HT, it was Limnohabitans (35%).
Although the composition in SF samples remained generally similar, Actinobacteriota was only detected at HT (9%), and the genus Pseudomonas (7%) was only detected at LT. Moreover, Flavobacterium was more prevalent at LT (25%) than at HT (6%), when Polynucleobacter became predominant (20%).
At the OZ stage, temperature strongly affected bacterial composition; at LT, the major phyla were Proteobacteria (58%) and Cyanobacteria (42%), and at HT, Proteobacteria remained predominant (66%). However, Cyanobacteria reads were negligible (0.08%), being displaced by Bacteroidota (33%), which was not detected at LT. The most abundant genera at LT were Pseudomonas (46%) and unclassified genera from the Chloroplast order (42%), neither of which were observed at HT, when most reads were for Flavobacterium (33%) and Rheinheimera (19%).
Bacterial composition in CF samples was also significantly correlated with the season, with diversity increasing with temperature. Proteobacteria (83%) reads clearly dominated at LT and were lower at HT (71%), when Bdellovibionota abundance increased (12%). Flavobacterium (10%) remained unchanged, whereas Polynucleobacter (10%) was detected only at HT, and Sphingomonas (8%) was only detected at LT.
The correlation with temperature at the RO stage was moderate (non-significant), with a clear dominance of Proteobacteria (94%) at HT. The reads decreased at LT (65%), when the next most abundant phylum was Bacteroidota (34%), which was scarcely detected at HT (0.4%). The most abundant genera at LT were Flavobacterium (19%) and Pseudomonas (13%), and at HT, they were Caulobacter (21%) and Phenylobacterium (18%).
In the MIX samples, temperature-associated differences at the genus and superior taxa level were statistically insignificant. Although the reads for Flavobacterium remained constant (~10%), Polynucleobacter (15%) was only detected at HT, followed by Aeromonas (14%), and at LT, Polaromonas (11%) was second in abundance.
In the final DW, a moderate but non-significant correlation with temperature was observed, with an obvious dominance of Cyanobacteria (87%) at LT, which was reduced somewhat at HT (63%) when Planctomycetota (12%) and Firmicutes (8%) were also detected. However, their levels were otherwise very low at LT (0.6% and 0.4%, respectively). The dominant genus in DW at LT was an unknown member of the Obscuribacteraceae family (58%), which was less abundant at HT (27%) when it accounted for half of the reads jointly, with unclassified reads belonging to the Chloroplast order (27%). The proportions of
Clostridium sensu stricto 1 (6%) and
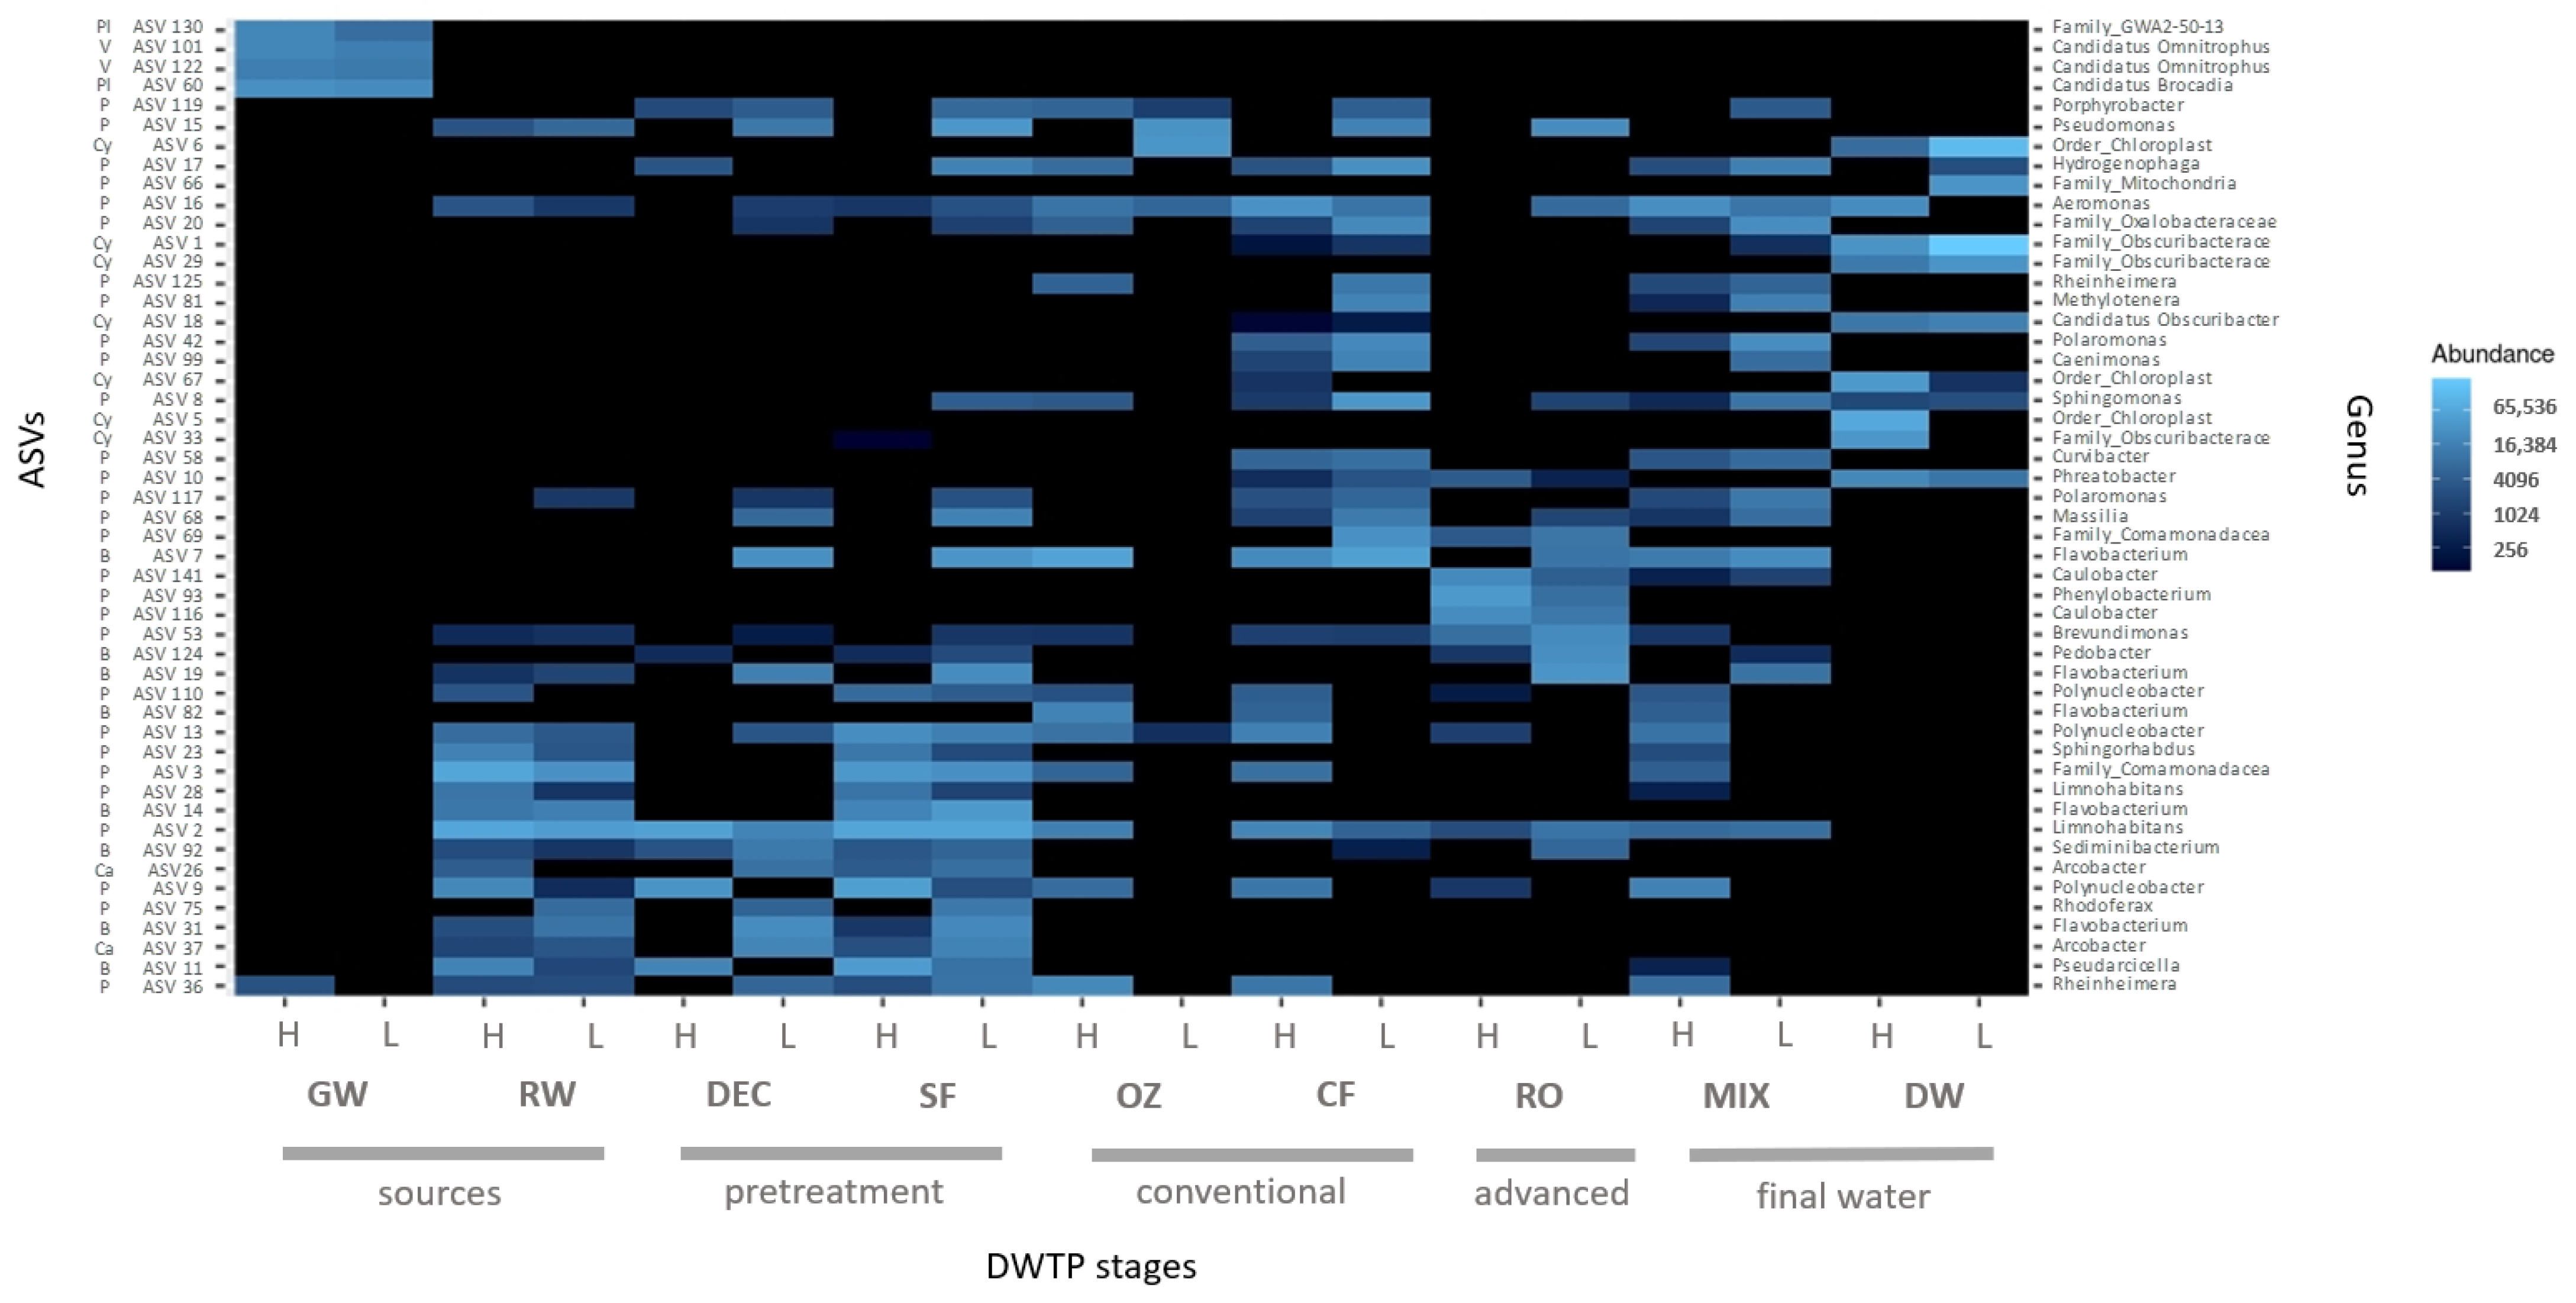
Aeromonas (5%) were greater at HT than at LT (0.4% and 0%, respectively). Regarding the ASV distribution according to temperature, the 50 most abundant core ASVs at HT and LT throughout the DWTP are illustrated in
Figure 8.
3.7. Tracking the Origin of the ASVs along the DWTP
To investigate which upstream stages in the DWTP contribute most to the microbial communities downstream, samples corresponding to the final stages were analyzed by the SourceTracker algorithm. Intake water, pretreatment stages, as well as conventional and advanced treatments were treated as “source”, whereas the final stages, the MIX and post-chlorination drinking water (DW) were “sink” samples. The results of the analysis are shown in
Table 2. Before the chlorination stage (
Table 2), the reads from the MIX samples mainly matched those of CF (89.7%), with some also corresponding to SF (2.7%), RO (2%) and unknown sources (4.4%). However, after the chlorination stage (
Table 2), most of the reads from the DW were from unknown sources (67.9%), followed by the OZ stage (17.4%) and the MIX (7.9%). GW and RO also contributed to the bacterial communities of the final chlorinated water (1.4% and 2%, respectively), whereas the contribution of CF was negligible (0.2%), despite being the main source of reads at the MIX stage.
3.8. Surface Water Contamination Episode and Changes in Operational Procedures
Water quality values of GW and CF samples during the river contamination event were similar to those registered in the other sampling campaigns; in GW, all bacterial indicators were negative, whereas only 5 NMP/100 mL for TC and 1 NMP/100 mL for EC were detected in CF samples. HPC accounted for 0.48 CFU/mL and 104 CFU/mL in GW and CF, respectively.
The taxonomic profile in GW during the event was similar to that of the other GW samples, with no evident changes in water quality parameters and metabarcoding results. However, metabarcoding analysis revealed different diversity patterns in the CF water in comparison with the samples taken under usual operating conditions (
Figure S4). Although the phyla remained the same, there were some differences in relative abundance of Proteobacteria (30% lower), Bdellovibrionota, (22% lower), and Verrucomicrobiota (7.6% higher). Differences were also observed in ASV composition: 126 ASVs were shared with core CF samples (at low temperatures), and a total of 711 unique ASVs were found in CF samples during the event. At the genus level,
Bdellovibrio was dominant (18%), followed by unclassified members of the Oligoflexia order 0319-6G20 (7%),
Reyranella (7%) and Candidatus Omnitrophus (6%), whereas CF samples taken at low temperatures contained
Flavobacterium (10%),
Sphingomonas (8%),
Hydrogenophaga (7%) and
Polaromonas (6%), among others. Nonetheless, these results should be interpreted with caution, as only one sample was studied, and it may reflect occasional operational variation in the carbon filters.
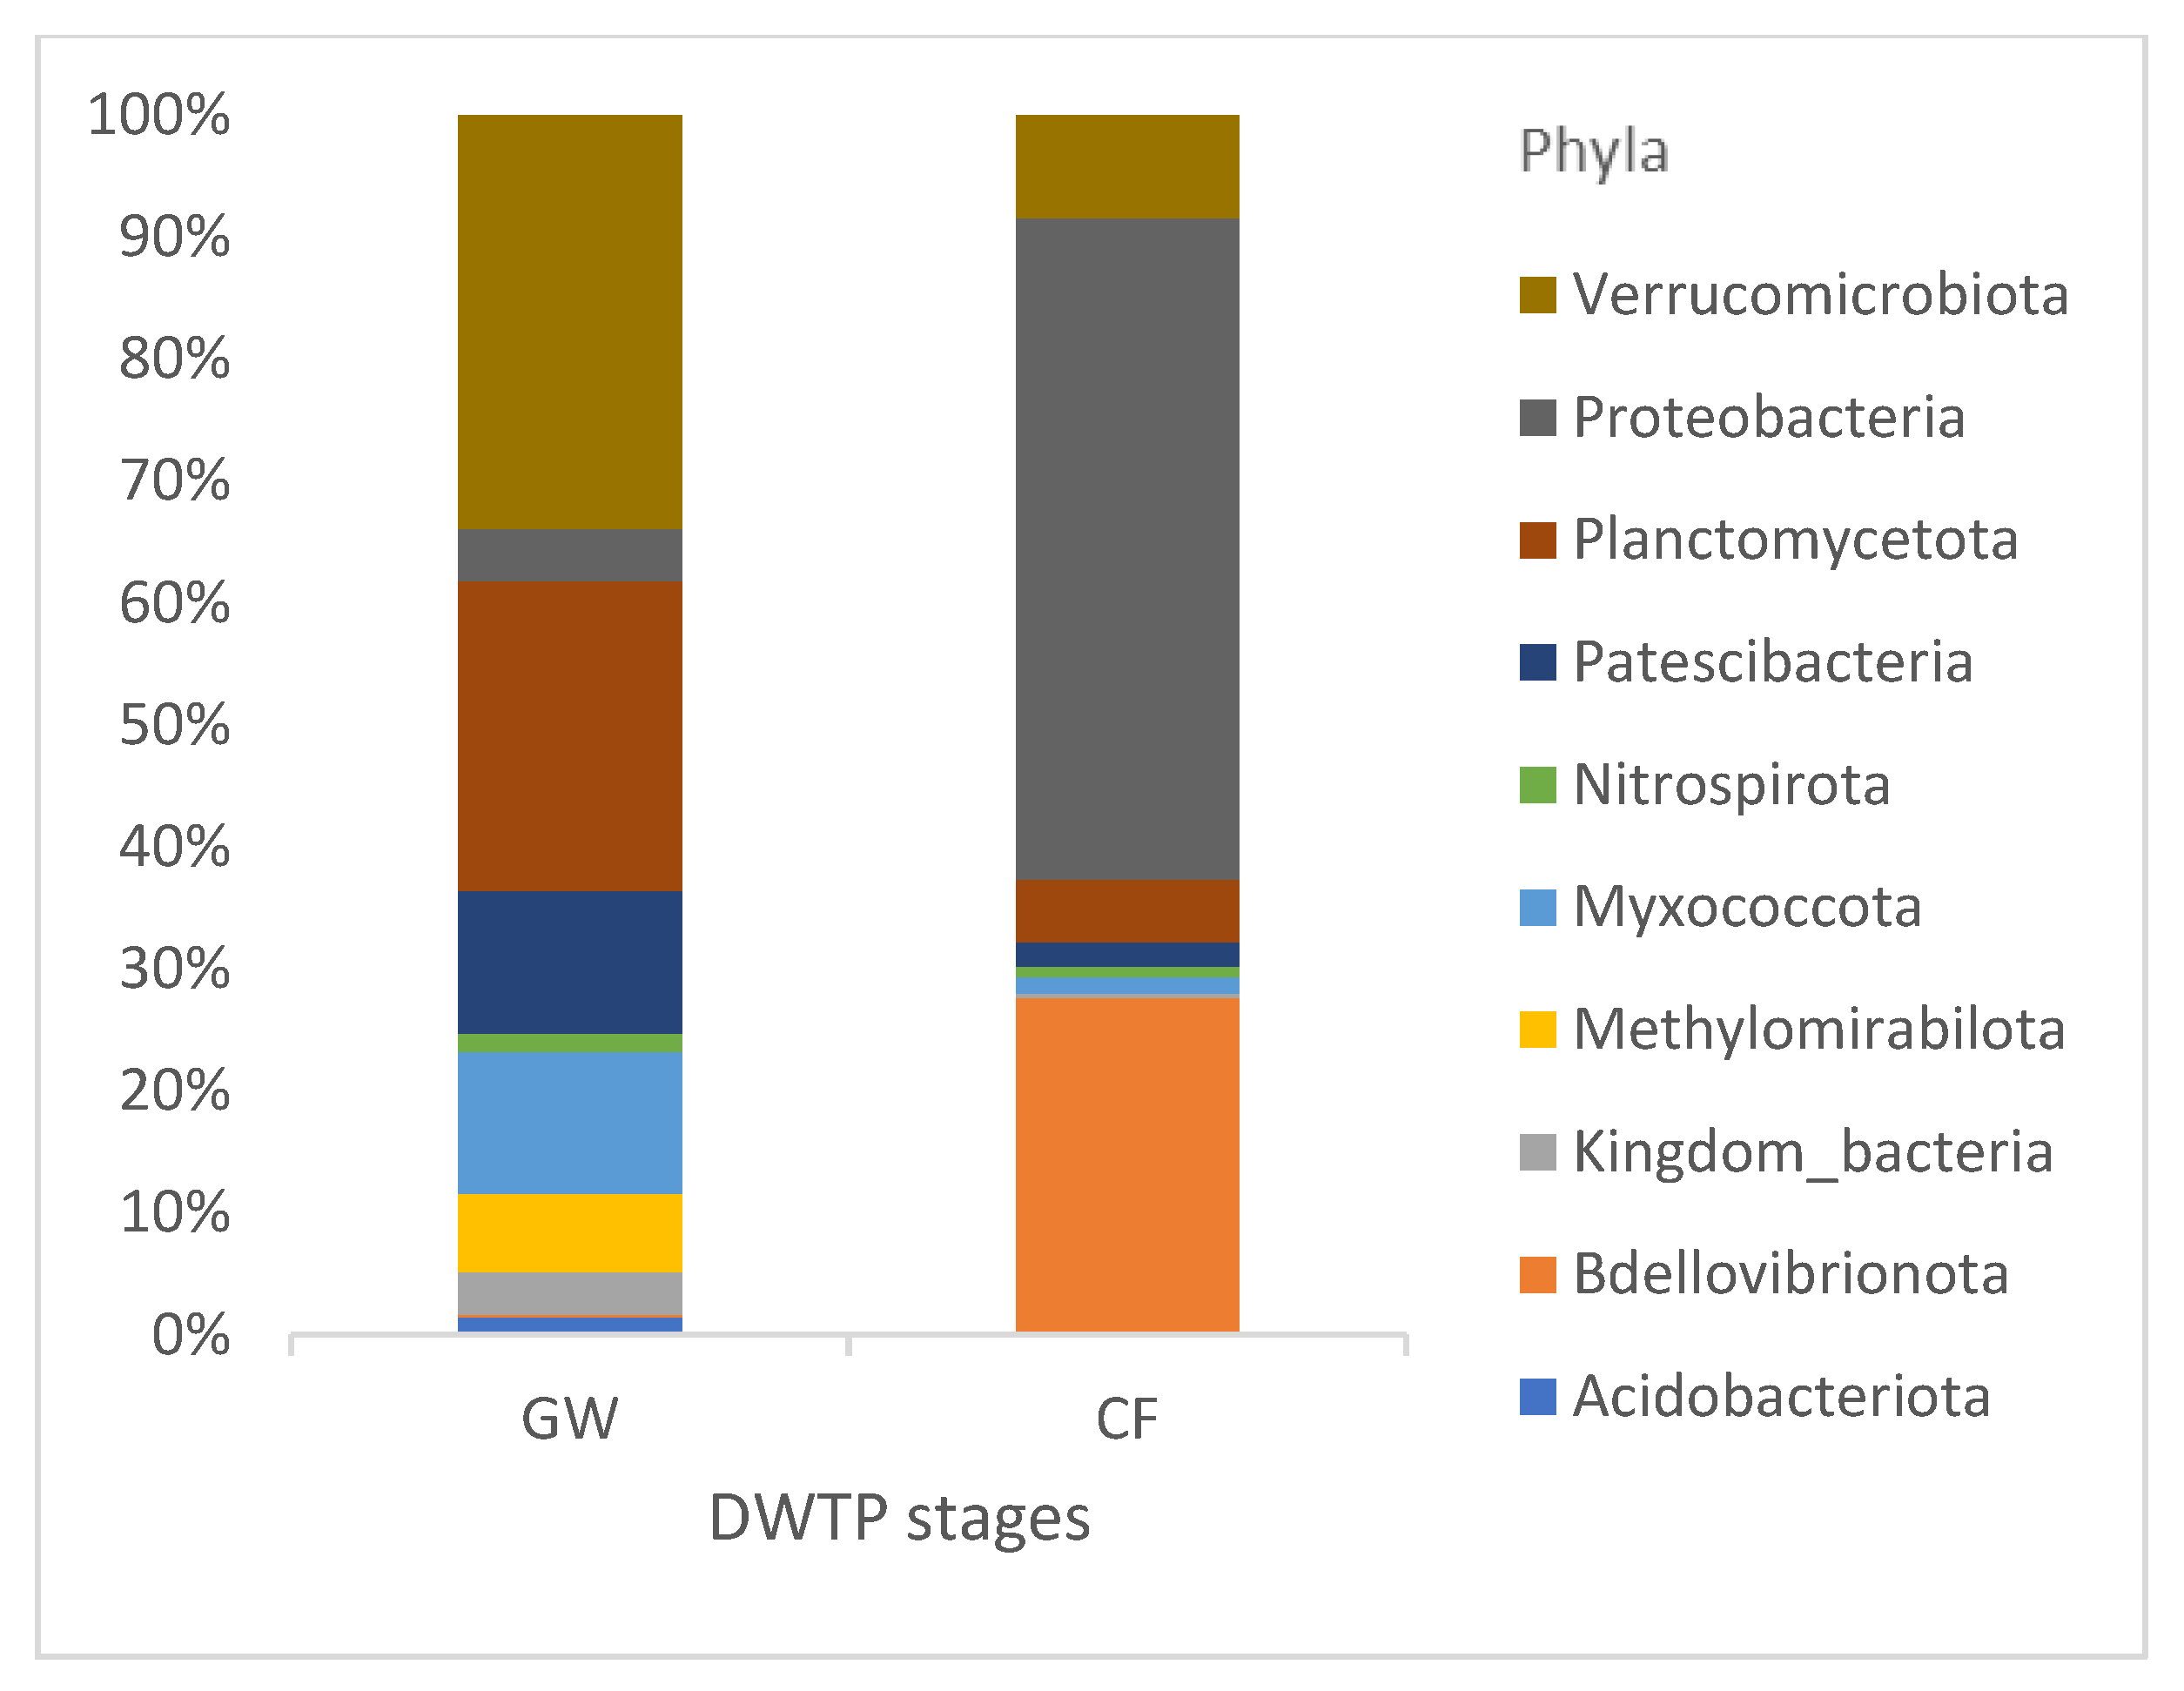
The suspension of RW intake allowed us to track the effect of GW on CF communities, as none of the other pretreatment stages were in operation. As seen in
Figure 9, CF effectively removed Acidobacteriota and Methylomirabilota from the GW and reduced Myxococcota, Patescibacteria, Planctomycetota and Verrucomicrobiota. However, an increase in Bdellovibrionota (from 0.2% to 26%) and Proteobacteria (from 4% to 53%) was observed in the CF samples.
3.9. Detection of Microbial Indicators and Potential Pathogens by 16SrRNA Sequencing
Sequences of bacterial groups relevant for water systems based on the Global Water Pathogens list [
45] were found. A total of eight potentially pathogenic bacterial genera were identified in the DWTP with a very low relative abundance of reads (0.002 to 8%) (
Table S5).
Pseudomonas was detected at the OZ stage (8%) and in the DW (1%),
Aeromonas and
Legionella were detected in the MIX (4% and 2%, respectively) and DW (2% and 0.4%, respectively) and
Clostridium was detected in OZ (1%) and DW (2%). Other potentially pathogenic genera,
Arcobacter, Campylobacterales, Escherichia-Shigella and
Mycobacterium, were only detected in source water or at early treatment stages, with their abundance being very low (<1%) in later treatments or in the final DW.
Helicobacter,
Leptospira and
Vibrio were not detected in any sample.
Regarding data on culturable water quality indicators (
Section 3.2.), it was observed that culturable
E. coli, an indicator of fecal contamination, accounted for an average of 3.5 log
10 CFU/100 mL in RW, whereas in metabarcoding analysis, it contributed only 0.003% of reads for
Escherichia-Shigella. Additionally,
Clostridium sensu stricto 1 was found in DW in low abundance (2%), although it was higher than in the previous stages (0.002–0.02%), but no culturable
C. perfrigens was detected in the DW. Finally,
Enteroccoccus was only detected in very low abundance (0.002%) in SF, OZ and CF.
4. Discussion
The performance of an advanced full-scale DWTP was assessed using culturable microbial indicators, as indicated in the current EU Directive on drinking water together with molecular methods (16S rRNA metabarcoding). Monitoring the dynamics of bacterial communities in a DWTP may help to better understand process performance, allowing a more in-depth assessment of operational variations that may modify water quality. For example, nutrient excess in source water may lead to regrowth of microorganisms or biofilm formation [
3,
46], which can affect the taste and odor of tap water and may even result in an increase in opportunistic pathogens, posing a risk to public health. Moreover, an increase in cyanobacterial blooms in surface water may produce clogging in filtration stages as well as being a health hazard, as some genera are toxin producers [
2].
Although the quality of the analyzed drinking water complies with EU Directive regulations, the stipulated culture-based indicators were not able to detect changes in bacterial communities in the DWTP. For example, the HPC remained constant despite shifts in bacterial diversity.
The use of a DEUF concentration method allowed the reduction in microbial indicators to be monitored more precisely during water processing, especially in the advanced treatment stages, when indicator concentration is very low and not detected by conventional techniques. Thus, among the culturable indicators,
C. perfringens was traced until carbon filtration, and total coliforms,
E. coli, intestinal enterococci and somatic coliphages were detected until the mixing chamber, with no traces remaining in the final drinking water. Historical data from this DWTP (from 2011 to 2019, data not shown), based on the use of standard membrane filtration for routine water quality monitoring, indicate positive results for these indicators only at early stages (i.e.,
E. coli and somatic coliphages until sand filtration, or intestinal enterococci until carbon filtration). Previous studies using the DEUF method have reported recoveries of 45.5 ± 24.0 % for fecal indicators and 22.4 ± 9.3% for bacteriophages [
47], ranging from 35 to 95% for enteric bacteria and viruses [
48] or 60–80% for bacteria, viruses and protozoa in drinking water [
20], depending on the water matrix and degree of turbidity. Therefore, the reported concentrations for the different indicators may be even higher than in the current study.
Compared to other methods, DEUF allowed for more in-depth and representative characterization of the bacterial communities in the DWTP, as large water volumes could be sampled. Contaminants from DNA extraction kits or PCR reagents can confound the results of molecular analysis, especially in samples with a low microbial biomass, such as the final treated water [
49]. In this context, large volume concentration methods are particularly useful. In our PCR procedure, sequence blanks clustered together, indicating that they did not significantly interfere with the characterization of the DWTP microbiome.
High diversity was observed at all DWTP stages, being the highest in GW, followed by the MIX and CF samples. Overall species abundance and richness were significantly reduced by the treatments, especially disinfection, with the lowest values being obtained in the OZ, DW and DEC samples. River water, the main intake source of the DWTP, had a lower species richness than those of the SF, FC and MIX samples. The higher diversity observed at SF and CF may indicate an established microbiome associated with filtration procedures, as has been reported [
13]. Diversity at the DEC stage was lower than it was after the following step of SF, reflecting a loss in richness after the disinfection procedure with chlorine dioxide and possible bacterial regrowth in the filters. A similar trend was observed in the conventional treatment, with a decrease in diversity after OZ, followed by a high increase in CF samples and again with a decrease in the advanced treatment, where there was reduced species richness at the RO stage. Diversity in the mixing chamber was high, falling between the values of the CF and SF samples. Finally, chlorination significantly reduced species diversity in the final water. Chlorine has a strong bactericidal effect, damaging bacterial cell structure, although certain groups resist the disinfection process. ASVs of bacterial communities characterized at disinfection stages may correspond to chlorine-resistant strains of
Aeromonas,
Clostridium, Cyanobacteria or
Pseudomonas, among others (reviewed in Luo et al. [
50]). Low diversity in RO samples can be explained by the low nutrient levels in permeate water, where only specially adapted microorganisms can thrive. Genera detected at this stage include
Caulobacter, Comamonas, Curvibacter, Flavobacterium and
Pseudomonas, which are considered potentially biofilm-forming.
Although Bdellovibrionota was detected at different treatment stages with ≤1% abundance, it accounted for 10 and 12% of reads in the CF and MIX samples, respectively, mainly consisting of unculturable Oligoflexia and
Bdellovibrio. The members of this phylum are described as obligate predators of bacteria (Gram-negative and Gram-positive) and have been proposed as biocontrol agents for their ability to prey on multi-drug-resistant bacteria [
51]. Concerning core amplicon sequence variants, only one ASV was detected in the samples taken at high temperatures and two in the samples taken at low temperatures, which correspond to
Aeromonas and to
Limnohabitans and
Reyranella, respectively. The detection of core ASVs under the standard operational conditions of the DWTP is of interest, as they can provide new monitoring tools for detecting impaired treatments, a potential application that still needs more research.
Over the short period when GW was the only source of intake and when the routine operational conditions of the DWTP changed, an increase in certain bacterial populations at the CF stage was detected, which can be attributed to the growth of communities present in biofilms in the filter or to their temporal detachment from carbon surfaces. Such conditions can be met after a sudden shift of water intake for the exclusive use of GW and can be attributed to differences in temperatures compared with other water sources [
52]. In this study, in the winter season when this episode occurred, river water temperature gathered at 7.9 °C, whereas groundwater presented 17.1 °C on the day of sampling. Nevertheless, in the current study, the significance of these results may be limited by the unrepresentativeness of the samples. Different potabilization stages exerted a selective pressure on bacterial communities and shaped their composition downstream. Filtration procedures had a strong influence, which is in agreement with other studies on sand filtration [
13] and carbon filtration [
16,
53]. However, disinfection had a greater impact, as reported previously, as residual disinfectants reduce the abundance and diversity of bacterial communities, which become dominated by resistant genera (including opportunistic pathogens) in post-chlorination water [
14,
15,
54] and in distribution networks [
54,
55,
56]. In the present study, the chlorination stage shifted the dominant bacterial population in the final drinking water from Proteobacteria to Cyanobacteria, a phylum that was poorly represented in source water (0–3%) and at other treatment stages (<6%), being slightly higher in OZ samples (19%). The aphotic environment of many of these processes (but not the pretreatment) suggests that the unclassified Cyanobacteria that were detected are non-photosynthetic. The dominant genus in the DW belongs to the unculturable Obscuribacteraceae, which are found in dark conditions, followed by an unclassified Chloroplast order. Most databases, such as SILVA, classify chloroplasts within the Cyanobacteria phylum, as they are considered a phylogenetic lineage evolved from endosymbiotic Cyanobacteria [
57]. Thus, chloroplast reads are commonly found in aquatic environments, and have been reported in studies of river [
58] and lake [
59] water quality.
Little is known about the diversity and ecology of non-photosynthetic Cyanobacteria in water environments, and their classification is still under debate. Di Rienzi and colleagues [
60] proposed their inclusion ina sibling phylum, Melainabacteria (named after “Melaina”, a nymph of dark waters in Greek mythology), whose sequenced genomes confirm an absence of a photosynthetic apparatus. Another study suggests that the orders Obscuribacterales and Vampirovibrionales, which are capable of aerobic and anaerobic respiration, should also be included in this new phylum [
61]. Although the SILVA database does not phylogenetically differentiate the non-photosynthetic cyanobacterial group, Cyanobacteria have been reported in aphotic environments, such as groundwater and animal guts [
60], koala feces and activated sludge from a wastewater treatment plant [
61] and continental subsurfaces 420–607 m in depth [
62].
Although most studies characterizing bacterial communities in DWTP stages and drinking water have not detected Cyanobacteria and report Proteobacteria as the dominant phylum [
11,
13,
14,
15,
25,
55,
63,
64], other researchers have obtained a high abundance of Cyanobacteria reads in water from distribution networks [
8], treatment stages [
65] or sludge storage in drinking water processing [
65,
66]. These variable results may be accounted for by factors such as location, the type and quality of source water, and whether or not disinfectant procedures are used, all of which create a unique habitat in each DWTP or distribution network. Cyanobacteria cells have an outer peptidoglycan layer thicker than most Gram-negative bacteria and a cell wall mainly composed of lipids and carotenoids. Furthermore, the outer membrane has fewer conductance porins than most Gram-negative bacteria, which is an adaptation to low-nutrient environments that enhances resistance toward harmful chemicals [
57]. This structure may confer mechanical stability when exposed to chlorine, with chlorine-resistant groups being found in the final water. No cyanobacterial blooms, stagnation or microcystin (cyanobacterial toxins) were detected in the river or drinking water, which was safe for consumption.
Changes in microbial communities related to ambient temperature were also observed in different treatment stages, with a correlation of higher diversity with higher temperatures, specially at DEC and CF. Such temporal variability has been widely described [
10,
13,
14,
67]. Higher temperatures can trigger changes in bacterial communities, as they facilitate bacterial growth of different genera. Implications of high temperatures in water systems have been documented, such as the occurrence of certain waterborne bacterial pathogens, opportunistic pathogens and biofilm-forming groups that may compromise water quality or pose a risk to public health. For instance, Calero Preciado et al. (2021) [
3] observed a significant increase in relative abundant reads of
Pseudomonas and
Fusarium in chlorinated distribution networks favored by temperature, both with the capability to promote biofilm formation. Moreover, the presence of the opportunistic pathogen
Mycobacterium spp. was also registered to rise together with temperature. Other genera that promote biofilm development in chlorinated distribution networks, such as
Aeromonas, also show greater abundance at higher temperatures [
68]. Similarly, in unchlorinated drinking water supplies, van der Wielen and van der Kooij (2013) [
69] described a higher occurrence of
Legionella pneumophila and
Stenotrophomonas maltophilia at high temperatures. Both of them are likely to grow in biofilms and can be moderately to highly virulent, as they often cause pneumonia or bacteriemia disease, respectively, in immunocompromised patients. These observed changes related to temperature may be of interest to drinking water managers in the context of the global warming scenario.
Very few 16S rRNA sequences (0.002–8%) retrieved from the source water and treatment stages were associated with genera of waterborne bacterial pathogens in the global priority list. Reads of
Aeromonas,
Arcobacter, the order Campylobacterales,
Legionella, Mycobacterium, Escherichia-Shigella and
Pseudomonas detected in the DWTP were reduced or eliminated in the DW, except for
Pseudomonas and
Aeromonas (1% and 2%).
Arcobacter reads, which were low in RW and pretreatment stages (1–3%), were negligible in drinking water (0.007%), demonstrating the effectiveness of conventional and advanced treatments in removing
Arcobacter species, as previously shown by Collado et al. (2010) [
70].
Helicobacter, Leptospira and
Vibrio were not detected at any stage of the process. It should be mentioned that not all the species of the targeted potentially pathogenic genera are animal, human or plant pathogens. Additionally, the reads may correspond to non-viable or dead cells after the potabilization treatment or to free DNA. The present analysis of drinking water samples confirms that the applied potabilization process provides safe drinking water, free of fecal indicators.
Discrepancies were observed in the results between conventional culture-based techniques and metabarcoding. In RW, culturable
E. coli values were high (3.5 log
10 CFU/100 mL), but the abundance of reads was very low (0.003%), perhaps because of a PCR bias against rare taxa in non-treated water samples. In DW, the opposite occurred with
C. perfringens, which was detected by the molecular technique (3%) but not by culture. However, relative abundance data must be treated with caution, as high-throughput sequencing is not designed for quantitative purposes. Therefore, the analysis of water quality based only on sequencing methods can lead to inaccurate assessments of microbial hazards [
54]. Nevertheless, a molecular approach allows for the simultaneous tracking of pathogens, opportunistic pathogens, microbial indicators and their fluctuations between treatments and within samples. The resulting taxonomic data can be used to develop quantitative methods such as qPCR to provide a more comprehensive understanding of microbial population dynamics.
Both approaches to water quality monitoring (culture- and molecular-based) have benefits and limitations. Although microbial indicators and HPC offer protection against pathogens and can detect viable microorganisms, the results can be biased by the medium or by growth conditions, and changes in microbial composition are not detected. In this respect, 16S rRNA metabarcoding provides a more in-depth analysis of microbial communities, including both culturable and non-culturable, autotrophic and heterotrophic, photic and aphotic and waterborne bacteria. However, metabarcoding also has shortcomings: obtaining results is more time-consuming; there is no standardized methodology; rare taxa can be neglected due to primer bias; and cell viability remains unconfirmed, which hinders risk assessment [
71]. Although all drinking water samples in this study fully met the quality standards of the EU Directive, samples with a stable HPC were observed to have variable bacterial diversity. Therefore, the use of 16S rRNA metabarcoding in water quality management in combination with standardized techniques can provide useful information on the efficiency of the different stages of water treatment and may help to address the challenge of potabilization related to likely expected deterioration of surface water due to future climate threats that may compromise water quality.


 ,
, 


