1. Introduction
Urban waterlogging refers to the internal water generated in low-lying and poorly drained urban areas during heavy rain, which is also one of the emerging research fronts of urban climatology [
1,
2]. It occurs gradually with the increase in urbanization and human activity. The spatial heterogeneity of urban built environments is a primary challenge in the research of urban waterlogging in terms of the model representativeness, computational efficiency, and data requirements [
3]. Therefore, rapid modeling and simulation research on urban waterlogging based on the lack of modeling data is significance to urban waterlogging prevention and control.
In response to the urban waterlogging problem, Paris implemented the urban drainage system into the construction plan as early as 1852. Presently, the length of sewers in Paris has reached more than 2400 km, which is far longer than the subway in Paris. Other countries are constantly upgrading their own urban drainage system with improved technology and the concept of waterlogging prevention [
4,
5]. However, from a global perspective, many cities are still challenged by urban waterlogging owing to extreme weather events that constantly exceed the given standards [
6,
7].
Within a couple of years, with the acceleration of urbanization in China, the urban scale and impervious areas have increased significantly [
8]. Moreover, within the context of global climate change, extreme rainfall events have increased significantly in cities, wherein frequent waterlogging events in many large cities have caused serious losses to urban non-agricultural industries such as transportation and infrastructure [
9]. Simultaneously, it also poses a severe threat to the life and property safety of urban residents, and seriously affects the normal operation and management of the city. Since 2010, 62% of Chinese cities have experienced urban waterlogging, 40% of which have experienced more than three waterlogging events. Large and medium-sized cities, such as Beijing, Shanghai, Guangzhou, Shenzhen, and Wuhan have experienced waterlogging disasters of varying degrees every year. Urban waterlogging has become a serious problem plaguing urban development in China [
10,
11,
12].
The key to preventing urban waterlogging is its simulation [
13,
14]. In general, the urban waterlogging model consists of modules of runoff generation, confluence, and flood submergence analysis [
15]. According to different modeling mechanisms, each module can be calculated using hydrologic, hydrodynamics, or simplified methods [
16]. Accordingly, most urban waterlogging models are composed of modules based on different methods. Common urban waterlogging models are listed in
Table 1 [
17].
In the early urban waterlogging model, there was only one drainage system. The overflow water of nodes was obtained through hydrodynamic calculation of a one-dimensional pipe network, and this was converted into the local water area and water depth combined with the water-volume curve of depressions in the catchment area; thus, the model accuracy was low. The two-dimensional shallow water model based on the direct rainfall method can simulate the flooding process of streets and any area, especially that of low-lying areas that are away from the rainwater outlet. However, it is difficult to implement this model in streets with dense pipe networks as it lacks sufficient data due to the coupling of drainage outlets, rainwater wells, and pipe network drainage systems. At present, common national and international commercial models are hydrologically driven hydrodynamic models. The outlet flow calculation results of the hydrological model are often considered as the input boundary conditions of the hydrodynamic model, and the hydrodynamic calculation of the coupling surface and pipe network is conducted through the stormwater outlet to clearly describe the physical process of urban waterlogging. Reasonable simulation accuracy was achieved in the simulation of surface confluence and the combined generation confluence process of internal and external river inflow connecting the urban underground drainage pipe networks [
21,
22].
However, such simulations will face many challenges if only the traditional hydrodynamic model is used to simulate waterlogging. Firstly, the model requires relatively perfect drainage network data, underlying surface data, and historical observation data, all of which are difficult to obtain [
23]. Secondly, there are many waterlogging black spots, and a considerably large modeling area will lead to an excessively long operation time and low efficiency [
24]. Thirdly, owing to the rapid change in the urban underlying surface, the model parameters will often undergo dynamic changes, thereby creating difficulties in adjusting the model parameters [
25]. The physical process of the hydrologic hydrodynamic model is described comprehensively and is relatively close to the simulation of natural processes. However, for the above reasons, the popularization and application of traditional waterlogging models are greatly hindered [
26].
At present, the continuous enrichment of monitoring means is considered to geometrically increase waterlogging-related data. Therefore, data mining methods are frequently applied in meteorological and hydrological studies [
27,
28,
29,
30,
31]. The data mining method can make full use of the existing data to quickly establish the direct correlation between rainfall and waterlogging. On the one hand, it greatly improves the speed of model construction. On the other hand, it also shortens waterlogging simulation time, and finally improves the applicability of waterlogging simulation [
32,
33]. However, it also has the following disadvantages. Firstly, the description of the physical process in the model is relatively simple and does not include physical implications in the simulation process. Secondly, because of the small number of data mining model parameters, such as the obscure physical implications of model parameters and the insufficient amount of simulation training, the simulation is prone to the problem of different arguments. Finally, data mining models can usually only predict the size of dependent variable values, and it is difficult to predict the process of dependent variables [
34,
35].
To summarize, in order to improve the applicability of waterlogging simulation, in this study we constructed a new urban waterlogging factor correlation model by building through the correlation among rainfall, waterlogging, and other factors affecting waterlogging on the underlying surface and using the data mining methods for obtaining intelligent tuning parameters. By simultaneously establishing the new model, along with the SWMM and Mike Urban models in typical waterlogging black spots in the study area, the waterlogging simulation results of several models were compared and analyzed, and the advantages and disadvantages of the new model were summarized.
3. Construction of Waterlogging Model
This research is committed to solving the traditional waterlogging model problems, such as the high dependence on baseline data, low computational efficiency, and poor applicability. A multi-factor correlation method was proposed in this research, and the correlation between rainfall and waterlogging we established and then the multi-factor correlation model for urban waterlogging was built. Consequently, the speed and applicability of the waterlogging simulation were improved with the new model.
The construction idea of the waterlogging multi-factor correlation model was as follows: based on the original rainfall deducted/added, a series of factors with a direct impact on waterlogging was estimated, such as the terrain, evaporation, infiltration, drainage, and river water level, resulting in residual rainfall. The residual rainfall is equivalent to submerged floods, and the flood volume can be associated with the water depth by terrain. Therefore, this study selected the factors of terrain, evaporation, infiltration, drainage, and river flood water level, as well as other factors related to waterlogging black spots. Their initial values and the deduction/addition methods were set based on the principles of subjective hydrology; subsequently, we calculated the best correlation between the residual rainfall and the maximum depth by applying inverse-push on a group of factors by using data mining. Values of six variable parameters (confluence time, confluence, evaporation, infiltration, drainage, and river gushing level) were extracted from the five waterlogging-related factors of topography, evaporation, infiltration, drainage, and river water level. Land use data, drainage network data, topographic data (catchment area and slope), and river water level data of waterlogging points were collected to determine the value range of the factors.
The construction process of the multi-factor correlation model is as follows: deduct/add the rainfall process successively according to the terrain, evaporation, infiltration, drainage, and river surge water level factors. After obtaining the net rainfall process, we established the correlation between the accumulated net rain and the waterlogging depth at the corresponding time. The modeling process is as follows:
(1) The topography mainly considers the rainfall confluence in the catchment area to which the waterlogged point belongs, and the confluence value considers two factors: confluence time and confluence amount. The maximum confluence time can be estimated by the area and slope of the catchment area, whereas the maximum confluence amount can be estimated by the relationship between rainfall and the production confluence relationship. The threshold value of the confluence time ranges from 0 to the maximum confluence time, and the threshold value of the confluence amount ranges from 0 to the maximum confluence amount. With the increasing amount of flooding corresponding to the different flooding delay times during the rainfall process, the influence of topographic factors on rainfall is increased. Maximum water confluence time considers the slope confluence time. The estimation formula for the maximum confluence time
T is as follows:
where
is the maximum confluence length of the catchment area,
is the average confluence velocity of the catchment area,
is the runoff depth,
is the slope flow coefficient,
is the average slope of the catchment area, and
n and
m are empirical parameters. The runoff water depth is generally not deep; thus,
is 0.1 m. The
n value ranges from 2/3 to 1 and the
m value ranges from 0.37 to 1;
n and
m are both intermediate values with values of 0.8 and 0.6, respectively.
As the flow of rainfall experiences losses, the maximum confluence amount
per unit area and per unit period will not be greater than the rainfall intensity per unit period. The formula is as follows:
where
is the rainfall intensity per unit period of the catchment area.
Deduction/addition of topographic factors for rainfall process is as follows: at each time from the start of rainfall to the time of confluence, the water-concentration sequence is added, which is the rainfall process multiplied by the water concentration coefficient. The formula is as follows:
where
is the original rainfall added value of topography influence to rainfall (mm) at per unit of time, which is the rainfall amount in the catchment area from the start of rainfall to the maximum catchment time,
T is the convergence delay time,
is the Reduction factor, and the catchment coefficient value ranges from 0 to the maximum catchment amount.
(2) Evaporation is mainly related to air pressure and wind speed. Therefore, the value range of evaporation can be approximately determined through the air pressure and wind speed data at the corresponding rainfall time. The evaporation value threshold ranged from 0 to the maximum evaporation value. The deduction method of evaporation is based on a certain amount of evaporation value generated each time during rainfall. Thus, the corresponding evaporation value is sequentially deducted from the rainfall at each time during the rainfall process. The estimation formula for the maximum evaporation value
H is as follows:
where Δ
P is the pressure difference in the catchment area; namely, the difference between the saturated vapor pressure of the water surface temperature in the catchment area and the vapor pressure at a height of 1.5 m on the evaporating water surface, and
Vm is the average wind speed at a height of 1.5 m in the catchment area.
Deduction/addition of the evaporation factor for rainfall process is as follows: from the beginning to the end, an evaporation value is subtracted at each moment of the rainfall process, and it returns to zero when a negative value occurs. The formula is as follows:
where
is the
deducted value of evaporation to rainfall (mm) and
is the evaporation influence value (mm), which refers to the amount of rainfall consumed per unit of time by the evaporation.
(3) The infiltration mainly depends on the maximum infiltration rate of the area near the waterlogging point. The threshold of the infiltration value was determined by the maximum infiltration rate and rainfall amount. The threshold of the infiltration value ranged from 0 to the maximum infiltration value. The infiltration value is deducted from the beginning of the rainfall process.
The formula for estimating the maximum infiltration volume
F is as follows:
where
is the maximum infiltration rate of the soil in the catchment area under the driest condition,
Q is the maximum catchment volume of the catchment area per unit time and per unit area, and
t is the rainfall duration of the catchment area.
The deduction/addition method of the infiltration factor for the rainfall process is as follows: from the first moment of the rainfall process, the amount of infiltration is reduced sequentially until the infiltration is reduced to zero. The formula is as follows:
where
is the
deducted value of infiltration to rainfall (mm),
is the infiltration influence value (mm) which refers to the amount of rainfall consumed per unit of time by the infiltration.
(4) The pipe drainage capacity mainly considers the drainage capacity of the drainage network. The drainage capacity of the drainage network can be estimated by obtaining the diameter data of the drainage network. The estimated full-pipe flow determines the threshold of the drainage value, which ranges from 0 to the maximum drainage value. The deduction method of the drainage value is as follows: after the rainfall meets the infiltration, the corresponding drainage value is deduced from the value at each time of the rainfall process.
The formula for estimating the maximum drainage value
Dr is as follows:
where
Q is the maximum catchment volume of the catchment area per unit area and per unit time,
S is the catchment area corresponding to the pipe point,
d is the diameter of the drainage pipe in the catchment area, and
t is the rainfall period of the catchment area.
The deduction/addition method of the drainage factor for the rainfall process is as follows: the drainage volume was subtracted from the beginning to the end of the rainfall process. The formula is as follows:
where
is the
deducted value of drainage to rainfall (mm),
is the drainage influence value (mm) which refers to the amount of rainfall consumed per unit of time by the drainage system.
(5) The river water level mainly affects the drainage of the waterlogging point. When the water level of the river surge exceeds the elevation of the drainage outlet at the waterlogging point, the accumulated water will not be discharged. The deduction/addition method of the river surge water level factor for the rainfall process is as follows: when the river gush water level is higher than the outlet of the drainage pipe network, the drainage drops to 0.
(6) The historical rainfall and waterlogging data of waterlogging black spots were collected as training data using the data mining and gradient descent methods, based on the value range of each factor. The set of factor values was inversely calculated with the highest degree of fit between total net rain and waterlogging depth. Subsequently, we established the correlation between the total net rain and waterlogging depth. The calculated factor value with the highest level of fitting was used as the determined parameter for the next rainfall and waterlogging event simulation to calculate the total net rainfall and obtain the corresponding simulated waterlogging depth. Generally, a quadratic equation of one variable is used to establish the correlation equation of the total net rain (independent variable) and waterlogging depth (dependent variable). The net rain value was calculated using the following method:
Finally, the correlation between the net rain value and maximum water depth was constructed, as given below:
where
D is the depth of the waterlogged water,
is the net rainfall at the corresponding time, and
,
s and
are constants. After constructing the model formula, the depth of waterlogging can be obtained directly by inputting rainfall process data. In this study, rainfall data with time accuracy of 10 min was used, so the data of water depth at 10 min interval were also obtained.
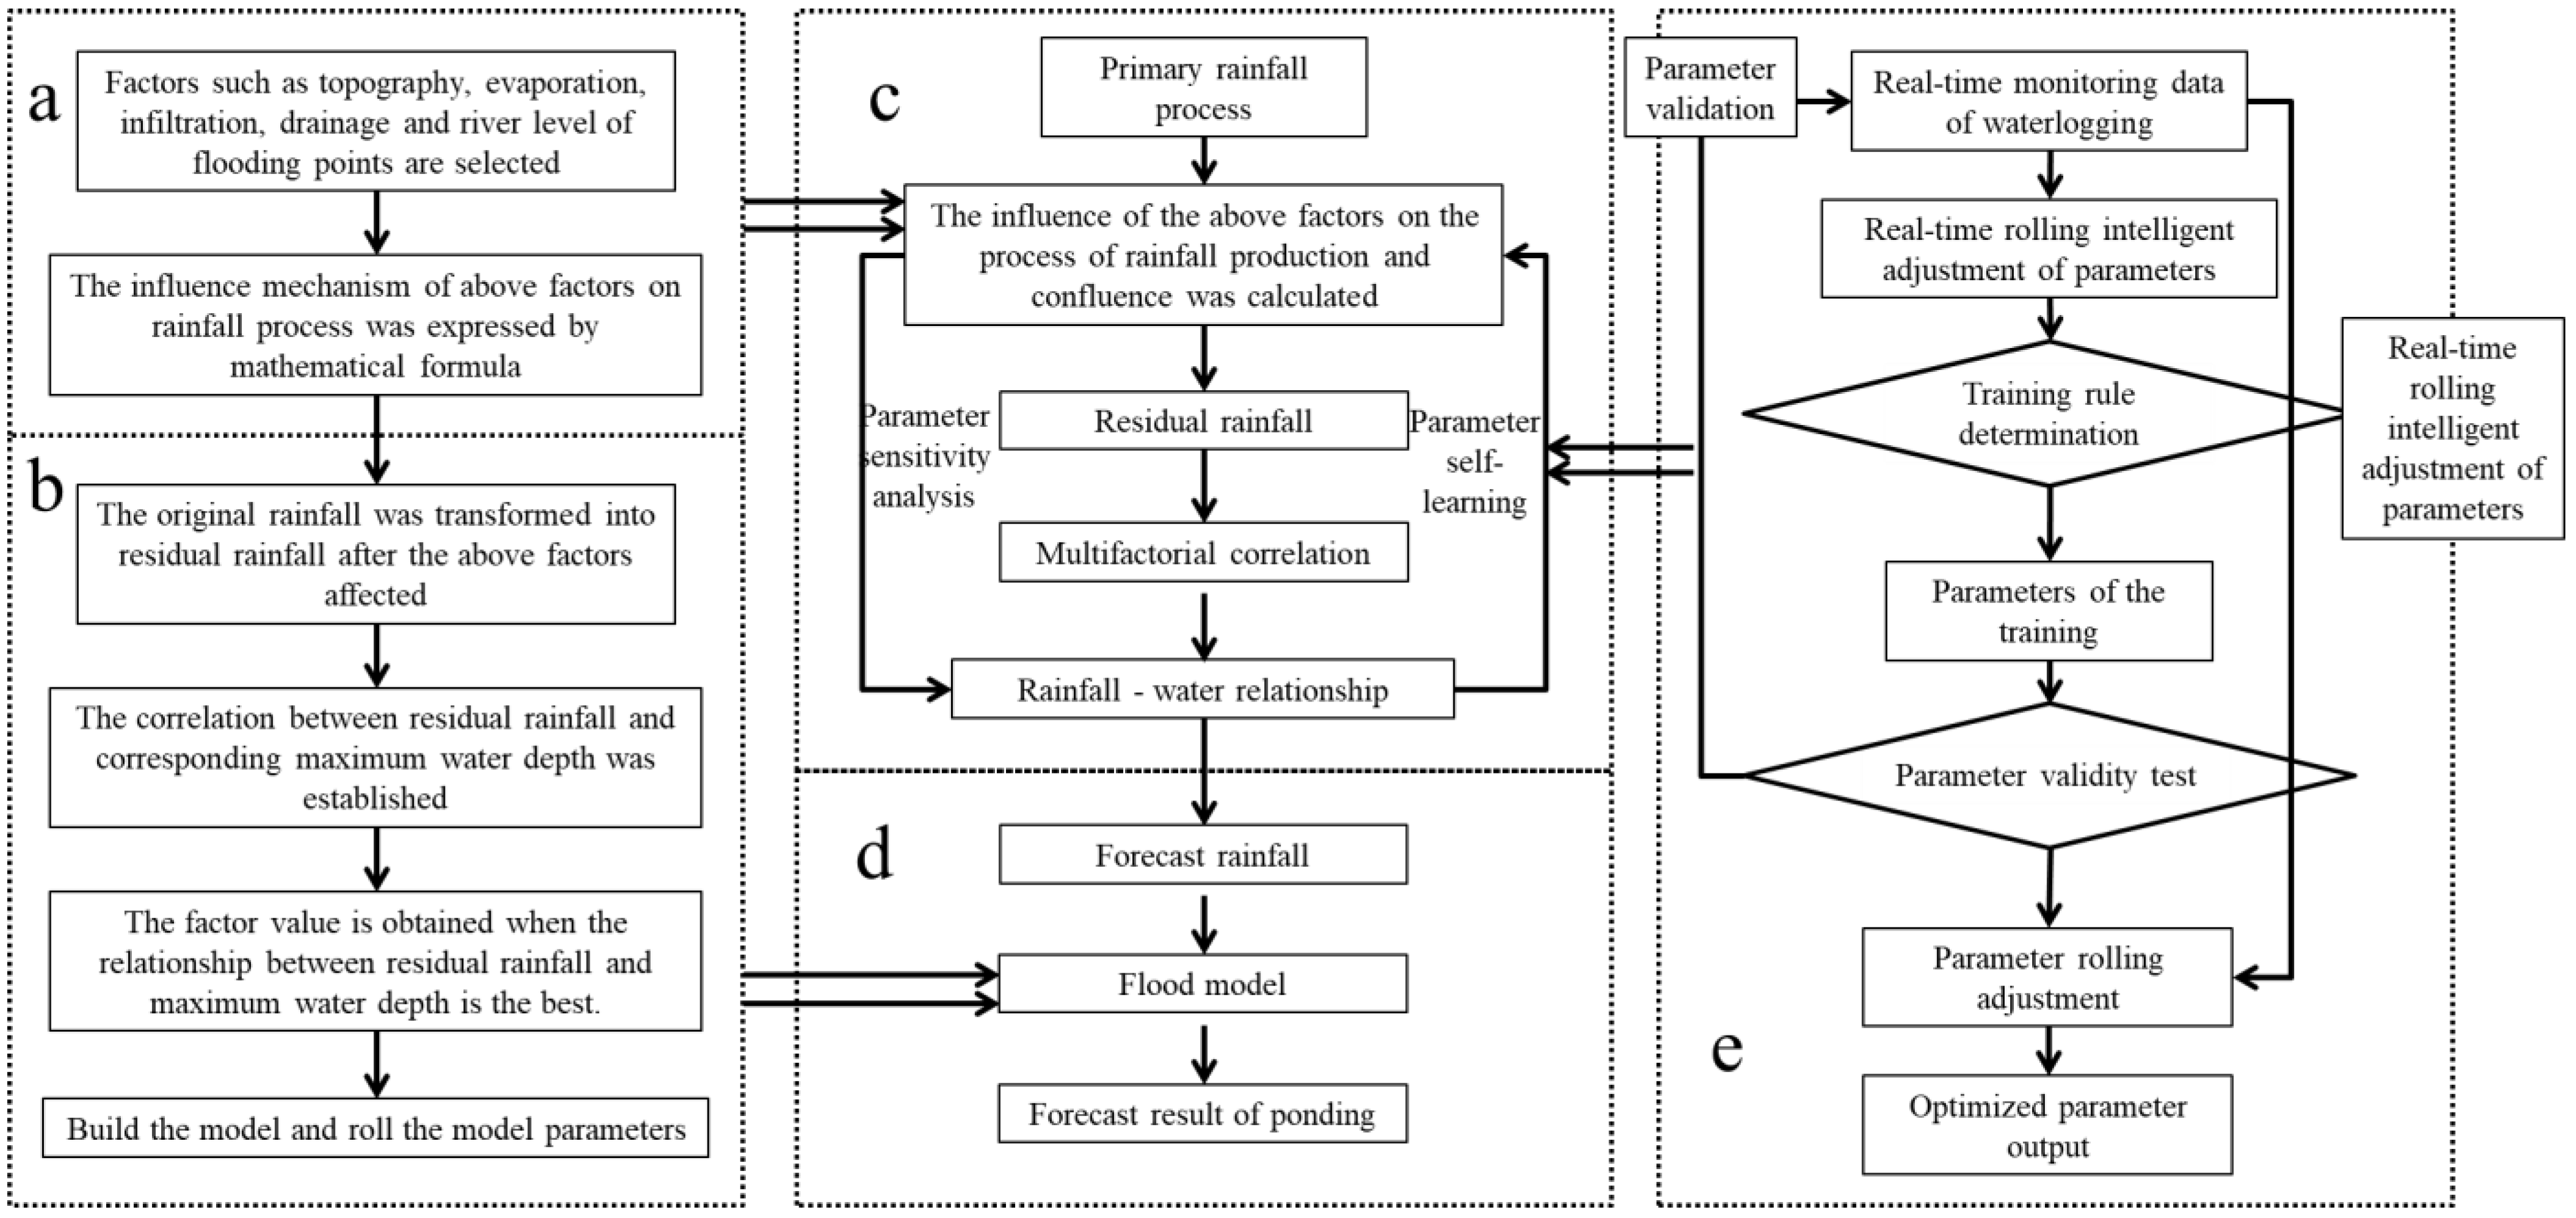
(7) The rain process is defined as the net rain process after the above factors are deducted/added. We searched for the first value that is greater than 0 in the net rain process. Subsequently, the cumulative net rain process was obtained by backward addition of the values; if the cumulative net rain process has a negative value, it will return to 0. The maximum sum was the maximum accumulated net rain corresponding to the maximum water depth. The maximum summation occurrence indicates the occurrence of the maximum water depth, and the moment when the first value greater than 0 appears in the cumulative net rain process is when the accumulated water appears. The moment after the occurrence of the last non-zero value is when the accumulated water disappears. After obtaining the correlation between the total net rain and the waterlogging depth, we used the regression equation to express the relationship between the total net rain at the current moment and the waterlogging depth to construct a multi-factor correlation model. The modeling process is shown in
Figure 2.
4. Model Validation
To verify the applicability of the multi-factor correlation model, the SWMM and Mike Urban models were simultaneously used to simulate waterlogging, and the accuracy of their simulations was compared. The SWMM and Mike Urban models are all integrated models based on hydrological processes, which can simulate runoff, pipe flow, and water quality. They can simulate the process of runoff to the pipe outflow under different rainfall conditions and include the simulation of various components of the system, such as stormwater intakes, pumping stations, and reservoirs. These three models are commonly used in engineering practices nationally and internationally.
SWMM is a dynamic precipitation-runoff simulation model developed by the American Environmental Protection Agency [
37]. It is mainly used to simulate a single precipitation event or the long-term water quantity and quality in the city. The runoff module comprehensively deals with the precipitation, runoff, and pollution load in each sub-basin, while the confluence module conducts water transmission through gray infrastructure, such as pipe networks, channels, water storage and treatment facilities, water pumps, and regulating gates. This model can continuously simulate the runoff and water quality of each sub-basin at any time under a variety of time steps, and the flow, depth, and water quality of each pipe and river [
38]; this has been widely used in the design of urban drainage management and flood control facilities, water quality modeling, and low-impact development [
39,
40,
41,
42,
43]. As the SWMM model is completely open source and is applicable to studies at different scales, we selected this model for urban waterlogging research.
The Mike model was developed by the Danish DHI Company. Mike series models include Mike 11, Mike 21, Mike Urban, etc., which can simulate the urban drainage pipe network, flood evolution, and sediment. It is a closed program software with a good interface and is suitable for river channels, lake network, drainage, dam breaks, tides, and other fields [
44,
45]. The latest version of MOUSE is included in Mike Urban. The main modules include rainfall infiltration, surface runoff, pipe flow, long-term statistics, real-time control, MOUSE TRAP series, and some independent modules, which can be used to calculate the storm runoff and realize real-time monitoring and online analysis.
4.1. Preliminary Validation of the Model
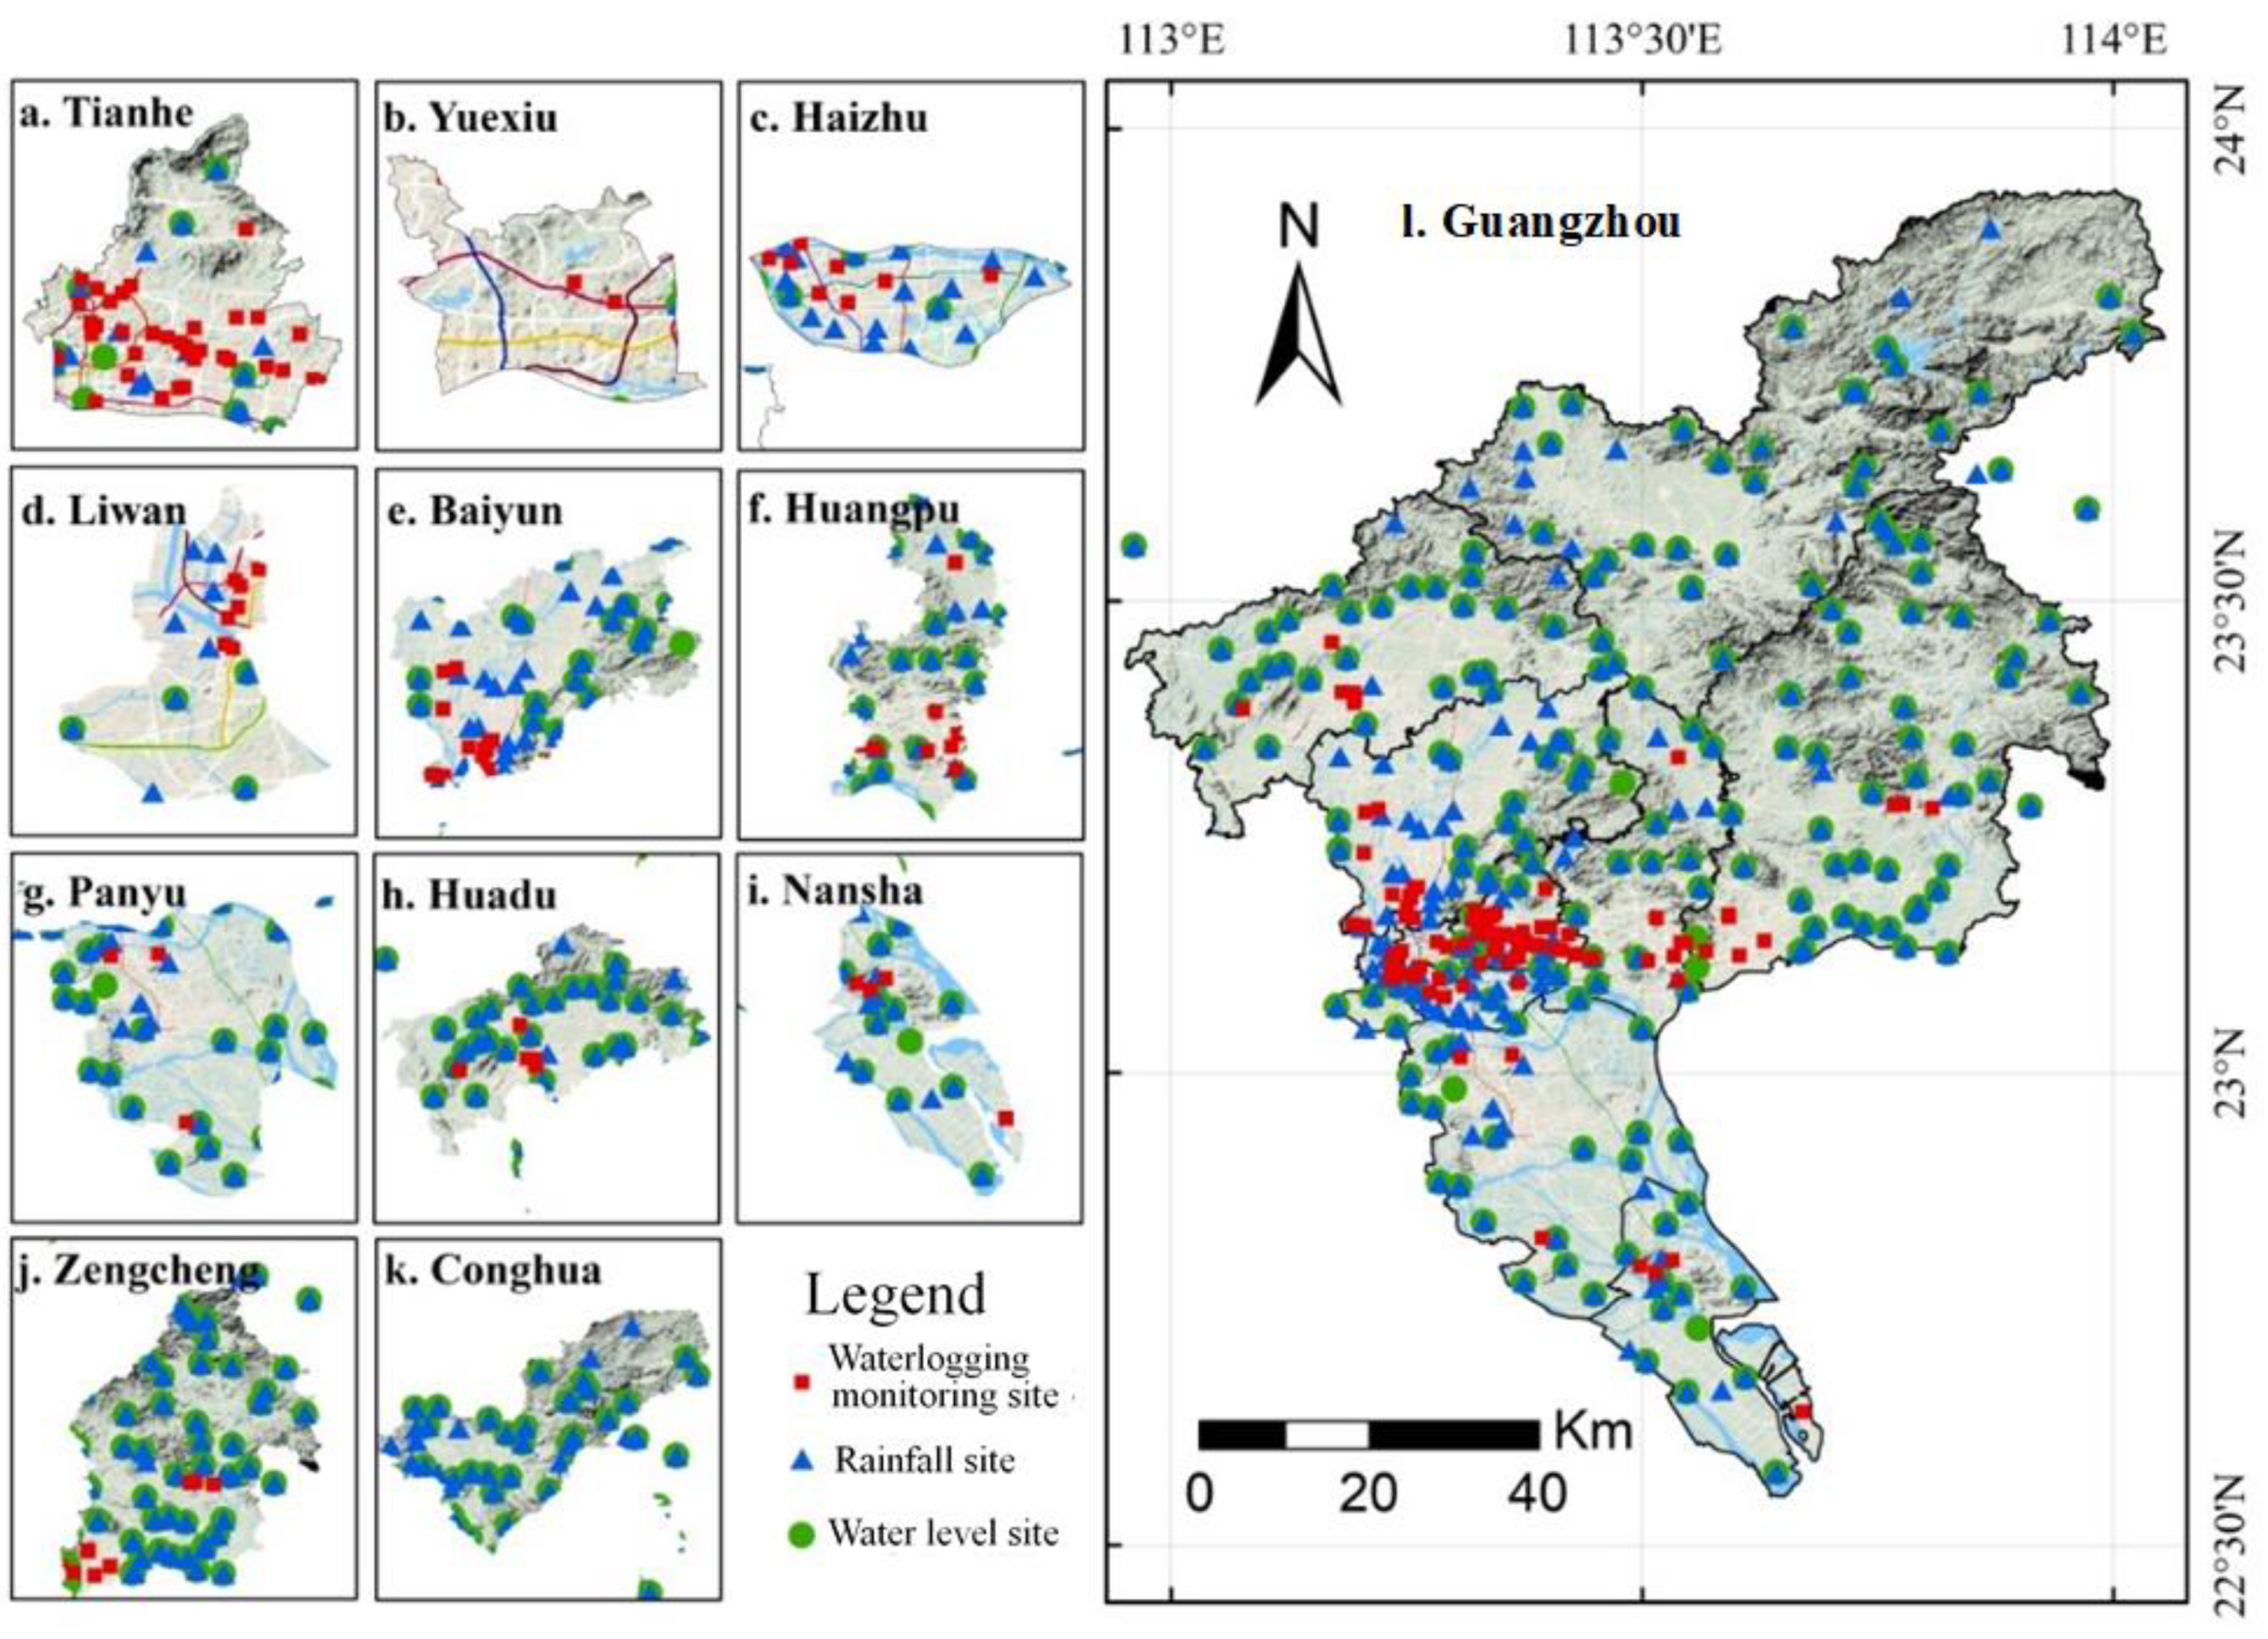
The Changfu Road (CR) tunnel, a typical waterlogging tunnel in the Tianhe District of Guangzhou, was selected as the research area. This flood point is in the suburbs, and is located near the expressway, characterized by a large traffic volume, low-lying terrain, and poor drainage, and is a flood-prone area. The height, length, and width of the tunnel are approximately 4.8, 60, and 8 m, respectively. The diameter of the drainage pipe is 400 mm, and the study area is 0.84 km2.
This waterlogging point monitored 13 rainstorms and waterlogging events in 2019. The data of these 13 rainstorm waterlogging events were used to update the model parameters. The calculated confluence time factor was 1.2, confluence amount factor was 0.4, evaporation factor was 0.2, infiltration factor was 3.9, and drainage factor was 2.5. As the drainage outlet of this waterlogged point was higher than the river water level, the river water level factor was not considered. The correlation between the maximum depth of waterlogged water and net rainfall is as follows:
Here, is the depth of the waterlogged water and is the net rainfall at the corresponding time.
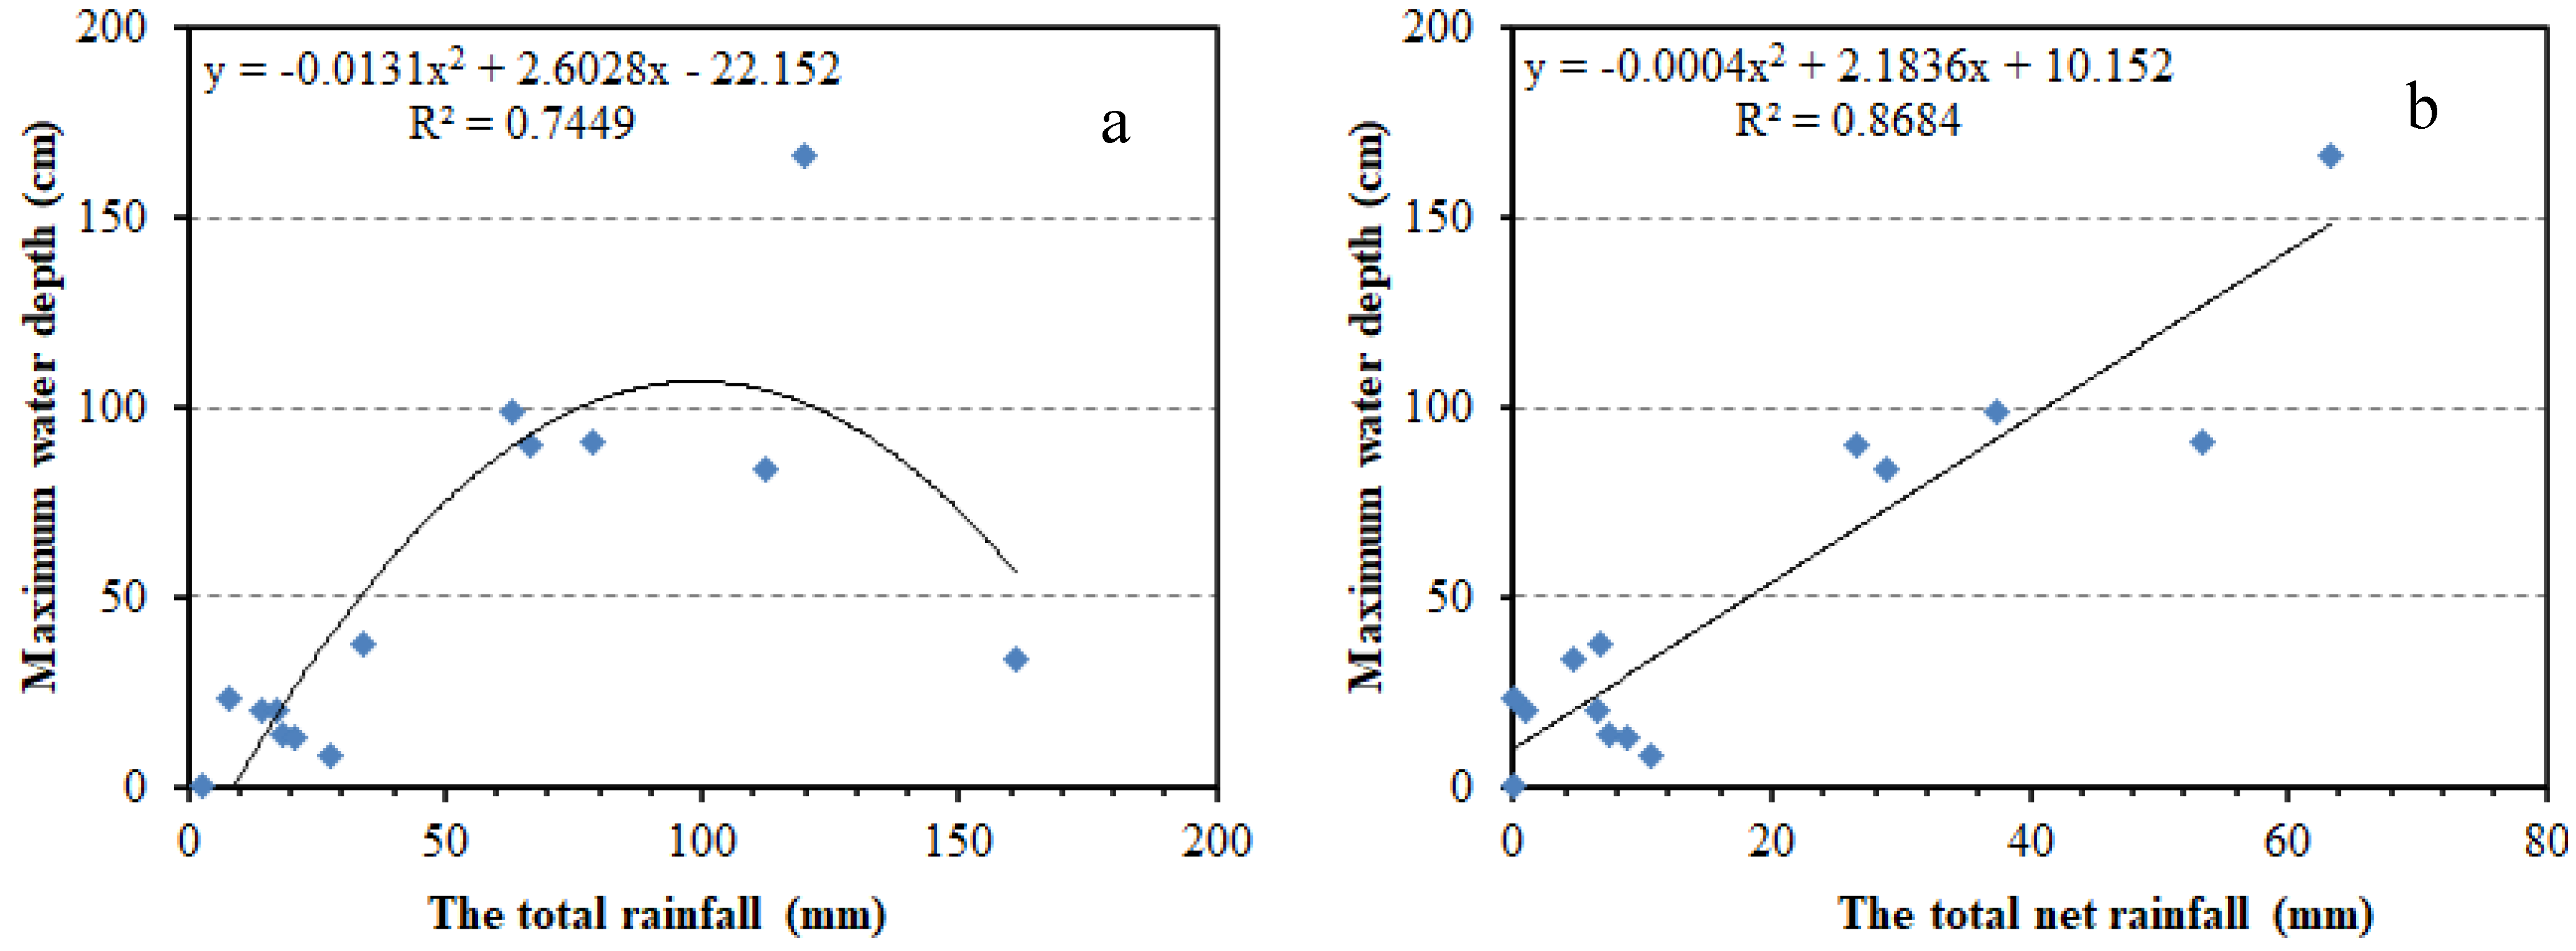
Figure 3 shows the correlation between the rainfall and maximum water depth based on 13 heavy rain events on CR tunnel.
Figure 3a shows a scatter plot (R
2 = 0.7449) of the total rainfall and maximum water depth.
Figure 3b shows a scatter plot (R
2 = 0.8684) of the total net rainfall and the maximum water depth. Notably, the correlation between the total net rainfall and the maximum water depth was better after deducting/adding the correlation factor value.
To correctly use the model for urban waterlogging simulation, the key is to optimize the model parameters reasonably. Because the core formula of the model is the regression formula of total net rain and maximum water depth, at least two events are needed for parameter calibration. However, since a virtual event with low rainfall and no water accumulation can be set, model construction and parameter calibration can be started after a real waterlogging event is collected. Therefore, sensitivity of the event field to the calibration effect of model parameters still requires further analysis.
Taking the CR tunnel waterlogging point as an example, a total of 13 real waterlogging events were collected from 2019 to 2020, and a virtual event with 0 water depth was added. A total of 14 waterlogging events were used for sensitivity analysis of model parameter optimization (
Table 2).
As can be seen from
Table 2, since the 4th waterlogging, the average error is less than 50%, and the goodness of fit index (R
2) tends to be stable. It means that when three or more real waterlogging events are collected by waterlogging points, the performance of the multi-factor correlation model optimized based on historical events in waterlogging simulation will gradually become stable. Also, we found that when extreme waterlogging events were added into the model calibration, the speed of model parameter optimization was greatly accelerated.
4.2. Model Comparative Analysis
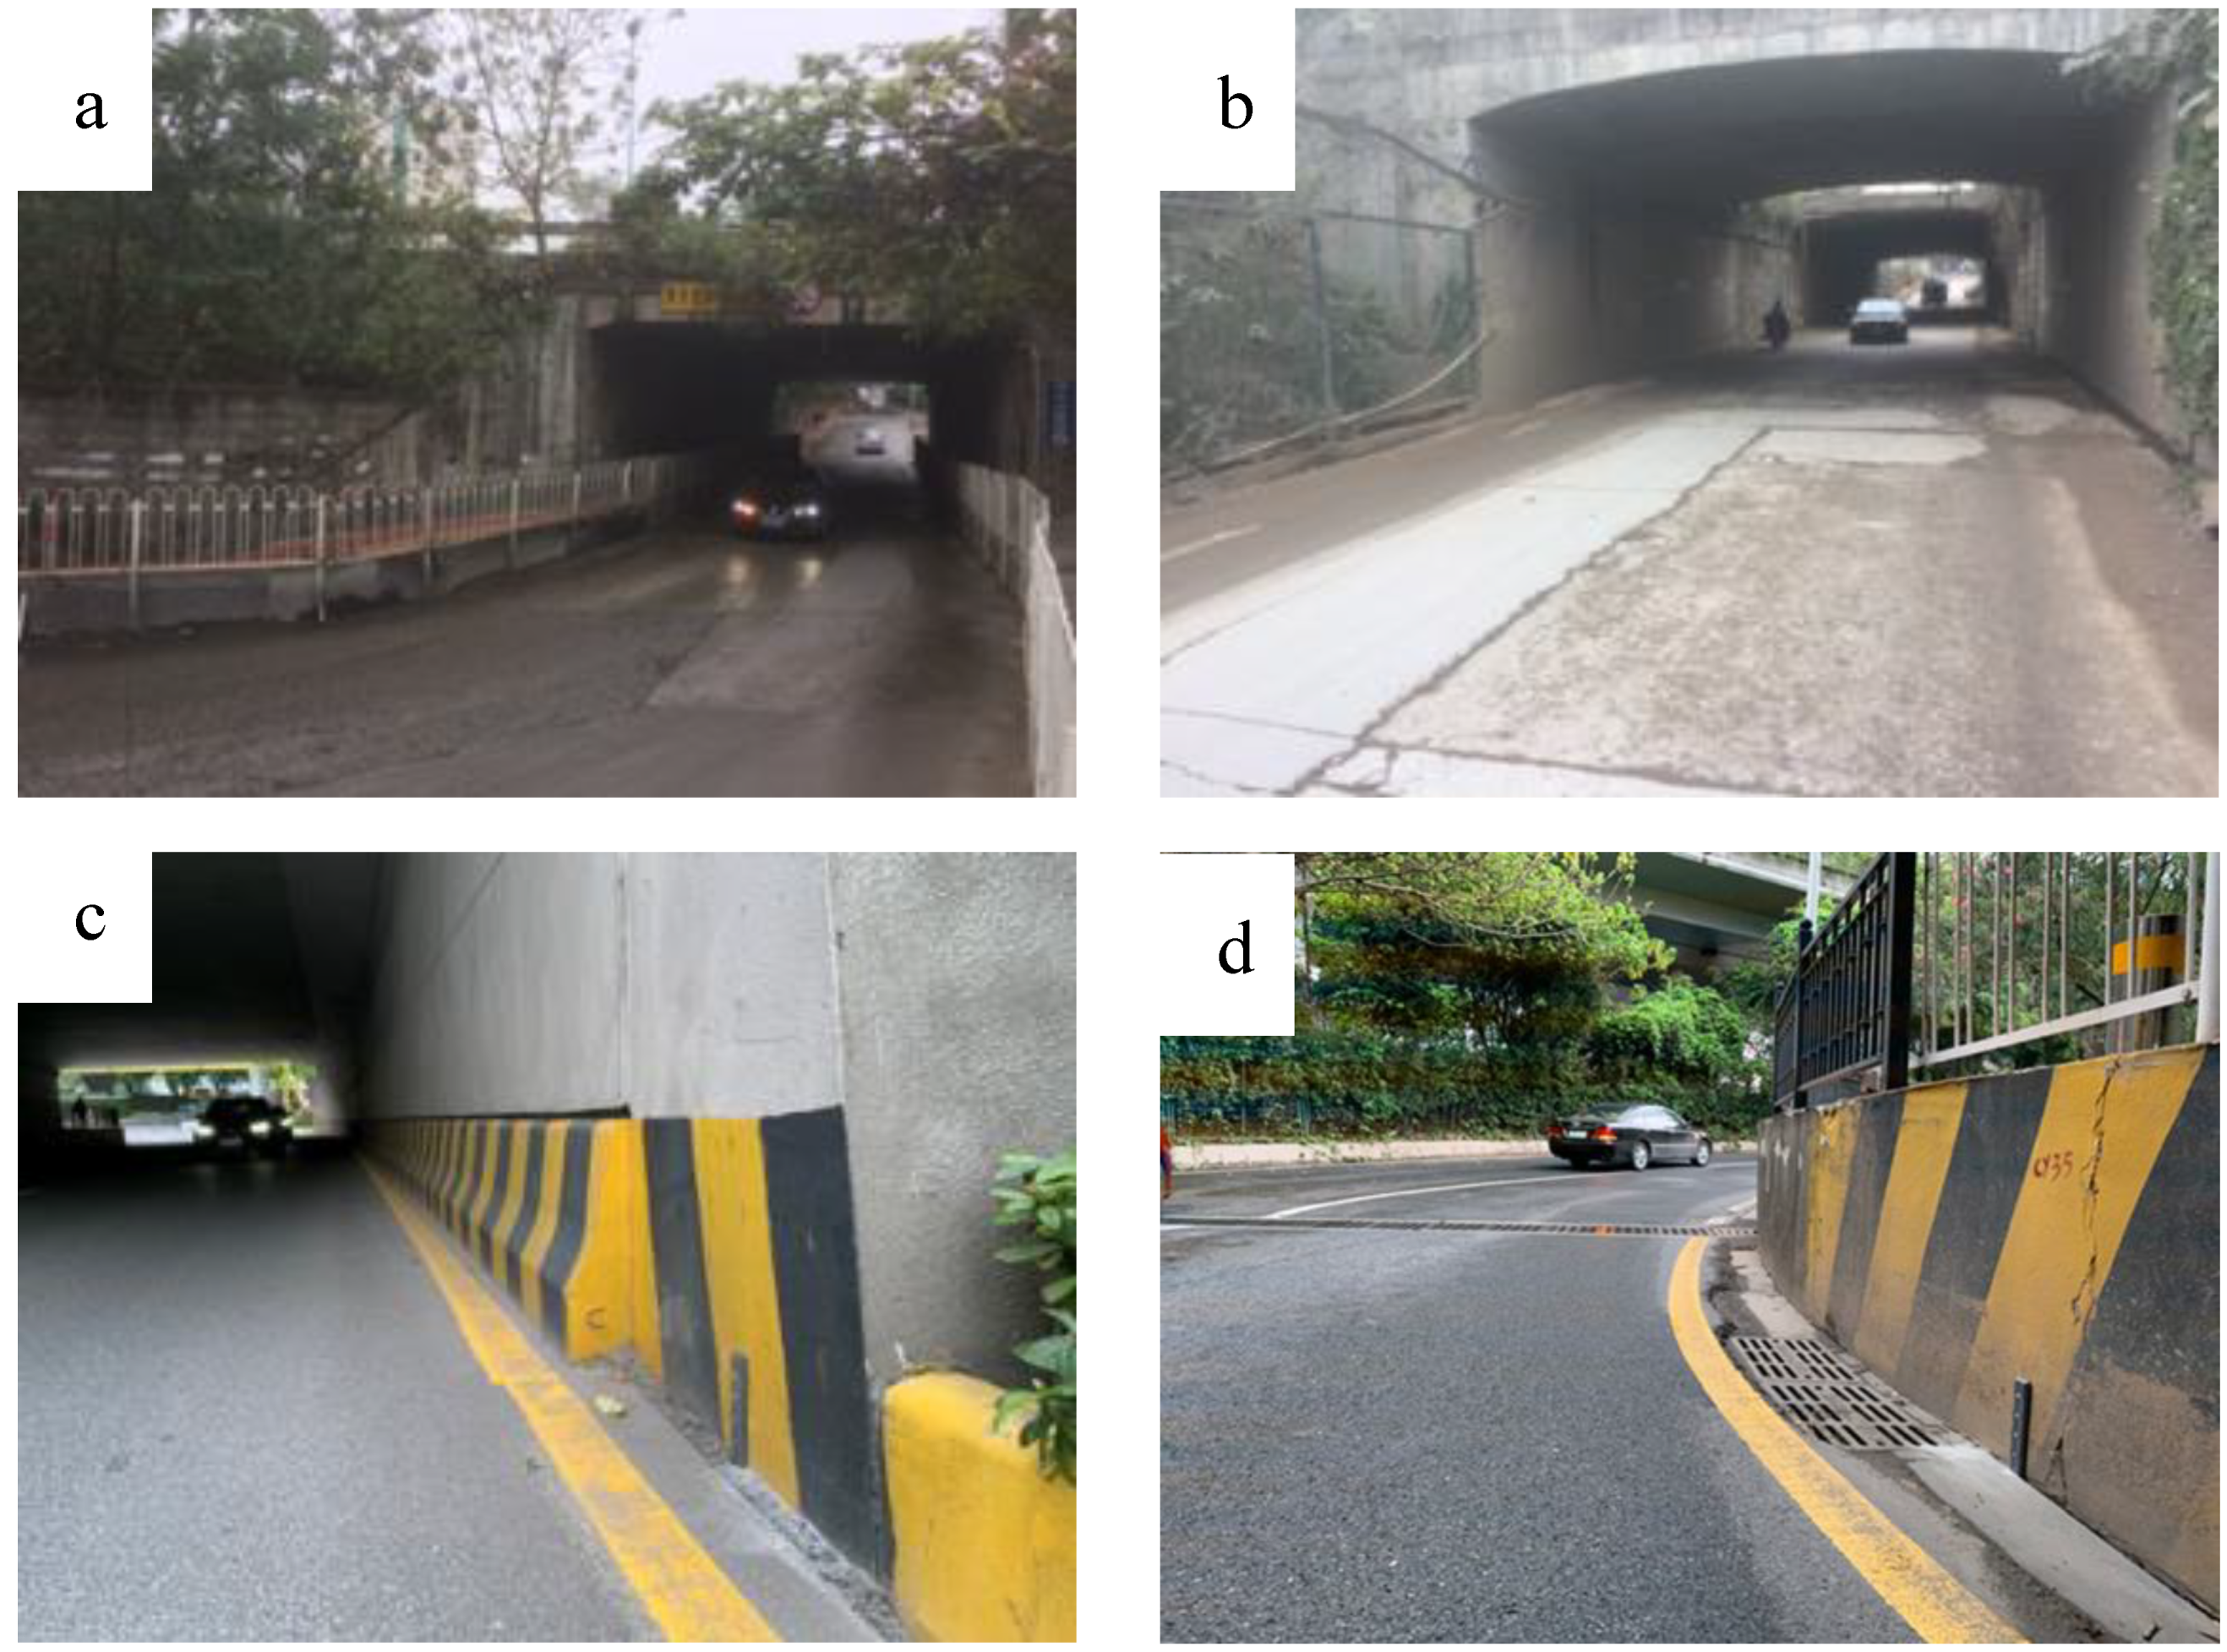
To better verify the accuracy of the multi-factor correlation model in simulating waterlogging events, four typical waterlogging black spots were selected for further comparative simulation analysis. In addition to the CR tunnel, three typical waterlogging-prone underpass tunnels in the Tianhe District of downtown Guangzhou were selected: Mupi Road (MR) tunnel, Tianshou Road (TR) tunnel, and Corner of Tianshou Road (COTR) tunnel. The four flood-prone underpass tunnels are all located near highways and belong to flood-prone areas. Among them, the MR tunnel is approximately 2.8 m in height, 30 m in length, and 6.5 m in width. The diameter of the drainage pipe is 400 mm. The TR Road tunnel and the COTR tunnel are both approximately 4.8 m in height, 35 m in length, and 35 m in width, and the diameter of the drainage pipe is approximately 800 mm. Photos of these four typical waterlogging points are shown in
Figure 4.CR tunnel and MR tunnel are located in the suburbs, while TR tunnel and COTR tunnel belong to the urban area. As can be seen from
Table 3, the theoretical drainage capacity of CR tunnel (0.84 m
3/s) and MR tunnel (0.76 m
3/s) is much lower than that of TR tunnel (1.70 m
3/s) and COTR tunnel (1.76 m
3/s). According to the collected historical waterlogging data, the frequency and severity of waterlogging in CR tunnel and MR tunnel are more serious than those in TR tunnel and COTR tunnel.
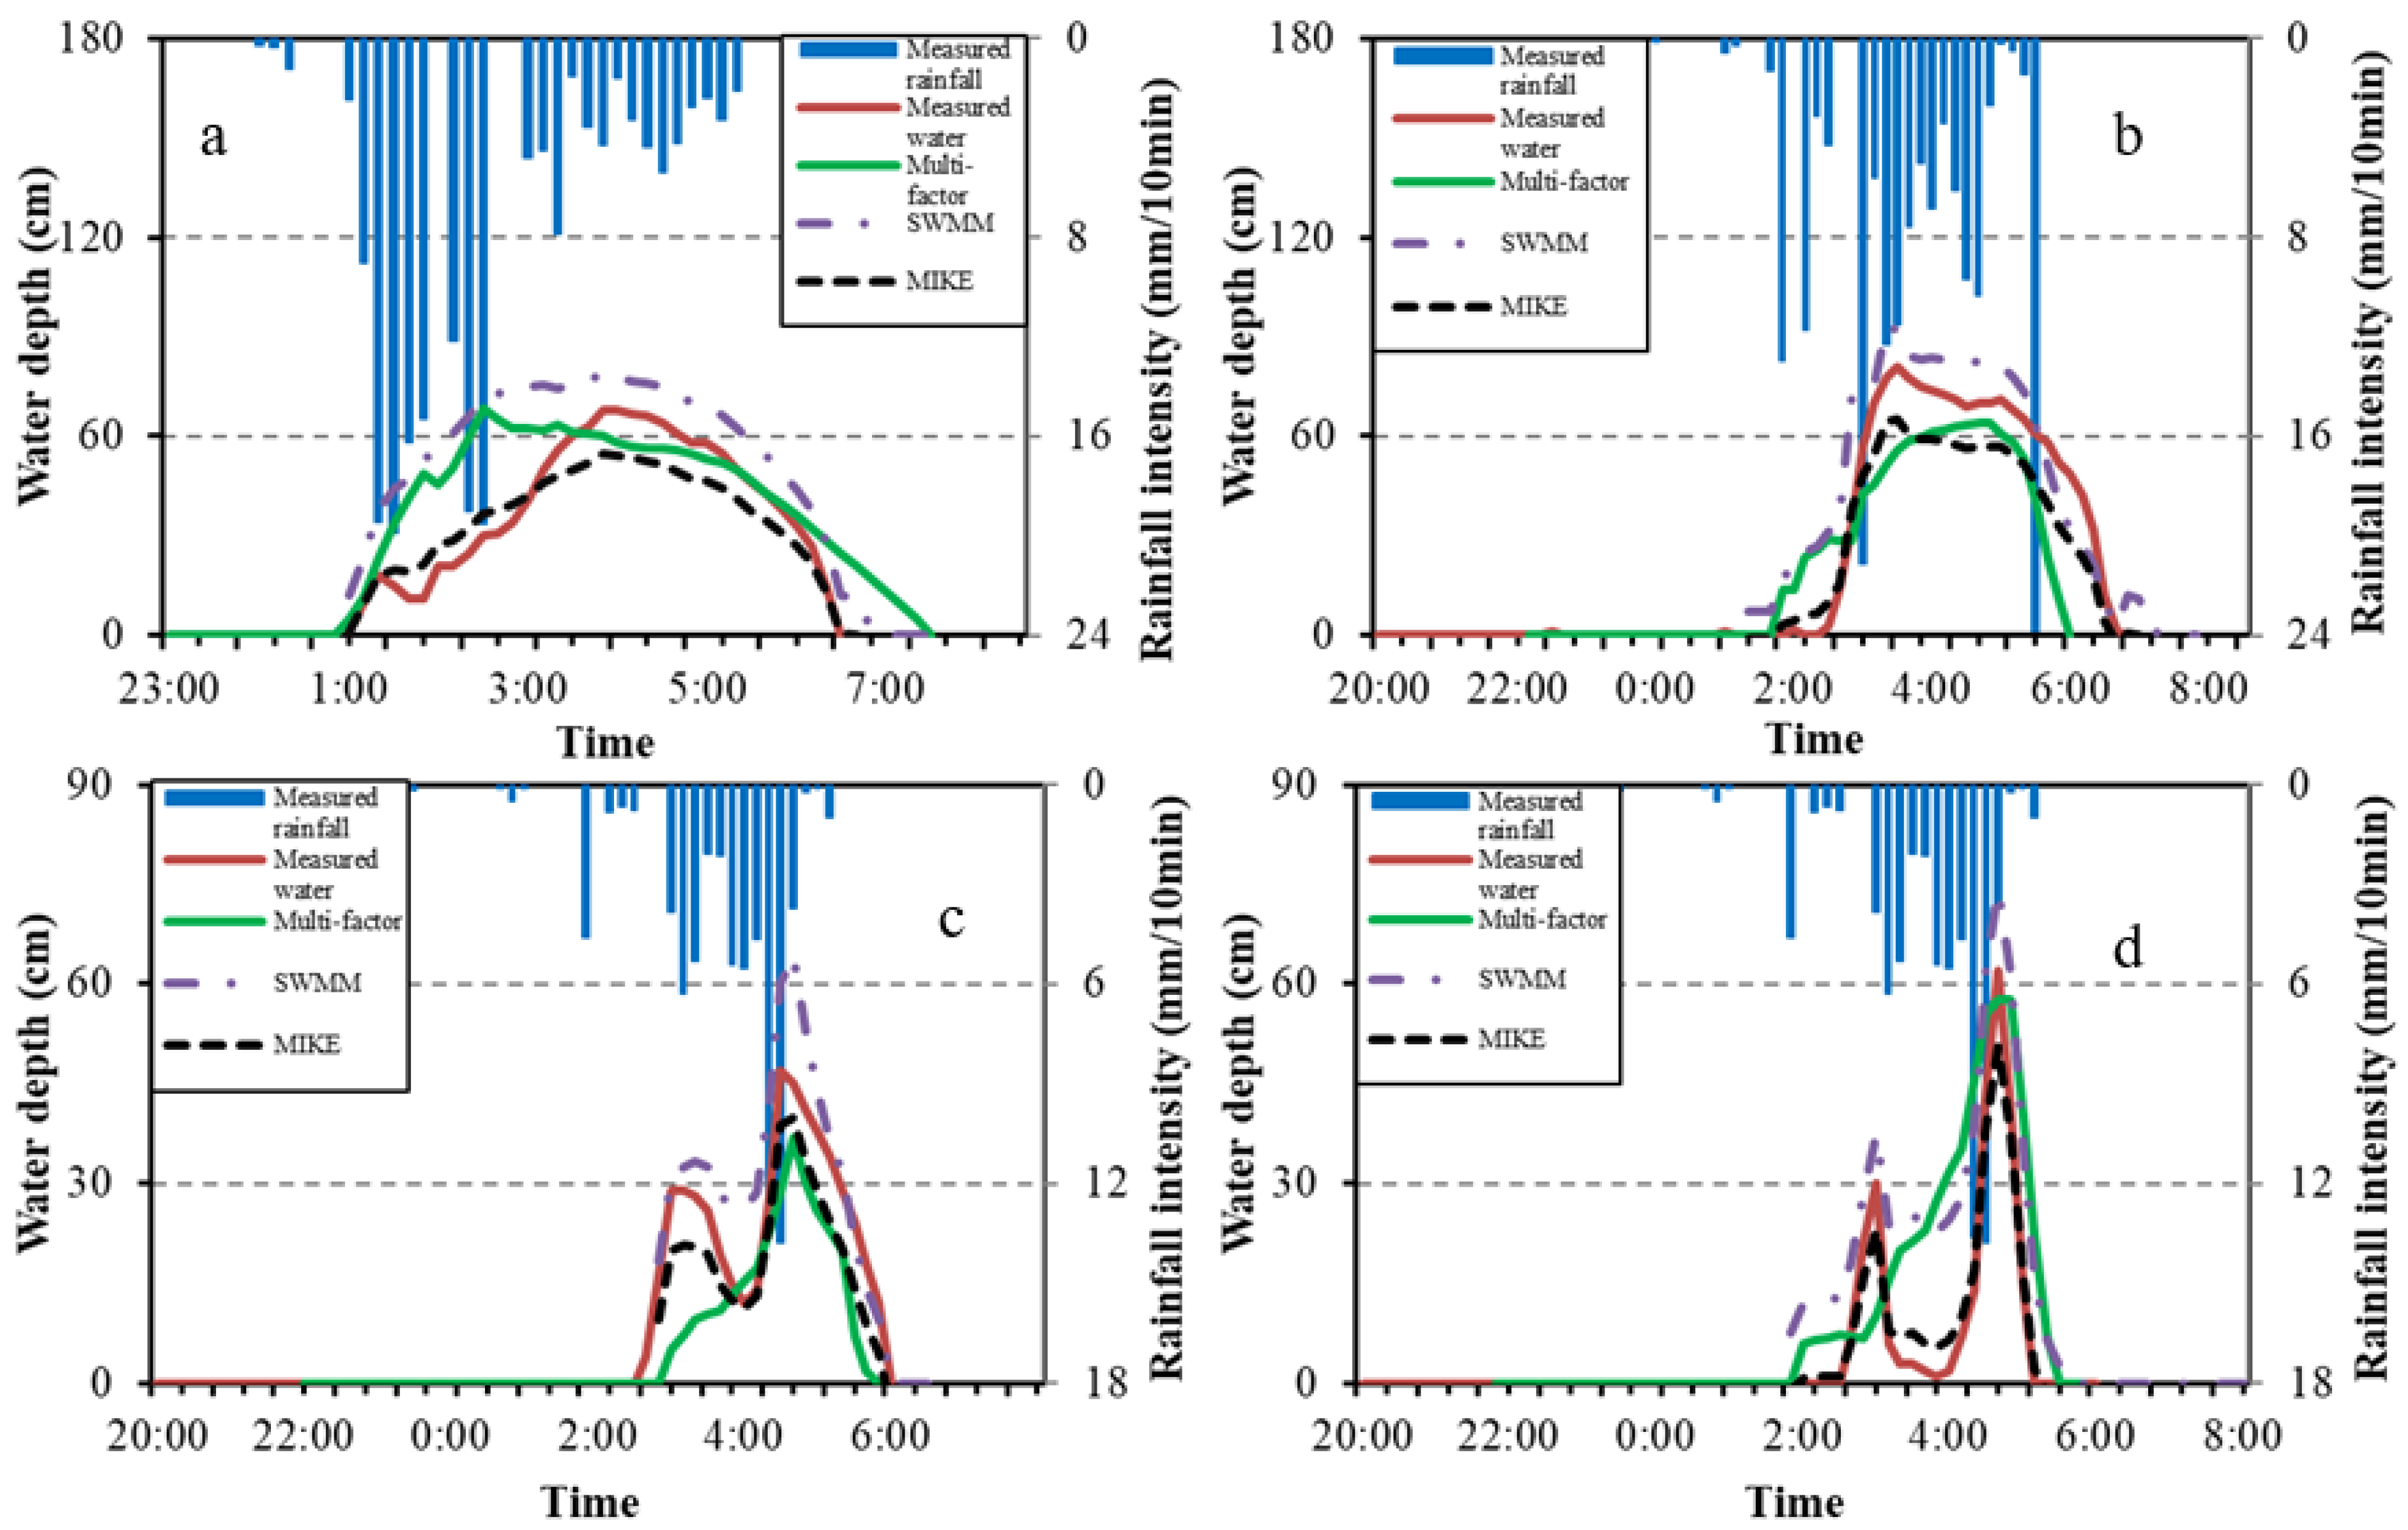
Historical data from 2019 to April 2020 were used to rate the model parameters. The waterlogging multi-factor correlation, SWMM and Mike Urban models were used to simulate and compare the waterlogging events that occurred on 22 May 2020. From
Table 4 and
Table 5, we can see the parameters of the three models optimized by historical data with four waterlogging points. Because of the different geographical locations of the four waterlogging points, their underlying surface attributes are quite different. The parameter with the greatest difference was slope in SWMM and Mike Urban models (
Table 4). Among them, the slope of CR tunnel and MR tunnel is much higher than that of TR tunnel and COTR tunnel, resulting in shorter convergence time of these two points, which makes waterlogging more serious to some extent (
Figure 5).
The value of delay coefficient in the multi-factor correlation model indicates the length of the convergence time, and this parameter of the two waterlogging points in the suburbs is shorter and also affected by slope (
Table 5). In terms of drainage parameter, we can see that relative to the other points, the drainage value of the COTR tunnel is unexpectedly small, which may be caused by the blockage of the drainage pipe network at this waterlogging point. Therefore, when the multi-factor correlation model is optimized by historical data, the model parameters can provide data support and direction for the rectification of waterlogging points for managers.
The simulation results of the multi-factor correlation model and Mike model are smaller than the measured waterlogging process, while the results of SWMM model are larger than the measured waterlogging process. The multi-factor correlation model pays more attention to the fitting of the maximum value, and the fitting degree of the waterlogging process especially for receding processes was not as good as that of the other two traditional models (
Figure 5).
Based on the data presented in
Table 6, we found that the error of the multi-factor correlation model (error = −13%) was the least for the simulation of the maximum water volume, followed by the Mike Urban model (error = −19%), and finally the SWMM model (error = 20%). There is little difference in the errors of the three models. Better prediction results can be obtained by using the ensemble forecast of multiple models in practice.
Table 7 shows that the multi-factor correlation model takes the least time, followed by the SWMM and Mike Urban models. At present, the multi-factor correlation model is known to be significantly advantageous in terms of the simulation speed in small-scale waterlogging simulations.
4.3. The Overall Validation
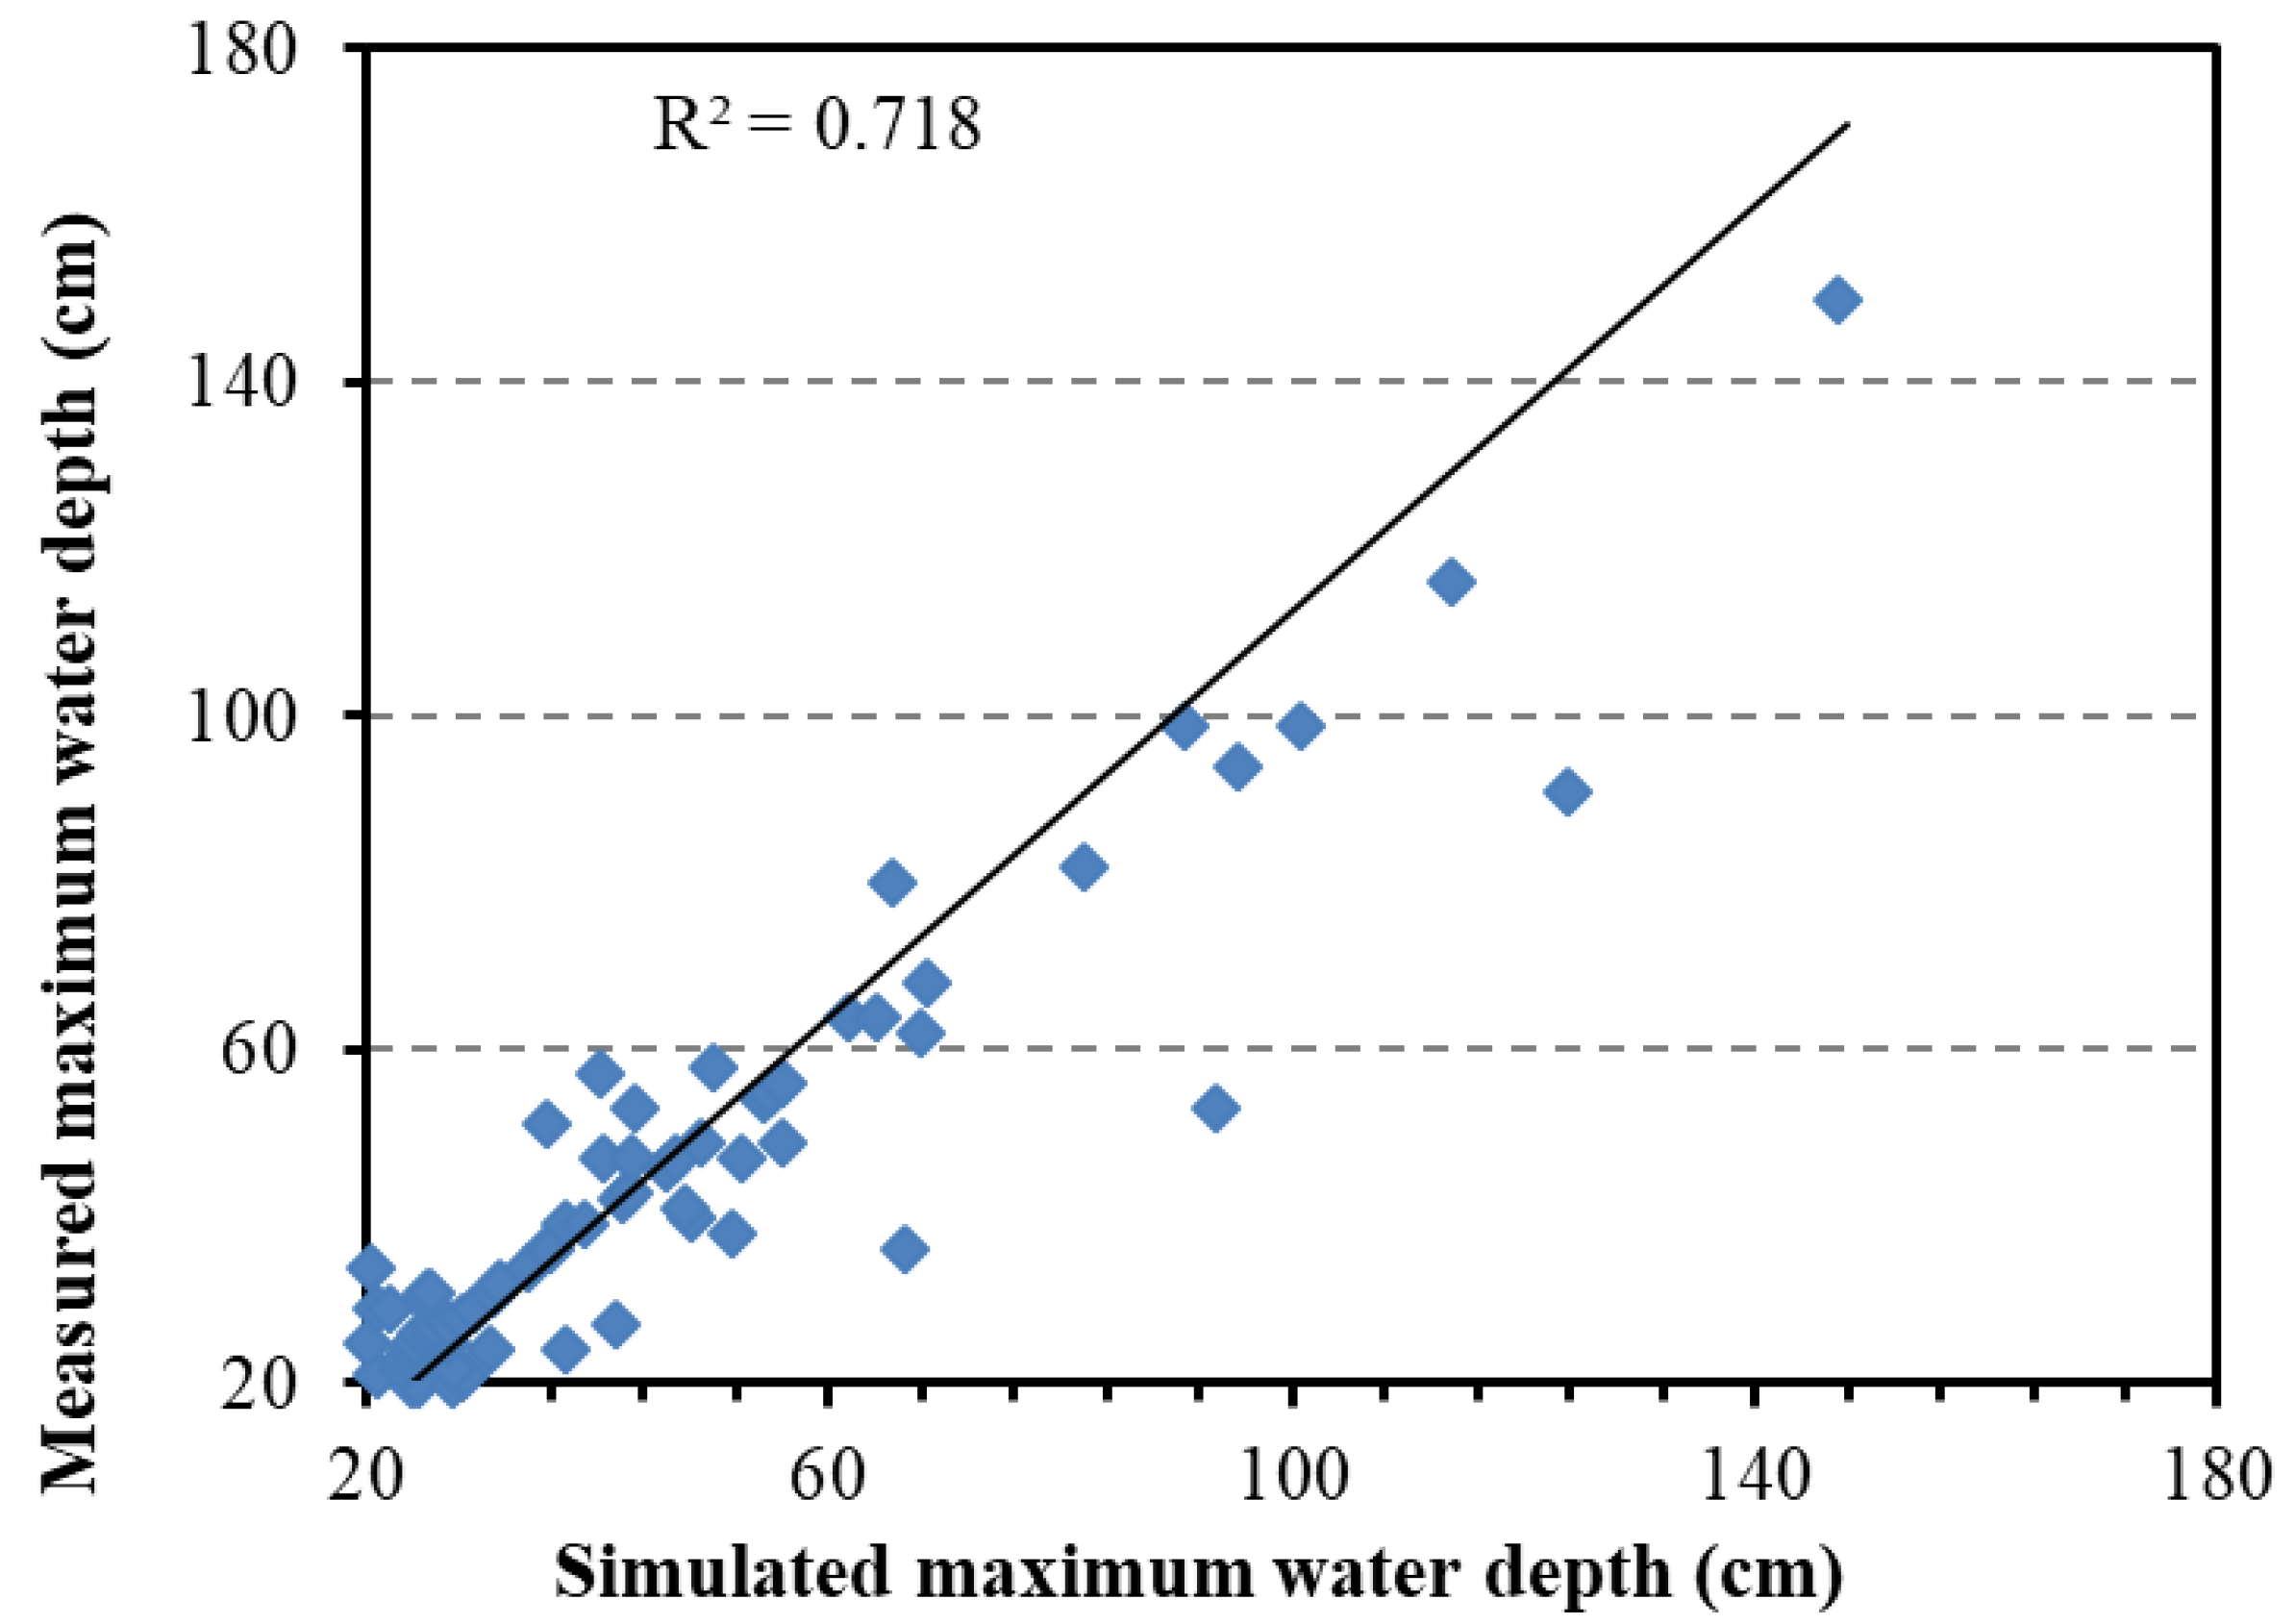
By analyzing the collected data of 93 waterlogging points in Guangzhou, 42 waterlogging points experienced three or more waterlogging events, and the maximum water depth exceeded 20 cm. Among them, 19 waterlogging points (46%) are located in urban areas, and 23 waterlogging points (54%) are located in suburbs. The overall distribution of waterlogging points which were selected to build the model in the city is relatively even. Each waterlogging point was modeled based on the historical field, and the last rainstorm was used for model verification. The mean error of the comparison between the simulated maximum waterlogging and the measured maximum waterlogging was 3%, and the R
2 value was 0.718 (
Figure 6).
5. Discussion
5.1. Urban Waterlogging
In recent years, extreme flood events have occurred frequently in China; one of the most serious was the Zhengzhou “7.20” incident of 2021. According to the China Meteorological Administration, the average rainfall in Zhengzhou reached 458.2 mm from July 17 to 21, with the maximum hourly rainfall reaching 201.9 mm, exceeding the historical maximum of 198.5 mm on the Chinese mainland. The maximum total rainfall in three days was close to Zhengzhou’s average annual rainfall of 640.8 mm. Both hourly precipitation and single-day precipitation exceeded the historical records of 60 years since Zhengzhou station was established in 1951. Due to the extreme rainstorm, 302 people died and 50 people were missing. The flood event caused heavy casualties and property losses.
In the early morning of 7 May 2017, there was a heavy rainstorm in Guangzhou, with the maximum hourly rainfall of 184.4 mm and the maximum 3-h rainfall of 382.6 mm, both of which were the historical extreme values in Guangdong Province, and the maximum 3-h rainfall exceeded the “7.20” event in Zhengzhou. On 22 May 2020, a heavy rainstorm occurred again in Guangzhou, with the maximum hourly rainfall of 167.8 mm, more than the rainfall in Guangzhou in 100 years. Four people died in the severe rainfall. Therefore, Guangzhou is highly likely to have extreme flooding events in the future.
Facing the severe waterlogging disaster risk situation in Guangzhou, it is urgent to improve the waterlogging monitoring and early warning system to reduce disaster loss. At present, the waterlogging monitoring and early warning system in Guangzhou only have simple functions such as video monitoring and rainfall monitoring, but the system has no available flood simulation and forecast functions, which cannot effectively support the water department to carry out emergency rescue work in a timely fashion.
5.2. A Supplement to the Traditional Waterlogging Model
Urban waterlogging simulation involves not only natural hydrologic and hydrodynamic processes such as rainfall, surface runoff, pipe network drainage, and river flood discharge, but also human factors such as social economic development and urban management. It is a kind of urban disaster under the combined effects of human and natural factors. The spatial distribution of waterlogging black spots is dynamic, and the disaster mechanism is complex and has significant regional differences. The complexity of the waterlogging physical process, the synthesis of driving factors, and the high spatial heterogeneity of urban built environment bring great challenges to urban hydrological research and waterlogging simulation. The specific manifestations are insufficient model representation, low computational efficiency, lack of basic data, and model validation data, etc.
Hydrodynamic simulation is the main method of urban waterlogging simulation, which has a definite physical basis and can express the hydrodynamic process with high precision. However, it has high requirements on model data and relies on validation data such as flow and water level to calibrate model parameters. In addition, the computational efficiency of hydrodynamic simulation is low. Although the computational power can improve through hardware development and parallel computing, it still faces great challenges to conduct high-precision and rapid simulation at the urban scale of hundreds of square kilometers, especially when multi-scenario simulation is required. The machine learning method has strong pattern recognition ability and high computational efficiency, but ignores the hydrodynamic physical process, and its conclusions are restricted by training samples, so it has obvious weak regional and generalization ability. Therefore, these two types of methods have good complementarity. Combined with hydrodynamic simulation and machine learning, a new waterlogging simulation method with both physical basis and computational efficiency can be established to realize near-real-time simulation, rapid forecast, and early warning of waterlogging.
This study aims to build a basic and flexible hydrodynamic model, train the parameters of the model with machine learning method based on monitoring data, then build the correlation between rainfall and water depth. Compared with the traditional model, the new model has great potential in the aspects of data requirement, modeling speed and operation speed. Because of the above characteristics, the new model can greatly reduce the application threshold of waterlogging simulation and forecast. In practical application, we can carry out the traditional model modeling in the area with sufficient underlying surface data and carry out the new model modeling in the area with insufficient data, and finally adopt the multi-model coupling method to predict urban waterlogging. The simulation results of various models can provide more comprehensive data support for waterlogging control.
5.3. Application of the Multi-Factor Correlation Model
In this paper, the multi-factor correlation model was established to simulate the process of urban waterlogging in Guangzhou, and SWMM and Mike Urban models used for comparison and verification. Firstly, the model parameters calibrated based on the historical event data in 2019. Secondly, the waterlogging event on 22 May 2021 was used to compare and verify the simulation results of the four models in three small watersheds.
The results show that the performance of multi-factor correlation model is better than or roughly equal to that of SWMM and Mike Urban models in simulating the maximum water depth, but the simulation of the waterlogging process is not as good as either model. The results of this study need to be validated by more studies in other areas. After further verification, the multi-factor correlation model with the advantages of convenient modeling and fast calibration will be of great application value in urban drainage design of Guangzhou and even other cities in South China with similar climate environment.
Based on the sensitivity analysis of waterlogging field to model optimization, we found that the construction of multi-factor correlation model requires at least three historical events for parameter calibration. After three or more historical events are calibrated, the simulation results are more reliable.
At present, the multi-factor correlation model has been integrated into the waterlogging prevention and control system of water management department and electric power department in Guangzhou city, which provided relevant waterlogging forecasting services. In Guangzhou, there are more than 400 waterlogging points recorded in the books of the water management department. Because the city is always built fast, the underlying surface is constantly changing. As a result, dozens of new waterlogging points appear every year, and old waterlogging points are effectively alleviated by prevention and control measures in place. Considering the above problems, when we use traditional models to build waterlogging models, it will bring a lot of workloads of model construction and calibration, which is not conducive to the extensive development of waterlogging simulation and forecast. The new model can be used for rapid modeling, parameter adjustment, and simulation forecast of newly emerging waterlogging points and waterlogging points with changed underlying surface, providing technical support for waterlogging prevention and control for water management departments.
6. Conclusions
China faces severe challenges in urban flooding due to its dramatic urbanization and relatively poor storm water management. A partial reason for this phenomenon in China is that the commonly used urban waterlogging models have relatively complex structures and building requires a lot of basic data. However, due to the large number of urban waterlogging points and the changing underlying surface, it is difficult to build and calibrate the model. Thus, the urban waterlogging simulation is still far from being used as data support for emergency command and disaster relief of urban water departments. This paper aimed to establish a new simulation model based on scientifically quantifying the effect principle of environmental influence factors of waterlogging black spots on the relationship between rainfall and waterlogging. As opposed to the traditional hydrodynamic model, the new model can greatly improve the speed of modeling and simulation. In order to improve the accuracy of new model simulation, the data mining method is used to adjust model parameters quickly and in real time. The results are summarized below.
Urban waterlogging mainly caused by excessive rainfall, and the relationship between net rainfall and maximum water depth is better than that between original rainfall and maximum water depth. In this study, a formula for the correlation between each influencing factor and its consumed rainfall was established. The net rainfall was calculated by adding/deducting the added/loss value from the original rainfall directly, and then the rainfall and water depth were correlated based on the topography. Finally, the model quickly forecasted the waterlogging through the input rainfall. The multi-factor correlation model is improved more by speed and applicability of the waterlogging simulation than by the traditional hydrodynamic model.
After sensitivity analysis of the waterlogging field to model optimization, it was found that a stable multi-factor correlation model for waterlogging point requires at least three historical event data for parameter calibration, and the simulation results of the optimized model are stable and reliable. Therefore, the waterlogging points with only three or more waterlogging events are selected to build a multi-factor model for simulation and verification.
Compared with the traditional hydrologic and hydrodynamic models (SWMM and Mike Urban), the multi-factor correlation model (error = −13%) presented the least error in simulating the maximum water volume, followed by the Mike Urban model (error = −19%), and finally the SWMM model (error = 20%). In simple waterlogging point simulation, the multi-factor correlation model and SWMM model required the least calculation time (less than 1 s), followed by the Mike Urban model (about half a minute). Therefore, the multi-factor model has great advantages in precision and simulation speed in the simulation of a large number of urban waterlogging points with simple causes.
There are 42 waterlogging points that were selected to further validate the model. Each waterlogging point was modeled based on the historical field, and the last rainstorm was used for model verification. The mean error of the comparison between the simulated maximum waterlogging and the measured maximum waterlogging was 3%, and the R2 value was 0.718.
In summary, the multi-factor correlation model requires fewer basic data, has a simple modeling process and wide applicability, and is easy to realize intelligent parameter adjustment, which can better meet the urgent demand of current urban waterlogging forecasts. Moreover, the model results show good empirical accuracy and can provide scientific decision support for urban waterlogging prevention and control.
The multi-factor correlation model has great potential in the simulation and forecasting of urban waterlogging after further validation. The multi-factor correlation model was built and verified by using three-year data from 92 sites in this study. More site data with longer periods are needed to verify the multi-factor correlation model in a future study.


