Article

Nitrogen Modulates the Effects of Short-Term Heat, Drought and Combined Stresses after Anthesis on Photosynthesis, Nitrogen Metabolism, Yield, and Water and Nitrogen Use Efficiency of Wheat

1
Key Laboratory of Agricultural Soil and Water Engineering in Arid and Semiarid Areas, Ministry of Education, College of Water Resources and Architectural Engineering, Northwest A&F University, Xianyang 712100, China
2
Department of Plant and Wildlife Sciences, Brigham Young University, Provo, UT 84602, USA
*
Author to whom correspondence should be addressed.
Water 2022, 14(9), 1407; https://doi.org/10.3390/w14091407
Submission received: 28 March 2022 / Revised: 22 April 2022 / Accepted: 26 April 2022 / Published: 28 April 2022
(This article belongs to the Section Water, Agriculture and Aquaculture)

Abstract

:
More frequent and more intense heat waves and greater drought stress will occur in the future climate environment. Short-term extreme heat and drought stress often occur simultaneously after winter wheat anthesis, which has become the major constraint threatening future wheat yield. In this study, short-term heat, drought and their combination stress were applied to wheat plants after anthesis, and all wheat plants were restored to the outdoor normal temperature and full watering after stress treatment. The aim of the current study was to evaluate the role of nitrogen (N) in modulating the effects of post-anthesis short-term heat, drought and their combination stress on photosynthesis, N metabolism-related enzymes, the accumulation of N and protein and growth, as well as on the yield and water (WUE) and N use efficiency (NUE) of wheat after stress treatment. The results showed that compared with low N application (N1), medium application (N2) enhanced the activities of nitrate reductase (NR) and glutamine synthase (GS) in grains under post-anthesis heat and drought stress alone, which provided a basis for the accumulation of N and protein in grains at the later stage of growth. Under post-anthesis individual stresses, N2 or high application (N3) increased the leaf photosynthetic rate (An), PSII photochemical efficiency and instantaneous WUE compared with N1, whereas these parameters were usually significantly improved by N1 application under post-anthesis combined stress. The positive effect of increased An by N application on growth was well represented in a higher green leaf area, aboveground dry mass and plant height, and the variation in An can be explained more accurately by the N content per unit leaf area. Short-term heat, drought and combined stress after anthesis resulted in a pronounced decrease in yield by reducing grain number per spike and thousand kernel weight. The reduction in NUE under combined stress was higher than that under individual heat and drought stress. Compared with N1, N2 or N3 application significantly prevented the decrease in yield and NUE caused by post-anthesis heat and drought stress alone. However, N1 application was conducive to improving the productivity, WUE and NUE of wheat when exposed to post-anthesis combined stress. The current data indicated that under short-term individual heat and drought stress after anthesis, appropriately increasing N application effectively improved the growth and physiological activity of wheat compared with N1, alleviating the reduction in yield, WUE and NUE. However, under combined stress conditions, reducing N application (N1) may be a suitable strategy to compensate for the decrease in yield, WUE and NUE.

1. Introduction

Short-term extreme high temperatures have become one of the main forms of climate change [1]. The climate model predicts that the global temperature will rise by 1.5–4.5 °C by the end of this century [2]. An increased frequency in the occurrence of extreme weather events, such as short-term heat waves and drought, is also expected in future climate changes [1,2,3,4]. These stresses often occur simultaneously and interact physically, at least in some areas. Wheat is the second largest and second most widely cultivated cereal crop species worldwide [5], but it is very vulnerable to post-anthesis heat and drought stress [6,7]. Furthermore, in most wheat-producing areas in northwestern China, including the Guanzhong Plain, this sensitivity may rise in the future climate environment [8,9,10], which may significantly inhibit crop growth and cause a severe reduction in yield [11,12].
Severe drought stress and exceeding the optimum temperature for a period of time will cause irreversible negative effects on plant growth and development [13,14]. The effects of drought stress and heat waves are primarily reflected in the reduction in photosynthetic leaf area, biomass, plant height, and early senescence [13]. In addition, both heat and drought stress directly affect many physiological and biochemical processes of plants. Under heat stress conditions, disordered chloroplast function and low photosystem efficiency under heat stress are considered to be the major constraints for a reduced photosynthetic rate [15]. In crops, the limitation of stress factors, such as heat and drought, and their interaction with growth and photosynthesis are associated with changes in plant nitrogen (N) status [16,17]. Previous studies have reported that both heat and drought stress significantly depressed nitrogen metabolism enzyme activities and reduced plant nitrogen accumulation [18]. Nitrate reductase (NR) and glutamine synthetase (GS) are the main enzymes involved in assimilating ammonium into organic compounds [19]. It has been reported that the NR and GS activities of grains are closely related to grain N accumulation and protein synthesis, which play vital roles in yield formation [20]. Post-anthesis drought stress can cause floret degeneration or pollen sterility and reduce the seed setting rate and grain weight, while heat stress accelerates grain filling, leading to a shorter reproductive phase [21]. Heat + drought was found to have a greater impact on yield, which has been confirmed in previous studies [13,21]. The significantly reduced yield under severe drought stress also further resulted in lower water use efficiency [22]. A previous study also revealed that heat stress reduced the water and N use efficiency of crops by affecting light capture due to the reduced photosynthetic leaf area duration [23].
N is one of the most widely used fertilizers in crop production [24]. Increasing N application can usually increase green leaf area, improve photosynthesis and promote nitrogen accumulation [25]. When N application is within a certain range, crop yield and WUE increase with increasing N application [26]. Riley [27] also believed that sufficient N application to meet the demand for wheat N consumption was critical to obtain the highest grain yield, while excessive N application significantly decreased yield and water and N use efficiency. Earlier studies have illustrated that N can modulate the effects of heat or drought stress on plants. Agami [28] reported that efficient N fertilizer could significantly relieve drought stress in wheat plants by maintaining metabolic activities even under a lower tissue water potential. Brueck [29] suggested that an appropriate N application could promote plant growth, improve WUE and mitigate the adverse impacts of drought stress. On the other hand, N also plays a crucial role in heat stress tolerance. The addition of N can effectively alleviate the inhibition of heat stress on photosynthesis and the damaging effects on crop growth [30]. However, Elía [31] reported that high N supply further exacerbates the negative effects of heat stress, and this conclusion is based on experiments in a controlled environment, in which “high N supply” and “heat stress” were extreme.
In contrast to the abundant information available on plant responses to heat and drought stresses, studies on N regulation of the effects of heat and drought stresses on plants have primarily focused on individual stresses (heat or drought). Heat and drought stress often occur simultaneously in the Guanzhong Plain in Northwest China, and comprehensive knowledge of the responses of wheat to post-anthesis drought and heat stress and their interactions is necessary to ensure sustainable wheat production in the future extreme climate environments. Moreover, there have been limited efforts to clarify to what degree the level of N application may affect the magnitude of the post-anthesis combined heat and drought stress effect on winter wheat. Therefore, the hypothesis of this study is that appropriate N application can alleviate the adverse effects of short-term heat, drought and their combined stress on winter wheat after anthesis. The goal of the study was to investigate the role of N in modulating the effects on photosynthesis, N metabolism-related enzyme activities, the accumulation of N and protein, growth, yield as well as WUE and NUE under short-term heat, drought and their combination stress after anthesis. It is hoped that this study will provide a scientific reference for N to mitigate the detrimental effects of short-term heat, drought and combined stress on wheat after anthesis.

2. Materials and Methods

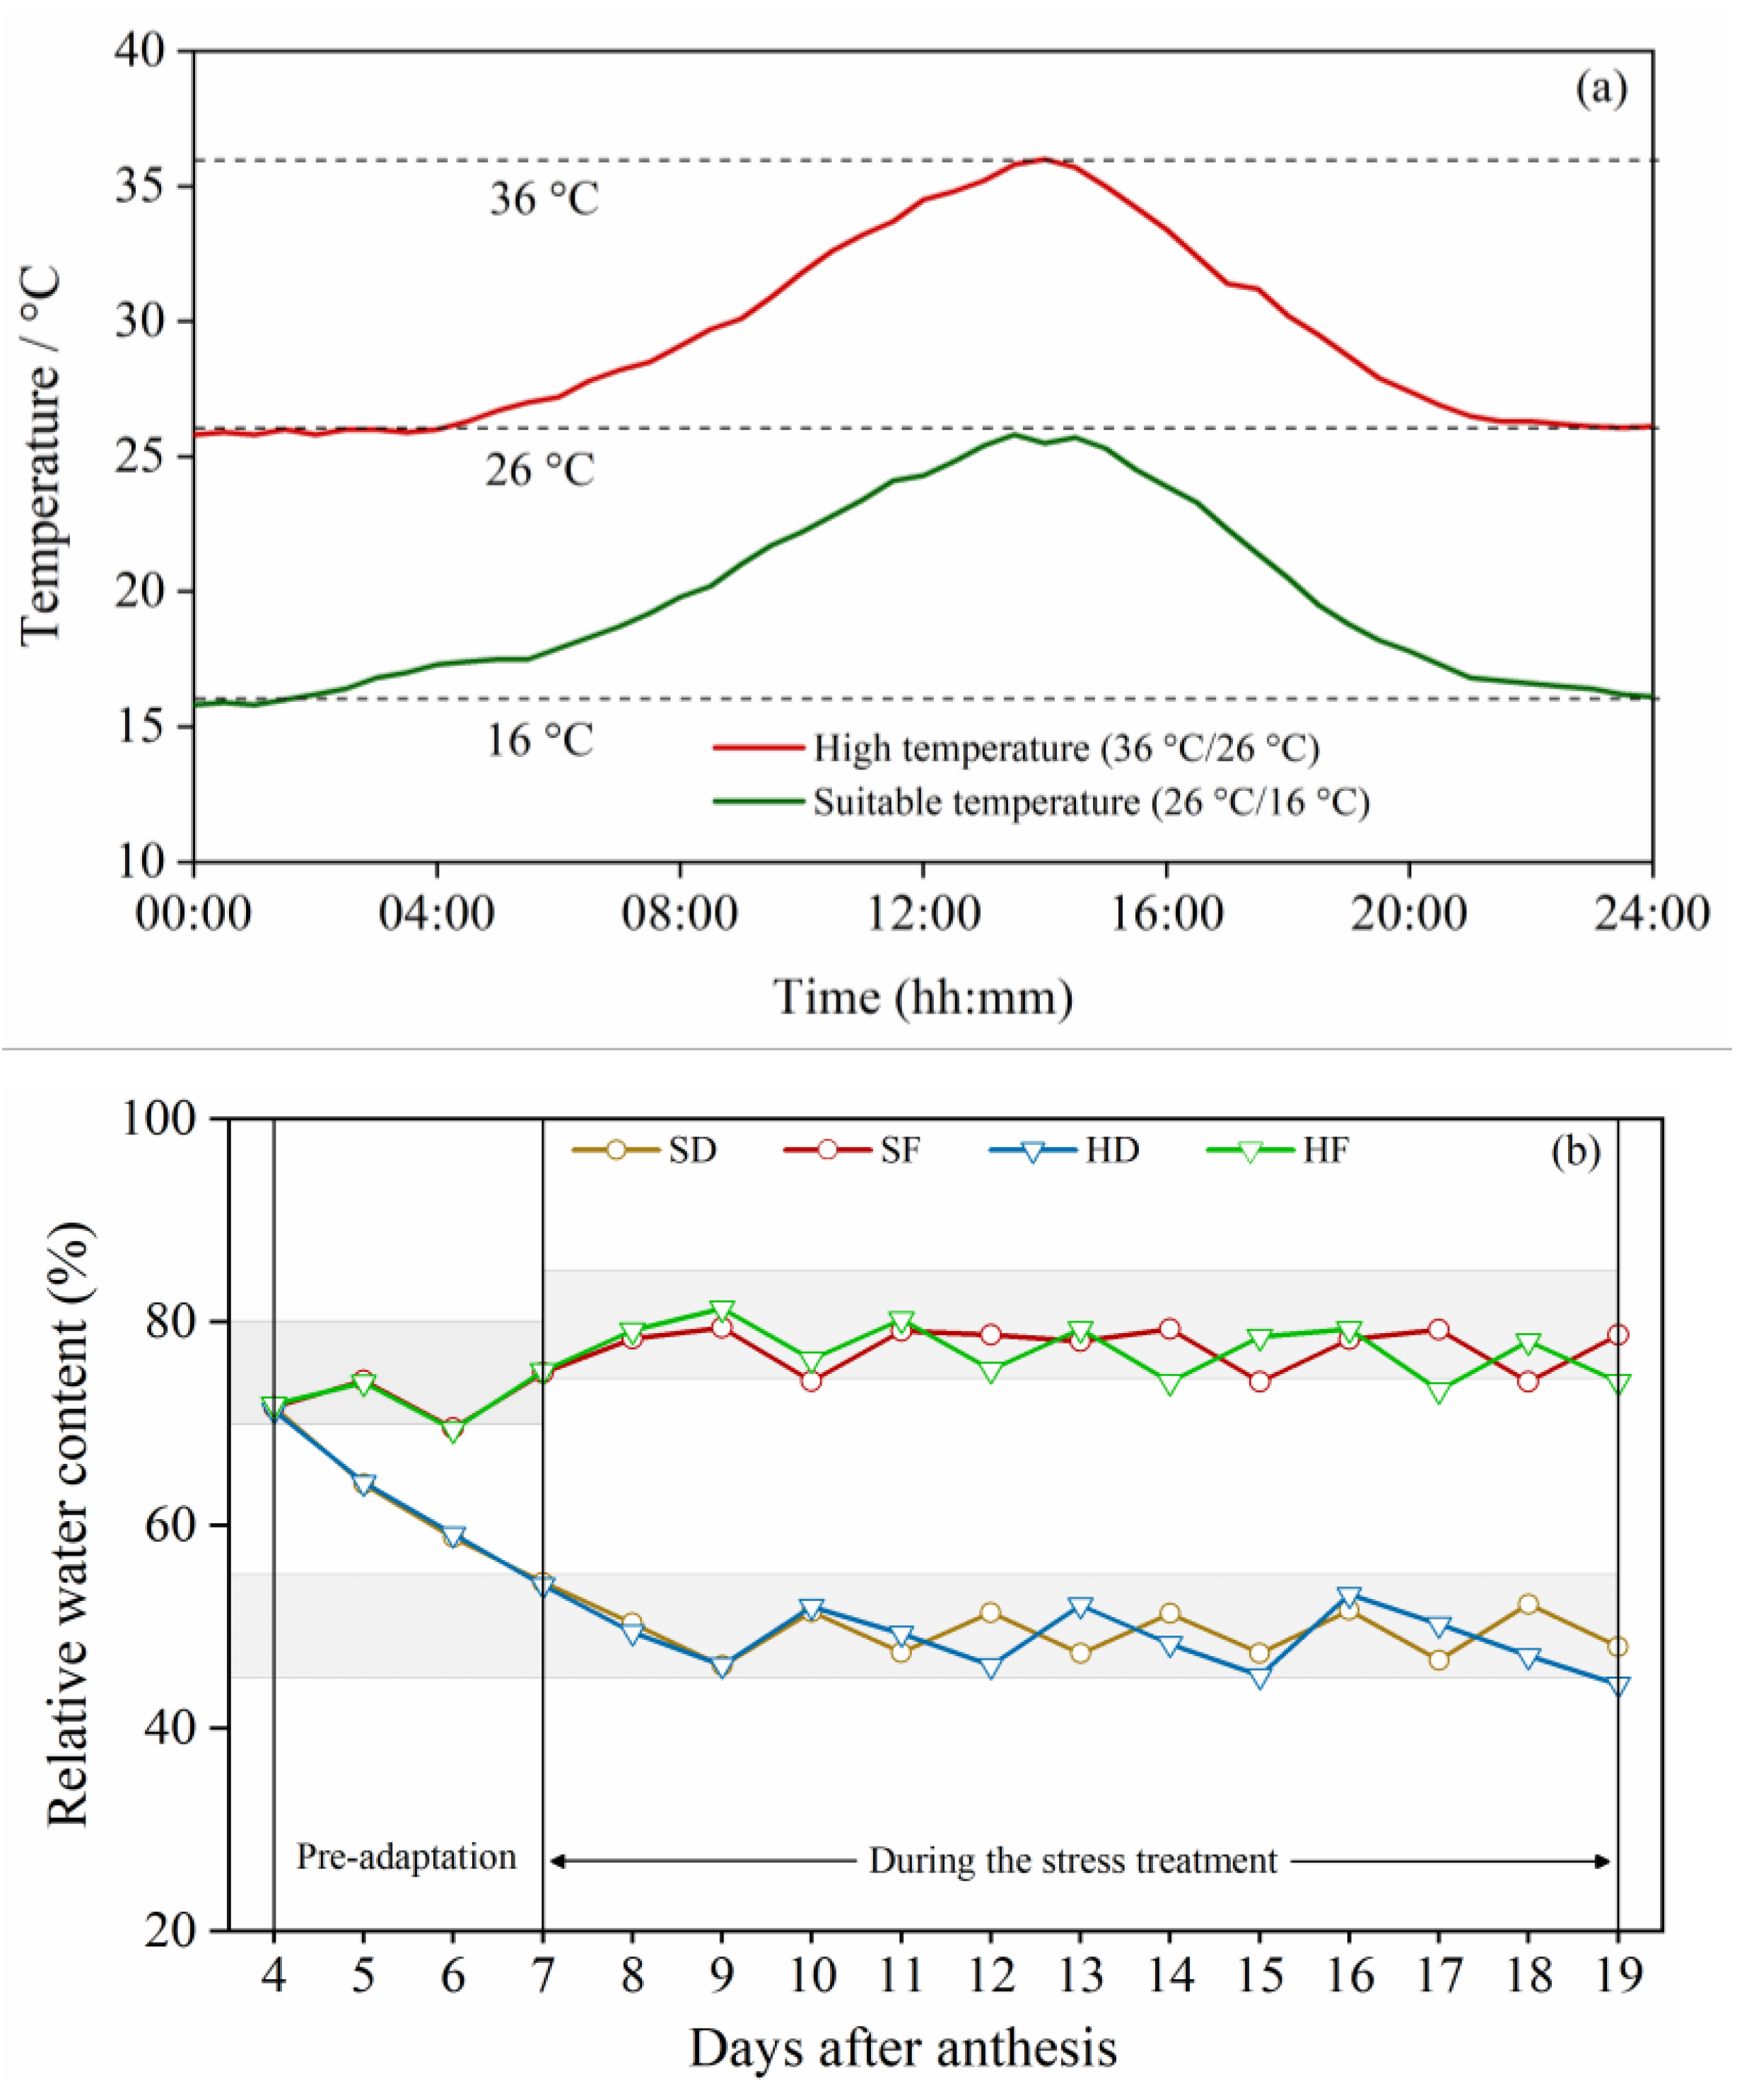
2.1. Plant Materials and Growth Conditions

The experiment was performed in an artificial growth chamber at the Key Laboratory of Agricultural Water and Soil Engineering in Arid and Semiarid Areas, Northwest A&F University (108.04° E, 34.20° N) from 17 October 2019 to 25 May 2020. A winter wheat cultivar (Triticum aestivum L. cultivar ‘Xiaoyan 22’) was selected for the experiment. The barrels were 34 cm in height and 28 cm in diameter, with seven holes at the bottom, although no water leaching was observed during the treatment period. Nineteen kilograms of sieved (0.5 mm) dry soil was added to each barrel. The soil that was tilled was the 0–30 cm layer, and the basic physical and chemical properties of the soil were as follows: pH was 7.61, organic matter content was 10.02 g/kg, total N content was 0.62 g/kg, total phosphorus content was 0.55 g/kg, total potassium (K2O) content was 16.8 g/kg, alkali-hydro N content was 36.07 mg/kg, available phosphorus content was 17.64 mg/kg, the soil water holding capacity (SWHC) was 27.13%, and the average soil volume mass was 1.47 g/cm3. Twenty seeds per barrel were sown on 17 October 2019, and the barrels were thinned to 10 seedlings at the wheat trilobal stage, which is the planting density of the surrounding fields. PVC pipes (2 cm in diameter and 40 cm in length) were installed 3–5 cm below the seeds in each barrel, and the pipes were evenly perforated to ensure uniform irrigation. The pipe was connected to a plastic funnel exposed outside the topsoil. Perlite (1 cm in thickness) was laid on the soil surface to reduce soil water evaporation.

2.2. Experimental Design

Treatments were arranged in a split-plot design with two temperature levels as the main plot and two watering levels and three N application levels as the subplot (Figure 1). According to the meteorological data of the main wheat-producing areas in the Guanzhong Plain in Northwest China in the past 30 years (http://data.cma.cn (accessed on 15 August 2019)), the extreme maximum temperature after anthesis from 1990 to 2019 was approximately 35 °C, and the relatively stable duration of recent high temperatures was approximately 11.25 days in the Guanzhong Plain in recent years (Supplementary Figure S1). Therefore, the heat stress (H) treatment involved temperatures of 36 °C/26 °C/31 °C (daily maximum temperature/minimum temperature/average temperature), and the suitable temperature (S) treatment included temperatures of 26 °C/16 °C/21 °C, respectively. The daily temperature change in the growth chamber was simulated by the daily temperature change in the external environment (Figure 2a). In two growth chamber units, climatic conditions were set to 65% relative humidity, 14-h photoperiod and photosynthetic photon flux density (1100 μ mol m−2 s−1). Two soil water regimes were set, including 75–85% SWHC and 45–55% SWHC, representing full watering (F) and drought stress (D) [22,32]. Three nitrogen application levels consisted of 1.11 g N pot−1 (N1, low nitrogen), 1.48 g N pot−1 (N2, medium nitrogen) and 2.16 g N pot−1 (N3, high nitrogen) [33]. N fertilizer was applied twice during the whole growth period, including basal fertilizer and topdressing fertilizer at the jointing period, at a ratio of 5:5. Before sowing, the N fertilizer urea was used, and phosphorus and potassium as diamine phosphate and potassium chloride at rates of 1.35 g and 1.15 g, respectively, were homogeneously mixed with the soil in each barrel. A total of 12 treatments were performed: HFN1, HFN2 and HFN3 (heat stress + full watering + low N, medium N and high N); SDN1, SDN2 and SDN3 (suitable temperature + drought stress + low N, medium N and high N); HDN1, HDN2 and HDN3 (heat stress + drought stress + low N, medium N and high N); SFN1, SFN2 and SFN3 (control, suitable temperature + full watering + low N, medium N and high N). Seven replicates (barrels) were set for each treatment.
After sowing, wheat plants were grown under natural outdoor conditions, and the soil moisture was maintained at 70–80% of SWHC. Before stress treatment, all wheat plants were acclimatized to S conditions for 3 days in a growth chamber, and the soil moisture of the drought-treatment barrels was gradually adjusted to the designed range (45–55% of SWHC) 7 days after anthesis (27 April 2020) to ensure that the pots treated with the two different watering levels were simultaneously subjected to the temperature treatments. Therefore, at 7 days after anthesis, heat, drought and their combination stresses were imposed for 12 days (from 27 April 2020 to 9 May 2020) to simulate the potentially growing trend of increased days of post-anthesis high temperatures in Guanzhong Plain, China. During the drought stress treatment, the soil water of all barrels was measured every day (Figure 2b). After stress treatment, all wheat barrels were transferred to outdoor environmental conditions and fully watered until harvest (25 May 2020). Under natural outdoor conditions (from 10 May 2020 to 25 May 2020), there was no extreme high-temperature weather (Supplementary Figure S2), and a movable canopy was applied to prevent the interference of natural rainfall. During the whole growth period, the weighing method was used to control the soil water content. Irrigation water went to the upper limit when the water conditions were close to or below the lower limit, and the plants were irrigated between 18:00–20:00. The amount of each irrigation was accurately recorded with a measuring cylinder.

2.3. Determination of Physiological Indexes

Leaf Gas Exchange and Chlorophyll Fluorescence

On the 3rd, 6th, 9th and 12th days of stress treatment, leaf gas exchange, including photosynthetic rate (An, µmol m2 s1), stomatal conductance (gs, mol m2 s1) and transpiration rate (Tr, mmol m2 s1), was determined on flag leaves using a Li-6800xt portable photosynthesis measurement system (LI-COR, Lincoln, NE, USA) under a PAR set to 1100 µmol m−2 s−1 controlled by a red/blue LED light source. Ten leaves were randomly selected from distinct barrels under the same treatment for each measurement. Instantaneous water use efficiency (WUEleaf, µmol mmol−1) was the ratio of An and Tr.
Consistent with the measurement data of gas exchange, chlorophyll fluorescence parameters were determined by using a Fluorcam portable chlorophyll fluorescence imager (Handy FluorCam FC 1000-HC, Photon Systems Instruments, Drásov, Czech Republic), including the maximum efficiency of PSII photochemistry (Fv/Fm), efficiency of PSII photochemical ( Φ PSII ), photochemical quenching (qP) and nonphotochemical quenching (NPQ). Five leaves were randomly selected from distinct barrels under the same treatment for each measurement.

2.4. Determination of Biochemical Indexes

2.4.1. Activities of Nitrate Reductase and Glutamine Synthetase

On the 6th and 12th days of stress treatment, five spikes were cut from different barrels under the same treatment for the determination of nitrate reductase (NR, EC 1.6.6.1) and glutamine synthetase (GS, EC 6.3.1.2). NR activity was measured following the method of Gaudinová [34], and the content of nitrite N was determined at 540 nm to calculate NR activity. GS activity was determined as described by Zhang [35], and the production of glutamyl hydroxamate was determined at 540 nm to calculate GS activity.

2.4.2. Plant N and Grain Protein

On the 6th and 12th days of stress treatment, five flag leaves were randomly collected from distinct barrels under the same treatment for each measurement. The flag leaf area was determined by using a scanning plate (LIDE-400, Canon (China) Co., Ltd., Beijing, China). Then, leaf samples were dried to constant weight at 80 °C in an oven to obtain the dry mass. Specific leaf mass was expressed as the ratio of dry mass to leaf area. The N concentration of leaves was determined by using a German SEAL continuous flow analyzer (AA3), and the N content of leaves was the product of the N concentration and dry mass. N-mass and N-area represent the N content per unit leaf dry mass and the N content per unit leaf area, respectively. N-area was expressed as the product of N-mass and specific leaf mass.
At maturity, five plants were randomly selected for each treatment, manually cutting the aboveground parts and separating them into leaves, stems, sheaths, chaff and grains. These samples were dried, weighed and ground to determine the N concentration. The grain protein content was calculated by multiplying the grain N content by the constant 5.70 [36]. The grain protein yield was the product of grain protein content and grain yield. The total aboveground N was calculated as the sum of N accumulation in each part of the aboveground part.

2.5. Determination of Growth Traits

On the 12th day of stress treatment, five wheat plants were selected from different barrels under the same treatment to measure plant height, and the green leaf area per plant was determined by using a scanning plate (LIDE-400, Canon (China) Co., Ltd., Beijing, China). ImageJ software (V1.8.0, National Institutes of Health, Bethesda, Maryland, USA) was used to calculate the green leaf area.
Before stress treatment (26 April 2020) and the 12th stress treatment, the aboveground parts were sampled from 5 randomly selected plants in each treatment. Samples were dried to a constant weight at 80 °C to obtain the aboveground dry mass (ADM) of the two adjacent sampling periods for the calculation of the relative growth rate (RGR). The RGR was calculated according to the method of Karimi [37].

2.6. Determination of Yield, Water and N Use Efficiency

After stress treatment, all wheat plants were restored to the outdoor normal temperature and well watered for 16 days until maturity. At maturity, three barrels of wheat were randomly selected for each treatment. Spikes were harvested and manually threshed; the grain number per spike (GN) and thousand kernel weight (TKW) were recorded. The moisture content of the grains was adjusted to 13% to determine the grain yield.
During the wheat growing season, the total water consumption (kg pot1) of wheat was the sum of each irrigation amount. The water use efficiency for grain (WUEg), water use efficiency for biomass (WUEb), N use efficiency for grain (NUEg) and N use efficiency for biomass (NUEb) were calculated using the following formulas.
NUE g = Grain   yield Total   N   accumulation
NUE b = Biomass   production   Total   N   accumulation
WUE g = Grain   yield Total   water   consumption
WUE b = Biomass   production Total   water   consumption

2.7. Data Analysis

SPSS 22.0 (SPSS Inc., Chicago, IL, USA) was used for regression analysis, analysis of variance and principal component analysis (PCA). Duncan’s method was used to test the significance of differences at the 0.05 probability level. Data from different measurement dates were aggregated for ANOVAs in photosynthetic and chlorophyll fluorescence parameters and N metabolism enzyme activities to evaluate the main and interactive effects of water, temperature and nitrogen on the variables. The sum of squares in the ANOVAs was used to calculate the proportion of variance explained by each factor and interaction. Regression analysis was used to determine the relationships between N-mass, N-area and photosynthetic rate. When the parameters were compared among different stress treatments, the data were taken as the mean of three N applications.

3. Results

3.1. Effect of Nitrogen on Physiological Characteristics under Post-Anthesis Heat, Drought and Combined Stress

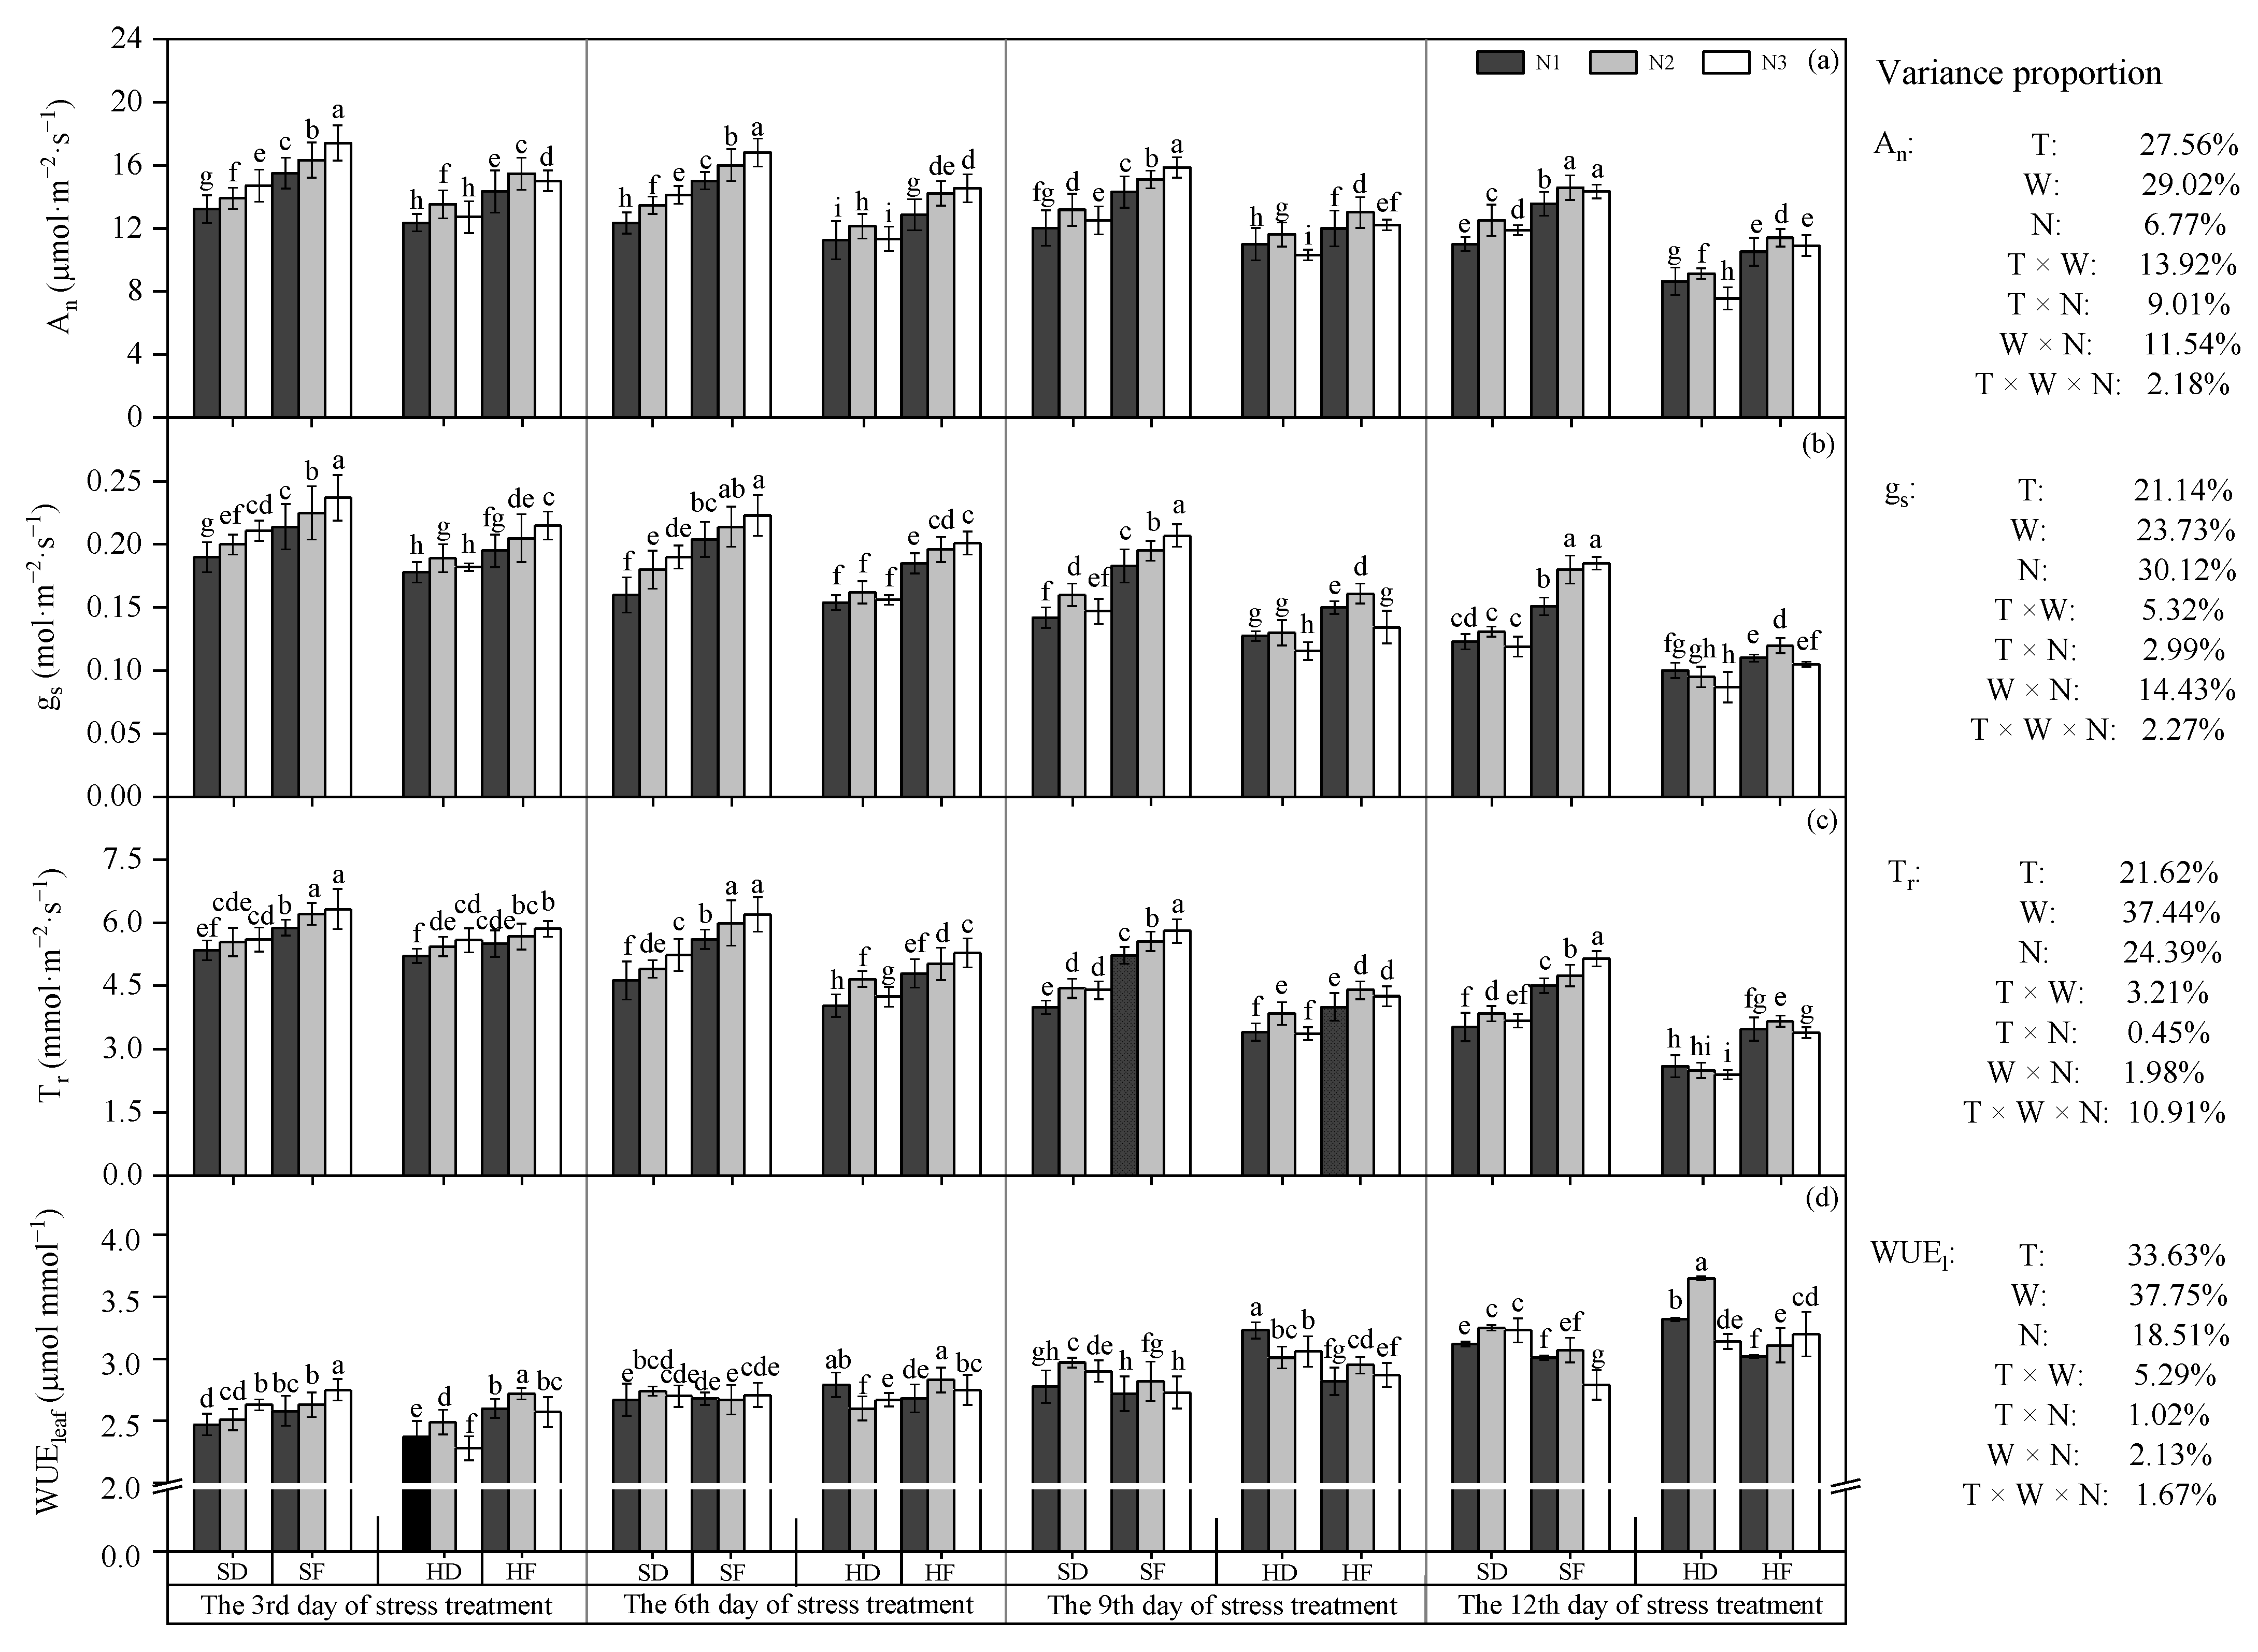
3.1.1. Leaf Photosynthesis Parameters

On the 12th day of stress treatment, An in the SD, HF and HD treatments was 16.64%, 22.74% and 40.39% lower than that in the control (SF) treatment, respectively (Figure 3a). The superposition effect of combined stress was also observed in gs and Tr on the 12th day of stress treatment. Drought (SD) and heat treatments (HF) reduced 27.71% and 35.08% in gs and 23.09% and 26.63% in Tr, respectively, compared to the control. However, in the combined stress (HD) treatment, gs and Tr decreased by 45.35% and 47.84%, respectively, compared with the control (Figure 3b,c). The difference in WUEleaf among treatments gradually increased with increasing stress duration. On the 12th day of stress treatment, WUEleaf in the SD, HF and HD treatments increased by 8.23%, 5.19% and 13.98% compared with the control, respectively (Figure 3d). The regulatory effect of N on leaf photosynthetic parameters changed with increasing stress duration. On the 3rd and 6th days of stress treatments, An in the SD treatment under the N3 application was 11.28% and 14.34% higher than that under the N1 application, respectively. The N2 application maintained higher An under all stress treatments on the 9th and 12th days of the stress treatments. The N3 application had the best regulatory effect on gs under the SD and HF treatments on the 3rd and 6th days of the stress treatments. With the extension of stress time, the N3 supply became no longer conducive to the increase in gs under individual stresses. The Tr in each stress treatment was highest under the N2 application on the 9th day of the stress treatments. In contrast to the individual stresses, Tr in the HD treatment decreased with increasing N application on the 12th day of the stress treatment. With the increase in stress time, the positive regulation of the N3 application on WUEleaf in the HF treatment was more significant compared with N1 and N2. The N1 application improved the WUEleaf under the HD treatment on the 9th and 12th days of the stress treatments. However, on the 12th day of stress treatment, the WUEleaf of N2 application under the HD treatment was significantly higher than that of N1 and N3. An was mainly affected by T and W. gs, Tr and WUEleaf were mainly affected by T, W and N. The interaction of two factors and three factors had much weaker impacts on WUEleaf than that of single factors.

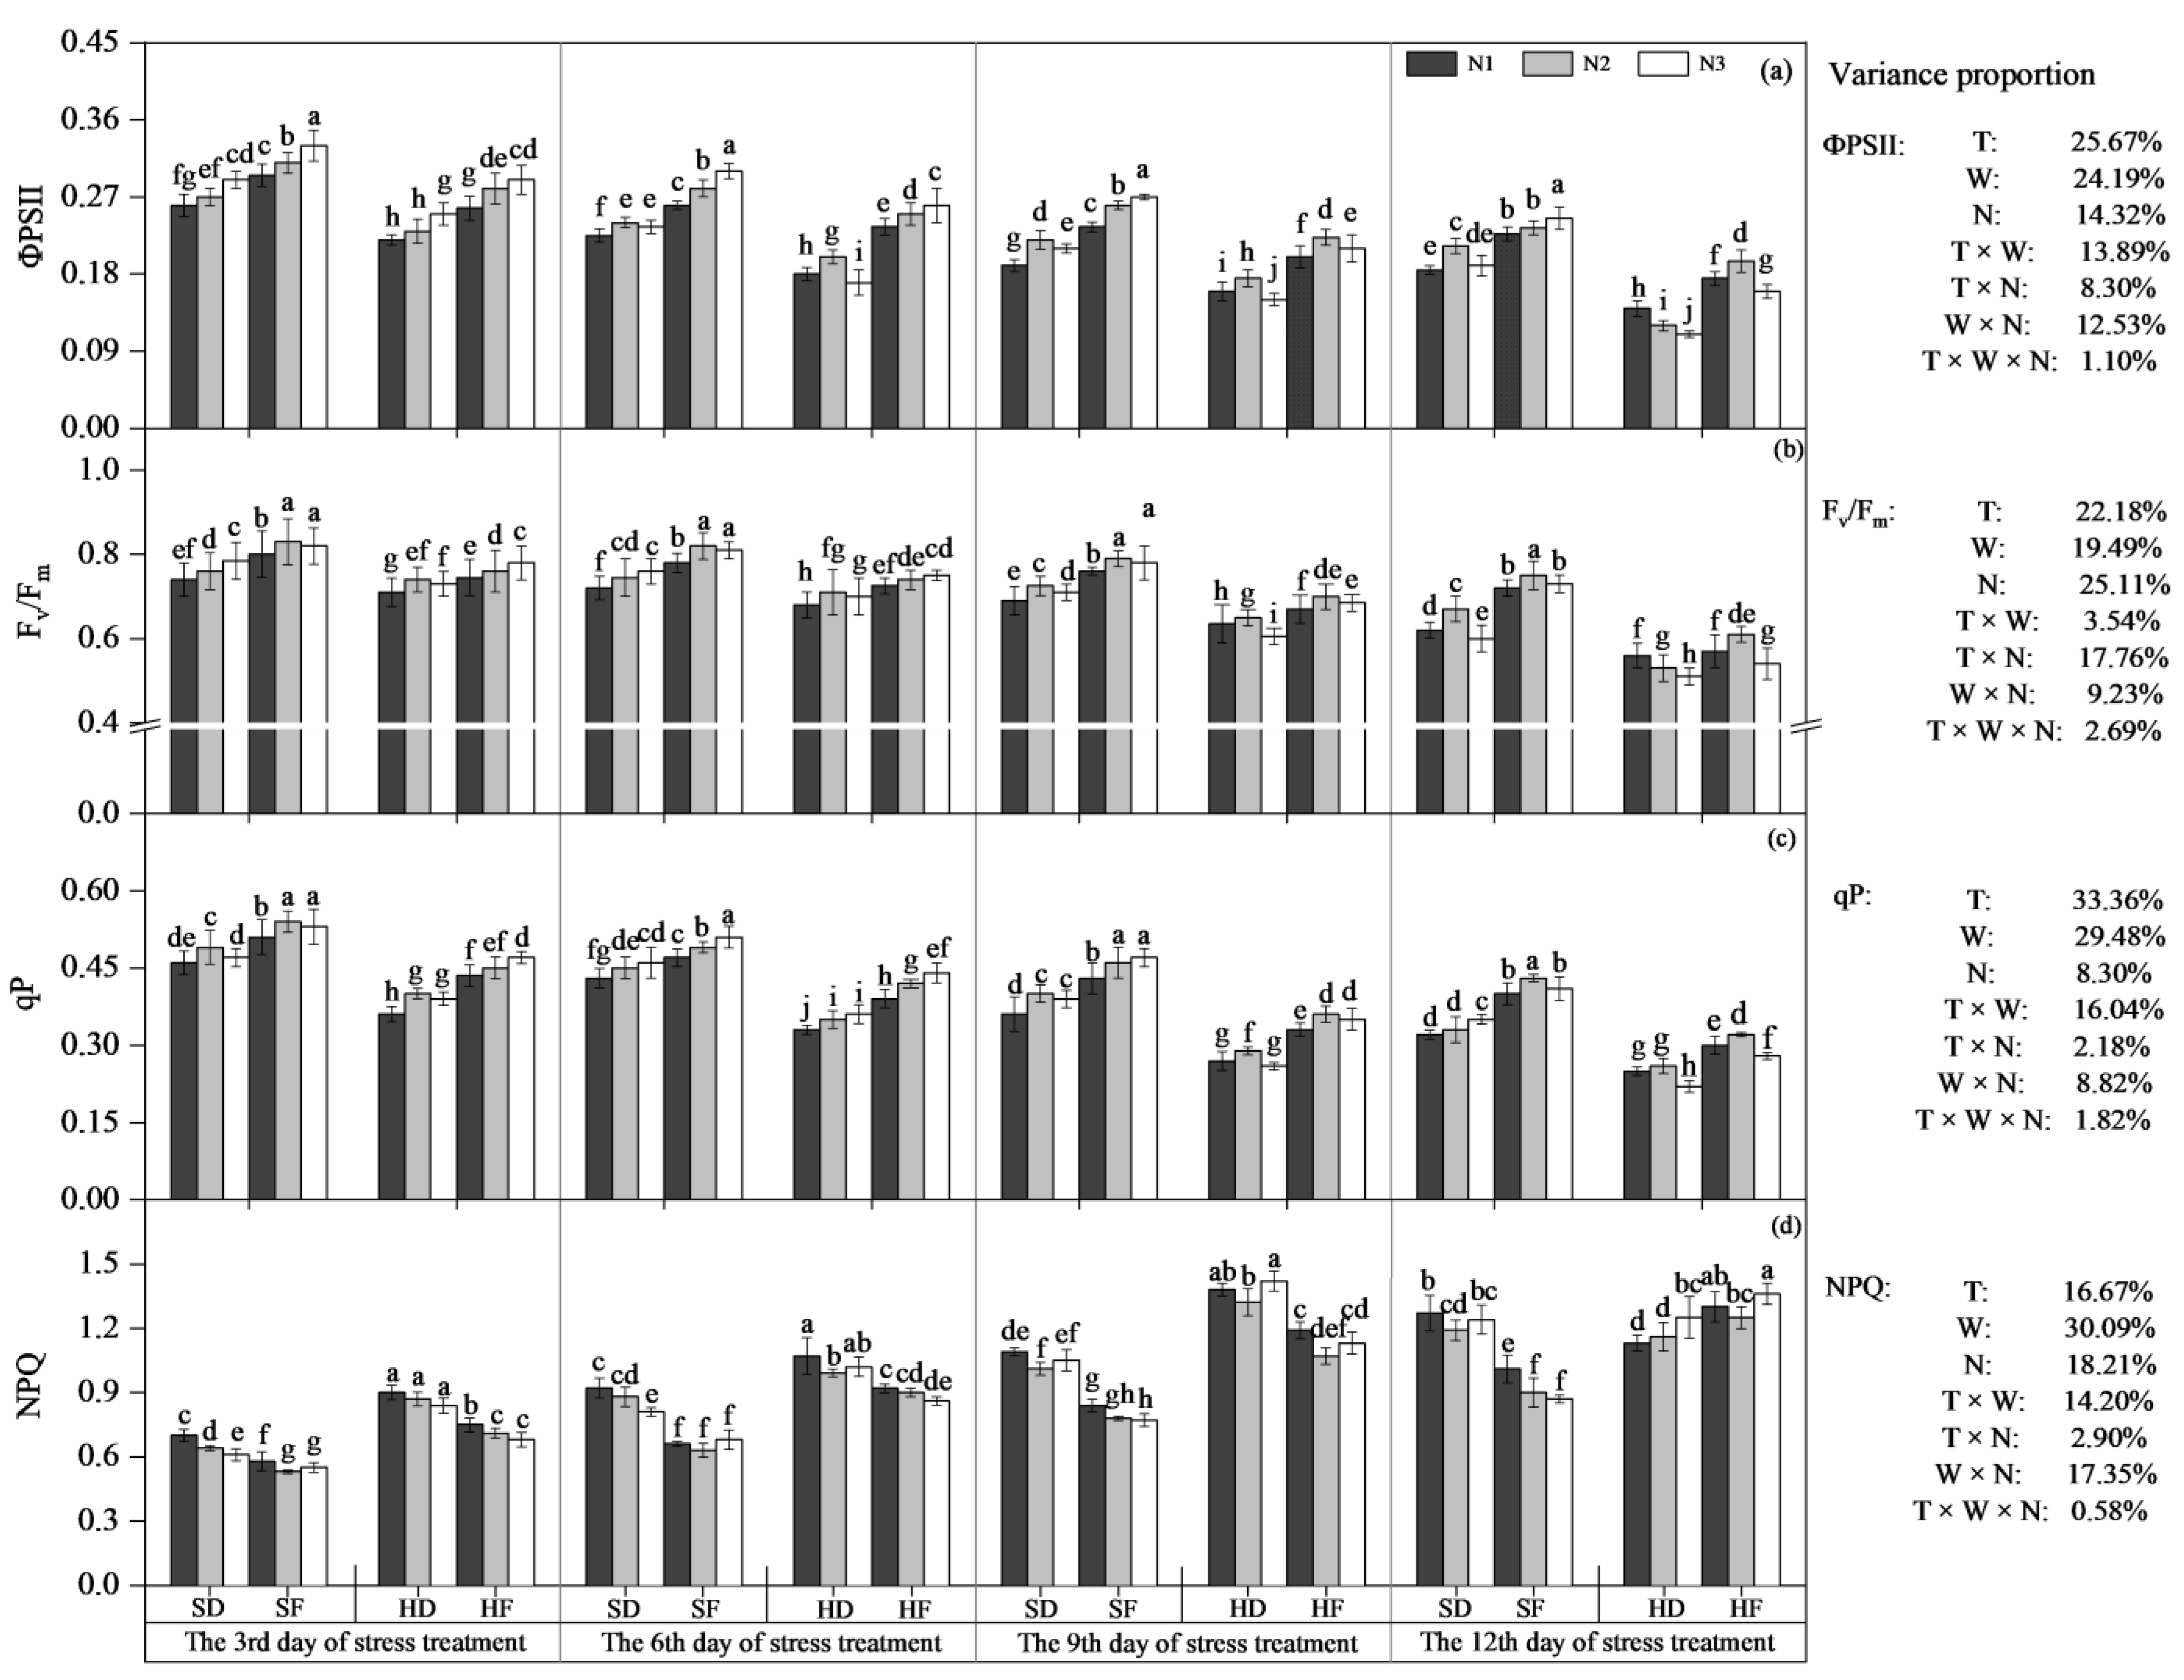
3.1.2. Chlorophyll Fluorescence Parameters

Compared with the control, heat, drought and combined stresses led to a reduction in Φ PSII, Fv/Fm and qP of leaves, and the combined stress showed a typical superposition effect. On the 12th day of stress treatment, Φ PSII decreased by 37.07% and 30.19%, Fv/Fm decreased by 15.34% and 6.98% and qP decreased by 19.35% and 27.42% under the HD treatment, respectively, compared with the SD and HF treatments (Figure 4). The chlorophyll fluorescence parameters in stressed plants were significantly affected by the N supply. On the 9th day of stress treatment, Φ PSII in the SD and HF treatments under the N2 application increased by 15.79% and 11.50%, respectively, compared with N1. On the 12th day of stress treatment, Φ PSII in the HD treatment was highest under the N1 application compared with N2 and N3 (Figure 4a). For Fv/Fm, the N3 application was significantly higher in the SD and HF treatments than in N1 on the 3rd and 6th days of stress treatments. The N2 application maintained high Fv/Fm in the heat- and drought-stressed plants on the 9th and 12th days of stress treatments. Under post-anthesis combined stress, Fv/Fm decreased with increasing N application on the 12th day of stress treatment (Figure 4b). qP in the SD treatment under the N3 application significantly increased on the 12th day of stress treatment, while qP in the HF and HD treatments under the N3 application was significantly lower than that under the N2 supply (Figure 4c). Compared with N1, an appropriate increase in N application reduced the NPQ of stressed plants, which was pronounced under the SD and HF treatments on the 3rd and 6th days of stress treatments, whereas N1 application was conducive to maintaining a lower NPQ in the HD treatment on the 12th day of stress treatment (Figure 4d). For Φ PSII, the variance proportion of T and W was more than 20%, followed by N (14.32%). The effects of T, W and N on Fv/Fm were more pronounced than the interactions of two and three factors. The proportion of variance explained by T, W and the interaction of T × W reached 78.88% in qP. NPQ was mainly affected by T, W and N.

3.2. Effect of Nitrogen on Biochemical Characteristics under Post-Anthesis Heat, Drought and Combined Stress

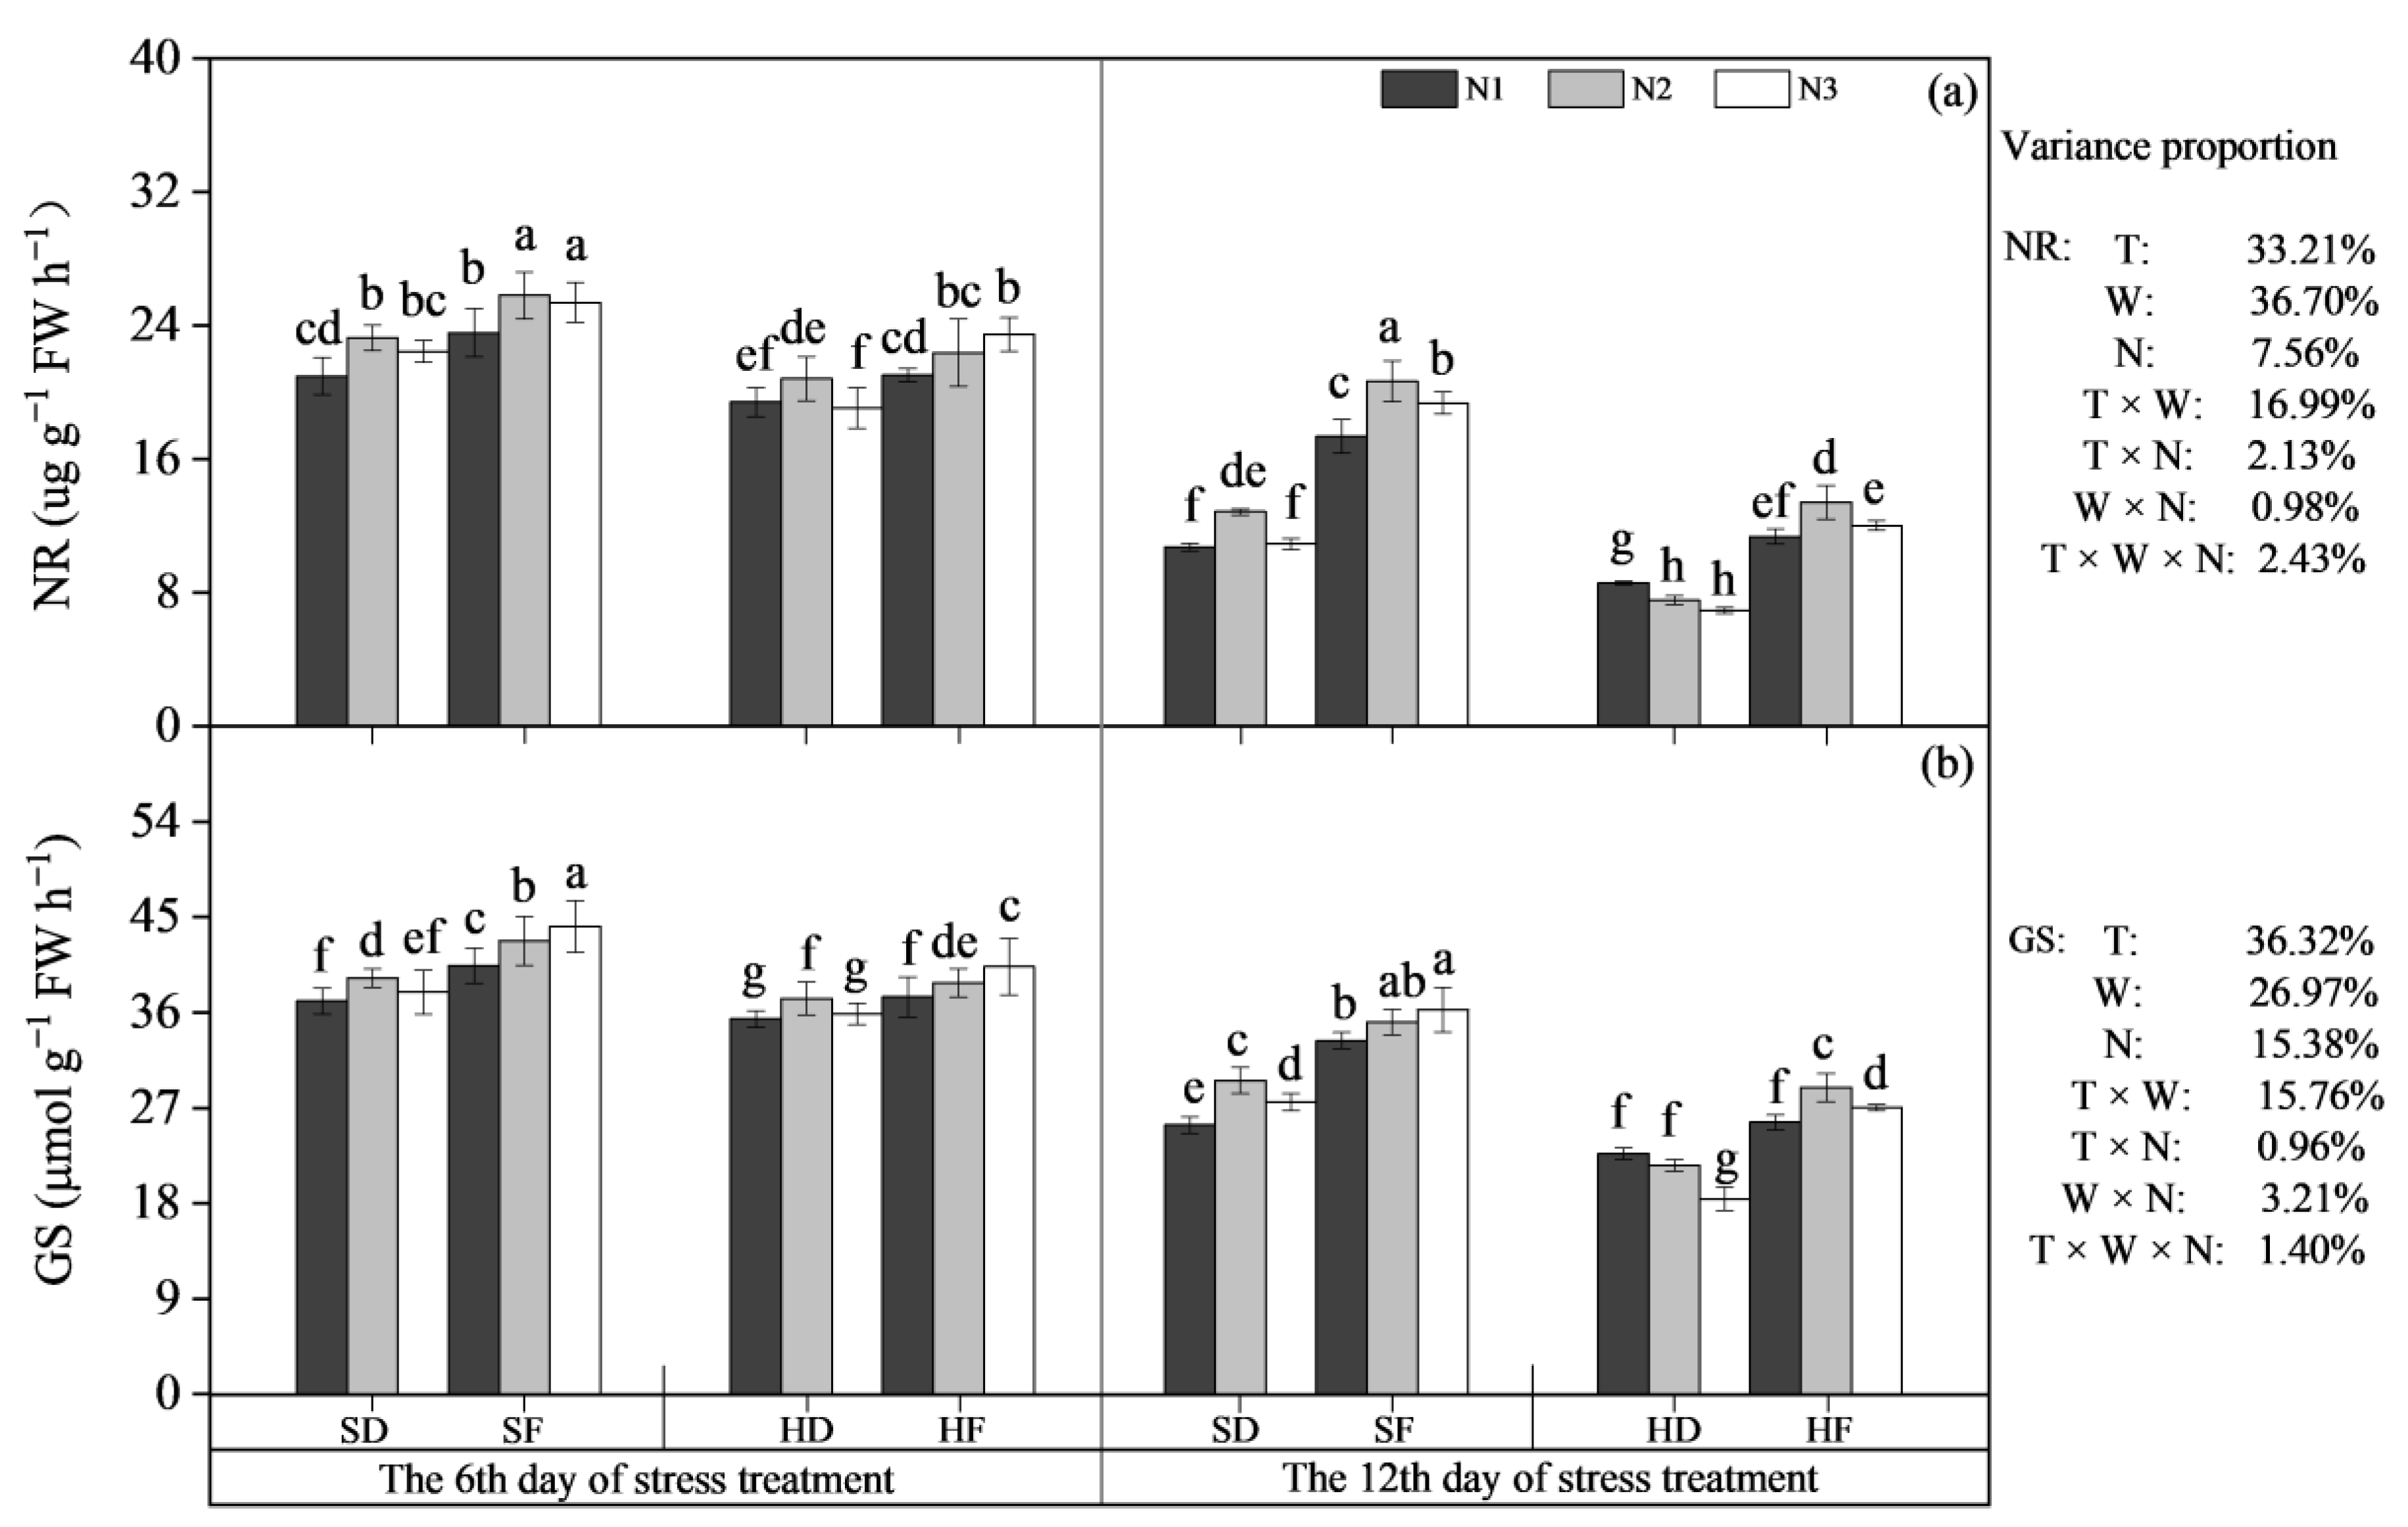
3.2.1. The Activity of N Metabolism-Related Enzymes

The proportion of variance explained by T and W exceeded 30% in NR, and the effect of N on NR was higher than the interaction of two factors (except T × W) and three factors. T and W had a higher effect on GS than the other factors, followed by N and T × W. NR and GS were very weakly affected by the interaction of three factors. The activities of NR and GS gradually decreased with increasing stress time. On the 12th day of stress treatment, the NR activity of the SD and HF treatments was 60.06% and 64.09% of that of the control and 78.80% and 77.93% of that of the control, respectively. Combined stress resulted in a more significant reduction in NR and GS activities and a decrease in the activities of NR and GS under the HD treatment by 55.54% and 54.01%, respectively, compared with the control. N effectively improved the activities of NR and GS under different stress types. On the 6th day of stress treatment, the N2 or N3 applications increased the NR activity in all treatments compared with N1. On the 12th day of stress treatment, increasing the N supply had a strong inhibitory effect on NR activity with HD treatment, with an N1 application 23.81% higher than that of N3 (Figure 5a). Compared with the 6th stress treatment, the regulatory effect of N on GS activity in the stress treatments was more pronounced on the 12th day of stress treatment. The response of GS to N under post-anthesis individual stresses and combined stress was similar to that of NR on the 12th day of stress treatment. The N2 application in the SD and HF treatments had 16.52% and 12.80% higher GS activity than that of N1, while the N1 application in the HD treatment had 23.07% greater GS activity than that of N3 (Figure 5b).

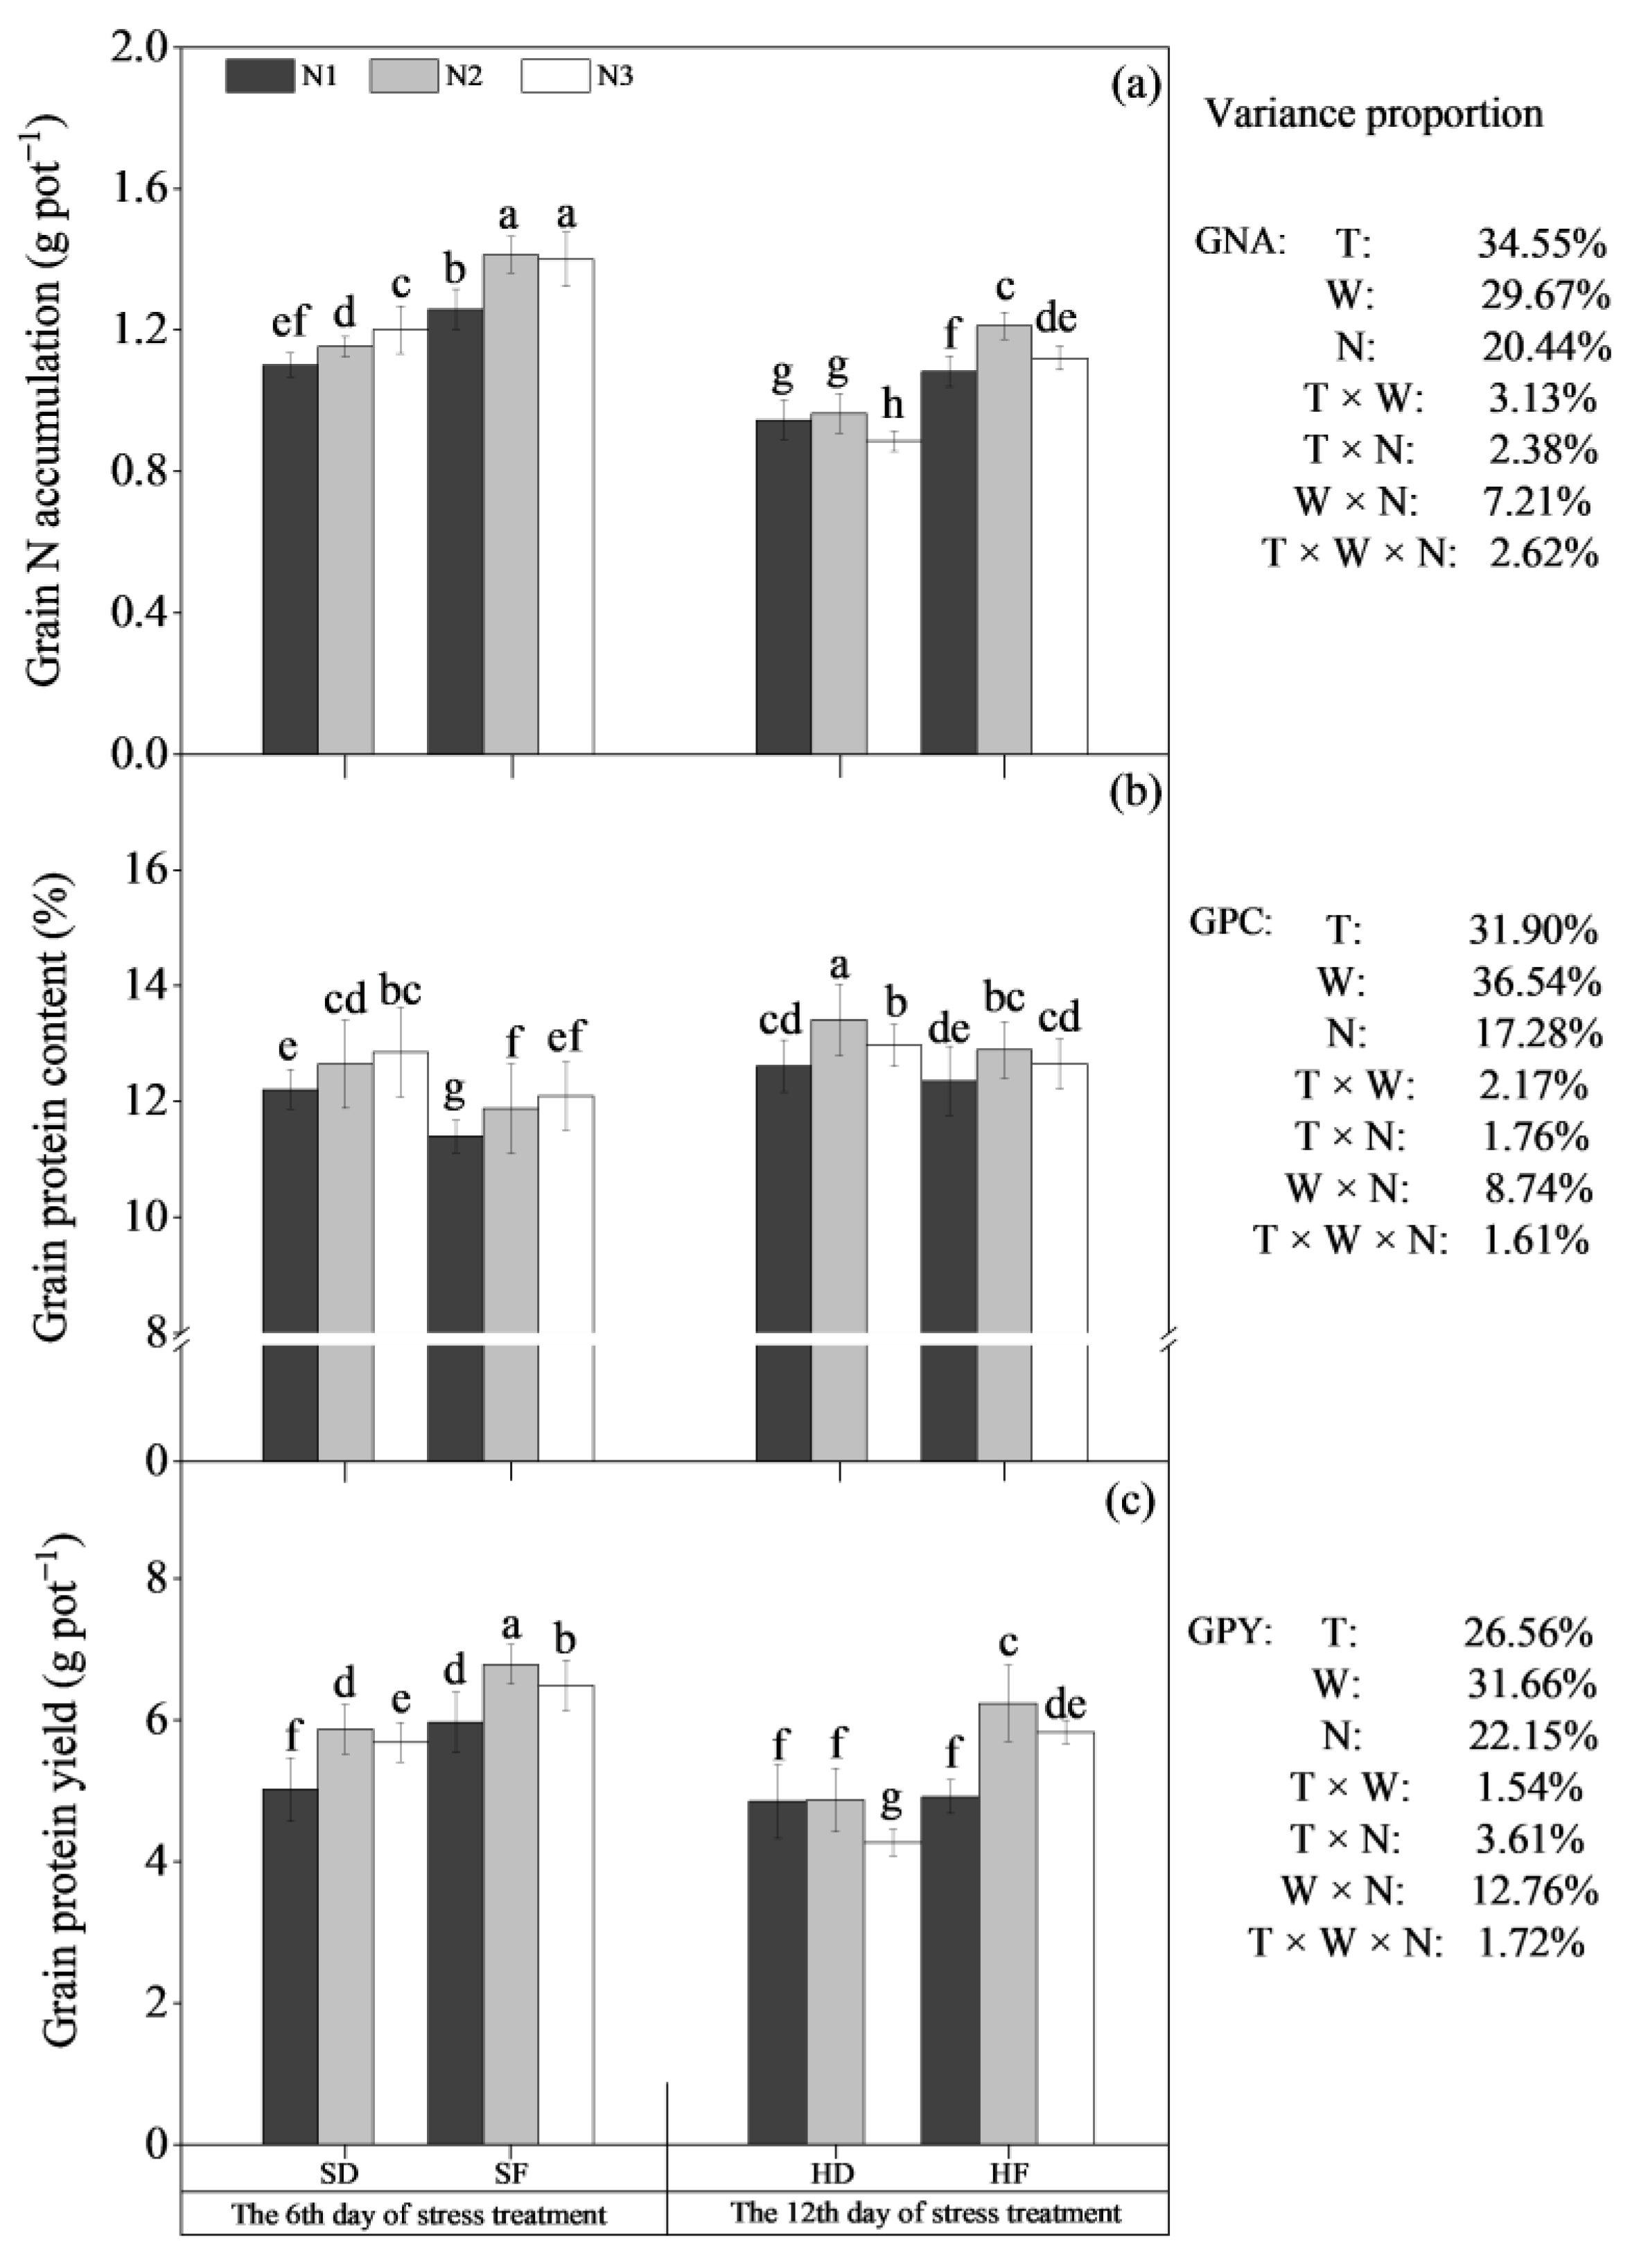
3.2.2. N Accumulation, Protein Content and Protein Yield

The cumulative proportion of variance explained by T, W and N reached 84.66% in grain N accumulation. Similar results were also observed in grain protein content. Grain protein yield was mainly influenced by T, W and N, the proportion of variance explained by the interaction of W × N was relatively high (12.76%) among the interactions of the two factors (Figure 6). The grain N accumulation among the SD, HF and HD treatments was significantly lower than that in the control (by 15.15%, 16.11% and 31.34%, respectively). The SD and HF treatments decreased grain protein yield by 15.14% and 11.74%, respectively, when compared with the control, and combined stress exacerbated this reduction, resulting in a 27.32% reduction in grain protein yield under the HD treatment. However, heat, drought and combined stress contributed to the increase in grain protein content compared with the control, and the HD treatment had a greater increase than the SD and HF treatments. Compared with N1, increasing N application mitigated the adverse effects of heat stress on the accumulation of nitrogen and protein in grain, especially N2 application. Compared with N1, N accumulation, protein content and protein yield in grain under the HF treatment with N2 application increased by 11.91%, 4.29% and 26.83%, respectively. The N accumulation and protein content in grain under the SD treatment increased with increasing N application, and the N2 application in the SD treatment resulted in a 16.93% higher grain protein yield than that under the N1 treatment. The grain N accumulation of the N1 and N2 applications in the HD treatment was higher than that of N3, and a similar tendency was also found in protein yield. The protein content of grain in the HD treatment under N2 was significantly higher than those under the N1 and N3 applications.

3.3. Effect of Nitrogen on Wheat Growth under Post-Anthesis Heat, Drought and Combined Stress

The proportion of variance shows that the green leaf area was mainly affected by T, W and the interaction of T × W. The effect of T, W and N on plant height was more pronounced compared to the two-factor and three-factor interactions. ADM and RGR were mainly affected by T and W, and N and the interaction of T × W and W × N had similar effects on ADM (Table 1). Subsequent heat, drought and combined stress significantly reduced the growth traits of maize plants as evidenced by the lower green leaf area, plant height, ADM and RGR compared to the control. Compared with the control, the SD, HF and HD treatments decreased the green leaf area by 25.63%, 25.80% and 34.04% and the plant height by 5.69%, 7.93% and 12.71%, respectively. Similar reductions were observed in ADM and RGR. For example, the SD, HF and HD treatments had 29.77%, 25.43% and 54.33% lower RGRs than the control. Nevertheless, appropriate N application effectively alleviated the adverse effects of heat, drought and combined stress on wheat growth. The green leaf area under the SD treatment increased with increasing N application, while the HD treatment exhibited the opposite tendency. A larger green leaf area was observed in the N2 application under the HF treatment. Plant height was significantly higher under the N2 and N3 applications than that under the N1 application, respectively, which was found in the SD and HF treatments; however, the N1 application under the HD treatment maintained a higher plant height than the N2 and N3 applications. The beneficial effects of N2 application on ADM under all stress treatments were more significant than that of N1 and N3 applications. The RGR of the SD treatment was significantly increased by the N2 compared to N1 application, and N2 and N3 applications significantly increased the RGR under HF treatment compared to N1 application. In contrast, an appropriate reduction in N application was beneficial for the improvement of RGR in the HD treatment.

3.4. Effect of Nitrogen on Yield, Water and N Use Efficiency under Post-Anthesis Heat, Drought and Combined Stress

The effects of the single factors (T, W and N) on GN were similar, and the proportion of variance explained by T × W was relatively low in GN. TKW and yield were mainly affected by T and W. Similarly, the interaction of W × N and T × W × N had weak effects on TKW and yield (Table 2). Compared with the control, heat and drought stress significantly reduced GN and TKW, leading to a reduction in the yield of the SD and HF treatments by 20.46% and 18.33%, respectively, when compared to the control. This reduction was further amplified under combined stress conditions, and the yield in the HD treatment was 33.98% lower than that of the control. Yield and its components were significantly improved under an appropriate N application. The GN of the N3 application in the HF treatment increased by 13.09% compared with N1. The SD treatment had higher GN and TKW under the N2 application than under the N1 and N3 treatments. Compared with the N1 application, the yield at the N2 level under the SD and HF treatments increased by 12.92% and 21.70%, respectively, whereas the HD treatment under the N1 application had 5.91% and 17.06% higher yields than that under the N2 and N3 applications.
The proportion of variance explained by T was at a lower level in WUEg and WUEb. WUEg was mainly affected by W, N and the interaction of T × W and T × N. W had the greatest impact on WUEb, followed by the interaction of T × W. NUEg was mainly affected by T, W and N. The effect of T on NUEb was the largest (Table 2). Drought stress resulted in a significant increase in WUEg and WUEb compared to the control. WUEg and WUEb under the SD treatment increased by 6.59% and 10.26%, respectively, compared to the control. There was no significant difference in WUEg between the HF treatment and the control. It is noteworthy that WUEg in the HD treatment was reduced by 7.47% compared with the control. NUEg and NUEb decreased significantly under heat, drought and combined stress, especially the combined stress. SD, HF and HD treatments decreased NUEg by 9.92%, 8.74% and 16.97% and NUEg by 5.48%, 5.12% and 8.83%, respectively, when compared with the control. The regulatory effect of N on water and N use efficiency is inconsistent due to the different stress types; for example, the WUEg of the N3 application under the SD treatment and the N2 application under the HF treatment were 7.76% and 6.18% greater than that of the N1 application, respectively, while the HD treatment under the N1 application had 10.05% higher WUEg than that under the N3 application. Compared with the control, N2 + full watering reduced the decrease in NUEg and NUEb in the HD treatment, and NUEg and NUEb in the HFN2 treatment were 13.90% and 7.32% higher than those in the HDN2 treatment, respectively.

3.5. Principal Component Analysis

The growth traits, physiological and biochemical parameters, yield components, yield, water and N use efficiency of wheat were analyzed by principal component analysis (PCA). As shown in Figure 7, the cumulative contribution rate of principal component 1 (PC1; 70.50%) and principal component 2 (PC2; 18.27%) reached 88.77%. The principal component (PC1) corresponded to ADM, GNA, TKW, yield, SGN, An, GPY and Fv/Fm. These parameters contributed to most of the variation observed in the dataset. WUEb, WUEg and NPQ primarily interpreted the principal component (PC2). There was a smaller acute angle between GNA, TKW, SGN and grain yield compared with other parameters, indicating that the positive correlation between GNA, TKW, SGN and grain yield was higher under stress conditions. An, Fv/Fm and Φ PSII had significant positive correlations with grain yield due to the acute angle among these parameters. Under the SD and HF treatments, The coordinates of N2 and N3 applications were closer to the side of the PC1 axis where the variables were concentrated compared to N1, especially N2 application; however, the coordinate of the N1 application was closer to the right side of the PC1 axis, indicating that an appropriate increase in N application contributed to the improvement in photosynthesis and yield formation parameters under post-anthesis heat and drought alone, thereby increasing grain yield, and this positive regulation was also observed in the N1 application under combined stress conditions.

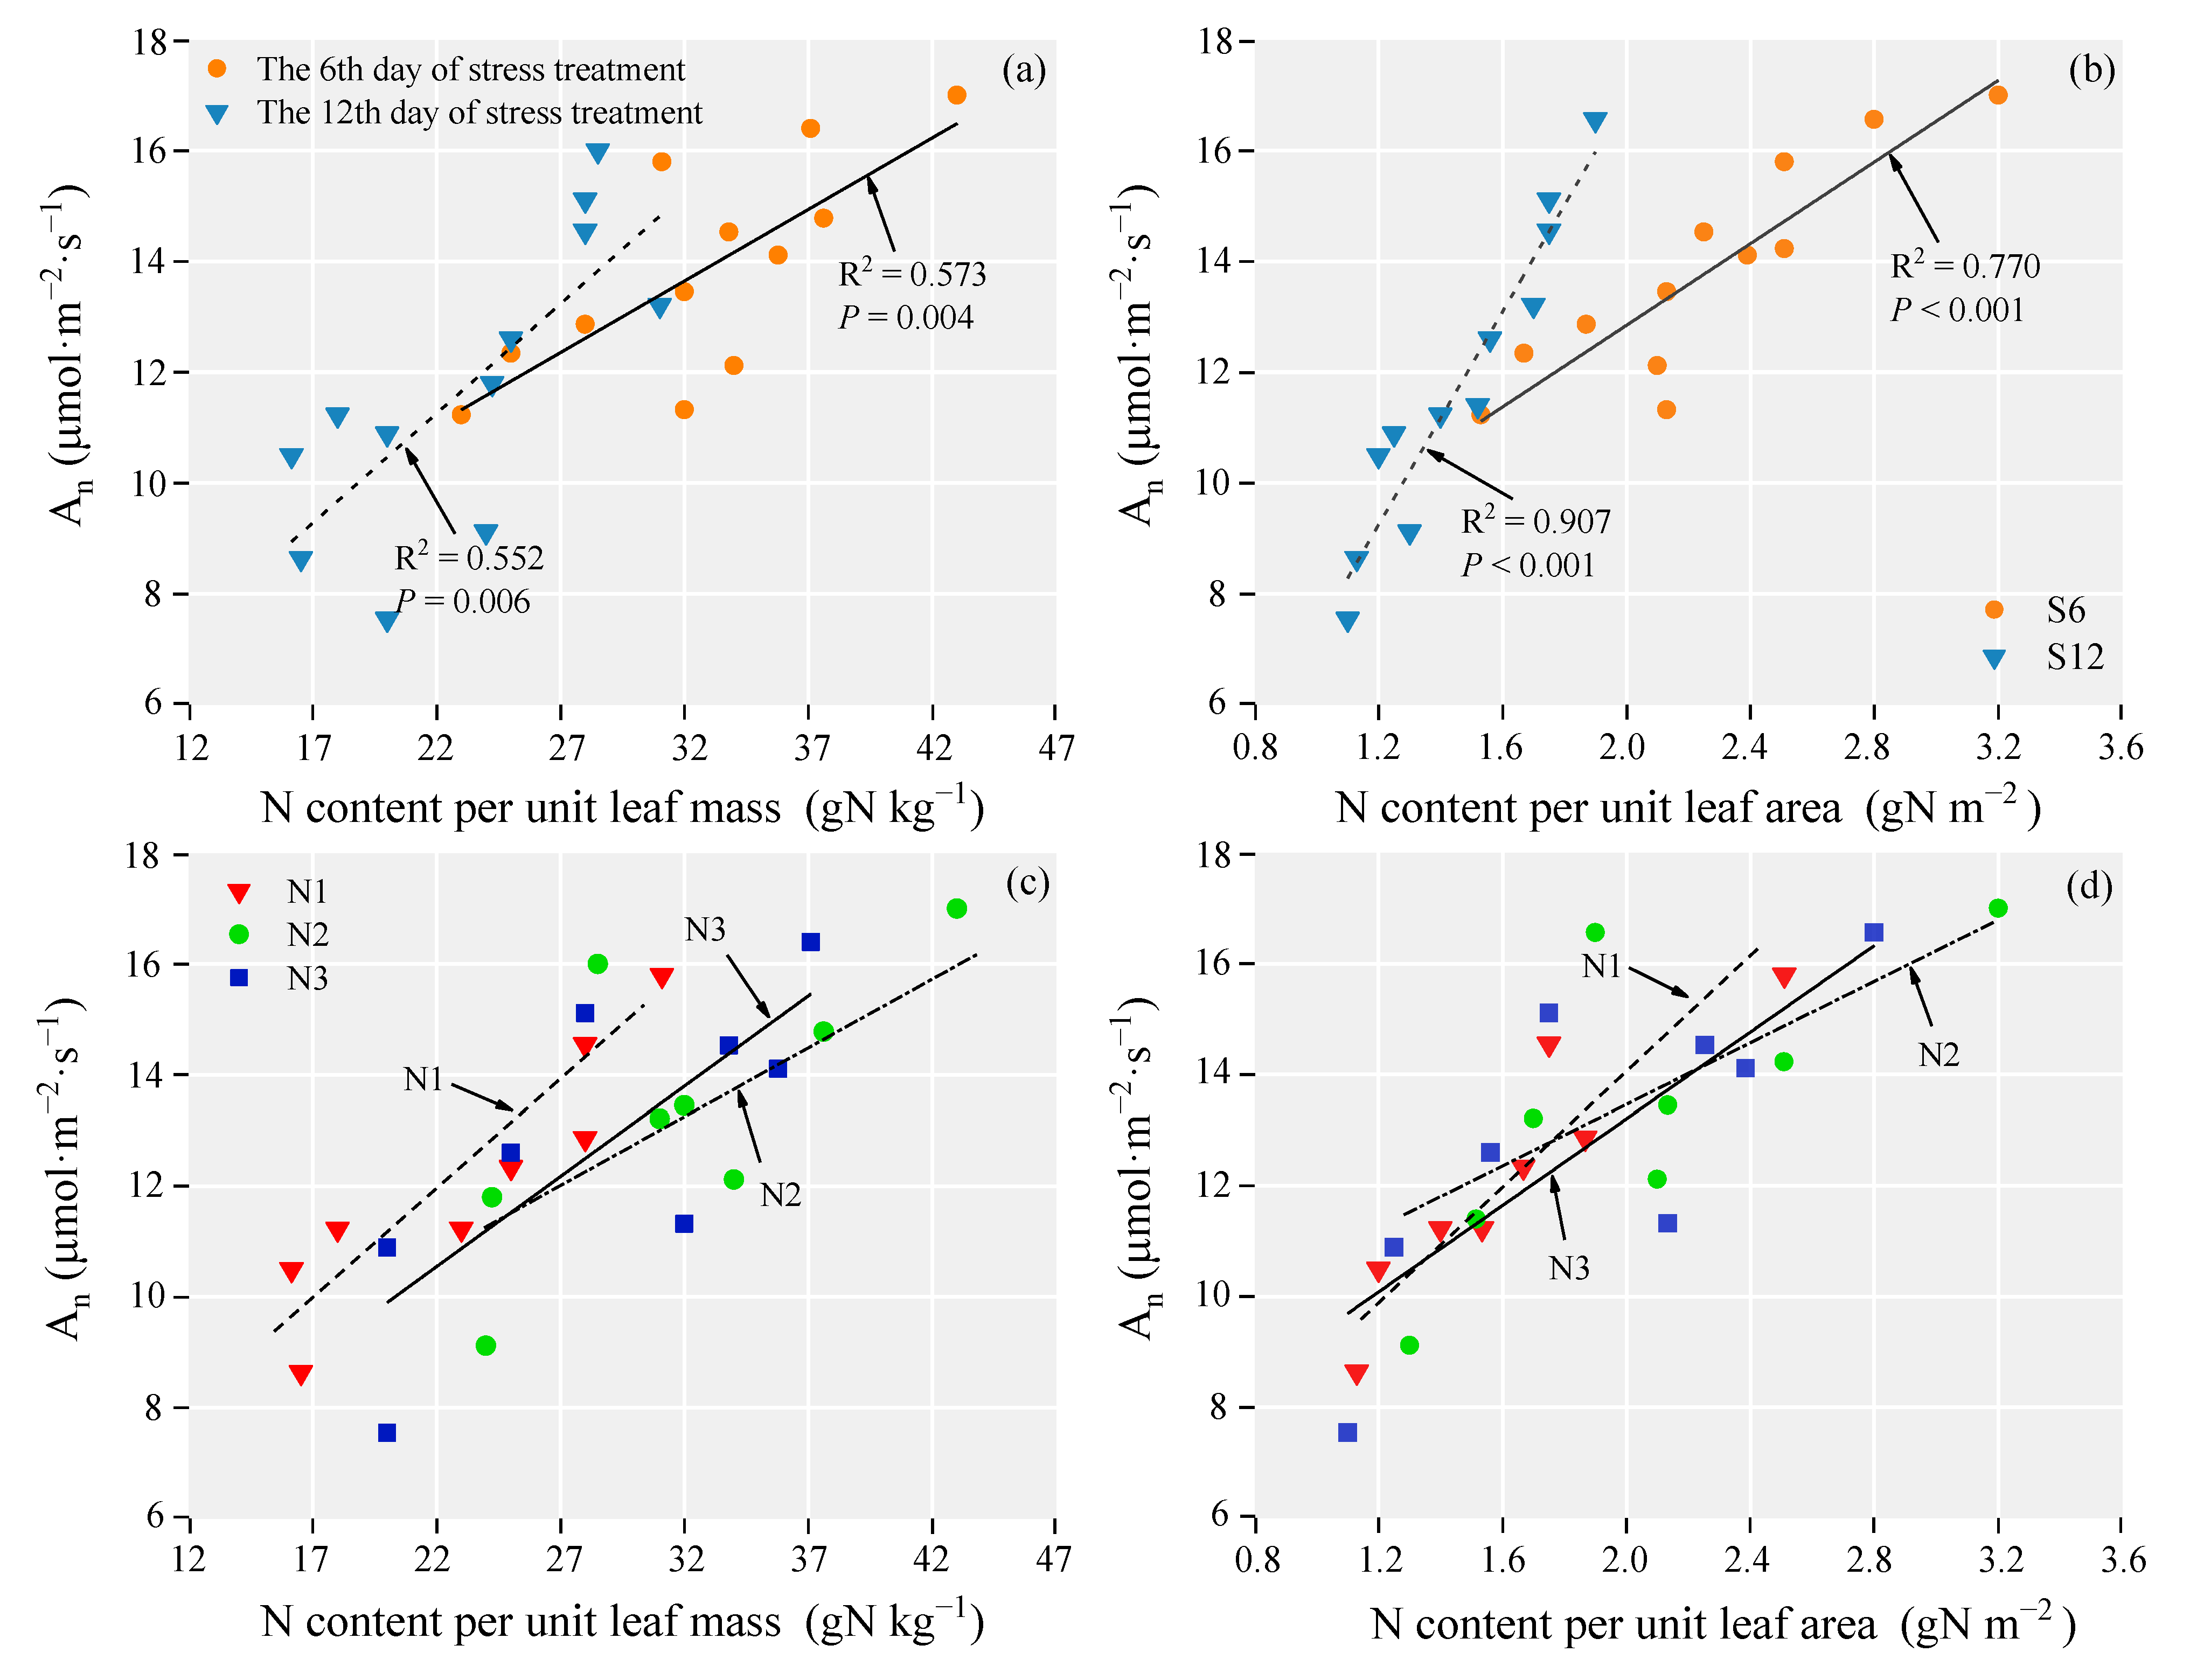
3.6. The Relationship between Photosynthetic Rate and Biological Factors

We evaluated the relationship between photosynthesis and N-mass and N-area and found a significant positive correlation between An and N-mass in two measurements (Figure 8a). A significant positive correlation was also observed between An and N-area, and An was linearly enhanced with increasing N-area. The correlation between An and N-area was more significant than that between An and N-mass in both measurements (the 6th and 12th days of stress treatment) (Figure 8b). In addition, there was a significant positive correlation between An and both N-mass and N-area under different N supplies (N1, N2 and N3). The slopes of the regression lines between An and N-mass and between An and N-area first decreased and then increased with increasing N application, and the R2 value of the N1 treatment was higher than that of N2 and N3 treatments (Table 3).

4. Discussion

4.1. Appropriate N Application Can Improve Photosynthesis under Short-Term Heat, Drought and Their Combination Stress after Anthesis

Previous studies have shown that high temperature exacerbates the reduction in photosynthesis under drought stress conditions [22], which was in agreement with the current finding (Figure 3). This phenomenon may be mainly explained by the ability of heat and drought to damage thylakoid membranes in leaves and the resultant decrease in electron transfer activity and efficiency, thereby causing a significant decrease in An [16]. In the current study, the reduction in An under combined stress was more pronounced compared to heat and drought stresses alone. However, Loka [38] reported that the photosynthetic rate under heat stress remained similar to that of the control, which they attributed to increases in gs and Tr. We assume that the difference between the findings of these studies is due to the longer duration of the heat stress treatment in the latter because the resulting increase in the transpiration rate effectively reduces the leaf temperature and prevents the destruction of the photosynthetic mechanism. It is worth noting that the N2 or N3 supplies effectively increased An in leaves under post-anthesis heat and drought stress alone (Figure 3a). The increase in photosynthesis may be related to the increase in the total chlorophyll content and chloroplast photochemical activity induced by increasing the N supply [39]. Here, we also observed that excessive N application could not alleviate drought stress in plants. In contrast, it aggravated drought stress and decreased photosynthesis (Figure 3a). The maintenance of stomatal opening under high N is important for maintaining leaf conductance for CO2 transpiration, photosynthetic reactions and electron transport [40]. In our study, the N2 application effectively improved gs and Tr of leaves under post-anthesis heat and drought stress alone compared with N1 application (Figure 3b,c). It was reported that one strategy for plants to enhance heat and drought tolerance is to increase leaf transpiration to reduce leaf temperature [41,42]. During the stress period, N3 application did not always have a positive regulatory effect on gs, especially under the HD treatment on the 12th day of stress treatment. Heat stress and high N application exacerbated the occurrence of drought stress, which may be the main reason for the decrease in Tr due to increased stomatal restriction under high N treatment. It was found that the application of N2 or N3 actively promoted the primary reaction process of photosynthesis, which was reflected in the increase in Fv/Fm and Φ PSII and the reduction in NPQ, potentially because under an appropriate increase in N supply, sufficient chlorophyll accelerated the synthesis of various enzymes and electron transporters via proteins involved in photosynthetic carbon assimilation and converted more light energy into chemical energy, thereby increasing Φ PSII and Fv/Fm [43]. In contrast, on the 12th day of stress treatment, the N1 treatment in the plants subjected to combined stress resulted in higher Φ PSII and Fv/Fm and a lower NPQ, implying that reducing N application under combined stress was more conducive to protecting the photosynthetic process.
In the present study, the responses of An, Φ PSII and Fv/Fm to post-anthesis heat, drought and their combined stress were similar. Abdelhakim [14] believed that An had a strong positive correlation with Fv/Fm when wheat plants were exposed to heat, drought and their combined stress after anthesis. More importantly, N2 application effectively improved the An, Fv/Fm and Φ PSII of leaves compared with N1 under post-anthesis heat and drought stress (the 12th day of stress treatment), whereas N1 treatment maintained higher An, Fv/Fm and Φ PSII under combined stress conditions (Figure 3 and Figure 4), which implies that the increased Fv/Fm and Φ PSII by appropriate N application were conducive to the protection of the photosynthetic process under post-anthesis individual and combined stresses. In the current study, WUEleaf under post-anthesis drought and combined stress was higher than that under full watering conditions, and the increase was more pronounced with the extension of stress time. Since less water was consumed under drought stress, the reduction in An was less than that in Tr [44]. Unlike the individual stresses, WUEleaf of the N3 treatment had a greater reduction than that of the N1 and N2 treatments. The WUEleaf of the N3 treatment under combined stress was significantly lower than that of the N1 and N2 treatments, which was primarily caused by the significant reduction in An and the nonsignificant reduction in Tr under the N3 application.

4.2. Comparison of Photosynthesis, Chlorophyll Fluorescence Parameters and Yield among Different N Applications under Short-Term Heat, Drought and Their Combination Stress after Anthesis

Here, differences in yield among different N treatments under post-anthesis stresses were further evaluated. We found that there were similar variations between An (the 12th day of stress treatment) and yield under different treatments. Under individual heat and drought stress, Fv/Fm, Φ PSII and yield were significantly improved under the N2 application compared with the N1 and N3 applications. However, the responses of Fv/Fm, Φ PSII and yield to N3 application were significantly different (Figure 3 and Figure 4). The above analysis indicates that An is likely to better explain the variation in yield compared with PSII photochemical efficiency. Makino [45] also believed that N supply may affect yield by affecting photosynthesis. Moreover, the same result was obtained by Xiang [46], who found that there was a significant positive correlation between the leaf photosynthetic rate and yield (r > 0.88 **) after anthesis. On the other hand, the An of drought-stressed plants was reduced by 11.28% on the 12th day of stress treatment compared to the 3rd day of stress treatment, and the An of N1 and N3 supplies decreased by 20.97% and 19.75% on the 12th day of stress treatment compared with the 3rd day of stress treatment. Moreover, N2 application was beneficial to the increase in yield and its components under drought stress conditions (Table 2), suggesting that delaying the senescence of wheat leaves after anthesis may be conducive to the improvement in grain yield [47]. This positive effect caused by N supply was also found in heat and combined stressed plants. Figure 7 shows that there were significant positive correlations between An and grain protein yield, grain N accumulation, spike grain number and grain yield. Photosynthesis can affect grain development and yield by affecting grain N and protein accumulation. This suggested that the effect of N on grain yield may be mainly driven by photosynthesis.

4.3. Relationships between Photosynthesis and Biological Factors of Leaves

In this study, a significant correlation was observed between An and biological factors, including N-mass and N-area. Their correlations were discussed from the following two perspectives. On the one hand, to clarify the factors leading to the differences in An, the correlations between An and N-mass as well as between An and N-area were analyzed for two determination dates (the 6th and 12th stress treatments). Interestingly, both N-mass and N-area can well explain the variation in An on the two determination dates (Figure 8a,b). In contrast, the R2 value of the regression lines between N-area and An was significantly higher than that of the regression lines between N-mass and An (Table 3), which suggests that N-area can better explain the changes in photosynthesis compared to N-weight in this study. Since An is expressed on a unit area, it is more popular to use N-area as an indicator of An [48].
On the other hand, the data of the two measurement dates (the 6th and 12th days of stress treatment) are gathered together. The correlation between leaf N content and An was established to explore whether leaf N content was affected by different N applications. Correlations between An and leaf N content were affected by the N supply due to the difference among regression lines (Table 3). The higher An caused by N supply may be associated with the increase in N distribution in the photosynthetic mechanism [49]. Bindraban [50] concluded that when the leaf N content was at a low level, An was strongly linearly correlated with the leaf N content. This corresponds to our findings. Here, An had higher correlations with N-mass and N-area under low N than under medium and high N application (Table 3), and the interpretation of An by leaf N content was more accurate when the leaf N accumulation was low and narrower. It was found that the fitting curve between N-area and An may increase logarithmically, as illustrated in Figure 8c,d. Therefore, there may be a threshold of N-area in the curve; when N-area was higher than this threshold, the increase in An was much less than that when N-area reached the threshold. It was reported earlier that the photosynthetic rate increased linearly before the leaf nitrogen content reached 1.5 g/m2, but beyond this threshold, the increase in photosynthetic rate was much less than that of leaf N accumulation [51]. Therefore, it may be concluded that the luxury N absorption caused by excessive N application was not conducive to the improvement in photosynthesis and affected the yield.

4.4. Appropriate N Application Can Improve Grain Yield by N Metabolism Enzyme Activities, N Accumulation and Growth under Short-Term Heat, Drought and Their Combined Stress after Anthesis

Earlier studies showed that persistent heat or drought stress reduced the activities of NR and GS, which greatly limited source activity and assimilated supply in grain and resulted in a significant reduction in yield [20,52]. In the current study, post-anthesis heat and drought stress significantly reduced NR and GS activities, and combined stress showed a subadditive effect. The reductions in these two enzyme activities were more pronounced with increasing stress time. The low activities of NR and GS under heat stress condition may be due to their low soluble protein content [53]. Nevertheless, the N2 application significantly increased NR and GS activities in grains under individual heat and drought stress after anthesis compared with N1 (Figure 5), and increasing the appropriate N level improved the abundance of enzymes and their activities [54]. This indicates that sufficient N application can ensure a smooth and efficient N metabolism process in grains after anthesis and increase the level of N metabolism in plants. The accumulation of N and protein in wheat grains largely depends on N assimilation [55]. Moreover, positive regulation of N2 application was also observed in terms of N accumulation and protein content, which may be mainly attributed to the increased expression of enzyme genes related to N metabolism. Goodall [56] reported an increase in GS1 expression with increasing N application in barley. In contrast, N1 application was more conducive to the enhancement of NR and GS activities in grain under post-anthesis combined heat and drought stress, whereas excessive N application severely inhibited grain N assimilation (Figure 5 and Figure 6). This is likely to be the main reason for the lower N accumulation and protein yield in grain. Nikolic [57] and Tao [20] pointed out that greater accumulation of N and protein in grains at maturity led to higher grain yield. The positive correlations in Figure 7 further confirmed that the accumulation of N and protein in grain plays a vital role in yield formation.
Drought and heat stresses are the main abiotic stress factors affecting plant growth and development, and long-term heat or drought stress has an irreversible negative impact on plant growth [58]. In the present study, post-anthesis heat and drought stresses resulted in significant reductions in green leaf area, plant height, ADW and RGR, and the reduction in growth traits was further exacerbated by the combined stress (Table 1). It has been reported that N deficiency can reduce plant height, green leaf growth, photosynthetic rate and source sink capacity, thus reducing the size of nutrient storage organs [59], and leading to lower yields. Nevertheless, increasing N application can mitigate the detrimental effect of heat and drought stress on plant growth by increasing the photosynthetic capacity and cell division intensity [26]. As shown in Table 1 and Figure 3, the An increased by N regulation exhibited a similar increasing tendency with growth traits under post-anthesis heat, drought and combined stress. The results of our study are supported by Engels [59], who reported that a sufficient N supply can increase plant height, green leaf growth, and source sink capacity by improving the photosynthetic rate. This finding was confirmed in the current study. It is interesting to note that increasing the N supply could not alleviate the adverse effects of combined heat and drought stress. In contrast, it aggravated the effects of combined stress and led to a decrease in plant growth. Therefore, it can be seen from the above findings that N plays a vital role in regulating the effects of heat and drought stresses on plant growth. However, its regulatory effects significantly differ due to differences in stress types. In our study, the growth characteristics of stressed wheat, including green leaf area, ADM, plant height, N accumulation, protein content and protein yield in grain, were positively affected by N application (Table 1 and Figure 6), which was beneficial to the increase in yield, WUE and NUE. This can be further observed in the correlation established among the above parameters (Figure 7).

4.5. Appropriate N Supply Can Improve the WUE and NUE of Wheat under Short-Term Heat, Drought and Their Combined Stress after Anthesis

Extreme short-term high temperature and drought stress on the Guanzhong Plain usually occur after anthesis of wheat. In the study, short-term heat, drought and their combined stress were carried out after anthesis, and the simulated high temperature in the growth chamber was basically consistent with the historical average (Supplementary Figure S1). After stress treatment, all wheat plants under outdoor conditions remained well watered, during which time wheat plants were not subjected to extreme heat stress (Supplementary Figure S2). Therefore, the difference in yield under different stress conditions was mainly caused by short-term heat, drought and combined stress after anthesis.
The accumulated evidence clearly shows that heat and drought stress from flowering to grain filling shorten grain filling duration and reduce grain weight, resulting in a severe reduction in crop yield [60,61]. Similar results were observed in the present study. Our study showed that although wheat plants were exposed to heat stress, sufficient soil water partially compensated for the adverse effect of heat stress on spike development, resulting in a more pronounced negative effect of drought than heat stress on yield components, which was finally reflected in grain yield. The reduction in yield components and grain yield under combined heat and drought stress was higher than their individual levels. However, compared with N1, N2 or N3 application effectively increased wheat yield and yield components under short-term individual heat and drought stress after anthesis (Table 2). This finding was previously noted in some crop plants, i.e., Lalelou and Fateh [62] found that nitrogen supplementation compensated for the wheat yield loss and deteriorative effects of water-deficit conditions. Our study also found that compared with N2 and N3 applications, N application reduction (N1) mainly improved grain yield by increasing SNG and TGW under combined stress, potentially because plants had a better water status under a low N supply, sustaining kernel set and cell division in the embryo and endosperm [63]. These findings indicated that wheat grown under insufficient N application can better cope with one or several completely different abiotic stresses [33]. A previous study reported that WUE can be increased under moderate drought stress and reasonable N application conditions [64,65]. In this study, WUEg and WUEb were significantly increased by post-anthesis short-term drought stress when compared to controls. Nonetheless, increasing N application strengthened this regulatory mechanism, as revealed by the higher WUEg and WUEb under the N2 application in the SD and HF treatments compared to N1 (Table 2). This may be because the regulatory effect of N2 application on grain yield and ADM was more significant than that of N1 application. Nevertheless, under post-anthesis combined stress, N1 application can achieve a higher yield by increasing GN and TKW, and the higher WUEg may be mainly attributed to the higher yield under N1 compared with the N2 and N3 applications (Table 2).
It has been reported that drought stress can cause a decrease in the N utilization capacity of plants, which is associated with reduced soil nitrogen availability or root nitrogen uptake capacity under drought stress conditions [66]. High temperatures exceeding the critical value depressed N metabolism enzyme activities and exacerbated N loss [20,52], which may be the main reason for the reduced N use capacity of plants under heat stress conditions. In the present study, NUEg and NUEb were significantly reduced under post-anthesis heat and drought stress alone, and the decreases in NUEg and NUEb under combined stress conditions were greater than those under individual heat and drought stress. The significant reduction under combined stress may be the result of a combined effect of the above two reasons. It was found that N2 application significantly increased NUEg and NUEb of wheat under short-term individual heat and drought stress (Table 2). The increased NR and GS activities in grains under the N2 application promoted the increase in grain N accumulation, which was conducive to the improvement in yield (Figure 7). This is likely to be an important reason for the increased NUEg. It is worth noting that excessive N application did not increase NUEg and NUEb. Conversely, increasing N application significantly reduced NUE under combined stress conditions compared with N1 application (Table 2). This is because the transport of N nutrition from vegetative organs to grains has been severely inhibited, leading to a lower grain N accumulation under N3 than under N1 and N2 applications, which may lead to lower grain yield and thus lower NUEg. In addition, a decrease in NUEg indicated that the improvement in grain yield was lower than the increase in plant N uptake. These results may prove that plants cannot absorb N due to their overloaded absorption mechanism when an excessive N application rate is applied under combined heat and drought stress conditions [67,68].

5. Conclusions

Compared with N1, N2 or N3 application enhanced the activities of NR and GS in grain and increased N accumulation and protein yield in grain under short-term heat and drought stress after anthesis. The decreased PSII photochemical efficiency and photosynthesis by post-anthesis heat and drought stress were improved under N2 application, while the favorable effects of N on the abovementioned parameters under combined heat and drought stress were usually observed under N1 application. An may be a better yield indicator than Fv/Fm and Φ PSII, and it can be more accurately explained by N-area than N-weight. It can be concluded that under short-term individual heat and drought stress after anthesis, N2 application effectively increased yield by improving photosynthesis and enhancing the activities of NR and GS, the accumulation of N and protein in grains and the growth of wheat, and the highest WUE and NUE were achieved by N2 application. However, under combined heat and drought stress conditions, N1 application effectively improved the growth and physiological activity of wheat, alleviating the reduction in yield, WUE and NUE.

Supplementary Materials

The following supporting information can be downloaded at: https://www.mdpi.com/article/10.3390/w14091407/s1, Figure S1: Extreme maximum temperature after winter wheat anthesis in the main production areas on the Guanzhong Plain in China from 1990 to 2019; Figure S2: Changes in outdoor ambient temperature from stress relief to maturity.

Author Contributions

C.R., X.H. and W.W. designed the experiments, C.R. performed the research and data analysis, D.C. and N.C.H. provided guidance on the determination of indicators, T.S. and M.L. assisted in the determination of various indicators, and C.R. wrote the manuscript with contributions from all authors. All authors have read and agreed to the published version of the manuscript.

Funding

This work was supported by the Natural Science Foundation of Shaanxi Province (2022JZ-24), the National Key Research and Development Program of China (2017YFD0201508), and the National Natural Science Foundation of China (51179163).

Institutional Review Board Statement

Not applicable.

Informed Consent Statement

Not applicable.

Data Availability Statement

The datasets used and/or analyzed during the current study are available from the corresponding author on reasonable request.

Acknowledgments

The authors would like to acknowledge all the team members of the Key Laboratory of Agricultural Soil and Water Engineering in Arid and Semiarid Areas, Ministry of Education.

Conflicts of Interest

The authors declare no conflict of interest.

References

  1. IPCC. Climate Change 2014: Synthesis Report. Contribution of Working Groups I, II and III to the Fifth Assessment Report of the Intergovernmental Panel on Climate Change; Core Writing Team, Pachauri, R.K., Meyer, L.A., Eds.; IPCC: Geneva, Switzerland, 2014; p. 151. [Google Scholar]
  2. IPCC. The physical science basis. Working group I technical support unit. Climate change. In Working Group I Contribution to the Fifth Assessment Report of the Intergovernmental Panel on Climate Change; Stpcker, T.F., Qin, D., Plattner, G.P., Tignor, M.M.B., Allen, A.K., Boschung, J., Nauels, A., Xia, Y., Bex, V., Midgley, P.M., Eds.; Cambridge University Press: Cambridge, UK, 2013. [Google Scholar]
  3. Trnka, M.; Olesen, J.E.; Kersebaum, K.C.; Skjelvag, A.O.; Eitzinger, J.; Seguin, B.; Peltonen-Sainio, P.; Rötter, R.; Iglesias, A.; Orlandini, S.; et al. Agroclimatic conditions in Europe under climate change. Glob. Chang. Biol. 2011, 17, 2298–2318. [Google Scholar] [CrossRef] [Green Version]
  4. Redden, R. New Approaches for Crop Genetic Adaptation to the Abiotic Stresses Predicted with Climate Change. Agronomy 2013, 3, 419–432. [Google Scholar] [CrossRef]
  5. Reyer, C.P.O.; Leuzinger, S.; Rammig, A.; Wolf, A.; Bartholomeus, R.P.; Bonfante, A.; Lorenzi, F.D.; Dury, M.; Gloning, P.; Jaoudé, R.A.; et al. Plant’s perspective of extremes: Terrestrial plant responses to changing climatic variability. Glob. Chang. Biol. 2013, 19, 75–89. [Google Scholar] [CrossRef]
  6. Lott, N.; Ross, T.; Smith, A.; Houston, T.; Shein, K. Billion Dollar US Weather Disasters, 1980–2010; National Climatic Data Center: Asheville, NC, USA, 2011. Available online: http://www.ncdc.noaa.gov/oa/reports/billionz.html (accessed on 24 October 2021).
  7. Suzuki, N.; Rivero, R.M.; Shulaev, V.; Blumwald, E.; Mittler, R. Abiotic and biotic stress combinations. New Phytol. 2014, 203, 32–43. [Google Scholar] [CrossRef] [PubMed]
  8. Li, S.Y.; Miao, L.J.; Jiang, Z.H.; Wang, G.J.; Gnyawali, K.R.; Zhang, J.; Zhang, H.; Fang, K.; He, Y.; Li, C. Projected drought conditions in Northwest China with CMIP6 models under combined SSPs and RCPs for 2015–2099. Adv. Clim. Chang. Res. 2020, 11, 210–217. [Google Scholar] [CrossRef]
  9. Zheng, Z.; Hoogenboom, G.; Cai, H.J.; Wang, Z.K. Winter wheat production on the Guanzhong Plain of Northwest China under projected future climate with SimCLIM. Agr. Water Manag. 2020, 239, 106233. [Google Scholar] [CrossRef]
  10. Ju, Y.L.; Min, Z.; Zhang, Y.; Zhang, K.K.; Liu, M.; Fang, Y.L. Transcriptome profiling provide new insights into the molecular mechanism of grapevine response to heat, drought, and combined stress. Sci. Hortic. 2021, 286, 110076. [Google Scholar] [CrossRef]
  11. Szymańska, R.; Slesak, I.; Orzechowska, A.; Kruk, J. Physiological and biochemical responses to high light and temperature stress in plants. Environ. Exp. Bot. 2017, 139, 165–177. [Google Scholar] [CrossRef]
  12. Ahluwalia, O.; Singh, P.C.; Bhatia, R. A review on drought stress in plants: Implications, mitigation and the role of plant growth promoting rhizobacteria. Resour. Environ. Sustain. 2021, 5, 100032. [Google Scholar] [CrossRef]
  13. Lipiec, J.; Doussan, C.; Nosalewicz, A.; Kondracka, K. Effect of drought and heat stresses on plant growth and yield: A review. Int. Agrophys. 2013, 27, 463–477. [Google Scholar] [CrossRef]
  14. Abdelhakim, L.O.A.; Palma, C.F.F.; Zhou, R.; Wollenweber, B.; Ottosen, C.O.; Rosenqvist, E. The effect of individual and combined drought and heat stress under elevated CO2 on physiological responses in spring wheat genotypes. Plant Physiol. Biochem. 2021, 162, 301–314. [Google Scholar] [CrossRef] [PubMed]
  15. Mathur, S.; Agrawal, D.; Jajoo, A. Photosynthesis: Response to high temperature stress. J. Photochem. Photobiol. B Biol. 2014, 137, 116–126. [Google Scholar] [CrossRef] [PubMed]
  16. Urban, O.; Hlaváová, M.; Klem, K.; Novotna, K.; Rapantova, B.; Smutna, P.; Horakova, V.; Hlavinka, P.; Skarpa, P.; Trnka, M. Combined effects of drought and high temperature on photosynthetic characteristics in four winter wheat genotypes. Field Crop Res. 2018, 223, 137–149. [Google Scholar] [CrossRef]
  17. Alvar-Beltranaz, J.; Dao, A.; Dalla Marta, A.; Saturnin, C.; Casini, P.; Orlandini, S. Effect of drought, nitrogen fertilization, temperature, and photoperiodicity on quinoa plant growth and development in the Sahel. Agronomy 2019, 9, 607. [Google Scholar] [CrossRef] [Green Version]
  18. Prasad, P.; Staggenborg, S.; Ristic, Z. Impacts of drought and/or heat stress on physiological, developmental, growth, and yield processes of crop plants. In response of crops to limited water: Understanding and modeling water stress effects on plant growth processes. In Advances in Agricultural Systems Modeling Series 1; Ahuja, L.H., Saseendran, S.A., Eds.; ASA-CSSA: Madison, WI, USA, 2008; pp. 301–355. [Google Scholar]
  19. Xiong, X.; Chang, L.Y.; Muhammad, K.; Zhang, J.J.; Huang, D.F. Alleviation of Drought Stress by Nitrogen Application in Brassica campestris ssp. Chinensis L. Agronomy 2018, 8, 66. [Google Scholar] [CrossRef] [Green Version]
  20. Tao, Z.Q.; Wang, D.M.; Chang, X.H.; Wang, Y.J.; Yang, Y.S.; Zhao, G.C. Effects of zinc fertilizer and short-term high temperature stress on wheat grain production and wheat flour proteins. J. Integr. Agr. 2018, 17, 1979–1990. [Google Scholar] [CrossRef] [Green Version]
  21. Zahra, N.; Wahid, A.; Hafeez, M.B.; Ullah, A.; Siddique, K.H.M.; Farooq, M. Grain Development in Wheat under Combined Heat and Drought Stress: Plant Responses and Management. Environ. Exp. Bot. 2021, 188, 104517. [Google Scholar] [CrossRef]
  22. Mu, Q.; Cai, H.J.; Sun, S.K.; Wen, S.S.; Xu, J.T.; Dong, M.Q.; Saddique, Q. The physiological response of winter wheat under short-term drought conditions and the sensitivity of different indices to soil water changes. Agric. Water Manag. 2021, 243, 106475. [Google Scholar] [CrossRef]
  23. Farooq, M.; Bramley, H.; Palta, J.A.; Siddique, K.H.M. Heat stress in wheat during reproductive and grain-filling phases. Crit. Rev. Plant Sci. 2011, 30, 491–507. [Google Scholar] [CrossRef]
  24. Ma, T.; Chen, K.W.; He, P.R.; Dai, Y.; Yin, Y.Q.; Peng, S.H.; Ding, J.H.; Yu, S.E.; Huang, J.S. Sunflower Photosynthetic Characteristics, Nitrogen Uptake, and Nitrogen Use Efficiency under Different Soil Salinity and Nitrogen Applications. Water 2022, 14, 982. [Google Scholar] [CrossRef]
  25. Zhang, F.F.; Gao, S.; Zhao, Y.Y.; Zhao, X.L.; Liu, X.M.; Xiao, K. Growth traits and nitrogen assimilation-associated physiological parameters of wheat (Triticum aestivum L.) under low and high N conditions. J. Integr. Agric. 2015, 14, 1295–1308. [Google Scholar] [CrossRef] [Green Version]
  26. Du, Y.D.; Niu, W.Q.; Zhang, Q.; Cui, B.J.; Zhang, Z.H.; Wang, Z.; Sun, J. A synthetic analysis of the effect of water and nitrogen inputs on wheat yield and water- and nitrogen-use efficiencies in China. Field Crop Res. 2021, 265, 108105. [Google Scholar] [CrossRef]
  27. Riley, W.J.; Ortiz-Monasterio, I.; Matso, P.A. Nitrogen leaching and soil nitrate, nitrite, and ammonium levels under irrigated wheat in Northern Mexico. Nutr. Cycl. Agroecosyst. 2001, 61, 223–236. [Google Scholar] [CrossRef]
  28. Agami, R.A.; Alamri, S.A.M.; Abd El-Mageed, T.A.; Abousekken, M.S.M.; Hashem, M. Role of exogenous nitrogen supply in alleviating the deficit irrigation stress in wheat plants. Agric. Water Manag. 2018, 210, 216–270. [Google Scholar] [CrossRef]
  29. Brueck, H.; Erdle, K.; Gao, Y.Z.; Giese, M.; Zhao, Y.; Peth, S.; Lin, S. Effects of N and water supply on water use-efficiency of semiarid grassland in Inner Mongolia. Plant Soil. 2010, 328, 495–505. [Google Scholar] [CrossRef]
  30. Waraich, E.A.; Ahmad, R.; Halim, A.; Aziz, T. Alleviation of temperature stress by nutrient management in crop plants: A review. J. Soil Sci. Plant Nutr. 2012, 12, 221–244. [Google Scholar] [CrossRef] [Green Version]
  31. Elía, M.; Slafer, G.A.; Savin, R. Yield and grain weight responses to post-anthesis increases in maximum temperature under field grown wheat as modified by nitrogen supply. Field Crops Res. 2018, 221, 228–237. [Google Scholar] [CrossRef] [Green Version]
  32. Meng, Z.; Duan, A.W.; Dassanayake, K.; Chen, D.; Gao, Y.; Wang, X.; Shen, X. Effects of regulated deficit irrigation on grain yield and quality traits in winter wheat. Trans. ASABE 2016, 59, 897–907. [Google Scholar]
  33. Lu, J.S.; Hu, T.T.; Geng, C.M.; Cui, X.L.; Fan, J.L.; Zhang, F.C. Response of yield, yield components and water-nitrogen use efficiency of winter wheat to different drip fertigation regimes in Northwest China. Agric. Water Manag. 2021, 255, 107034. [Google Scholar] [CrossRef]
  34. Gaudinová, A. The effect of cytokinins on nitrate reductase activity. Biol. Plantarum 1990, 32, 89–96. [Google Scholar] [CrossRef]
  35. Zhang, C.F.; Peng, S.B.; Peng, X.X.; Chavez, A.Q.; Bennett, J. Response of glutamine synthetase isoforms to nitrogen sources in rice (Oryza sativa L.) roots. Plant Sci. 1997, 125, 163–170. [Google Scholar] [CrossRef]
  36. Lyu, X.K.; Liu, Y.; Li, N.; Ku, L.B.; Hou, Y.T.; Wen, X.X. Foliar applications of various nitrogen (N) forms to winter wheat affect grain protein accumulation and quality via N metabolism and remobilization. Crop J. 2021. [Google Scholar] [CrossRef]
  37. Karimi, M.; Siddique, K. Crop growth and relative growth rates of old and modern wheat cultivars. Aust. J. Agric. Res. 1991, 42, 13–20. [Google Scholar] [CrossRef]
  38. Loka, D.A.; Oosterhuis, D.M.; Baxevanos, D.; Noulas, C.; Hu, W. Single and combined effects of heat and water stress and recovery on cotton (Gossypium hirsutum L.) leaf physiology and sucrose metabolism. Plant Physiol. Biochem. 2020, 148, 166–179. [Google Scholar] [CrossRef] [PubMed]
  39. Li, D.D.; Tian, M.Y.; Cai, J.; Jing, D.; Cao, W.X.; Dai, T.B. Effects of low nitrogen supply on relationships between photosynthesis and nitrogen status at different leaf position in wheat seedlings. Plant Growth Regul. 2013, 70, 257–263. [Google Scholar] [CrossRef]
  40. Zhong, C.; Cao, X.C.; Hu, J.J.; Zhu, L.F.; Zhang, J.H.; Huang, J.L.; Jin, Q.Y. Nitrogen metabolism in adaptation of photosynthesis to water stress in rice grown under different nitrogen levels. Front. Plant Sci. 2017, 8, 1079. [Google Scholar] [CrossRef] [PubMed] [Green Version]
  41. Borrell, A.K.; Mullet, J.E.; Georgee Jaeggli, B.; van Oosterom, E.J.; Hammer, G.L.; Klein, P.E.; Jordan, D.R. Drought adaptation of stayegreen sorghum is associated with canopy development, leaf anatomy, root growth, and water uptake. J. Exp. Bot. 2014, 21, 6251–6263. [Google Scholar] [CrossRef]
  42. Zhou, R.; Yu, X.Q.; Li, X.N.; Santos, T.M.D.; Rosenqvist, E.; Ottosen, C.O. Combined high light and heat stress induced complex response in tomato with better leaf cooling after heat priming—ScienceDirect. Plant Physiol. Biochem. 2020, 151, 1–9. [Google Scholar] [CrossRef]
  43. Zivcak, M.; Olsovska, K.; Slamka, P.; Galambosova, J.; Rataj, V.; Shao, H.S.; Brestic, M. Application of chlorophyll fluorescence performance indices to assess the wheat photosynthetic functions influenced by nitrogen deficiency. Plant Soil Environ. 2014, 60, 210–215. [Google Scholar] [CrossRef] [Green Version]
  44. Zhang, B.B.; Liu, W.Z.; Chang, S.X.; Anyia, A.O. Water-deficit and high temperature affected water use efficiency and arabinoxylan concentration in spring wheat. J. Cereal Sci. 2010, 52, 263–269. [Google Scholar] [CrossRef]
  45. Makino, A. Photosynthesis, grain yield, and nitrogen utilization in rice andwheat. Plant Physiol. 2011, 155, 125–129. [Google Scholar] [CrossRef] [PubMed] [Green Version]
  46. Xiang, D.B.; Ma, C.R.; Song, Y.; Wu, Q.; Wu, X.Y.; Sun, Y.X.; Zhao, G.; Wan, Y. Post-Anthesis Photosynthetic Properties Provide Insights into Yield Potential of Tartary Buckwheat Cultivars. Agronomy 2019, 9, 149. [Google Scholar] [CrossRef] [Green Version]
  47. Gaju, O.; Allard, V.; Martre, P.; Snape, J.W.; Heumez, E.; LeGouis, J.; Moreau, D.; Bogard, M.; Griffiths, S.; Orford, S. Identification of traits to improve thenitrogen-use efficiency of wheat genotypes. Field Crop Res. 2011, 123, 139–152. [Google Scholar] [CrossRef]
  48. Hikosaka, K. Interspecific difference in the photosynthesis-nitrogen relationship: Patterns, physiological causes, and ecological importance. J. Plant Res. 2004, 117, 481–494. [Google Scholar] [CrossRef] [PubMed]
  49. Evans, J.R. Photosynthesis and nitrogen relationships in leaves of C3 plants. Oecologia 1989, 78, 9–19. [Google Scholar] [CrossRef]
  50. Bindraban, P.S. Impact of canopy nitrogen profile in wheat on growth. Field Crop Res. 1999, 63, 63–77. [Google Scholar] [CrossRef]
  51. Tambussi, E.A.; Nogués, S.; Araus, J.L. Ear of durum wheat under waterstress: Water relations and photosynthetic metabolism. Planta 2005, 221, 446–458. [Google Scholar] [CrossRef]
  52. Cui, G.C.; Zhang, Y.; Zhang, W.J.; Lang, D.Y.; Zhang, X.J.; Li, Z.X.; Zhang, X.H. Response of Carbon and Nitrogen Metabolism and Secondary Metabolites to Drought Stress and Salt Stress in Plants. J. Plant Biol. 2019, 62, 387–399. [Google Scholar] [CrossRef]
  53. Yang, H.; Huang, T.Q.; Ding, M.Q.; Lu, D.L.; Lu, W.P. High temperature during grain filling impacts on leaf senescence in waxy maize. Agron. J. 2017, 109, 906–916. [Google Scholar] [CrossRef]
  54. Gao, X.P.; Lukow, O.M.; Grant, C.A. Grain concentrations of protein, iron and zinc and bread making quality in spring wheat as affected by seeding date and nitrogen fertilizer management. J. Geochem. Explor. 2012, 121, 36–44. [Google Scholar] [CrossRef]
  55. Zhang, M.W.; Ma, D.Y.; Ma, G.; Wang, C.Y.; Xie, X.D.; Kang, G.Z. Responses of glutamine synthetase activity and gene expression to nitrogen levels in winter wheat cultivars with different grain protein content. J. Cereal Sci. 2017, 74, 187–193. [Google Scholar] [CrossRef]
  56. Goodall, A.J.; Kumar, P.; Tobin, A.K. Identification and expression analyses of cytosolic glutamine synthetase genes in barley (Hordeum vulgare L.). Plant Cell Physiol. 2013, 54, 492–505. [Google Scholar] [CrossRef] [PubMed] [Green Version]
  57. Nikolic, O.; Zivanovic, T.; Jelic, M.; Djalovic, I. Interrelationships between grain nitrogen content and other indicators of nitrogen accumulation and utilization efficiency in wheat plants. Chil. J. Agric. Res. 2012, 72, 111–116. [Google Scholar] [CrossRef] [Green Version]
  58. Lobell, D.B.; Hammer, G.L.; Chenu, K.; Zheng, B.; McLean, G.; Chapman, S.C. The shifting influence of drought and heat stress for crops in northeast Australia. Glob Chang. Biol. 2015, 21, 4115–4127. [Google Scholar] [CrossRef] [PubMed]
  59. Engels, C.; Marschne, H. Plant uptake and utilization of nitrogen. In Nitrogen Fertilization and the Environment; Bacon, P.E., Ed.; Marcel Dekker: New York, NY, USA, 1995; pp. 41–83. [Google Scholar]
  60. Guilioni, L.; Wery, J.; Lecoeur, J. High temperature and water deficit may reduce seed number in field pea purely by decreasing plant growth rate. Funct. Plant Biol. 2003, 30, 1151–1164. [Google Scholar] [CrossRef]
  61. Nadeem, M.; Li, J.J.; Wang, M.H.; Shah, L.; Lu, S.Q.; Wang, X.B.; Ma, C.X. Unraveling field crops sensitivity to heat stress: Mechanisms, approaches, and future prospects. Agronomy 2018, 8, 128. [Google Scholar] [CrossRef] [Green Version]
  62. Lalelou, F.S.; Fateh, M. Effects of water deficit stress and nitrogen fertilizer on wheat varieties. Int. J. Biosci. 2014, 4, 183–189. [Google Scholar]
  63. Westgate, M.E.; Passioura, J.B.; Munns, R. Water status and ABA content of floral organs in drought-stressed wheat. Aust. J. Plant Physiol. 1996, 23, 763–772. [Google Scholar] [CrossRef]
  64. Zhou, C.L.; Zhang, H.J.; Li, F.Q.; Wang, Z.Y.; Wang, Y.C. Photosynthetic characteristics and yield response of isatis indigotica to regulated deficit irrigation in a cold and arid environment. Water 2021, 13, 3510. [Google Scholar] [CrossRef]
  65. Hatfield, J.L.; Sauer, T.J.; Prueger, J.H. Managing soilsto achieve greater water use efficiency: A review. Agron. J. 2001, 93, 271–280. [Google Scholar] [CrossRef]
  66. He, M.Z.; Dijkstra, F.A. Drought effect on plant nitrogen and phosphorus: A meta-analysis. New Phytol. 2014, 204, 924–931. [Google Scholar] [CrossRef] [PubMed]
  67. Chen, J.S.; Wang, G.S.; Hamani, A.K.M.; Amin, A.S.; Sun, W.H.; Zhang, Y.Y.; Liu, Z.D.; Gao, Y. Optimization of Nitrogen Fertilizer Application with Climate-Smart Agriculture in the North China Plain. Water 2021, 13, 3415. [Google Scholar] [CrossRef]
  68. Shamme, S.K.; Raghavaiah, C.V.; Balemi, T.; Hamza, I. Sorghum (Sorghum bicolor L.) growth, productivity, nitrogen removal, N-use efficiencies and economics in relation to genotypes and nitrogen nutrition in Kellem-Wollega zone of Ethiopia, east Africa. Adv. Crop Sci. Technol. 2016, 4, 218. [Google Scholar] [CrossRef] [Green Version]
Figure 1. Schematic diagram of the overall experimental layout.
Water 14 01407 g001
Figure 2. Changes in daily temperature (a) and soil water content (b) during the stress treatment.
Water 14 01407 g002
Figure 3. Effects of N application on net photosynthetic rate (An, a), stomatal conductance (gs, b), transpiration rate (Tr, c) and instantaneous water use efficiency (WUEleaf, d) in the leaves of wheat under short-term heat, drought and combined stress after anthesis. SD: suitable temperature + drought stress; HD: heat + drought stress; HF: heat stress + full watering; SF: suitable temperature + full watering. T: temperature; W: watering; N: nitrogen. The values are the means ± standard deviation, n = 10. Different lowercase letters indicate statistically significant differences (p < 0.05). The right side of the figure shows the proportion of variance explained by each factor and interaction.
Water 14 01407 g003
Figure 4. Effects of N application on the efficiency of PSII photochemistry ( Φ PSII, a), maximum efficiency of PSII photochemistry (Fv/Fm, b), photochemical quenching coefficient (qP, c) and nonphotochemical quenching coefficient (NPQ, d) in the leaves of wheat under short-term heat, drought and combined stress after anthesis. SD: suitable temperature + drought stress; HD: heat + drought stress; HF: heat stress + full watering; SF: suitable temperature + full watering. T: temperature; W: watering; N: nitrogen. The values are the means ± standard deviation, n = 5. Different lowercase letters indicate statistically significant differences (p < 0.05). The right side of the figure shows the proportion of variance explained by each factor and interaction.
Water 14 01407 g004
Figure 5. Effects of N application on the activities of nitrate reductase (NR, a) and glutamine synthetase (GS, b) in the leaves of wheat under short-term heat, drought and combined stress after anthesis. SD: suitable temperature + drought stress; HD: heat + drought stress; HF: heat stress + full watering; SF: suitable temperature + full watering. T: temperature; W: watering; N: nitrogen. The values are the means ± standard deviation, n = 5. Different lowercase letters indicate statistically significant differences (p < 0.05). The right side of the figure shows the proportion of variance explained by each factor and interaction.
Water 14 01407 g005
Figure 6. Effects of N application on grain N accumulation (a), grain protein content (b) and grain protein yield (c) under short-term heat, drought and combined stress after anthesis. SD: suitable temperature + drought stress; HD: heat + drought stress; HF: heat stress + full watering; SF: suitable temperature + full watering. T: temperature; W: watering; N: nitrogen. The values are the means ± standard deviation, n = 5. Different lowercase letters indicate statistically significant differences (p < 0.05). The right side of the figure shows the proportion of variance explained by each factor and interaction.
Water 14 01407 g006
Figure 7. PCA for growth traits, N accumulation and protein yield in grain, grain yield, yield components, water and N use efficiency in wheat plants under post-anthesis stress conditions. GNA: grain nitrogen accumulation; GPY: grain protein yield; GLA: green leaf area; PH: plant height.
Water 14 01407 g007
Figure 8. Correlations between the photosynthetic rate (An) and N-mass and N-area. (a,b) represent the correlation between An and N-mass as well as between An and N-area under different measurement dates, respectively. (c,d) represent the relationships between An and N-mass as well as between An and N-area under different N applications. The arrows in the figure correspond to the regression lines under different N treatments.
Water 14 01407 g008
Table 1. Effects of N application on green leaf area, plant height, aboveground dry mass (ADM) and relative growth rate (RGR) of wheat plants under short-term heat, drought and combined stress after anthesis.
TreatmentsGrowth Traits
Temperature/Water/Nitrogen RegimesGreen Leaf Area
(cm2/Plant)
Plant Height
(cm)
ADM
(g/Plant)
RGR
(mg·g−1·Day−1)
SDN156.24 ± 4.21 g62.17 ± 1.23 g2.90 ± 0.045 g21.67 ± 1.21 f
N267.65 ± 4.40 cde64.07 ± 0.88 f3.10 ± 0.029 e23.44 ± 0.87 de
N371.02 ± 6.53 c64.65 ± 1.23 ef2.99 ± 0.077 fg22.90 ± 1.45 ef
FN189.55 ± 4.42 a66.89 ± 2.10 bc3.45 ± 0.045 c30.48 ± 0.60 b
N290.04 ± 6.54 a67.67 ± 1.55 b3.61 ± 0.120 b32.63 ± 2.01 a
N382.49 ± 5.89 b69.01 ± 0.77 a3.72 ± 0.082 a33.74 ± 1.32 a
HDN164.50 ± 4.71 e61.80 ± 1.20 g2.61 ± 0.039 hi15.82 ± 0.41 g
N258.93 ± 2.67 fg60.25 ± 1.83 h2.69 ± 0.60 h15.32 ± 0.29 g
N349.44 ± 3.02 h58.56 ± 1.35 i2.53 ± 0.021 j13.08 ± 0.56 h
FN160.37 ± 4.32 f63.86 ± 2.43 f2.95 ± 0.051 fg22.48 ± 1.01 ef
N268.70 ± 3.23 cd65.89 ± 0.67 cd3.21 ± 0.101 d25.08 ± 0.82 c
N365.40 ± 3.45 de65.18 ± 1.78 de3.02 ± 0.084 ef24.65 ± 1.33 cd
Variance proportion (%)T29.7419.8731.8030.40
W19.1021.3023.4424.73
N7.5219.5514.3211.76
T × W21.0316.2412.1510.19
T × N7.888.394.856.26
W × N0.754.4812.3812.65
T × W × N13.9810.171.064.01
S: suitable temperature; H: high temperature; D: drought, F: full watering; T: temperature; W: watering; N: nitrogen. The values are the means ± standard deviation, n = 5. Different lowercase letters indicate statistically significant differences (p < 0.05).
Table 2. Effects of N application on yield, yield components, water and N use efficiency of wheat plants under short-term heat, drought and combined stress after anthesis.
TreatmentsYield and Its ComponentsWater and N Efficiency
Temperature/Water/
Nitrogen Regimes
GN
(no.)
TKW
(g)
Yield
(g pot−1)
WUEg
(g kg−1)
WUEb
(g kg−1)
NUEg
(g g−1 N)
NUEb
(g g−1 N)
SDN131.01 ± 0.45 f37.32 ± 0.98 h41.10 ± 1.59 f2.32 ± 0.05 bc4.83 ± 0.12 c31.23 ± 0.64 d65.48 ± 1.63 ef
N233.28 ± 0.78 d40.12 ± 0.77 de46.41 ± 2.01 d2.46 ± 0.05 a5.15 ± 0.21 a33.43 ± 0.65 b68.35 ± 1.18 b
N332.25 ± 0.99 e39.12 ± 1.45 f44.30 ± 1.87 e2.50 ± 0.02 a4.96 ± 0.08 b30.23 ± 0.81 e63.39 ± 1.25 g
FN136.21 ± 0.88 b42.32 ± 0.93 d52.39 ± 2.44 b2.27 ± 0.06 cd4.48 ± 0.15 f35.73 ± 0.24 a70.58 ± 2.56 a
N238.40 ± 0.56 a44.19 ± 1.54 a57.19 ± 1.45 a2.33 ± 0.05 bc4.56 ± 0.17 ef36.03 ± 0.55 a70.25 ± 1.52 a
N336.20 ± 0.65 b43.89 ± 1.20 b53.63 ± 1.89 b2.23 ± 0.03 de4.51 ± 0.09 f33.58 ± 0.53 b67.82 ± 0.89 bc
HDN129.34 ± 0.87 g36.21 ± 1.01 i38.50 ± 0.98 g2.19 ± 0.06 ef4.53 ± 0.13 ef32.05 ± 0.78 c66.92 ± 1.78 d
N228.05 ± 0.66 h35.04 ± 0.78 g36.35 ± 2.10 h2.14 ± 0.03 f4.75 ± 0.09 cd29.20 ± 0.55 f62.82 ± 2.25 g
N326.12 ± 0.77 i32.44 ± 1.67 j32.89 ± 1.32 i1.99 ± 0.08 g4.60 ± 0.14 e26.21 ± 0.45 g60.48 ± 1.46 h
FN132.01 ± 1.05 e37.56 ± 1.60 gh39.77 ± 2.76 fg2.24 ± 0.07 de4.71 ± 0.12 d31.10 ± 0.77 d65.77 ± 2.55 e
N234.13 ± 0.78 c41.01 ± 1.10 ef48.40 ± 1.45 c2.37 ± 0.04 b5.02 ± 0.07 b33.26 ± 0.80 b67.42 ± 2.09 cd
N334.78 ± 0.65 c38.34 ± 1.32 c46.07 ± 1.01 de2.29 ± 0.08 cd4.80 ± 0.19 c31.77 ± 0.36 cd64.77 ± 3.58 f
Variance proportion (%)T18.1935.6633.334.515.9130.7633.18
W16.2333.9029.6718.9033.7328.3117.42
N19.577.4410.4719.429.5213.2115.30
T × W3.6615.6120.7523.2831.3510.3918.54
T × N17.235.282.4618.187.447.7313.01
W × N15.581.641.5414.529.068.640.79
T × W × N9.540.471.781.192.990.961.76
S: suitable temperature; H: high temperature; D: drought, F: full watering; T: temperature; W: watering; N: nitrogen. The values are the means ± standard deviation, n = 3. Different lowercase letters indicate statistically significant differences (p < 0.05).
Table 3. Parameters of linear regression and accuracy evaluation of the fitting equation between An and N-mass and N-area.
Dependent VariableIndependent VariablesN ApplicationabR2p
An (µmol·m−2·s−1)N-mass (gN kg−1)N10.3813.3580.835<0.001
N20.2635.1310.5260.042
N30.3253.3920.6040.023
N-area (gN m−2)N15.0313.8450.849<0.001
N23.0177.2060.5750.029
N33.9025.4030.6390.017
a: slope of the regression equation; b: interceptions of regression equation; R2 and p represent statistical parameters.
Publisher’s Note: MDPI stays neutral with regard to jurisdictional claims in published maps and institutional affiliations.

