Abstract
White-rot fungi can degrade a wide spectrum of environmental pollutants, including pharmaceuticals, which are not efficiently removed from wastewater by conventional methods, e.g., the activated sludge method. However, the treatment of wastewater with the use of fungal cultures (mycoremediation) also has significant limitations: among others, the need to use appropriate, often-expensive culture media. We aimed to screen 18 media ingredients, including seven agrifood byproducts for Armillaria mellea, Phanerochaete chrysosporium and Pleurotus ostreatus in submerged cultures to select the low-cost medium optimal for biomass production and laccase activity. We screened nine mathematic models to describe the relation of fungal growth and the amount of the selected byproduct in media. Finally, we tested the ability of the strain with the highest mycelial growth and enzyme-producing ability in the selected medium to degrade eight drug contaminants. Three media variants composed of byproducts provided both efficient growth and laccase production: corn steep liquor + poplar, dried distillers grains with solubles + poplar and corn steep liquor 50%. Among the investigated growth models, the Han–Levenspiel equation described well the specific growth rate in function of the nominal substrate concentration in one-component media. Pleurotus ostreatus, the fungus with the highest ligninolytic enzyme activity, cultured in medium composed of corn steep liquor, removed six of eight drug contaminants with a removal degree of 20–90% in 48 h. The obtained data on the optimal culture media consisting of insoluble components provide initial data for upscaling the process and designing an appropriate type of bioreactor for the process of removing drug contaminants from water.
1. Introduction
The contamination of surface water, groundwater, and drinking water supplies with organic micropollutants, especially pharmaceutical active compounds (PhACs) but also pesticides and personal care products, has been reported worldwide [1]. Their occurrence can threaten both environment and human health, especially from a long-term perspective [2,3,4]. Wastewater treatment (WWT) systems are essential to decrease contamination of the environment with PhACs [5]. However, the existing standard methods are not efficient for their removal [5,6]. Currently used methods are of three types: physical, chemical and biological. Physical methods include membrane processes carried out in bioreactors, UV radiation and absorption on activated carbon. Chlorination, advanced oxidation and ozonation are considered as chemical methods [7,8,9]. The biological methods applied in WWT (bioremediation) entail the use of active microbial biomass to degrade soluble organic compounds in a manner that sustains the growth of that biomass but removes or neutralizes pollutants. The typically used biomass consists of aerobic and/or anaerobic microorganisms (mostly bacteria) [10]. Presently used biological systems are, unfortunately, not resistant to many drug pollutants [11]. Therefore, they are not efficient in the removal of these xenobiotics. Bacteria need a sufficiently high concentration of a pollutant to be able to act upon it. Conversely, fungi can successfully break down all sorts of organic micropollutants irrespective of concentration [12,13]. Hence, the search for new solutions is ongoing [5,14]. White-rot fungi (WRF) decompose many recalcitrant organic pollutants; thus, they have become a popular target of environmental research in the field of mycoremediation [6,15]. The mechanism of xenobiotics removal performed by WRF is based on adsorption onto fungal biomass or/and enzymatic activity [16]. The latter involves three types of enzymes: extracellular (laccase, lignin peroxidase, manganese peroxidase), intracellular (P450 cytochrome) and mycelium-bound enzymes [6]. Consequently, the employment of WRF in wastewater treatment plants (WWTPs) to remove organic micropollutants such as PhACs is strongly considered and widely discussed [15].
Nevertheless, fungal systems are currently not used on the industrial scale due to several limitations. These are, namely, difficulties in the operation of the reactor due to foaming and settling of mycelium on its walls and agitators, bacterial contamination leading to the loss of fungal biomass, the high-hydraulic-retention-time (HRT) requirement of fungal treatments for the removal of microcontaminants and the need for nutrient addition [15]. In our study, we focused on overcoming the last-mentioned limiting factor: the need to provide a continuous external C and N source for the fungus to enable its growth and enzyme synthesis [17]. The high cost of glucose- and nitrogen-based substrates in quantities used on the industrial scale can question the point of applying mycoremediation in WWTPs [15]. An interesting low-cost alternative is utilizing byproducts delivered by an industry that are considered as waste [18]. Using them would limit the cost of both WRF cultivation and the disposal of byproducts. To give an example, the price for a corn agrifood byproduct approximates PLN 1200 (ca. EUR 270) per 1000 kg. Various studies compared the impact of alternative C and N sources on the growth of WRF. Nevertheless, contrary to solid-state fermentation, in batch cultures, only up to two byproducts have been compared so far [19,20,21,22]. Moreover, the media contained additives, such as macro- and microelements: Cu2+, Mg2+, Mn2+, Zn2+, HPO42−, SO42− [19,20,21], glucose, peptone, or yeast extract [19,22,23], that increased the cost of cultures. Therefore, we aimed to screen 18 low-cost substrates (11 C and 7 N sources), including seven byproducts of agrifood industries as the only ingredients (no macro- and microelements, etc.) in cultures of three WRF species (Armillaria mellea, Phanerochaete chrysosporium, Pleurotus ostreatus). As a positive control, reference growing medium (RGM) was used.
Additionally, using solid, insoluble media ingredients can help solve the problem of mycelium growth on the parts of reactor, as the surface for fungal immobilization would be provided.
Three WRF species (Armillaria mellea, Phanerochaete chrysosporium, Pleurotus ostreatus) with different remediation properties were selected for this study. P. ostreatus uses mainly laccase and peroxidases to degrade xenobiotics [24,25]. P. chrysosporium is described to operate on cytochrome P450 monooxygenase and to produce many isoenzymes of lignin and manganese peroxidases but has not been reported to have a laccase-encoding gene [26,27,28,29]. On the other hand, A. mellea, the common edible honey fungus, is not a popular WRF species in mycoremediation, probably, due to its relatively slow growth. Moreover, it was reported that laccase is the only active degrading agent in A. mellea [30,31]. Our study provides an expansion of knowledge on A. mellea’s growth.
According to our published paper, the fungus P. ostreatus performs bioconversion of some of the β-lactam antibiotics when using post products of an antibiotic fermentation process as components of its culturing media [32]. Moreover, in the next paper, we confirmed the removal potential of antidepressants and immunosuppressants by P. ostreatus [33]. We have also tested the ability of the species to remove selected pharmaceuticals in culturing media containing wastewater. We proved that the addition of a corn-based agrifood byproduct to the plain filtered wastewater resulted in a higher removal level of the most of tested xenobiotics; however, this data was not yet published. These results, achieved with the use P. ostreatus, encouraged us to test different WRF species. The selection of the species to be applied to this study was supported by literature findings on the potential of fungi to remove pharmaceuticals. We decided to focus on species with low growth requirements. Based on our knowledge and experience, we considered such a feature to be a good prognostic for a fungus to be applicable in nonsterile conditions of sewage-treatment plants.
We aimed to select the best C and N sources among, in total, 77 different media variants that would ensure the highest biomass increase in submerged mycelial cultures. Such an extensive study on the optimization of mycelial culture components has not been described before, which contributes to the novelty of the paper. To better describe the culture on the proposed media and to select the optimal conditions for WWT, we determined the curves of both biomass increase and enzymatic activity. Additionally, the relationship between the specific growth rate and the substrate concentration was described mathematically for the first time, which proves to be another originality of the presented work. Finally, we presented the data on the removal of the selected pharmaceuticals by P. ostreatus, the fungus with the highest ligninolytic enzyme activity, from water enriched with corn steep liquor (CSL).
2. Materials and Methods
2.1. Precultivation
The strains employed in the research were purchased from the Nite Biological Resource Centre collection: Armillaria mellea (NBRC 7037), Phanerochaete chrysosporium (NBRC 31249), and American Type Culture Collection: Pleurotus ostreatus (ATCC 58753). To obtain inoculum, first, we bred the prime strains on a solid agar medium in Petri dishes according to the supplier’s recommendations. Next, we used the obtained mycelium as inoculum for the submerged cultures in flasks containing Sabouraud Dextrose Broth (BIOCORP, Issoire, France) as a growing medium (1 L contained 20 g of glucose and 10 g of peptone mixture) with pH = 5.6, 6.0 and 6.5 for A. mellea, P. chrysosporium and P. ostreatus, respectively, at 26 °C and shaking rotation set to 120 rpm on the GFL3033 laboratory shaker (GFL, Burgwedel, Germany). Such prepared cultures were applied to the study.
2.2. Screening Test
The investigated components of growing media are listed in Table S1 (Supplementary Materials). Variants of culturing media were prepared in 100 mL Erlenmeyer flasks according to Table 1, based on the composition of RGM (100 mL contained 2.90 g of carbon and 0.26 g of nitrogen). Sterilization was performed in the autoclave VARIOKLAV type 300 E (H + P Labortechnik, Oberschleiβheim, Germany) in the following conditions: T = 121 °C, t = 20 min. The amount of introduced sterile inoculum was equal to one mycelial pellet (1, 2, or 4 mm, according to the species) of each species; breeding time was set to 14 days, under the conditions mentioned in Section 2.1., Precultivation.

Table 1.
Screening test: composition of tested culturing media.
2.3. Selection of the Most-Effective Media Variants
The screening test allowed the selection of the most-effective media variants, taking into account the following criteria: growth speed (high enough for all species tested), medium composition (preferred agrifood byproducts) and transparency of the culturing medium (preferred media where the continuous phase was a solution rather than a heterogeneous mixture of large-sized particles). Based on the presented criteria 2-component media variants were selected (as presented in Table 2). The contents of CSL and DDGS in one-component media were adjusted according to details from Section 2.7.3. Composition of one-component media on calculations and shown in Table 3.
Table 2.
Two-component media selected for further investigation.
Table 3.
Nominal concentrations C* of one-component media and their chemical equivalents.
2.4. Determination of Growth Curves
To determine growth curves for tested WRF species on selected growing media, 30 flasks containing a submerged mycelial culture of each species on each of the chosen media were prepared separately, maintaining the same culture parameters as in the screening test. It was experimentally determined that there was no increase in biomass within the first four days from the moment of inoculation. Therefore, the first measurement took place on the fifth day. The measurements were carried out daily for 14 days, 24 hours apart, in triplicates. The procedure was to mechanically separate wet fungal biomass from the substrate and then to dry it at 105 °C using a moisture analyzer MA30 (Sartorius, Goettingen, Germany). The mechanical separation was possible due to the applied type of culture (submerged, liquid) as well as due to the dispersion or solubility of tested substrates in water. The fungi did not tend to settle on the substrates’ particles in a constantly shaken environment; the obtained biomass was detached from the used media components.
2.5. Enzymatic Activity
Starting from the fifth day after inoculation, 1.5 mL of culture medium was collected from each of the three flasks for each species to carry out enzymatic assays. The activity of laccase was determined using a modified method [34]. The reaction mixture contained 50 μL of 0.1 M acetate buffer pH = 5.0, 50 μL of cultivation medium (diluted with crude growth medium if necessary), and 50 μL of 10 mM ABTS (2,2′-azino-bis(3-ethylbenzothiazoline-6-sulfonic acid). The absorbance was measured at 420 nm for 30 min (1 min intervals) at 25 °C. The activity of lignin peroxidase was determined by the modified method [34]. The reaction mixture contained 50 μL of 0.1 M citrate buffer pH = 3.0, 25 μL of cultivation medium, 25 μL of 25 mM veratryl alcohol, and 25 μL of 5 mM H2O2. The absorbance was measured at 310 nm for 60 min with an interval of 1 min at 25 °C. For calculations, the slope coefficient of a linear fragment of the curve absorbance = f(time) was used.
2.6. Removal of Pharmaceuticals
To prepare removal test, six 100 mL Erlenmeyer flasks with 40 mL of 0.527% w/v CSL medium (C* = 10%, see Table 2) were autoclaved at 121 °C for 20 min. The three flasks were then inoculated with three P. ostreatus pellets, resulting in approximately 1.5 mg of dry biomass per flask, and incubated under the same preculture conditions. After 12 days, 200 µL of a methanol solution containing citalopram, clomipramine, fluoxetine, mianserin, mycophenolic acid (MPA), paroxetine, sertraline, and venlafaxine (National Medicines Institute, Warsaw, Poland) was added to all flasks at a concentration of 20 µg·mL−1. Samples were collected 1 h, 4 h, 24 h, and 48 h after PhACs’ addition and centrifuged (9300× g, 15 min). Supernatants were stored at −27 °C in a mixture with acetonitrile (2:5 v/v). For chemical analysis, mixtures were centrifuged (9300× g, 15 min) and supernatants were diluted with MiliQ-water (5:9 v/v). LC-MS analysis was performed using an Agilent 1260 Infinity (Agilent Technologies, Santa Clara, CA, USA) coupled to 4000 QTRAP mass spectrometer. We used Kinetex RP-18 column (100 mm × 4.6 mm, particle size 2.6 μm) supplied by Phenomenex (Torrance, CA, USA). A detailed description of the analytical method was described previously [33].
2.7. Calculations
2.7.1. Percentage of C and N in the Investigated Substrates
The composition of the tested media (Table 1) was determined based on the percentage of C and N in individual components so that the mass of C and N was the same as in the RGM. The percentage of C and N in individual components is shown in Table S2 (Supplementary Materials).
2.7.2. The Efficiency Coefficient of a Single Component in a Two-Component Medium
The amount of both components in the two-component culture medium was selected in a way to obtain the C and N content equivalent to the one of the RGM. Due to the bicomponent nature of the tested media and the limitations resulting from the fact that not every component could be paired with every other, the nBav coefficient was calculated as a parameter allowing the detection of a distinctive C and/or N source, defined by Equation (1):
where:
nBav = (∑nB)/k
k—number of media in which the given component is present;
nB—number of statistically significantly better results for a given medium;
ΣnB—the sum of the number of statistically better results for the media in which the given component is present.
2.7.3. Composition of One-Component Media
The content of the component in the one-component medium was determined assuming that the relative error of carbon content δC resulting from the use of one component is equal to the relative error of nitrogen content δN, where both relative errors were defined according to Equations (2) and (3), respectively:
where:
δC = |∆mC/mCopt| = |(xCopt ∙ V − xCm ∙ mS)/(xCopt ∙ V)|
δN = |∆mN/mNopt| = |(xNopt ∙ V − xNm ∙ mS)/(xNopt ∙ V)|
ΔmC, ΔmN—absolute error of carbon/nitrogen content (respectively) in one-component medium [g];
mCopt, mNopt—carbon/nitrogen content (respectively) in the reference growing medium [g];
mS—mass of C and N source in one-component medium [g];
V—volume of one-component medium [mL];
xCm, xNm—percentage content of carbon/nitrogen (respectively) in C and N source (% w/w);
xCopt, xNopt—percentage content of carbon/nitrogen (respectively) within the reference growing medium (% w/v).
When solving the equation δC = δN (see Equations (2) and (3)) there is only one solution with physical sense regarding the unknown mS, which takes the form of the Equation (4):
mS = 2V · (xCopt · xNopt)/(xCm · xNopt + xNm · xCopt)
2.7.4. Enzymatic Activity
Enzymatic activity (A) was calculated as µmol of substrate transformed in 1 min by 1 mL of post culture medium.
2.7.5. Estimation of Growth Curves Parameters
Based on data on the dry mycelium weight measured for determination of growth curves (Section 2.4. Determination of growth curves), growth curves’ parameters were estimated as follows: specific growth rate (Section 2.7.6. Specific growth rate); the time of the exponential growth phase start point; the time of exponential growth duration; the average final mass of the culture defined as the average mass of the stationary phase or, in the absence of this phase, the average weight over the last three days of breeding. Additionally, for laccase-positive cultures, following parameters were determined: a time point at which non-zero laccase activity was observed for the first time; maximum laccase activity; the time point of maximum activity; the average laccase activity averaged over the entire duration of the cultivation.
2.7.6. Specific Growth Rate
The specific growth rate was determined based on the linearized form of Equation (5), describing the exponential growth:
where:
mX = mX0 · exp(μt)
mX—dry biomass mass over time t [g];
mX0—dry biomass mass at the beginning of the exponential growth phase [g];
µ—specific growth rate [d−1];
t—time [d].
The equation of a straight line (Equation (6)) was determined by the least-squares method:
ln(mX) = ln(mX0) + μt
2.7.7. Growth Model for One-Component Media Containing DDGS and CSL
The growth model of the tested WRF species on one-component media was determined based on the specific growth rates relative to the initial concentration of a corn waste product (CWP) as a growth substrate. This concentration corresponds to the calculation in Section 2.7.3., Composition of one-component media, as shown in Table 3.
The experimental data were fitted with Monod, Moser, Tessier, Haldane–Andrews, Yamane, Aiba, Edwards, Luong, and Han–Levenspiel models (respective equations in Section 3.4. Growth Model on a One-Component Medium). Monod and Haldane–Andrews models were programmed as their linearized forms using the least-squares method. The rest of the mathematical models were programmed in the MatlabR2017 environment (license: Medical University of Warsaw) with the fitting using the local variation algorithm. All simulations were run at least 5 times with random starting parameters to ensure the exploration of local minima. Results with the lower fitting error (not given) and maximum R2 were presented.
2.7.8. Removal Degree
Removal degree (RD) values of pharmaceuticals were calculated using the Formula (7):
where:
RD(t) = 1 − [C(t)/CC(t)]
C(t)—the mean concentration (3 replicates) of a compound for the time point t in cultivation medium with fungus;
CC(t)– the mean concentration (3 replicates) of compound for time point t in cultivation medium without fungus (control samples).
2.7.9. Statistics
Statistical analysis was performed using the Statistica 13 program (license: Medical University of Warsaw). The normality of the distribution was tested with the Shapiro–Wilk test; whereas, to check the homogeneity of variance, the Bartlett test was used. The ANOVA for detecting statistically significant differences was used; while the NIR (Fisher) constituted a post-hoc verification. When investigating the screening test results, the statistical samples of growth assessment for three species on the same medium variant were compared. In the case of both the growth curves and enzymatic activity, the following were compared: samples that were media variants, combining results for all three species; samples that were species, combining results for the all the media variants; samples that were media variants, combining results obtained within one species; samples that were species, combining results obtained within one media variant. The level of significance in all the above-mentioned statistical tests was equal to 0.05.
The fitting of the growth models was compared by mean of R2 values, grouped in the six variants of samples: the set of all R2 values for a given model, the three sets of all R2 values for a given model when considering a single species, and the two sets of all R2 values for a given model when considering one type of a CWP used.
3. Results
3.1. Screening Test
The averaged efficiency coefficients of a single component in a two-component medium (nBav) for 18 different media were calculated according to Section 2.7.2., The efficiency coefficient of a single component in a two-component medium. A higher value of nBav means significantly better biomass production for the specific component (Figure 1A). Non-averaged efficiency coefficients of a single component in a two-component medium (nB) are presented in Figure 1B.
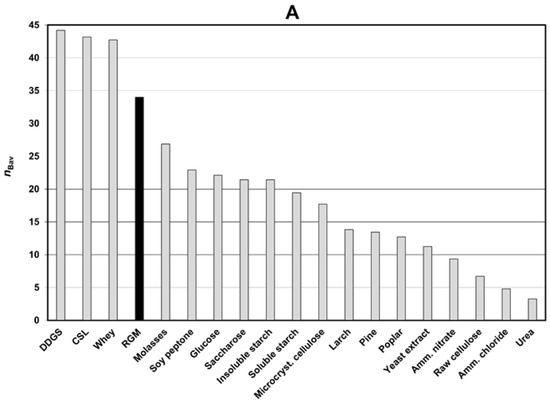
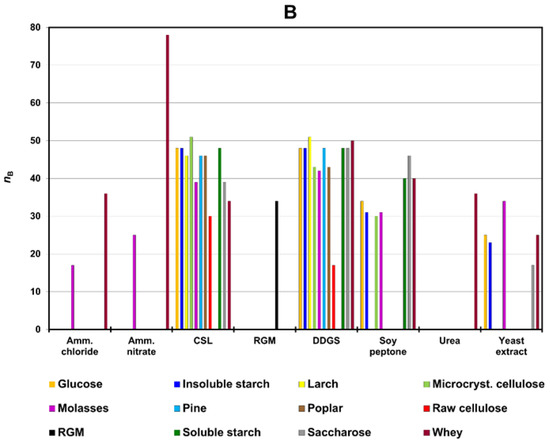
Figure 1.
(A) Averaged values of the efficiency coefficient for a single component in two-component media (nBav); (B) obtained values of the efficiency coefficient (nB) for two-component media in relation to source no. two. Abbreviations: CSL—corn steep liquor; DDGS—dried distillers grains with solubles; RGM—reference growing medium.
Corn steep liquor (CSL), dried distillers grains with solubles (DDGS), and whey led to a higher biomass increase (nBav) than the reference medium (RGM) did (Figure 1A). Slightly worse growth than for RGM was obtained for molasses or soy peptone as a co-ingredient in two-component media (Figure 1A). The weakest growth was observed for ammonium chloride, ammonium nitrate, raw cellulose, and urea (Figure 1A).
Among the DDGS and CSL media, only the variants with raw cellulose had nB values lower than RGM (Figure 1B). For whey-containing media, only the yeast extract was less effective than RGM (Figure 1B). The higher growth than in RGM for molasses media was observed only with CSL or DDGS additives (Figure 1B).
Soy peptone, glucose, saccharose, cellulose microcrystalline or starch (soluble and insoluble) had similar nBav values (Figure 1A). Soy-peptone media with soluble starch, whey or saccharose were more effective than RGM (Figure 1B). The highest biomass increase for carbohydrates (glucose, cellulose microcrystalline, raw cellulose, saccharose) was observed for DDGS and CSL as a second component (Figure 1B).
Sawdust (larch, pine, poplar) and yeast extract had relatively low nBav values (Figure 1A). However, two-component media with DDGS and CSL were more efficient than RGM (Figure 1B). No medium with raw cellulose was better than RGM (Figure 1B). Better growth than for RGM, in the case of media with ammonium salts (ammonium chloride, ammonium nitrate), was observed for whey as a second ingredient (Figure 1B).
3.2. Growth Curves—Parameters, Enzymatic Activity, and Results Description
The fungal growth curves were obtained using the selected media, i.e., RGM, molasses with CSL or DDGS, and poplar with CSL or DDGS. These media, which are purified agrifood industrial byproducts, were chosen due to the high growth rate and clearly identifiable continuous phase. Additionally, the growth curves for CSL and DDGS were determined in the range of 5–100%, knowing that both CSL and DDGS alone also proved to be efficient single C and N sources. The important parameters of growth kinetics are presented in Table 4.
Table 4.
Growth curves parameters.
Media with molasses or poplar and CSL (Table 4) showed the highest values both of the specific growth rate (µ) and the mean mass at stability phase mavS (0.81–1.47 d−1 and 0.38–0.94 g, respectively). High mean µ (second tercile and higher) was also observed for the growth of A. mellea and P. chrysosporium on DDGS 50% (1.40–1.75 d−1) and DDGS 100% (0.33–1.14 d−1); for P. chrysosporium and P. ostreatus on CSL 100% (1.24–1.37 d−1) and DDGS 25% (0.81–0.83 d−1); and for P. ostreatus for CSL 50% (1.504 d−1), poplar with DDGS (1.47 d−1), and CSL 25% (1.30 d−1). The averaged mavS was high (second tercile and higher) for molasses or poplar with DDGS (0.38–0.67 g and 0.58–0.85 g, respectively) and P. chrysosporium and P. osteratus on CSL/DDGS 100% (0.44–0.46 and 0.77–0.89 g, respectively). On the other hand, the lowest µ and mavS appeared for CSL 10% (0.101–0.364 d−1 and 0.0312–0.0678 g, respectively) and DDGS 10% (0.424–0.490 d−1 and 0.00413–0.0407 g, respectively). Averaged values of the beginning of the exponential growth phase (texp0) for each media were comparable (6–8 days). The duration of the exponential growth phase was hardly longer for A. mellea (approx. 9 days) than for the other two WRF species, which were comparable (approx. 5–6 days). The averaged mass values of dried mycelium obtained for each culture are presented in Figure 2. The efficiency coefficients of different media, nB, are presented in Figure S1 (Supplementary Materials).
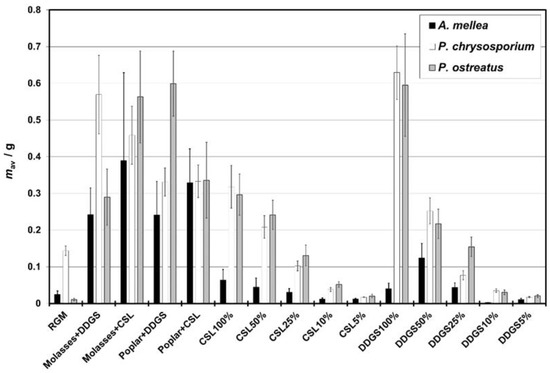
Figure 2.
The averaged mass of dried mycelium in the cultures. Abbreviations: CSL—corn steep liquor; DDGS—dried distillers grains with solubles; RGM—reference growing medium; 100% CSL: CSL with nominal concentration of 5.27% w/v; 100% DDGS: DDGS with nominal concentration of 7.44% w/v; 50% CSL or DDGS: CSL or DDGS at 50% of nominal concentration of 100% CSL/DDGS concentration.
In the two-component media, the growth was satisfactory for all three WRF (Figure 2). The growth of A. mellea was significantly higher in these media than in the others, with the best results observed for the molasses with CSL. Moreover, the growth of A. mellea in poplar with CSL was slightly worse than in molasses with CSL (p = 0.0449), but the differences were negligible.
All the two-component media and one-component media with 100% of the nominal content of DDGS or CSL were better for P. chrysosporium than RGM (p < 0.05). The best medium for P. chrysosporium proved to be 100% DDGS (Figure 2). The growth of P. ostreatus was the most effective in 100% DDGS as well. The combination of poplar with DDGS gave a similar result (Figure 2).
3.3. Laccase
Laccase activity was detected only for A. mellea and P. ostreatus (Table 4). At the same time, the activity of lignin peroxidase was undetectable for all the investigated species. A. mellea had lower values of maximal laccase activity (Amax), i.e., up to 0.167 U·mL−1 and mean laccase activity (Aav), i.e., up to 0.039 U·mL−1 (Table 4) than P. ostreatus (Amax and Aav up to 1.41 and 0.41 U·mL−1, respectively), so it was less efficient in the laccase production. Moreover, the laccase activity for A. mellea (approx. after 10 days) became quantifiable later than for P. ostreatus (approx. after 6 days). The time of maximal laccase activity (tAmax) observed was comparable both between A. mellea (approx. after 14 days) and P. ostreatus (approx. after 12 days) and between the media (usually after 12–14 days). Since Aav is the most important enzyme-activity parameter, its values are shown in Figure 3.
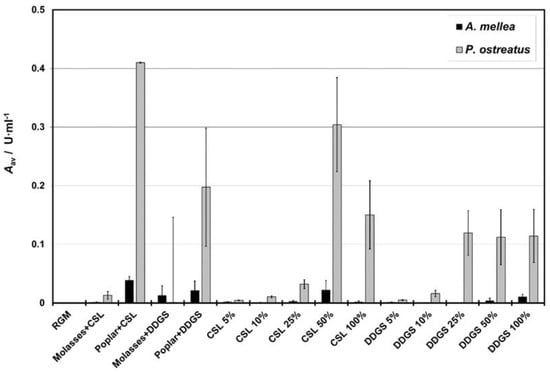
Figure 3.
Average laccase activity (Aav) for A. mellea and P. ostreatus measured in different media. Abbreviations: CSL—corn steep liquor; DDGS—dried distillers grains with solubles; RGM—reference growing medium; 100% CSL: CSL with nominal concentration of 5.27% w/v; 100% DDGS: DDGS with nominal concentration of 7.44% w/v; 50% CSL or DDGS: CSL or DDGS at 50% of nominal concentration of 100% CSL/DDGS concentration.
Different media did not provide any significant differences in the laccase activity of A. mellea (p >> 0.05). On the contrary, the laccase activity of P. ostreatus differed significantly between media. Generally, the media containing poplar were the best for laccase production in the case of P. ostreatus. The highest laccase activity of P. ostreatus was observed for poplar with CSL and CSL 50%, slightly lower than for poplar with DDGS. Moreover, for P. ostreatus, the average activity of laccase increased with the content of CSL or DDGS, up to a certain point. Enzymatic activity in DDGS media increased from 5% to 25% and remained stable up to 100%; whereas, in CSL, it increased up to 50% but then decreased for 100%.
3.4. Growth Model on a One-Component Medium
Based on observed trends in specific growth rates (µ) (Figure 4), one could suggest the inhibitory growth model for all systems, except for P. chrysosporium in the CSL medium. That is why we considered both the inhibitory growth models and classic models with no substrate inhibition.
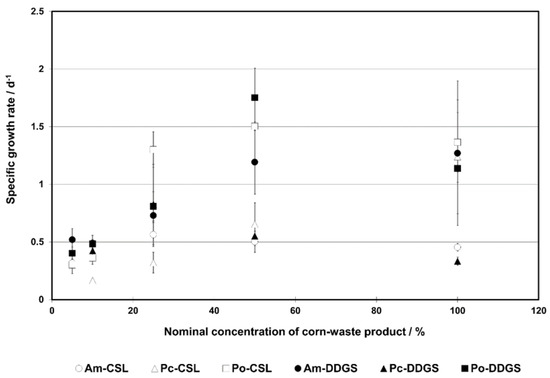
Figure 4.
Specific growth rate in a function of corn-waste substrate nominal concentration. Abbreviations: Am—A. mellea; CSL—corn steep liquor; DDGS—dried distillers grains with solubles; Pc—P. chrysosporium, Po—P. ostreatus. 100% CSL: CSL with nominal concentration of 5.27% w/v; 100% DDGS: DDGS with nominal concentration of 7.44% w/v; 50% CSL or DDGS: CSL or DDGS at 50% of nominal concentration of 100% CSL/DDGS concentration.
Overall, nine equations were considered. We used the determination coefficient to evaluate the fitting efficiency of each model (Table 5). The corresponding parameters are summarized in the Table S3 (Supplementary Materials).
Table 5.
Mathematical models for growth curves of A. mellea, P. chrysosporium, and P. ostreatus in CSL and DDGS one-component media and corresponding determination coefficients.
The Han–Levenspiel model described in the most appropriate way the growth of all groups (Section 2.7.9. Statistics) with the average R2 values ranging from 0.929 (21) to 0.9775 (88) (Table 5). However, this model showed a statistically significant difference with the Monod and Edwards models only (p <<0.05). On the other hand, the Monod model with averaged R2 values in the range of 0.64 (16)–0.821 (70) was the least corresponding equation to the experimental data. This was proven by the lack of statistically significant difference with the Edwards model (p = 0.34). To conclude, the non-inhibitory models could describe the growth models in selected samples, i.e., P. chrysosporium and P. ostreatus in CSL and A. mellea in DDGS.
We used the determined parameters of the models (Table S3, Supplementary Materials) to approximate the specific growth rate in the range 5–100% of substrate concentrations (Figure 5).
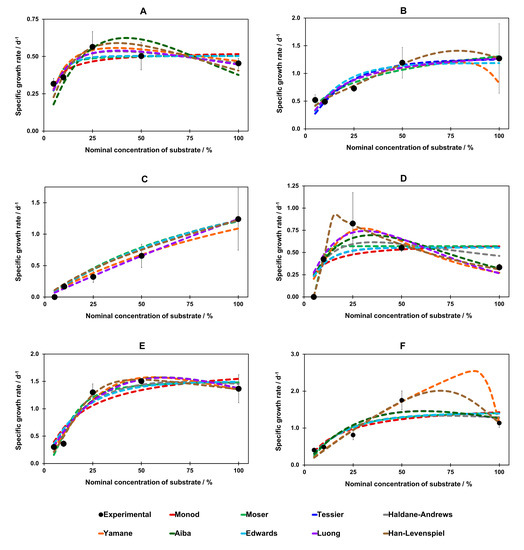
Figure 5.
Graphical presentation for fitting all nine mathematical models for A. mellea on: (A) CSL, (B) DDGS; P. chrysosporium on: (C) CSL, (D) DDGS; P. ostreatus on: (E) CSL, (F) DDGS. Abbreviations: CSL—corn steep liquor; DDGS—dried distillers grains with solubles. 100% CSL: CSL with nominal concentration of 5.27% w/v; 100% DDGS: DDGS with nominal concentration of 7.44% w/v; 50% CSL or DDGS: CSL or DDGS at 50% of nominal concentration of 100% CSL/DDGS concentration.
CSL: The model-fitting curves were quite similar for the media containing CSL (Figure 5A,C,E). The Monod, Tessier, Moser (non-inhibitory), and Edwards models (inhibitory) had almost the same fit for all species. For A. mellea in CSL media, the Haldane–Andrews, Yamane, Aiba, Luong and Han–Levenspiel inhibition models showed the maximum specific growth rate for a nominal concentration between 25% and 40% (Figure 5A). In contrast, the non-inhibitory models (Monod, Moser, and Tessier) and Edwards model predicted a plateau for a specific growth rate at 25% and higher substrate concentration (Figure 5A). For CSL media, the most remarkable overlap of model curves could be noticed for P. chrysosporium, while only the Yamane and Luong models curve differed from the others (Figure 5C). For the growth of P. ostreatus, the Haldane–Andrews equation showed the lack of a maximum and a similar fit to the non-inhibitory (Monod, Moser, Tessier) and Edwards models (Figure 5E). The Han–Levenspiel model predicted the maximum growth rate at 35–40% substrate concentrations; whereas the Yamane, Aiba, and Luong inhibitory models suggested a maximum growth rate at around 50–55% of CSL concentration (Figure 5E).
DDGS: Within the DDGS substrate, growth models showed a similar fit for A. mellea in most cases (Figure 5B). Only the Yamane and Han–Levenspiel models predicted the maximum growth rate of around 85% and 75% of DDGS concentration, respectively (Figure 5B). Evident discrepancies between the models appeared for P. chrysosporium (Figure 5D). The Monod, Tessier and Edwards models proved to be practically identical. The Moser model reached a plateau at around 15% of DDGS concentration. Excluding the Han–Levenspiel model, other models showed the maximal µ in the range of nominal concentration 25–30% (Figure 5D). Whereas the Han–Levenspiel model prediction differed the most: it revealed a maximum at 15–20% DDGS concentration (Figure 5D). For P. ostreatus, the non-inhibitory (Monod, Moser, Tessier) and Edwards models proved to be similar in fit to each other (Figure 5F). The Aiba and Luong models predicted a maximum at around 65% of DDGS concentration (Figure 5F), whereas the Haldane–Andrews and Han–Levenspiel models showed a maximum at 70–75% of DDGS concentration (Figure 5F). The Yamane model showed the highest concentration of DDGS for a maximal value of µ, i.e. almost 90% (Figure 5F).
3.5. Removal of Pharmaceuticals
The structures of PhACs used in the study ae presented in Figure 6. The PhACs removal degree is shown in Figure 7. Almost all compounds were removed by P. ostreatus from the medium with CSL. MPA was the most-efficiently-removed compound (88.0% after 48 h), followed by sertraline and clomipramine (45.5% and 40.6% after 48 h, respectively). Fluoxetine and paroxetine had a moderate removal rate of approximately 20%. No degradation was observed for citalopram and venlafaxine.
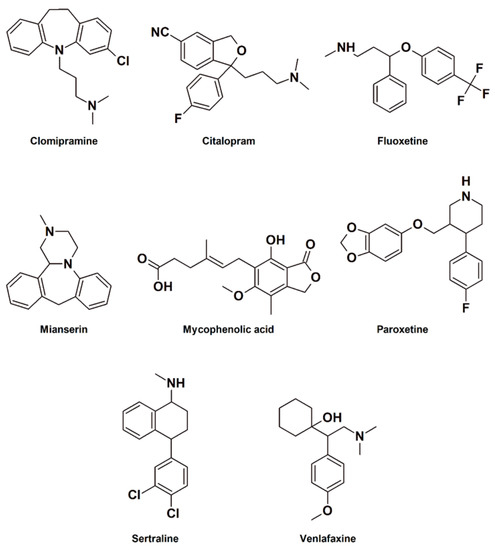
Figure 6.
Structures of PhACs used in the study.
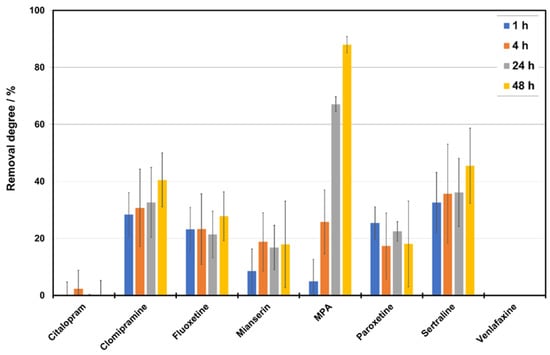
Figure 7.
Removal degree by P. ostreatus of selected pharmaceuticals from a medium with CSL in the function of time.
4. Discussion
4.1. Screening Test
No complete reports are available for biomass growth for the studied fungi. Only partial information is available for biomass growth and degradation efficiency in different media. Thus, we discussed both biomass growth and degradation efficiency to determine the best media.
Food industry byproducts (DDGC, CSL, whey, molasses) provided the best results as media ingredients for fungi cultivation. The growth of the examined species depended on the type of the N and C source, giving the best results for two-component media, whereas among one component, CSL and DDGS proved to be the best. The literature reported that better results were previously obtained for organic (food-industry byproducts, plants or yeast extracts) than for inorganic or simple organic N sources (i.e., ammonium salts, urea), which coincided with our observations and confirmed our results. To give the first example, our results are in agreement with those published by Lung et al. for A. mellea, where the efficiency of biomass production using soy peptone as an organic N source was 3.3 times higher than when using peptone-free medium [35]. Moreover, another paper indicated bean-cake extract and corn steep (organic) as the best ingredients for the growth of A. mellea, whereas inorganic (ammonium sulfate and sodium nitrate) were reported to be the worst [36]. Additionally, previously, whey was successfully used for P. ostreatus [37,38], whereas CSL was used for P. chrysosporium and P. ostreatus growth [21,22,39,40]. Pena et al. proved DDGS and dried corn fiber to be efficiently used in producing bioethanol by P. chrysosporium [41]. Other examples confirming results obtained in this study are the papers of Pena et al. and Zuo et al., which reported that DDGS and CSL were fermented by WRF [41,42]. Additionally, Itelima described these substrates to have a higher efficacy than sawdust [43].
Molasses is a relatively effective C source for the growth of WRF; still slightly less effective than RGM. As the only C source, molasses requires discoloration before utilization [23,44,45,46]. Confirmation of results reported by us is provided by Hoa et al. in their paper, where molasses was also an effective media ingredient for P. ostreatus growth [47]. Thus far, molasses has been used as an additive in the breeding medium; therefore, it is difficult to determine whether it may be the main C source based on such studies [38,48].
Both soluble and insoluble starch as a C source also gave worse results of WRF biomass increase than RGM did. However, on the contrary, previous works of Roldan-Carillo et al. and Wu et al. reported the amylolytic abilities of P. chrysosporium based on the detection of dextrin, maltose, and glucose (starch decomposition products) in a postculture medium [49,50]. In addition, Wirunpan et al. observed the growth of P. ostreatus on a starch-containing medium, where, in comparison to the control fungus, the concentration of reducing sugar increased almost 19-fold [51].
The current report showed raw cellulose to be one of the worst C sources for all the tested species. In comparison, microcrystalline cellulose was better than raw cellulose. In opposition to this, other papers showed that cellulose could be a C source and can be transformed by P. chrysosporium [50,52], as well as by P. ostreatus [53,54]. However, our observations can be supported by the results of Düzkale Sözbir, who reported that P. ostreatus was not able to degrade cellulose [55].
The present study showed that wood sawdust (poplar, larch, pine) was not an efficient C source. Our results can be explained as follows: although wood is the natural C source for every ligninolytic fungus, not all types of wood and its forms are tolerated by specific species. As an example given by Sachs et al., poplar wood was beneficial for P. chrysosporium, causing both mycelium’s surface growth and penetration [56]; however, the author did not explain what form of poplar wood was used in experiments. On the other hand, P. ostreatus can be cultivated on pine. Nevertheless, its growth is relatively slow due to toxic and antiphysiological effects on vegetative development and reproduction of this fungus [57,58]. In addition, thermal treatment (e.g., which occurred during sterilization of media used in our study) decreased the susceptibility of beech, pine, and oak wood to the ligninolytic activity of P. ostreatus [59].
No comparison evidence of the influence of the inorganic and organic N source for P. chrysosporium biomass could be found, which supports the novelty of our paper regarding P. chrysosporium growth using simple N sources. The previous data on simple N sources as media ingredients for P. chrysosporium concerned the degradation processes. An example was found in the paper by Reid et al., where degradation of lignin was more efficient on peptone than on ammonium chloride [60]. Moreover, stil degradation of Congo red using P. chrysosporium in ammonium chloride occurred [61]. Similarly, P. ostreatus required low concentrations (0.03–0.09%) of ammonium chloride for optimum growth [47]. Alternatively, ammonium nitrate could be used as a medium for P. ostreatus; however, it was a less-efficient nitrogen source than ammonium chloride, resulting in a 13% lower biomass [62]. It can be explained by nitrate-caused blocking of the transmembrane transport of substances, which may, in turn, affect the biochemical processes and overall affect the growth of Basidiomycetes fungi [47]. Our results showed that neither ammonium nitrate nor ammonium chloride addition to the media is effective for WRF growth.
The slowest growth of WRF among all the tested additives was observed for urea. As proof for this, previous studies on P. chrysosporium can be cited. Urea suppressed the nucleobase transporter gene [63] and decreased the degradation of the selected compounds by P. chrysosporium from five- to nine-fold compared to ammonium nitrate [45,60]. On the contrary, the growth of P. ostreatus in the presence of urea was comparable to the growth in the reference medium [64]. Such variety in urea preferences can depend on species and its resistance to toxic xenobiotics. To give an example, for Pleurotus pulmonarius, urea was one of the least effective N sources [65] but for Pleurotus ostreatus, it proved to be efficient [62].
No reports on the growth of A. mellea using media containing urea, saccharides, wood, and other industry food-waste products were found. Therefore, the results presented in this paper fill the lack of data in this area.
4.2. Growth Curve
Based on the screening test, where no biomass increase occurred till the fifth day from the inoculation, the first measurement of growth and enzymes activity took place on the fifth day of culture.
In our study, A. mellea grew slowly in submerged cultivation, with a 9-day pre-exponential phase and 2–6 days of exponential growth (Table 4, texp0 and Δtexp). The duration of exponential growth was in agreement with the published results [35], where, for the quasi-optimal growth medium, the exponential phase of A. mellea began after 8–9 days and lasted 5 days. In a potato-dextrose-broth medium, A. mellea pre-exponential phase was shorter (7 days) [35].
The current results confirmed the growth kinetics of P. chrysosporium. This species grew in the exponential phase practically from the beginning of cultivation. In contrast, the adaptation and acceleration phases were not very well pronounced, according to results for optimum-growing medium [66,67], cotton stalks [68], or corn-cob extract [66]. Li et al. showed that a certain pre-exponential phase could be observed, with the duration time estimated to last 72 h [67], whereas Zhang et al. reported a 24-hour-long exponential phase [69]. The duration of exponential growth and the inhibition growth phase (4 days, approximately) was confirmed mainly by previous reports, where it was equal to 5–6 days [66,67].
The relatively long pre-exponential phase in the growth of P. ostreatus, observed in the current study (9–10 days), was also confirmed by the report of Tlecuitl-Beristain [70]. Nevertheless, on the medium assumed as the optimal one, the exponential phase began much earlier than in this study, i.e., after 4 [71,72,73,74,75] or 2 days of cultivation [76]. P. ostreatus grew exponentially from 3–4 days [72] to 8 days, which was confirmed by our study (5–6 days).
4.3. Enzymatic Activity
Unexpectedly in the current research, for all WRF species, no laccase activity was found in RGM; while, for the rest of the investigated media, laccase activity at a mean of 0.1–10 mU·mL−1 level was detected. Only little data is available so far on laccase activity changes depending on the day of the culture of A. mellea. The species produced the enzyme only when cultured on a nutrient-rich medium. However, similarly to our results, even in such medium during the first few days of culture, the laccase level was undetectable [77].
The results obtained here confirmed the literature reports that P. chrysosporium does not produce laccase due to the lack of the laccase-coding gene [26].
The current results for P. ostreatus, where the laccase activity was undetectable in the RGM, are not supported by previous studies [54,70,72,74,78]. However, for some media tested, the order of magnitude equal to 10−3–10−1 U·mL−1 is consistent with previous reports [74,75,78]. Moreover, a short period of undetectable laccase activity [72,74,78] was also observed for some tested media.
4.4. Growth Model
Determination of the mathematical form of the growth model enabled us to consider the specific growth rate variety in the function of variable substrate concentrations. This article describes the first attempt made to determine the growth model (related to the amount of CSL/DDGS) for selected representatives of white-rot fungi cultivated in submerged cultures. Considerations of growth to date have concerned the overall growth of mycelium and have not been based on the appropriate growth rate needed to conduct the balance calculations crucial to designing the biotechnology process. The literature reporting a more-advanced mathematical description of P. chrysosporium growth [79] assumed the classic Monod model of biomass growth.
The obtained results showed the substrate inhibition in the growth model (i.e., µ in the function of the CSL/DDGS concentration) of the tested Basidiomycota species. To explain, the high nominal concentration of CSL and DGGS can provide an optimal C and N source level but, at the same time, also a too-high concentration of another component that CSL and DGGS include. This extra compound can affect fungal growth, resulting in a lack of increase in specific growth rate with the increase in the substrate concentration. The best results were obtained for the Han–Levenspiel model.
4.5. Removal Study
In the current study, the removal rates of selected pharmaceuticals were examined in CSL-enriched water. Pharmaceuticals, the degradation of which was tested, belonged to various pharmacological and chemical groups. Of all compounds tested, only venlafaxine and citalopram did not completely degrade under the conditions of the experiment, which corresponds to our previous results [33]. Previously, we found that these compounds were the least-efficiently removed among all examined PhACs. It would be interesting to undertake further studies explaining the high resistance of these drugs to enzymatic degradation. Enzymatic degradation by WRF has a radical mechanism. Perhaps in the case of these compounds, their oxidation to free radicals (which is the degradative effect of fungal peroxidases and laccases) requires a higher redox potential and, consequently, the use of mediators in this process. In the current research, the rest of the six compounds were removed visibly slower than in previous tests, most likely due to different culture conditions, which resulted in a lower amount of obtained biomass. Previously, after 48 h, above 80% of all compounds were removed; whereas, in the current research, only the removal of MPA was higher than 50% and reached the value of 80%. The significant results regarding mycoremediation with the use of WRF Trametes versicolor were reported by Cruz-Morato et al. [80]. There are other reported methods used for PhACs removal: physical (physical adsorption, filtration), physicochemical (chemical adsorption, photodegradation), chemical (redox reactions, ex. chlorination, ozonation, Fenton reaction, other oxidations) [81] and biological (phytoremediation, activated sludge) [82,83,84]. The main advantage of these methods is high removal efficiency and a wide spectrum of removed compounds. The disadvantages depend on the method used; however, high costs and high energy consumption concern almost all of them. When applying filtration, the removal is incomplete and, what is more, the filtrating factor requires to be regenerated. Besides regeneration, adsorption by a technological solution is a challenge. As an undesired result of photodegradation and redox reactions with the use of chemical reagents, toxic byproducts can be created, whereas operational problems also play a role. Photodegradation and chemical oxidation are the most efficient methods used for the removal of the antidepressants examined in the current research. Citalopram was degraded by 98% (1 h) and 100% (4 h) when using chlorination and UV-photodegradation, respectively [85]. Fluoxetine was efficiently removed by activated carbon on biofilm (97%) [86], and chemical degradation with ferrate anions (90%, 1 h) [87]. Efficient methods for paroxetine removal were the red-mud magnetite nanoparticle (96%), printed molecular polymers (almost 100%) [88] and phytodegradation by Phragmites australis (95%, 7 days) [89]. Sunlight was reported to be a factor causing sertraline decay (100%, 50 h) [90]. Clomipramine was degraded in the process of UV irradiation (88%, 6 min) [91]. Similarly, but with the addition of humic water, mianserin was removed with the use of the UV-VIS method (75%, 3 h) [92]. Electrochemical methods with the use of a chloride are promising for venlafaxine (100%, 10 min) [93].
Although the above methods seem to be more efficient, mycoremediation brings some significant advantages. It is economical, ecofriendly, and safe; moreover, it shows a robust growth with a vast hyphal structure, the production of extracellular ligninolytic enzymes, a high surface area in relation to volume, resistance to heavy metals and adaptability to fluctuating pH and temperature [94]. To resume discussion of the results of the current removal study, our observations confirm that replacement of RGM with a medium based on byproducts deriving from the agrifood industry did not result in loss of xenobiotic-degradation ability. However, the method requires optimization both in terms of the process conditions and the potential use of mediators.
5. Conclusions
Agrifood industry byproducts (CSL and DDGS) are optimal media ingredients, in terms of effectiveness, for the cultivation of A. mellea, P. chrysosporium, and P. ostreatus, especially with molasses and poplar as the second ingredient. Three media variants, namely, CSL + poplar, DDGS + poplar and CSL 50%, provided both efficient growth and similar laccase production. Among the investigated growth models, the Han–Levenspiel equation described well specific growth rate in function of the nominal substrate concentration in one-component media. Eventually, the results of the removal of selected pharmaceuticals from water enriched with CSL by P. ostreatus indicated that only venlafaxine and citalopram, among all the tested pharmaceuticals, were resistant and, hence, not removed.
The obtained results confirm the possibility of using low-price substrates as substitutes for standard growing media for all the tested fungi species. This can allow to cut costs of carrying out large-scale fungi cultivation processes which, at the moment, are limited due to the economic factor.
The research on the optimization of mycelial growth on agrifood byproducts presented in this paper is the first step on the way to developing an efficient method that could be used in wastewater-treatment technologies in future. Especially since the addition of CSL allowed the removal of selected pharmaceuticals from the medium.
Although our studies were conducted on a laboratory scale, we believe the findings can support the further necessary research on scaling up mycoremediation for application in wastewater-treatment plants. Obtained data prove the possibility of substituting the standard culturing media of a defined price with low-cost corn-derived agrifood byproducts. Since the media proposed by us consist of solid insoluble elements such as particles of wood or CSL/DGGS, it additionally gives a fungus a surface for immobilization. This would be particularly useful when conducting the process in a bioreactor, as it would prevent the mycelium from settling on the agitators or walls of a bioreactor and, hence, disturbing its work. In the future, the presented data can contribute to the higher efficiency of the water-purification process in large-scale technologies.
Supplementary Materials
The following supporting information can be downloaded at: https://www.mdpi.com/article/10.3390/w14091374/s1, Figure S1: The nB values for the media used to determine the growth curves.; Table S1: Investigated cultivation substrates and their origins.; Table S2: Percentage content of culture-medium components prepared as part of the screening test.; Table S3: Values of fitting parameters in the mathematical models for growth curves of A. mellea, P. chrysosporium, and P. ostreatus in CSL and DDGS one-component media and corresponding determination coefficients.
Author Contributions
Conceptualization, J.G. and J.T.; methodology, J.G., J.T., B.K. and M.K.; software, K.M.; formal analysis, B.K.; investigation, A.S., B.K., K.M. and M.K.; resources, J.G. and J.T.; data curation, B.K.; writing—original draft preparation, B.K. and A.S.; writing—review and editing, J.G., J.T. and K.M.; visualization, B.K.; supervision, J.G. and J.T.; project administration, J.T.; funding acquisition, J.T. and A.S. All authors have read and agreed to the published version of the manuscript.
Funding
This research was funded by Intelligent Development Operational Program 2014–2020 “Innovation Incubator 2.0”, grant number FW26/FS227/ZW/CTT/DR/02/19.
Institutional Review Board Statement
Not applicable.
Informed Consent Statement
Not applicable.
Data Availability Statement
Not applicable.
Acknowledgments
The authors want to thank the companies and institutions for providing the materials necessary to conduct the research: BZK Sp. z o.o. & Associates (Poland), Mondi in Świecie (Poland), Warsaw University of Life Sciences—Faculty of Wood Technology—Department of Technology and Entrepreneurship in Wood Industry, Dairy Product Company MLEKOVITA (Poland). The authors are also grateful to: Wiktoria Soroko, who, in 2019 as a master student at the Department of Drug Chemistry and Pharmaceutical Biotechnology Medical University of Warsaw, co-worked to conduct the stage of the screening test, and also to Karolina Bębas, who, in 2020 as a master student at the Department of Drug Analysis Medical University of Warsaw, co-worked to conduct the stage of the removal study.
Conflicts of Interest
The authors declare no conflict of interest.
References
- Kulshreshtha, S.; Mathur, N.; Bhatnagar, P. Mycoremediation of paper, pulp and cardboard industrial wastes and pollutants. In Fungi as Bioremediators; Goltapeh, E.M., Danesh, Y.R., Varma, A., Eds.; Springer: Berlin, Heidelberg, Germany, 2013; Volume 32, pp. 77–116. [Google Scholar]
- Asemoloye, M.D.; Ahmad, R.; Jonathan, S.G. Synergistic rhizosphere degradation of γ-hexachlorocyclohexane (lindane) through the combinatorial plant-fungal action. PLoS ONE 2017, 12, e0183373. [Google Scholar] [CrossRef] [PubMed] [Green Version]
- Sharma, N.; Singhvi, R. Effects of chemical fertilizers and pesticides on human health and environment: A review. Int. J. Agric. Environ. Biotechnol. 2017, 10, 675–680. [Google Scholar] [CrossRef]
- Castellet-Rovira, F.; Lucas, D.; Villagrasa, M.; Rodríguez-Mozaz, S.; Barceló, D.; Sarrà, M. Stropharia rugosoannulata and Gymnopilus luteofolius: Promising fungal species for pharmaceutical biodegradation in contaminated water. J. Environ. Manag. 2018, 207, 396–404. [Google Scholar] [CrossRef] [PubMed]
- Couto, C.F.; Lange, L.C.; Amaral, M.C.S. Occurrence, fate and removal of pharmaceutically active compounds (PhACs) in water and wastewater treatment plants—A review. J. Water Process Eng. 2019, 32, 100927. [Google Scholar] [CrossRef]
- Asif, M.B.; Hai, F.I.; Singh, L.; Price, W.E.; Nghiem, L.D. Degradation of Pharmaceuticals and Personal Care Products by White-Rot Fungi-a Critical Review. Curr. Pollut. Rep. 2017, 3, 88–103. [Google Scholar] [CrossRef] [Green Version]
- Kaleniecka, A.; Zarzycki, P.K. Pharmaceuticals in the aquatic environment: Sources, effects, treatment methods. Arch. Physiother. Glob. Res. 2015, 19, 39–52. [Google Scholar] [CrossRef]
- Zwiener, C.; Frimmel, F. Oxidative treatment of pharmaceuticals in water. Water Res. 2000, 34, 1881–1885. [Google Scholar] [CrossRef]
- Ternes, T.A.; Meisenheimer, M.; McDowell, D.; Sacher, F.; Brauch, H.-J.; Haist-Gulde, B.; Preuss, G.; Wilme, U.; Zulei-Seibert, N. Removal of pharmaceuticals during drinking water treatment. Environ. Sci. Technol. 2002, 36, 3855–3863. [Google Scholar] [CrossRef]
- Xia, Y.; Wen, X.; Zhang, B.; Yang, Y. Diversity and assembly patterns of activated sludge microbial communities: A review. Biotechnol. Adv. 2018, 36, 1038–1047. [Google Scholar] [CrossRef]
- Olivieri, G.; Russo, M.; Giardina, P.; Marzocchella, A.; Sannia, G.; Salatino, P. Strategies for dephenolization of raw olive mill wastewater by means of Pleurotus ostreatus. J. Ind. Microbiol. Biotechnol. 2012, 39, 719–729. [Google Scholar] [CrossRef]
- Asamudo, N.; Daba, A.; Ezeronye, O. Bioremediation of textile effluent using Phanerochaete chrysosporium. Afr. J. Biotechnol. 2005, 4, 1548–1553. [Google Scholar] [CrossRef]
- Harms, H.; Schlosser, D.; Wick, L.Y. Untapped potential: Exploiting fungi in bioremediation of hazardous chemicals. Nat. Rev. Microbiol. 2011, 9, 177–192. [Google Scholar] [CrossRef] [PubMed]
- Grandclément, C.; Seyssiecq, I.; Piram, A.; Wong-Wah-Chung, P.; Vanot, G.; Tiliacos, N.; Roche, N.; Doumenq, P. From the conventional biological wastewater treatment to hybrid processes, the evaluation of organic micropollutant removal: A review. Water Res. 2017, 111, 297–317. [Google Scholar] [CrossRef] [PubMed] [Green Version]
- Mir-Tutusaus, J.A.; Baccar, R.; Caminal, G.; Sarrà, M. Can white-rot fungi be a real wastewater treatment alternative for organic micropollutants removal? A review. Water Res. 2018, 138, 137–151. [Google Scholar] [CrossRef] [PubMed]
- Jebapriya, G.R.; Gnanadoss, J.J. Bioremediation of textile dye using white rot fungi: A review. Int. J. Curr. Res. Rev. 2013, 5, 1. [Google Scholar]
- Mir-Tutusaus, J.A.; Masís-Mora, M.; Corcellas, C.; Eljarrat, E.; Barceló, D.; Sarrà, M.; Caminal, G.; Vicent, T.; Rodríguez-Rodríguez, C.E. Degradation of selected agrochemicals by the white rot fungus Trametes versicolor. Sci. Total Environ. 2014, 500, 235–242. [Google Scholar] [CrossRef] [Green Version]
- Hasanin, M.S.; Hashem, A.H. Eco-friendly, economic fungal universal medium from watermelon peel waste. J. Microbiol. Methods 2020, 168, 105802. [Google Scholar] [CrossRef]
- Costa, S.; Dedola, D.G.; Pellizzari, S.; Blo, R.; Rugiero, I.; Pedrini, P.; Tamburini, E.J.W. Lignin biodegradation in pulp-and-paper mill wastewater by selected white rot fungi. Water 2017, 9, 935. [Google Scholar] [CrossRef] [Green Version]
- Das, A.; Bhattacharya, S.; Panchanan, G.; Navya, B.S.; Nambiar, P. Production, characterization and Congo red dye decolourizing efficiency of a laccase from Pleurotus ostreatus MTCC 142 cultivated on co-substrates of paddy straw and corn husk. J. Genet. Eng. Biotechnol. 2016, 14, 281–288. [Google Scholar] [CrossRef] [Green Version]
- Gern, R.M.M.; Wisbeck, E.; Rampinelli, J.R.; Ninow, J.L.; Furlan, S.A. Alternative medium for production of Pleurotus ostreatus biomass and potential antitumor polysaccharides. Bioresour. Technol. 2008, 99, 76–82. [Google Scholar] [CrossRef]
- Papaspyridi, L.; Katapodis, P.; Gonou-Zagou, Z.; Kapsanaki-Gotsi, E.; Christakopoulos, P. Optimization of biomass production with enhanced glucan and dietary fibres content by Pleurotus ostreatus ATHUM 4438 under submerged culture. Biochem. Eng. J. 2010, 50, 131–138. [Google Scholar] [CrossRef]
- Fahy, V.; FitzGibbon, F.J.; McMullan, G.; Singh, D.; Marchant, R. Decolourisation of molasses spent wash by Phanerochaete chrysosporium. Biotechnol. Lett. 1997, 19, 97–99. [Google Scholar] [CrossRef]
- Garrido-Bazán, V.; Téllez-Téllez, M.; Herrera-Estrella, A.; Díaz-Godínez, G.; Nava-Galicia, S.; Villalobos-López, M.Á.; Arroyo-Becerra, A.; Bibbins-Martínez, M. Effect of textile dyes on activity and differential regulation of laccase genes from Pleurotus ostreatus grown in submerged fermentation. AMB Express 2016, 6, 1–9. [Google Scholar] [CrossRef] [PubMed] [Green Version]
- Pezzella, C.; Lettera, V.; Piscitelli, A.; Giardina, P.; Sannia, G. Transcriptional analysis of Pleurotus ostreatus laccase genes. Appl. Microbiol. Biotechnol. 2013, 97, 705–717. [Google Scholar] [CrossRef]
- Daou, M.; Piumi, F.; Cullen, D.; Record, E.; Faulds, C.B. Heterologous production and characterization of two glyoxal oxidases from Pycnoporus cinnabarinus. Appl. Environ. Microbiol. 2016, 82, 4867–4875. [Google Scholar] [CrossRef] [Green Version]
- Fernandez Fueyo, E.; Ruiz-Duenas, F.J.; Lopez-Lucendo, M.F.; Perez-Boada, M.; Rencorat, J.; Gutierrez, A.; Pisabarro, A.G.; Ramirez, L.; Martinez, A.T. A secretomic view of woody and nonwoody lignocellulose degradation by Pleurotus ostreatus. Biotechnol. Biofuels 2016, 9, 49. [Google Scholar] [CrossRef] [Green Version]
- Pollegioni, L.; Tonin, F.; Rosini, E. The FEBS journal. FEBS J. 2015, 282, 1190–1213. [Google Scholar] [CrossRef]
- Sakai, K.; Matsuzaki, F.; Wise, L.; Sakai, Y.; Jindou, S.; Ichinose, H.; Takaya, N.; Kato, M.; Wariishi, H.; Shimizu, M. Biochemical characterization of CYP505D6, a self-sufficient cytochrome P450 from the white-rot fungus Phanerochaete chrysosporium. Appl. Environ. Microbiol. 2018, 84, e01091-18. [Google Scholar] [CrossRef] [Green Version]
- Hadibarata, T.; Kristanti, R.A. Fate and cometabolic degradation of benzo[a]pyrene by white-rot fungus Armillaria sp. F022. Bioresour. Technol. 2012, 107, 314–318. [Google Scholar] [CrossRef]
- Stoytchev, I.; Nerud, F. Ligninolytic enzyme complex of Armillaria spp. Folia Microbiol. (Praha) 2000, 45, 248–250. [Google Scholar] [CrossRef]
- Sośnicka, A.; Lubiński, O.; Turło, J. Erythromycin and penicillin toxic post-products management using Pleurotus ostreatus. Res. J. Biotechnol. 2019, 14, 29–36. [Google Scholar]
- Kózka, B.; Nałęcz-Jawecki, G.; Turło, J.; Giebułtowicz, J. Application of Pleurotus ostreatus to efficient removal of selected antidepressants and immunosuppressant. J. Environ. Manag. 2020, 273, 1–8. [Google Scholar] [CrossRef] [PubMed]
- Hariharan, S.; Nambisan, P. Optimization of Lignin Peroxidase, Manganese Peroxidase, and Lac Production from Ganoderma lucidum Under Solid State Fermentation of Pineapple Leaf. BioResources 2013, 8, 250–271. [Google Scholar] [CrossRef] [Green Version]
- Lung, M.Y.; Huang, P.C. Optimization of exopolysaccharide production from Armillaria mellea in submerged cultures. Lett. Appl. Microbiol. 2010, 50, 198–204. [Google Scholar] [CrossRef] [PubMed]
- Cheng, X.H.; Liu, L.D.; Dong, H.X.; Qu, H.G.; Cai, D.H. Optimization of submerged culture condition for production of mycelial biomass by Armillaria mellea. Zhong Yao Cai 2007, 30, 509–512. [Google Scholar]
- Bhak, G.; Song, M.; Lee, S.; Hwang, S. Response Surface Analysis of Solid State Growth of Pleurotus ostreatus Mycelia utilizing Whey Permeate. Biotechnol. Lett. 2005, 27, 1537–1541. [Google Scholar] [CrossRef] [PubMed]
- Theodoros, A.; Argyro, B.; Stavros, P.; Athanasios, A.K.; Poonam, N. Upgrading of Mixed Food Industry Side-Streams by Solid-State Fermentation with P. ostreatus. Recycling 2018, 3, 12. [Google Scholar] [CrossRef] [Green Version]
- Kapich, A.N.; Prior, B.A.; Botha, A.; Galkin, S.; Lundell, T.; Hatakka, A. Effect of lignocellulose-containing substrates on production of ligninolytic peroxidases in submerged cultures of Phanerochaete chrysosporium ME-446. Enzym. Microb. Technol. 2004, 34, 187–195. [Google Scholar] [CrossRef]
- Kapich, A.N.; Prior, B.A.; Lundell, T.; Hatakka, A. A rapid method to quantify pro-oxidant activity in cultures of wood-decaying white-rot fungi. J. Microbiol. Methods 2005, 61, 261–271. [Google Scholar] [CrossRef]
- Pena, R.; Lú-Chau, T.; Lema, J. Use of White-Rot Fungi for Valorization of Stillage From Bioethanol Production. Waste Biomass Valori. 2012, 3, 295–303. [Google Scholar] [CrossRef]
- Zuo, S.; Niu, D.; Zheng, M.; Jiang, D.; Tian, P.; Li, R.; Xu, C. Effect of Irpex lacteus, Pleurotus ostreatus and Pleurotus cystidiosus pretreatment of corn stover on its improvement of the in vitro rumen fermentation. J. Sci. Food Agric. 2018, 98, 4287–4295. [Google Scholar] [CrossRef] [PubMed]
- Itelima, J. Cultivation of mushroom (Pleurotus ostreatus) using corn cobs and saw dust as the major substrates. Glob. J. Agric. Sci. 2012, 11, 51–56. [Google Scholar] [CrossRef]
- Thakkar, A.P.; Dhamankar, V.S.; Kapadnis, B.P. Biocatalytic decolourisation of molasses by Phanerochaete chrysosporium. Bioresour. Technol. 2006, 97, 1377–1381. [Google Scholar] [CrossRef] [PubMed]
- Vahabzadeh, F.; Mehranian, M.; Saatari, A.R. Color removal ability of Phanerochaete chrysosporium in relation to lignin peroxidase and manganese peroxidase produced in molasses wastewater. World J. Microbiol. Biotechnol. 2004, 20, 859–864. [Google Scholar] [CrossRef]
- Vahabzadeh, F.; Mogharei, A.; Mehranian, M. Decolorization of molasses waste water from an alcoholic fermentation process with Phanerochaete chrysosporium-Involvement of ligninase. Iran J. Chem. Chem. Eng. 2002, 21, 126–134. [Google Scholar] [CrossRef]
- Hoa, H.T.; Wang, C.-L. The Effects of Temperature and Nutritional Conditions on Mycelium Growth of Two Oyster Mushrooms (Pleurotus ostreatus and Pleurotus cystidiosus). Mycobiology 2015, 43, 14–23. [Google Scholar] [CrossRef] [Green Version]
- Kim, M.; Reddy, K.; Oh, Y.; Jung, Y.; Yeo, J.; Choi, H. Rumen fermentation and digestibility of spent mushroom (Pleurotus ostreatus) substrate inoculated with Lactobacillus brevis for Hanwoo steers. Rev. Colomb. Cienc. Pecu. 2017, 30, 267–277. [Google Scholar] [CrossRef]
- Roldán-Carrillo, T.; Rodrıguez-Vázquez, R.; Dıaz-Cervantes, D.; Vázquez-Torres, H.; Manzur-Guzmán, A.; Torres-Domınguez, A. Starch-based plastic polymer degradation by the white rot fungus Phanerochaete chrysosporium grown on sugarcane bagasse pith: Enzyme production. Bioresour. Technol. 2003, 86, 1–5. [Google Scholar] [CrossRef]
- Wu, B.; Hu, G.-K.; Feng, H.; Wu, J.-M.; Zhang, Y.-Z. Cloning and Expression of an α-Amylase Gene from Phanerochaete chrysosporium. Curr. Microbiol. 2007, 55, 105–113. [Google Scholar] [CrossRef]
- Wirunpan, K.; Chinwang, S.; Chaikong, N.; Pukahuta, C. Increasing Nutritional Contents of Cassava Starch Wastes Using Pleurotus ostreatus (Jacq.) P. Kumm. and Lentinus squarrosulus Mont. J. Pure Appl. Microbiol. 2019, 13, 117–125. [Google Scholar] [CrossRef] [Green Version]
- Birch, P.R.J. Targeted differential display of abundantly expressed sequences from the basidiomycete Phanerochaete chrysosporium which contain regions coding for fungal cellulose-binding domains. Curr. Genet. 1998, 33, 70–76. [Google Scholar] [CrossRef] [PubMed]
- Jin, Z.; Hou, Q.; Niu, T. Effect of cultivating Pleurotus ostreatus on substrates supplemented with herb residues on yield characteristics, substrates degradation, and fruiting bodies’ properties. J. Sci. Food Agric. 2020, 100, 4901–4910. [Google Scholar] [CrossRef] [PubMed]
- Xiao, Q.; Ma, F.; Li, Y.; Yu, H.; Li, C.; Zhang, X. Differential proteomic profiles of Pleurotus ostreatus in response to lignocellulosic components provide insights into divergent adaptive mechanisms. Front. Microbiol. 2017, 8, 480. [Google Scholar] [CrossRef] [PubMed] [Green Version]
- Düzkale Sözbir, G. Utilization of various lignocellulosic substrates for Pleurotus ostreatus mushroom cultivation in the manufacturing of polycaprolactone (PCL)-based biocomposite films. BioResources 2021, 16, 3783–3796. [Google Scholar] [CrossRef]
- Sachs, I.B.; Leatham, G.F.; Myers, G.C. Biomechanical Pulping of Aspen Chips by Phanerochaete-Chrysosporium-Fungal Growth-Pattern and Effects on Wood Cell-Walls. Wood Fiber Sci. 1989, 21, 331–342. [Google Scholar]
- Mata, G.; Perez-Torres, J.; Medel, R.; Perez-Merlo, R.; Salmones, D. Culture of Pleurotus ostreatus in pine shavings: Isolation of strains and evaluation of their productivity. Madera Bosques 2019, 25, e2521715. [Google Scholar] [CrossRef]
- Piškur, B.; Bajc, M.; Robek, R.; Humar, M.; Sinjur, I.; Kadunc, A.; Oven, P.; Rep, G.; Al Sayegh Petkovšek, S.; Kraigher, H.; et al. Influence of Pleurotus ostreatus inoculation on wood degradation and fungal colonization. Bioresour. Technol. 2011, 102, 10611–10617. [Google Scholar] [CrossRef]
- Ayata, U.; Akcay, C.; Esteves, B. Determination of decay resistance against Pleurotus ostreatus and Coniophora puteana fungus of heat-treated scotch pine, oak and beech wood species. Maderas. Cienc. Y Tecnol. 2017, 19, 309–316. [Google Scholar] [CrossRef] [Green Version]
- Reid, I.D. Effects of nitrogen supplements on degradation of aspen wood lignin and carbohydrate components by Phanerochaete chrysosporium. Appl. Environ. Microbiol. 1983, 45, 830–837. [Google Scholar] [CrossRef] [Green Version]
- Andrade, M.V.F.; da Silva, K.M.L.; Siqueira, J.P.D.; Wanderley, C.R.P.; Araujo, R.D.; Marinho, G.; Rodrigues, K. Azo Dye Degradation by Phanerochaete chrysosporium in the Medium Enriched with Nitrogen in the Presence of Primary Co-Substrate. Braz. Arch. Biol. Technol. 2013, 56, 867–874. [Google Scholar] [CrossRef]
- Haider, A.; Zulfiqar, M. Optimization of Cultural Conditions for the Treatment of Pulp and Paper Industrial Effluent by Pleurotus ostreatus (L.). Pak. J. Agri. Res. 2019, 32, 507–513. [Google Scholar] [CrossRef]
- Barraco-Vega, M.; Romero, H.; Richero, M.; Cerdeiras, M.P.; Cecchetto, G. Functional characterization of two novel purine transporters from the Basidiomycota Phanerochaete chrysosporium. Gene 2017, 601, 1. [Google Scholar] [CrossRef] [PubMed]
- Adebayo-Tayo, B.; Jonathan, S.G.; Popoola, O.; Egbomuche, R.C. Optimization of growth conditions for mycelial yield and exopolysaccharride production by Pleurotus ostreatus cultivated in Nigeria. Afr. J. Microbiol. Res. 2011, 5, 2130–2138. [Google Scholar] [CrossRef]
- El-Dein, M.N.; El-Fallal, A.A.; El-Shahat, A.; Hereher, F.E. Exopolysaccharides production by Pleurotus pulmonarius: Factors affecting formation and their structures. Pak. J. Biol. Sci. 2004, 7, 1078–1084. [Google Scholar] [CrossRef] [Green Version]
- Coelho-Moreira, J.D.S.; Bracht, A.; Souza, A.C.D.S.D.; Oliveira, R.F.; Sá-Nakanishi, A.B.D.; Souza, C.G.M.D.; Peralta, R.M. Degradation of diuron by Phanerochaete chrysosporium: Role of ligninolytic enzymes and cytochrome P450. BioMed Res. Int. 2013, 2013, 251354. [Google Scholar] [CrossRef] [Green Version]
- Li, X.-m.; Yang, Q.; Zhang, Y.; Zheng, W.; Yue, X.; Wang, D.-B.; Zeng, G.-M. Biodegradation of 2, 4-dichlorophenol in a fluidized bed reactor with immobilized Phanerochaete chrysosporium. Water Sci. Technol. 2010, 62, 947–955. [Google Scholar] [CrossRef]
- Shi, J.; Chinn, M.; Sharma-Shivappa, R. Interactions between fungal growth, substrate utilization, and enzyme production during solid substrate cultivation of Phanerochaete chrysosporium on cotton stalks. Enzyme Microb. Technol. 2014, 37, 2463–2473. [Google Scholar] [CrossRef]
- Zhang, Q.; Wei, Y.; Han, H.; Weng, C. Enhancing bioethanol production from water hyacinth by new combined pretreatment methods. Bioresour. Technol. 2018, 251, 358–363. [Google Scholar] [CrossRef]
- Tlecuitl-Beristain, S.; Sánchez, C.; Loera, O.; Robson, G.D.; Díaz-Godínez, G. Laccases of Pleurotus ostreatus observed at different phases of its growth in submerged fermentation: Production of a novel laccase isoform. Mycol. Res. 2008, 112, 1080–1084. [Google Scholar] [CrossRef]
- Arbanah, M.; Miradatul Najwa, M.; Ku Halim, K. Utilization of Pleurotus ostreatus in the removal of Cr (VI) from chemical laboratory waste. Int. Ref. J. Eng. Sci. 2013, 2, 29–39. [Google Scholar]
- Diaz, R.; Alonso, S.; Sanchez, C.; Tomasini, A.; Bibbins-Martinez, M.; Diaz-Godinez, G. Characterization of the Growth and Laccase Activity of Strains of Pleurotus ostreatus in Submerged Fermentation. BioResources 2011, 6, 282–290. [Google Scholar] [CrossRef]
- Tay, C.; Liew, H.; Yin, C.-Y.; Abdul-Talib, S.; Surif, S.; Suhaimi, A.; Yong, S. Biosorption of cadmium ions using Pleurotus ostreatus: Growth kinetics, isotherm study and biosorption mechanism. Korean J. Chem. Eng. 2011, 28, 825–830. [Google Scholar] [CrossRef] [Green Version]
- Téllez-Téllez, M.; Fernández, F.; Montiel-González, A.; Sánchez, C.; Díaz-Godínez, G. Growth and laccase production by Pleurotus ostreatus in submerged and solid-state fermentation. Appl. Microbiol. Biotechnol. 2008, 81, 675–679. [Google Scholar] [CrossRef] [PubMed]
- Zhao, L.; Chen, W.; Wang, L.; Sun, H.; Zhu, Z. Improvement of laccase production by Pleurotus ostreatus by means of agroindustrial waste and fermentation kinetics. Mycosphere 2017, 8, 147–161. [Google Scholar] [CrossRef]
- Vamanu, E. Biological activities of the polysaccharides produced in submerged culture of two edible Pleurotus ostreatus mushrooms. J. Biomed. Biotechnol. 2012, 2012, 565974. [Google Scholar] [CrossRef] [Green Version]
- Billal, F.; Thurston, C. Purification of laccase II from Armillaria mellea and comparison of its properties with those of laccase I. Mycol. Res. 1996, 100, 1099–1105. [Google Scholar] [CrossRef]
- Castanera, R.; Omarini, A.; Santoyo, F.; Pérez, G.; Pisabarro, A.; Ramírez, L. Non-Additive Transcriptional Profiles Underlie Dikaryotic Superiority in Pleurotus ostreatus Laccase Activity. PLoS ONE 2013, 8, e73282. [Google Scholar] [CrossRef]
- Barclay, C.D.; Legge, R.L.; Farquhar, G.F. Modeling the Growth-Kinetics of Phanerochaete-Chrysosporium in Submerged Static Culture. Appl. Environ. Microbiol. 1993, 59, 1887–1892. [Google Scholar] [CrossRef] [Green Version]
- Cruz-Morato, C.; Lucas, D.; Llorca, M.; Rodriguez-Mozaz, S.; Gorga, M.; Petrovic, M.; Barcelo, D.; Vicent, T.; Sarra, M.; Marco-Urrea, E. Hospital wastewater treatment by fungal bioreactor: Removal efficiency for pharmaceuticals and endocrine disruptor compounds. Sci. Total Environ. 2014, 493, 365–376. [Google Scholar] [CrossRef]
- Patel, M.; Kumar, R.; Kishor, K.; Mlsna, T.; Pittman, C.U., Jr.; Mohan, D. Pharmaceuticals of emerging concern in aquatic systems: Chemistry, occurrence, effects, and removal methods. Chem. Rev. 2019, 119, 3510–3673. [Google Scholar] [CrossRef] [Green Version]
- Legorreta-Castañeda, A.J.; Lucho-Constantino, C.A.; Beltrán-Hernández, R.I.; Coronel-Olivares, C.; Vázquez-Rodríguez, G.A. Biosorption of water pollutants by fungal pellets. Water (Basel) 2020, 12, 1155. [Google Scholar] [CrossRef] [Green Version]
- Xiong, J.-Q.; Kurade, M.B.; Jeon, B.-H. Can Microalgae Remove Pharmaceutical Contaminants from Water? Trends Biotechnol. 2018, 36, 30–44. [Google Scholar] [CrossRef] [PubMed]
- Gornik, T.; Kovacic, A.; Heath, E.; Hollender, J.; Kosjek, T. Biotransformation study of antidepressant sertraline and its removal during biological wastewater treatment. Water Res. 2020, 181, 115864. [Google Scholar] [CrossRef] [PubMed]
- Osawa, R.A.; Carvalho, A.P.; Monteiro, O.C.; Oliveira, M.C.; Florêncio, M.H. Transformation products of citalopram: Identification, wastewater analysis and in silico toxicological assessment. Chemosphere 2019, 217, 858–868. [Google Scholar] [CrossRef] [PubMed]
- Ma, B.; Arnold, W.A.; Hozalski, R.M. The relative roles of sorption and biodegradation in the removal of contaminants of emerging concern (CECs) in GAC-sand biofilters. Water Res. 2018, 146, 67–76. [Google Scholar] [CrossRef] [PubMed]
- Drzewicz, P.; Drobniewska, A.; Sikorska, K.; Nałęcz-Jawecki, G. Analytical and ecotoxicological studies on degradation of fluoxetine and fluvoxamine by potassium ferrate. Environ. Technol. 2019, 40, 3265–3275. [Google Scholar] [CrossRef] [PubMed]
- Gornik, T.; Shinde, S.; Lamovsek, L.; Koblar, M.; Heath, E.; Sellergren, B.; Kosjek, T. Molecularly Imprinted Polymers for the Removal of Antide-Pressants from Contaminated Wastewater. Polymers 2020, 13, 120. [Google Scholar] [CrossRef]
- Dias, S.; Correia, B.; Fraga-Santiago, P.; Silva, C.; Baptista, P.C.; Gomes, C.R.; Almeida, C.M.R. Potential of an estuarine salt marsh plant (Phragmites australis (Cav.) Trin. Ex Steud10751) for phytoremediation of bezafibrate and paroxetine. Hydrobiologia 2021, 848, 3291–3304. [Google Scholar] [CrossRef]
- Gornik, T.; Vozic, A.; Heath, E.; Trontelj, J.; Roskar, R.; Zigon, D.; Vione, D.; Kosjek, T. Determination and photodegradation of sertraline residues in aqueous environment. Environ. Pollut. 2020, 256, 113431. [Google Scholar] [CrossRef]
- Nassar, R.; Trivella, A.; Mokh, S.; Al-Iskandarani, M.; Budzinski, H.; Mazellier, P. Photodegradation of sulfamethazine, sulfamethoxypiridazine, amitriptyline, and clomipramine drugs in aqueous media. J. Photochem. Photobiol. A Chem. 2017, 336, 176–182. [Google Scholar] [CrossRef]
- Wawryniuk, M.; Pietrzak, A.; Nalecz-Jawecki, G. Evaluation of direct and indirect photodegradation of mianserin with high-performance liquid chromatography and short-term bioassays. Ecotoxicol. Environ. Saf. 2015, 115, 144–151. [Google Scholar] [CrossRef] [PubMed]
- Zhu, Y.; Chang, B.; Sun, X.; Luo, H.; Wang, W.; Li, C. Chloride-mediated electrochemical degradation of the venlafaxine antidepressant. Environ. Technol. Innov. 2022, 25, 102189. [Google Scholar] [CrossRef]
- Akhtar, N.; Mannan, M.A.-u. Mycoremediation: Expunging environmental pollutants. Biotechnol. Rep. 2020, 26, e00452. [Google Scholar] [CrossRef] [PubMed]
Publisher’s Note: MDPI stays neutral with regard to jurisdictional claims in published maps and institutional affiliations. |
© 2022 by the authors. Licensee MDPI, Basel, Switzerland. This article is an open access article distributed under the terms and conditions of the Creative Commons Attribution (CC BY) license (https://creativecommons.org/licenses/by/4.0/).