
Non-Monotonic Relationships between Return Periods of Precipitation Surface Hazard Intensity


Abstract
:1. Introduction
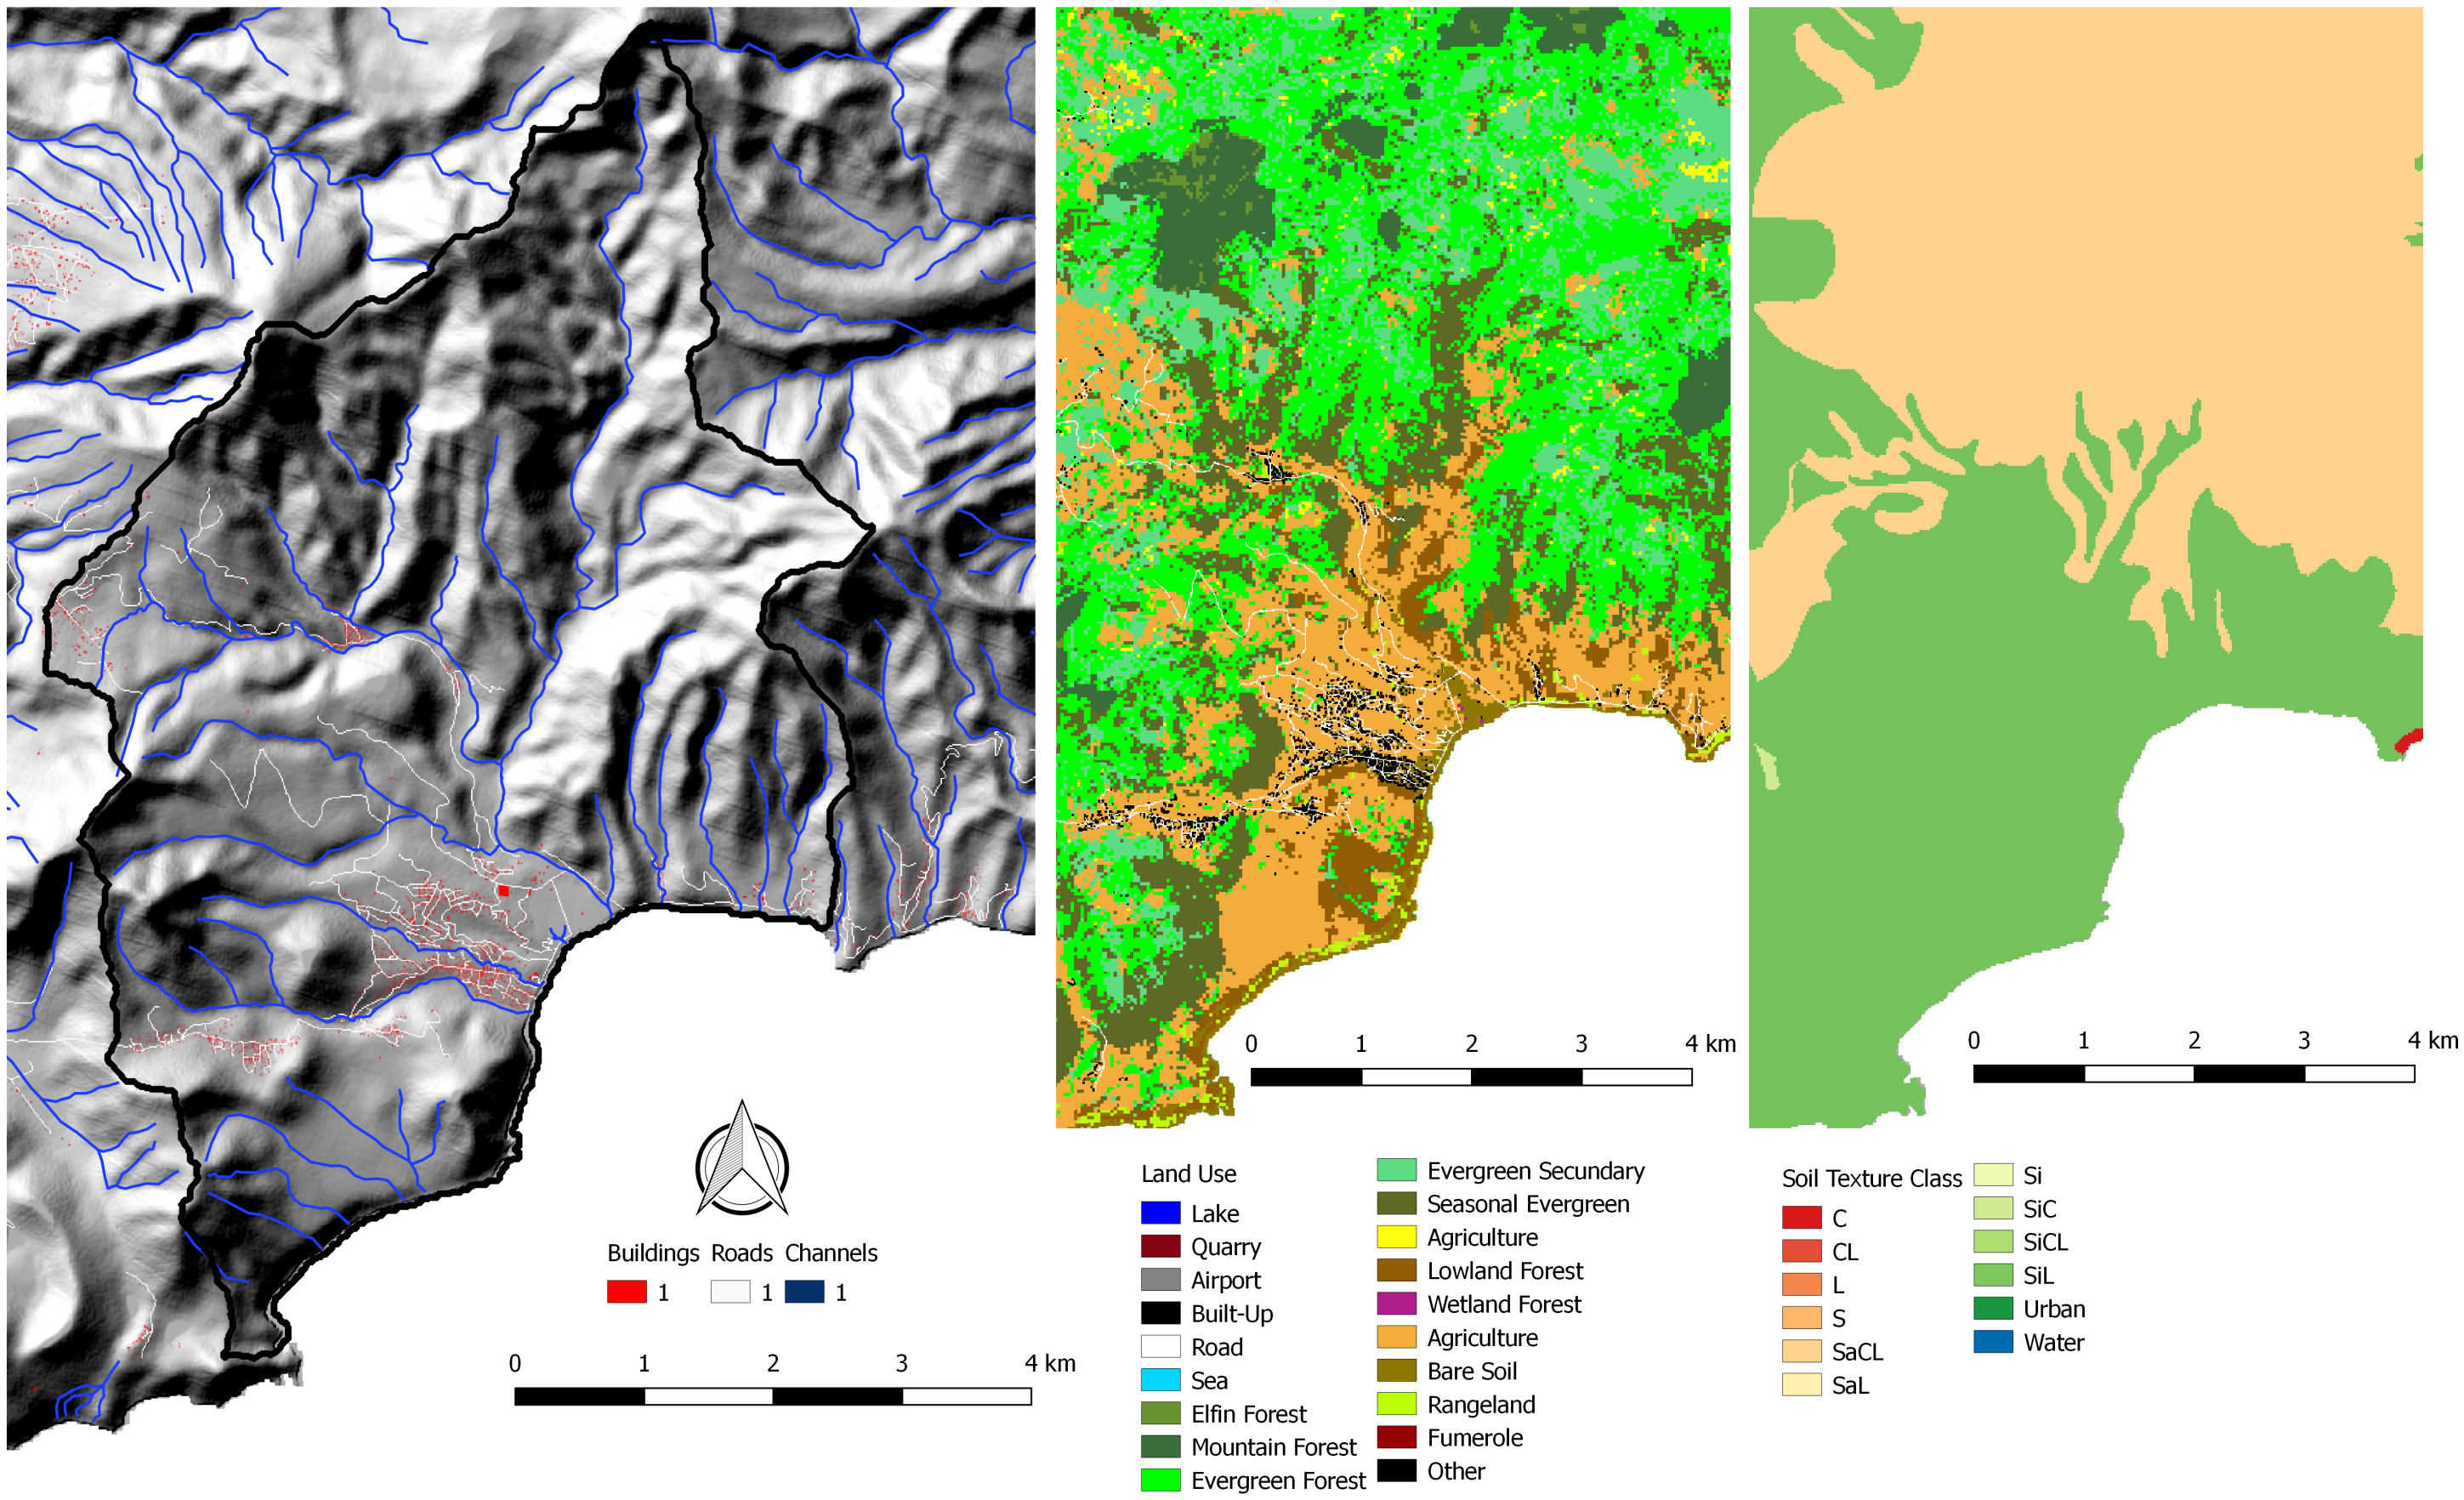
2. Study Site
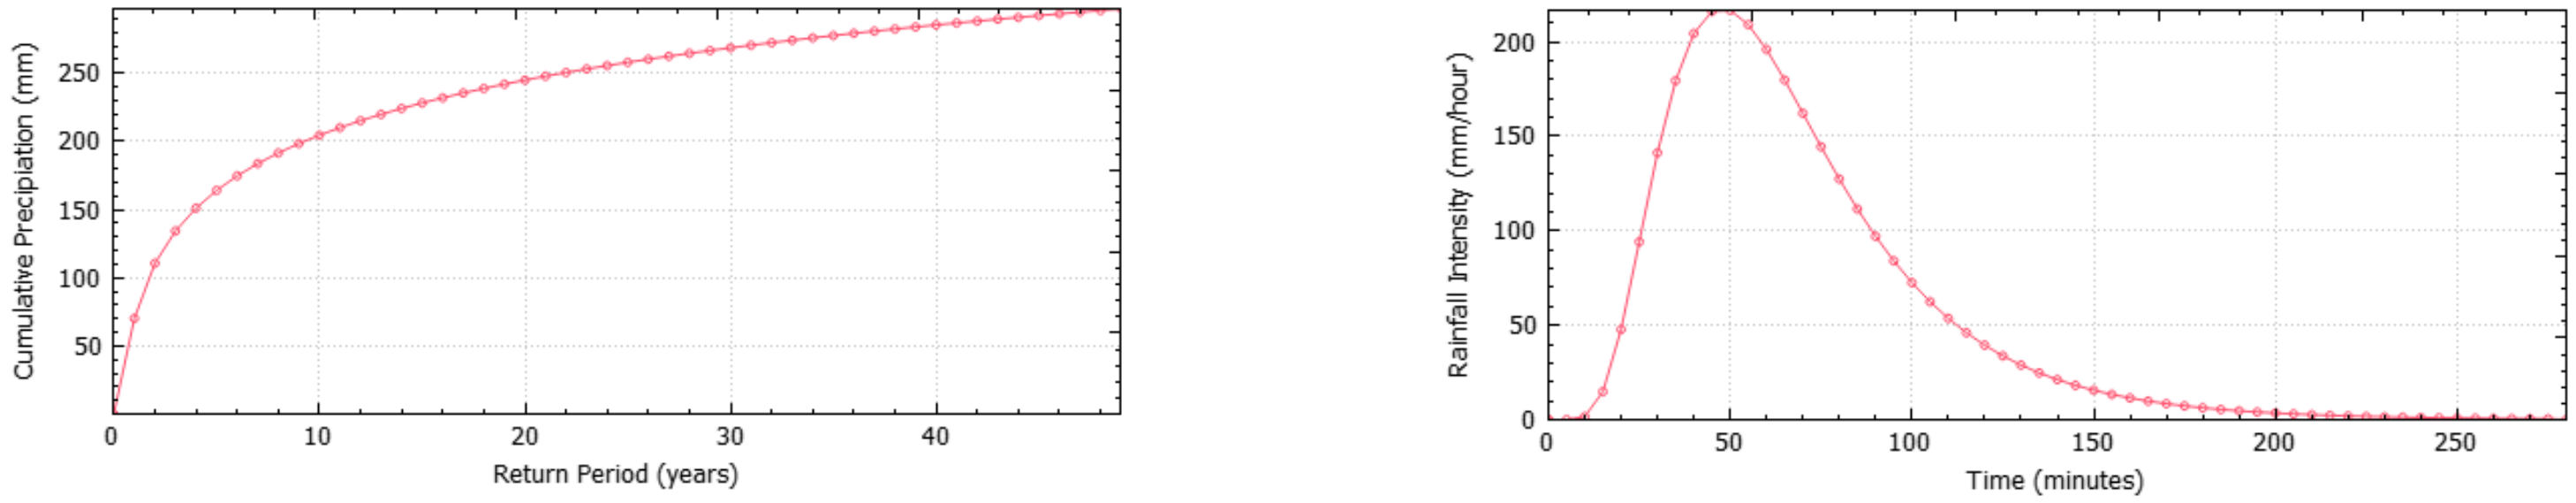
Design Events
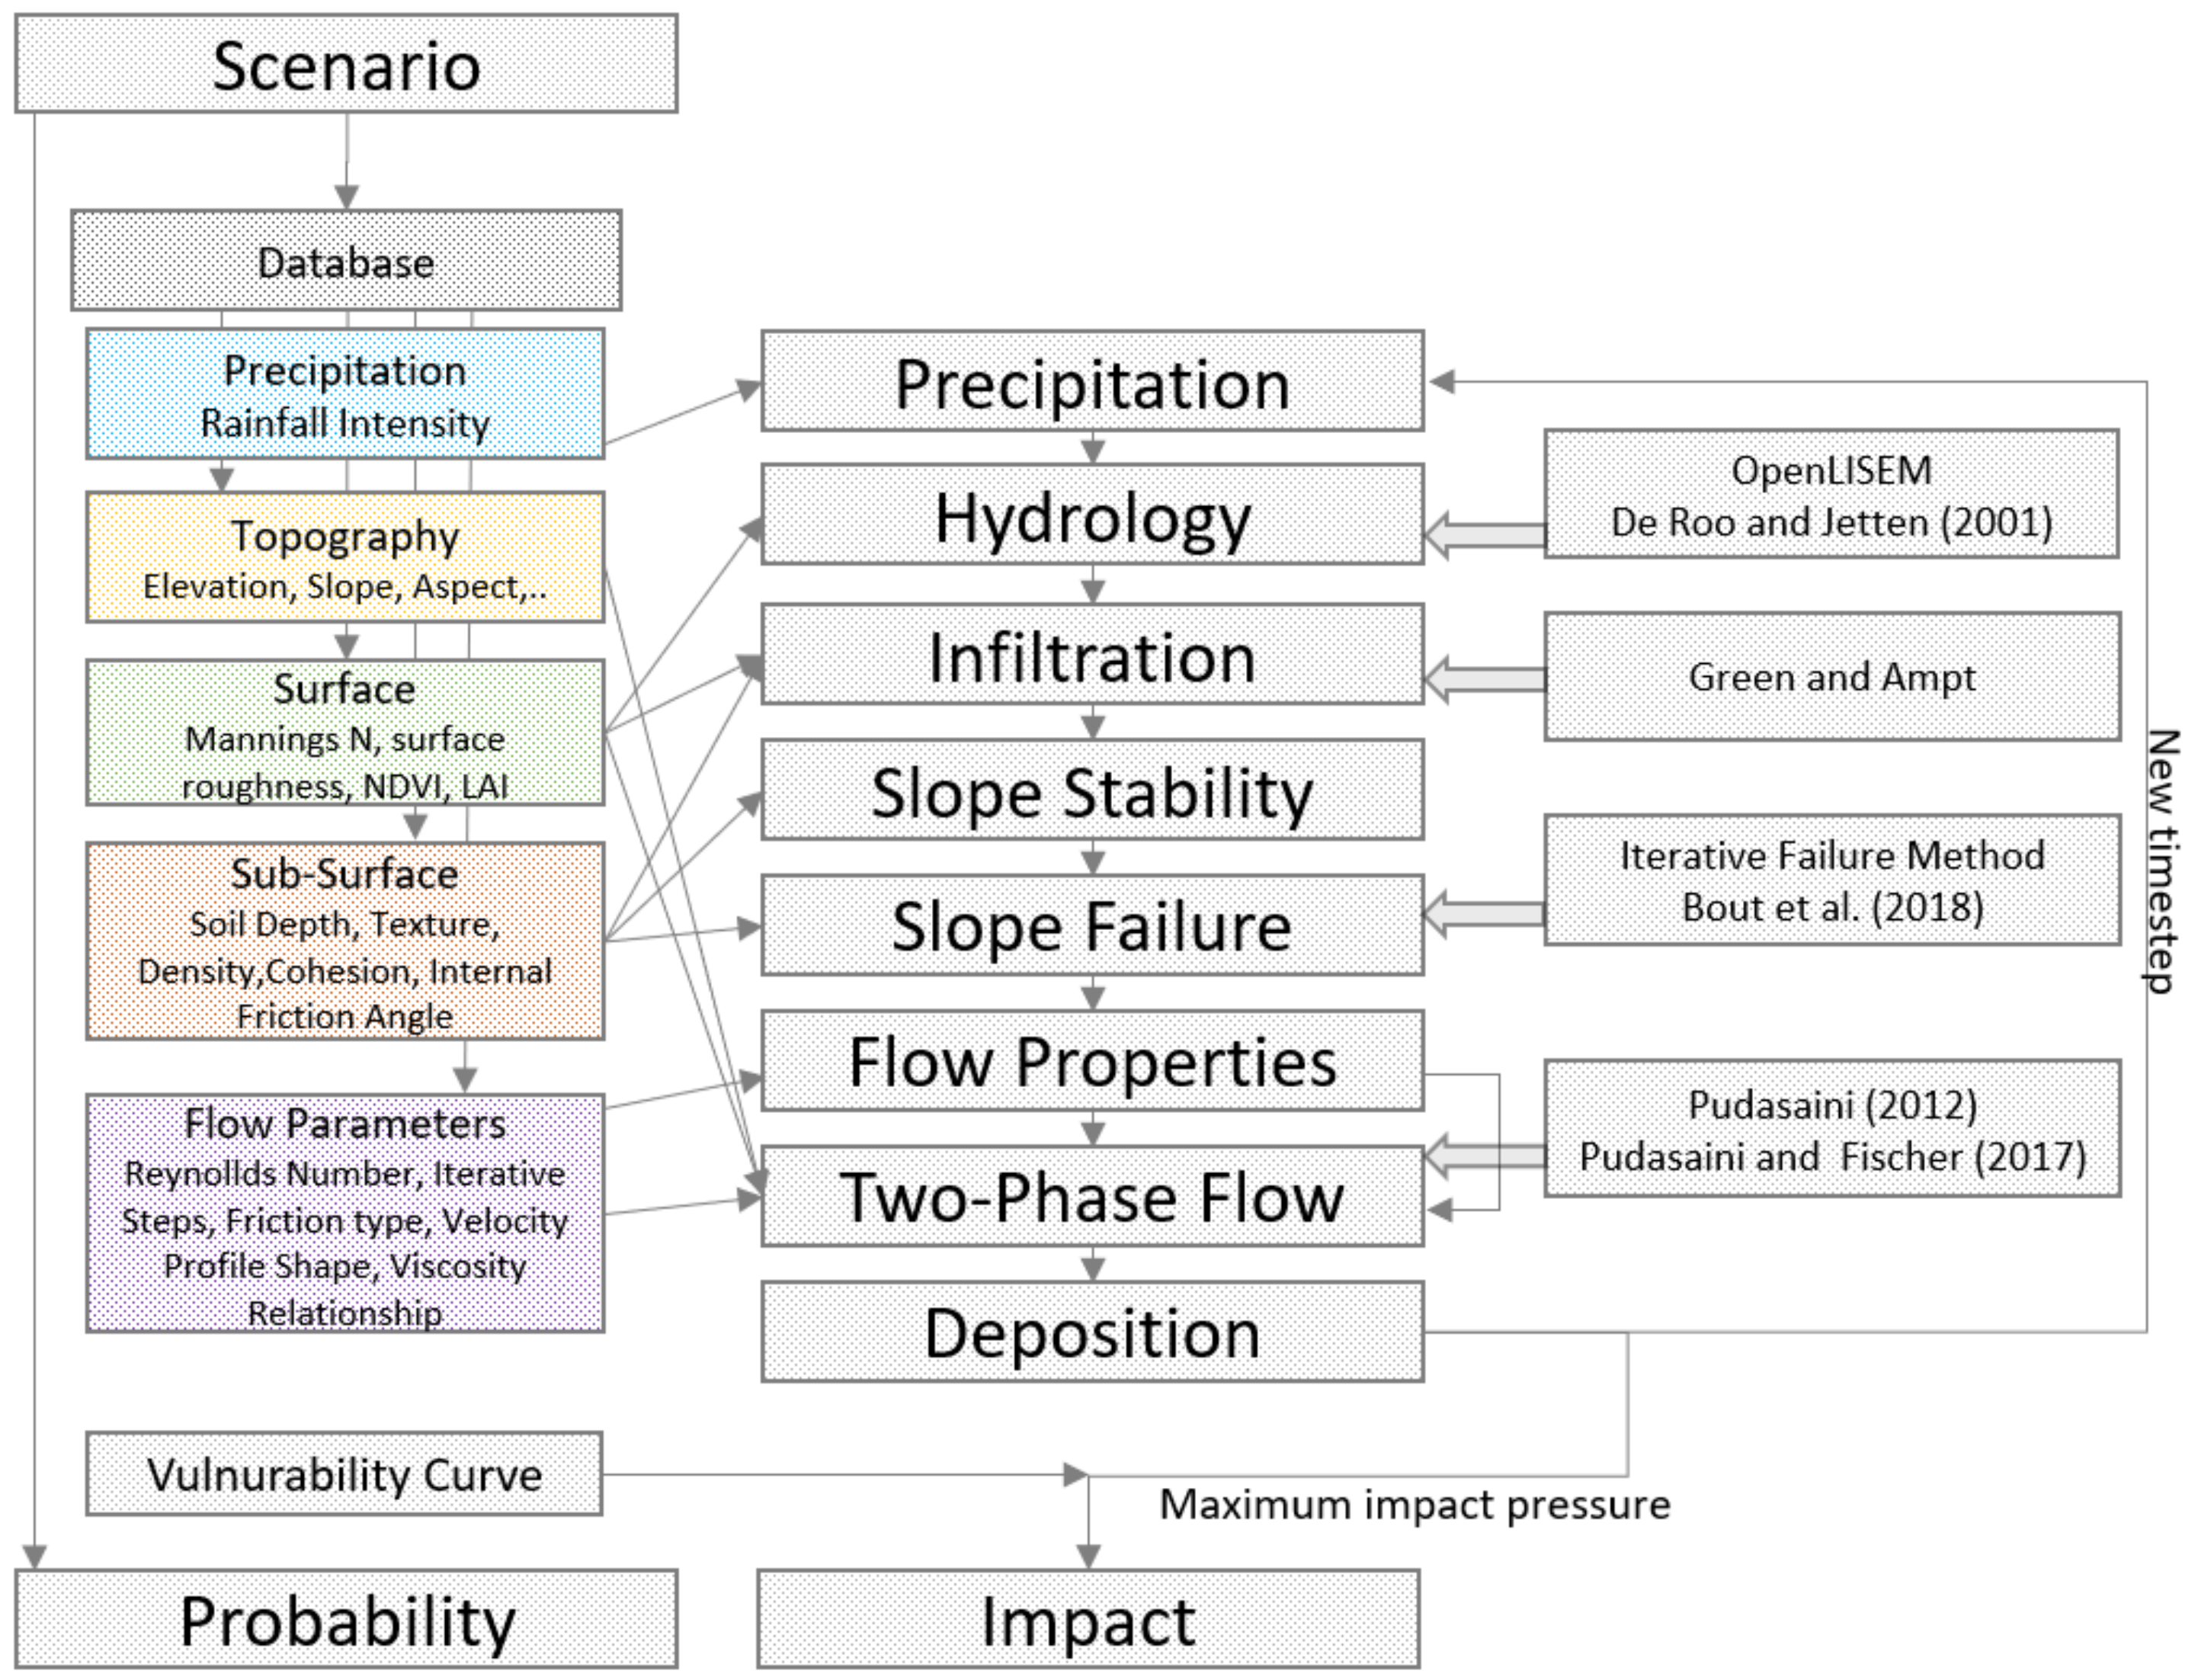
3. Modeling Setup
4. Results
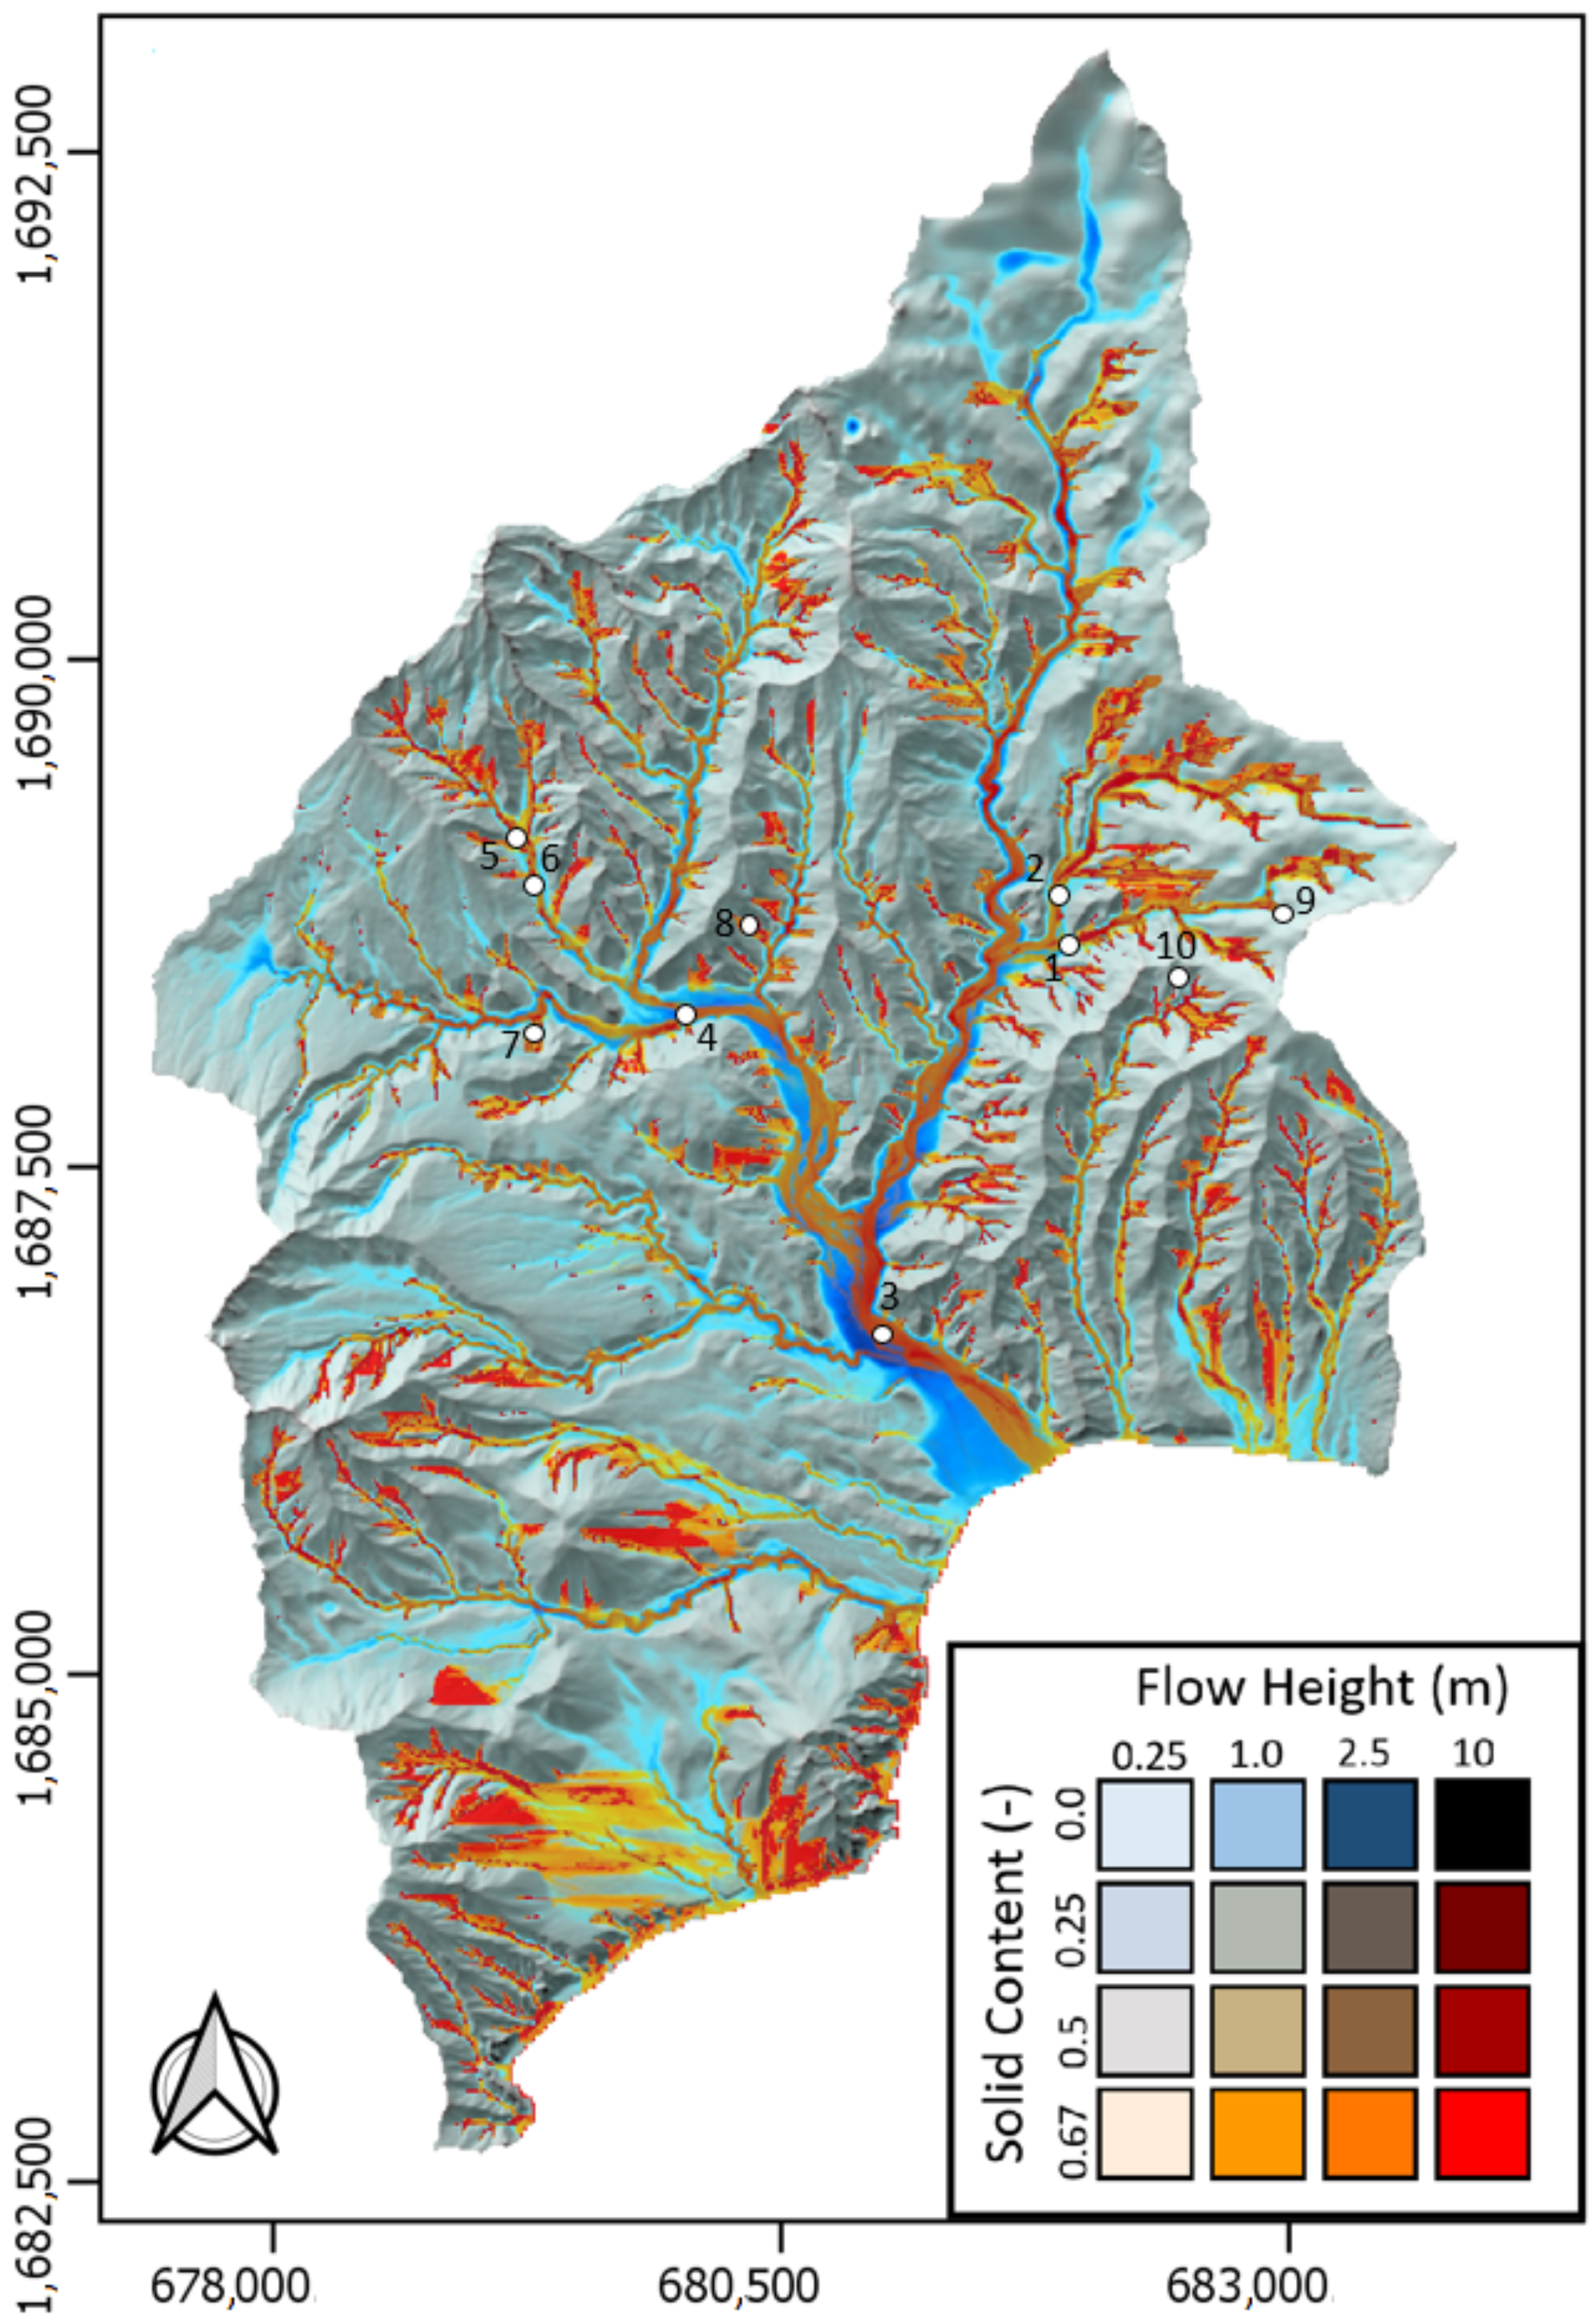
4.1. Simulation of the Multi-Hazard Event
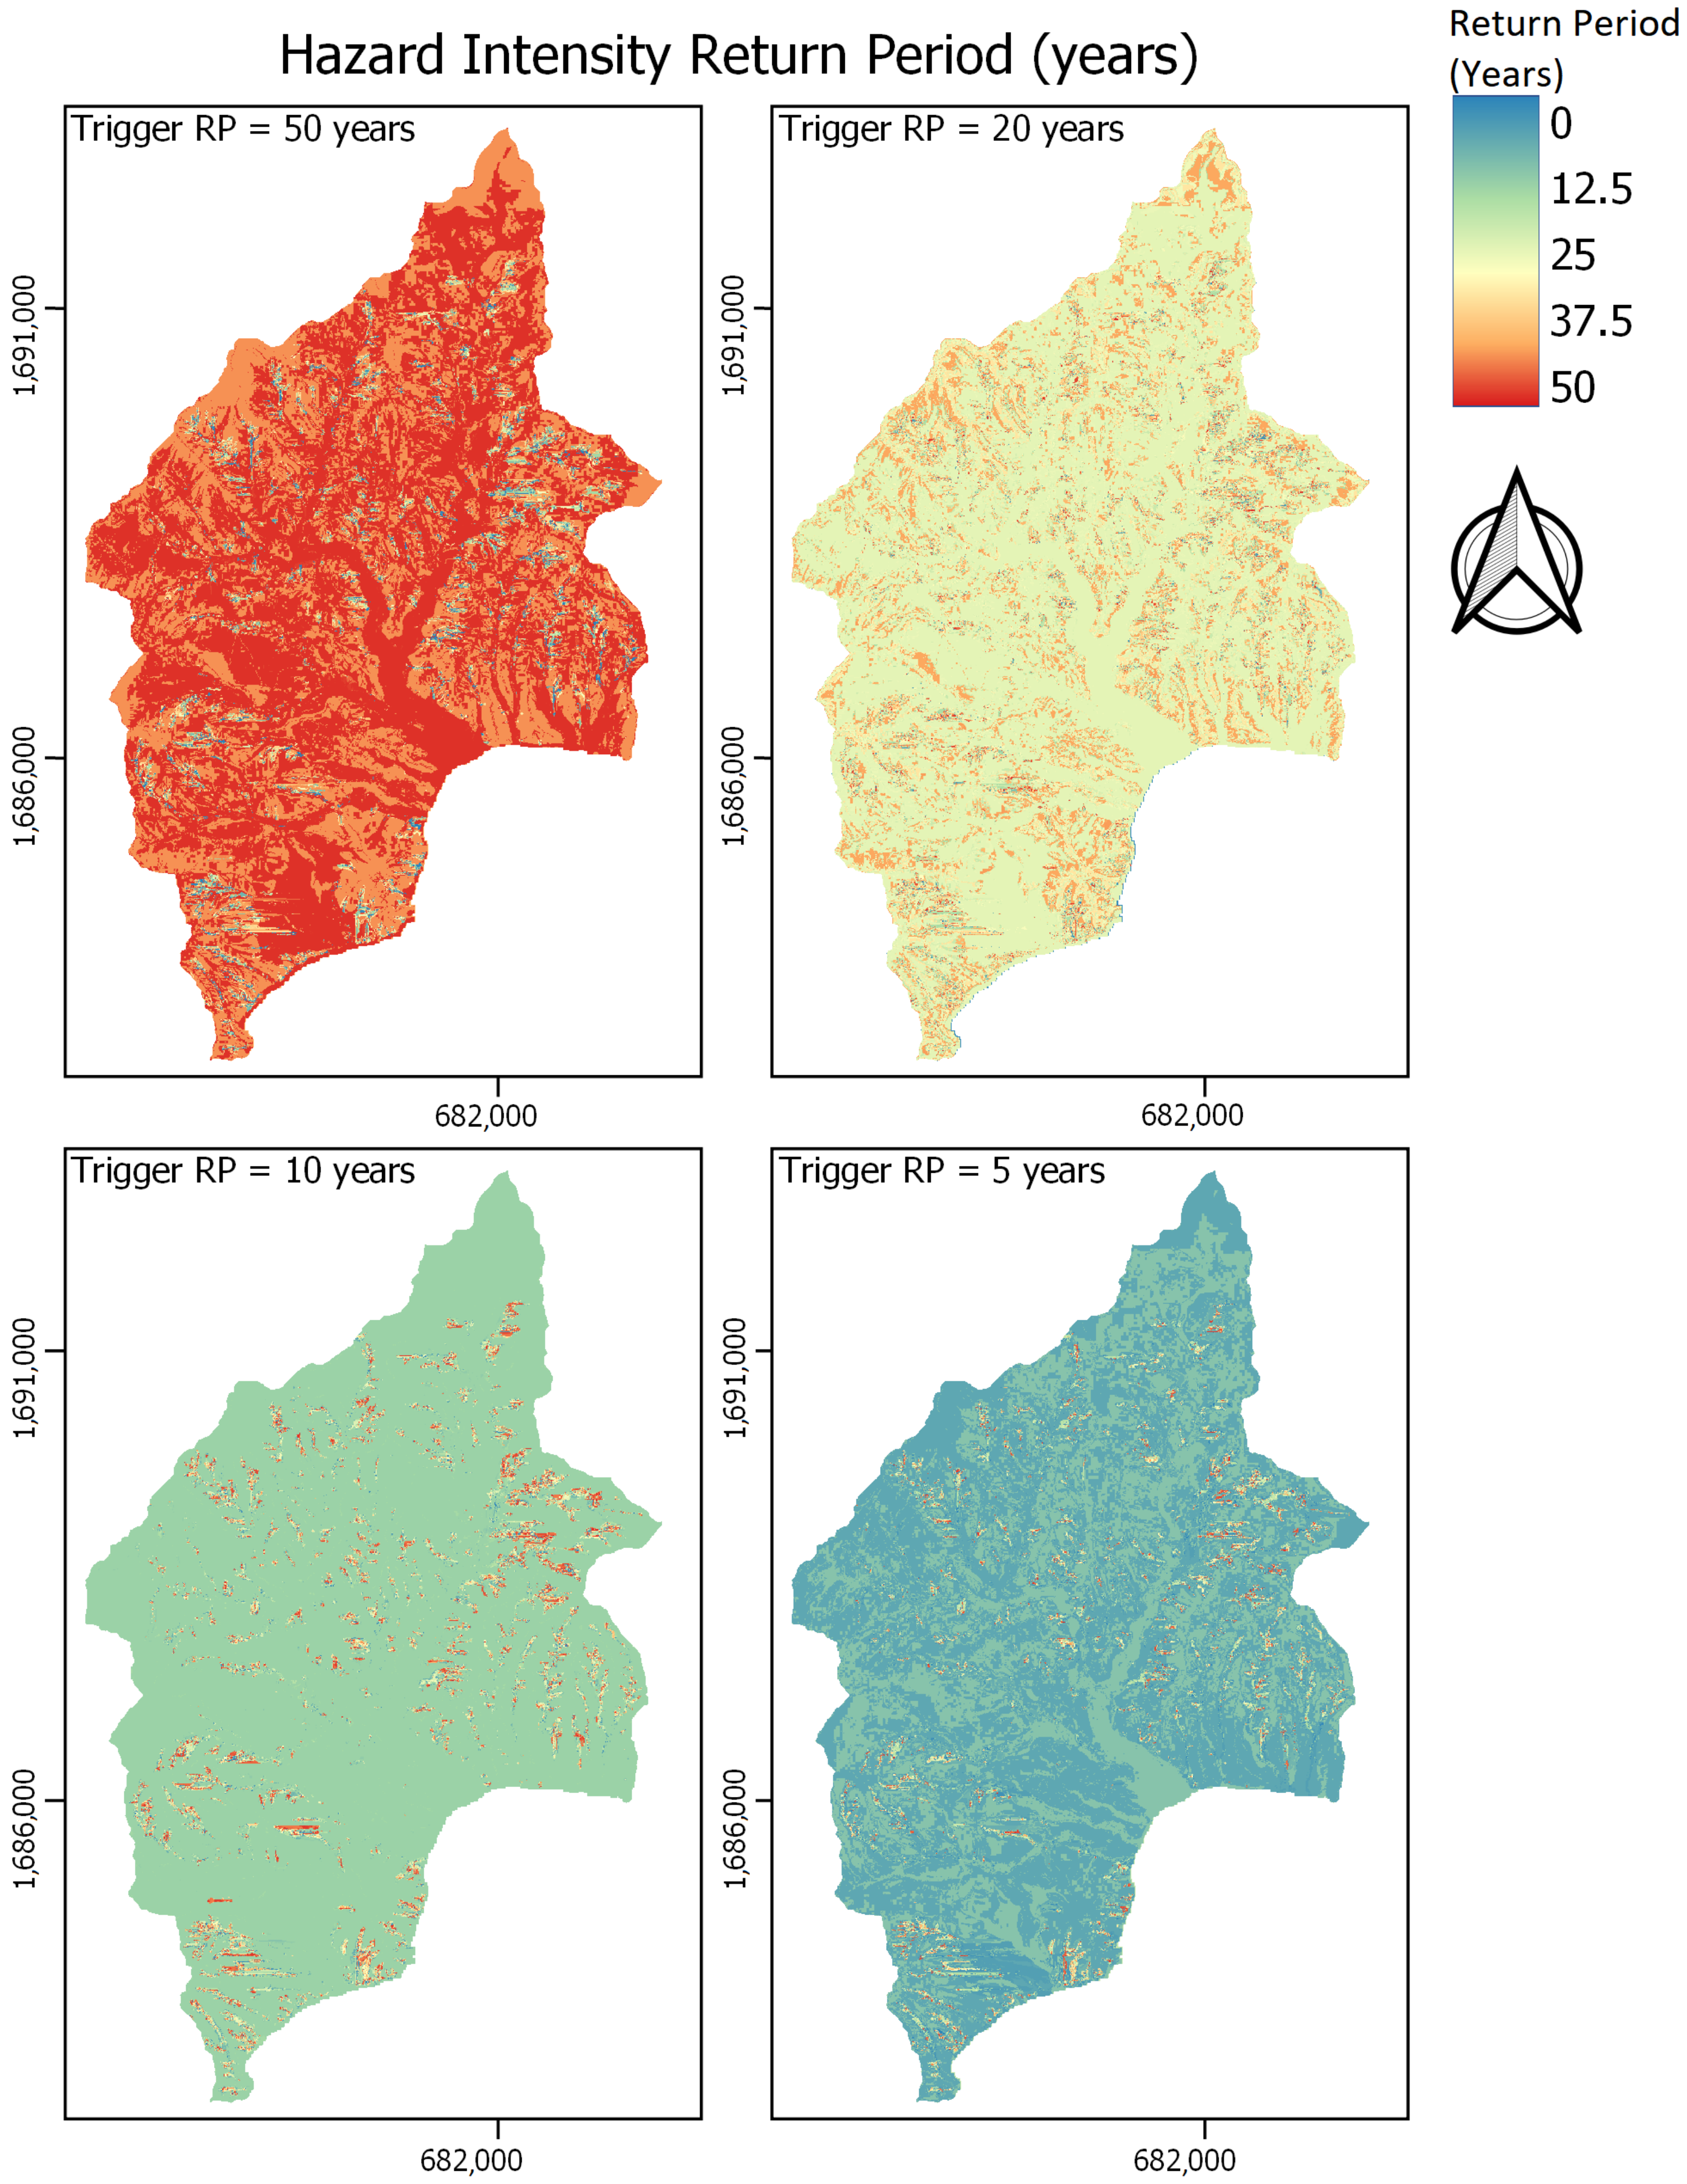
4.2. Relationship between Trigger and Hazard Intensity
4.3. Spatial Variability
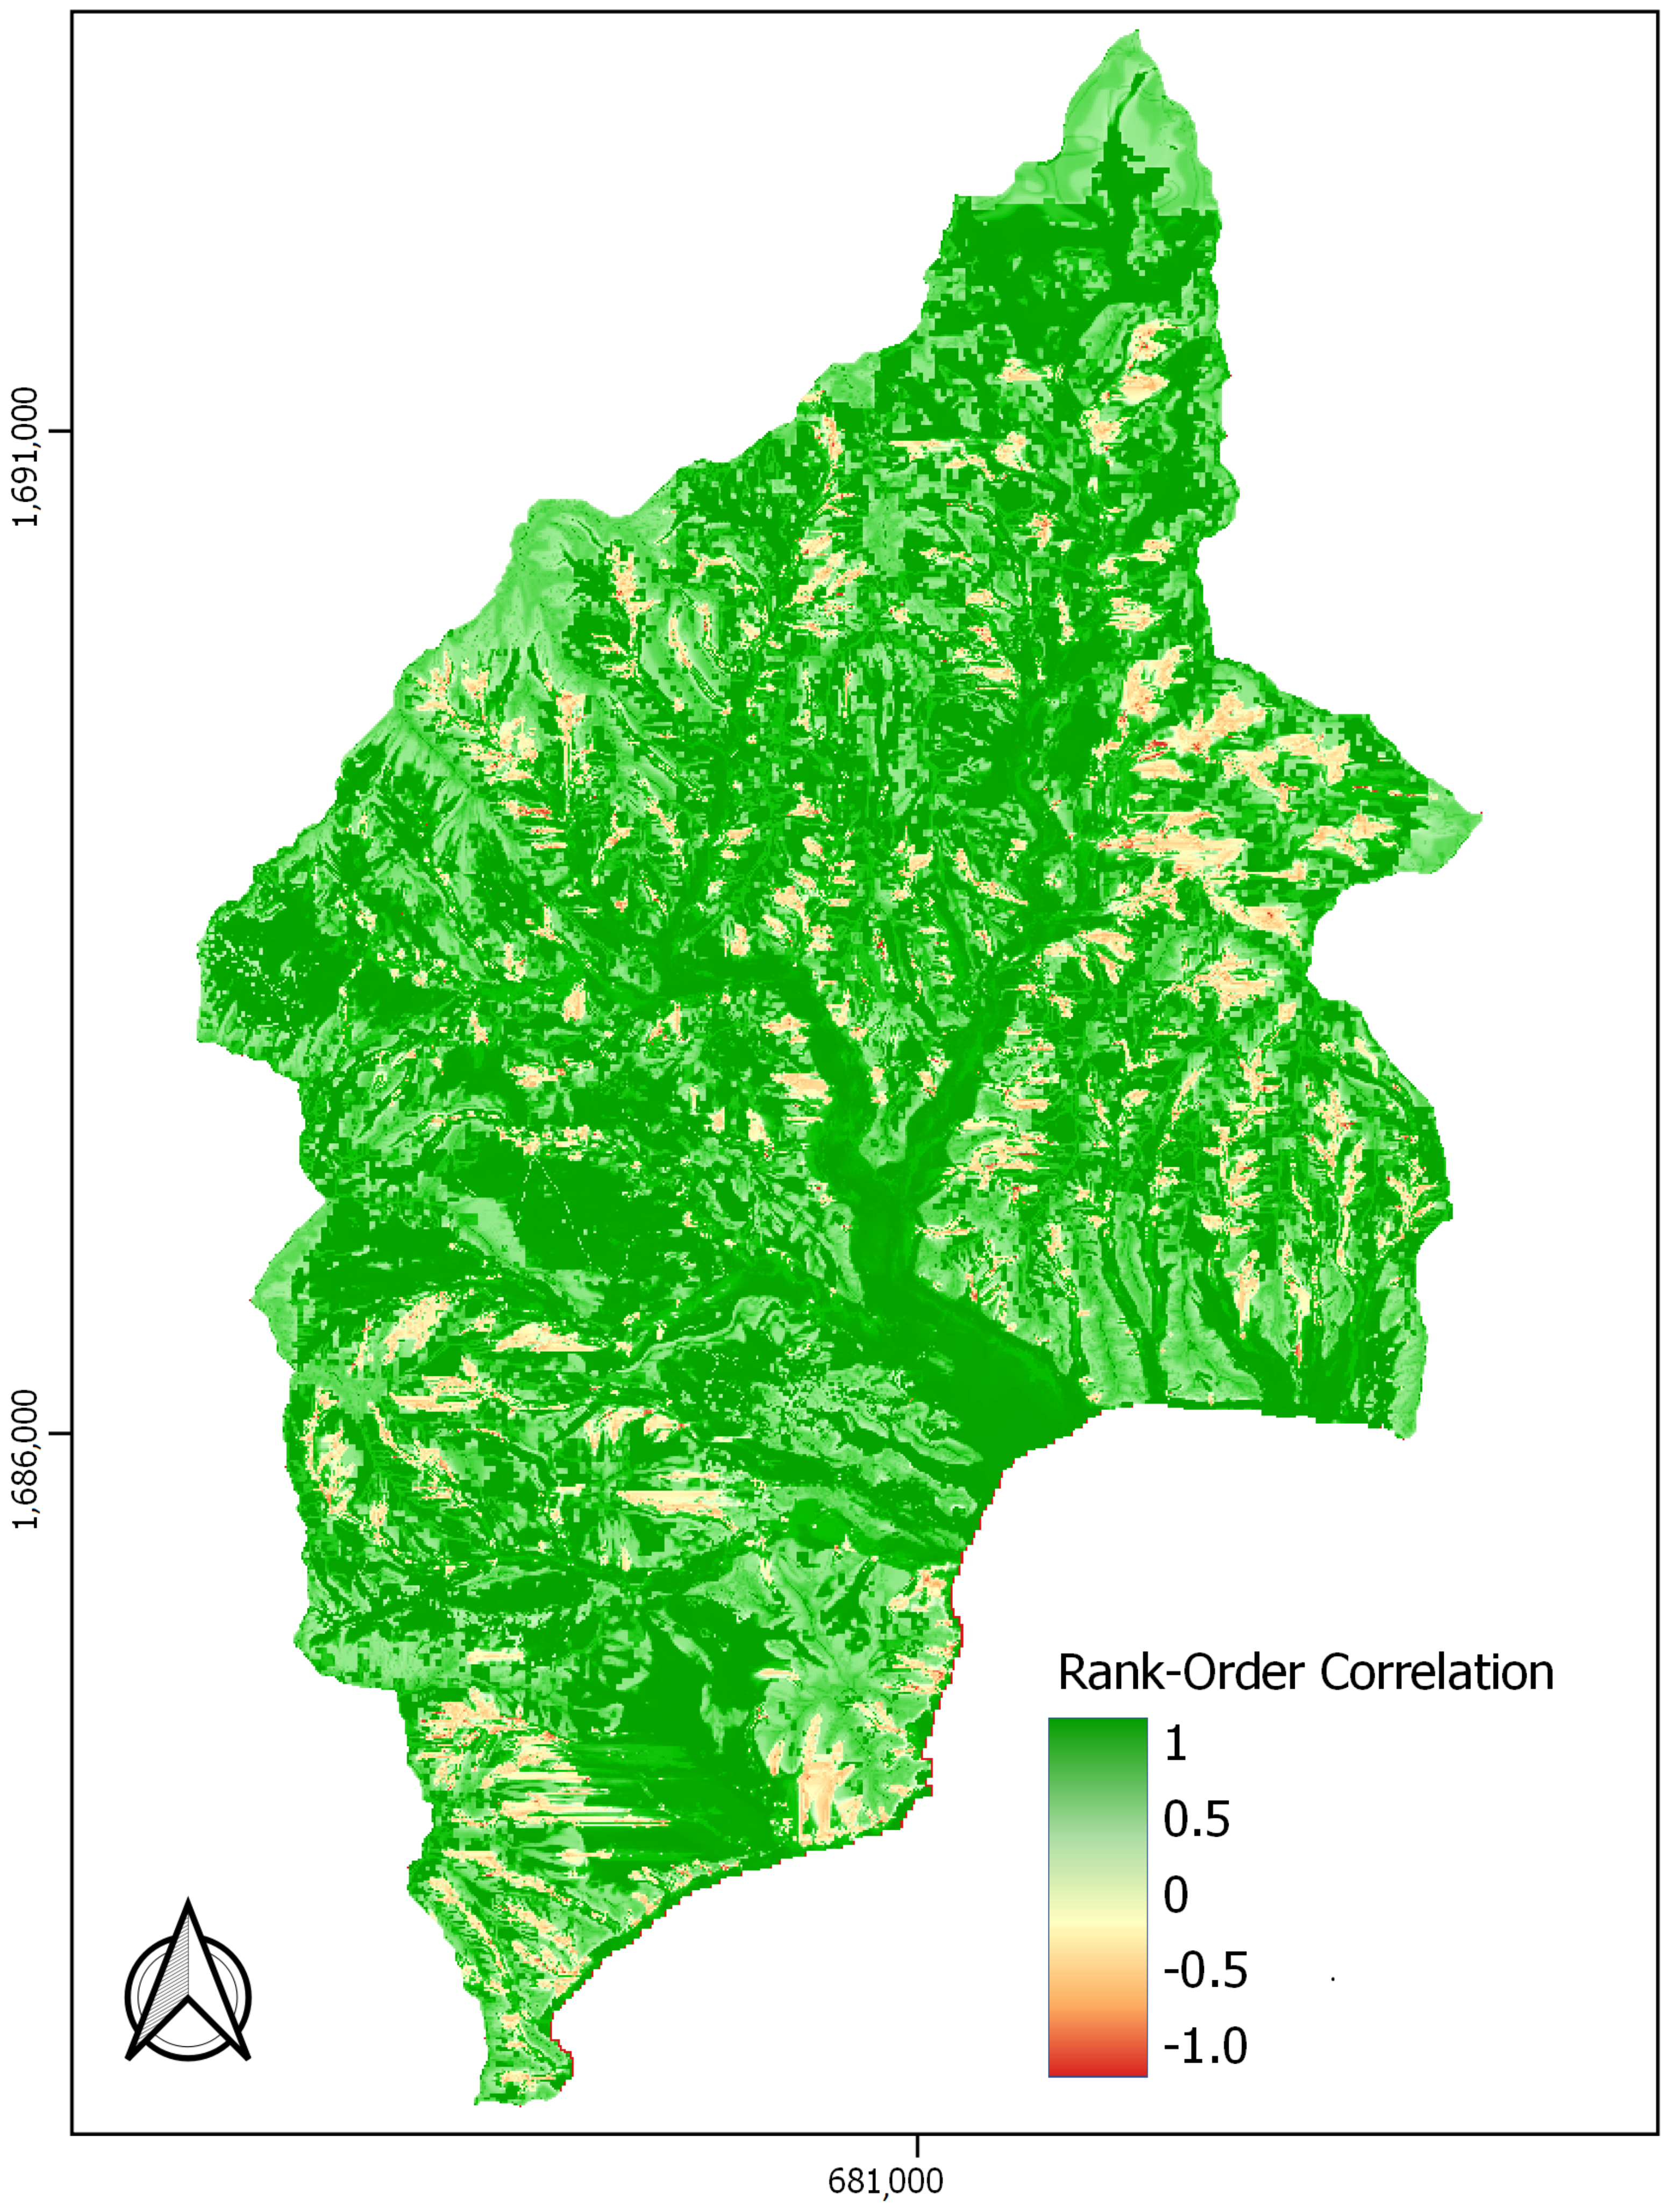
4.4. Quantification of Relation
4.5. Influence on Impact
5. Discussion
5.1. Influence on Risk Calculations
5.2. Influence on Event Categorization
5.3. Limitations of the Used Method
6. Conclusions
Author Contributions
Funding
Data Availability Statement
Acknowledgments
Conflicts of Interest
References
- Toth, E.; Brath, A.; Montanari, A. Comparison of short-term rainfall prediction models for real-time flood forecasting. J. Hydrol. 2000, 239, 132–147. [Google Scholar] [CrossRef]
- Arnaud, P.; Bouvier, C.; Cisneros, L.; Dominguez, R. Influence of rainfall spatial variability on flood prediction. J. Hydrol. 2002, 260, 216–230. [Google Scholar] [CrossRef]
- Kumar, R.; Acharya, P. Flood hazard and risk assessment of 2014 floods in Kashmir Valley: A space-based multisensor approach. Nat. Hazards 2016, 84, 437–464. [Google Scholar] [CrossRef]
- Alkema, D. Simulating Floods: On the Application of a 2D-Hydraulic Model for Flood Hazard and Risk Assessment; Utrecht University: Utrecht, The Netherlands, 2007. [Google Scholar]
- Viglione, A.; Blöschl, G. On the role of storm duration in the mapping of rainfall to flood return periods. Hydrol. Earth Syst. Sci. 2009, 13, 205–216. [Google Scholar] [CrossRef] [Green Version]
- Pawar, U.; Hire, P. Flood Frequency Analysis of the Mahi Basin by Using Log Pearson Type III Probability Distribution. Hydrospatial Anal. 2018, 2, 102–112. [Google Scholar] [CrossRef] [Green Version]
- Te Chow, V. Applied Hydrology; Tata McGraw-Hill Education: New York, NY, USA, 2010. [Google Scholar]
- Tanyaş, H.; Van Westen, C.J.; Allstadt, K.E.; Anna Nowicki Jessee, M.; Görüm, T.; Jibson, R.W.; Godt, J.W.; Sato, H.P.; Schmitt, R.G.; Marc, O.; et al. Presentation and analysis of a worldwide database of earthquake-induced landslide inventories. J. Geophys. Res. Earth Surf. 2017, 122, 1991–2015. [Google Scholar] [CrossRef] [Green Version]
- Kantha, L. Time to replace the Saffir-Simpson hurricane scale? Eos Trans. Am. Geophys. Union 2006, 87, 3–6. [Google Scholar] [CrossRef] [Green Version]
- Klotzbach, P.J.; Bowen, S.G.; Pielke, R., Jr.; Bell, M. Continental US hurricane landfall frequency and associated damage: Observations and future risks. Bull. Am. Meteorol. Soc. 2018, 99, 1359–1376. [Google Scholar] [CrossRef]
- Van Westen, C.; Alkema, D.; Damen, M.; Kerle, N.; Kingma, N. Multi-Hazard Risk Assessment; United Nations University–ITC School on Disaster Geoinformation Management: Enschede, The Netherlands, 2011. [Google Scholar]
- Marsalek, J.; Watt, W. Design storms for urban drainage design. Can. J. Civ. Eng. 1984, 11, 574–584. [Google Scholar] [CrossRef]
- Bout, B.; Lombardo, L.; van Westen, C.J.; Jetten, V.G. Integration of two-phase solid fluid equations in a catchment model for flashfloods, debris flows and shallow slope failures. Environ. Model. Softw. 2018, 105, 1–16. [Google Scholar] [CrossRef]
- Gill, J.C.; Malamud, B.D. Hazard interactions and interaction networks (cascades) within multi-hazard methodologies. Earth Syst. Dyn. 2016, 7, 659. [Google Scholar] [CrossRef] [Green Version]
- Leidig, M.; Teeuw, R.; Day, S.; Solana, C.; Heidarzadeh, M.; Schaefer, M. Infrastructure as both hazard victim and hazard multiplier on Dominica, during and after Hurricane Maria. AGUFM 2019, 2019, NH11B-0776. [Google Scholar]
- Mergili, M.; Jan-Thomas, F.; Krenn, J.; Pudasaini, S.P. r.avaflow v1, an advanced open-source computational framework for the propagation and interaction of two-phase mass flows. Geosci. Model Dev. 2017, 10, 553. [Google Scholar] [CrossRef] [Green Version]
- Mergili, M.; Frank, B.; Fischer, J.T.; Huggel, C.; Pudasaini, S.P. Computational experiments on the 1962 and 1970 landslide events at Huascarán (Peru) with r. avaflow: Lessons learned for predictive mass flow simulations. Geomorphology 2018, 322, 15–28. [Google Scholar] [CrossRef]
- GFDRR. Post-Disaster Needs Assessment Dominica. 2018. Available online: https://www.gfdrr.org/sites/default/files/publication/dominica-pdna-maria.pdf (accessed on 12 April 2022).
- CHARIM. Caribbean Handbook on Risk Management; CHARIM: Enschede, The Netherlands, 2016. [Google Scholar]
- Lowrey, M.R.K.; Yang, Z.L. Assessing the capability of a regional-scale weather model to simulate extreme precipitation patterns and flooding in central Texas. Weather. Forecast. 2008, 23, 1102–1126. [Google Scholar] [CrossRef]
- Bout, B.; Jetten, V. The validity of flow approximations when simulating catchment-integrated flash floods. J. Hydrol. 2018, 556, 674–688. [Google Scholar] [CrossRef]
- Pudasaini, S.P. A general two-phase debris flow model. J. Geophys. Res. Earth Surf. 2012, 117. [Google Scholar] [CrossRef]
- Takahashi, T. Debris flow initiation and termination in a gully. In Hydraulic Engineering; ASCE: Reston, VA, USA, 1993; pp. 1756–1761. [Google Scholar]
- Saxton, K.E.; Rawls, W.J. Soil water characteristic estimates by texture and organic matter for hydrologic solutions. Soil Sci. Soc. Am. J. 2006, 70, 1569–1578. [Google Scholar] [CrossRef] [Green Version]
- Fuchs, S.; Heiss, K.; Hübl, J. Towards an empirical vulnerability function for use in debris flow risk assessment. Nat. Hazards Earth Syst. Sci. 2007, 7, 495–506. [Google Scholar] [CrossRef] [Green Version]
- Scherer, N. Insuring against Climate Change: The Emergence of Regional Catastrophe Risk Pools; Routledge: London, UK, 2020. [Google Scholar]
- Borensztein, E.; Cavallo, E.; Valenzuela, P. Debt sustainability under catastrophic risk: The case for government budget insurance. Risk Manag. Insur. Rev. 2009, 12, 273–294. [Google Scholar] [CrossRef]
- Boote, A.R. Eastern Caribbean Currency Union: Selected Issues; International Monetary Fund: Washington, DC, USA, 2003. [Google Scholar]
- Brooks, L. The Caribbean Catastrophe Risk Insurance Facility: Parametric Insurance Payouts Without Proper Parameters. Ariz. J. Environ. Law Policy 2011, 2, 135. [Google Scholar]
- Deodatis, G.; Ellingwood, B.R.; Frangopol, D.M. Safety, Reliability, Risk and Life-Cycle Performance of Structures and Infrastructures; CRC Press: Boca Raton, FL, USA, 2014. [Google Scholar]
- van den Bout, B.; Tang, C.; van Westen, C.; Jetten, V. Physically-Based Modelling of co-seismic Landslide, Debris Flow and Flood Cascade. Nat. Hazards Earth Syst. Sci. Discuss. 2022, 1–56. [Google Scholar] [CrossRef]
- Nanditha, J.; Mishra, V. On the need of ensemble flood forecast in India. Water Secur. 2021, 12, 100086. [Google Scholar] [CrossRef]
- Barclay, J.; Wilkinson, E.; White, C.S.; Shelton, C.; Forster, J.; Few, R.; Lorenzoni, I.; Woolhouse, G.; Jowitt, C.; Stone, H.; et al. Historical trajectories of disaster risk in Dominica. Int. J. Disaster Risk Sci. 2019, 10, 149–165. [Google Scholar] [CrossRef] [Green Version]
- Rypkema, D.; Tuljapurkar, S. Modeling extreme climatic events using the generalized extreme value (GEV) distribution. In Handbook of Statistics; Elsevier: Amsterdam, The Netherlands, 2021; Volume 44, pp. 39–71. [Google Scholar]


| Parameter | Source |
|---|---|
| Elevation | LIDAR-based 10 m gridded digital terrain model (obtained predominantly in 2018) |
| Land Use/Cover | Classification from SPOT 4m resolution imagery. Urban elements added from OpenStreetMaps database. Surface properties such as Manning’s N, surface micro-roughness or canopy height, the database established by the CHARIM project [19] is used. |
| Soil Texture and Soil Physical Parameters | Soil classification converted to texture by CHARIM project, from which physical parameters are predicted using pedotransfer functions from [24]. |
| NDVI (Normalized Differential Vegetation index) | Sentinel-2 imagery, 2017 |
| Soil Depth | Spatial soil depth model (cite 2020 Dominica paper.., to be added) |
| Numerical Parameters | s, m, |
| Relationship | Observed Causes |
|---|---|
| predominantly increasing | The expected behavior for areas predominantly impacted by (flash) floods. As increase in water results in increased runoff, the converging water that forms the flash floods is similarly increased. |
| approximately constant | Observed in particular for areas impacted with landslide type-movements. With increased trigger intensity, there is no strong influence on landslide flow momentum. Generally, slope failures reach the interface between soils and bed-rock, and additional precipitation does not increase the released volume. Instead, increased trigger intensity influences the spatial extent of impact by increasing the number of slope failures. |
| predominantly decreasing | This type of relationship between hazard intensity and trigger intensity is found in case of shallow slope failures that move down on a diverging (laterally convex) slope. Here, the increase in trigger intensity (increased precipitation) results in higher water flow. This dilutes the mass movement resulting in spreading of the flow as fluid-pressure forces become more important. The spreading reduces the flow height and momentum for a particular location, although it increases the total exposed area. |
| threshold increasing | This type of relationship is found in cases where a threshold effect is significant, such as found in case of slope failures or areas protected from floods by a barrier. Additionally, the breaching of landslide dams shows threshold behavior as material is entrained only above a specific shear stress, which depends on flow heights, velocities and densities. |
| no clear relationship | This is predominantly found for locations with interactions that depend on timing of individual processes such as landslide damming of rivers, breaching and entrainment. The potential damming of rivers depends on the arrival time of flash flood waves and deposition behavior of the mass movement. With sufficient water flow, breaching occurs, which prevents formation of a small reservoir behind the blocking. These time-dependent interactions do not show clear patterns but alter the relationship between trigger intensity and hazard intensity in complex ways. |
| Surface Type | Average Rank-Order Correlation Coefficient |
|---|---|
| All (max. flow height > 0.5 m) | 0.81 |
| Urban (max. flow height > 0.5 m) | 0.76 |
| Slope > 30 percent (max. flow height > 0.5 m) | 0.76 |
| Slope < 30 percent (max. flow height > 0.5 m) | 0.85 |
Publisher’s Note: MDPI stays neutral with regard to jurisdictional claims in published maps and institutional affiliations. |
© 2022 by the authors. Licensee MDPI, Basel, Switzerland. This article is an open access article distributed under the terms and conditions of the Creative Commons Attribution (CC BY) license (https://creativecommons.org/licenses/by/4.0/).
Share and Cite
van den Bout, B.; van Westen, C.J.; Jetten, V.G. Non-Monotonic Relationships between Return Periods of Precipitation Surface Hazard Intensity. Water 2022, 14, 1348. https://doi.org/10.3390/w14091348
van den Bout B, van Westen CJ, Jetten VG. Non-Monotonic Relationships between Return Periods of Precipitation Surface Hazard Intensity. Water. 2022; 14(9):1348. https://doi.org/10.3390/w14091348
Chicago/Turabian Stylevan den Bout, Bastian, Cees J. van Westen, and Victor G. Jetten. 2022. "Non-Monotonic Relationships between Return Periods of Precipitation Surface Hazard Intensity" Water 14, no. 9: 1348. https://doi.org/10.3390/w14091348
APA Stylevan den Bout, B., van Westen, C. J., & Jetten, V. G. (2022). Non-Monotonic Relationships between Return Periods of Precipitation Surface Hazard Intensity. Water, 14(9), 1348. https://doi.org/10.3390/w14091348