Abstract
Accurate information about the irrigated surface is essential to help assess the impact of irrigation on water consumption, the hydrological cycle and regional climate. In this study, we compare recently developed operational and spatially transferrable classification models proposed for irrigation mapping. The first model suggests the use of spatio-temporal soil moisture indices derived from the Sentinel-1/2 soil moisture product (S2MP) at plot scale to map irrigated areas using the unsupervised K-means clustering algorithm (Dari model). The second model called the Sentinel-1/2 Irrigation mapping (S2IM) is a classification model based on the use the Sentinel-1 (S1) and Sentinel-2 (S2) time series data. Five study cases were examined including four studied years in a semi-oceanic area in north-central France (between 2017 and 2020) and one year (2020) in a Mediterranean context in south France. Main results showed that the soil-moisture based model using K-means clustering (Dari model) performs well for irrigation mapping but remains less accurate than the S2IM model. The overall accuracy of the Dari model ranged between 72.1% and 78.4% across the five study cases. The Dari model was found to be limited over humid conditions as it fails to correctly distinguish rain-fed plots from irrigated plots with an accuracy of the rain-fed class reaching 24.2% only. The S2IM showed the best accuracy in the five study cases with an overall accuracy ranging between 72.8% and 93.0%. However, for humid climatic conditions, the S2IM had an accuracy of the rain-fed class reaching 62.0%. The S2IM is thus superior in terms of accuracy but with higher complexity for application than the Dari model that remains simple yet effective for irrigation mapping.
1. Introduction
Foreseen climate change and population growth are pushing towards increasing agricultural production mainly by intensifying the use of fresh water resources for irrigation [1,2,3,4]. Intensive water consumption for irrigation does not only threaten the water availability but also has a direct biogeophysical impact on regional and global climate [5,6,7,8,9]. Several regional climatic modellings deployed by several studies assured that regionally rigorous irrigation leads to the reduction in near-surface air temperature, increase in evaporative fraction and water vapor and intensification of the hydrological cycle [6,10].
For better assessment of the impact of irrigation on global and regional climate as well as the exact quantification of the water consumption, spatial accurate estimation of irrigation information is vital [11,12]. This accurate irrigation information includes the spatial distribution of irrigated areas as well as the temporal monitoring of irrigation episodes (frequency). Both the spatial distribution and the irrigation frequency helps accurately quantifying the irrigation water consumption as well as assessing the regional impact of irrigation on the climate and the hydrological cycle [13,14].
Over a large scale, remote sensing offers a powerful tool for land surface monitoring including and not limited to several agricultural and hydrological applications [15,16,17,18]. Using Earth observation (EO) data, several techniques and approaches were developed with the aim to quantify the spatial extent of irrigated areas and estimating the irrigation frequency at regional and global scales [19,20,21,22,23,24]. To reach those two aforementioned goals, passive (optical) and active (Synthetic Aperture Radar SAR) remote sensing data have been intensively used. Using optical data, the difference in the spectral signatures between irrigated and rainfed areas is considered the key element for mapping irrigated and rainfed areas [25,26]. Several vegetation indices such as the normalized difference vegetation index (NDVI), the normalized difference water index (NDWI) and the normalized difference red-edge (NDRE) derived from the moderate resolution imaging spectroradiometer (MODIS), Landsat or Sentinel-2 (S2) optical images are mainly used to classify irrigated and rain-fed plots [27,28]. Using the SAR technology, the soil moisture variation is considered the proxy-measure for discriminating between irrigated and rain-fed areas [19,21]. In this context, the Sentinel-1 (S1) C-band time series data have been recently exploited for irrigated area mapping given the high spatio-temporal resolution of the S1 satellite allowing the continuous temporal follow up of the soil water status at plot or sub-plot scales [19,29].
In addition to optical and SAR data, some studies proved the potential of using microwave soil moisture products supported by simulated soil moisture from land surface models for mapping irrigated areas [30,31]. Since simulated soil moisture from land surface models does not account for irrigation information, the inconsistency between satellite soil moisture estimations and simulated soil moisture is attributed as evidence of existing irrigation. On the other hand, high correlation between simulated and measured soil moisture usually corresponds to an area that does not encounter any artificial variation of soil moisture caused by irrigation and thus being non-irrigated [30,32]. Nevertheless, most of the studies using satellite soil moisture for irrigation mapping rely on coarse resolution soil moisture products such as that provided by the SMAP (9 km × 9 km), ASCAT (12.5 km × 12.5 km) and SMOS (25 km × 25 km), thus providing coarse resolution irrigation maps [21].
Classifying irrigated and rain-fed areas using either optical, SAR or soil moisture products mainly depends on supervised classification models built using terrain data collected over irrigated and rain-fed plots. Supervised machine learning models such as the classical random forests (RF) [20] and support vector machine (SVM) [29] or advanced deep learning models such as the convolutional neural networks (CNN) [19,33] are common models used to develop irrigated/rain-fed classifiers using optical and/or radar images. Although supervised machine learning models have proved very high efficiency in irrigated area mapping, two drawbacks are usually found when using such types of classifiers. The first obstacle is the availability of terrain data to perform the irrigation mapping while the second is the difficulty of spatially or temporally transferring one model to another year or another geographical area [34]. Obtaining terrain data for irrigated/rain-fed plots requires costly terrain campaigns and may be subject to lack of credibility in the irrigation declarations by visited farmers given the sensitivity of water consumption information. The temporal and spatial transfer of the built supervised model is also a crucial issue especially when trying to apply the built irrigation classification model on another year or another region with different climatic conditions or agricultural practices [35]. To overcome these two drawbacks, two recent studies by Bazzi et al. [20] and Dari et al. [36] proposed two different perspectives for irrigation mapping using unsupervised classification models. In Bazzi et al. [20], they proposed to automatically generate a reference dataset that could replace in situ terrain data to feed a machine learning model to classify irrigated/rain-fed areas. Generating the reference dataset was based on two irrigation metrics derived from the temporal series of S1 and S2 data to deem a number of plots as irrigated or rain-fed with very high confidence. The proposed framework, thereby referred to S2IM (Sentinel-1/Sentinel-2 Irrigation Mapping), was tested over a study site located in north-central France for four years having different climatic conditions. Dari et al. [22,36,37] also proposed an unsupervised approach for irrigated area mapping based on the K-means clustering algorithm using satellite derived soil moisture products. The proposed approach is based on deriving spatio-temporal indices describing the soil moisture dynamics and classifies irrigated/rain-fed plots by applying the K-means clustering using the derived soil moisture metrics. Dari et al. [36] first tested the soil moisture based approach using satellite soil moisture derived from the SMAP, SMOS and ASCAT and Sentinel-1 at 1 Km scale over an arid area in Catalonia, Spain. Later on, Dari et al. [37] adapted the proposed soil moisture-based approach using a plot scale soil moisture product provided by the French Data and Services center for continental surfaces (Theia) over a semi-arid area of central Italy to map irrigated areas at 100 m × 100 m scale.
The objective of this paper is to present a comparative analysis between the efficacity of both models proposed by Bazzi et al. [20] (S2IM) and Dari et al. [37] (later referred to as Dari model) to map irrigated areas at plot scale. Two different climatic contexts, Mediterranean and semi-oceanic, were considered in this study in order to assess the robustness of each method with respect to the climatic conditions that may highly alter the classification accuracies. Irrigation maps of the S2IM and Dari were compared against in situ terrain data and then cross-compared to assess the similarities between the resulting irrigation maps.
2. Materials and Methods
2.1. Study Sites
Two sites with contrasted climatic conditions were examined in this study (Figure 1). The first study site located near Orléans city in north-central France and the second study site is located in the PACA (Provence-Alpes-Côte d’Azur) region of south France. The Orléans study site is characterized by a semi-oceanic temperate climate with an average rainfall of 730 mm and frequent summer rainy episodes. Four years were examined between 2017 and 2020. The four years had different climatic conditions, where 2017 had the most humid summer with a cumulative rainfall between May and October reaching 321 mm followed by a moderately humid summer in 2018, registering 210 mm. The year 2020 registered 150 mm whereas the driest was 2019 with 180 mm. Precipitation records were derived from a local station near the study site. Four terrain campaigns conducted over the study sites aimed to collect irrigation information for four years between 2017 and 2020. For each year, samples of irrigated and rain-fed plots were recorded to construct an in situ database composed of 686, 92, 127 and 116 irrigated and rain-fed plots for 2020, 2019, 2018 and 2017, respectively. The average area of the visited plots reaches 8.0 ha. The in situ collected data of Orléans are mostly irrigated and rain-fed maize plots.
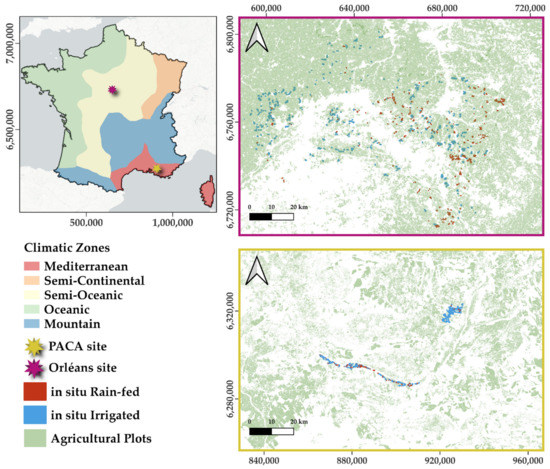
Figure 1.
Location of the two study sites in Orléans (magenta star) and PACA (yellow star). Red and blue plots represent rain-fed and irrigated reference in situ plots, respectively. In green are the agricultural plots used for irrigation mapping in each site. Climatic zones of France are derived from MeteoFrance.
The second study site is located in the PACA region of south France. This site is characterized by a Mediterranean climate with a mild winter and a dry summer season. A field campaign was conducted in 2020 with the aim of collecting an in situ dataset of irrigated and rain-fed plots. A total of 627 plots (204 rain-fed and 323 irrigated plots) were registered in the field campaign. The average surface of the visited plots reached 1.97 ha. Daily precipitation data recorded from a local station near the in situ collected plots registered a cumulative rainfall of 185 mm between May and October 2020. In situ collected data in PACA included several crop types including maize, sunflower, grassland, wheat, vegetables, sorghum and soja.
For both study sites, irrigation took place between June and September mainly for summer crops such as corn, sorghum, sunflower and grassland which were cultivated between May and October. Irrigation on both sites is highly-fragmented where the distribution of the irrigated and rain-fed plots is highly mixed and heterogeneous.
2.2. Soil Moisture Maps
The surface soil moisture (SSM) product used in this study is the Sentinel-1/2 plot scale SSM product (S2MP Sentinel-1/2 Soil Moisture Product) developed by the National Research Institute of Agriculture, Food and Environment (INRAE). The S2MP product provides soil moisture estimations at the agricultural plot scale based on a neural network inversion of the S1 backscattering signal coupled with the S2 Normalized Difference Vegetation Index (NDVI) [38]. The S2MP provides SSM estimations only over agricultural and grassland areas excluding orchards, vineyards and forests. The accuracy of soil moisture estimation in the S2MP reaches 5 vol.% (volumetric water content in percent = 0.05 cm3cm−3) as reported by several accuracy assessment studies of the S2MP [39,40,41]. The S2MP product is available, via the French Data and Services center for continental surfaces (Theia) website, over several regions in Europe and the Mediterranean basin including our two study sites in Orléans and PACA. Over the two study sites, S2MP maps derived from both ascending (evening pass) and descending (morning pass) S1 acquisitions were downloaded and used in this study for the period between March and October for each studied site/year. The ascending and descending modes insure obtaining two soil moisture estimations over an interval of six days (revisit time of the S1 images). The soil moisture estimations from the S2MP were used to calculate the spatio-temporal soil moisture indices proposed by Dari et al. [36] at the plot scale.
2.3. Dari Model
2.3.1. Spatial and Temporal Soil Moisture Anomalies
The classification of irrigated and rain-fed areas proposed by Dari et al. [37] relies mainly on two soil moisture indices derived from soil moisture time series data using the temporal stability theorem introduced by Vachaud et al. [42] initially developed to optimize soil moisture monitoring. These two soil moisture indices describe the spatio-temporal dynamics of the soil moisture. In irrigation context, soil moisture is a key variable as irrigation has a direct impact on the soil moisture variation. Thus, the spatial and temporal anomalies of the soil moisture could be a good descriptor to detect irrigation signals.
The first calculated soil moisture anomaly index is the spatial relative difference “RD” index which describes spatial behavior of the soil moisture for a given spatial entity (grid cell or agricultural plot) with respect to its surrounding. The RD index measures how much the soil moisture of the spatial entity at a given date differs from the spatial mean of the surrounding area at the same date. As irrigated areas are made artificially wet, it is assumed that higher values of relative differences should be observed over the irrigated areas due to the artificial application of water, especially during the dry season. On the other hand, rain-fed areas could show low RD values as it may acquire the same soil moisture dynamics of its surroundings, mainly related to rainfall events only.
In this study, the spatial entity was considered the agricultural plot since first the S2MP provides plot scale soil moisture and second, we aim to map irrigated areas at plot scale. For a given agricultural plot, the is the SSM value estimated by the S2MP map for a plot p and at the S1 acquisition time t. For each plot at each SSM estimation time (t), the value could be calculated as:
where is the average soil moisture values of all the agricultural plots in the studied area at time t. The average relative difference for a period of time T at each plot is then calculated as:
where T is the total number of considered SSM estimations (number of considered S2MP maps) between June and September corresponding to the irrigation period.
The second soil moisture index proposed by Dari et al. [36,37] is the temporal anomaly (TA). It quantifies the variation of the soil moisture in a given plot at a given date with respect to its temporal average soil moisture during a given period. The artificial application of water due to irrigation may induce higher variation in the soil moisture values, thus inducing higher values at the irrigated plots with lower values for rain-fed plots.
The temporal anomaly for a given plot (p) at a given S1 acquisition time t could be calculated as:
where is the average temporal soil moisture value of a given plot over the whole studied time series SSM data between March and October. The average temporal anomaly for a given plot ( is then calculated as the average over the irrigation period T:
where T is the total number of considered soil moisture estimations in the irrigation period between June and September.
As suggested by Dari et al. [37], both and were calculated for the period between June and September of each year, which corresponds to the irrigation period in both our study sites. The value T in Equations (2) and (4) corresponds thus to the total number of soil moisture estimations between June and September. The summation of the and values in Equations (2) and (4) corresponds to the sum of and values where the value t belongs to the period between June and September. Each plot is thus represented by two values of the two soil moisture indices ( and ).
2.3.2. K-Means Clustering
To classify irrigated and rain-fed plots, Dari et al. [36,37] propose to use the unsupervised K-means clustering algorithm. The K-means is a data classification process that groups n data points into predefined k clusters. In this study, the K-means clustering was performed using the and metrics for each study case (site/year) of all the agricultural plots by considering two clusters: one for irrigated and the other for rain-fed. Before feeding the K-means clustering by the and values, both indices were standardized with the aim to put both variables ( and ) at the same scale. The standardization converts the initial and values into values with a zero mean and a variance equal to 1, which helps the K-means clustering finding appropriate clusters independent of the considered variable variance (variance of the initial and ).
2.3.3. Modified Dari Model
One modification in the calculation of both and is proposed in this paper with the aim of possibly enhancing the classification performance. The modification proposes that both and indices are to be calculated by excluding the soil moisture estimation dates encountering a direct effect of rainfall events on the soil moisture values. The objective here is to measure the spatial and temporal anomalies of the soil moisture values ( and ) at a plot scale independent of the rainfall events. Removing the effect of rainfall in calculating and may help reduce the ambiguity between the soil moisture variation due to rainfall or irrigation [40,43] especially in regions that encounter frequent rainfalls in the summer irrigation season such as the Orléans study site. Thus, instead of integrating all the SSM estimations provided by the S2MP to calculate and , the estimation dates encountering rainfall episodes are excluded. For each site/year study case, the rainfall dates were derived based on the variation of the soil moisture estimates in whole study sites between two consecutive SSM estimations of the S2MP. In other words, when the average soil moisture of all the agricultural plots increases more than 5 vol.% between the time at time , the S2MP map at time is excluded from the calculation of both and . The global increase in the soil moisture at the basin scale could be evidence of an existing rainfall event that occurred two to three days before the S1 acquisition date (the date of the S2MP estimation) [40,43,44].
After calculating the and values at each plot with the exclusion of rainfall dates, the and were then integrated in a K-means clustering algorithm with two defined clusters (irrigated and rain-fed). The modified and values were also standardized before applying the K-means algorithm.
2.4. Sentinel-1/Sentinel-2 Irrigation Mapping (S2IM)
The S2IM is an automatic classification framework proposed recently by Bazzi et al. [20] with the aim to operationally map irrigated areas at plot scale without using terrain collected data for feeding a machine learning model. The S2IM is a two-step mapping procedure that first automatically generates its own reference dataset then trains, using this generated reference dataset, a machine learning model to map irrigated areas (random forest classifier).
In the first step of the S2IM, selecting reference data depends on two irrigation metrics, one derived from the S1 time series and the other derived from the S2-NDVI time series. The first S1 metric relies on applying an unsupervised change detection algorithm called the irrigation event detection model (IEDM) proposed by Bazzi et al. [43] on S1 time series for both VV and VH polarizations. The IEDM provides, for each plot and at each S1 image in each polarization (VV and VH), an irrigation possibility weight which represents a proxy-probability of the presence or absence of irrigation as: 0 (no irrigation), 25 (low irrigation possibility), 50 (medium irrigation possibility) and 100 (high irrigation possibility). The irrigation possibilities mainly rely on the change in the S1 backscattering signal between two consecutive S1 images. The IEDM suggests that the increase in the S1 backscattering signal between two S1 images is mainly related to the increase in the soil moisture values. This increase, which could be due to irrigation, is to be separated from the same increase that could be due to rainfall events. For this reason, the IEDM compares between the increase in the S1 signal at plot scale with that at the basin scale supposing that the basin scale increase in S1 signal is mainly related to rainfall events only. Thus, any increase in the S1 signal between two S1 dates at plot scale accompanied with a decrease in the S1 signal at grid scale is attributed to an irrigation event. The S1 metric used for selecting reference data in the S2IM is mainly based on cumulating these irrigation possibilities, provided by the IEDM, for each plot over the S1 time series in both VV and VH polarizations. The assumption in the S2IM says that if the plot is not irrigated, the IEDM would most probably detect no irrigation possibilities on each S1 image of the S1 time series, thus leading to low cumulated irrigation possibilities. On the other hand, if the plot is irrigated, the IEDM would be capable of detecting several irrigation events and thus the cumulative irrigation possibilities for the plot over the S1 time series would be high. The second metric used for selecting the reference dataset is the maximum value attained by the NDVI during the crop cycle. In the S2IM, it is assumed that irrigated plots could show higher maximum NDVI values than the rain-fed plots due to a higher level of photosynthesis and biomass caused by irrigation. Therefore, the plot is deemed as a reference rain-fed plot with high confidence level if it attains a low value of cumulative irrigation possibilities and a low maximum NDVI (maximum NDVI < 0.7). On the other hand, a plot is considered as a reference irrigated plot if it attains very high cumulative irrigation possibilities and a maximum NDVI value greater than 0.8.
In the second step of the S2IM, the generated reference dataset of irrigated and rain-fed plots is then used to feed a random forest classifier in order to map irrigated and rain-fed plots using S1 and NDVI time series data of the reference selected dataset. For detailed information about the reference data selection and the parametrization of the random forest classifier used by the S2IM, the reader is referred to Bazzi et al. [20].
The S2IM was applied over Orléans (2017, 2018, 2019 and 2020) and PACA (2020) study sites. Indeed, over Orléans, the S2IM was previously applied for four years between 2017 and 2020 in Bazzi et al. [20] and the classification accuracies against the same in situ dataset of this study were reported for each year. On the other hand, in this study the S2IM was applied over the PACA site (2020) following the same protocol explained in Bazzi et al. [20]. Over the PACA 2020, the application of the S2IM necessitated downloading and calibrating (radiometric and geometric calibrations) all available S1 images over the study site between March and October 2020 (70 S1 images) in ascending and descending acquisition modes. In addition, NDVI time series was derived using atmospherically corrected S2 time series images downloaded from Theia website. To apply the S2IM over PACA 2020, the IEDM was first applied on the S1 time series images to derive the S1-metric for the reference data selection (cumulative irrigation possibilities). Then, NDVI time series was used to derive the second reference data selection metric (maximum NDVI). Selected reference dataset over PACA 2020 was then used in a random forest (RF) classifier to classify irrigated and rain-fed plots using the S1 time series and the NDVI time series as inputs for the RF model. The resultant RF classification model for PACA was then applied over all the agricultural plots in the PACA site to provide the irrigated/rain-fed classification map.
Finally, it is worth mentioning that the application the S2IM, Dari model and modified Dari model on each studied site/year was performed at the plot scale using the same plot’s boundaries provided by the S2MP soil moisture product. In fact, the plot’s boundaries for the SSM estimations in the S2MP corresponds to the graphical parcel registry (RPG), which is the French official graphical declaration system providing annual geo-localized representation of the agricultural plots.
2.5. Accuracy Assessment
The three models (Dari, modified Dari and S2IM) were applied on both study sites in Orléans and PACA. For Orléans, the accuracy of the classification of the S2IM performed each year (2017, 2018, 2019 and 2020) was previously assessed by Bazzi et al. [20] using the corresponding in situ data terrain data collected each year, whereas the accuracies of the Dari and modified Dari models were assessed in this study using the same in situ dataset. For PACA, the three models were tested for the year 2020 where the terrain in situ data are available. The evaluation of the models’ performance over all site/year study cases was achieved using the common accuracy metrics usually used to assess classification aspects [45,46]: overall accuracy (OA), the F-score, the F-score of the irrigated class and the F-score of the rain-fed class. In addition to the accuracy assessment using in situ data, we intercompare between the irrigation maps originated from the three models. The intercomparison tends to assess the similarity between each model map in order to understand the behavior of each model with respect to other models. In the comparison between two irrigation maps, one map from one model is considered as the base map and the second map is considered the compared map. The similarity between each combination of two maps from two different models was assessed by means of the overall similarity and the recall metric for each class (irrigated and rain-fed). The overall similarity reports the ratio between the number of agricultural plots commonly classified in the same class in both the base and compared maps to the total number of agricultural plots classified. The recall metric of each class reports the ratio between the commonly classified plots in a given class (rain-fed or irrigated) divided by the total number of the plots of this class in the base map. While the overall similarity can give general information about the concurrence of two maps, the recall metric helps to assess the over and underestimation of a class in a map with respect to the other map.
3. Results
3.1. K-Means Models
Figure 2 shows the scatter plot of the standardized (x-axis) and (y-axis) input values for the K-means clustering method for both the Dari model and the proposed modified Dari model, overlaid with the scatter points of and values of the reference dataset (blue and red points correspond to irrigated and rain-fed reference plots, respectively). The light gray cluster represents the plots classified as rain-fed, whereas the dark gray cluster represents the plots classified as irrigated using the K-means clustering method.
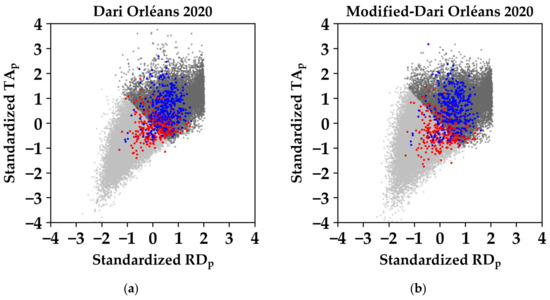
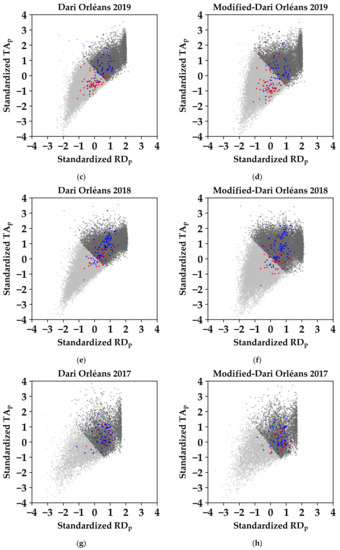
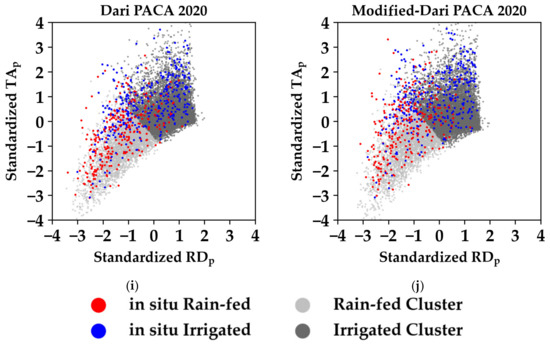
Figure 2.
Scatter plots of the standardized (x-axis) and (y-axis) values for the agricultural plots with the resultant two K-means clusters of both Dari and modified Dari models. The dark gray cluster represents the agricultural plots classified as irrigated, while the light gray cluster represents agricultural plots classified as rain-fed. The blue and red points represent the and scatter plot of irrigated and rain-fed in situ terrain datasets for each study case, respectively. (a,b), (c,d), (e,f), (g,h) and (i,j) represent (Dari model, modified Dari model) for Orléans 2020, 2019, 2018, 2017 and PACA 2020 respectively.
In the study case of Orléans 2020, the Dari model showed that 132 reference rain-fed plots are located in the rain-fed cluster (light gray), thus correctly classified as rain-fed while 159 reference rain-fed plots were misclassified by the K-means cluster as they appear to be in the irrigated point cloud (Figure 2a). The irrigated plots are better classified than the rain-fed plots in the Dari model where 357 irrigated reference plots were correctly classified as irrigated and only 32 irrigated reference plots are misclassified (Figure 2a). Using the modified Dari model proposed in this study, rain-fed plots were better classified as 185 rain-fed plots were correctly classified, versus 106 misclassified rain-fed plots. For the irrigated class, similar results are obtained between both Dari and modified Dari models (Figure 2b).
In Orléans 2019, the two Figure 2c,d shows that both the Dari model and the proposed modification reveal approximately the same classification with 50 out of 57 rain-fed plots correctly classified and 40 out of 59 irrigated plots well classified. In Orléans 2018, the K-means clustering by Dari model correctly classified only 10 out of 36 reference rain-fed plots and 82 out of 91 correctly classified irrigated plots (Figure 2e). The modified Dari model in Orléans 2018 enhanced the separation of rain-fed plots and maintained the same classification of irrigated plots with respect to Dari’s initial model. In fact, 17 out of 36 rain-fed plots were correctly classified using the modified model in Orléans 2018 (Figure 2f).
In Orléans 2017, Figure 2g,h shows that both the Dari and the modified Dari models have the same classification results. In both models, the K-means clustering failed to robustly distinguish the rain-fed plots from irrigated plots as only 4 rain-fed plots out of 26 reference rain-fed plots were correctly classified using the Dari and the modified Dari models. In both models, the separation of the two clusters showed that all the reference plots being either irrigated or rain-fed tend to be classified in the irrigated cluster. The K-means clustering using the and did not actually reflect the correct separation between irrigated and rain-fed plots.
Over the PACA region in 2020, both the Dari and the modified Dari models (Figure 2i,j) had approximately the same classification. In the K-means classification, 192 out of 278 rain-fed plots were correctly classified, whereas 256 irrigated plots out of 349 reference irrigated plots were correctly classified.
3.2. Models’ Accuracy Assessment
Figure 3 summarizes the accuracy metrics for the five study cases (four years for Orléans and one year for PACA) using the three classification models (Dari, modified Dari and the S2IM).
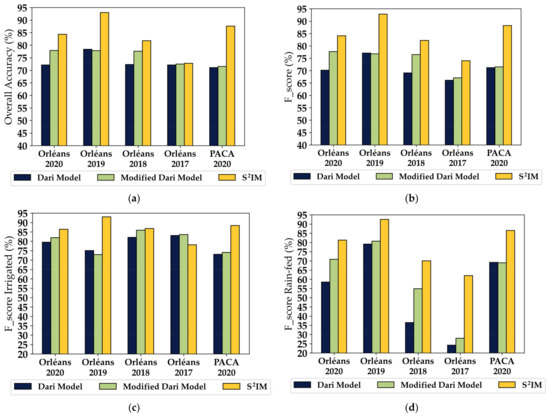
Figure 3.
Accuracy metrics for the three tested models in the five case studies: (a) the overall accuracy, (b) the F-score, (c) the irrigated F-score and (d) the rain-fed F-score.
In the case study of Orléans 2020, the modified Dari model revealed better overall accuracy than the Dari model, with an overall accuracy of 72.1% and 77.9%, respectively (Figure 3a). The S2IM showed higher accuracy compared to both K-means models reaching 84.3%. In Orléans 2019 (Figure 3a), nearly similar overall accuracies were obtained for both the Dari and modified Dari models (78.2 and 77.8%, respectively) where the S2IM showed superior accuracy, reaching 93.0%. Similar to the case of Orléans 2020, the case study of Orléans 2018 showed enhanced overall accuracy using the modified Dari model than using the Dari model where the overall accuracy increased from 72.3% to 77.6% (Figure 3a). The S2IM remained superior to both K-means models with an overall accuracy reaching 81.8%. In Orléans 2017 (year with humid summer season), the three tested models showed similar overall accuracies (about 72%). Finally, in PACA 2020, both the Dari and modified Dari models had similar overall accuracies (71.5%), whereas the S2IM revealed a superior overall accuracy reaching 87.6%.
Regarding the F-score (Figure 3b), similar behavior as that of the overall accuracy is observed for the five study cases. The modified Dari model slightly enhanced the F-score value for both Orléans 2020 and 2018 with a superior F-score value for the S2IM. In Orléans 2019 and PACA 2020, the Dari and modified Dari models provided similar F-score values reaching 77% and 71% for Orléans 2019 and PACA 2020, respectively. However, the F-score value of the S2IM reached 92.8% and 88.2% for Orléans 2019 and PACA 2020, respectively. In the case of Orléans 2017, Dari and modified Dari have a similar F-score value (67%), whereas the F-score of S2IM is slightly higher reaching 74%.
Concerning the accuracy of the irrigated class (Figure 3c), the F-score of the irrigated class reached 79.5%, 75.1%, 82.1%, 83.1% and 73.1% for Orléans 2020, 2019, 2018, 2017 and PACA 2020, respectively, using the Dari model. In general, slightly better F-score values of irrigated class are obtained for the five study cases using the modified Dari model reaching 81.9%, 72.9%, 85.9%, 83.6% and 74.1% for Orléans 2020, 2019, 2018, 2017 and PACA 2020, respectively. The S2IM also showed the best accuracy for the irrigated class than the two K-means models in the five cases reaching 86.4%, 93.0%, 86.8%, 78.1% and 88.4% for Orléans 2020, 2019, 2018, 2017 and PACA 2020, respectively.
For the rain-fed class accuracy (Figure 3d), the F-score of the rain-fed class in Orléans 2020 increased by 12.2%, from 58.5% using the Dari model, to 70.8% using the modified Dari model. Similarly, in Orléans 2018, the accuracy of the rain-fed class increased by 18.4% from 36.5% using the Dari model to reach 54.9% using the modified Dari model. In Orléans 2019 and PACA 2020, the rain-fed class maintained the same F-score value for the Dari and modified Dari model reaching 80% and 69% for the two cases, respectively. In Orléans 2017, the F-score of the rain-fed class remained stable between the Dari and modified Dari model (24%). Finally, the S2IM also showed the highest F-score value of the rain-fed class for the five study cases reaching 81.3%, 92.5%, 70.0%, 62.0% and 88.4% for Orléans 2020, 2019, 2018, 2017 and PACA 2020, respectively.
3.3. Similarity between Irrigation Maps
After validating the three tested methods using the in situ terrain data of each case study, this part reports the similarity between the irrigation maps obtained using the Dari model, modified Dari model and the S2IM. Figure 4 shows the three-evaluation metrics (similarity, rain-fed recall and irrigated class recall) for the comparison of the three irrigation maps produced using the Dari model, modified Dari model (MDari) and the S2IM for the five study cases.
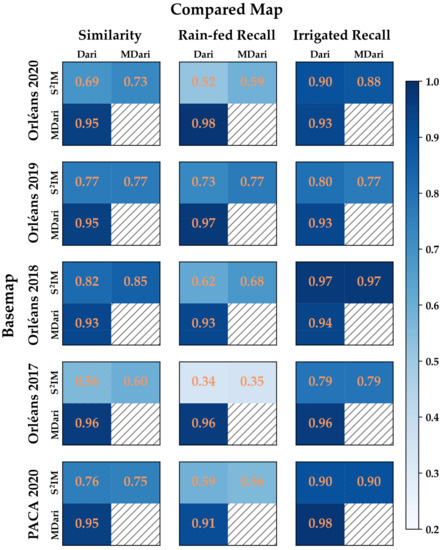
Figure 4.
Comparison between three irrigation maps derived from the Dari model, modified Dari (MDari) and the S2IM for the five study cases. One row is the base map used as a reference to compare the other map (Compared Map) on the column. The hatched area in the matrix corresponds to the absence of a comparison between the same map (MDari).
In the case of Orléans 2020, the Dari map and the S2IM showed an overall similarity of 69% where 90% of the irrigated plots in the S2IM were also classified as irrigated in the Dari map but only 52% of the rain-fed plots in S2IM were classified as rain-fed in the Dari map. A recall of the rain-fed class of 52% between the base S2IM map and the compared Dari map, means that the Dari map tends to underestimate the rain-fed areas and overestimate the irrigated areas with respect to the S2IM. In Orléans 2020, the modified Dari map (MDari) had a slightly higher similarity with the S2IM than the Dari map (73%) with a recall value reaching 59% and 88% for the rain-fed and irrigated class, respectively. The Dari and MDari maps had a very high overall similarity reaching 95%. In the case of Orléans 2019, both the Dari and MDari maps had the same overall similarity with the S2IM reaching 77% with slightly higher recall for rain-fed class in MDari (77%) than Dari (73%) with respect to the S2IM. Inversely to the rain-fed class, the irrigated class shows slightly higher similarity between the Dari map and the S2IM (80%) than the MDari (77%). In Orléans 2018, MDari has 3% higher overall similarity with the S2IM (85%) than the Dari map (82%) accompanied with a higher rain-fed recall value for MDari (68%) than Dari (62%) with respect to the S2IM. The irrigated class has similar behavior in both the Dari (97%) and MDari (97%) with respect to the S2IM. The overall similarity between Dari and MDari models with the S2IM being the lowest in Orléans 2017 attaining a value of 56% and 60% with a low recall value of the rain-fed class reaching 34% and 35%, respectively. This indicates that both K-mean models tend to highly overestimate the irrigated plots with respect to the S2IM where more than 65% of the plots mapped as rain-fed in the S2IM are mapped as irrigated in the K-means models of Dari and MDari maps. In PACA 2020, both Dari and MDari maps have the same similarity with the S2IM reaching 75%. The case of PACA 2020 also shows a low recall value of rain-fed class (59% and 56% for Dari and MDari, respectively) with respect to the S2IM accompanied with high recall of irrigated class reaching 90% for both Dari and MDari model.
4. Discussion
4.1. Time Series Analysis
Figure 5 presents the time series data of the S1 radar backscattering coefficients in VV polarization at plot scale and basin scale derived from the S1 time series images acquired from the morning descending acquisition mode over Orléans 2019 at 6 days revisit time. The S1 backscattering coefficients in VV polarization are used for the estimation of the SSM values in the S2MP, thus highly correlated with the soil moisture estimations [38]. Figure 5 presents four different cases of reference in situ plots: Figure 5a represents a rain-fed reference plot correctly classified in both the Dari model and S2IM, Figure 5b represents an irrigated reference plot correctly classified in the Dari model and the S2IM, Figure 5c shows a rain-fed reference plot misclassified as irrigated in the Dari model and well classified as rain-fed in the S2IM and, finally, Figure 5d represents an irrigated reference plot misclassified as rain-fed in the Dari model and correctly classified as irrigated in the S2IM. The four examples below are taken from the study case of Orléans 2019. The line in the indigo color (dark blue) represents at plot scale whereas the orange line represents the values averaged at the basin scale for bare soil agricultural plots with low vegetation cover (NDVI < 0.4). Blue bars show the rainfall data in mm derived from a local meteorological station in the study site.
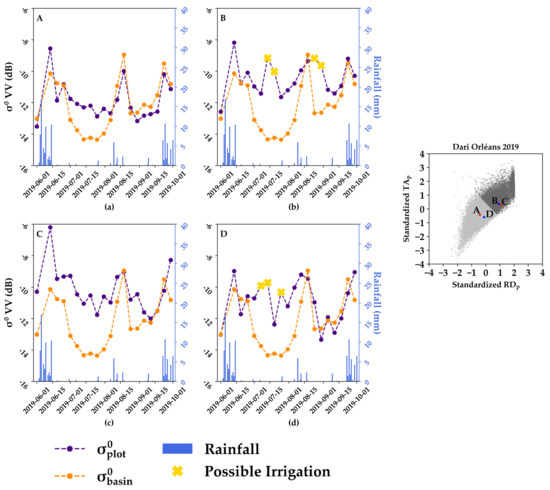
Figure 5.
Temporal series of S1-VV backscattering coefficients at plot scale () in indigo and basin scale in orange between June and September 2019 for four different plots in Orléans: (a,b) are, respectively, rain-fed and irrigated reference plots correctly classified in Dari and S2IM models, (c,d) are, respectively, rain-fed and irrigated reference plots misclassified in the Dari model and well classified in the S2IM. Blue bars show the rainfall data. Yellow crosses represent potential irrigation events on the plots. The cluster figure to the right shows the irrigated/rain-fed clusters generated by the K-means model overlaid with the four plots. According to in situ data, plots A and C are rain-fed whereas plots B and D are irrigated.
In Figure 5a, the plot well classified as rain-fed in both Dari and the S2IM (plot A in the cluster figure to the right) shows similar behavior for and between June and September, where both signals increase and decrease simultaneously due to rainfall events (blue bars) only. During the dry period, no significant increases in the values are observed unless following a rainfall event, which indicates that the soil moisture values at this plot did not encounter any change due to artificial application of water from irrigation. The spatio-temporal soil moisture indices ( and ) of this plot were low and coincide with the rain-fed cluster generated by the K-means. In Figure 5b, the values showed significant increases between two consecutive S1 acquisitions as well as stability of at high values (high soil moisture and/or effect of the vegetation), which are not related to any rainfall event (yellow crosses). The increase in the or stability of the at high values between two consecutive S1 acquisitions with no rainfall event, are evidence of possible irrigation events that occurred on the plot and altered the soil moisture values (subsequently the values). This plot (plot B in the cluster figure to the right) was well classified as irrigated in both the Dari model and the S2IM. In Figure 5c, the reference rain-fed plot was classified as irrigated in the Dari model (plot C in the cluster figure to the right). The temporal evolution of the and the are nearly the same between June and September which means that the soil moisture of the plot was only affected by the rainfall events. However, it could be noticed in Figure 5c that the level of the values is about 3 dB higher than that of the basin values, especially between June and August. Thus, the estimated SSM values at the plot scale from the S2MP could be extremely higher than SSM values at the basin scale leading to high and values for this plot. This difference of 3 dB between the basin scale and the plot scale is most probably due to the vegetation contribution present in the total backscattering signal at plot scale ( during the vegetation development which may lead to an uncertainty in the estimated SSM values. Figure 5d (representing plot D in the clusters figure to the right) shows an irrigated reference plot that was misclassified as rain-fed in the Dari model. Indeed, the and values of this plot were low and coincided with the rain-fed cluster of the K-means despite the three potential irrigation events that could be clearly visible in the temporal evolution. The three potential irrigation events in Figure 5d (yellow crosses) represent an increase in the values (thus an increase in the SSM values) with a stability of the values at low levels indicating dry conditions (also no rainfall events are recorded). However, the spatio-temporal soil moisture indices ( and ) used to discriminate between irrigated and rain-fed plots in the Dari model did not reflect these altered soil moisture values (irrigation events) and showed low values closer to rain-fed plots causing the plot to be misclassified as a rain-fed plot.
4.2. General Evaluation of the Models’ Performances
The three models applied in this study reported contrasted precisions with respect to the studied site and its specific climatic condition. In this section, we tend to summarize some main discussion points that could be relevant for the end-users before choosing a specific model to be applied for irrigation mapping.
First, the proposed modification of the Dari model by eliminating rainfall-affected soil moisture estimations from the spatio-temporal indices only slightly enhanced the classification accuracy in some study cases. The enhancement between the Dari model and the proposed modified Dari model is mainly related to the better distinguishment of the rain-fed class, especially in the case study of Orléans 2020 and 2018. The enhancement of the overall accuracy by 5.8% and 5.2% between Dari and modified Dari models in Orléans 2020 and 2018, respectively, is majorly accompanied with an enhancement of 12.2% and 18.4% of the accuracy of the rain-fed class, thus better separation of the rain-fed plots from the irrigated plots. In the case of Orléans 2019 and PACA 2020, both cases share nearly similar climatical conditions where the summer season in Orléans 2019 was dry with rare rainfall events similar to a Mediterranean climate in PACA 2020. Both the Dari model and the proposed modification of eliminating rainfall dates from the calculation and revealed approximately similar accuracies for each study case. These similar accuracies between the Dari model and the proposed modification in each site could be related to the dry conditions in the summer irrigation season where the exclusion of only few precipitation dates did not highly affect the classification accuracy. In Orléans 2017, it was reported by Bazzi et al. [20] that the climatic conditions in the summer season were extremely humid with frequent rainfall events in summer, cumulating in about 320 mm between May and October 2017. The classification approach based only on the spatial and temporal variations of the soil moisture in such humid case, using either the Dari model or the proposed modification, did not efficiently separate the rain-fed plots from the irrigated plots. As shown in Figure 2g,h, the reference irrigated and rain-fed plots coincide with the irrigated cluster of the K-means with an important mix in the point cloud of rain-fed and irrigated plots when presented as a function of and values. Therefore, it seems that due to frequent rainfall events in the summer, the variability of the soil moisture spatially and temporally is similar between rain-fed and irrigated plots, which makes it difficult to distinguish rain-fed plots from irrigated plots using only the soil moisture as a proxy measure of irrigation.
Second, in the five study cases, it is clear that the S2IM has a superior performance over the K-means clustering using either the Dari model or the proposed modified model. In terms of the four evaluated accuracy metrics, the S2IM provided better results than the other competitors (the Dari and modified Dari). For example, the overall accuracy provided by the S2IM is 6.4%, 15.2%, 4.2% and 16.1% higher than that provided by the modified Dari model for Orléans 2020, 2019, 2018 and PACA 2020, respectively. For Orléans 2017, the S2IM provided similar overall accuracy to the K-means clustering (72 %) but higher accuracy for the rain-fed class than that of the K-means (rain-fed F-score equals 28% for modified Dari and 62% for the S2IM). This means that in the case of the humid conditions in Orléans 2017, the S2IM was capable of better discriminating the rain-fed plots than the K-means clustering method.
Third, the similarity comparison of the three-model derived maps for the five case studies indicates that for all the cases, the K-means models in both the Dari and modified Dari models tend to overestimate the irrigated areas with respect to the S2IM, whereas the irrigated plots in the S2IM have higher resemblance with both K-means models. This also confirms the lower accuracy of the rain-fed class for both Dari and modified Dari models with respect to the S2IM model when compared to the in-situ terrain data. In addition, for most of the cases, especially in Orléans 2020 and 2018, the modified Dari map showed higher resemblance with the S2IM map than the Dari map. In the case of Orléans 2017 with humid summer conditions, the K-means models of both the Dari and modified Dari model have very low resemblance to the S2IM especially in the rain-fed class were the recall value of the rain-fed plots did not exceed 35%. This means that the K-means clustering method may not be capable of distinguishing rain-fed plots from the irrigated plots as the S2IM in such humid conditions. This inability of correctly distinguishing rain-fed plots from irrigated plots in Orléans 2017 is also confirmed by the F-score of the rain-fed class that did not exceed 24% when compared to in situ terrain data.
Finally, regardless of the superiority of the S2IM in terms of classification accuracy, the classification using the K-means clustering with the spatio-temporal soil moisture metrics remains a powerful tool for irrigation classification mainly over dry areas. Even with less accuracy for the Dari or modified Dari model ranging between 72% to 78%, the application of these models is widely simpler and easier for end-users than the S2IM model. To perform an irrigated area map at plot scale using the Dari model, it is sufficient to obtain time series soil moisture derived usually from satellite soil moisture products, such as the S2MP, to calculate and values that could be easily integrated in a K-means clustering method. On the other hand, the application of the S2IM requires downloading, pre-processing and post-processing of huge a dataset of S1 and S2 time series data, which may be time and storage resource consuming. In other words, both operational models remain powerful with a superiority of the S2IM in terms of accuracy and a simplicity of the Dari or modified Dari models in terms of direct application.
4.3. Models’ Limitations
This section discusses some limitations of both the Dari and S2IM models. Firstly, the Dari model, which is based on two spatio-temporal soil moisture indices derived from satellite soil moisture time series to map irrigated areas, is found to have limited usefulness in the humid context. The accuracy of the Dari model classification decreases in humid conditions (such as that of Orléans 2017) where the separation of the rain-fed class from the irrigated class becomes difficult. This decrease in performance could be related to the similarity in the spatial and temporal dynamics of soil moisture for the irrigated and the rain-fed plots in humid areas. With frequent rainfall events, the effect of irrigation on the estimated soil moisture value at a given irrigation date would not be significant when compared to the temporal mean, which is affected by several rainfall events, thus causing similar TA values for both rain-fed and irrigated plots. The RD value which measures the spatial dynamics of soil moisture would also be similar for both irrigated and rain-fed in humid conditions because all the plots are encountering frequent rainfall events, leading to a high variability in the soil moisture values regardless of irrigation. Consequently, the few irrigation events occurring on irrigated plots may not be detected consistently. Thus, the effect of the rainfall events on the RD and TA would be higher than that of the irrigation events in humid conditions, leading to similar RD and TA values for both irrigated and rain-fed plots and more difficulty when distinguishing between the two classes. In addition, when the season is humid, the frequency of irrigation decreases, so it could be more difficult to derive a clear impact of the irrigation events on the soil moisture dynamics using both RD and TA values. For this reason, we can observe that the Dari model best performed during the dry season with a high influence of irrigation in the soil moisture spatio-temporal dynamics (Orléans 2019) and performed the worst during the wet season when the influence of irrigation on the soil moisture dynamics is lowest (Orléans 2017).
Another limit that can constrain the application of the Dari model is the used satellite soil moisture product. Applying the Dari model for mapping irrigated areas at plot scale using the S2MP plot scale soil moisture could be restricted for some crop types. The S2MP is mainly derived from the Sentinel-1 C-band SAR backscattering at a wavelength of about 5 cm. Indeed, it is well known that the SAR C-band data (case of Sentinel-1 and the S2MP product) could be less sensitive to the soil moisture in the case of very well-developed vegetation cover (NDVI > 0.7) in the case of specific crop types such as cereals (wheat and barley) and sunflowers [43,47,48]. Thus, the estimation of the soil moisture using C-band SAR data for some high vegetated canopies could be less accurate and thus lead to unsatisfactory classification results when used for irrigation mapping. As an example, Figure 5c showed a rain-fed plot classified as an irrigated plot due to the high effect of the vegetation cover that induced higher values of the C-band backscattering signal leading to higher estimated soil moisture values and therefore high RD and TA values for this rain-fed plot. Dari et al. [36] first tested the potential use of the satellite soil moisture for irrigation mapping using the L-band microwave sensors (such as SMAP and SMOS) that have higher penetration capabilities than the C-band (wavelength about 20 cm). However, soil moisture products such as SMAP and SMOS provide coarse resolution irrigation maps (at few km2) due to the coarse resolution of such satellite soil moisture products. The coarse resolution irrigation map is not suitable for highly-fragmented irrigated areas where the distribution of the irrigated and rain-fed plots is very mixed and heterogeneous. Despite the limitation of the S2MP in providing accurate soil moisture estimations over well-developed vegetation cover of a few crop types, the S2MP at plot scale now remains the only available plot scale soil moisture product that delivers continuous soil moisture estimations at a high temporal resolution suitable for hydrological and agricultural applications such as irrigation mapping and monitoring. For this reason, to obtain a plot scale irrigation map, the use of the S2MP product in the Dari model remains reasonable. The same limits of the S1 C-band soil moisture sensitivity could be also present in the S2IM model that relies mainly on S1 temporal series data for the selection of the reference dataset (using the IEDM) and the irrigation classification in the random forest classifier. This limitation has been reported by Bazzi et al. [20,43,44] as one of the main factors that could restrict the capability of detecting irrigation events at plot scale and for mapping irrigated areas.
5. Conclusions
This study presented a comparative analysis between two recently proposed irrigation mapping models, Dari model and S²IM model, across a Mediterranean climate (PACA region of south France for the year 2020) and a semi-oceanic climate (Orléans of central France between 2017 and 2020) in order to assess the feasibility of using each model over different climatic conditions. The assessment results of each model against in situ data showed different behavior of both models depending on the climatic context. First, the results showed that the S2IM model had superior performance compared to the Dari model with an overall classification accuracy ranging between 72.8% for humid conditions and 93.0% for dry conditions. On the other hand, the Dari model showed less overall accuracy ranging between 72.1% over humid conditions and 78.4% for dry climatic properties. It was noted that when the climatic conditions are humid with frequent rainfall in the irrigation period, the Dari model did not allow the correct separation of the rain-fed plots from irrigated plots, where the accuracy of the rain-fed class did not exceed 24.2%. In the same humid conditions, the S2IM had better distinguishment of the rain-fed plots with a moderate accuracy reaching 62.0% for the rain-fed class. A modification of the Dari model was proposed in this study with the aim of enhancing the Dari’s classification accuracy. The main results showed that with the modified Dari model, enhancement of about 5% in the overall accuracy is observed for a moderately humid summer with an enhancement of the accuracy of the rain-fed class between 12.2% and 18.4%. However, for extremely humid or dry seasons, the modified Dari model had no significant change on the classification accuracy. The intercomparison between irrigation maps in the five study cases showed that the Dari model maps tend to overestimate the irrigated areas and underestimate rain-fed areas with respect to the S2IM maps especially over humid conditions.
For model complexity, the Dari model was found to be a straightforward model with a moderate accuracy in the dry seasons and not applicable for humid conditions. On the other hand, the S2IM may provide better classification accuracies for both dry and humid conditions but yet require complex data processing especially using the S1 and S2 time series data.
Author Contributions
Conceptualization, H.B. and N.B.; Data curation, H.B.; Formal analysis, H.B. and N.B.; Investigation, H.B.; Methodology, H.B. and N.B.; Software, H.B.; Supervision, M.Z. and N.B.; Validation, H.B., M.Z. and N.B.; Visualization, H.B.; Writing—original draft, H.B.; Writing—review and editing, M.Z. and N.B. All authors have read and agreed to the published version of the manuscript.
Funding
This research received funding from the French Space Study Center (CNES, TOSCA 2021 project), the National Research Institute for Agriculture, Food and the Environment (INRAE) and the RSEAU project financed by the French Environment and Energy Management Agency (ADEME)—Occitanie—Montpellier.
Data Availability Statement
The S2MP maps were obtained from the Theia website (https://www.theia-land.fr/en/product/soil-moisture-with-very-high-spatial-resolution/, accessed on 13 March 2022). The Sentinel-1 and Sentinel-2 data are available via the Copernicus Open Access Hub (https://scihub.copernicus.eu/, accessed on 13 March 2022).
Acknowledgments
Authors wish to thank the French Space Study Center (CNES, TOSCA 2022) and the National Research Institute for Agriculture, Food and Environment (INRAE) and the French Environment and Energy Management Agency (ADEME). The authors also wish to thank the European Space Agency (ESA) for the Sentinel 1 and Sentinel 2 data and Theia pole for the calibration of the Sentinel-2 images. In addition, the authors would like to thank the Regional Directorate of Food, Agriculture and Forest (D.R.A.A.F) of the “Centre Val de Loire” and particularly Gérard Guillaume (DRAAF Centre Val de Loire/SSI), Audrey Oddos (DRAAF Centre Val de Loire/SRISE) and Claudie Suzanne (DRAAF Centre Val de Loire/SSI) for their expertise and the collection of field data in the Orléans study site. Authors would like finally to thank Pascal Dumoulin from SMAVD “Syndicat Mixte d’Aménagement de la Vallée de la Durance” for his expertise and the collection of the field data in PACA region.
Conflicts of Interest
The authors declare no conflict of interest.
References
- Kummu, M.; Guillaume, J.H.A.; de Moel, H.; Eisner, S.; Flörke, M.; Porkka, M.; Siebert, S.; Veldkamp, T.I.E.; Ward, P.J. The World’s Road to Water Scarcity: Shortage and Stress in the 20th Century and Pathways towards Sustainability. Sci. Rep. 2016, 6, 38495. [Google Scholar] [CrossRef] [PubMed] [Green Version]
- Tilman, D.; Clark, M. Food, Agriculture & the Environment: Can We Feed the World & Save the Earth? Daedalus 2015, 144, 8–23. [Google Scholar] [CrossRef]
- Richardson, K.J.; Lewis, K.H.; Krishnamurthy, P.K.; Kent, C.; Wiltshire, A.J.; Hanlon, H.M. Food Security Outcomes under a Changing Climate: Impacts of Mitigation and Adaptation on Vulnerability to Food Insecurity. Clim. Chang. 2018, 147, 327–341. [Google Scholar] [CrossRef] [Green Version]
- Pradipta, A.; Soupios, P.; Kourgialas, N.; Doula, M.; Dokou, Z.; Makkawi, M.; Alfarhan, M.; Tawabini, B.; Kirmizakis, P.; Yassin, M. Remote Sensing, Geophysics, and Modeling to Support Precision Agriculture—Part 2: Irrigation Management. Water 2022, 14, 1157. [Google Scholar] [CrossRef]
- Wei, J.; Dirmeyer, P.A.; Wisser, D.; Bosilovich, M.G.; Mocko, D.M. Where Does the Irrigation Water Go? An Estimate of the Contribution of Irrigation to Precipitation Using MERRA. J. Hydrometeorol. 2013, 14, 275–289. [Google Scholar] [CrossRef]
- Guimberteau, M.; Laval, K.; Perrier, A.; Polcher, J. Global Effect of Irrigation and Its Impact on the Onset of the Indian Summer Monsoon. Clim. Dyn. 2012, 39, 1329–1348. [Google Scholar] [CrossRef]
- Zhang, P.; Ma, W.; Hou, L.; Liu, F.; Zhang, Q. Study on the Spatial and Temporal Distribution of Irrigation Water Requirements for Major Crops in Shandong Province. Water 2022, 14, 1051. [Google Scholar] [CrossRef]
- Kueppers, L.M.; Snyder, M.A.; Sloan, L.C. Irrigation Cooling Effect: Regional Climate Forcing by Land-Use Change. Geophys. Res. Lett. 2007, 34, L03703. [Google Scholar] [CrossRef] [Green Version]
- Cook, B.I.; McDermid, S.S.; Puma, M.J.; Williams, A.P.; Seager, R.; Kelley, M.; Nazarenko, L.; Aleinov, I. Divergent Regional Climate Consequences of Maintaining Current Irrigation Rates in the 21st Century. JGR Atmos. 2020, 125, e2019JD031814. [Google Scholar] [CrossRef]
- Findell, K.L.; Eltahir, E.A. Atmospheric Controls on Soil Moisture–Boundary Layer Interactions. Part II: Feedbacks within the Continental United States. J. Hydrometeorol. 2003, 4, 570–583. [Google Scholar] [CrossRef]
- Ozdogan, M.; Gutman, G. A New Methodology to Map Irrigated Areas Using Multi-Temporal MODIS and Ancillary Data: An Application Example in the Continental US. Remote Sens. Environ. 2008, 112, 3520–3537. [Google Scholar] [CrossRef] [Green Version]
- Bradai, A.; Yahiaoui, I.; Douaoui, A.; Abdennour, M.A.; Gulakhmadov, A.; Chen, X. Combined Modeling of Multivariate Analysis and Geostatistics in Assessing Groundwater Irrigation Sustenance in the Middle Cheliff Plain (North Africa). Water 2022, 14, 924. [Google Scholar] [CrossRef]
- Ozdogan, M.; Yang, Y.; Allez, G.; Cervantes, C. Remote Sensing of Irrigated Agriculture: Opportunities and Challenges. Remote Sens. 2010, 2, 2274–2304. [Google Scholar] [CrossRef] [Green Version]
- Massari, C.; Modanesi, S.; Dari, J.; Gruber, A.; De Lannoy, G.J.M.; Girotto, M.; Quintana-Seguí, P.; Le Page, M.; Jarlan, L.; Zribi, M.; et al. A Review of Irrigation Information Retrievals from Space and Their Utility for Users. Remote Sens. 2021, 13, 4112. [Google Scholar] [CrossRef]
- Motte, E.; Zribi, M.; Fanise, P.; Egido, A.; Darrozes, J.; Al-Yaari, A.; Baghdadi, N.; Baup, F.; Dayau, S.; Fieuzal, R.; et al. GLORI: A GNSS-R Dual Polarization Airborne Instrument for Land Surface Monitoring. Sensors 2016, 16, 732. [Google Scholar] [CrossRef]
- Baghdadi, N.; El Hajj, M.; Choker, M.; Zribi, M.; Bazzi, H.; Vaudour, E.; Gilliot, J.-M.; Ebengo, D. Potential of Sentinel-1 Images for Estimating the Soil Roughness over Bare Agricultural Soils. Water 2018, 10, 131. [Google Scholar] [CrossRef] [Green Version]
- Bazzi, H.; Baghdadi, N.; El Hajj, M.; Zribi, M.; Minh, D.H.T.; Ndikumana, E.; Courault, D.; Belhouchette, H. Mapping Paddy Rice Using Sentinel-1 SAR Time Series in Camargue, France. Remote Sens. 2019, 11, 887. [Google Scholar] [CrossRef] [Green Version]
- Ienco, D.; Interdonato, R.; Gaetano, R.; Ho Tong Minh, D. Combining Sentinel-1 and Sentinel-2 Satellite Image Time Series for Land Cover Mapping via a Multi-Source Deep Learning Architecture. ISPRS J. Photogramm. Remote Sens. 2019, 158, 11–22. [Google Scholar] [CrossRef]
- Bazzi, H.; Baghdadi, N.; Ienco, D.; El Hajj, M.; Zribi, M.; Belhouchette, H.; Escorihuela, M.J.; Demarez, V. Mapping Irrigated Areas Using Sentinel-1 Time Series in Catalonia, Spain. Remote Sens. 2019, 11, 1836. [Google Scholar] [CrossRef] [Green Version]
- Bazzi, H.; Baghdadi, N.; Amin, G.; Fayad, I.; Zribi, M.; Demarez, V.; Belhouchette, H. An Operational Framework for Mapping Irrigated Areas at Plot Scale Using Sentinel-1 and Sentinel-2 Data. Remote Sens. 2021, 13, 2584. [Google Scholar] [CrossRef]
- Dari, J.; Brocca, L.; Quintana-Seguí, P.; Escorihuela, M.J.; Stefan, V.; Morbidelli, R. Exploiting High-Resolution Remote Sensing Soil Moisture to Estimate Irrigation Water Amounts over a Mediterranean Region. Remote Sens. 2020, 12, 2593. [Google Scholar] [CrossRef]
- Dari, J.; Quintana-Seguí, P.; Morbidelli, R.; Saltalippi, C.; Flammini, A.; Giugliarelli, E.; Escorihuela, M.J.; Stefan, V.; Brocca, L. Irrigation Estimates from Space: Implementation of Different Approaches to Model the Evapotranspiration Contribution within a Soil-Moisture-Based Inversion Algorithm. Agric. Water Manag. 2022, 265, 107537. [Google Scholar] [CrossRef]
- Xie, Y.; Lark, T.J. Mapping Annual Irrigation from Landsat Imagery and Environmental Variables across the Conterminous United States. Remote Sens. Environ. 2021, 260, 112445. [Google Scholar] [CrossRef]
- Elwan, E.; Le Page, M.; Jarlan, L.; Baghdadi, N.; Brocca, L.; Modanesi, S.; Dari, J.; Quintana Seguí, P.; Zribi, M. Irrigation Mapping on Two Contrasted Climatic Contexts Using Sentinel-1 and Sentinel-2 Data. Water 2022, 14, 804. [Google Scholar] [CrossRef]
- Potter, C.S.; Brooks, V. Global Analysis of Empirical Relations between Annual Climate and Seasonality of NDVI. Int. J. Remote Sens. 1998, 19, 2921–2948. [Google Scholar] [CrossRef]
- Ji, L.; Peters, A.J. Assessing Vegetation Response to Drought in the Northern Great Plains Using Vegetation and Drought Indices. Remote Sens. Environ. 2003, 87, 85–98. [Google Scholar] [CrossRef]
- Pageot, Y.; Baup, F.; Inglada, J.; Baghdadi, N.; Demarez, V. Detection of Irrigated and Rainfed Crops in Temperate Areas Using Sentinel-1 and Sentinel-2 Time Series. Remote Sens. 2020, 12, 3044. [Google Scholar] [CrossRef]
- Salmon, J.M.; Friedl, M.A.; Frolking, S.; Wisser, D.; Douglas, E.M. Global Rain-Fed, Irrigated, and Paddy Croplands: A New High Resolution Map Derived from Remote Sensing, Crop Inventories and Climate Data. Int. J. Appl. Earth Obs. Geoinf. 2015, 38, 321–334. [Google Scholar] [CrossRef]
- Gao, Q.; Zribi, M.; Escorihuela, M.J.; Baghdadi, N.; Segui, P.Q. Irrigation Mapping Using Sentinel-1 Time Series at Field Scale. Remote Sens. 2018, 10, 1495. [Google Scholar] [CrossRef] [Green Version]
- Escorihuela, M.J.; Quintana-Seguí, P. Comparison of Remote Sensing and Simulated Soil Moisture Datasets in Mediterranean Landscapes. Remote Sens. Environ. 2016, 180, 99–114. [Google Scholar] [CrossRef] [Green Version]
- Lawston, P.M.; Santanello, J.A.; Kumar, S.V. Irrigation Signals Detected From SMAP Soil Moisture Retrievals: Irrigation Signals Detected From SMAP. Geophys. Res. Lett. 2017, 44, 11,860–11,867. [Google Scholar] [CrossRef] [Green Version]
- Qiu, J.; Gao, Q.; Wang, S.; Su, Z. Comparison of Temporal Trends from Multiple Soil Moisture Data Sets and Precipitation: The Implication of Irrigation on Regional Soil Moisture Trend. Int. J. Appl. Earth Obs. Geoinf. 2016, 48, 17–27. [Google Scholar] [CrossRef]
- Bazzi, H.; Ienco, D.; Baghdadi, N.; Zribi, M.; Demarez, V. Distilling Before Refine: Spatio-Temporal Transfer Learning for Mapping Irrigated Areas Using Sentinel-1 Time Series. IEEE Geosci. Remote Sens. Lett. 2020, 17, 1909–1913. [Google Scholar] [CrossRef]
- Talukdar, S.; Singha, P.; Mahato, S.; Pal, S.; Liou, Y.-A.; Rahman, A. Land-Use Land-Cover Classification by Machine Learning Classifiers for Satellite Observations—A Review. Remote Sens. 2020, 12, 1135. [Google Scholar] [CrossRef] [Green Version]
- Zhu, X.X.; Tuia, D.; Mou, L.; Xia, G.-S.; Zhang, L.; Xu, F.; Fraundorfer, F. Deep Learning in Remote Sensing: A Comprehensive Review and List of Resources. IEEE Geosci. Remote Sens. Mag. 2017, 5, 8–36. [Google Scholar] [CrossRef] [Green Version]
- Dari, J.; Quintana-Seguí, P.; Escorihuela, M.J.; Stefan, V.; Brocca, L.; Morbidelli, R. Detecting and Mapping Irrigated Areas in a Mediterranean Environment by Using Remote Sensing Soil Moisture and a Land Surface Model. J. Hydrol. 2021, 596, 126129. [Google Scholar] [CrossRef]
- Dari, J.; Brocca, L.; Quintana-Seguí, P.; Casadei, S.; Escorihuela, M.J.; Stefan, V.; Morbidelli, R. Double-Scale Analysis on the Detectability of Irrigation Signals from Remote Sensing Soil Moisture over an Area with Complex Topography in Central Italy. Adv. Water Resour. 2022, 161, 104130. [Google Scholar] [CrossRef]
- El Hajj, M.; Baghdadi, N.; Zribi, M.; Bazzi, H. Synergic Use of Sentinel-1 and Sentinel-2 Images for Operational Soil Moisture Mapping at High Spatial Resolution over Agricultural Areas. Remote Sens. 2017, 9, 1292. [Google Scholar] [CrossRef] [Green Version]
- Bazzi, H.; Baghdadi, N.; El Hajj, M.; Zribi, M.; Belhouchette, H. A Comparison of Two Soil Moisture Products S2 MP and Copernicus-SSM Over Southern France. IEEE J. Sel. Top. Appl. Earth Obs. Remote Sens. 2019, 12, 3366–3375. [Google Scholar] [CrossRef]
- Bazzi, H.; Baghdadi, N.; El Hajj, M.; Zribi, M. Potential of Sentinel-1 Surface Soil Moisture Product for Detecting Heavy Rainfall in the South of France. Sensors 2019, 19, 802. [Google Scholar] [CrossRef] [Green Version]
- El Hajj, M.; Baghdadi, N.; Zribi, M.; Rodríguez-Fernández, N.; Wigneron, J.P.; Al-Yaari, A.; Al Bitar, A.; Albergel, C.; Calvet, J.-C. Evaluation of SMOS, SMAP, ASCAT and Sentinel-1 Soil Moisture Products at Sites in Southwestern France. Remote Sens. 2018, 10, 569. [Google Scholar] [CrossRef] [Green Version]
- Vachaud, G.; Passerat De Silans, A.; Balabanis, P.; Vauclin, M. Temporal Stability of Spatially Measured Soil Water Probability Density Function. Soil Sci. Soc. Am. J. 1985, 49, 822–828. [Google Scholar] [CrossRef]
- Bazzi, H.; Baghdadi, N.; Fayad, I.; Zribi, M.; Belhouchette, H.; Demarez, V. Near Real-Time Irrigation Detection at Plot Scale Using Sentinel-1 Data. Remote Sens. 2020, 12, 1456. [Google Scholar] [CrossRef]
- Bazzi, H.; Baghdadi, N.; Fayad, I.; Charron, F.; Zribi, M.; Belhouchette, H. Irrigation Events Detection over Intensively Irrigated Grassland Plots Using Sentinel-1 Data. Remote Sens. 2020, 12, 4058. [Google Scholar] [CrossRef]
- Fawcett, T. An Introduction to ROC Analysis. Pattern Recognit. Lett. 2006, 27, 861–874. [Google Scholar] [CrossRef]
- Landis, J.R.; Koch, G.G. The Measurement of Observer Agreement for Categorical Data. Biometrics 1977, 33, 159. [Google Scholar] [CrossRef] [Green Version]
- Le Page, M.; Jarlan, L.; El Hajj, M.M.; Zribi, M.; Baghdadi, N.; Boone, A. Potential for the Detection of Irrigation Events on Maize Plots Using Sentinel-1 Soil Moisture Products. Remote Sens. 2020, 12, 1621. [Google Scholar] [CrossRef]
- El Hajj, M.; Baghdadi, N.; Bazzi, H.; Zribi, M. Penetration Analysis of SAR Signals in the C and L Bands for Wheat, Maize, and Grasslands. Remote Sens. 2018, 11, 31. [Google Scholar] [CrossRef] [Green Version]
Publisher’s Note: MDPI stays neutral with regard to jurisdictional claims in published maps and institutional affiliations. |
© 2022 by the authors. Licensee MDPI, Basel, Switzerland. This article is an open access article distributed under the terms and conditions of the Creative Commons Attribution (CC BY) license (https://creativecommons.org/licenses/by/4.0/).