Abstract
In this study, two cruises were conducted across the mainstream of the Kuroshio off eastern Taiwan before and after the passage of Typhoon Saola in summer 2012. The continuous underway pCO2 (i.e., partial pressure of CO2) measurements revealed that surface seawater pCO2 (SS pCO2) displayed spatial variations in response to typhoon passage. The simulated results showed that the mixed-layer deepening after typhoon passage had a minor effect on SS pCO2 variation because pCO2 decrease driven by temperature dropdown and enhanced biological production fueled by nutrients input was largely compensated by pCO2 increase caused by salinity increase and dissolved inorganic carbon input from the subsurface layer. By contrast, the advection pattern showed significant change before and after the typhoon, which could play a major role in controlling the variation of SS pCO2. In the exit area of the cyclonic eddy, SS pCO2 decreased, while in the area of its arrival, SS pCO2 increased. Besides, the discharge of freshwater and the intrusion of the South China Sea subsurface could result in SS pCO2 increase in the nearshore area. The present study highlights that more advection changes need to be considered to better understand the impact of the typhoon on SS pCO2, especially in the strong current area, such as the Kuroshio.
1. Introduction
Previous studies have demonstrated that typhoons (severe tropical storms also referred to as tropical cyclones or hurricanes) can cause dramatic hydrographic and biogeochemical impacts on marine ecosystems, such as cooling of sea surface temperature, upward mixing, and entrainment of deep salty water rich in nutrients and CO2, and the enhanced biological activities [1,2,3]. Typhoon-triggered entrainment/upwelling prompts strong vertical mixing and breaks stratification in the upper ocean, which can cause prominent sea surface cooling, thereby reducing partially pressure of CO2 (pCO2; [2,3,4,5]). The effect of salinity on pCO2 is another thermodynamic manifestation of the changes in the solubility of CO2 and the dissociation constants of carbonic acid in seawater [6]. For example, a wing pump by a tropical cyclone that supplies much salinity causing the increased sea surface pCO2 was reported in the North Atlantic Ocean [7].
A number of studies have reported that hurricanes (or typhoons) increase surface pCO2 and summertime CO2 efflux, mainly due to upward mixing and entrainment of deep water enriched in CO2 during the typhoon passage [2,7,8,9,10]. In contrast, some recent observations have shown net uptake of sea surface CO2 associated with the passage of typhoons over the continental shelf and continental margin, as a result of the enhancements in primary production fueled by the nutrients brought up from the deep water [3].
These previous studies have shown that the impact of typhoons on surface seawater pCO2 (SS pCO2) varies significantly among different regions. Therefore, observations in different oceanic regimes are still required to better understand the typhoon effect on a global scale. However, to our knowledge, the impact of the typhoon on SS pCO2 has never been investigated in a western boundary current regime. In this study, we conducted two cruises across the mainstream of the Kuroshio off eastern Taiwan before and after a typhoon passage. During the two cruises, we concurrently conducted continuous underway pCO2 measurements and collected hydrological (i.e., temperature, salinity, nitrate, and Chlorophyll (Chl) a) and carbonate chemistry data (i.e., pH, dissolved inorganic carbon (DIC), and total alkalinity (TA) at nine hydrological stations. Additionally, the current structure along the cruise transect was recorded by a shipboard acoustic Doppler current profiler, and absolute geostrophic currents in the study area before and after typhoon were estimated using the satellite-measured sea level anomalies from the Copernicus Marine Environment Monitoring Service (CMEMS). Using this comprehensive data set, we first separated the respective contributions of temperature, salinity, CO2, and nitrate inputs (i.e., potential biological production) to the observed SS pCO2 variations after typhoon passage, associated with the typhoon-induced mixed-layer deepening. The relationship between the alteration in advection pattern and the variation in SS pCO2 was further examined. The present study thus provides us a rare opportunity to investigate the potential impact of the typhoon on SS pCO2 variation in the western boundary current regime.
2. Materials and Methods
2.1. Study Sites and Sampling
The Kuroshio is the western boundary current of the North Pacific’s subtropical gyre, originating from the northward bifurcation of the North Equatorial Current off the east coast of Luzon and flowing more than 3000 km past Taiwan to the southeast coast of Japan [11]. Off east of Taiwan, the Kuroshio is a relatively stable current with a climatological width of ~100 km and a maximum velocity of ~1 ms−1 at 15 m depth [12]. Additionally, Kuroshio is also known to considerably change its water property in its onshore flank due to the South China Sea (SCS) subsurface outflow as it bypasses the Luzon Strait [13].
In this study, nine hydrological stations along a transect across the Kuroshio off the east coast of Taiwan were visited twice aboard the R/V Ocean Research II (Figure 1). The two cruises were conducted from 26 to 30 July and from 4 to 6 August 2012, respectively. During this period, typhoon Saola, a strong tropical cyclone with the highest winds up to 130 km h−1 and the lowest pressure approaching 960 kPa, passed through the study area from 31 July to 3 August. Therefore, the first and the second cruise were used to represent the pre-typhoon (4 days before) and post-typhoon (3 days after) conditions.
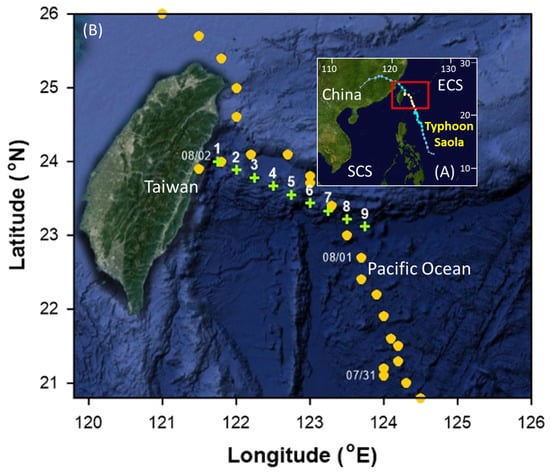
Figure 1.
Locations of sampling sites off eastern Taiwan and the inserted map showing the full path of typhoon Saola in the northwest Pacific Ocean.
During these cruises, the current velocity along the ship track was measured by a 150 kHz shipboard acoustic Doppler current profiler (ADCP; Teledyne RD Instruments Inc., San Diego, CA, USA). The underway pCO2 measurements were made with a continuous flow equilibration system (AS-P2, Apollo SciTech Inc., Newark, DE, USA), which pumped seawater into the system from an inlet at 3–4 m on R/V Ocean Researcher II. The equilibrated headspace gas was dried by a Peltier cooler and a dry tube filled with magnesium perchlorate (Mg(ClO4)2) before it flowed into a nondispersive infrared spectrometer (LI-COR 7000), which was calibrated every 4 h against a CO2-free reference gas (N2) and three gas standards (the xCO2 of the three standards was 146.6, 363.2, and 523.2 ppm, respectively, traceable to NIST, National Institute of Standards and Technology). The measured xCO2 data were converted into surface water pCO2 by correcting to 100% humidity and to in situ water temperature, according to [14]. The accuracy and precision of the system were better than 2 ppm. Surface seawater temperature and salinity were measured just before the equilibration by the thermosalinograph (SBE 45, Sea-Bird Electronics, Bellevue, WA, USA).
At each hydrographic station, depth profiles of temperature and salinity were recorded using a Seabird SBE9/11-plus conductivity-temperature-depth (CTD) system. Discrete water samples were collected at twelve depths of 3, 10, 25, 50, 75, 100, 125, 150, 175, 200, 250, and 300 m, using 20 L Go-Flo bottles mounted onto a rosette sampling assembly. Subsamples for DIC and TA analyses were transferred into 350 mL pre-cleaned borosilicate bottles, and 200 μL of HgCl2—saturated solution was immediately added. Subsamples for the determination of nitrate concentrations were placed in 100 mL polypropylene bottles and frozen with liquid nitrogen immediately. Water samples for Chl a analysis were quickly filtered through a GF/F filter paper (Whatman, 47 mm, MERCK, Darmstadt, Germany), and the filter paper was stored at −20 °C.
The satellite-measured sea level anomalies (SLAs) and estimated absolute geostrophic currents were obtained from the CMEMS to study synoptic ocean currents and eddies. These satellite data are provided at 1/4° resolution, available daily since the end of 1992. To compare the observed temperature-salinity (T-S) properties of water with those climatological fields, we used the dataset from synoptic monthly gridded three-dimensional World Ocean Atlas version 2018, at 1° resolution, provided by the National Oceanic and Atmospheric Administration.
2.2. Analytical Methods
The measurements of TA, DIC, and pH followed the standard methods reported in [15] and were consistent with those used in our previous studies [16,17]. TA was measured using Gran titration on an automatic TA titrator (AS-ALK2, Apollo SciTech Inc.). DIC was measured using the nondispersive infrared method on a DIC analyzer (AS-C3, Apollo SciTech Inc.). The alkalinity titrator and DIC analyzer were calibrated using certified reference materials (CRMs) obtained from Dr. A. Dickson’s laboratory at the Scripps Institution of Oceanography. The accuracy and precision for both analytical TA and DIC measurements were ±0.15% or better. Determination of pH was based on the method described [18] and spectrophotometrically determined at 25 °C, with a precision of 0.005 on the total hydrogen ion concentration scale. Nitrate was analyzed with a custom-made flow injection analyzer. The precision for the nitrate analysis was 0.3 μmol kg−1, based on six duplicated measurements of a reference solution with a concentration of 10 μmol kg−1. Chl a retained on the GF/F filters was determined fluorometrically on a Turner Design 10-AU-005 field fluorometer. Detailed descriptions of nitrate and Chl a analyses have been described earlier [19].
2.3. Statistical Analyses
Differences in the means of temperature, salinity, in situ pCO2, and npCO2 at 29.1 °C before and after the typhoon passage were assessed using a Two-Sample t-test [20]. All statistical analyses were performed with a TTEST procedure in the SAS 9.4 software package [21].
3. Results
3.1. Spatial Variations of Temperature, Salinity, and pCO2 in the Sea Surface Water before and after the Passage of Typhoon Saola
The spatial variations of temperature, salinity, and pCO2 in the sea surface water (3–4 m) before and after the passage of typhoon Saola are shown in Figure 2. Before and after the typhoon passage, sea surface temperature (SST) generally increased eastwards from the nearshore area to ~122.5° E and to 122.0° E, respectively, and then decreased to ~123° E, and gradually increased again to the far coastal zone. The variation range was 28.1 to 30.9 °C and 28.6 to 29.5 °C before and after the typhoon passage, respectively (Figure 2A). Generally, SST was not significantly different in the area west of ~122.0° E between the typhoon passage, while it decreased significantly by an average of ∼0.6 °C (29.0 ± 0.2 °C vs. 29.6 ± 0.6 °C; p < 0.01) in the area east of ~122.0° E after typhoon passage. SSS increased eastwards from the nearshore area to ~122.0° E and then remained at a relatively constant level of ~33.7 and ~34.2 before and after typhoon passage (Figure 2B), respectively, in the east area of 122.0° E, where the average SSS was significantly higher by ~0.9 after typhoon compared with that before typhoon (34.0 ± 0.5 vs. 33.1 ± 0.5; p < 0.01). Mixed-layer depth (MLD), defined as the surface layer with a potential density variation less than 0.1 kg m−3 [19], generally deepened eastwards from the nearshore area to ~122.5° E and then shallowed to the far coastal zone. The variation range was 11 to 33 m and 19 to 59 m before and after the passage of the typhoon, respectively (Figure 2C). In terms of average values, the MLD was significantly deeper after than those before the typhoon passage (41.8 ± 4.5 m vs. 21.8 ± 2.3 m; p < 0.05).
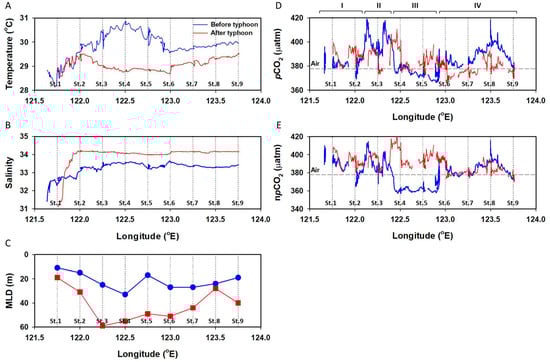
Figure 2.
Underway measurements of (A) surface temperature, (B) salinity, (C) mixed-layer depth (MLD), (D) pCO2, and (E) temperature normalized pCO2 (npCO2) during the pre-typhoon (blue line) and the post-typhoon (red line) cruises. Gray dash line in (D,E) refers to the monthly average atmosphere pCO2 during the study period.
Sea surface (SS) pCO2 showed remarkable spatial variations during the two cruises, which varied within a range from ~360 to 420 μatm (Figure 2D). To examine the SS pCO2 response to the typhoon passage, we divided the entire transect into four sub-zones; in Zones I (~ 121.5–122° E) and III (~122.5–123° E), SS pCO2 was generally higher after the typhoon than that before the typhoon (Zone I: 388 ± 6 µatm vs. 380 ± 4 µatm, p < 0.01; Zone III: 383 ± 7 µatm vs. 375 ± 5 µatm, p < 0.01 in), while in Zones II (~122–122.5° E) and IV (~ 123–124° E), SS pCO2 was commonly lower after the typhoon than that before the typhoon (Zone II: 381 ± 8 µatm vs. 398 ± 9 µatm, p < 0.01; Zone IV: 376 ± 5 µatm vs. 385 ± 10 µatm, p < 0.01) (Figure 2D). Furthermore, to eliminate the effect of temperature on the pCO2 variations, pCO2 was corrected to the average temperature of 29.1 °C (npCO2), as shown in Figure 2E. Despite the spatial variations, overall, the average SS pCO2 was significantly lower after the typhoon than that before the typhoon (379 ± 7 µatm vs. 383 ± 11 µatm; p < 0.01), while the average npCO2 was significantly higher after the typhoon than that before typhoon (386 ± 9 µatm vs. 376 ± 12 µatm; p < 0.01).
3.2. Depth Distributions of Temperature, Salinity, DIC, TA, pH, Nitrate, and Chl a before and after the Passage of Typhoon Saola
Depth distributions of temperature, salinity, DIC, TA, pH, nitrate, and Chl a before and after the typhoon passage at nine hydrological stations are shown in Figure 3. As a typical feature in the ocean, temperature generally decreases with increasing depth. On close examination, a striking feature, however, is readily seen in the subsurface layer (~50–200 m), where the temperature was higher after the typhoon than that before the typhoon at the same depth at stations one, six, seven, and eight, whereas temperature was lower after the typhoon than that before the typhoon at stations three and four (Figure 3A). Salinity generally increased with increasing depth to a maximum of ~34.9 at the depth range between 100 to 150 m and then decreased slightly with depth. A sharper vertical salinity increasing trend was observed at the nearshore station (stations one and two; Figure 3B), suggesting the influence of freshwater input in the nearshore area. Similar to the vertical distribution of temperature, salinity in the subsurface layer also showed some remarkable variations before and after the typhoon passage. For example, salinity in the subsurface layer seemed to be higher after the typhoon than that before the typhoon at stations three and four, while it appeared to be lower at stations one, two, six, and seven.
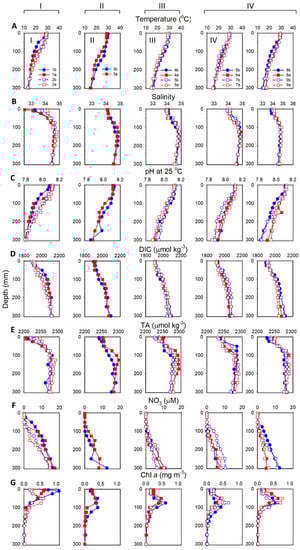
Figure 3.
Comparison of the vertical distributions of (A) temperature, (B) salinity, (C) pH at 25 °C, (D) dissolved inorganic carbon (DIC), (E) total alkalinity (TA), (F) NO3, and (G) Chl a concentration at the nine hydrological stations before (blue symbols) and after the typhoon (red symbols) passage. The nine stations were grouped into four subzones based on the pCO2 variations before and after typhoon passage (Zone I, stations 1 and 2; Zone II, station 3; Zone III, stations 4 and 5; and Zone IV, stations 6, 7, 8 and 9; see text for the details).
For carbonate chemistry parameters, pH generally decreased with increasing depth (Figure 3C), whereas DIC increased with depth (Figure 3D). The vertical distribution of TA mimicked the pattern of salinity, increased gradually to a maximum at ~100–150 m, and then decreased slightly with depth (Figure 3E). The close correlation between TA and salinity suggests that salinity was the dominant factor controlling the vertical distribution of TA. Likewise, carbonate chemistry parameters in the subsurface layer also revealed some notable variations before and after typhoon passage. Generally, pH in the subsurface layer was higher after the typhoon than that before the typhoon at stations one, two, seven, and eight, but it was lower at stations three and four. In contrast, DIC in the subsurface layer was higher after typhoon than that before typhoon at stations three and four, but it was lower at stations one, two, seven, and eight.
Nitrate concentration was generally under the detection limit (0.2 μM) within the top 50 m and then increased with depth, while the surface low-nitrate layer expanded to the depth of approximately 100 m before typhoon (Figure 3F), suggesting that the nitracline should be shallower after typhoon passage. Chl a concentration generally increased with depth before reaching the subsurface Chl a maximum (SCM), which was between 50 and 100 m, and then decreased sharply (Figure 3G). However, the SCM was not found at station one before the typhoon passage.
In summary, the most striking variations in the vertical distributions of hydrological and carbonate parameters before and after typhoon passage were observed in the subsurface layer, which showed two contrasting patterns between stations 3 and 4 and stations 7 and 8. In stations 3 and 4, temperature and pH were lower, but salinity and DIC were higher after typhoon than those before the typhoon. In contrast, in stations 7 and 8, temperature and pH were higher, but salinity and DIC were lower after typhoon than those before the typhoon. This contrasting pattern in the variations of hydrological and carbonate parameters in the subsurface layer implies that there might be spatially various alterations in the horizontal advection pattern before and after typhoon passage, which has been further examined in the following Discussion section.
4. Discussion
4.1. Typhoon Effects on Surface pCO2
Typhoon generally leads to surface cooling, precipitation, and mixed-layer deepening, which may change temperature, salinity, and chemical characteristics such as TA, DIC, and nutrient concentrations in surface water, thereby influencing local variations of SS pCO2 [2,3,7,8,9,22,23]. To clarify the processes controlling the SS pCO2 variations as typhoons pass through the study area, we quantified the respective contributions from temperature, salinity, TA and DIC input, and potential biological effect (i.e., nutrients input) to the observed SS pCO2 variations at nine hydrographic stations by the following equations:
where ΔpCO2.Obs represents the observed pCO2 difference before and after the typhoon passage (i.e., pCO2.aft − pCO2.bef), which can be further expressed as the sum of pCO2 change caused by the variations in temperature (ΔpCO2.T), salinity (ΔpCO2.S), TA and DIC input (ΔpCO2.C), biological effect (ΔpCO2.B), and other effect (ΔpCO2.O; e.g., change in advection pattern).
ΔpCO2.Obs = pCO2.aft − pCO2.bef
= ΔpCO2.T + ΔpCO2.S + ΔpCO2.C + ΔpCO2.B + ΔpCO2.O
= ΔpCO2.T + ΔpCO2.S + ΔpCO2.C + ΔpCO2.B + ΔpCO2.O
ΔpCO2.T = pCO2@(DIC.M.bef, TA.M.bef, S.bef, [T.aft − T.bef])
ΔpCO2.S = pCO2@(DIC.M.bef, TA.M.bef, [S.aft − S.bef], T.bef)
ΔpCO2.C = pCO2@([DIC.M.aft − DIC.M.bef], [TA.M.aft − TA.M.bef], S.bef, T.bef)
ΔpCO2.B = pCO2@([−(NO3.M.aft − NO3.M.bef) × R], TA.M.bef, S.bef, T.bef)
ΔpCO2.O = ΔpCO2.Obs − (ΔpCO2.T + ΔpCO2.S + ΔpCO2.C + ΔpCO2.B)
For the calculation of ΔpCO2.T, ΔpCO2.S, ΔpCO2.C, and ΔpCO2.B, surface temperature and salinity, and the average DIC, TA, and NO3 in the MLD (DIC.M, TA.M, NO3.M) before the typhoon was set as the initial condition [24]. ΔpCO2.T, ΔpCO2.S, and ΔpCO2.C are computed based on the differences in temperature, salinity, and TA and DIC before (T.bef, S.bef, TA.M.bef, DIC.M.bef) and after (T.aft, S.aft, TA.M.aft, DIC.M.aft) typhoon passage on initial pCO2 (Equations (2)–(4)). Biological effect (ΔpCO2.B) was estimated based on the differences in NO3.M.aft and NO3.M.bef, and the subsequent uptake C/N ratio (R) by the stimulated biological production (Redfield ratio = 6.6, R in Equation (5)). Finally, ΔpCO2.O represents the part of ΔpCO2.Obs that cannot be explained by the changes in temperature, salinity, and TA, DIC, and nitrate inputs induced by the enhanced vertical mixing after typhoon passage, which is computed as the difference between ΔpCO2.Obs and the sum of ΔpCO2.T, ΔpCO2.S, ΔpCO2.C, and ΔpCO2.B (Equation (6)).
The calculated results are shown in Figure 4 and Table 1. Because thermodynamically temperature decrease leads to pCO2 reduction, the observed temperature decrease induced by the cooling effect and the enhancement of vertical mixing after typhoon passage would have produced negative ΔpCO2.T values [2,3], ranging from −2 to −29 μatm with an average value of −13 μatm (Figure 4B). The most pronounced temperature-induced pCO2 decrease (ΔpCO2.T) was observed at stations 3, 4, 5, and 6, located in Zones II and III, which also showed the largest temperature decrease (Figure 2B). In contrast, the temperature decrease was generally smaller, and thus, ΔpCO2.T was lower at the other stations in Zones I (stations 1 and 2) and IV (stations 7, 8, and 9). The larger temperature decrease in Zones II and III could be associated with the combined effect of MLD deepening (Figure 4H) and the arrival of cold eddy (Figure 5) after typhoon passage, while the smaller temperature decrease in Zones I and IV could be related to the movement of Kuroshio towards the shore and the disappearance of cold eddy after the typhoon passage (Figure 5), respectively, both of which could partially compensate the temperature decrease induced by cooling effect and MLD deepening.
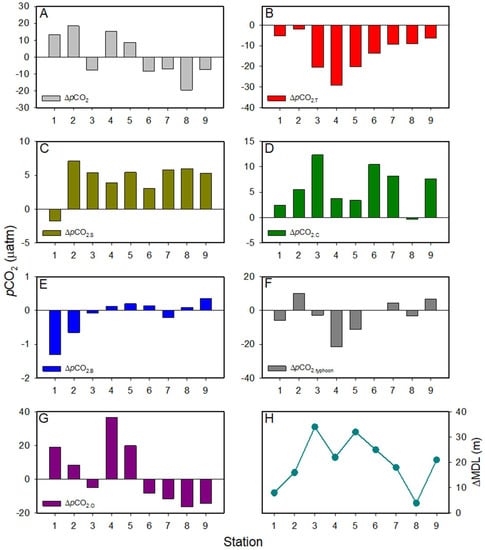
Figure 4.
(A) The observed differences of pCO2 (ΔpCO2.Obs) before and after the typhoon passage at the nine hydrological stations; (B–G), the contributions of temperature (ΔpCO2.T, (B)), salinity (ΔpCO2.S, (C)), dissolved inorganic carbon/total alkalinity (DIC/TA) input (ΔpCO2.C, (D)), and nutrient input (i.e., biological production, ΔpCO2.B, (E) to the observed ΔpCO2; (F) the sum of the contributions of the typhoon-related effects (ΔpCO2.typhoon = ΔpCO2.T + ΔpCO2.S + ΔpCO2.C + ΔpCO2.B); (G) the contribution of non-typhoon-related effect to the observed ΔpCO2; and (H) the variations of mixed-layer depth (ΔMLD) before and after the typhoon passage.

Table 1.
Summary of the difference in surface seawater temperature (ΔSST), surface seawater salinity (ΔSSS), mixed-layer depth (ΔMLD), pCO2 (ΔpCO2), temperature-normalized npCO2 (ΔnpCO2), as well as average dissolved inorganic carbon (ΔDIC), TA (ΔTA), and nitrate (ΔNO3) in the mixed layer before and after the typhoon passage at the nine hydrological stations, which were grouped into four subzones based on the pCO2 variations (Zone I, stations one and two; Zone II, station three; Zone III, stations four and five; and Zone IV, stations six, seven, eight, and nine; see text for the details).
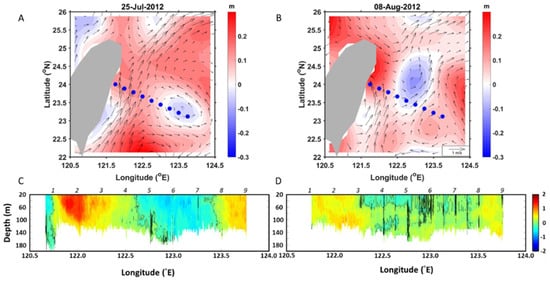
Figure 5.
Spatial variations of satellite-observed sea level anomalies (units in meters, color shading, (A,B)) and geostrophic currents (vectors, (A,B)), and acoustic Doppler current profiler-observed meridional current velocity profile through the sampling transect offshore of eastern Taiwan (C,D), before the typhoon (25 July in A and 27~28 July in (C)) and after the typhoon (8 August in (B) and 4~5 in August (D)). For clarity, alternate current vectors with two grid points skipping are presented in (A,B). The blue circles represent the locations of nine sampling stations in (A,B).
Since salinity generally increased with depth before reaching the salinity maximum depth (Figure 3B), the enhanced vertical mixing would have resulted in an increase in SSS in the study area, except at station 1, where SSS decreased after typhoon passage, probably due to freshwater discharge (Figure 2B). An increase in salinity would cause an increase in pCO2, and vice versa, by affecting the thermodynamic constants. Consequently, the calculated results showed positive ΔpCO2.S values at all stations (except station 1) within a narrow range between 3 and 7 μatm, while ΔpCO2.S was −2 μatm at station 1 (Figure 4C). Compared with temperature, salinity had a minor effect on SS pCO2 variations in response to typhoon passage.
The enhanced vertical mixing may bring subsurface water that is replete in DIC and TA into the surface layer and therefore may cause SS pCO2 variations. The calculated results showed a generally positive ΔpCO2.C at all stations (except station 8; Figure 4D), suggesting that the input of DIC may play a more significant role than TA input in regulating SS pCO2 variations, providing that DIC increment would increase pCO2, but TA increment would decrease pCO2. At station 8, MLD merely deepened 3 m after typhoon passage so that ΔpCO2.C was very close to null.
The potentially subsequent elevated biological production stimulated by the nutrient input via enhanced vertical mixing had a nearly negligible impact on SS pCO2 variation at stations 3 to 9, as shown by ΔpCO2.B, which was very close to zero (Figure 4E). This may reflect the fact that the nitracline is relatively deep in the study area, so the enhanced deepening of MLD could transport limited nitrate into the surface layer (Figure 3F), which was further supported by the little change in Chl a concentration before and after the typhoon passage (Figure 3G).
4.2. Non-Typhoon on Surface pCO2
As shown in Figure 4G, the calculated ΔpCO2O (i.e., another effect on SS pCO2 variation) varied substantially within a range between −16 to 37 μatm, which was generally larger than the ΔpCO2.typhoon. Furthermore, ΔpCO2.O revealed a very similar spatial variation pattern as ΔpCO2.Obs. From these lines of evidence, we suggest that ΔpCO2.O could be the dominant process controlling the variations of SS pCO2 after typhoon passage in the study area.
According to previous studies, the core of cyclonic eddies is characterized by lower sea level and shallower pycnocline [25] due to eddy-driven upwelling, consequently increasing SS pCO2 [9,10,26]. Thus, in this study, we examined the potential impact of ocean eddies/currents on SS pCO2 variations after the typhoon passage by comparing the spatial distribution of SLAs and geostrophic flow before and after the typhoon from 25 July to 8 August 2012 (Figure 5). On July 25, before the typhoon occurred, a cyclonic eddy was detected far offshore in Zone IV and east of Zone III (Figure 5A). Then, the cyclonic eddy propagated westward and reached Zone III on 8 August (Figure 5B), after the typhoon. Such propagating cyclonic eddy could induce upwelling in Zone IV before the typhoon and in Zone III after the typhoon. Thus, the observed SS pCO2 decreased in Zone IV but increased in Zone III (Figure 4G) after the typhoon passage in this area, probably due to the exit and arrival of the cyclonic eddy in Zone IV and Zone III, respectively.
Moreover, from 25 July to 8 August 2012, the Kuroshio flowed through Zone I and varied with the cyclonic eddy approaching from the east (Figure 5). The Kuroshio became weaker and narrower (Figure 5C,D) when impinging with the cyclonic eddy after the typhoon passage, concurrent with that reported by [25]. In the same region after the typhoon, near-surface salinity decreased significantly above the 22-kg/m3 isopycnic at Station 1 (Figure 6), suggesting the influence of the freshwater discharge near the surface in this area. Additionally, the water T-S properties at Station 1 before the typhoon were very close to that of the SCS (Figure 6), suggesting the influence of the outflowing SCS subsurface water. Previous studies have shown that the outflowing SCS water may induce high biological production and activities in the Kuroshio off eastern Taiwan [13,27,28], which could be favorable for the SS pCO2 dropdown before the typhoon. In contrast, freshwater from terrestrial sources generally tends to have higher pCO2. Therefore, the SCS water intrusion into the area east of Taiwan before the typhoon, along with more freshwater discharge after the typhoon, may explain the increase in the observed SS pCO2 in Zone I after typhoon (Figure 4G).
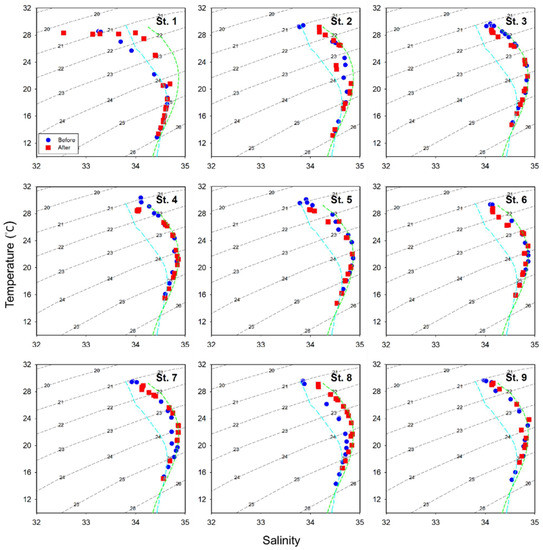
Figure 6.
Comparison of T-S diagrams before (blue symbols) and after (red symbols) the typhoon passage at the nine hydrological stations. Cyan and green lines refer to the typical T-S diagrams for the South China Sea water and the Kuroshio water, respectively, according to data from [13,29].
5. Conclusions
In this study, SS pCO2 showed spatially different variations from the near coast area to the far offshore area after the typhoon passage (Figure 7): SS pCO2 increased after typhoon passage with an average of 16 μatm and 12 μatm in Zone I (121.70–122.10° N, included stations 1 and 2) and Zone III (122.41–122.93° N, included stations 4 and 5), while SS pCO2 decreased with an average of −8 μatm and −11 μatm in Zone II (122.10–122.41° N, included station 3) and Zone IV (122.93–123.75° N, included stations 6 to 9), respectively.
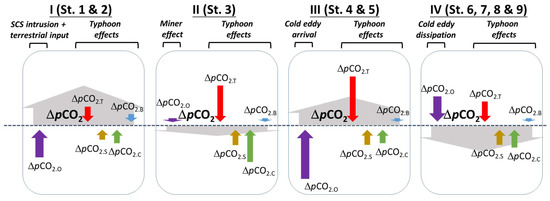
Figure 7.
Schematic diagram showing the relative contributions of typhoon-related effects (i.e., temperature (ΔpCO2.T; red arrow), salinity (ΔpCO2.S; brown arrow), dissolved inorganic carbon/total alkalinity (DIC/TA) (ΔpCO2.C; green arrow), and nutrient inputs(ΔpCO2.B; blue arrow) and other effects (ΔpCO2.O; purple arrow) to the observed pCO2 variations (grey arrow) after typhoon passage in the four subzones (Zone I, stations 1 and 2; Zone II, station 3; Zone III, stations 4 and 5; and Zone IV, stations 6, 7, 8 and 9; see text for the details).
Among the four sub-areas, Zone II was the only area that did not reveal noticeable alteration in advection pattern before and after typhoon passage (i.e., arrival and exit of the cyclonic eddy, intrusion of SCS water, and freshwater discharge). Also, Zone II showed the smallest SS pCO2 variation after typhoon passage, in which pCO2 decrease driven by temperature dropdown and potential biological production enhancement fueled by nutrients input was nearly compensated by the increase in pCO2 caused by salinity increase and DIC input from the subsurface layer. We suggest that the condition in Zone II could be representative of the impact of typhoon passage on the SS pCO2 variation without the influence of advection changes in the study area. Therefore, the exit of cyclonic eddy in Zone IV could well explain the observed SS pCO2 decrease after typhoon passage, as eddy–driven upwelling generally leads to higher SS pCO2 than that in the surrounding water. By contrast, the arrival of cyclonic eddy could be the dominant process resulting in the observed SS pCO2 increase in Zone III after typhoon passage. In addition, the intrusion of SCS water before the typhoon and terrestrial input after the typhoon could collectively explain the observed SS pCO2 increase after typhoon passage in Zone I.
In summary, the present findings suggest that in addition to the enhanced vertical mixing effect, the alteration of advection pattern, e.g., eddy movement and the Kuroshio itself, could also play an important role in controlling the variation of SS pCO2 after typhoon passage, and thus demonstrate the need for more focus on advection changes to better understand the impact of the typhoon on SS pCO2, particularly in the strong current area (such as Kuroshio).
Author Contributions
Conceptualization, L.-F.F. and W.-C.C.; Data curation, L.-F.F., C.H.C., G.-C.G. and W.-C.C.; Formal analysis, L.-F.F. and C.H.C.; Funding acquisition, W.-C.C.; Investigation, W.-C.C.; Methodology, C.H.C. and G.-C.G.; Resources, W.-C.C.; Software, C.H.C.; Validation, C.H.C. and W.-C.C.; Visualization, L.-F.F. and C.H.C.; Writing—original draft, L.-F.F., C.H.C. and W.-C.C.; Writing—review & editing, G.-C.G. All authors have read and agreed to the published version of the manuscript.
Funding
This research was funded by the Ministry of Science and Technology of Taiwan grant number 110-2611-M-019-012.
Institutional Review Board Statement
Not applicable.
Informed Consent Statement
Not applicable.
Data Availability Statement
Data used in this study are duly available from the corresponding author on reasonable request.
Acknowledgments
We are grateful to the captain, crew and technicians of the R/V Ocean Researcher II for shipboard operation and water sampling. Constructive comments from four anonymous reviewers have greatly improved the manuscript. We thank Mi-Shuan Lee for the help with the field and laboratory work.
Conflicts of Interest
The authors declare no conflict of interest.
References
- Zhai, W.D.; Dai, M.H.; Cai, W.J.; Wang, Y.C.; Hong, H.S. The partial pressure of carbon dioxide and air-sea fluxes in the northern South China Sea in spring, summer and autumn. Mar. Chem. 2005, 96, 87–97. [Google Scholar] [CrossRef]
- Nemoto, K.; Midorikawa, T.; Wada, A.; Ogawa, K.; Takatani, S.; Kimoto, H.; Ishii, M.; Inoue, H.Y. Continuous observations of atmospheric and oceanic CO2 using a moored buoy in the East China Sea: Variations during the passage of typhoons. Deep. Sea Res. 2 Top. Stud. Oceanogr. 2009, 56, 542–553. [Google Scholar] [CrossRef] [Green Version]
- Yu, P.; Wang, Z.A.; Churchill, J.; Zheng, M.; Pan, J.; Bai, Y.; Liang, C. Effects of typhoons on surface seawater pCO2 and air—sea CO2 fluxes in the northern South China Sea. J. Geophy. Res. Oceans 2020, 125, e2020JC016258. [Google Scholar] [CrossRef]
- Ning, J.; Xu, Q.; Zhang, H.; Wang, T.; Fan, K. Impact of cyclonic ocean eddies on upper ocean thermodynamic response to typhoon Soudelor. Remote Sens. 2019, 11, 938. [Google Scholar] [CrossRef] [Green Version]
- Yu, J.; Lin, S.; Jiang, Y.; Wang, Y. Modulation of Typhoon-Induced Sea Surface Cooling by Preexisting Eddies in the South China Sea. Water 2021, 13, 653. [Google Scholar] [CrossRef]
- Takahashi, T.; Sutherland, S.C.; Wanninkhof, R.; Sweeney, C.; Feely, R.A.; Chipman, D.W.; Hales, B.; Friederich, G.; Chavez, F.; Sabine, C.; et al. Climatological mean and decadal change in surface ocean pCO2, and net air-sea CO2 flux over the global oceans. Deep.-Sea Res. II Top. Stud. Oceanogr. 2009, 56, 554–577. [Google Scholar] [CrossRef]
- Ye, H.; Morozov, E.; Tang, D.; Wang, S.; Liu, Y.; Li, Y.; Tang, S. Variation of pCO2 concentrations induced by tropical cyclones “Wind-Pump” in the middle-latitude surface oceans: A comparative study. PLoS ONE 2020, 15, e0226189. [Google Scholar] [CrossRef] [Green Version]
- Bates, N.R.; Knap, A.H.; Michaels, A.F. Contribution of hurricanes to local and global estimates of air—Sea exchange of CO2. Nature 1998, 395, 58–61. [Google Scholar] [CrossRef]
- Hood, E.M.; Wanninkhof, R.; Merlivat, L. Short timescale variations of fCO2 in a North Atlantic warm—Core eddy: Results from the Gas-Ex 98 carbon interface ocean atmosphere (CARIOCA) buoy data. J. Geophys. Res. 2001, 106, 2561–2572. [Google Scholar] [CrossRef]
- Sun, Q.Y.; Tang, D.L.; Legendre, L.; Shi, P. Enhanced air-sea CO2 exchange influenced by a tropical depression in the South China Sea. J. Geophys. Res. Ocean. 2014, 119, 6792–6804. [Google Scholar] [CrossRef]
- Jan, S.; Yang, Y.J.; Wang, J.; Mensah, V.; Kuo, T.-H.; Chiou, M.-D.; Chern, C.-S.; Chang, M.-H.; Chien, H. Large variability of the Kuroshio at 23.75° N east of Taiwan. J. Geophys. Res. Oceans 2015, 120, 1825–1840. [Google Scholar] [CrossRef]
- L12. Liang, W.-D.; Tang, T.Y.; Yang, Y.J.; Ko, M.T.; Chuang, W.-S. Upper-ocean currents around Taiwan. Deep Sea Res. 2 2003, 50, 1085–1105. [Google Scholar] [CrossRef]
- Chou, W.C.; Sheu, D.D.; Chen, C.T.A.; Wen, L.S.; Yang, Y.; Wei, C.L. Transport of the South China Sea subsurface water outflow and its influence on the carbon chemistry of Kuroshio waters off southeastern Taiwan. J. Geophys. Res. 2007, 112, C12008. [Google Scholar] [CrossRef]
- Pelletier, G.J.; Lewis, E.; Wallace, D.W.R. CO2SYS.XLS: A Calculator for the CO2 System in Seawater for Microsoft Excel/VBA. Version 16; Washington State Department of Ecology: Olympia, WA, USA, 2011. [Google Scholar]
- Dickson, A.G.; Millero, F.J. A comparison of the equilibrium constants for the dissociation of carbonic acid in seawater media. Deep. Sea Res. A 1987, 34, 1733–1743. [Google Scholar] [CrossRef]
- Chou, W.-C.; Fan, L.-F.; Yang, C.-C.; Chen, Y.-H.; Hung, C.-C.; Huang, W.-J.; Shih, Y.-Y.; Soong, K.; Tseng, H.-C.; Gong, G.-C.; et al. A Unique Diel Pattern in Carbonate Chemistry in the Seagrass Meadows of Dongsha Island: The Enhancement of Metabolic Carbonate Dissolution in a Semienclosed Lagoon. Front. Mar. Sci. 2021, 8, 717685. [Google Scholar] [CrossRef]
- Fan, L.-F.; Qiu, S.-Q.; Chou, W.-C. Carbonate chemistry of the Dongsha Atoll Lagoon in the northern South China Sea. Terr. Atmos. Ocean. Sci. 2021, 32, 399–409. [Google Scholar] [CrossRef]
- Clayton, T.D.; Byrne, R.H. Spectrophotometric seawater pH measurements: Total hydrogen ion concentration scale calibration of m-cresol purple and at-sea results. Deep. Sea Res. 1 1993, 40, 2115–2129. [Google Scholar] [CrossRef]
- Gong, G.-C.; Chang, J.; Wen, Y.-H. Estimation of annual primary production in the Kuroshio waters northeast of Taiwan using a photosynthesis-irradiance model. Deep Sea Res. 1 1999, 46, 93–108. [Google Scholar] [CrossRef]
- Montgomery, D.C. Design and Analysis of Experiments, 8th ed.; John Wiley and Sons: Hoboken, NJ, USA, 2012; p. 730. [Google Scholar]
- SAS Institute. SAS User’s Guide: Statistics, Release 9.1; SAS Institute: Cary, NC, USA, 2003. [Google Scholar]
- Hung, C.C.; Gong, G.C. Biogeochemical responses in the Southern East China Sea after typhoons. Oceanography 2011, 24, 42–51. [Google Scholar] [CrossRef]
- Shih, Y.-Y.; Hung, C.-C.; Huang, S.-Y.; Muller, F.L.L.; Chen, Y.-H. Biogeochemical Variability of the Upper Ocean Response to Typhoons and Storms in the Northern South China Sea. Front. Mar. Sci. 2020, 7, 151. [Google Scholar] [CrossRef] [Green Version]
- Chou, W.-C.; Gong, G.-C.; Cai, W.-J.; Sheu, D.D.; Hung, C.-C.; Chen, H.-Y.; Chung, C.-C. CO2 system in the oligotrophic northwest Pacific Ocean during the Asian dust storm season. Mar. Chem. 2011, 127, 210–222. [Google Scholar] [CrossRef]
- Jan, S.; Mensah, V.; Andres, M.; Chang, M.-H.; Yang, Y.J. Eddy-Kuroshio interactions: Local and remote effects. J. Geophys. Res. Oceans 2017, 122, 9744–9764. [Google Scholar] [CrossRef] [Green Version]
- Chen, F.; Cai, W.-J.; Benitez-Nelson, C.; Wang, Y. Sea surface pCO2-SST relationships across a cold-core cyclonic eddy: Implications for understanding regional variability and air-sea gas exchange. Geophys. Res. Lett. 2007, 34, L10603. [Google Scholar] [CrossRef] [Green Version]
- Sheu, D.D.; Chou, W.C.; Chen, C.T.A.; Wei, C.L.; Hsieh, H.L.; Hou, W.P.; Dai, M. Riding over the Kuroshio from the South to the East China Sea: Mixing and transport of DIC. Geophys. Res. Lett. 2009, 36, L07603. [Google Scholar] [CrossRef] [Green Version]
- Lai, C.-C.; Wu, C.-R.; Chuang, C.-Y.; Tai, J.-H.; Lee, K.-Y.; Kuo, H.-Y.; Shiah, F.-K. Phytoplankton and Bacterial Responses to Monsoon-Driven Water Masses Mixing in the Kuroshio Off the East Coast of Taiwan. Front. Mar. Sci. 2021, 8, 707807. [Google Scholar] [CrossRef]
- Chow, C.H.; Liu, Q.; Xie, S.-P. Effects of Kuroshio Intrusions on the atmosphere northeast of Taiwan Island. Geophys. Res. Lett. 2015, 42, 1465–1470. [Google Scholar] [CrossRef]
Publisher’s Note: MDPI stays neutral with regard to jurisdictional claims in published maps and institutional affiliations. |
© 2022 by the authors. Licensee MDPI, Basel, Switzerland. This article is an open access article distributed under the terms and conditions of the Creative Commons Attribution (CC BY) license (https://creativecommons.org/licenses/by/4.0/).