Abstract
This study presents an integrated analysis of cohesive bank-collapsed material transportation in a high-curvature channel with a non-cohesive riverbed. A numerical model was established to simulate the erosion and transportation of collapsed materials in a 180° U-bend channel after verification. The novel aspect of this study is that the quantities of the collapsed materials that transformed into suspended and bed loads were comprehensively analyzed. The results show that finer collapsed sediments were only transformed into suspended loads after being eroded, while the coarser particles transformed into both suspended loads and bed loads. When the flow charge was 30 L/s, the quantity of collapsed materials (S1 and S2) that transported downstream was smaller, and coarser materials transformed into suspended loads with a ratio of 88.12–99.86% and bed loads with a ratio of 11.18–0.14%. When the flow charge was 55 L/s, due to the greater shear stress, the quantity of collapsed materials (S1 and S2) that transported downstream was greater, and the ratio ranged from 46.65% to 49.88% and from 50.12% to 53.35%, respectively. This research provides theoretical and practical benefits that reveal the mechanisms of channel bend evolution.
1. Introduction
Riverbank collapse is a key process in river morphodynamics that can affect channel mobility, floodplain evolution, and pollution transportation. Large amounts of sediments come into alluvial rivers, leading to a series of social and environmental problems, including farmland loss, embankment destruction, river turbidity, and river eutrophication [1,2].
Given the importance of riverbank collapse, it is not surprising that many studies have been carried out on this subject in these past decades. For cohesive riverbanks, one focus of recent work has been the mechanism of riverbank collapse and the relative influence of the factors that control mass failure [3]. In such studies, collapse processes were divided into three steps: (1) bank toe erosion, (2) tension cracks generated on top of a bank, and (3) mass failure on flat or cambered planes [4,5,6]. Simultaneously, the respective roles of bank shapes [7], near-bank hydrology [8], positive and negative pore pressures [9], high confining water pressures [10], and riparian vegetation coverages [11], as well as bank materials were quantified in the modelization of riverbank collapse [12]. In addition, several bank stability models based on limit equilibrium were established to evaluate cohesive bank stability and predict collapse volumes [13,14]. These notable contributions present much benefit for predicting channel bend evolution processes, especially for the rivers with drastic riverbank collapse [15].
In a curved channel with drastic riverbank collapse, the evolution processes become more complicated under the interaction between collapsed materials and near-bank hydrology [16]. After bank collapse occurs, collapsed sediments that accumulated at the bank toe will change the original channel topography, which can affect the velocity distribution and provide a sediment source [17]. Previous studies noted that collapsed materials can reduce the near-bank shear stress [18,19], further increase the near bank resistance, and make the high velocity area shift away from the riverbank [20,21]. Yu et al. [22] found that the presence of a collapsed block can cause greater downstream bank retreat, while a smaller near-bank velocity can protect the bank against erosion occurring upstream of the block end. Xie et al. [23] noted that the average wall shear force between the collapse body and the toe decreases when the collapsed body is located upstream of the apex of bend. The opposite situation occurs when the collapse body is located downstream of the apex of bend. Based on these qualitative analyses, some mathematical models were developed by changing bank erosion parameters to reflect protection from collapsed materials [15,24,25,26,27]. Nevertheless, these studies mainly emphasized the influence of collapsed materials on flow distributions.
In fact, channel hydrology reacts on collapsed materials at the same time. One important manifestation is the accumulation and transportation of collapsed materials. Though some studies qualitatively describe the transportation based on flume experiments and theory of sediment movement [22,28,29], there has been no uniform approach for quantifying the transportation of collapsed materials directly until now because of its difficulty to observe either in natural rivers or laboratory flume experiments. Instead, many studies introduced assumptions about the transportation of collapsed materials when simulating channel evolution processes by coupling water–sediments equations, bed evolution equations, and bank stability models. Some studies considered collapsed cohesive sediment as wash loads that were carried away instantaneously, with none being accumulative [9]. Some studies classified the collapsed materials based on particle size. Particles finer than 0.062 mm were considered as wash load, while the coarser particles were considered as bed sediments that were distributed uniformly across the bed area between the bank toe and the boundary of the near bank sediment routing segment, a distance equal to twice the bank height. Zong et al. [30] considered 50% of collapsed materials as wash load; the others accumulated at the bank toe with triangular silting shapes. Duan et al. [31] proposed that the volume of accumulated sediments is decided by sediment carrying capacity and assumed that sediment accumulated at the sediment deposition angle. Then river evolution process was simulated through water–sediment and bed evolution equations. Though these assumptions were indirectly demonstrated by comparing simulated and measured results, the further fraction of reworked collapsed materials, transported either as bed load or as suspended load, was rarely involved. As this further fraction can influence channel downstream morphology significantly in natural alluvial rivers, it is essential to quantify the different transport patterns of collapsed materials.
In this study, scenarios with cohesive collapsed materials and non-cohesive sediments in a 180° U-bend channel were simulated by a numerical model established based in Delft3D to evaluate the transportation of the collapsed materials in a sharply curved channel and quantify the suspended and bed loads that are transformed from collapsed materials.
2. Materials and Methods
In this study, a three-dimensional mathematical model established in Delft3D was adopted [32], which is comprised of a flow model and a sediment transport model.
2.1. Flow Model
The three-dimensional bend flow model (k-ε model) in the σ coordinate system was applied to the Reynolds-averaged Navier–Stokes equations for incompressible free surface flow to obtain the flow velocities in the ξ, η and σ directions.
- (1)
- Definition of σ-co-ordinate.
The σ co-ordinate system is defined as:
where z is the vertical coordinate in physical space; ζ is the free surface elevation above the reference plane (at z = 0), m; d is the depth below the reference plane, m; and H is the total water depth, m.
- (2)
- Continuity equations.
In coordinate system σ, continuity equations can be transformed as follows:
where t is the time, s; (Gξξ)1/2 and (Gηη)1/2 are the coefficients used to transform curvilinear to rectangular coordinates, m; ξ and η are horizontal curvilinear coordinates; U is depth-averaged velocity in ξ direction, m/s; V is depth-averaged velocity in η direction, m/s; and Q is the contributions per unit area due to the water discharge, m/s.
where qin is the local source of water per unit of volume, 1/s; qout is the local sink of water per unit of volume, 1/s; P is precipitation, m/s; and E is evaporation, m/s.
- (3)
- Momentum equations.
The vertical velocity ω in the adapting σ-coordinate system is computed from the continuity equation:
- (4)
- Turbulent model: k-ε model.
2.2. Sediment Transport Equation
- (1)
- Suspended sediment transport equation
- (2)
- Bed load transport equation
The reference concentration is calculated as:
where ca(l) is the mass concentration at reference height a, kg/m3; D*(l) is the nondimensional particle diameter; and Ta(l) is the nondimensional bed shear stress.
where ρs is the density of sediment, kg/m3; ws is the sediment setting velocity, m/s; M is the sediment mobility number due to waves and currents; and Me is the excess sediment mobility number.
2.3. Model Verification
The numerical model was verified by simulating water flume experiments that studied the interaction between the riverbank and bed sediments, as described in the literature [33]. The flume experiments were constructed at the State Key Laboratory of Water Resources and Hydropower Engineering Sciences at Wuhan University to simulate riverbank collapse in Dengkou Reach of the Yellow River. The slope of flume was 1‰. The flow conditions were designed as: (1) discharge 30 L/s; (2) water depth 0.14 m; (3) water level 0.24 m. Water flume sizes, section settings, and sediment distributions were organized as shown in Figure 1. The erodible sediments were placed only on the shaded part of the water flume. The particle sizes of all the bed and bank sediments that collected from Dengkou Reach of the Yellow River are listed in Figure 2. Additionally, Table 1 lists the physical properties of cohesive sediments. The flow velocity was measured by an acoustic Doppler velocity (ADV) profiler; by mounting the probe to a rigid scaffold, any possible vibration of the probe due to flow action was minimized. When the experiment was completed, the bed level was measured by a transparent mesh plate at typical sections after the water was drained.
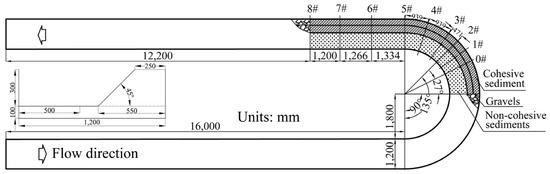
Figure 1.
Schematic diagram of the flume experiment.
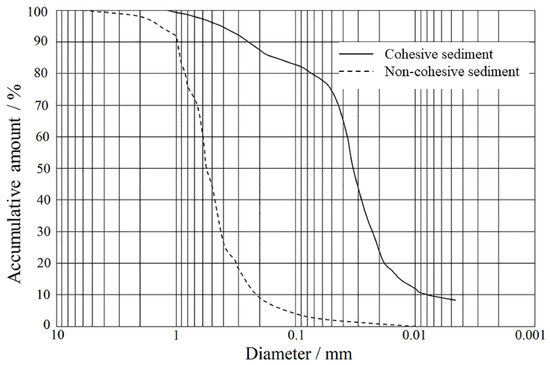
Figure 2.
Particle distribution of cohesive and non-cohesive sediments.

Table 1.
Physical properties of cohesive sediments.
A basin of 188 × 24 computational cells, where each was approximately 0.01 m2 at 0.2 m long and 0.05 m wide, was positioned with an initial bed slope of 1‰ in the rectangular flume along the flow direction, as shown in Figure 3.
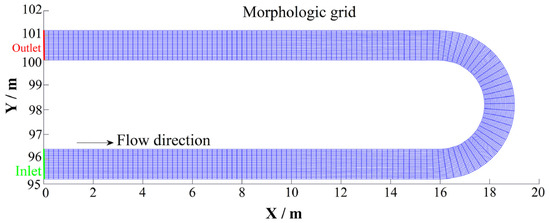
Figure 3.
Morphologic grid in calculate areas.
The inlet and outlet boundary conditions shown in Figure 3 were set to be the discharge (30 L/s) and water level (0.24 m), respectively. All cohesive and non-cohesive grains had a density of 2650 kg/m3, as the dry densities were set to 500 kg/m3 and 1600 kg/m3, respectively, based on measurements. The settling velocities of cohesive sediments that ranged from 0.04 to 0.46 mm/s in this research were calculated using the formula derived by Dou [34]. For cohesive sediments, the critical bed shear stress for erosion ranged from 0.2 to 1.8 N/m2; here we calculated using the formula in the literature [35,36]. The critical bed shear stress for deposition can be obtained using the formula in the literature [37]. The background horizontal viscosity and diffusivity values were set to 0.0005 and 0.0001 m2/s, respectively.
A bed stratigraphy model containing 5 layers was used to track the evolution of the bed sediment. A time step of 0.03 s was adopted to obey all stability criteria, and the simulation time was 3 h when riverbank collapse did not occur. To avoid numerical instabilities caused by supercritical flow in shallow areas, a grid cell was considered dry if its depth was shallower than 0.01 cm. Boundary fitted grids were used in this model so that all erosion and deposition fluxes were applied to the bottom cell face.
- (1)
- Velocity verification
Because the main object of this study was to quantify the transformation of collapsed materials, the depth-averaged velocity played a more important role in longitudinal direction. Thus, the depth-averaged velocities from numerical simulation and flume experiments were selected to verify the adopted model. The average velocities in Sections 1, 3–7 were adopted to verify the simulated velocities with the measured velocities in the water flume experiments, as shown in Figure 4. Figure 5 presents the comparison between simulated and measured velocities at the same location in every selected section. The simulated velocities were moderately consistent with the experimental velocities, supporting the validity of the flow model.
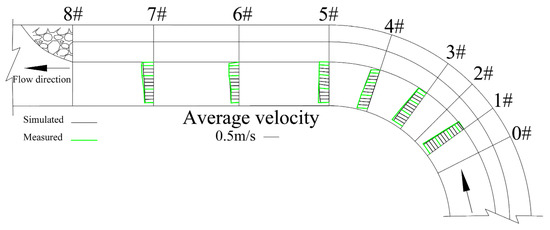
Figure 4.
Comparison of simulated velocities and measured velocities.
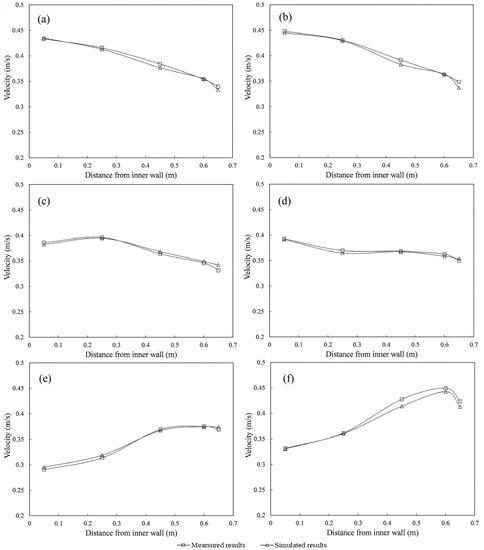
Figure 5.
Comparison of the simulated and measured velocities in different sections. (a) Section 1; (b) Section 3; (c) Section 4; (d) Section 5; (e) Section 6; (f) Section 7.
- (2)
- Bed level verification
Bed sediment transportation was verified by comparing bed levels between simulated and measured results in Sections 1, 3, 4, 5, 6, and 7 separately, as shown in Figure 6. Due to the existence of the transverse effect, the water at the surface in the curve channel will flow towards the concave bank, whereas the water at the bottom will flow in the opposite direction, which will carry sediments. Thus, the bed levels near the convex bank were higher than those near the concave bank in both simulated and experimental scenarios, as depicted in Figure 6. It can also be seen that the adopted model is accurate enough to investigate the evolution of flume bottom variation.
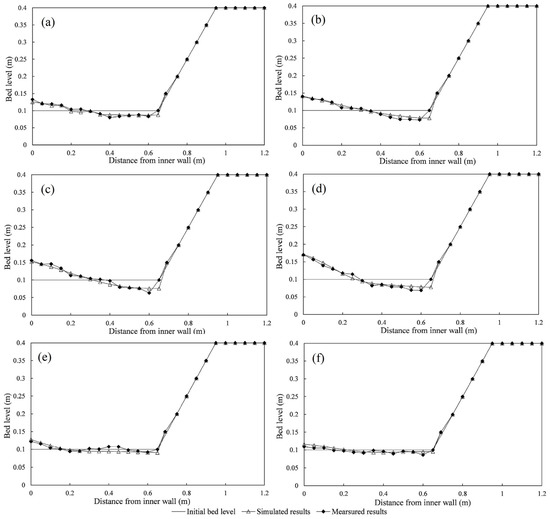
Figure 6.
Comparison of the simulated and measured bed levels in different sections. (a) Section 1; (b) Section 3; (c) Section 4; (d) Section 5; (e) Section 6; (f) Section 7.
2.4. Simulated Scenario
2.4.1. Location of Collapsed Materials
Two scenarios listed in Table 2 were simulated by using the adopted numerical model to determine the location of collapsed materials under different flow conditions (30 L/s and 55 L/s). The water shear stress distribution of the curved channel, as the main driving force on riverbank collapse [28], was simulated without collapsed materials to determine the probable location of collapsed material accumulation. As bank collapse occurs in the downstream of the bend exit [38], the collapsed materials were set to accumulate at the location in situ, circled by a dotted line in Figure 7, where the water shear stress was greater.
Table 2.
Simulated scenarios settings.
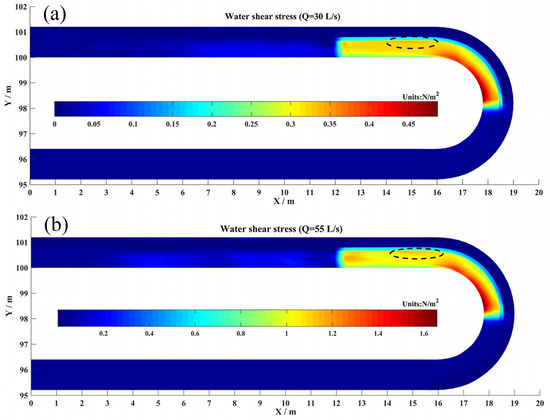
Figure 7.
Water shear stress distribution under different flow charge conditions. (a) Q = 30 L/s; (b) Q = 55 L/s.
2.4.2. Composition of Collapsed Materials
In natural rivers, the shape of collapsed materials accumulated at the bank toe is very difficult to measure and predict due to its irregularity. Based on the existing research [30,31], the shape of collapsed materials is assumed to be right-angled trapezoidal in the cross-sectional direction, as shown in Figure 8a. The length of the collapsed materials is determined by the area in the dotted line (Figure 7), and the total thickness of the collapsed materials was 50 mm (Figure 8a). Since the critical size of coarse and fine sediment in the Yellow River was 50 μm [39], two typical particles were selected to represent coarser and fine sediment, i.e., 37 μm (S1) and 74 μm (S2), based on the particle size distribution of the riverbank (Figure 2). It can also be obtained that the ratio of particles coarser than 50μm to finer than 50μm approximately equals to 3; thus, the ratio of VS1 to VS2 equals 3, where VS1 and VS2 represent the volumes of S1 and S2, respectively. Bed sediments were made of one typical particle size, 490 μm (S3), and the thickness was 100 mm, as shown in Figure 8.
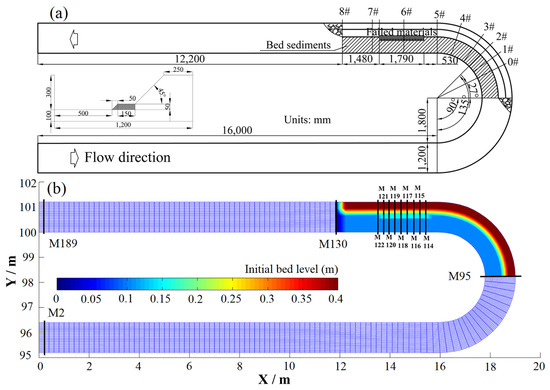
Figure 8.
Collapsed materials and section settings in simulated scenarios. (a) Schematic diagram; (b) grid and bed level in numerical model.
2.4.3. Scenario Settings in Simulation for Transportation of Collapsed Materials
The riverbank was fixed except for the collapsed materials and the bed sediments, as the main purpose of this study was to evaluate the quantities of collapsed materials transforming into suspended loads and bed loads. Based on the determined location and composition of collapsed materials, the grid and bed levels in the numerical model are shown in Figure 8b. The simulated scenario settings in Table 2 were used for boundary conditions. New section labels named based on grid numbers along the flow direction were also used in the following article to analyze the simulated results more conveniently. To ensure that the flow reached a steady state, river geomorphology was incorporated after 30 min. The simulated results based on the verified numerical model were analyzed in Section 3.
3. Results
3.1. Curved Channel Evolution Process
The variation in the riverbed elevation is an important performance factor in the curved channel evolution process. Figure 9 presents the bed levels at different times. As mentioned in Section 2.4, the river topography module began to run after 30 min of hydrodynamic pre-operation with a flow charge of 30 L/s or 55 L/s. There were three obvious characteristics in the curved channel evolution process. First, the bed level at the bend inlet decreased because sediments were washed downstream. Second, the bed level of the convex bank was higher than that of the concave bank over time due to the existence of cross circulation and surface pressure differences. Third, the bed level changed more dramatically when the flow charge was larger. Taking bed levels at 02:00:00 as an example, when the flow charge was 55 L/s, the bed levels of the bend inlet and concave bank were obviously lower, while the bed levels of the convex bank downstream of the bend outlet were obviously higher. This is attributed to the larger water shear stress and sediment carrying capacity of a larger flow charge with the same constant water level.
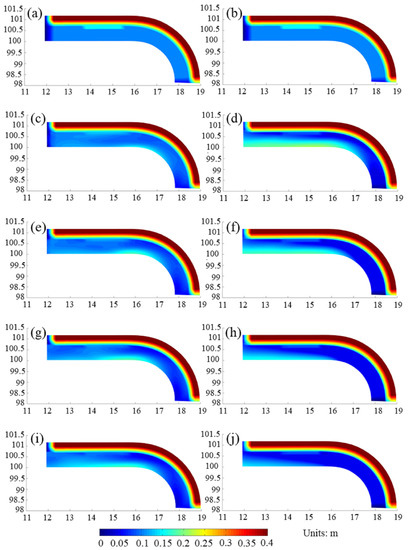
Figure 9.
Bed level of the curved channel at different times. (a) Q = 30 L/s, T = 00:00:00; (b) Q = 55 L/s, T = 00:00:00; (c) Q = 30 L/s, T = 02:00:00; (d) Q = 55 L/s, T = 02:00:00; (e) Q = 30 L/s, T = 04:00:00; (f) Q = 55 L/s, T = 04:00:00; (g) Q = 30 L/s, T = 06:00:00; (h) Q = 55 L/s, T = 06:00:00; (i) Q = 30 L/s, T = 08:00:00; (j) Q = 55 L/s, T = 08:00:00.
Figure 10 describes the bed level changes in typical sections (M114, 118 and 121) in collapsed materials reached at different moments. Whether the flow charge was 30 L/s or 55 L/s, the bed levels of the right bank, where collapsed materials accumulated, decreased as collapsed materials were eroded by water flow. For the left bank, the bed level changes were more complicated. When the flow charge was 30 L/s, the bed levels of the left bank increased as time progressed. When the flow charge was 55 L/s, the bed levels of the left bank increased in the first 2 h and then decreased because a larger flow charge was more conducive to sediment transportation [40]. After 2 h, there were fewer sediments upstream, and the sediments that were previously deposited on the left bank were transported downstream under the action of water flow when the flow charge was 55 L/s.
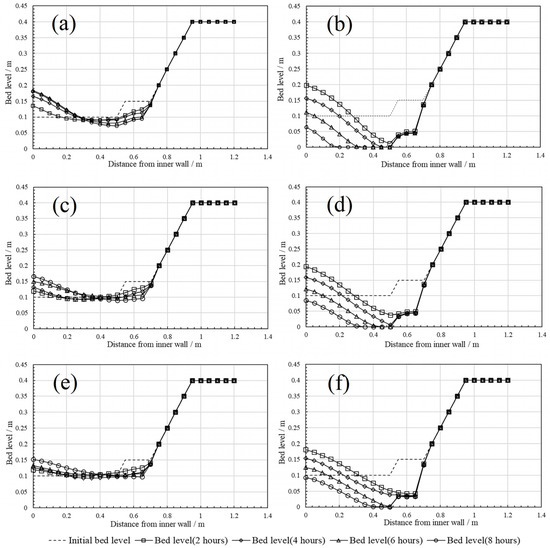
Figure 10.
Bed levels of typical sections in collapsed materials reach (a) M114, Q = 30 L/s; (b) M114, Q = 55 L/s; (c) M118, Q = 30 L/s; (d) M118, Q = 55 L/s; (e) M121, Q = 30 L/s; (f) M121, Q = 55 L/s.
3.2. Quantities of the Collapsed Material Transformation and Transportation
3.2.1. Quantities of the Eroded Collapsed Materials
The quantities of the eroded sediment fractions can be obtained by arranging the remaining sediments on the riverbed at different moments. Figure 11 shows the remaining quantities of S2 on the riverbed at the beginning and end of the simulation when the flow charge was 30 L/s. The eroded quantity of S2 can be obtained by calculating the difference. Table 3 and Table 4 list the erosion quantities of different sediment fractions at different moments. When the flow charge was 55 L/s, the erosion quantities of both sediment fractions were larger because of the larger water shear stress. Whether the flow charge was 30 L/s or 55 L/s, the erosion quantity of S2 was larger than that of S1. The main driving force was the water shear stress in the cohesive sediment erosion process, while the resistance provided the cohesive force, friction, gravity of particles, and electrochemical force effects. When the particle size was finer, the electrochemical force was greater and played a more important role than other resistances [41].
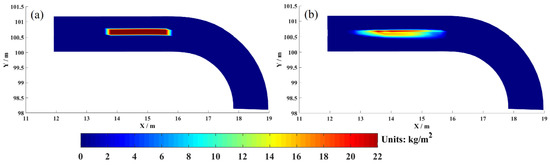
Figure 11.
Remaining S2 on riverbed. (a) Q = 30 L/s, T = 00:00:00; (b) Q = 30 L/s, T = 08:00:00.
Table 3.
Erosion quantities of the collapsed materials (30 L/s).
Table 4.
Erosion quantities of the collapsed materials (55 L/s).
3.2.2. The Quantities of the Suspended and Bed Loads
After the collapsed materials were eroded, they were transported downstream as suspended loads or bed loads. Several typical sections (M122, M124, M126, M128, and M130) downstream of the collapsed reach were adopted to calculate the quantities, as listed in Table 5 and Table 6. When the flow charge was 30 L/s, the quantities of both suspended and bed loads flowing through sections decreased downstream. When the flow charge was 55 L/s, the quantities of the suspended loads flowing through all sections were almost the same as that of the bed load.
Table 5.
Quantities of the suspended and bed loads through typical cross sections (30 L/s).
Table 6.
Quantities of the suspended and bed loads through typical cross sections (55 L/s).
3.2.3. Percentage of Sediment Fractions in Suspended and Bed Loads Transforming from the Collapsed Materials
Table 7 and Table 8 list the percentage of different sediment fractions in suspended loads and bed loads that were transformed from the collapsed materials. No bed load was obtained from S1 in any section and the flow charge was either 30 L/s or 55 L/s—i.e., all the collapsed materials at S1 were transported as suspended loads, while the S2 collapsed materials were transported as both suspended and bed loads after erosion. When the flow charge was 30 L/s, the percentage of S1 suspended loads ranged from 2.05% to 11.64%, whereas that of S2 ranged from 88.36% to 97.95%. When the flow charge was 55 L/s, the percentage of S1 ranged from 5.15% to 6.46%, whereas that of S2 ranged from 93.54% to 94.85%.
Table 7.
Quantities and percentage of sediment fractions flowing through cross sections as suspended and bed loads (30 L/s).
Table 8.
Quantities and percentage of sediment fractions flowing through cross sections as suspended and bed loads (55 L/s).
Table 9 and Table 10 list the percentage of S2 collapsed materials transforming into suspended and bed loads in typical sections. When the flow charge was 30 L/s, approximately 88–99.8% of S2 collapsed materials was transported as suspended loads, and only approximately 0.2–12% was transported as bed loads. When the flow charge was 55 L/s, approximately 47–50% was transported as suspended loads, and approximately 50–53% was transported as bed loads.
Table 9.
Percentage of S2 collapsed materials transforming into suspended and bed loads (30 L/s).
Table 10.
Percentage of S2 collapsed materials transforming into suspended and bed loads (55 L/s).
4. Discussion
Quantifying the transformation and transportation of collapsed materials in a curved channel is challenging because there are many influencing factors, such as flow velocity, water level, topography, and sediment characteristics. In addition, the suspended and bed loads will also transform mutually in the process. Nevertheless, under specific flow conditions, when sediments transportation is at equilibrium state, the quantity of the suspended and bed loads across typical sections would barely change [42]. Based on this, the results listed in Table 7 and Table 8 were reasonable.
This study could be considered as a classic attempt to quantify the transportation of cohesive collapsed materials with non-cohesive riverbed, since there is rarely literature on this problem. The results not only demonstrate the existing theory of sediment transportation but also provide the ratio of suspended and bed loads that transformed from collapsed materials under certain flow conditions. At the same time, there are also several assumptions based on previous literature, such as the shape of collapsed material accumulation and the composition of collapsed materials. These reasonable assumptions would bring benefits in the numerical simulation of sediment transportation incontestably. However, they can also make the experimental results reified and difficult to apply to general phenomena.
Finally, as a key factor influencing sediment characteristics, particle size distribution plays an important role in the transformation and transportation of collapsed materials. Under certain flow conditions, sediment particle transport patterns differ. In this study, finer particles (S1) were only transported as suspended loads, while coarser particles (S2) were transported as both suspended and bed loads. For the same particle size distribution, the transport patterns were also different under different flow conditions [43]. Thus, it is essential to consider flow conditions and particle size distributions comprehensively when predicting natural river evolution processes.
5. Conclusions
Numerical studies were conducted to investigate the transformation and transportation of cohesive collapsed materials in a 180° sharply bent flume. The findings can be summarized as follows:
- (1)
- Under the designed flow conditions, finer particles (S1) are only transformed into suspended loads, while coarser particles (S2) transformed into both suspended and bed loads.
- (2)
- In terms of the quantities of suspended loads across typical downstream sections, the percentage of S1 collapse materials ranges from 2.05% to 11.64%, while that of S2 ranges from 88.36% to 97.95% when the flow charge is 30 L/s. When the flow charge is 55 L/s, the percentage of S1 collapse materials ranges from 5.15% to 6.46%, while that of S2 ranges from 93.54% to 94.85%.
- (3)
- When the flow charge was 30 L/s, the quantity of collapsed materials (S1 and S2) that transported downstream was smaller and approximately 88–99.8% coarser particles (S2) were transformed into suspended loads, while only 0.2–12% of them were transported as bed loads. When the flow charge was increased to 55 L/s, due to the greater shear stress, the quantity of collapsed materials (S1 and S2) that transported downstream was greater, and approximately 47–50% of S2 particles were transformed into suspended loads, while approximately 50–53% were transformed into bed loads.
- (4)
- Because the flow conditions and composition of sediment applied in the numerical model were consistent with that of the flume experiment described in Section 2.3, the simulation results not only could be scientific support for predicting river evolution process along the collapsed reach of the Yellow River but also can present reference for numerical models for simulating the transportation of collapsed materials.
Furthermore, additional outcomes must be highlighted in future studies. First, as the particle size distribution of riverbanks and beds in nature ranges widely, more sediment fractions of collapsed materials and riverbeds should be added in the following simulations. Second, since the quantities of riverbank collapse events largely vary in natural rivers, different quantities of collapsed materials should be considered in future studies.
Author Contributions
Conceptualization, G.D. and H.L.; funding acquisition, H.L.; investigation, C.W. and S.C.; methodology, H.L., Z.L. and Y.D.; project administration, H.L.; validation, D.S. and W.Y.; writing—original draft, G.D. and H.L.; writing—review and editing, G.D., H.L., D.S., W.Y. and Y.D. All authors have read and agreed to the published version of the manuscript.
Funding
This research was supported by the Major Scientific and Technological Innovation Projects in Shandong Province (2021CXGC011201) and the Open Research Fund of Key Laboratory of Hydro-Sediment Science and River Training, the Ministry of Water Resources, China Institute of Water Resources and Hydropower Research (Grant number: IWHR-JH-2020-A-03).
Institutional Review Board Statement
Not applicable.
Informed Consent Statement
Not applicable.
Data Availability Statement
Not applicable.
Conflicts of Interest
The authors declare no conflict of interest.
References
- Nardi, L.; Rinaldi, M.; Solari, L. An experimental investigation on mass failures occurring in a riverbank composed of sandy gravel. Geomorphology 2012, 163, 56–59. [Google Scholar] [CrossRef] [Green Version]
- Rinaldi, M.; Nardi, L. Modelling interactions between riverbank hydrology and mass failures. J. Hydraul. Eng. 2013, 18, 1231–1240. [Google Scholar] [CrossRef]
- Sun, Q.H.; Xia, J.Q.; Zhou, M.R.; Deng, S.S. Application of analytic hierarchy process in the study of factors affecting bank erosion in the Jingjiang reach. J. Sediment Res. 2021, 46, 21–28. (In Chinese) [Google Scholar] [CrossRef]
- Nagata, N.; Hosoda, T.; Muramoto, Y. Numerical Analysis of River Channel Processes with Bank Erosion. J. Hydraul. Eng. 2000, 126, 243–252. [Google Scholar] [CrossRef]
- Darby, S.E.; Delbono, I. A model of equilibrium bed topography for meander bends with erodible banks. Earth Surf. Proc. Land. 2002, 27, 1057–1085. [Google Scholar] [CrossRef]
- Darby, S.E.; Trieu, H.Q.; Carling, P.A.; Sarkkula, J.; Koponen, J.; Kummu, M.; Colan, L.; Leyland, J. A physically based model to predict hydraulic erosion of fine-grained riverbanks: The role of form roughness in limiting erosion. J. Geophys. Res. Earth Surf. 2010, 115, F04003. [Google Scholar] [CrossRef] [Green Version]
- Midgley, T.L.; Fox, G.A.; Heeren, D.M. Evaluation of the bank stability and toe erosion model (BSTEM) for predicting lateral retreat on composite streambanks. Geomorphology 2012, 145, 107–114. [Google Scholar] [CrossRef] [Green Version]
- Langendoen, E.J.; Simon, A. Modeling the evolution of incised streams. II: Stream bank erosion. J. Hydraul. Eng. 2008, 134, 905–915. [Google Scholar] [CrossRef]
- Simon, A.; Curini, A.; Darby, S.E.; Langendoen, E.J. Bank and near-bank processes in an incised channel. Geomorphology 2000, 35, 193–217. [Google Scholar] [CrossRef]
- Saadon, A.; Abdullah, J.; Muhammad, N.S.; Ariffin, J.; Julien, P.Y. Predictive models for the estimation of riverbank erosion rates. Catena 2021, 196, 104917. [Google Scholar] [CrossRef]
- Aviles, D.; Wesstrm, I.; Joel, A. Effect of vegetation removal on soil erosion and bank stability in agricultural drainage ditches. Land 2020, 9, 441. [Google Scholar] [CrossRef]
- Morelli, S.; Pazzi, V.; Tanteri, L.; Nocentini, M.; Lombardi, L.; Gigli, G.; Tofani, V.; Casagli, N. Characterization and geotechnical investigations of a riverbank failure in florence, italy, unesco world heritage site. J. Geotech. Geoenviron. 2020, 146, 05020009. [Google Scholar] [CrossRef]
- Osman, A.; Thorne, C.R. Riverbank Stability Analysis. I: Theory. J. Hydraul. Eng. 1988, 114, 134–150. [Google Scholar] [CrossRef]
- Simon, A.; Pollenbankhead, N.; Mahacek, V.; Langendoen, E. Quantifying reductions of mass-failure frequency and sediment loadings from streambanks using toe protection and other means: Lake Tahoe, United States. JAWRA J. Am. Water Resour. Assoc. 2009, 45, 170–186. [Google Scholar] [CrossRef]
- Darby, S.E.; Rinaldi, M.; Dapporto, S. Coupled simulations of fluvial erosion and mass wasting for cohesive river banks. J. Geophys. Res. Earth Surf. 2007, 112, F03022. [Google Scholar] [CrossRef]
- Xu, D.; Bai, Y.C.; Ma, J.M.; Tan, Y. Numerical investigation of long-term planform dynamics and stability of river meandering on fluvial floodplains. Geomorphology 2011, 132, 195–207. [Google Scholar] [CrossRef]
- Duan, J.G.; Julien, P.Y. Numerical simulation of meandering evolution. J. Hydrol. 2010, 391, 34–36. [Google Scholar] [CrossRef]
- Dulal, K.P.; Kobayashi, K.; Shimizu, Y.; Parker, G. Numerical computation of free meandering channels with the application of slump blocks on the outer bends. J. Hydro-Environ. Res. 2010, 3, 239–246. [Google Scholar] [CrossRef]
- Hackney, C.; Best, J.; Leyland, J.; Leyland, J.; Darby, S.E.; Parsons, D.; Aalto, R.; Nicholas, A. Modulation of outer bank erosion by slump blocks: Disentangling the protective and destructive role of failed material on the three-dimensional flow structure. Geophys. Res. Lett. 2015, 42, 10663–10670. [Google Scholar] [CrossRef] [Green Version]
- Motta, D.; Abad, J.D.; Langendoen, E.J.; Garcia, M.H. A simplified 2-D model for meander migration with physically-based bank evolution. Geomorphology 2012, 163, 10–25. [Google Scholar] [CrossRef]
- Eke, E.; Parker, G.; Shimizu, Y. Numerical modelling of erosional and depositional bank processes in migrating river bends with self-formed width: Morphodynamics of bar push and bank pull. J. Geophys. Res. Earth Surf. 2014, 119, 1455–1483. [Google Scholar] [CrossRef]
- Yu, M.H.; Wu, S.B.; Liu, C.J.; Shu, A. Erosion of collapsed riverbank and interaction with channel. Proc. Inst. Civ. Eng.-Water Manag. 2016, 170, 243–253. [Google Scholar] [CrossRef]
- Xie, Y.G.; Yu, M.H.; Hu, P.; Liu, Y.J.; Chen, X.Q. Experimental study on the effects of slump block at different locations upon the flow structure near the outer bank. Adv. Water Sci. 2019, 30, 727–737. (In Chinese) [Google Scholar] [CrossRef]
- Jia, D.D.; Shao, X.J.; Wang, H.; Zhou, G. Three-dimensional modeling of bank erosion and morphological changes in the Shishou bend of the middle Yangtze River. Adv. Water Resour. 2010, 33, 348–360. [Google Scholar] [CrossRef]
- Motta, D.; Abad, J.D.; Langendoen, E.J.; Garcia, M.H. The effects of floodplain soil heterogeneity on meander planform shape. Water Resour. Res. 2012, 48, W09518. [Google Scholar] [CrossRef]
- Motta, D.; Langendoen, E.J.; Abad, J.D.; Garcia, M.H. Modification of meander migration by bank failures. J. Geophys. Res. Earth Surf. 2014, 119, 1026–1042. [Google Scholar] [CrossRef]
- Deng, S.S.; Xia, J.Q.; Zhou, M.R.; Lin, F.F. Coupled modeling of bed deformation and bank erosion in Jingjiang Reach of the Middle Yangtze River. J. Hydrol. 2019, 568, 221–233. [Google Scholar] [CrossRef]
- Yu, M.H.; Guo, X. Experimental study on the interaction between the hydraulic transport of failed bank soil and near-bank bed evolution. Adv. Water Sci. 2014, 25, 677–683. (In Chinese) [Google Scholar] [CrossRef]
- Yu, M.H.; Xie, Y.G.; Wu, S.B.; Tian, H.Y. Sidewall shear stress distribution effects on cohesive bank erosion in curved channels. Proc. Inst. Civ. Eng.-Water Manag. 2019, 172, 257–269. [Google Scholar] [CrossRef]
- Zong, Q.L.; Xia, J.Q.; Zhou, M.R.; Deng, S.S.; Zhang, Y. Modelling of the retreat process of composite riverbank in the Jingjiang Reach using the improved BSTEM. Hydrol. Process. 2017, 31, 4669–4681. [Google Scholar] [CrossRef]
- Duan, G.S.; Shu, A.; Matteo, R.; Wang, S.; Zhu, F.Y. Collapsing mechanisms of the typical cohesive riverbank along the Ningxia-Inner Mongolia catchment. Water 2018, 10, 1272. [Google Scholar] [CrossRef] [Green Version]
- Deltares. Delft3D-FLOW-User Manual; Deltares: Rotterdam, The Netherlands, 2014; pp. 189–239. [Google Scholar]
- Shu, A.; Zhou, X.; Yu, M.H.; Duan, G.S.; Zhu, F.Y. Characteristics for circulating currents and water-flow shear stress under the condition of bank slope collapse. J. Hydraul. Eng. 2018, 49, 271–281. (In Chinese) [Google Scholar] [CrossRef]
- Dou, G.R. Similarity theory of total sediment transport modeling for estuarine and coastal regions. Hydro-Sci. Eng. 2001, 3, 1–12. (In Chinese) [Google Scholar] [CrossRef]
- Dou, G.R. Incipient motion of coarse and fine sediment. J. Sediment Res. 1999, 12, 1–9. (In Chinese) [Google Scholar] [CrossRef]
- Lu, J.; Qiao, F.L.; Wang, X.H.; Wang, Y.; Teng, Y.; Xia, C.S. A numerical study of transport dynamics and seasonal variability of the Yellow River sediment in the Bohai and Yellow seas. Estuar. Coast. Shelf Sci. 2011, 95, 39–51. [Google Scholar] [CrossRef]
- Xiao, H.; Cao, Z.D.; Zhao, Q.; Han, H.S. Experimental study on incipient motion of coherent silt under wave and flow action. J. Sediment Res. 2009, 6, 75–80. (In Chinese) [Google Scholar] [CrossRef]
- Yu, M.H.; Chen, X.; Wei, H.Y.; Hu, C.W.; Wu, S.B. Experimental of the influence of different near-bank riverbed compositions on bank failure. Adv. Water Sci. 2016, 3, 176–185. (In Chinese) [Google Scholar] [CrossRef]
- Zhang, H.W.; Zhang, J.H.; Wu, T. Definition of “coarse sand of the Yellow River based on river dynamics”. Yellow River 2008, 3, 24–27. (In Chinese) [Google Scholar] [CrossRef]
- Han, Q.W. Some rules of sediment transportation and deposition-scouring in the lower Yellow River. J. Sediment Res. 2004, 6, 1–13. (In Chinese) [Google Scholar] [CrossRef]
- Seo, J.Y.; Choi, S.M.; Ha, H.K. Assessment of potential impact of invasive vegetation on cohesive sediment erodibility in intertidal flats. Sci. Total Environ. 2020, 766, 144493. [Google Scholar] [CrossRef]
- Shu, A.; Duan, G.S.; Rubinato, M.; Tian, L.; Wang, M.Y.; Wang, S. An experimental study on mechanisms for sediment transformation due to riverbank collapse. Water 2019, 11, 259. [Google Scholar] [CrossRef] [Green Version]
- Qian, N.; Wan, Z.H. Sediment Motion Mechanics; Yang, J.F., Ed.; Science Press: Beijing, China, 1983; pp. 126–226. ISBN 9787030112606. [Google Scholar]
Publisher’s Note: MDPI stays neutral with regard to jurisdictional claims in published maps and institutional affiliations. |
© 2022 by the authors. Licensee MDPI, Basel, Switzerland. This article is an open access article distributed under the terms and conditions of the Creative Commons Attribution (CC BY) license (https://creativecommons.org/licenses/by/4.0/).