Article

Cross-Evaluation of Soil Moisture Based on the Triple Collocation Method and a Preliminary Application of Quality Control for Station Observations in China

1
Institute of Remote Sensing and Geographic Information System, School of Earth and Space Sciences, Peking University, Beijing 100871, China
2
National Experimental Teaching Demonstrating Center of Earth Sciences, Peking University, Beijing 100871, China
3
Coldwater Laboratory, Centre for Hydrology, University of Saskatchewan, Canmore, AB T1W 3G1, Canada
4
National Meteorological Information Centre, China Meteorological Administration, Beijing 100081, China
*
Author to whom correspondence should be addressed.
Water 2022, 14(7), 1054; https://doi.org/10.3390/w14071054
Submission received: 28 February 2022 / Revised: 22 March 2022 / Accepted: 25 March 2022 / Published: 27 March 2022
(This article belongs to the Section Soil and Water)

Abstract

:
Soil moisture (SM) measurements from ground stations are often after quality control (QC) in the operational system, but the QC flags may not be reliable in some cases when precipitation events or manual watering happen. This study applies the triple collocation (TC) method to conduct a cross-evaluation of SM data from ERA5 reanalysis estimates, ESA-CCI estimates, and ~2000 ground stations across the China domain. The results show that all datasets can capture the spatial pattern of SM in China. TC-based correlation coefficient (CC) and root mean square error (RMSE) show that the station data have worse performance in western and central China. For most stations, TC-based CC is between 0.6~0.9, and TC-based RMSE is between 0.01~0.06 m3/m3. In addition, TC-based metrics show good agreement with the CC between precipitation and SM, indicating that these metrics can reflect the quality of station data. We further selected typical stations (e.g., CC 0.2, RMSE 0.06 m3/m3) to check the quality of the QC procedure. The comparison shows that TC-based metrics can better represent the actual quality for these stations compared to raw QC flags. This study indicates that TC has the potential to detect problematic stations and could be a supplement to traditional QC of station observations.

1. Introduction

Soil moisture is an important component of global water and the energy cycle. Soil moisture plays a key role in the exchange of water and energy between the land surface and the atmosphere [1] and has an impact on various hydrological and biogeochemical processes [2]. A series of soil moisture datasets have contributed to improving our understanding of hydrological processes and climate systems, and are also useful for numerical weather forecasting, agricultural, and environmental applications [2].
There are three major ways of measuring or estimating soil moisture to meet the needs of research and applications, including ground stations, land surface models, and remote sensing [3,4,5,6,7]. Ground stations can directly measure soil moisture through sensors buried underground, which are generally regarded as benchmark data in the assessment of different products [2]. Models and satellite sensors are able to provide global-scale soil moisture data and thus are widely used in diverse studies and applications. However, each type of measurement method has its limitations. Point-based ground measurements can only obtain accurate information over a small ground area, and the construction of a dense ground measurement network is labor-intensive, expensive and hard to maintain [8]. The quality of model-derived soil moisture products is closely related to model algorithms and structure, physical parameters, and forcing data, while the retrieval algorithms, characteristics of microwave instruments, climate and geographical conditions are the main elements affecting the accuracy of remotely sensed soil moisture products [9]. Due to the limitations of these approaches, accurate observation/estimation of soil moisture is still challenging. As well, quantification of the uncertainties in model estimates and satellite measurements is critical to appropriately utilizing these data [8,9,10,11,12]. Until now, the comparison between soil moisture products and field measurements is the main method to evaluate soil moisture products [2].
Traditionally, ground observations from meteorological stations are used to validate model and remote sensing soil moisture. For example, An et al. [11] used 40 stations from the International Soil Moisture Network in China to evaluate soil moisture from the Climate Change Initiative (CCI) of the European Space Agency (ESA). Xu et al. [13] used a surface soil moisture dataset to simulate and predict subsurface soil moisture through the (de)coupling method. Cui et al. [12] evaluated three remote sensing soil moisture products in the Genhe area of China based on 10 stations. Chen and Yuan [9] used ~2400 stations over China to evaluate nine sub-daily soil moisture model products. Zeng et al. [6] used ground stations to verify the effects of meteorological forcing and land surface model simulations over China. Meng et al. [5] generated a fine-resolution (0.05°, monthly) soil moisture dataset based on different satellite products which are calibrated with in situ stations. Nevertheless, the coverage of ground observations is often limited, and the mismatch between point-scale station data and areal model/remote sensing data could cause uncertainties in the evaluation. Moreover, ground soil moisture observations cannot be regarded as the “truth” value. Many factors could affect the quality of station-based soil moisture, such as instrumental errors, instrument sensitivity, intermittent data communication, environmental changes, manual watering, etc. This is particularly true for automatic weather stations widely deployed in recent years, which are subjected to larger uncertainties owing to the relatively conventional QC procedure used.
Recently, the triple collocation (TC) analysis, proposed by Stoffelen [14] for the evaluation of wind speed, has been widely used in the evaluation of multi-source soil moisture as well as many other environmental variables [15,16,17,18]. TC does not need any reference data (or so-called “truth”), and can evaluate the accuracy of three independent input datasets, which has advantage over traditional statistical methods. For example, Kim et al. [19] compared global satellite-based and model-based soil moisture products and showed that TC performs well when the triplets are rightly selected. Xu et al. [20] used the TC method to assess the quality of different root zone soil moisture datasets and showed that TC results were consistent globally and could provide the spatial evaluation. Zheng et al. [2] used TC to assess 24 different soil moisture products and found that the TC results are close to station-based results, indicating the applicability of the TC method without station observations. All these studies utilize TC to evaluate the accuracy of the model or remote sensing soil moisture datasets with widely known spatiotemporal uncertainties. However, ground station soil moisture data also have uncertainties as we have discussed before and they are independent of model or remote-sensed soil moisture. Thus, using TC to double-check the possible QC problems of the station observations seems promising; however, it has been ignored by previous studies.
Therefore, this study aims to use the TC method to (1) evaluate the quality of soil moisture from a highly dense station network, satellite remote sensing, and reanalysis model in China, and (2) explore the potential of TC in the operational control of station data. Although there have been previous studies [1,2,3,8,9,10,11,12] using in situ stations to verify and assess model simulations or satellite products, this is the first time that the TC method is applied in evaluating the quality of ground stations from the climatological view. The study does not only reveal the accuracy of multi-source soil moisture data but it contributes to more accurate soil moisture observations in China.

2. Materials and Methods
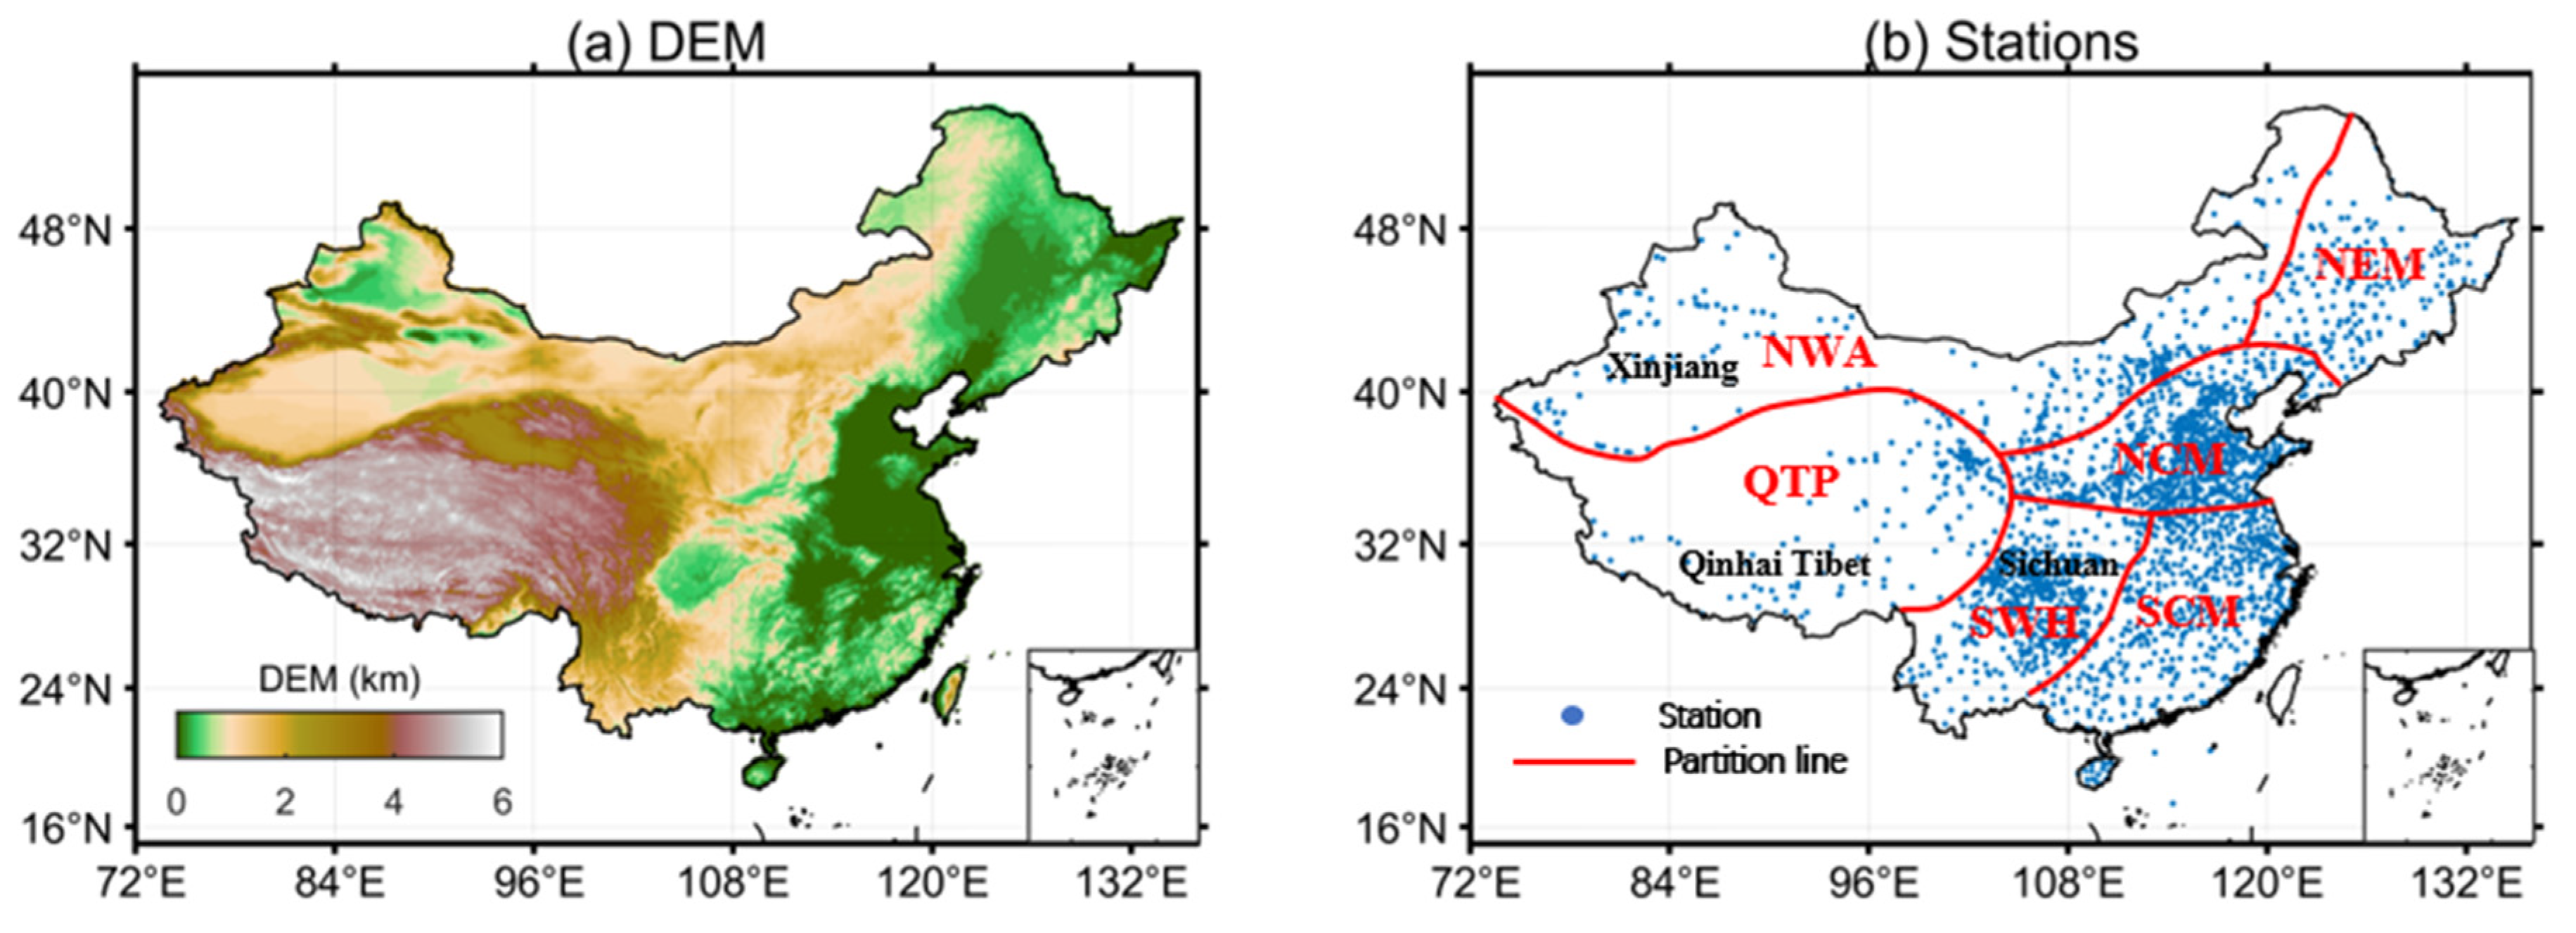
2.1. Study Area

China, which is located in central and eastern Asia and on the western shore of the Pacific Ocean, with an approximate 9.6 million km2 land area, is characterized by drastic variations of topography with elevation decreasing from the western to the eastern part (Figure 1a). Due to the influence of a monsoon climate, there are significant differences in precipitation, heat and moisture conditions from the northwest to southeast in the different seasons in China, such as lower precipitation and soil moisture in winter and higher in summer [21]. The annual precipitation in China gradually decreases from a maximum value of more than 2000 mm/year along the southeast coast to a minimum value of less than 100 mm/year in the northwest inland areas, and about 60% of the precipitation is concentrated in summer [21,22]. Previous studies [5,7] have shown that the distribution of soil moisture in China generally shows periodic fluctuations and a slight downward trend, which is summarized as dry (wet) in the north (south), with an increasing (decreasing) trend in the west (east) in the period from 2002 to 2018.
China can be divided into six subregions based on surface dryness and wetness, elevation, topography, and hydrogeologic features, including Northwest Arid Region (NWA, 38–53° N, 73–126° E), Qinghai–Tibet Plateau Region (QTP, 27–35° N, 73–104° E), Northeast Monsoon Region (NEM, 43–54° N, 118–135° E), North China Monsoon Region (NCM, 35–43° N, 106–128° E), Southwest Humid Region (SWH, 21–35° N, 98–110° E) and South China Monsoon Region (SCM, 18–35° N, 106–123° E) [5]. The climate characteristics of the six subregions are as follows [5,7,21]: The NWA includes vast arid and semiarid regions. The QTP is the highest plateau in the world and has cold weather and evident seasonal soil moisture variations. The NEM is dominated by cold air in spring and winter and has moderate rainfall in the summer and fall. The NCM is characterized by a typical temperate monsoon climate. The SWH includes the Yunnan-Guizhou Plateau and the Sichuan Basin. With abundant precipitation and dense river networks, the SCM belongs to a typical subtropical monsoon climate. The soil of China is characterized by clay, silty loam and sandy loam, and the main soil types of six subregions are as follows [23]: arensols, gypsisols and kastanozems (NWA); leptosols and cambisols (QTP); luvisols and phaeozms (NEM); fluvisols, luvisols and anthrosols (NCM); acrisols, alisols and regoslos (SWH); acrisols, anthrosols and gleysols (SCM). For more details on soil type information in China, please refer to Fischer et al. [23].

2.2. Soil Moisture Data

We collected daily soil moisture observations from ~2000 national automatic stations maintained by the China Meteorological Administration (CMA) over mainland China. The stations are relatively sparse in west China such as the Tibetan Plateau and Xinjiang Province (Figure 1b) due to the complex topography and low population. The measurement depths of stations are 10, 20, 30, 40, 50, 60, 80, and 100 cm.
The raw dataset has undergone the basic quality control process before being released by CMA. A two-step quality control method is used for the soil moisture observations [24,25]. First, soil temperature is used to check the abnormal extreme low soil moisture values [26]. Soil moisture values are flagged to be wrong if the soil temperature is less than or equal to 0 °C. Second, the abnormal extreme value check method (AECtrh) [25] is used to determine the soil moisture maximum threshold. Previous studies [25,26] have shown that the upper limit value of soil moisture can not exceed 0.6 m3/m3 in China. Therefore, CMA chooses 0.6 m3/m3 as the maximum threshold value. After the above basic quality control, each station will have a quality flag for every record. However, those quality flags may not be able to represent the actual quality of station data in some cases, as shown in Section 3.
ESA CCI soil moisture products have been widely used in many fields [27,28,29,30]. Based on measurements from many passive and active microwave sensors, three types of products are provided from 1978, including the ACTIVE, PASSIVE, and COMBINED products. In this study, the passive-active COMBINED product is used due to its seamless spatial coverage. The resolutions are daily and 0.25°. The ESA CCI SM dataset represents surface soil moisture of the first few centimeters of the soil (~0–5 cm), although specific depth depends on the satellite sensor used for a specific time and location.
ERA5 is the fifth generation of atmospheric reanalysis of the European Centre for Medium-Range Weather Forecasts [31]. It provides hourly data of numerous environmental variables starting from 1950 at the 0.25° resolution. ERA5-Land is produced by replaying the land component of ERA5 and can generate hourly data at a higher spatial resolution of 0.1°. Currently, ERA5-Land covers the period from 1981 to the present, which will be extended to be the same with ERA5 in the near future. ERA5-Land provides soil moisture data at four levels, i.e., 0–7, 7–28, 28–100, and 100–289 cm.
A challenge faced by this study is the scale mismatch in terms of temporal resolution, horizontal resolution, and vertical depth. To accommodate ESA CCI data (daily, 0.25°, ~0–5 cm), we adopted the first depth level of station observations (0–10 cm) and ERA5-Land (0–7 cm) and averaged hourly station and ERA5-Land data to the daily scale. The nearest neighboring interpolation is used to match gridded ERA CCI and ERA5-Land with point-scale station data. Although the method has been used by many studies, uncertainties exist in the evaluation, which, however, is hard to overcome given existing measurement and modeling systems.

2.3. Triple Collocation

The TC method used in this study is the extended TC (ETC), which can simultaneously estimate CC and RMSE of three independent inputs (i.e., stations, ESA CCI, and ERA5-Land). CMA station data are not used by ESA CCI and ERA5-Land. Although the ERA5-Land model may assimilate data from some satellite sensors used by ESA CCI, their final soil moisture data can still be regarded as independent [32] because the atmosphere/land processes of reanalysis models are totally different from remote sensing-based soil moisture estimation.
The classical TC can evaluate the accuracy of three input datasets and estimate RMSE. However, the ETC that could estimate the RMSE and correlation coefficient (CC) is proven to be more effective than the classical TC method [33]. Compared with the classical TC, the ETC has two significant advantages: (1) no additional assumptions are required; (2) it provides estimates of two complementary performance indicators (CC and RMSE) instead of one (RMSE). Therefore, the ETC method is used in this study, and its basic function is represented as follows [18]:
R i = A i + β i T + ε i
where R i ( i = 1 ,   2 ,   3 ) represents the estimated soil moisture from the i th product, A i and β i represent the two parameters, T represents the true soil moisture, and ε i is the random error of the estimated soil moisture.
To calculate the covariance between any two of the three input estimates, the function is represented as follows [18]:
C i , j = C o v ( R i ,   R j ) = β i β j σ T 2 + β i C o v ( ε j , T ) + β j C o v ( ε i , T ) + C o v ( ε i , ε j )
where j = 1 ,   2 ,   3 , and j i , and σ T 2 = C o v ( T ,   T ) represents the variance of the true soil moisture value.
TC has three assumptions: (1) the random errors of the three input datasets have expectations of zero; (2) the covariances between the random errors of the three inputs and the unknown truth are zero; and (3) the random errors of the three input datasets are independent with each other [14]. Therefore, Equation (2) could be transformed as follows [18,33]:
{ C 1 , 1 = β 1 2 σ T 2 + σ 1 2 C 2 , 2 = β 2 2 σ T 2 + σ 2 2 C 3 , 3 = β 3 2 σ T 2 + σ 3 2
{ C 1 , 2 = β 1 β 2 σ T 2 C 2 , 3 = β 2 β 3 σ T 2 C 1 , 3 = β 1 β 3 σ T 2
where σ T 2 = C o v ( ε i ,   ε i ) ( i = 1 ,   2 ,   3 ) indicates the variance of random errors for the i th input dataset, σ i denotes the RMSE of the input estimate. For Equation (4), the basic calculated function of C 1 , 2 is represented as follows [18]:
C i , j = 1 n k = 1 n ( R i R ¯ i ) ( R j R ¯ j )
where R ¯ i is the mean value of the i th product. Since there are six equations but seven unknowns ( β 1 , β 2 , β 3 ,     σ 1 , σ 2 , σ 3 ), there is no unique solution for the system. Therefore, we define a new variable θ i = β i σ T instead of directly solving for β i and σ T 2 . Thus, the six equations above could be transformed to the following formulas [18,33]:
{ C 1 , 1 = θ 1 2 + σ 1 2 C 2 , 2 = θ 2 2 + σ 2 2 C 3 , 3 = θ 3 2 + σ 3 2
{ C 1 , 2 = θ 1 θ 2 C 2 , 3 = θ 2 θ 3 C 1 , 3 = θ 1 θ 3
We now have six equations with six unkowns ( θ 1 , θ 2 ,   θ 3 ,   σ 1 ,   σ 2 ,   σ 3 ); thus, we can solve the system. The CCs and RMSEs of the three estimates are expressed in Equations (8) and (9) [18,33].
{ σ 1 2 = C 11 C 12 C 13 C 23 σ 2 2 = C 22 C 12 C 23 C 13 σ 3 2 = C 33 C 13 C 23 C 12
{ ρ 1 2 = C 12 C 13 C 11 C 23 ρ 2 2 = C 12 C 23 C 22 C 13 ρ 3 2 = C 13 C 23 C 33 C 12
where C i j ( i = 1, 2, 3, and j = 1, 2, 3) is the covariance between any two input datasets, σ i ( i = 1, 2, 3) is the RMSE of the i th input, and ρ i 2 is the CC of the i th input.

3. Results and Discussion

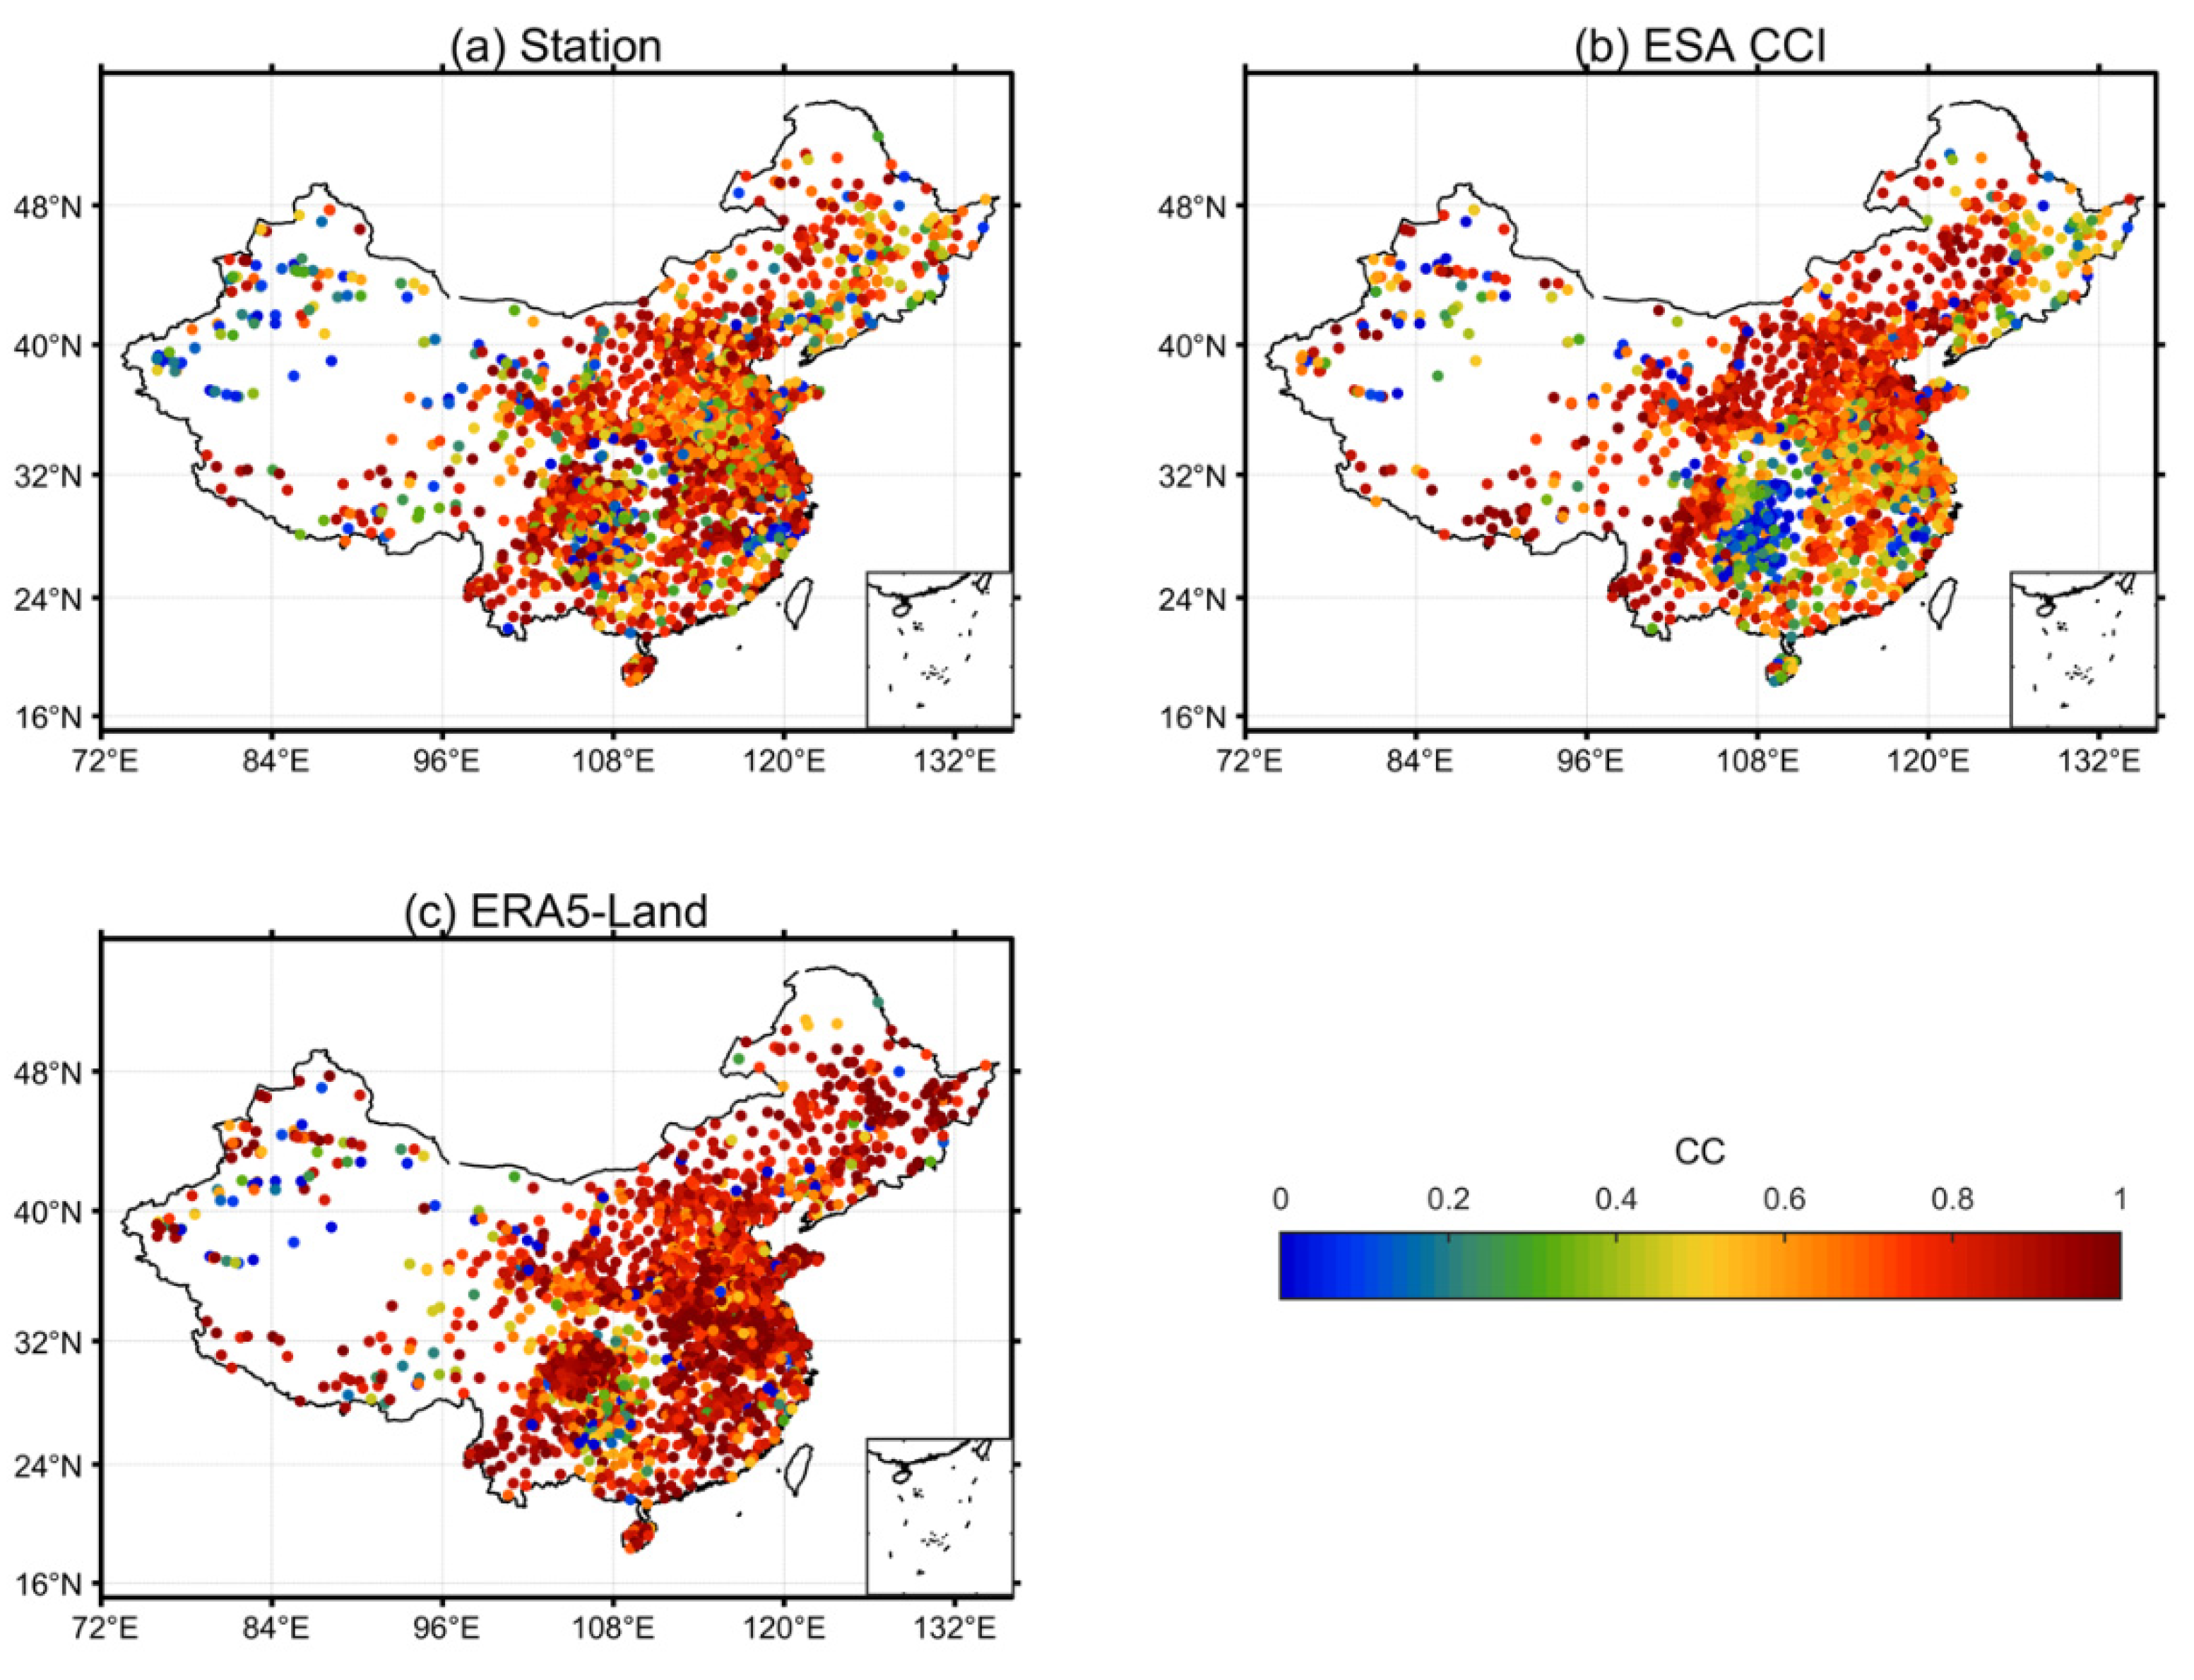
3.1. Soil Moisture from Different Data Sources

Figure 2 shows the mean daily soil moisture in China in 2018 from stations, ESA CCI remote sensing estimates, and ERA5-Land reanalysis model estimates. All datasets show higher soil moisture in south China and lower soil moisture in north and west China. However, stations show much stronger spatial variability compared to ESA CCI and ERA5 in 2018. The spatial distribution of station soil moisture (Figure 2a) in SWH, SCM and center of NWA shows the characteristic of coexistence of low values (~0.2 m3/m3) and high values (~0.5 m3/m3), while the soil moisture in the same regions of ESA CCI and ERA5-Land shows a relative smooth spatial distribution. We suppose there are two reasons. ESA CCI and ERA5-Land may fail to capture the spatial variability of soil moisture caused by land cover and soil property variations. Conversely, there might be some quality problems of the ground stations because in the SWH and SCM, the average annual soil moisture should be at a high level since the terrain is relatively flat and the rainfall is sufficient. The TC analysis in this study will be helpful to determine the exact cause of the differences between datasets. On the whole, ESA CCI shows the smallest north–south difference of soil moisture with a smooth spatial distribution. ERA5 shows the highest soil moisture in most regions of China such as the SWH, SCM, and NEM parts. In particular, both ESA CCI and ERA5-Land show higher soil moisture than stations in the QTP where the snow cover and frozen soil may affect the accuracy of all kinds of measurement/estimation approaches.
Several stations exhibit much higher or much lower soil moisture compared to surrounding stations (Figure 2a), especially in SWH and SCM. The phenomenon may be caused by the quality problems of stations because the mean annual soil moisture should not have such a large variation if the land surface and hydrogeologic conditions do not show substantial changes. More specifically, there is a certain correlation between soil moisture and geographical factors such as precipitation, air temperature, actual evaporation, relative humidity and sunshine time [34]. Since these correlations weaken with increasing distance, the soil moisture of a site is different from the surrounding sites, which to some extent shows that there may be some quality problems with the site. The measurement of soil moisture depends on sensors buried underground, which are more difficult to maintain and monitor than traditional aboveground meteorological stations (e.g., rain gauges). The quality flags provided together with soil moisture data may not always be reliable. The basic quality control (in Section 2.2) eliminated abnormal soil moisture values (≤0 m3/m3 or >0.6 m3/m3) of stations but did not screen out the problematic stations from the whole station dataset.
Figure 3 shows an example station for which the quality flags indicate all records have passed quality control procedures. However, Figure 3b,d shows that when a large amount of precipitation was detected at the target site, soil moisture of the target station did not change. Based on the spatial distribution (Figure 3b–d), the target station does not show a large difference of mean precipitation and soil moisture compared to neighboring stations. This is because the target station always shows soil moisture ~0.2 from Day 100 to 365 (covering the summertime in China). However, the time series of the target station is obviously abnormal. Moreover, the soil moisture and precipitation curves show that soil moisture observations are problematic. In the rainy season (June to August), there are many notable precipitation events, while soil moisture observations do not show any response to the precipitation. Therefore, additional quality control is necessary before the application of raw station soil moisture data.

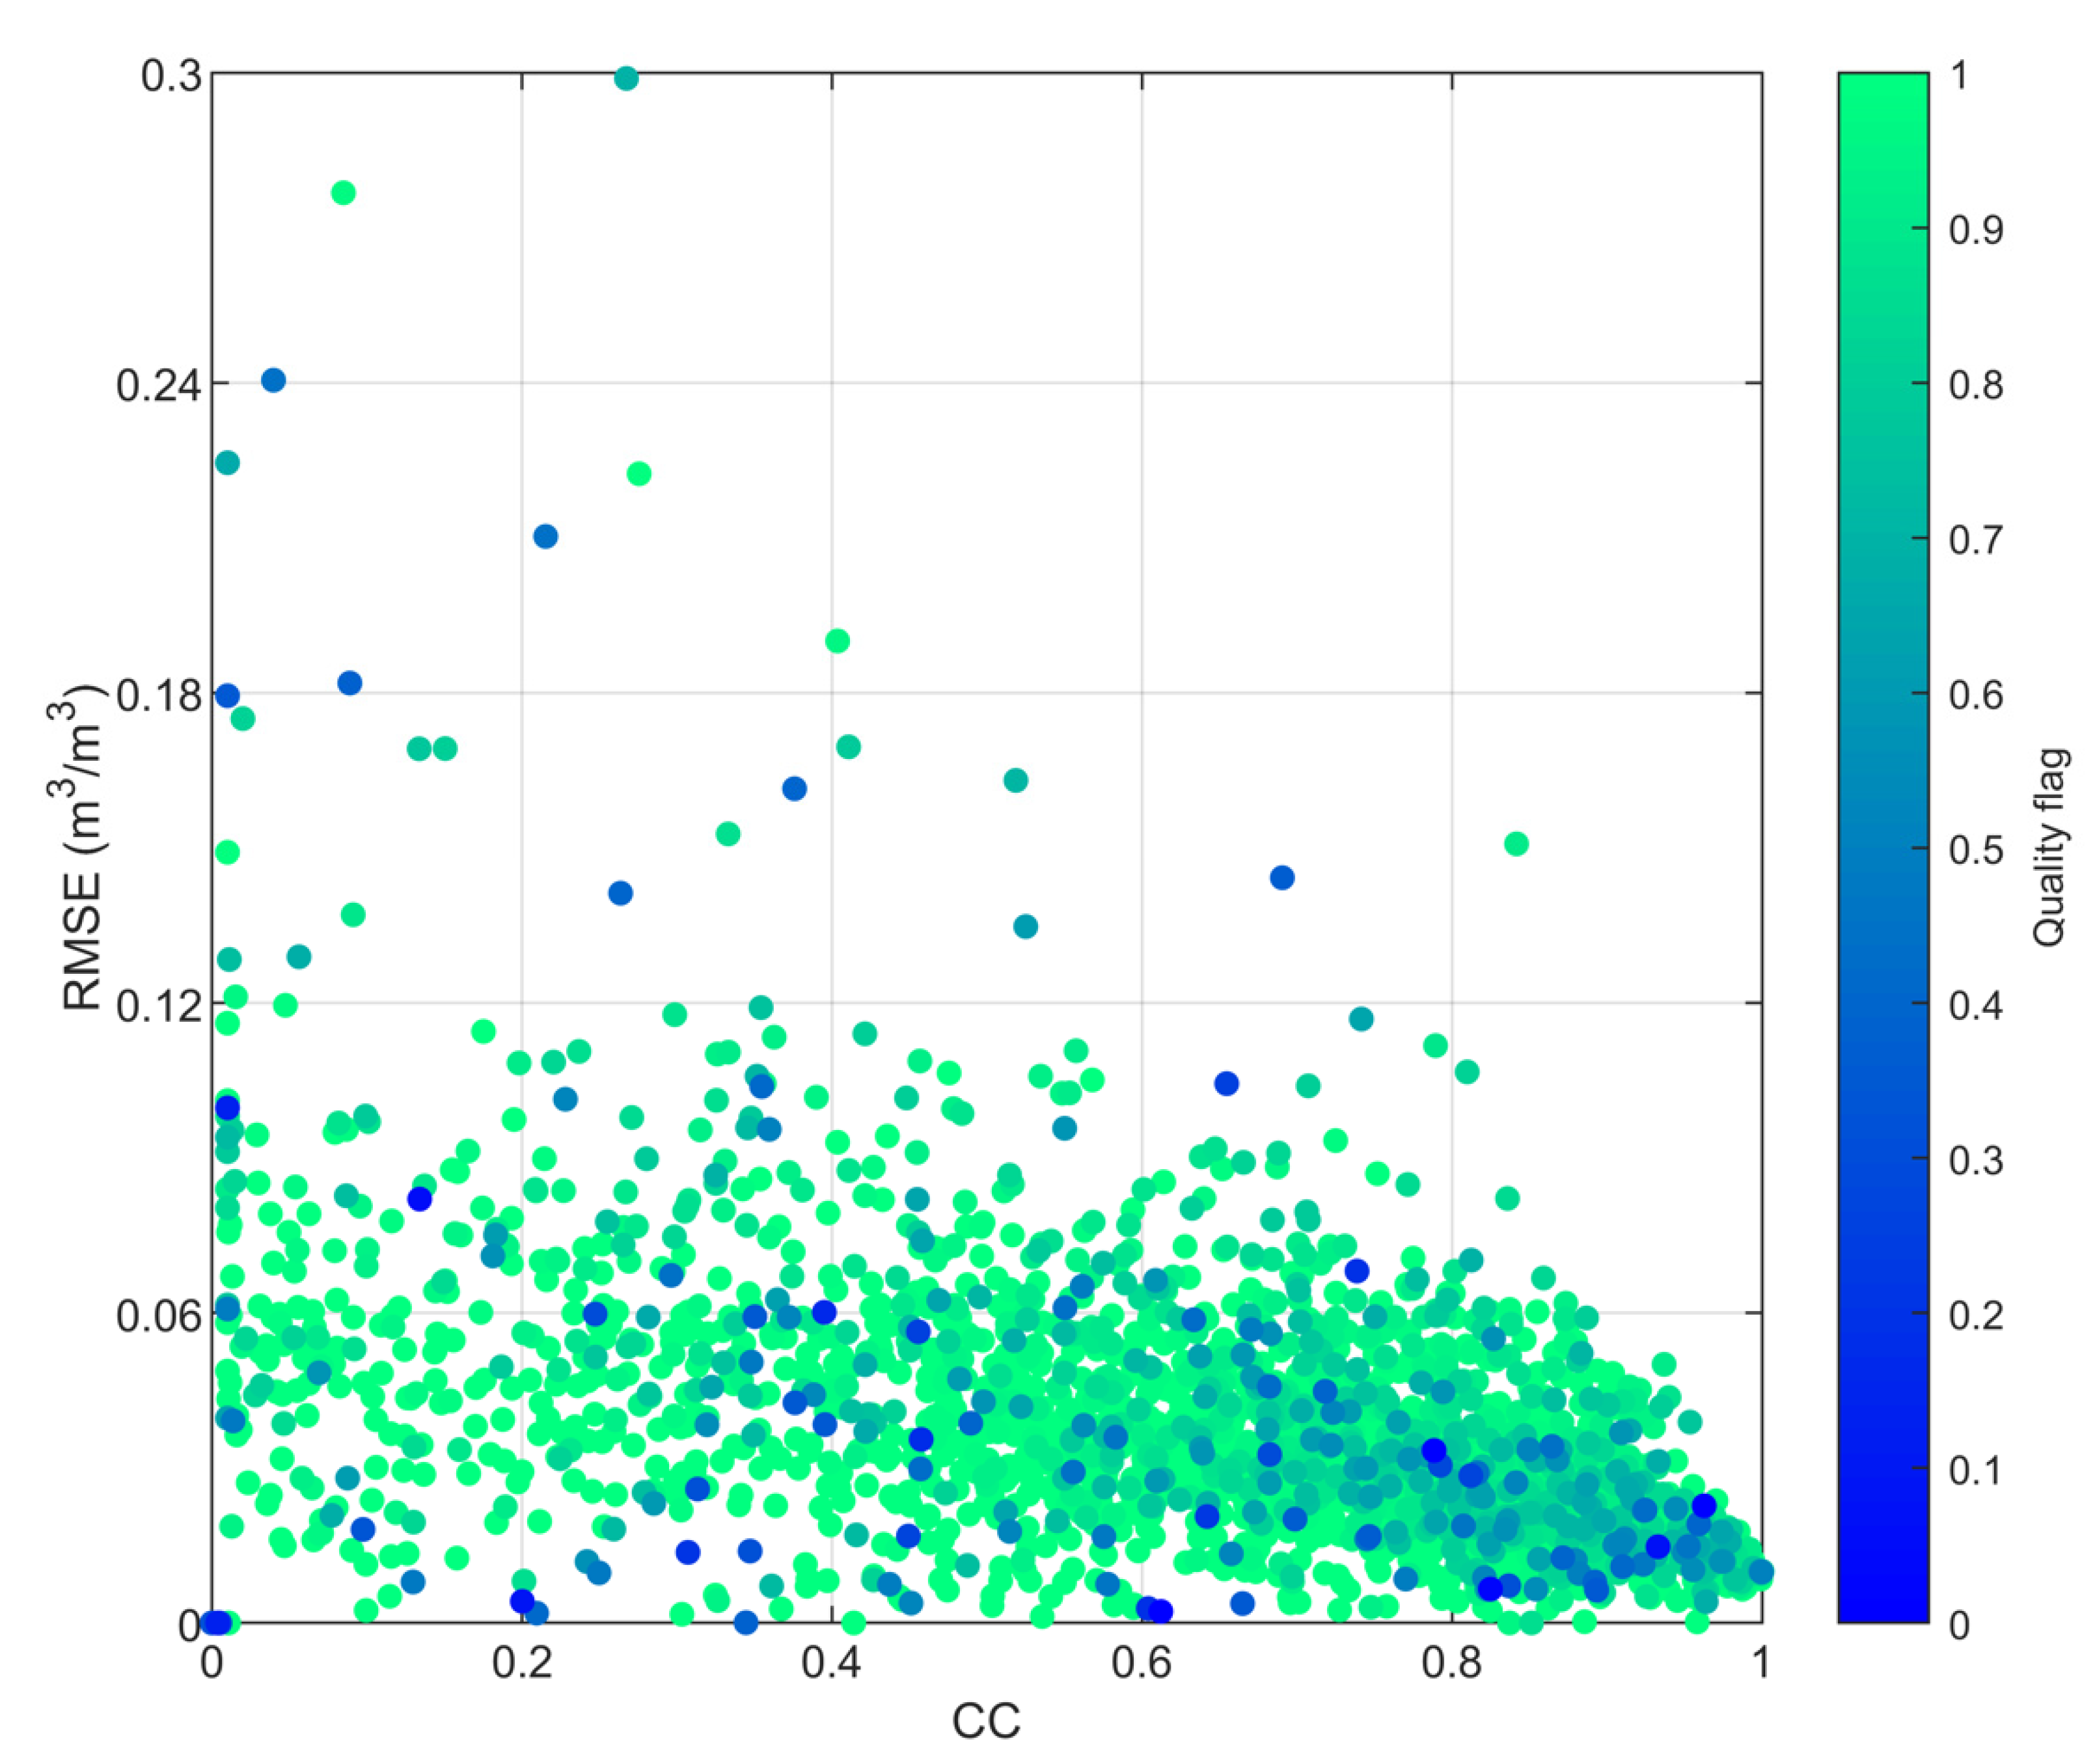
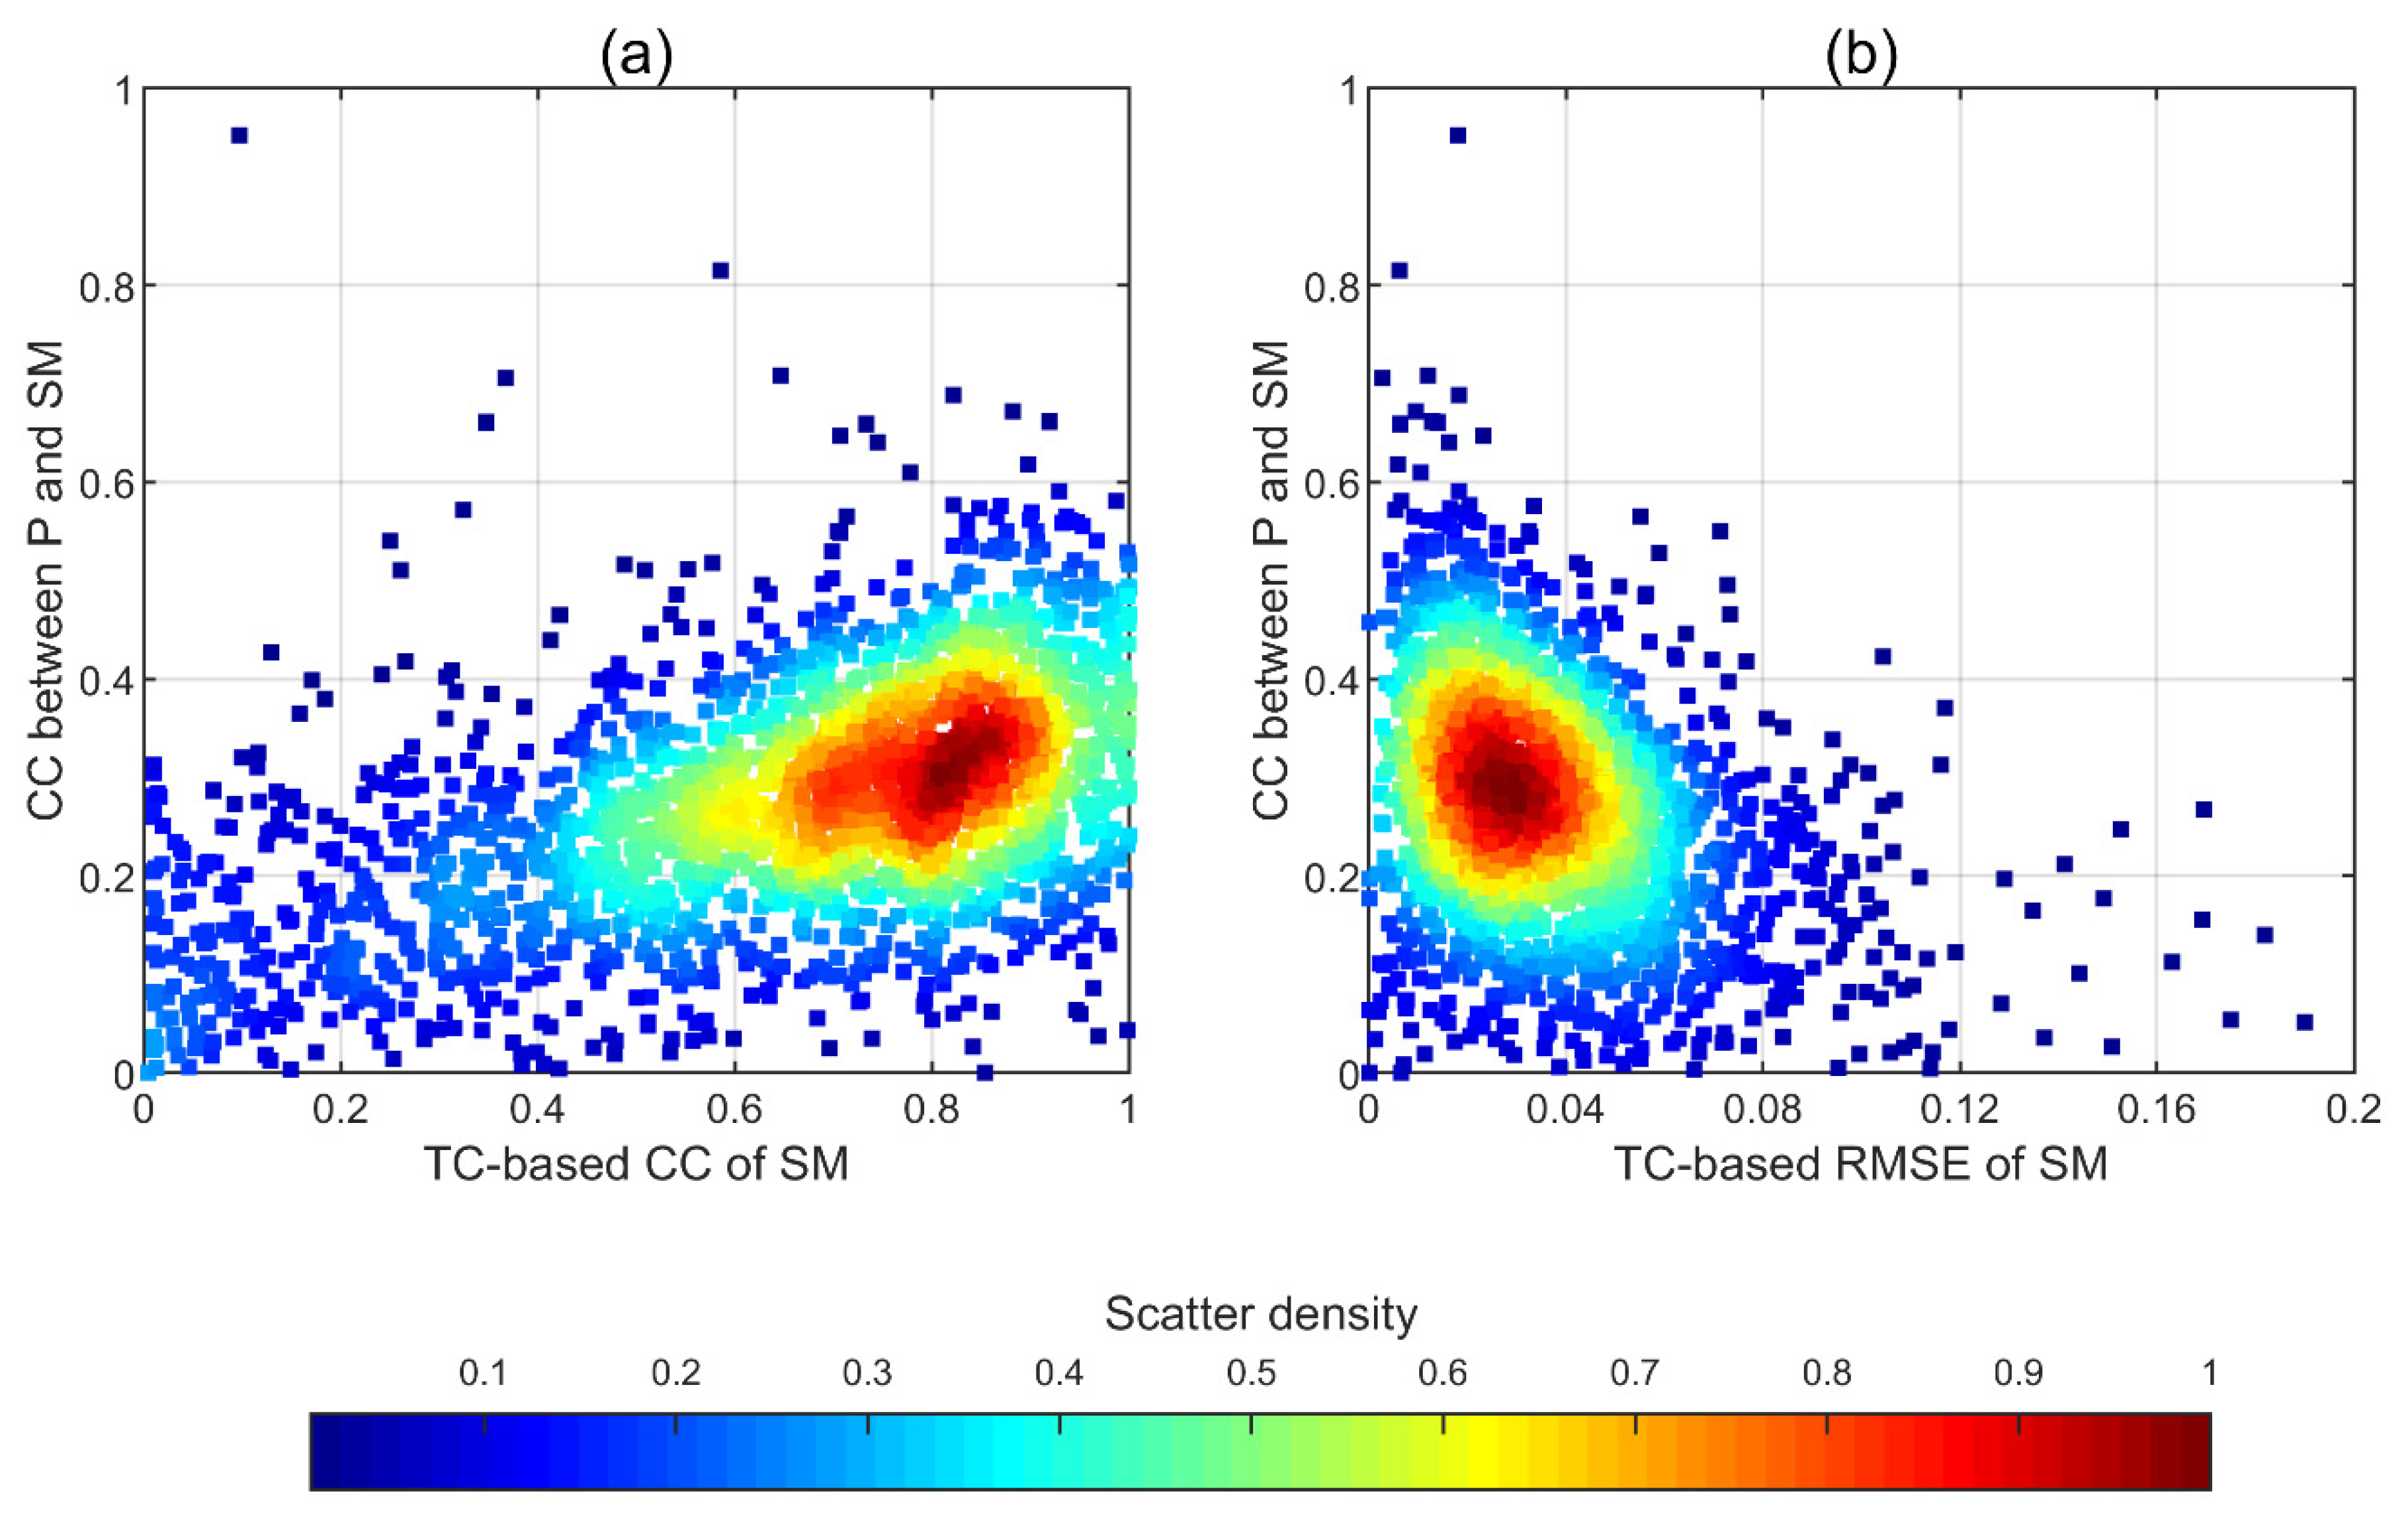
3.2. Triple Collocation-Based Evaluation

Station, ESA CCI, and ERA5-Land soil moisture data are evaluated using the TC method. Figure 4 and Figure 5 show TC CC and RMSE estimates, respectively. ERA5-Land shows the highest CC in most regions of China. The station shows lower CC than ERA5-Land, and some stations show much lower CC than surrounding stations. It is suspected that those stations may be subject to quality problems. ESA CCI shows higher quality in northern regions than southern regions probably because the abundant precipitation in south China often leads to saturation of soil and thus poses challenges to remote sensing-based retrieval. Particularly, ESA CCI shows low CC in the Sichuan Basin, eastern to the Tibetan Plateau. In west China, such as in Xinjiang Province, the CC of all datasets is low probably due to the complex topography. The results of station evaluation originate from two components: the quality of station data and the scale match between station and gridded estimates.

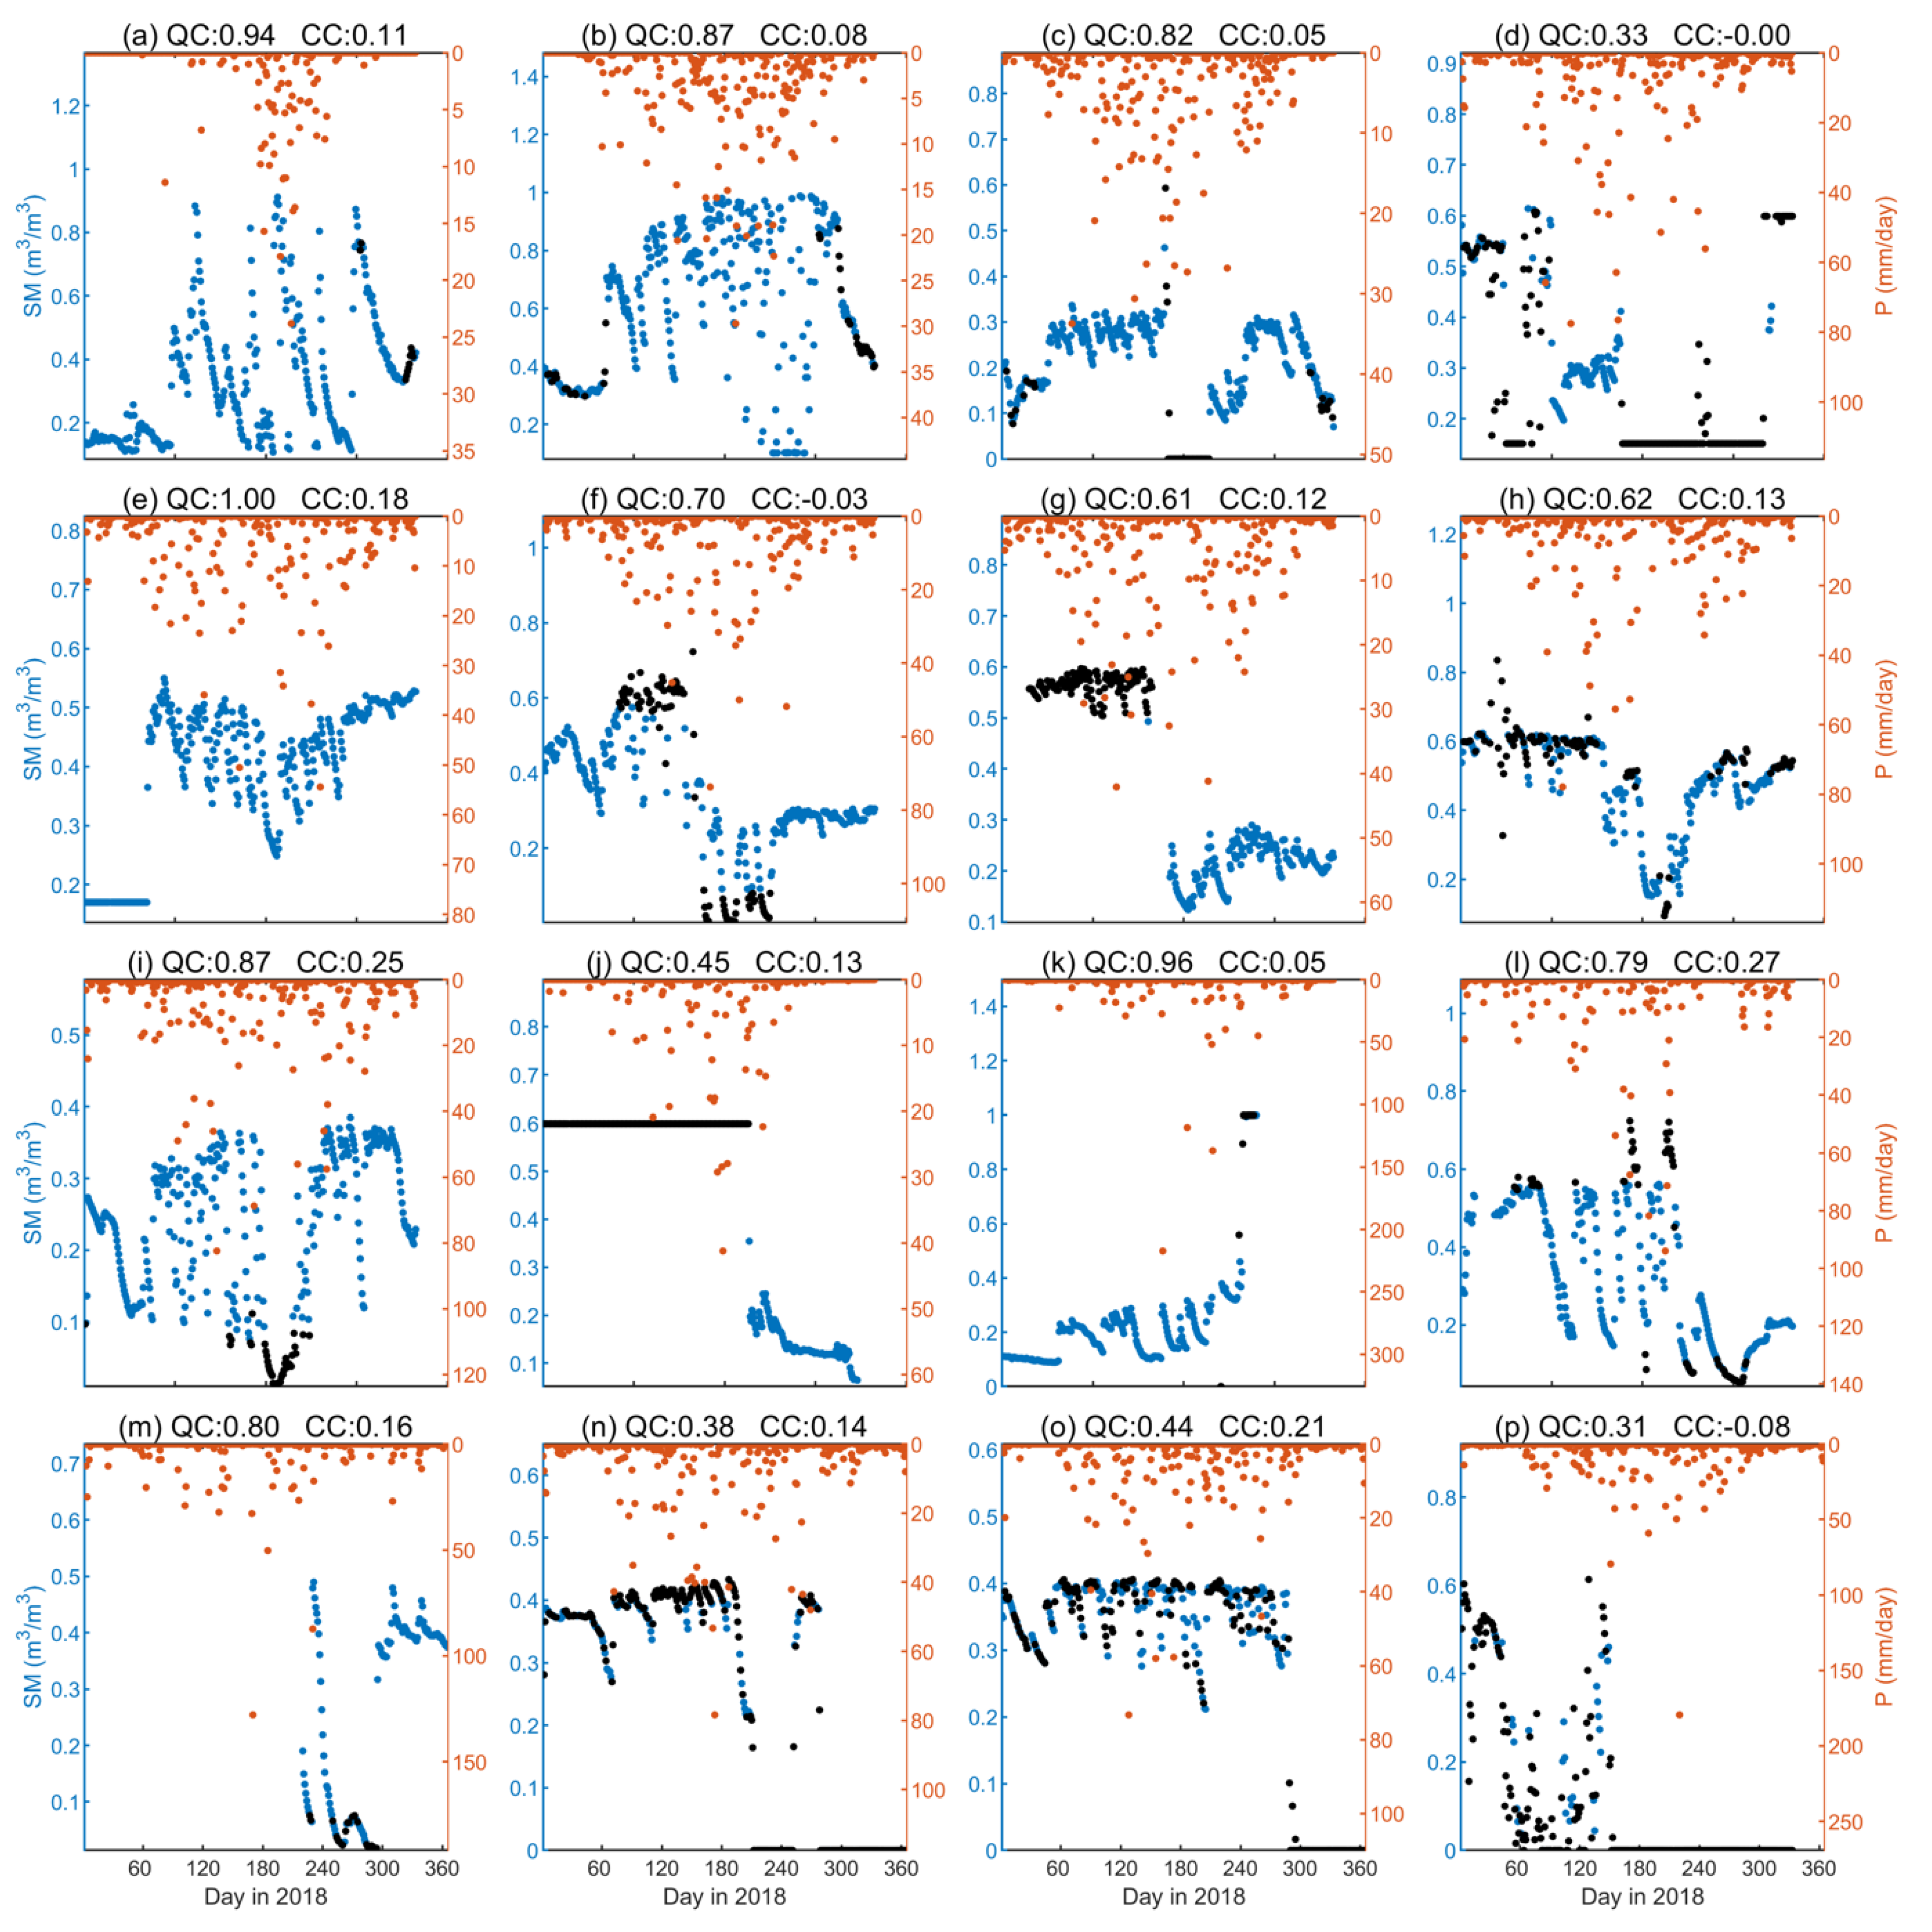
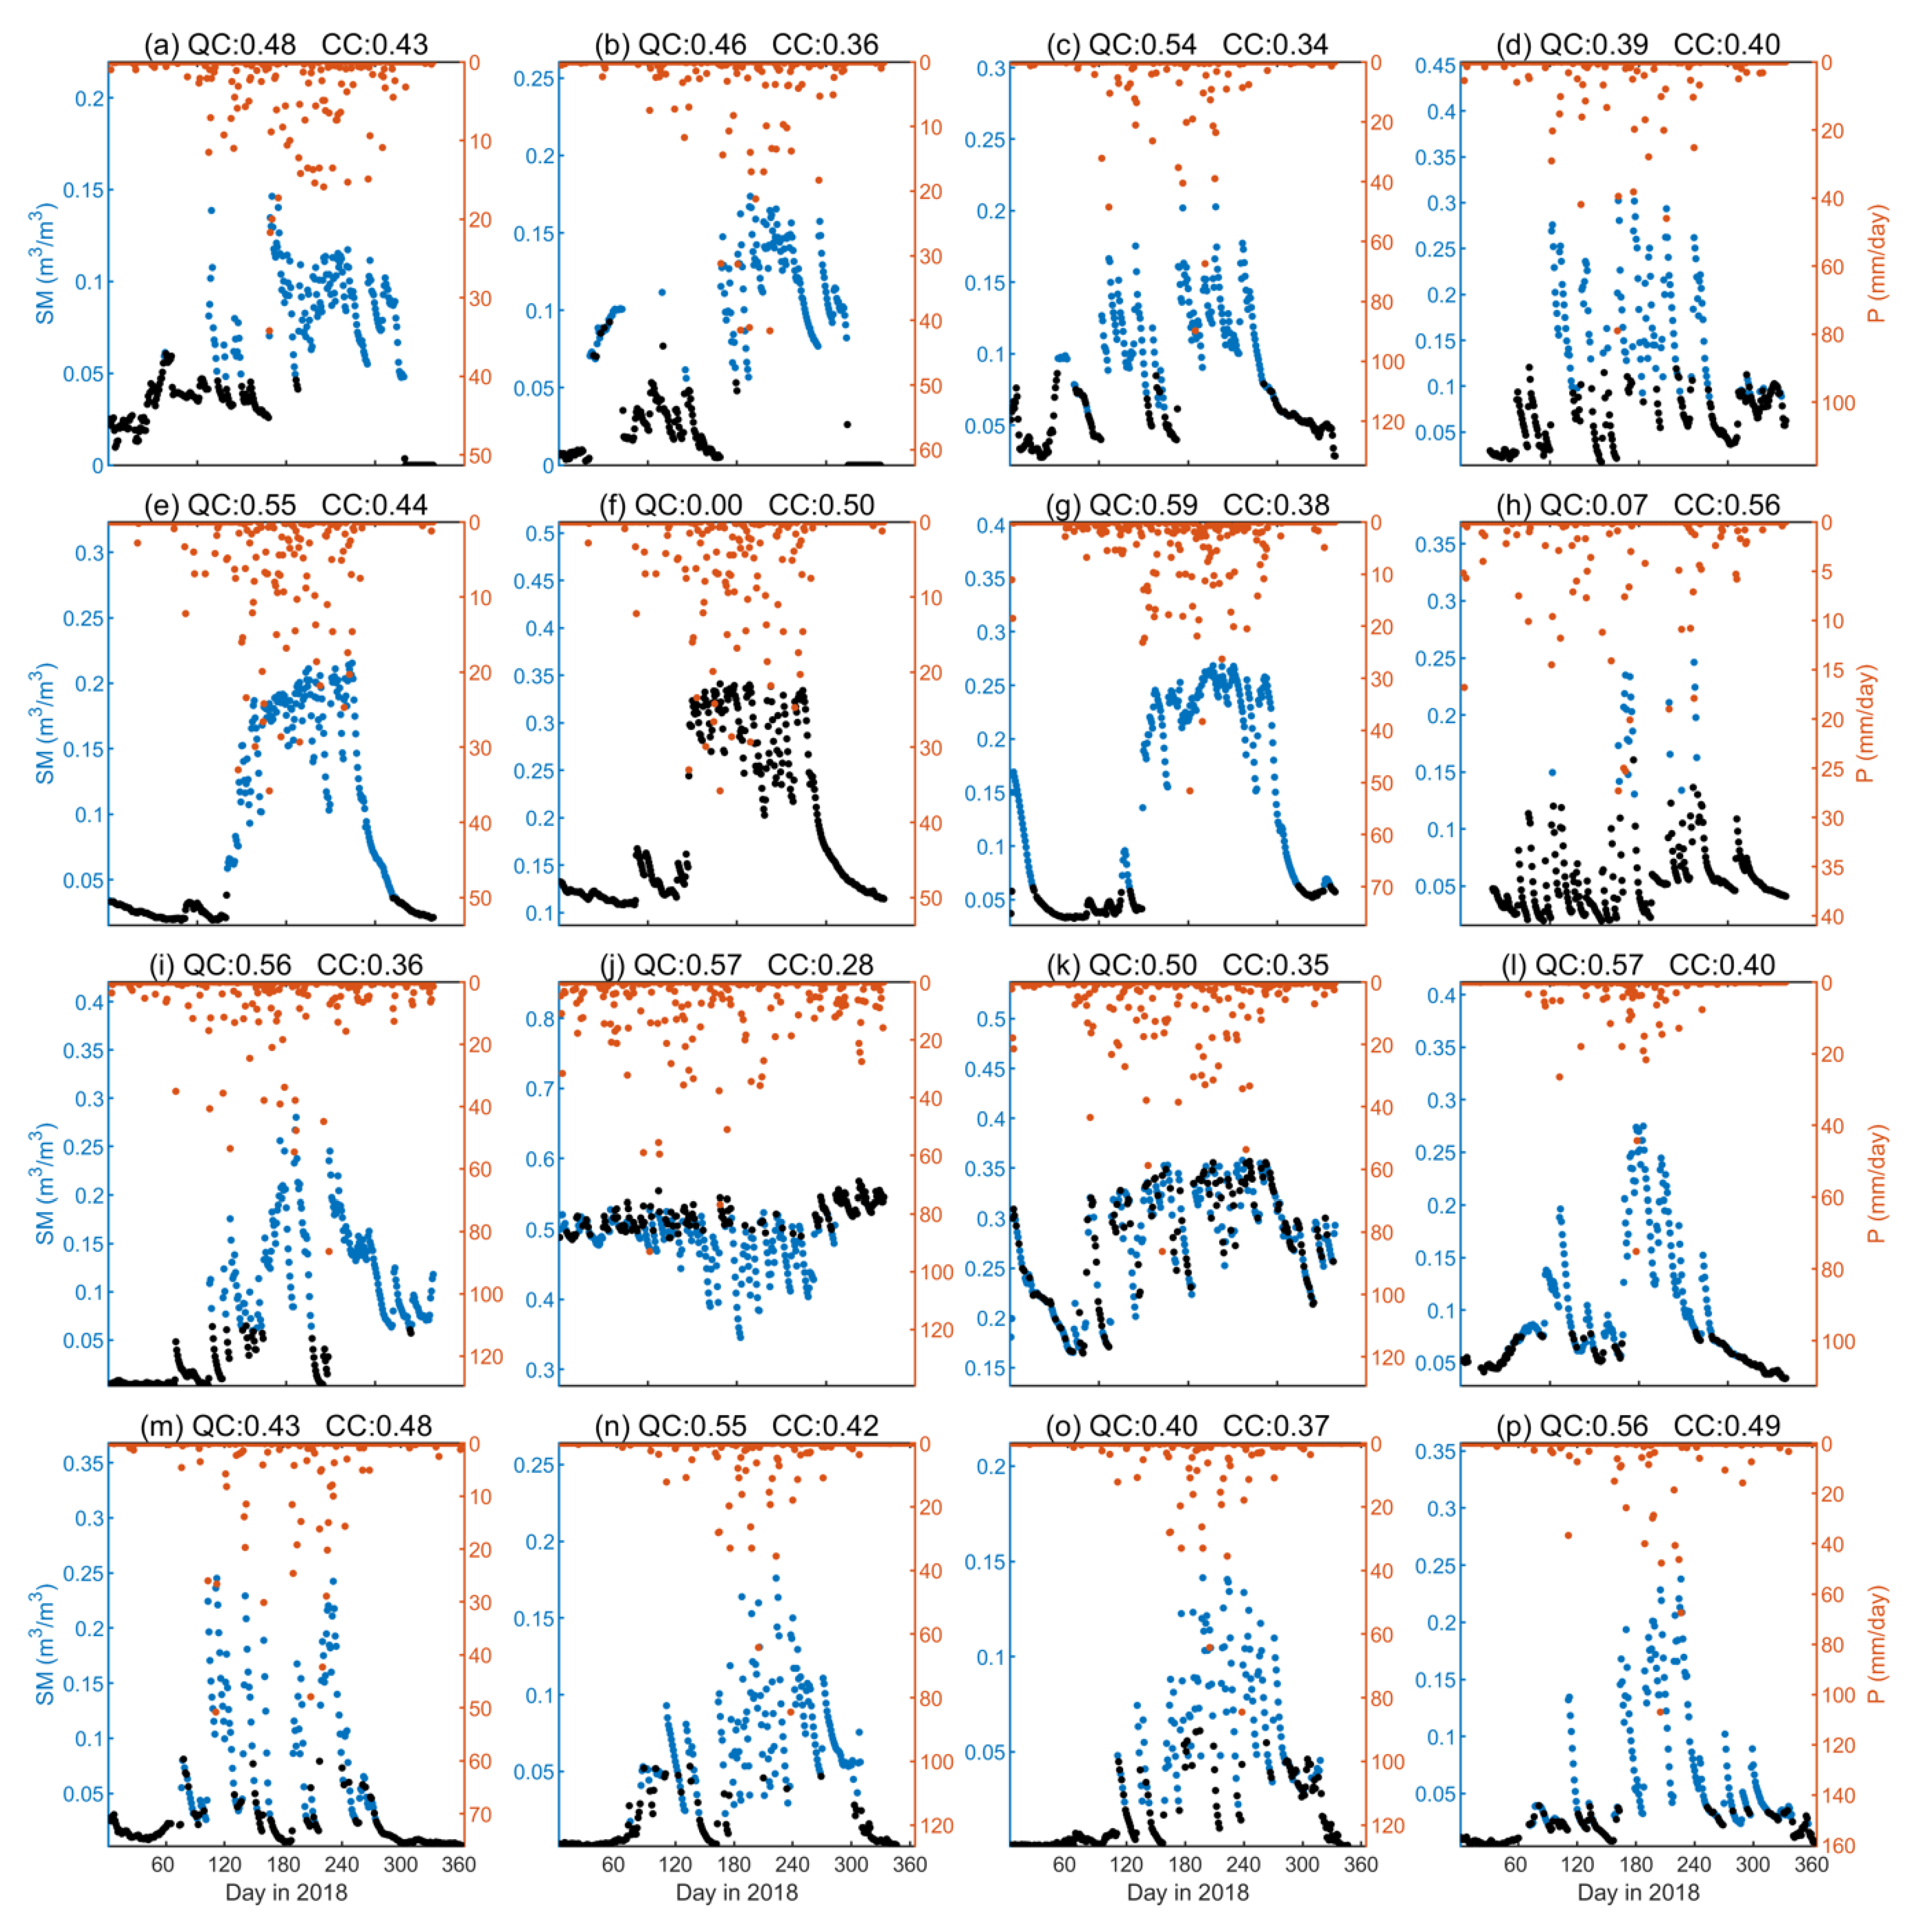
3.3. Application of Triple Collocation in Soil Moisture Quality Control

In this section, we tested the applicability of triple collocation in the quality control of ground soil moisture observations. Figure 6 shows the relationship between TC-based CC and RMSE and the quality flags provided by stations. Ideally, higher quality flag values represent better station quality. However, Figure 6 shows that stations with high quality flag values could have low CC and RMSE, indicating that TC-based evaluation does not agree with station information, which originates from the problem of station quality flags, as we have mentioned. Therefore, it will be valuable if TC-based CC and RMSE can act as indicators of station soil moisture quality.
To validate this possibility, we need a more reliable approach to represent the quality of station data. A possible way is a manual check by experts, which however is not possible for the entirety of China. Therefore, we use the CC between precipitation and soil moisture observations to show whether the quality of soil moisture data is reliable. We consider that ground soil moisture observation is easily affected by factors such as soil type, surface temperature and surface terrain conditions. These factors may result in some uncertainties in the quality flags of soil moisture data. The precipitation data, by contrast, can be measured relatively accurately. The precipitation data are also proven accurate and used in the evaluation of other datasets in a large number of studies [35,36,37,38,39]. We also can see from Figure 2a and Figure 3c that the homogeneity of precipitation distribution is better than that of soil moisture distribution in China. Thus, an implicit assumption is that precipitation observations are reliable (or at least, more reliable than soil moisture observations), which can be met because precipitation is much easier to measure, and precipitation quality flags are often more reliable compared to soil moisture. CC between precipitation and soil moisture is an effective indicator considering that the two variables have strong physical linkage, and remote sensing soil moisture has been used to estimate precipitation via the popular SM2RAIN method [4,40]. Figure 7 shows the scatter density plots between TC-based CC/RMSE and precipitation–soil moisture CC. TC-based CC of the majority of ground stations is in the range of 0.6~0.9 (Figure 7a), while TC-based RMSE of the majority of ground stations falls in the range of 0.01~0.06 m3/m3 (Figure 7b). It is obvious that as the CC between precipitation observations and soil moisture observations increases, TC-based CC increases and TC-based RMSE decreases. This is inspiring because TC-based evaluation results and precipitation–soil moisture CC show clear positive relation, indicating that TC-based evaluation results can also act as an effective indicator of the quality of station soil moisture data.
Figure 8 shows precipitation and soil moisture data of 16 example stations with TC-based CC < 0.5 and RMSE > 0.15 m3/m3. The quality flag values and CC between precipitation and soil moisture are shown in subtitles. It is obvious that the quality flags cannot well represent the actual station quality. For example, in Figure 8a, the overall quality flag value is up to 0.94, and the number of failed records is small. However, the response of soil moisture to precipitation is weird. For example, for Days 90–100, soil moisture shows a constantly increasing trend, while precipitation events are scarce and small. The overall precipitation–soil moisture CC is only 0.11. Several other stations (e.g., Figure 8b,i,m) show similar problems. Figure 8c,e shows a different problem, i.e., the time series of soil moisture is abnormal, which is not well captured by quality flags. Particularly, Days 1–80 in Figure 8e show a flat soil moisture curve, which is problematic when several precipitation events occur, while quality flags indicate that those records pass quality control. There are also many stations where quality flags can capture problematic records well (e.g., Figure 8d,p). In Figure 8d, for days 1–60, soil moisture is about 0.55 m3/m3 while precipitation events are scarce and small. The quality flags captured this phenomenon and the whole QC is 0.33. However, as a whole, quality flags are not perfect for determining the actual quality of soil moisture observations.
Figure 9 is converse to Figure 8, which shows example stations with high TC accuracy (CC > 0.9, RMSE < 0.05 m3/m3) but low quality flags (QC < 0.6). In short, Figure 9 includes stations that are reliable based on TC but are not reliable based on quality flags. For example, Days 1–90 in Figure 9e show a flat soil moisture curve, which is below 0.05 m3/m3 while there are few precipitation events. However, quality flags indicate that those records fail quality control. In addition, those stations all show high CC between soil moisture and precipitation, with the mean CC being 0.41, the median CC being 0.44, and the minimum CC being 0.28 in Figure 9j. The mean and median CC values of all stations in China are 0.26 and 0.27, respectively. Therefore, we believe that those stations are generally in good quality based on both TC evaluation and precipitation–soil moisture CC. Meanwhile, quality flags can also capture a few obviously failed soil moisture records in Figure 9a,b. However, the mean quality flag < 0.6 indicates that at least 40% of records are problematic, which does not agree with our intuitive judgements based on the time series in Figure 9, TC evaluation, and precipitation–soil moisture CC.
In general, the results of TC analysis show that the quality flags provided by station data cannot perfectly represent the actual quality of soil moisture observations, while the TC-based accuracy metrics can better represent the actual quality of those typical stations. Therefore, the results of TC analysis are helpful to identify problematic soil moisture observation stations, to check and repair problematic stations, and are helpful to the design of soil moisture ground station networks. However, the TC algorithm presented in this study currently only compares the soil moisture data of the site with ERA5 and ESA CCI products, a more proper comparison of TC results can be performed with different remotely sensed and simulated soil moisture datasets in a future study.

4. Conclusions

Triple collocation has been widely used to evaluate the quality of remote sensing and model estimates of various environmental variables such as soil moisture. Ground observations are often treated as the truth and are used to verify the effectiveness of triple collocation evaluation results. However, no study considers the potential of triple collocation in detecting problematic ground stations. In this study, we utilized ~2000 stations providing daily soil moisture measurements and quality control flags in China and evaluated the quality soil moisture from a highly dense station network against ERA5 and ESA CCI soil moisture products. Then we applied the TC method to conduct the cross-evaluation of station observations, ERA5 and ESA CCI. Finally, we evaluated the applicability of TC in representing the quality of station soil moisture based on general evaluation and comparison with another quality indicator (i.e., precipitation–soil moisture correlation). The main conclusions are given as follows:
(1)
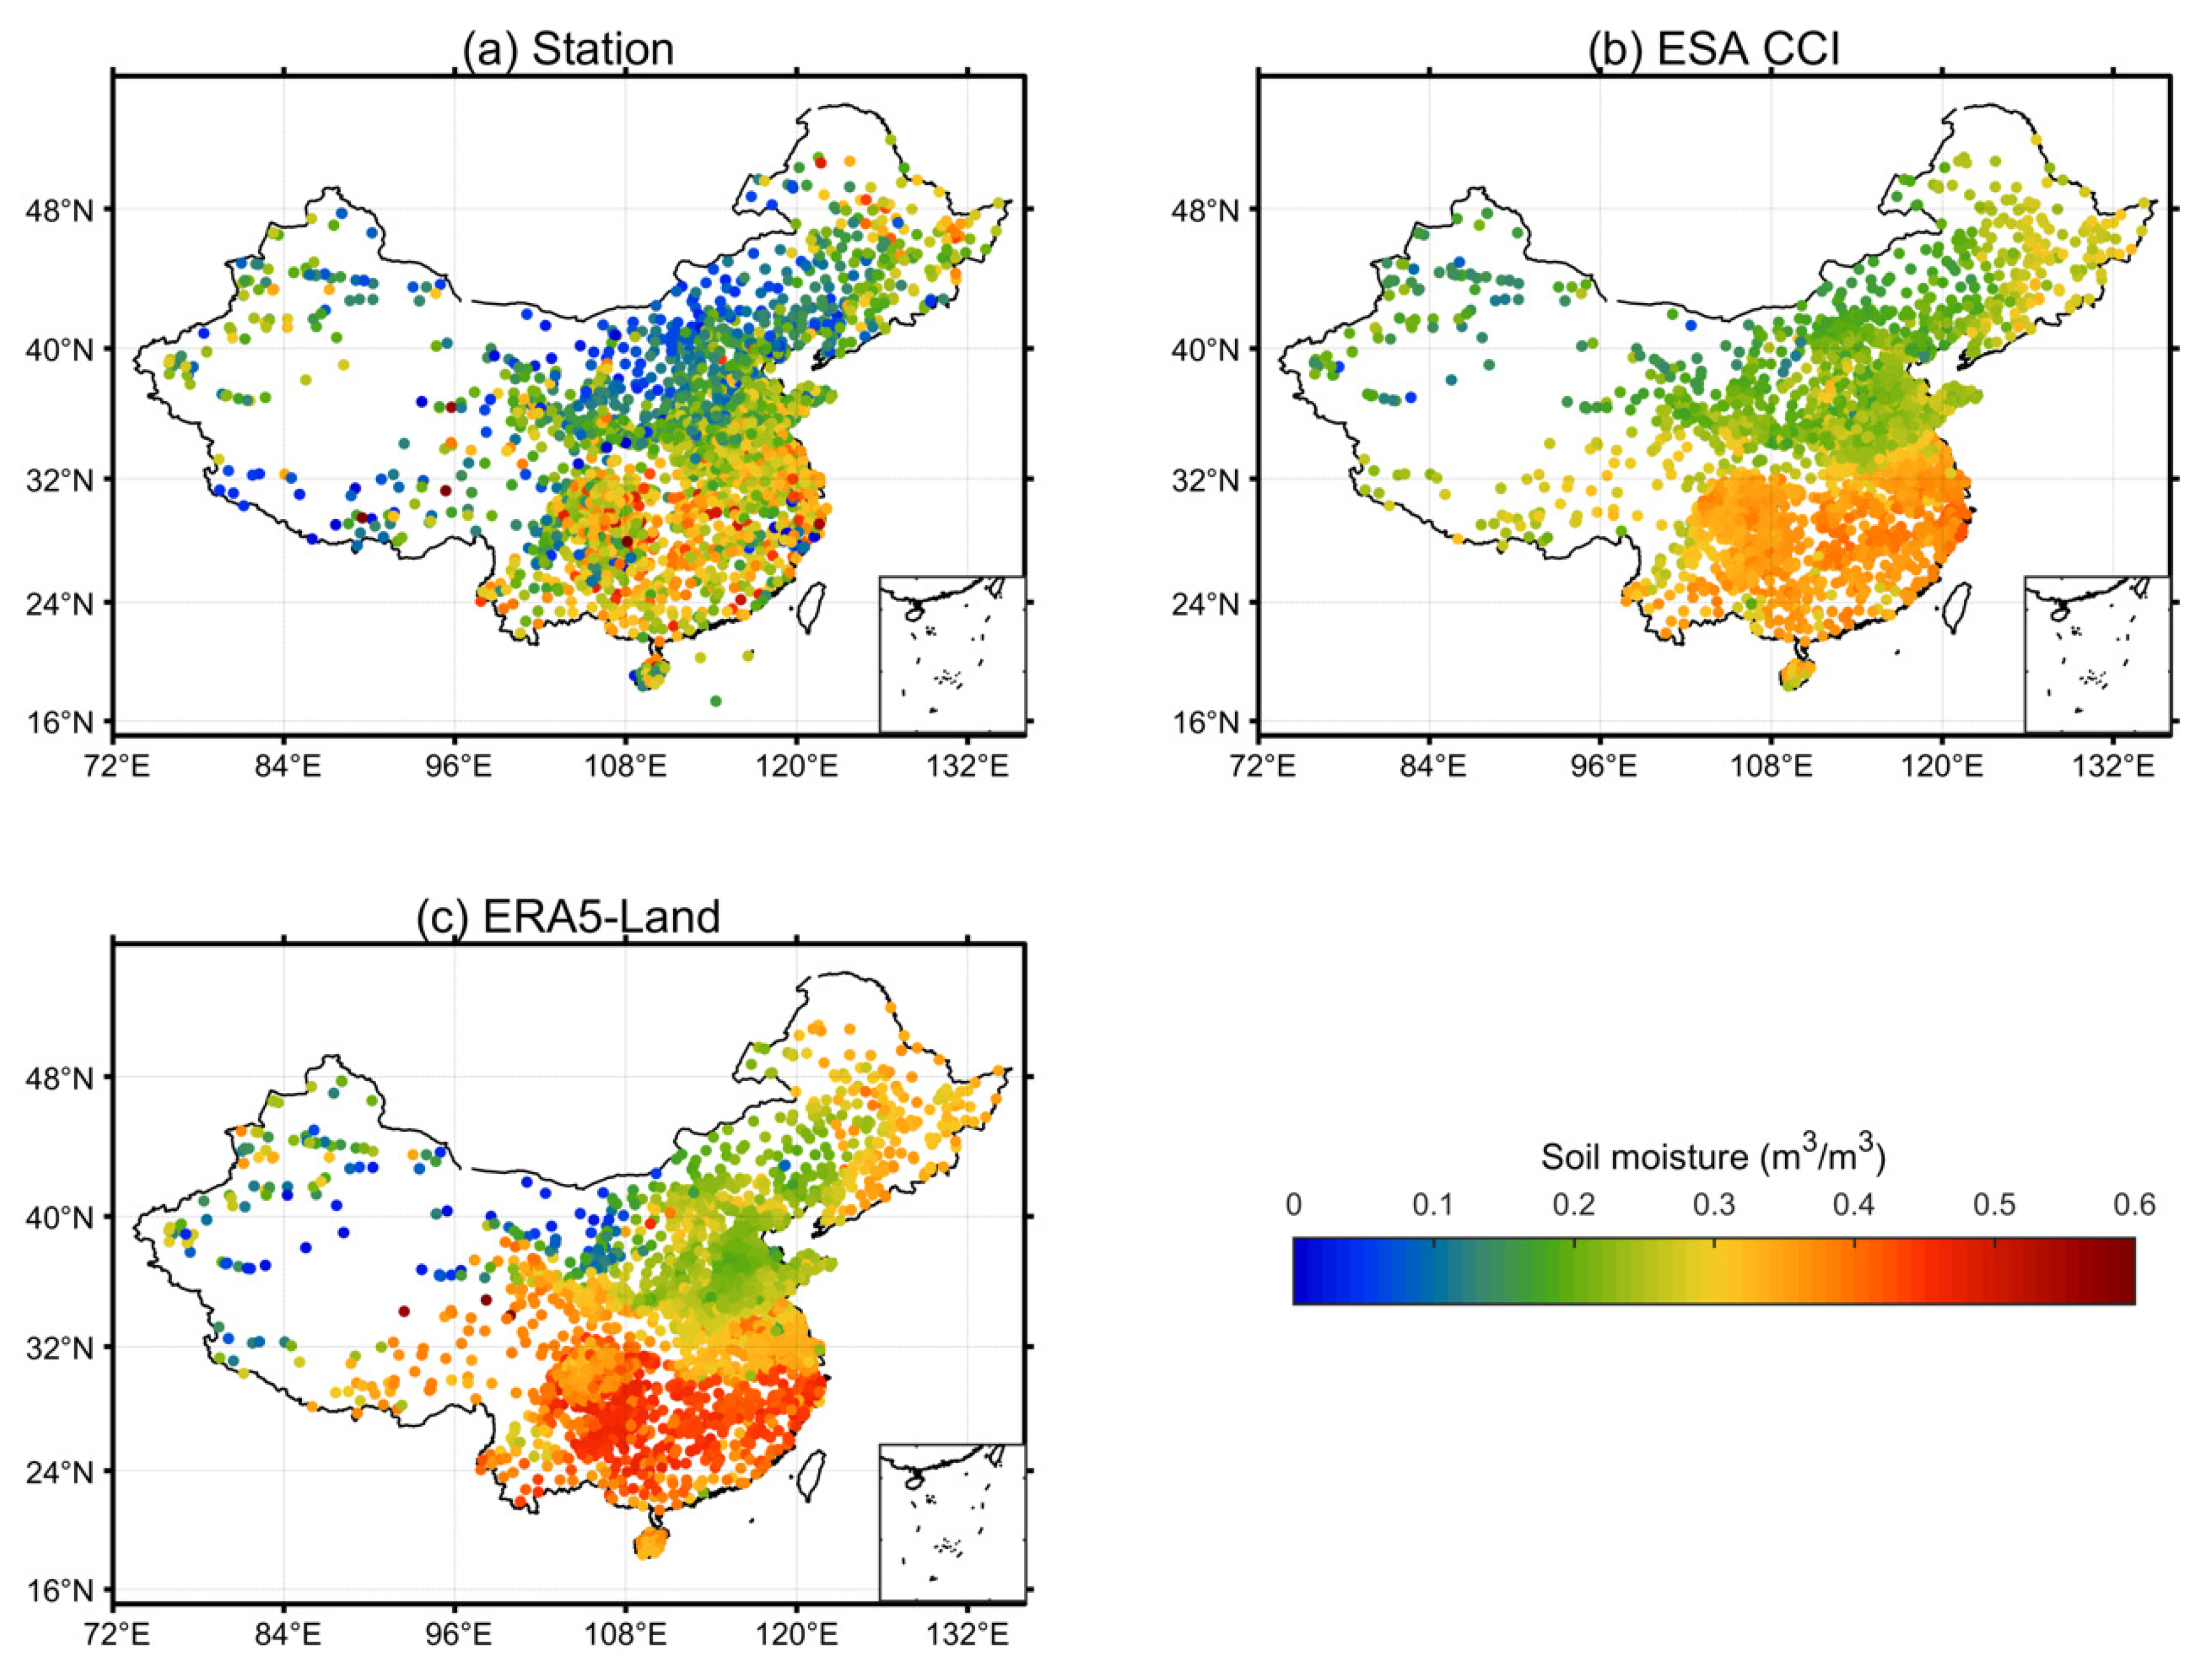
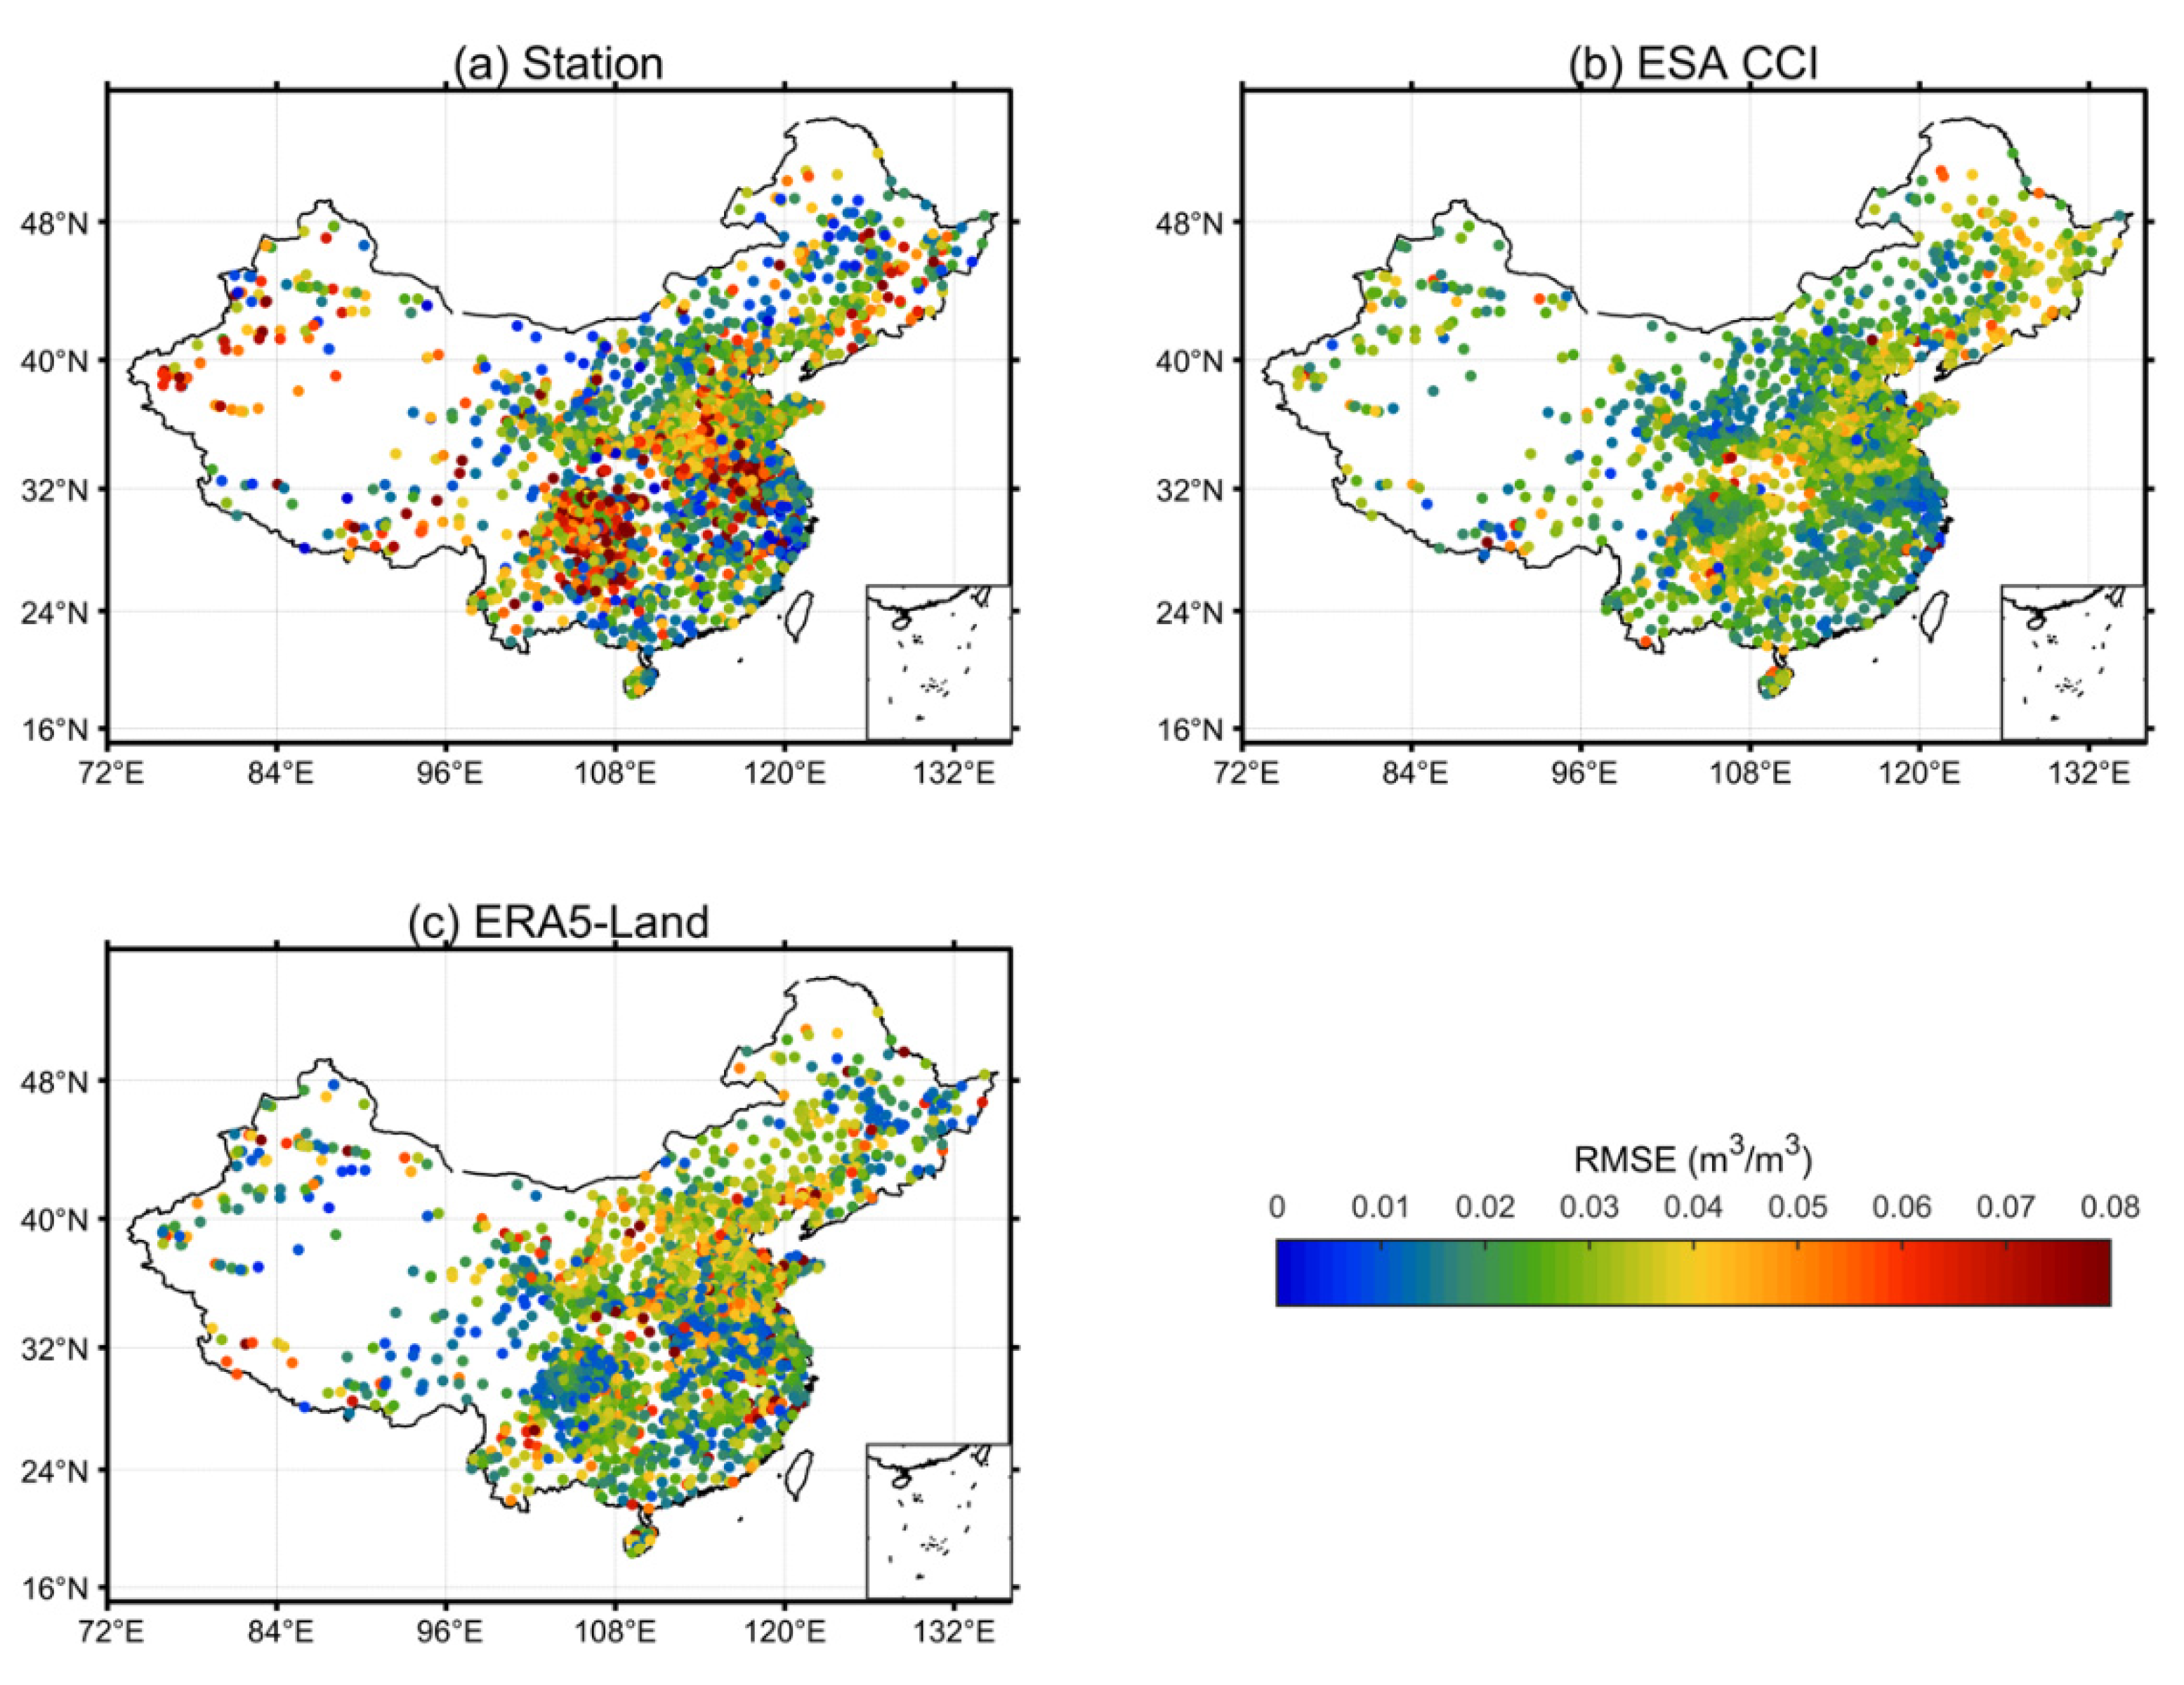
All datasets showed lower soil moisture in north and west China and higher soil moisture in south China. The mean daily soil moisture from stations was drier than that from ESA CCI and ERA5-Land, especially over the north of China, while the mean daily soil moisture from ERA5-Land was wetter than that from stations and ESA CCI.
(2)
TC-based CC and RMSE of station soil moisture agreed well with precipitation–soil moisture correlation. As precipitation–soil moisture correlation increased, TC-based CC increased, while TC-based RMSE decreases. This indicates that TC-based metrics can be used as indicators of station data quality.
(3)
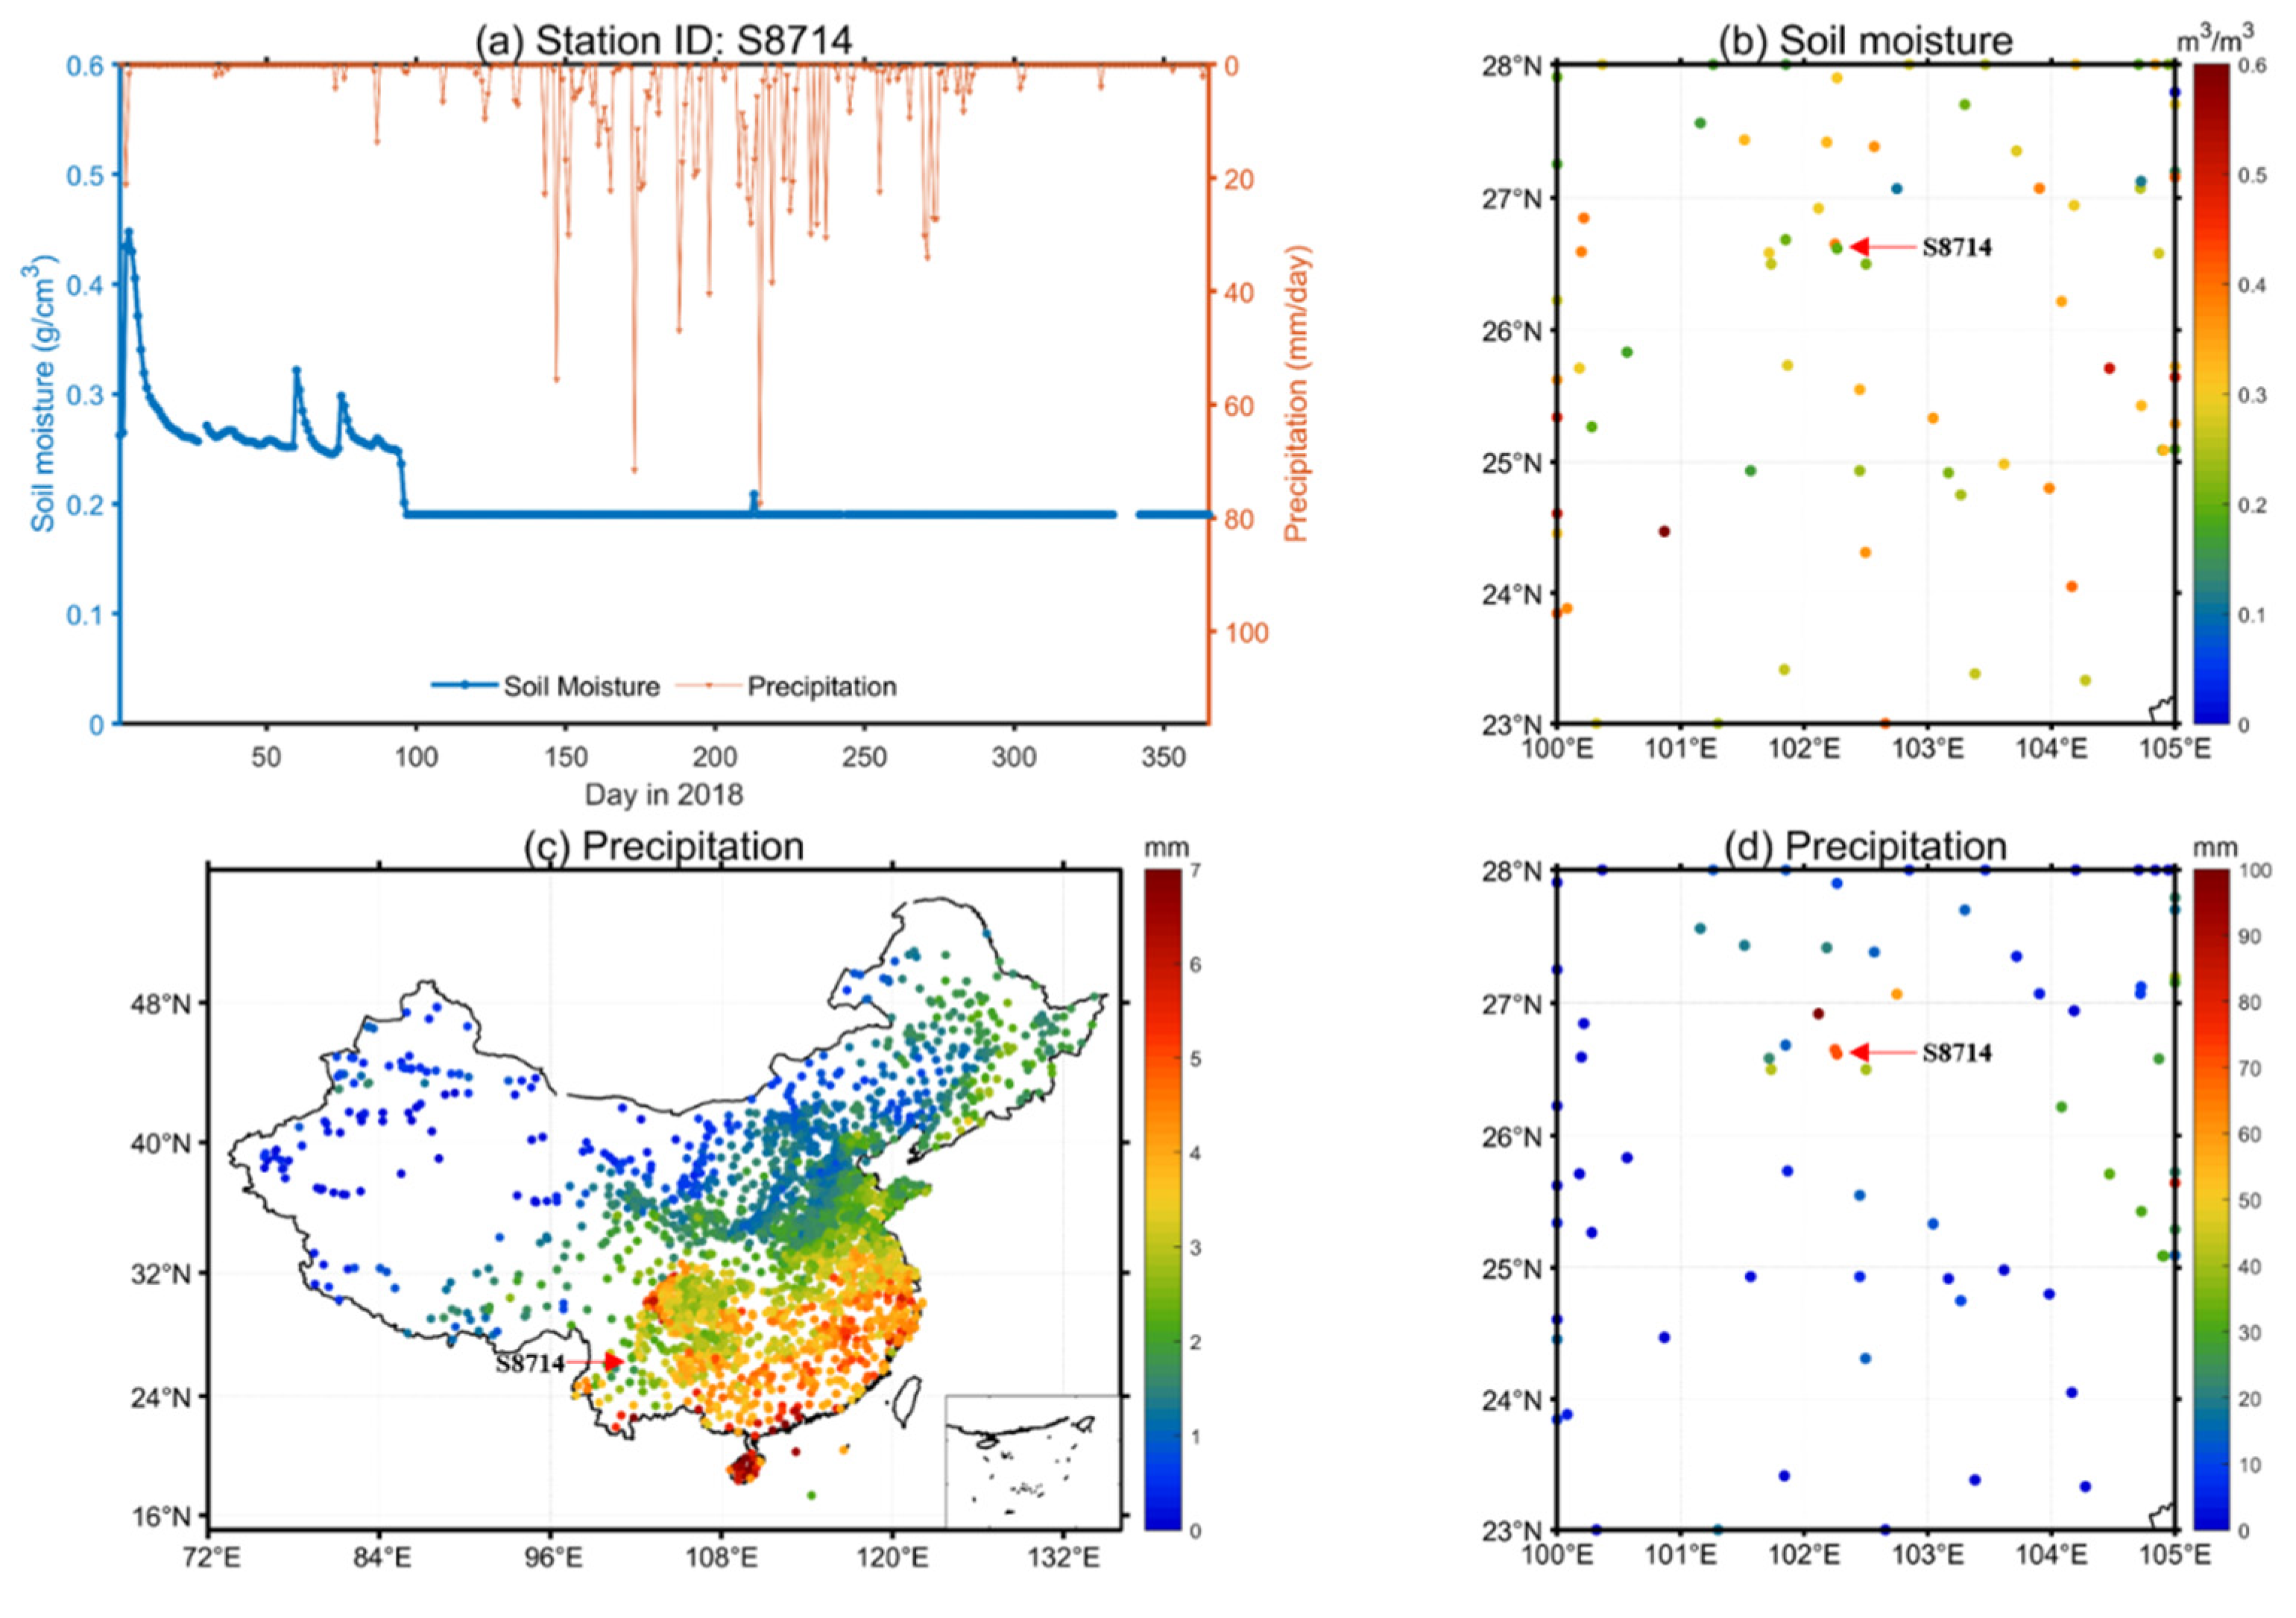
The quality flags provided by station data cannot perfectly represent the actual quality of soil moisture observations according to the investigation of two types of typical stations (i.e., bad stations according to TC, and good stations according to TC but bad stations according to quality flags). In contrast, TC-based accuracy metrics can better represent the actual quality of those typical stations.
In conclusion, the triple collocation method presented in this study showed the potential in soil moisture evaluation and could be considered as a viable tool for quality control of ground observations in mainland China. Further studies are needed to evaluate the performance of stations against other satellite and reanalysis products (e.g., SMAP) based on the TC method.

Author Contributions

All authors contributed to the work presented in this paper. W.X., G.T. and Y.S. developed the concept and methodology. W.X. performed soil moisture evaluation, the triple collocation evaluation, and wrote the initial paper. Y.S. contributed to the subject of research and soil moisture data. G.T. contributed to the analysis of study data and the optimization of the figures. G.T. and Y.S. improved the content and structure of the final paper. All authors have read and agreed to the published version of the manuscript.

Funding

This research was supported by the National Meteorological Information Centre, grant number NMICCJY202108; the Key Research and Development Program of Ministry of Science and Technology, grant number 2018YFC1506500; the Undergraduate Teaching Reform Program of Peking University, grant number 2020JG7100901184; and the Global Water Futures (GWF) project.

Data Availability Statement

Soil moisture observation data are supported by CMA (http://data.cma.cn/ accessed on 27 February 2022). ERA5 data can be downloaded from the Climate Data Store from the website (https://cds.climate.copernicus.eu/cdsapp#!/dataset/reanalysis-era5-single-levels?tab=form accessed on 27 February 2022). ESA-CCI data were downloaded from the website (https://www.soil-modeling.org/resources-links/data-portal/ecv-soil-moisture accessed on 27 February 2022). The Matlab codes and station dataset of this paper are available upon request to the corresponding author.

Conflicts of Interest

The authors declare no conflict of interest.

References

  1. Zeng, J.; Li, Z.; Chen, Q.; Bi, H.; Qiu, J.; Zou, P. Evaluation of remotely sensed and reanalysis soil moisture products over the Tibetan Plateau using in-situ observations. Remote Sens. Environ. 2015, 163, 91–110. [Google Scholar] [CrossRef]
  2. Zheng, J.; Zhao, T.; Lü, H.; Shi, J.; Cosh, M.H.; Ji, D.; Jiang, L.; Cui, Q.; Lu, H.; Yang, K.; et al. Assessment of 24 soil moisture datasets using a new in situ network in the Shandian River Basin of China. Remote Sens. Environ. 2022, 271, 112891. [Google Scholar] [CrossRef]
  3. Beck, H.E.; Pan, M.; Miralles, D.G.; Reichle, R.H.; Dorigo, W.A.; Hahn, S.; Sheffield, J.; Karthikeyan, L.; Balsamo, G.; Parinussa, R.M.; et al. Evaluation of 18 satellite- and model-based soil moisture products using in situ measurements from 826 sensors. Hydrol. Earth Syst. Sci. 2021, 25, 17–40. [Google Scholar] [CrossRef]
  4. Brocca, L.; Crow, W.T.; Ciabatta, L.; Massari, C.; de Rosnay, P.; Enenkel, M.; Hahn, S.; Amarnath, G.; Camici, S.; Tarpanelli, A.; et al. A Review of the Applications of ASCAT Soil Moisture Products. IEEE J. Sel. Top. Appl. Earth Obs. Remote Sens. 2017, 10, 2285–2306. [Google Scholar] [CrossRef]
  5. Meng, X.; Mao, K.; Meng, F.; Shi, J.; Zeng, J.; Shen, X.; Cui, Y.; Jiang, L.; Guo, Z. A fine-resolution soil moisture dataset for China in 2002–2018. Earth Syst. Sci. Data 2021, 13, 3239–3261. [Google Scholar] [CrossRef]
  6. Zeng, J.; Yuan, X.; Ji, P.; Shi, C. Effects of meteorological forcings and land surface model on soil moisture simulation over China. J. Hydrol. 2021, 603, 126978. [Google Scholar] [CrossRef]
  7. Wang, L.; Fang, S.; Pei, Z.; Wu, D.; Zhu, Y.; Zhuo, W. Developing machine learning models with multisource inputs for improved land surface soil moisture in China. Comput. Electron. Agric. 2022, 192, 106623. [Google Scholar] [CrossRef]
  8. Babaeian, E.; Sadeghi, M.; Jones, S.B.; Montzka, C.; Vereecken, H.; Tuller, M. Ground, Proximal, and Satellite Remote Sensing of Soil Moisture. Rev. Geophys. 2019, 57, 530–616. [Google Scholar] [CrossRef] [Green Version]
  9. Chen, Y.; Yuan, H. Evaluation of nine sub-daily soil moisture model products over China using high-resolution in situ observations. J. Hydrol. 2020, 588, 125054. [Google Scholar] [CrossRef]
  10. Peng, J.; Niesel, J.; Loew, A.; Zhang, S.; Wang, J. Evaluation of Satellite and Reanalysis Soil Moisture Products over Southwest China Using Ground-Based Measurements. Remote Sens. 2015, 7, 15729–15747. [Google Scholar] [CrossRef] [Green Version]
  11. An, R.; Zhang, L.; Wang, Z.; Quaye-Ballard, J.A.; You, J.; Shen, X.; Gao, W.; Huang, L.; Zhao, Y.; Ke, Z. Validation of the ESA CCI soil moisture product in China. Int. J. Appl. Earth Obs. Geoinf. 2016, 48, 28–36. [Google Scholar] [CrossRef]
  12. Cui, H.; Jiang, L.; Du, J.; Zhao, S.; Wang, G.; Lu, Z.; Wang, J. Evaluation and analysis of AMSR-2, SMOS, and SMAP soil moisture products in the Genhe area of China. J. Geophys. Res. Atmos. 2017, 122, 8650–8666. [Google Scholar] [CrossRef]
  13. Xu, Z.; Man, X.; Duan, L.; Cai, T. Improved subsurface soil moisture prediction from surface soil moisture through the integration of the (de)coupling effect. J. Hydrol. 2022, 608, 127634. [Google Scholar] [CrossRef]
  14. Stoffelen, A. Toward the true near-surface wind speed: Error modeling and calibration using triple collocation. J. Geophys. Res. Ocean. 1998, 103, 7755–7766. [Google Scholar] [CrossRef]
  15. Gruber, A.; Su, C.H.; Zwieback, S.; Crow, W.; Dorigo, W.; Wagner, W. Recent advances in (soil moisture) triple collocation analysis. Int. J. Appl. Earth Obs. Geoinf. 2016, 45, 200–211. [Google Scholar] [CrossRef]
  16. Gruber, A.; Dorigo, W.A.; Crow, W.; Wagner, W. Triple Collocation-Based Merging of Satellite Soil Moisture Retrievals. IEEE Trans. Geosci. Remote Sens. 2017, 55, 6780–6792. [Google Scholar] [CrossRef]
  17. Li, C.; Tang, G.; Hong, Y. Cross-evaluation of ground-based, multi-satellite and reanalysis precipitation products: Applicability of the Triple Collocation method across Mainland China. J. Hydrol. 2018, 562, 71–83. [Google Scholar] [CrossRef]
  18. Lyu, F.; Tang, G.; Behrangi, A.; Wang, T.; Tan, X.; Ma, Z.; Xiong, W. Precipitation Merging Based on the Triple Collocation Method Across Mainland China. IEEE Trans. Geosci. Remote Sens. 2021, 59, 3161–3176. [Google Scholar] [CrossRef]
  19. Kim, H.; Wigneron, J.-P.; Kumar, S.; Dong, J.; Wagner, W.; Cosh, M.H.; Bosch, D.D.; Collins, C.H.; Starks, P.J.; Seyfried, M.; et al. Global scale error assessments of soil moisture estimates from microwave-based active and passive satellites and land surface models over forest and mixed irrigated/dryland agriculture regions. Remote Sens. Environ. 2020, 251, 112052. [Google Scholar] [CrossRef]
  20. Xu, L.; Chen, N.; Zhang, X.; Moradkhani, H.; Zhang, C.; Hu, C. In-situ and triple-collocation based evaluations of eight global root zone soil moisture products. Remote Sens. Environ. 2021, 254, 112248. [Google Scholar] [CrossRef]
  21. Chen, X.; Yu, L.; Du, Z.; Xu, Y.; Zhao, J.; Zhao, H.; Zhang, G.; Peng, D.; Gong, P. Distribution of ecological restoration projects associated with land use and land cover change in China and their ecological impacts. Sci. Total Environ. 2022, 825, 153938. [Google Scholar] [CrossRef] [PubMed]
  22. Liu, J.; Zang, C.; Tian, S.; Liu, J.; Yang, H.; Jia, S.; You, L.; Liu, B.; Zhang, M. Water conservancy projects in China: Achievements, challenges and way forward. Glob. Environ. Chang. 2013, 23, 633–643. [Google Scholar] [CrossRef] [Green Version]
  23. Fischer, G.; Nachtergaele, S.F.; Prieler, H.T.; van Velthuizen, L.; Verelst, D.W. Global Agro-Ecological Zones Assessment for Agriculture (GAEZ 2008); IIASA: Laxenburg, Austria; FAO: Rome, Italy, 2008. [Google Scholar]
  24. Wang, J.Q.; Zhao, Y.F.; Ren, Z.H.; Gao, J. Design and Verification of Quality Control Methods for Automatic Soil Moisture Observation Data in China. Meteorol. Mon. 2018, 44, 244–257, (In Chinese with English abstract). [Google Scholar]
  25. Xia, Y.; Ford, T.W.; Wu, Y.; Quiring, S.M.; Ek, M.B. Automated Quality Control of In Situ Soil Moisture from the North American Soil Moisture Database Using NLDAS-2 Products. J. Appl. Meteorol. Climatol. 2015, 54, 1267–1282. [Google Scholar] [CrossRef]
  26. Dorigo, W.A.; Xaver, A.; Vreugdenhil, M.; Gruber, A.; Hegyiová, A.; Sanchis-Dufau, A.D.; Zamojski, D.; Cordes, C.; Wagner, W.; Drusch, M. Global Automated Quality Control of In Situ Soil Moisture Data from the International Soil Moisture Network. Vadose Zone J. 2013, 12, vzj2012.0097. [Google Scholar] [CrossRef]
  27. Liu, Y.Y.; Dorigo, W.A.; Parinussa, R.M.; de Jeu, R.A.M.; Wagner, W.; McCabe, M.F.; Evans, J.P.; van Dijk, A.I.J.M. Trend-preserving blending of passive and active microwave soil moisture retrievals. Remote Sens. Environ. 2012, 123, 280–297. [Google Scholar] [CrossRef]
  28. Zhao, W.; Wen, F.; Wang, Q.; Sanchez, N.; Piles, M. Seamless downscaling of the ESA CCI soil moisture data at the daily scale with MODIS land products. J. Hydrol. 2021, 603, 126930. [Google Scholar] [CrossRef]
  29. Zhang, L.; Liu, Y.; Ren, L.; Teuling, A.J.; Zhang, X.; Jiang, S.; Yang, X.; Wei, L.; Zhong, F.; Zheng, L. Reconstruction of ESA CCI satellite-derived soil moisture using an artificial neural network technology. Sci. Total Environ. 2021, 782, 146602. [Google Scholar] [CrossRef]
  30. Trofaier, A.M.; Westermann, S.; Bartsch, A. Progress in space-borne studies of permafrost for climate science: Towards a multi-ECV approach. Remote Sens. Environ. 2017, 203, 55–70. [Google Scholar] [CrossRef]
  31. Hersbach, H.; Bell, B.; Berrisford, P.; Hirahara, S.; Horányi, A.; Muñoz-Sabater, J.; Nicolas, J.; Peubey, C.; Radu, R.; Schepers, D.; et al. The ERA5 global reanalysis. Q. J. R. Meteorol. Soc. 2020, 146, 1999–2049. [Google Scholar] [CrossRef]
  32. Miyaoka, K.; Gruber, A.; Ticconi, F.; Hahn, S.; Wagner, W.; Figa-Saldana, J.; Anderson, C. Triple Collocation Analysis of Soil Moisture From Metop-A ASCAT and SMOS Against JRA-55 and ERA-Interim. IEEE J. Sel. Top. Appl. Earth Obs. Remote Sens. 2017, 10, 2274–2284. [Google Scholar] [CrossRef]
  33. McColl, K.A.; Vogelzang, J.; Konings, A.G.; Entekhabi, D.; Piles, M.; Stoffelen, A. Extended triple collocation: Estimating errors and correlation coefficients with respect to an unknown target. Geophys. Res. Lett. 2014, 41, 6229–6236. [Google Scholar] [CrossRef] [Green Version]
  34. Wang, C.; Xu, J.; Chen, Y.; Bai, L.; Chen, Z. A hybrid model to assess the impact of climate variability on streamflow for an ungauged mountainous basin. Clim. Dyn. 2017, 50, 2829–2844. [Google Scholar] [CrossRef]
  35. Roussel, M.-L.; Lemonnier, F.; Genthon, C.; Krinner, G. Brief communication: Evaluating Antarctic precipitation in ERA5 and CMIP6 against CloudSat observations. Cryosphere 2020, 14, 2715–2727. [Google Scholar] [CrossRef]
  36. Jiang, Q.; Li, W.; Fan, Z.; He, X.; Sun, W.; Chen, S.; Wen, J.; Gao, J.; Wang, J. Evaluation of the ERA5 reanalysis precipitation dataset over Chinese Mainland. J. Hydrol. 2021, 595, 125660. [Google Scholar] [CrossRef]
  37. Hynčica, M.; Huth, R. Long-term changes in precipitation phase in Europe in cold half year. Atmos. Res. 2019, 227, 79–88. [Google Scholar] [CrossRef]
  38. Tang, G.; Long, D.; Behrangi, A.; Wang, C.; Hong, Y. Exploring Deep Neural Networks to Retrieve Rain and Snow in High Latitudes Using Multisensor and Reanalysis Data. Water Resour. Res. 2018, 54, 8253–8278. [Google Scholar] [CrossRef] [Green Version]
  39. Jennings, K.S.; Winchell, T.S.; Livneh, B.; Molotch, N.P. Spatial variation of the rain-snow temperature threshold across the Northern Hemisphere. Nat. Commun. 2018, 9, 1148. [Google Scholar] [CrossRef] [Green Version]
  40. Ciabatta, L.; Massari, C.; Brocca, L.; Gruber, A.; Reimer, C.; Hahn, S.; Paulik, C.; Dorigo, W.; Kidd, R.; Wagner, W. SM2RAIN-CCI: A new global long-term rainfall data set derived from ESA CCI soil moisture. Earth Syst. Sci. Data 2018, 10, 267–280. [Google Scholar] [CrossRef] [Green Version]
Figure 1. (a) Digital elevation model (DEM) and (b) spatial distribution of ground stations and six geographic–climatic regions in China.
Water 14 01054 g001
Figure 2. The mean daily soil moisture from (a) stations, (b) ESA CCI, and (c) ERA5-Land over China.
Water 14 01054 g002
Figure 3. (a) The daily soil moisture and precipitation of a station (S8714, 102.2° E, 26.6° N) in 2018. The raw quality flags indicate that station soil moisture records for all days pass the quality control procedures; (b) daily soil moisture of the station S8714 and neighboring stations on Day 173 of 2018; (c) the mean daily precipitation of 2018 over China; (d) daily precipitation of station S8714 and neighboring stations on Day 173 of 2018.
Water 14 01054 g003
Figure 4. The CC of (a) stations, (b) ESA CCI, and (c) ERA5-Land obtained from the triple collocation analysis.
Water 14 01054 g004
Figure 5. The RMSE of (a) stations, (b) ESA CCI, and (c) ERA5-Land obtained from the triple collocation analysis.
Water 14 01054 g005
Figure 6. The relationship between TC results and traditional quality flags. X-axis and Y-axis represent TC-based CC and RMSE, respectively. The color of points shows the average quality flags of stations, for which one represents the perfect quality for all days and zero represents the failed quality for all days.
Water 14 01054 g006
Figure 7. The relationship between TC results and the CC between precipitation and soil moisture. The Y-axis shows the CC between precipitation and soil moisture. The X-axis in (a,b) represents the TC-based CC and RMSE, respectively.
Water 14 01054 g007
Figure 8. Example stations with the worst TC-based accuracy (i.e., CC < 0.5 and RMSE > 0.15 m3/m3). The blue dots show daily soil moisture with good quality flags, while the dark dots show daily soil moisture with failed quality flags. The red dots show daily precipitation. In the titles of each panel, the QC represents the average quality control flag values, and the CC represents the correlation between soil moisture and precipitation.
Water 14 01054 g008
Figure 9. Same as Figure 8, but showing example stations with high TC accuracy (CC > 0.9, RMSE < 0.05 m3/m3) but low quality control flags (QC < 0.6). The blue dots show daily soil moisture with good quality flags, while the dark dots show daily soil moisture with failed quality flags. The red dots show daily precipitation. In the titles of each panel, the QC represents the average quality control flag values, and the CC represents the correlation between soil moisture and precipitation.
Water 14 01054 g009
Publisher’s Note: MDPI stays neutral with regard to jurisdictional claims in published maps and institutional affiliations.

