
Understanding the Combined Effects of Land Cover, Precipitation and Catchment Size on Nitrogen and Discharge—A Case Study of the Mississippi River Basin


Abstract
:
1. Introduction
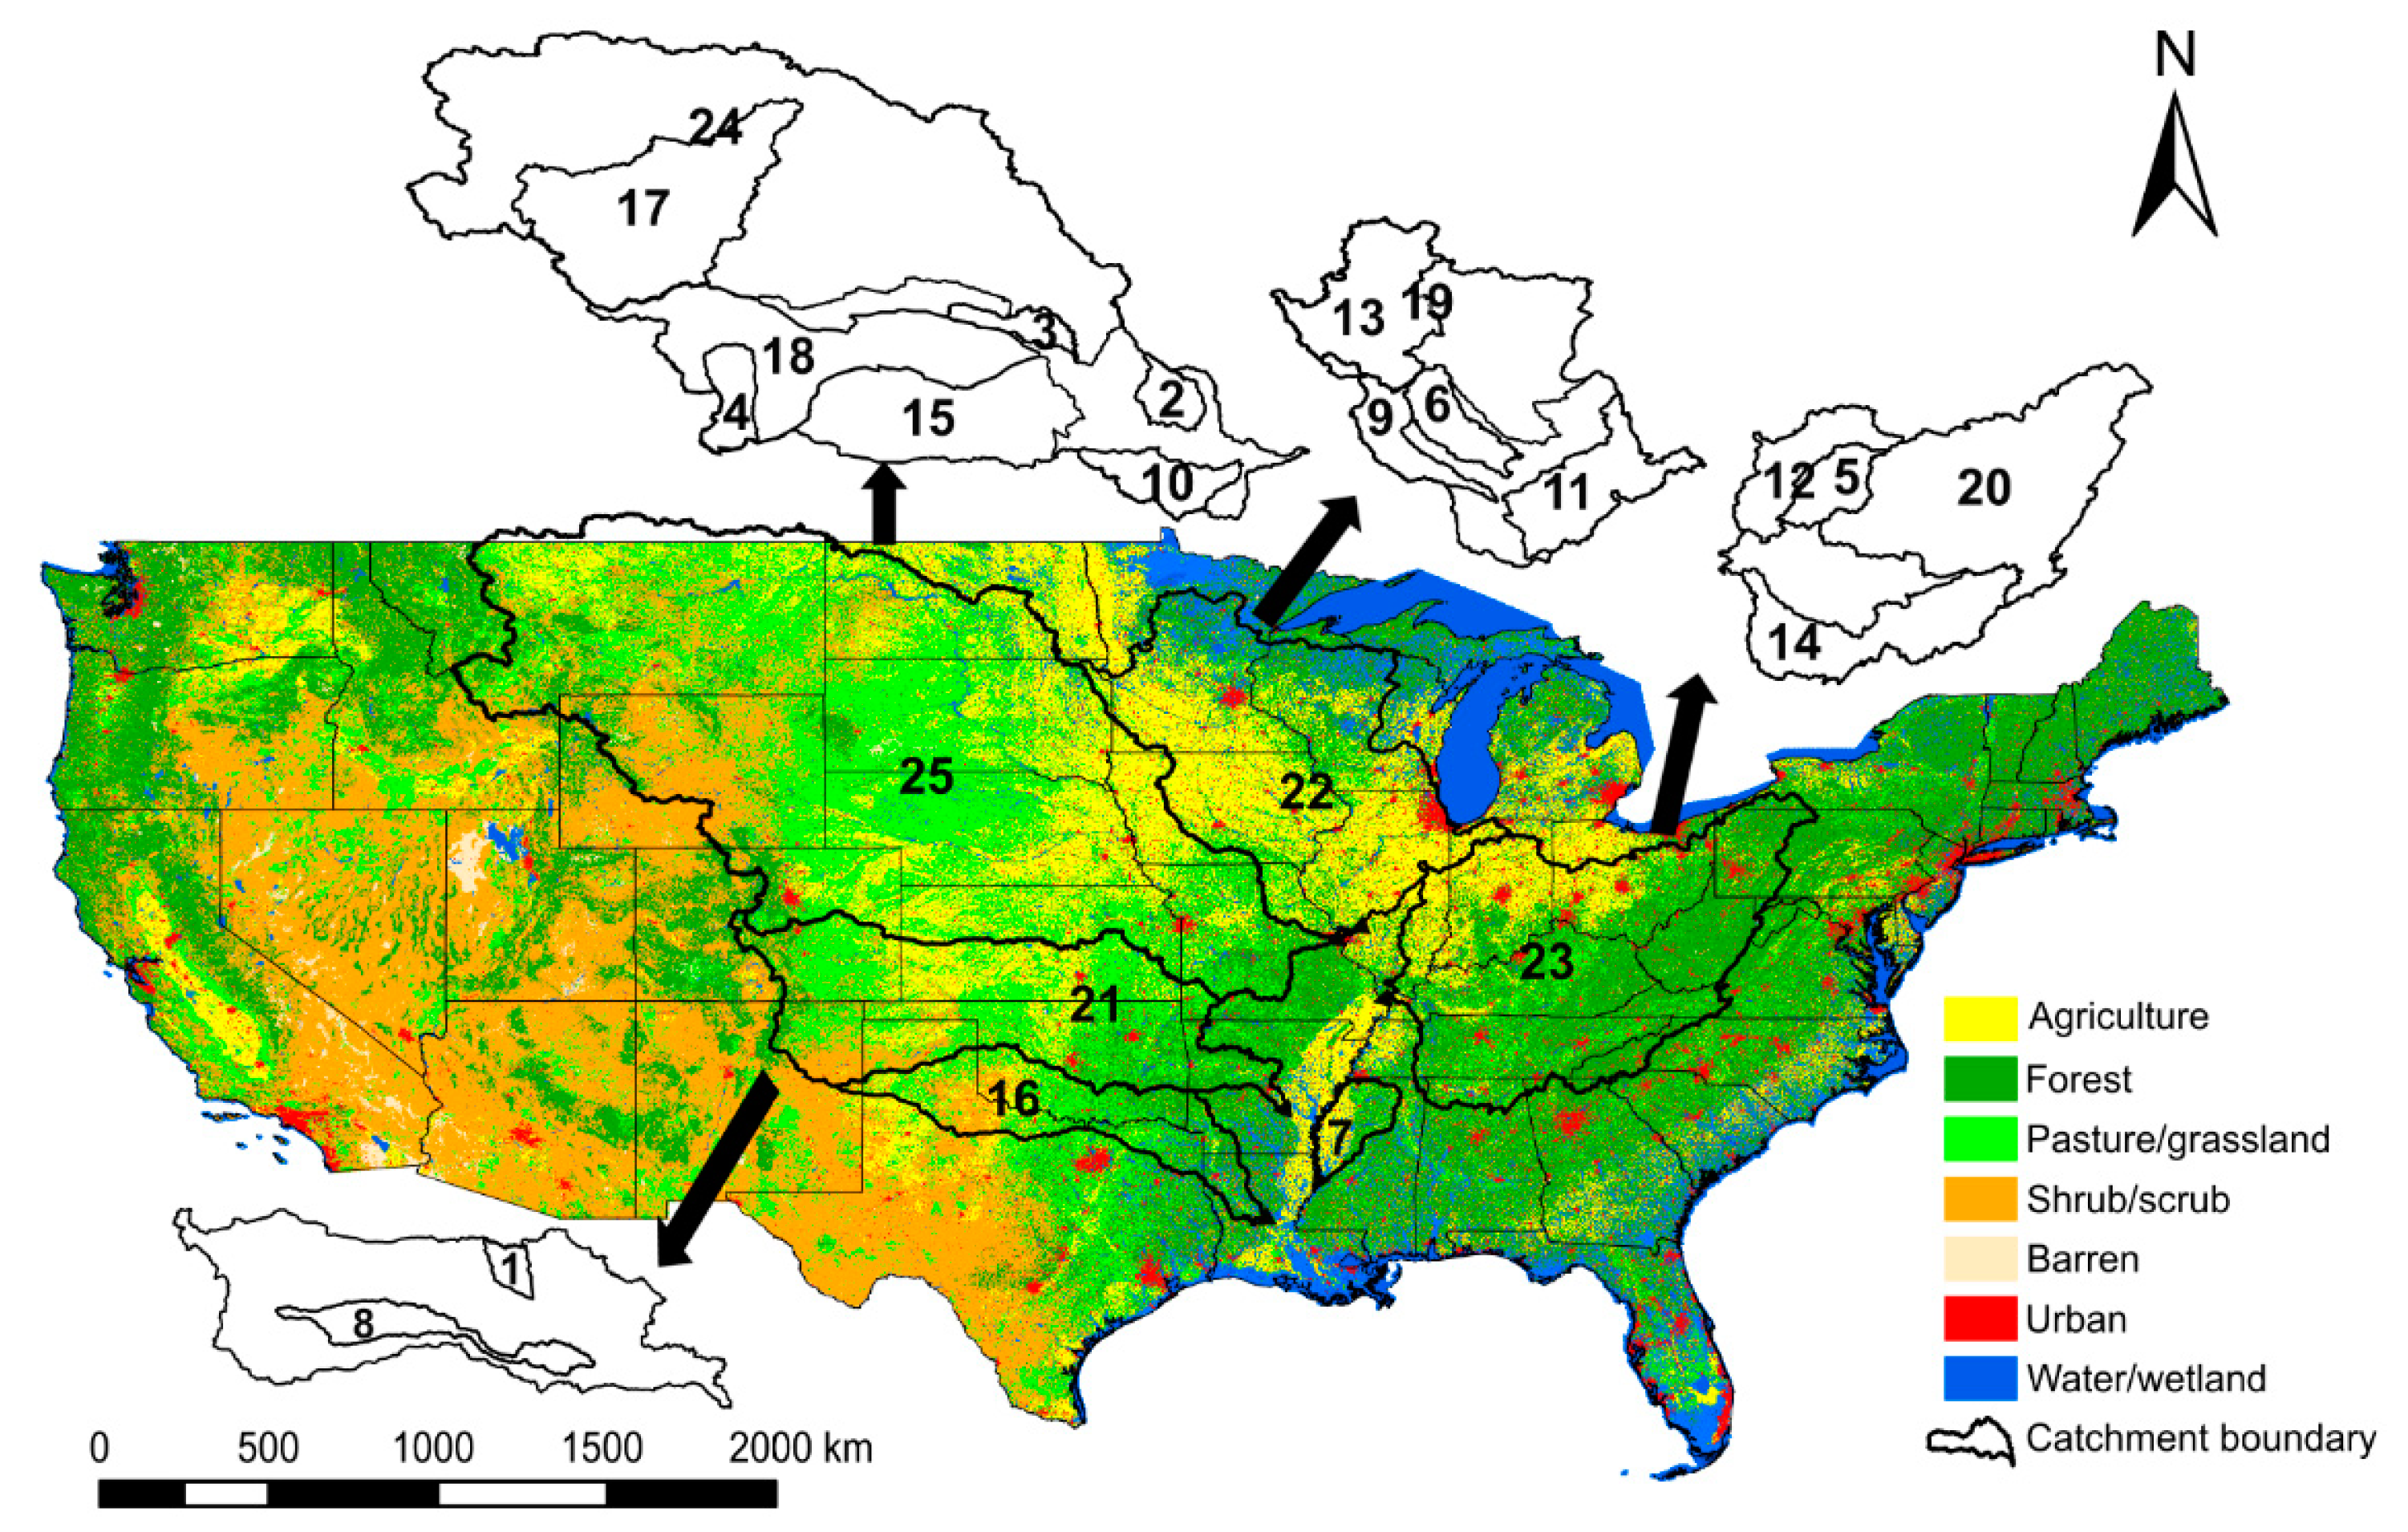
2. Materials and Methods
3. Results
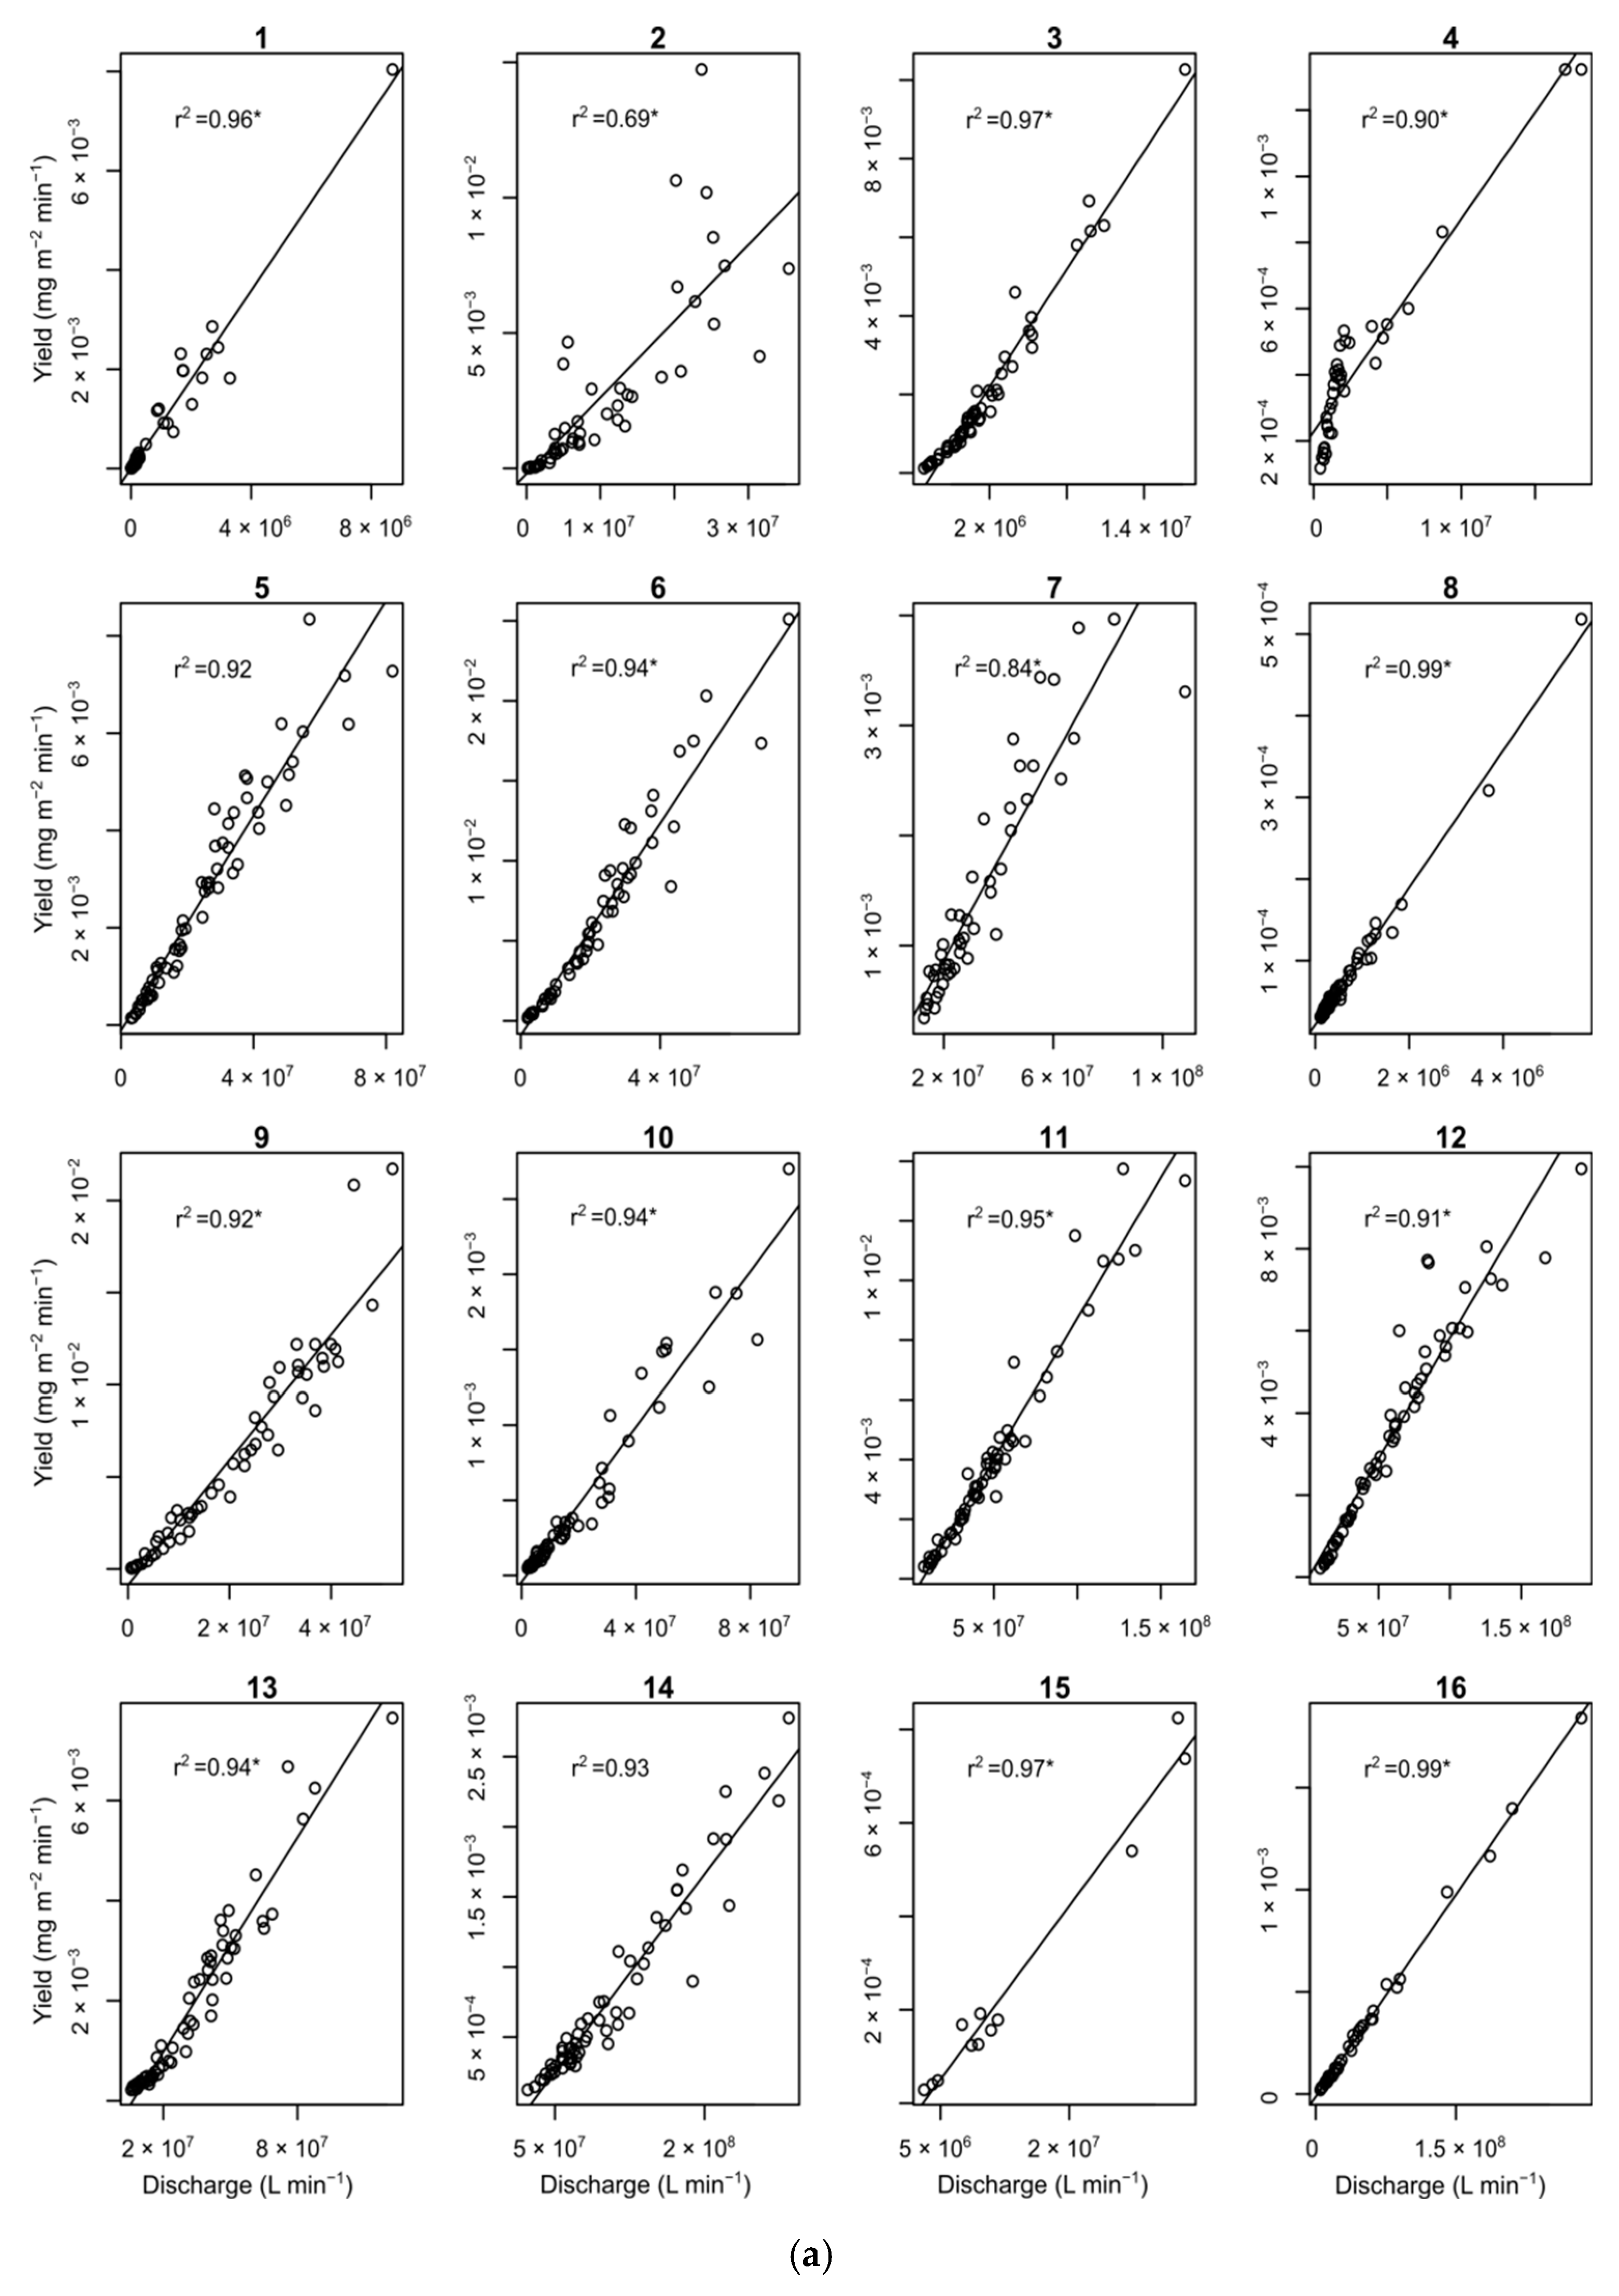
3.1. Total Nitrogen, Precipitation, Land Cover, and Catchment Size
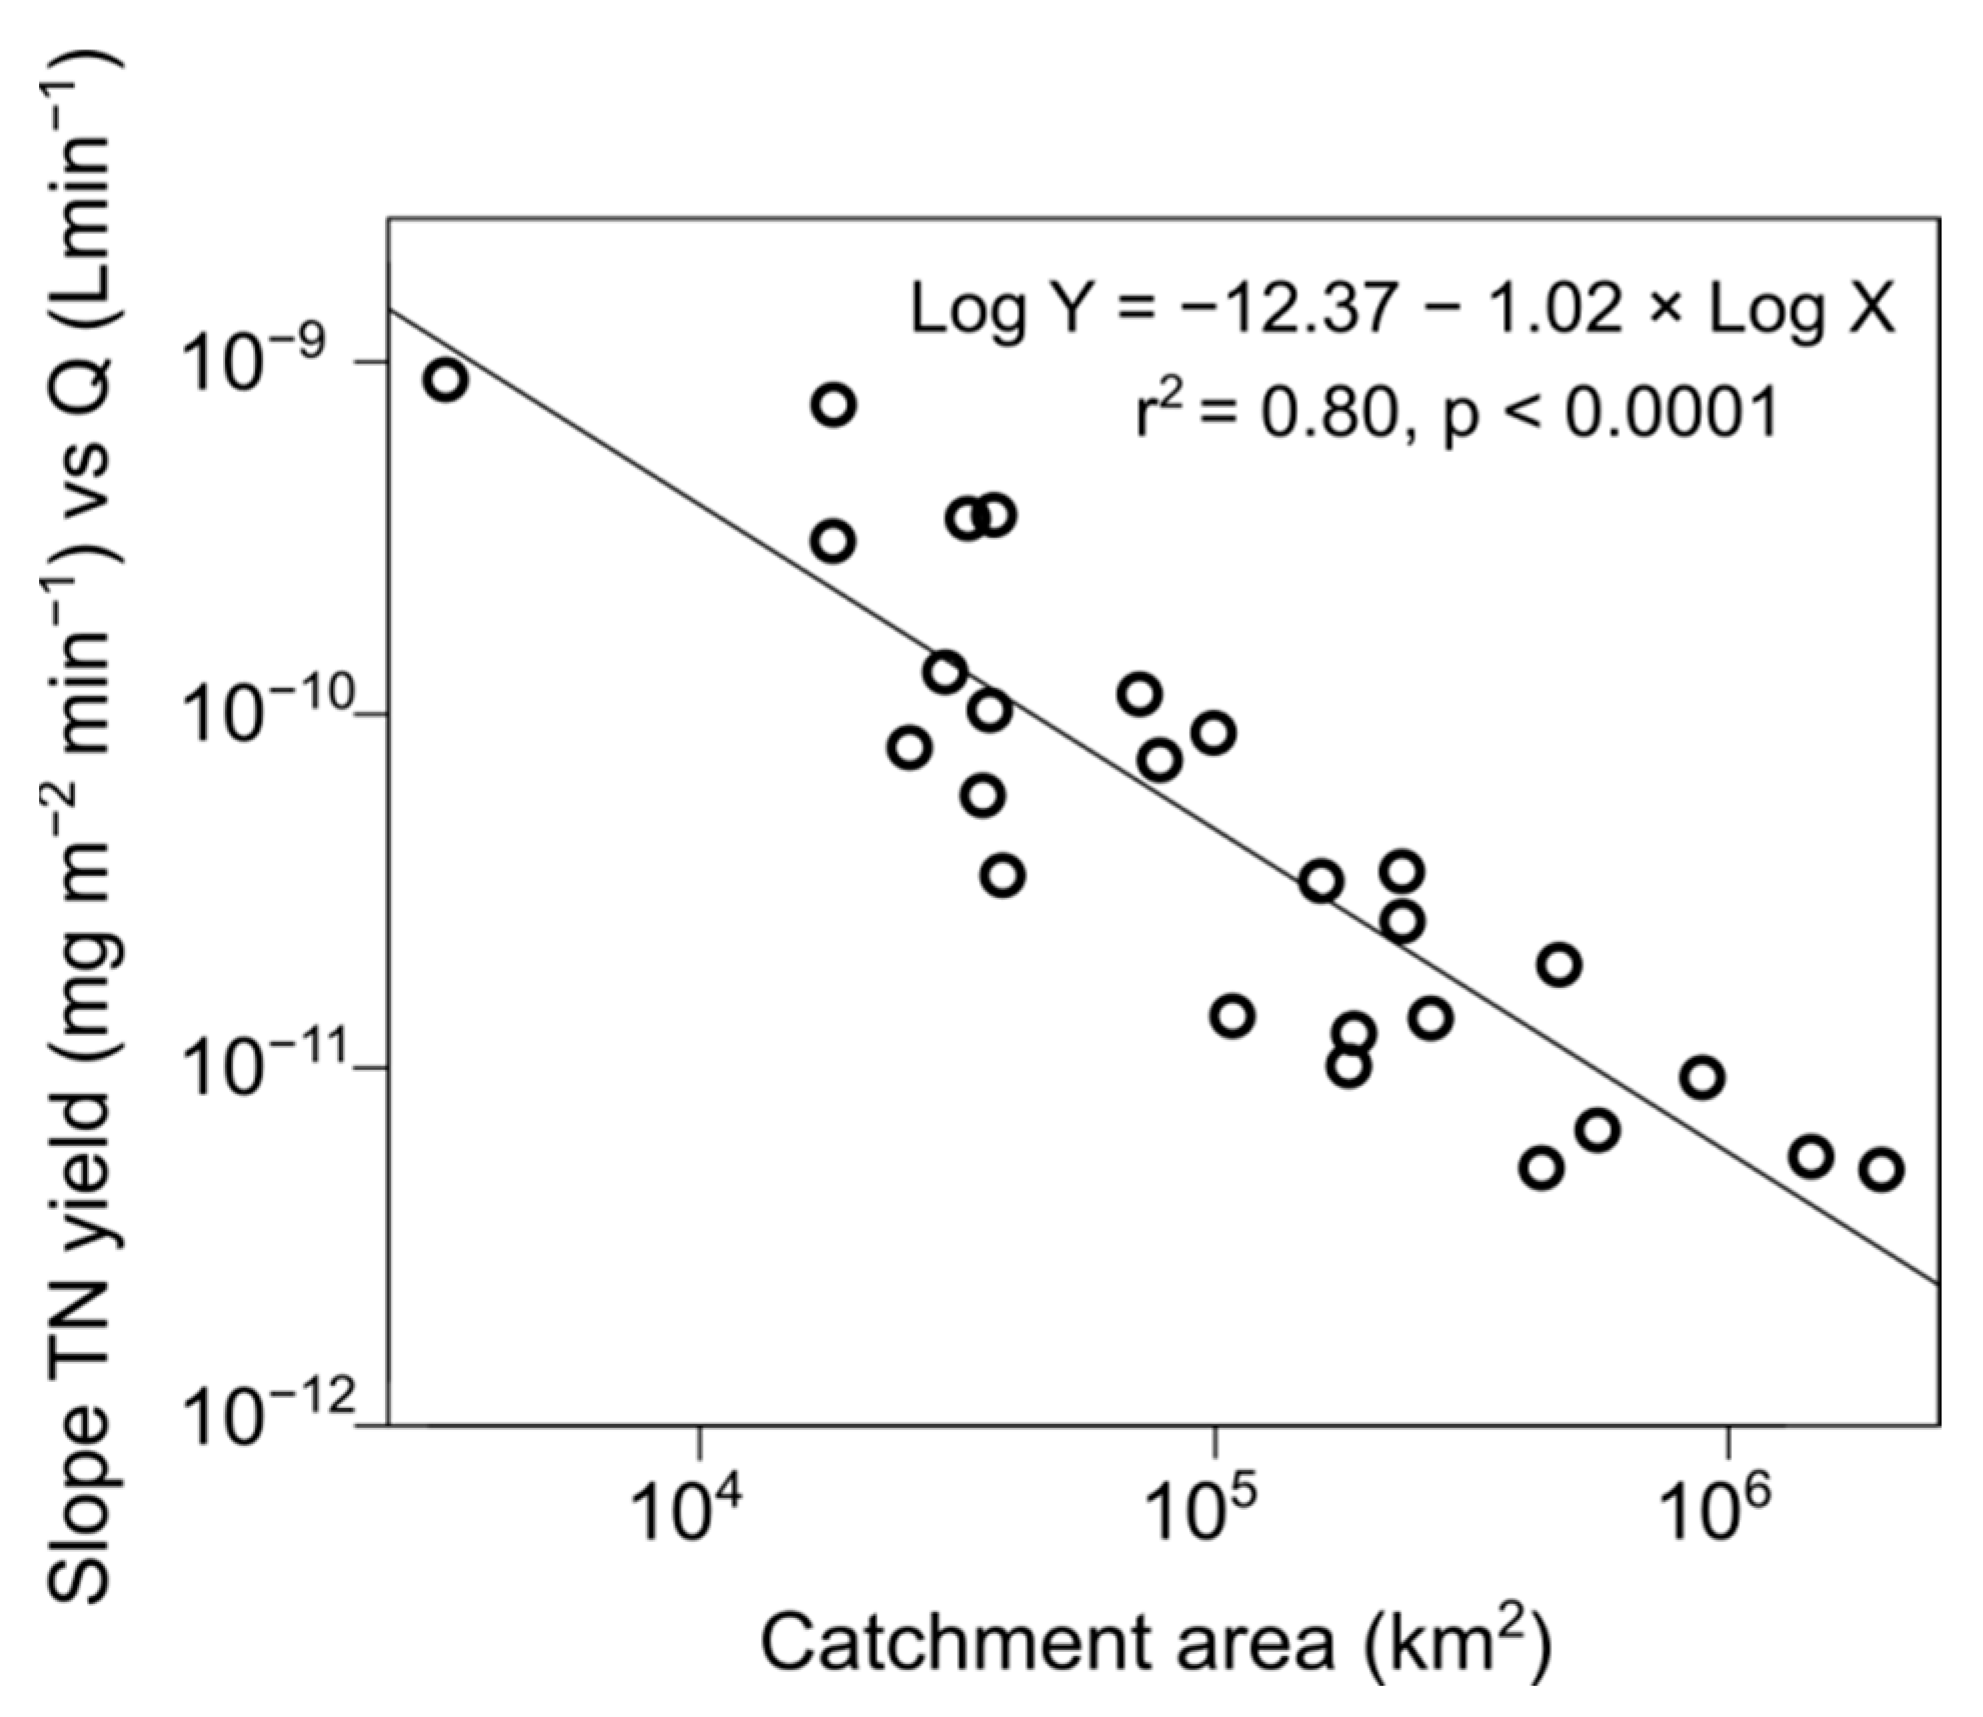
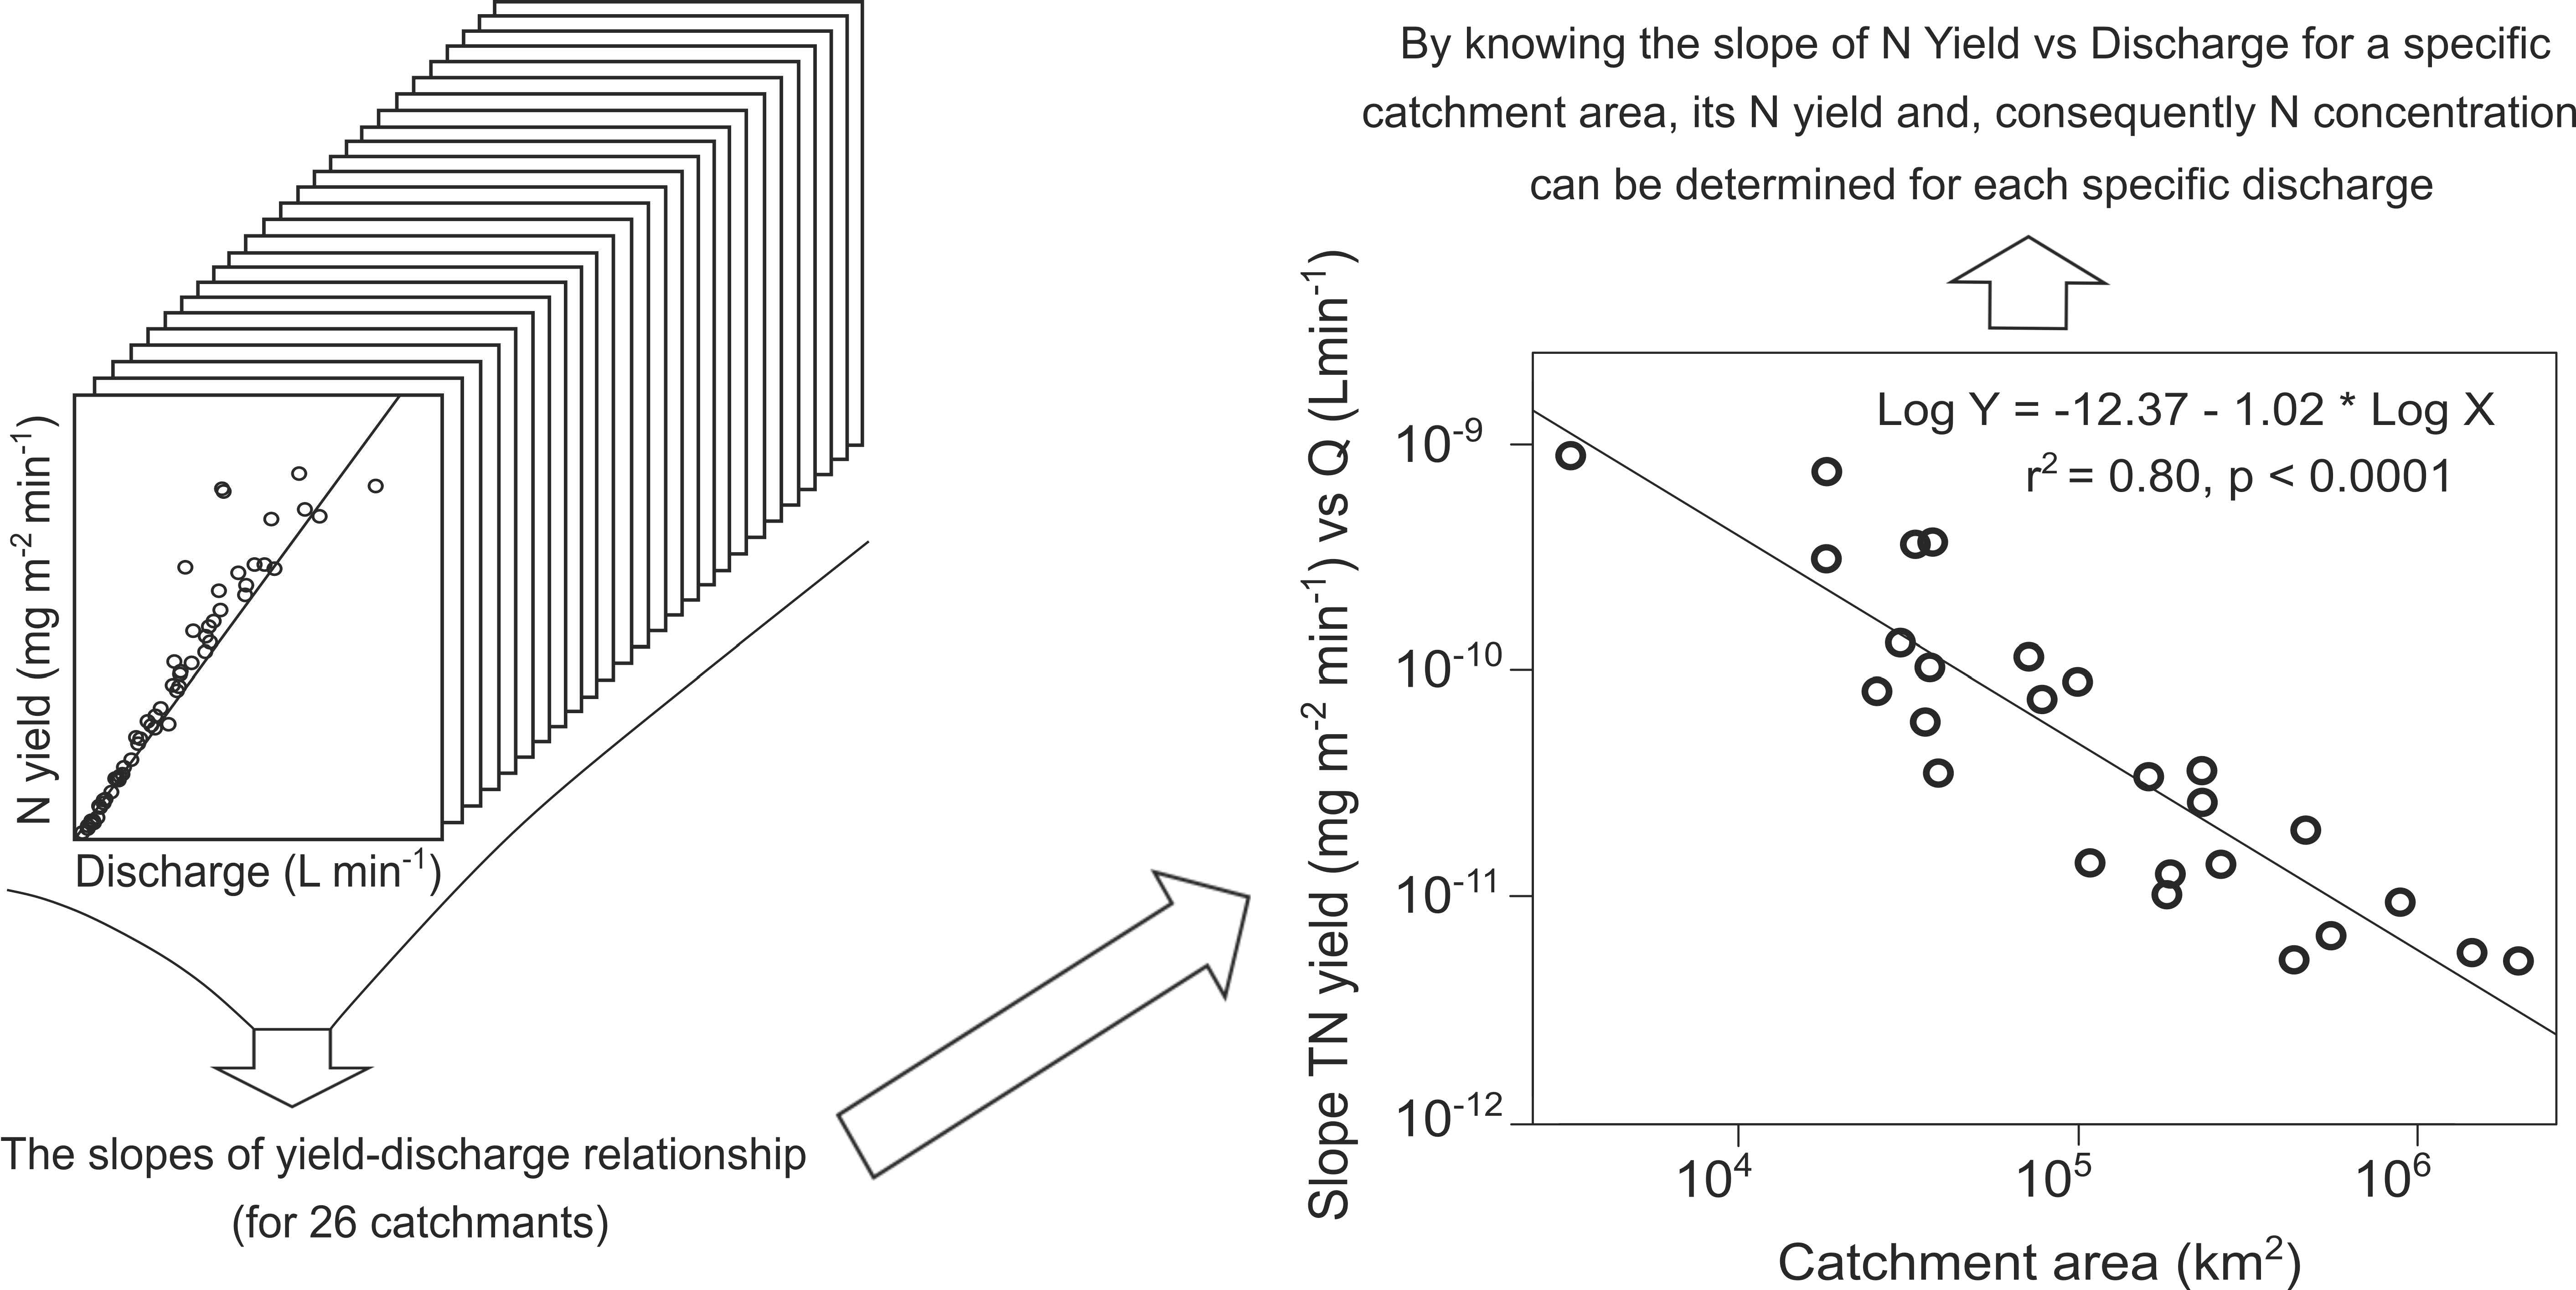
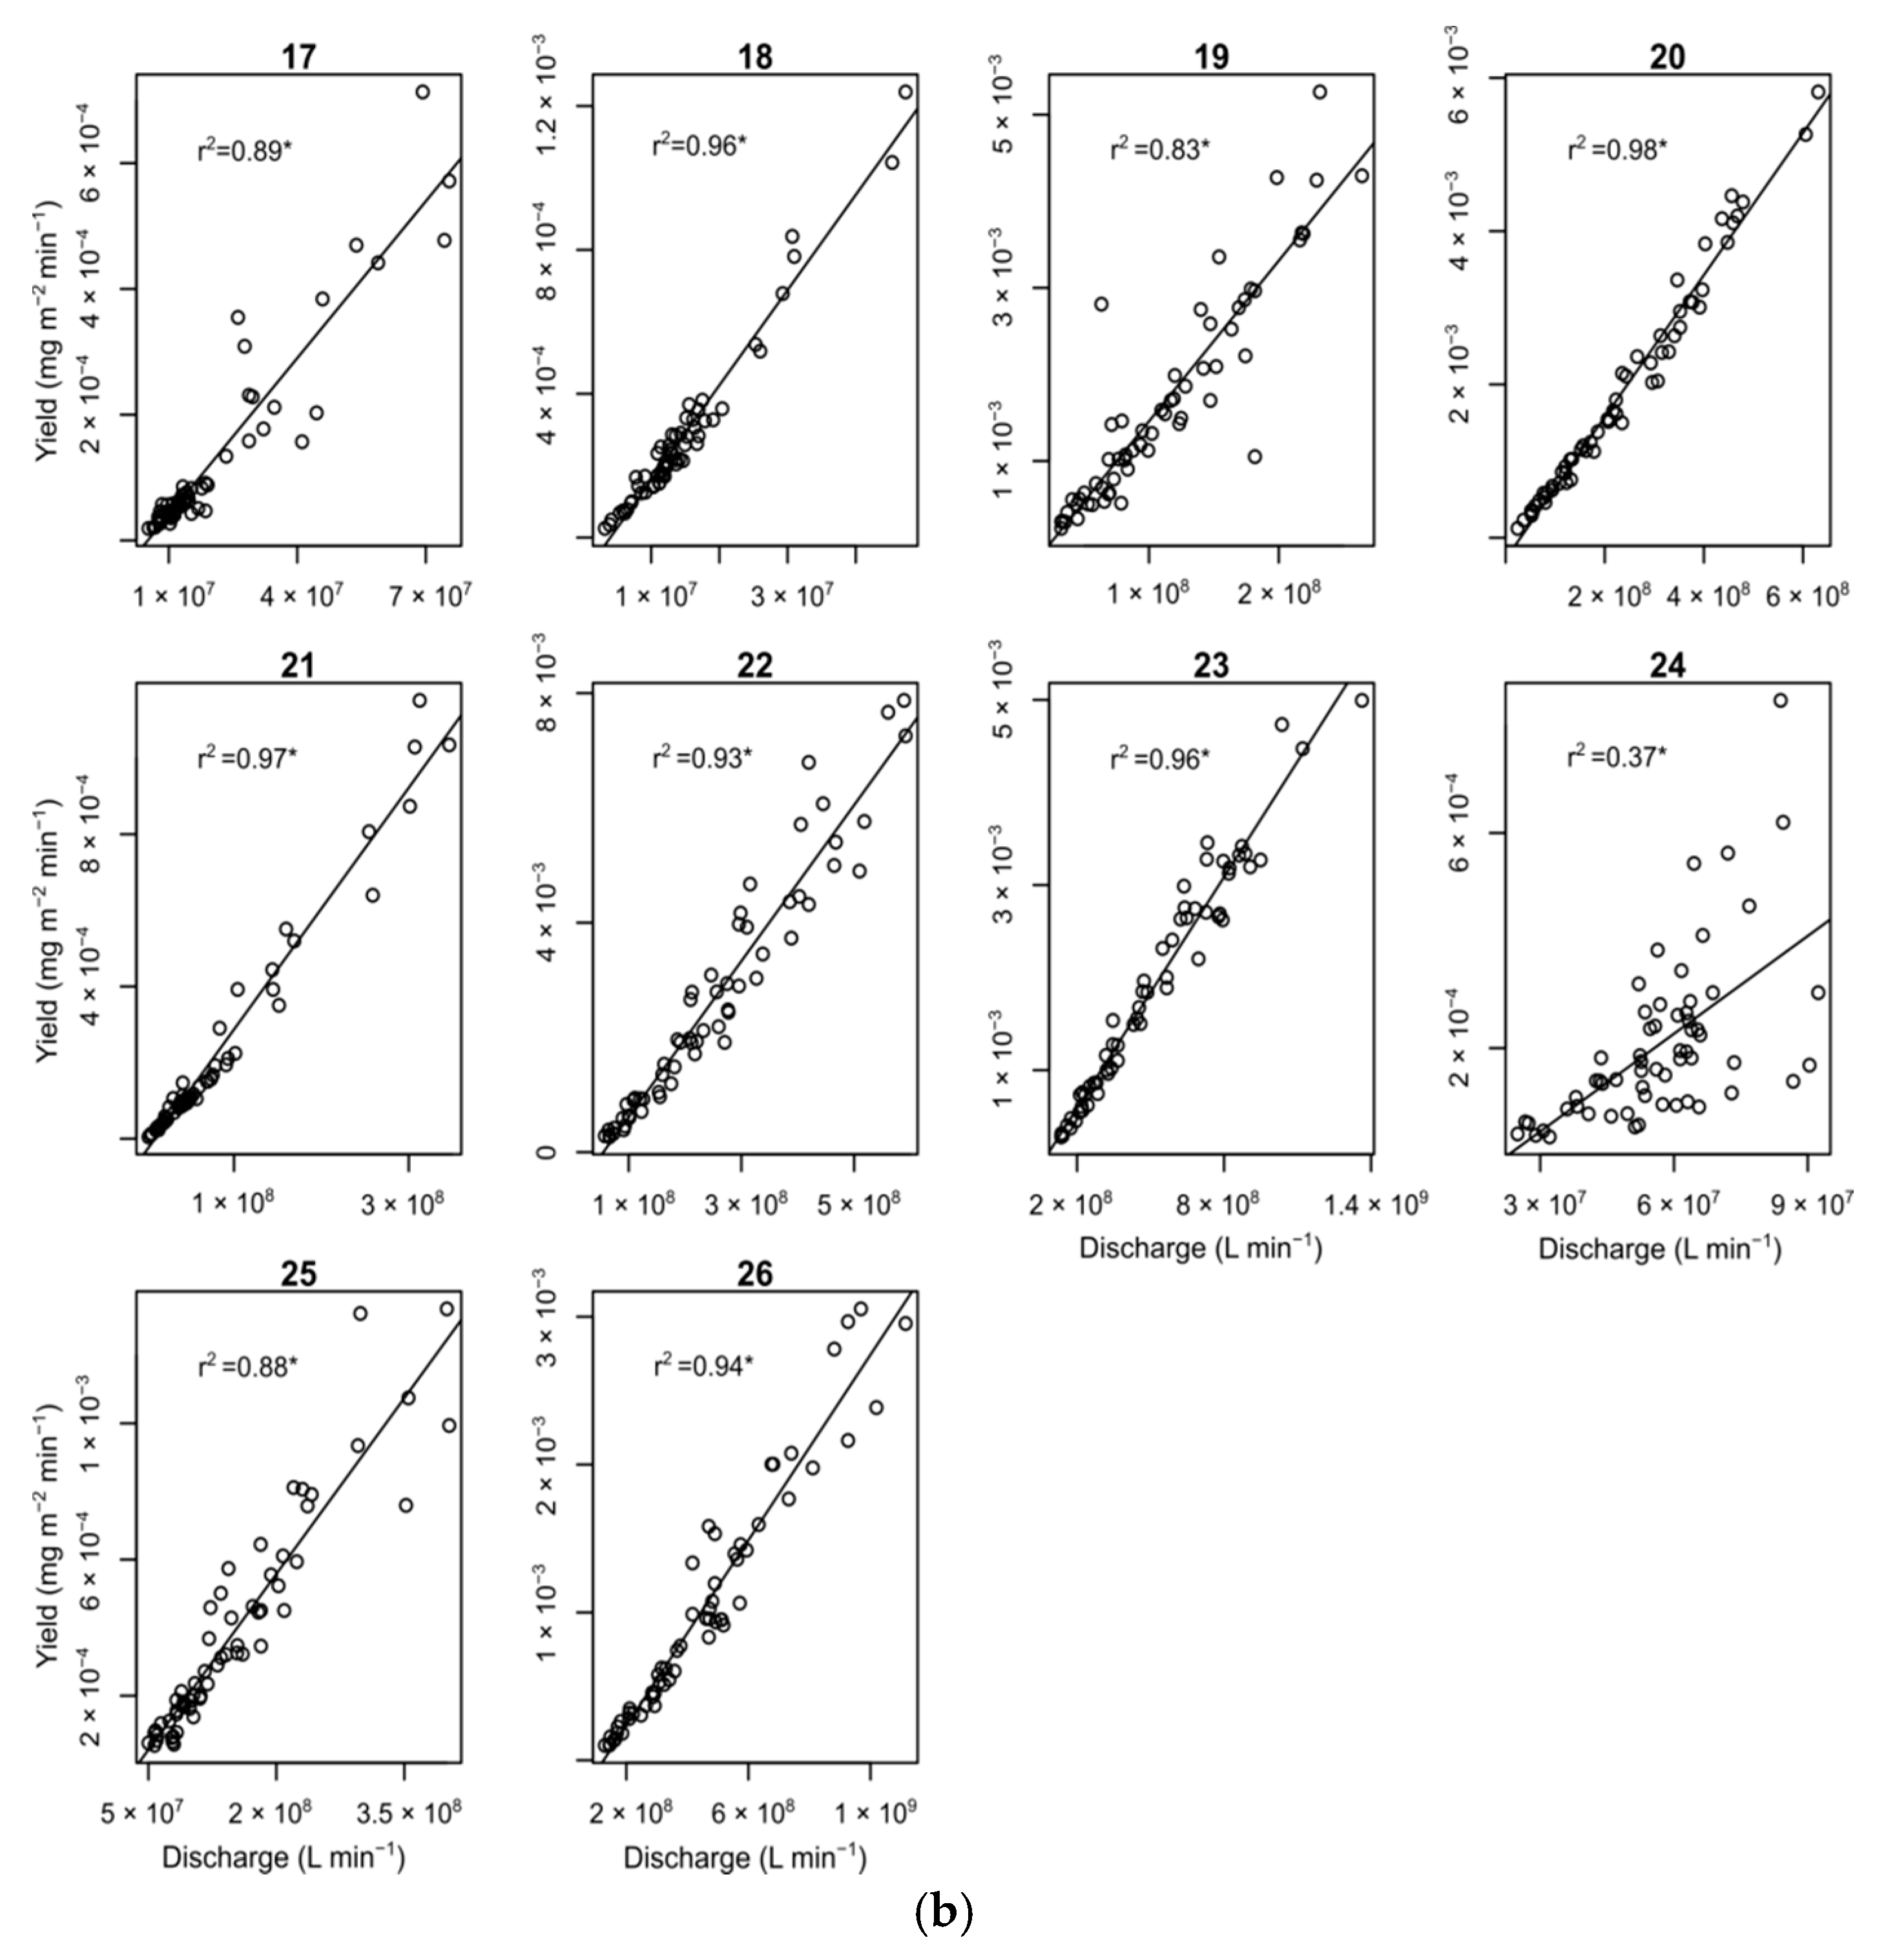
3.2. TN Yield Rates
4. Discussion
4.1. Total Nitrogen, Precipitation, Land Cover, and Area
4.2. TN Yield Rate
5. Conclusions
Author Contributions
Funding
Data Availability Statement
Conflicts of Interest
References
- Stewart, W.M.; Roberts, T.L. Food Security and the Role of Fertilizer in Supporting it. Procedia Eng. 2012, 46, 76–82. [Google Scholar] [CrossRef] [Green Version]
- Davidson, E.A.; Nifong, R.L.; Ferguson, R.B.; Palm, C.; Osmond, D.L.; Baron, J.S. Nutrients in the nexus. J. Environ. Stud. Sci. 2016, 6, 25–38. [Google Scholar] [CrossRef] [Green Version]
- Caccia, V.G.; Boyer, J.N. Spatial patterning of water quality in Biscayne Bay Florida as a function of land use and water management. Mar. Pollut. Bull. 2005, 50, 1416–1429. [Google Scholar] [CrossRef] [PubMed]
- Howarth, R.; Swaney, D.; Billen, G.; Garnier, J.; Hong, B.; Humborg, C.; Johnes, P.; Mörth, C.-M.; Marino, R. Nitrogen fluxes from the landscape are controlled by net anthropogenic nitrogen inputs and by climate. Front. Ecol. Environ. 2012, 10, 37–43. [Google Scholar] [CrossRef] [Green Version]
- World Health Organisation (WHO); European Commission. Eutrophication and Health; WHO (Regional Office for Europe) and the European Commission: Luxembourg, 2002; Available online: https://ec.europa.eu/environment/water/water-nitrates/pdf/eutrophication.pdf (accessed on 17 February 2022).
- Russell, M.J.; Weller, D.E.; Jordan, T.E.; Sigwart, K.J.; Sullivan, K.J. Net anthropogenic phosphorus inputs: Spatial and temporal variability in the Chesapeake Bay region. Biogeochemistry 2008, 88, 285–304. [Google Scholar] [CrossRef]
- Antweiler, R.C.; Goolsby, D.A.; Taylor, H.E. Nutrients in the Mississippi River. In Contaminants in the Mississippi River 1987–1992; Meade, R.H., Ed.; U.S. Geological Survey Circular: Denver, CO, USA, 1995; Volume 1133, pp. 73–86. [Google Scholar]
- Jonsson, K.; Johansson, H.; Worman, A. Hyporheic exchange of reactive and conservative solutes in streams tracer methodology and model interpretation. J. Hydrol. 2003, 278, 153–171. [Google Scholar] [CrossRef]
- Ip, C.C.; Li, X.-D.; Zhang, G.; Wai, O.W.; Li, Y.-S. Trace metal distribution in sediments of the Pearl River Estuary and the surrounding coastal area, South China. Environ. Pollut. 2007, 147, 311–323. [Google Scholar] [CrossRef] [Green Version]
- Schlesinger, W.H.; Bernhardt, E.S. Biogeochemistry: An Analysis of Global Change, 3rd ed.; Academic Press: Waltham, MA, USA, 2013. [Google Scholar]
- Alexander, R.B.; Smith, R.A. County-Level Estimates of Nitrogen and Phosphorus Fertilizer Use in the United States, 1945 to 1985; Open-File Report 90-130; U.S. Geological Survey: Reston, VA, USA, 1990; pp. 15.
- Howarth, R.; Sharpley, A.; Walker, D. Sources of Nutrient Pollution to Coastal Waters in the United States: Implications for Achieving Coastal Water Quality Goals. Estuaries 2002, 25, 656–676. [Google Scholar] [CrossRef]
- Turner, R.E.; Rabalais, N.N.; Justic, D. Gulf of Mexico hypoxia: Altered states and a legacy. Environ. Sci. Technol. 2008, 42, 2323–2327. [Google Scholar] [CrossRef]
- Dentener, F.J.; Crutzen, P.J. A three dimensional model of the global ammonia cycle. J. Atmos. Chem. 1994, 19, 331–369. [Google Scholar] [CrossRef]
- Smil, V. Nitrogen in crop production: An account of global flows. Glob. Biogeochem. Cycles 1999, 13, 647–662. [Google Scholar] [CrossRef] [Green Version]
- Galloway, J.N.; Dentener, F.J.; Capone, D.G.; Boyer, E.W.; Howarth, R.W.; Seitzinger, S.P.; Asner, G.P.; Cleveland, C.C.; Green, P.A.; Holland, E.A.; et al. Nitrogen cycles: Past, present, and future. Biogeochemistry 2004, 70, 153–226. [Google Scholar] [CrossRef]
- Green, P.A.; Vörösmarty, C.J.; Meybeck, M.; Galloway, J.; Peterson, B.J.; Boyer, E. Pre-industrial and contemporary fluxes of nitrogen through rivers: A global assessment based on typology. Biogeochemistry 2004, 68, 71–105. [Google Scholar] [CrossRef]
- Worldometers.info. 7 Continents. 2021. Available online: https://www.worldometers.info/geography/7-continents/ (accessed on 17 February 2022).
- Battaglin, W.A.; Aulenbach, B.T.; Aldo, V.; Buxton, H.T. Changes in Streamflow and the Flux of Nutrients in the Mississippi-Atchafalaya River Basin, USA, 1980–2007; U.S. Geological Survey: Reston, VA, USA, 2010.
- Dale, V.H.; Armitage, T.; Bianchi, T.; Blumberg, A.; Boynton, W.; Conley, D.J.; Crumpton, W.; David, M.; Gilbert, D.; Howarth, R.W.; et al. Hypoxia in the Northern Gulf of Mexico; Springer: New York, NY, USA, 2010; p. 284. [Google Scholar]
- Robertson, D.M.; Saad, D.A. SPARROW Models Used to Understand Nutrient Sources in the Mississippi/Atchafalaya River Basin. J. Environ. Qual. 2014, 42, 1422. [Google Scholar] [CrossRef] [PubMed]
- Tian, H.; Xu, R.; Pan, S.; Yao, Y.; Bian, Z.; Cai, W.; Hopkinson, C.S.; Justic, D.; Lohrenz, S.; Lu, C.; et al. Long-Term Trajectory of Nitrogen Loading and Delivery From Mississippi River Basin to the Gulf of Mexico. Glob. Biogeochem. Cycles 2020, 34, e2019GB006475. [Google Scholar] [CrossRef]
- Scavia, D.; Rabalais, N.N.; Turner, R.E.; Justić, D.; Wiseman, W.J. Predicting the response of Gulf of Mexico hypoxia to variations in Mississippi River nitrogen load. Limnol. Oceanogr. 2003, 48, 951–956. [Google Scholar] [CrossRef] [Green Version]
- Turner, R.E.; Rabalais, N.N.; Justic, D. Predicting summer hypoxia in thenorthern Gulf of Mexico: Riverine N, P, and Si loading. Mar. Pollut. Bull. 2006, 52, 139–148. [Google Scholar] [CrossRef]
- Mississippi River/Gulf of Mexico Watershed Nutrient Task Force. Action plan for reducing, mitigating, and controlling hypoxia in the northern Gulf of Mexico. US Environmental Protection Agency, Mississippi River/Gulf of Mexico Watershed Nutrient Task Force: Washington, DC, USA, 2001. Available online: https://permanent.fdlp.gov/lps119826/LPS119826.pdf (accessed on 17 February 2022).
- Rabalais, N.N.; Turner, T.; Gupta, B.S.; Boesch, D.; Chapman, P.; Murrell, M. Hypoxia in the northern Gulf of Mexico: Does the science support the plan to reduce, mitigate, and control hypoxia? Estuaries Coasts 2007, 30, 753–772. [Google Scholar] [CrossRef]
- Sinha, E.; Michalak, A.; Balaji, V. Eutrophication will increase during the 21st century as a result of precipitation changes. Science 2017, 357, 405–408. [Google Scholar] [CrossRef] [Green Version]
- Foley, J.A.; Kucharik, C.J.; Twine, T.E.; Coe, M.T.; Donner, S.D. Land use, land cover, and climate change across the Mississippi basin: Impacts on selected land and water resources. Ecosyst. Land Use Chang. 2004, 15, 249–261. [Google Scholar]
- Ren, W.; Tian, H.; Cai, W.J.; Lohrenz, S.E.; Hopkinson, C.S.; Huang, W.J.; Yang, J.; Tao, B.; Pan, S.; He, R. Century-long increasing trend and variability of dissolved organic carbon export from the Mississippi River basin driven by natural and anthropogenic forcing. Glob. Biogeochem. Cycles 2016, 30, 1288–1299. [Google Scholar] [CrossRef]
- Van Meter, K.J.; Basu, N.B.; Van Cappellen, P. Two centuries of nitrogen dynamics: Legacy sources and sinks in the Mississippi and Susquehanna River Basins. Glob. Biogeochem. Cycles 2017, 31, 2–23. [Google Scholar] [CrossRef] [Green Version]
- Robertson, D.M.; Saad, D.A.; Christiansen, D.E.; Lorenz, D.J. Simulated impacts of climate change on phosphorus loading to Lake Michigan. J. Great Lakes Res. 2016, 42, 536–548. [Google Scholar] [CrossRef] [Green Version]
- Hungate, B.A.; Dukes, J.S.; Shaw, M.R.; Luo, Y.; Field, C.B. Nitrogen and climate change. Science 2003, 302, 1512–1513. [Google Scholar] [CrossRef] [Green Version]
- Wiley, M.J.; Hyndman, D.W.; Pijanowski, B.C.; Kendall, A.D.; Riseng, C.; Rutherford, E.S.; Cheng, S.T.; Carlson, M.L.; Tyler, J.A.; Stevenson, R.J.; et al. A multi-modeling approach to evaluating climate and land use change impacts in a Great Lakes River Basin. Hydrobiologia 2010, 657, 243–262. [Google Scholar] [CrossRef]
- USEPA United States Environmental Protection Agency. Watershed Modeling to Assess the Sensitivity of Streamflow, Nutrient, and Sediment Loads to Potential Climate Change and Urban Development in 20 U.S. Watersheds; National Center for Environmental Assessment: Washington, DC, USA, 2013. Available online: http://www.epa.gov/ncea (accessed on 17 February 2022).
- Chang, H. Water Quality Impacts of Climate and Land Use Changes in Southeastern Pennsylvania. Prof. Geogr. 2004, 56, 240–257. [Google Scholar]
- Ulen, B.; Johansson, G. Long-term nutrient leaching from a Swedish arable field with intensified crop production against a background of climate change. Acta Agric. Scand. Sect. B Soil Plant Sci. 2009, 59, 157–169. [Google Scholar] [CrossRef]
- Stuart, M.E.; Gooddy, D.C.; Bloomfield, J.P.; Williams, A.T. A review of the impact of climate change on future nitrate concentrations in groundwater of the UK. Sci. Total Environ. 2011, 409, 2859–2873. [Google Scholar] [CrossRef] [Green Version]
- Suddick, E.C.; Davidson, E.A. The Role of Nitrogen in Climate Change and the Impacts of Nitrogen-Climate Interactions on Terrestrial and Aquatic Ecosystems, Agriculture, and Human Health in the United States: A Technical Report Submitted to the US National Climate Assessment; North American Nitrogen Center of the International Nitrogen Initiative (NANC-INI); Woods Hole Research Center: Falmouth, ME, USA, 2012. [Google Scholar]
- Loecke, T.D.; Burgin, A.J.; Riveros-Iregui, D.A.; Ward, A.S.; Thomas, S.A.; Davis, C.A.; St Clair, M.A. Weather whiplash in agricultural regions drives deterioration of water quality. Biogeochemistry 2017, 133, 7–15. [Google Scholar] [CrossRef] [Green Version]
- Strickling, H.L.; Obenour, D.R. Leveraging Spatial and Temporal Variability to Probabilistically Characterize nutrient sources and export rates in a developing watershed. Water Resour. Res. 2018, 54, 5143–5162. [Google Scholar] [CrossRef]
- Iqbal, J.; Necpalova, M.; Archontoulis, S.V.; Anex, R.P.; Bourguignon, M.; Herzmann, D.; Mitchell, D.C.; Sawyer, J.E.; Zhu, Q.; Castellano, M.J. Extreme weather-year sequences have nonadditive effects on environmental nitrogen losses. Glob. Chang. Biol. 2018, 24, e303–e317. [Google Scholar] [CrossRef] [PubMed] [Green Version]
- Sinha, E.; Michalak, A.M. Precipitation dominates interannual variability ofriverine nitrogen loading across the continental United States. Environ. Sci. Technol. 2016, 50, 12874–12884. [Google Scholar] [CrossRef] [PubMed]
- Lu, C.; Zhang, J.; Tian, H.; Crumpton, W.G.; Helmers, M.J.; Cai, W.-J.; Hopkinson, C.S.; Lohrenz, S.E. Increased extreme precipitation challenges nitrogen load management to the Gulf of Mexico. Commun. Earth Environ. 2020, 1, 1–10. [Google Scholar] [CrossRef]
- Xia, X.H.; Zhang, S.B.; Li, S.L.; Zhang, L.W.; Wang, G.Q.; Zhang, L. The cycle of nitrogen in river systems: Sources, transformation, and flux. Environ. Sci. Process. Impacts 2018, 20, 863–891. [Google Scholar] [CrossRef]
- Ide, J.; Takeda, I.; Somura, H.; Mori, Y.; Sakuno, Y.; Yone, Y.; Takahashi, E. Impacts of hydrological changes on nutrient transport from diffuse sources in a rural river basin, western Japan. J. Geophys. Res. Biogeosci. 2019, 124, 2565–2581. [Google Scholar] [CrossRef]
- Thompson, E. How land use affects nutrient pollution in a changing climate. EOS 2019, 100. [Google Scholar] [CrossRef]
- Wu, L.; Long, T.; Liu, X.; Guo, J. Impacts of climate and land-use changes on the migration of non-point source nitrogen and phosphorus during rainfall-runoff in the Jialing River Watershed, China. J. Hydrol. 2012, 475, 26–41. [Google Scholar] [CrossRef]
- El-Khoury, A.; Seidou, O.; Lapen, D.; Que, Z.; Mohammadian, M.; Sunohara, M.; Bahram, D. Combined impacts of future climate and land use changes on discharge, nitrogen and phosphorus loads for a Canadian river basin. J. Environ. Manag. 2015, 151, 76–86. [Google Scholar] [CrossRef] [Green Version]
- Parsons, A.J.; Wainwright, J.; Powell, D.M.; Kaduk, J.; Brazier, R.E. A conceptual model for determining soil erosion by water. Earth Surf. Process. Landf. 2004, 29, 1293–1302. [Google Scholar] [CrossRef]
- Parsons, A.J.; Brazier, R.E.; Wainwright, J.; Powell, D.M. Scale relationships in hillslope runoff and erosion. Earth Surf. Process. Landf. 2006, 31, 1384–1393. [Google Scholar] [CrossRef]
- USGS United States Geological Survey. 2022. Available online: https://www.sciencebase.gov/catalog/item/617987dbd34ea58c3c6fa16e (accessed on 17 February 2022).
- National Oceanic and Atmospheric Administration (NOAA). 2022. Available online: https://www.psl.noaa.gov/data/gridded/ (accessed on 17 February 2022).
- Subramanya, K. Engineering Hydrology, 3rd ed.; McGraw-Hill Education: New Delhi, India, 2009; p. 450. [Google Scholar]
- Godsey, S.E.; Kirchner, J.W.; Clow, D.W. Concentration–discharge relationships reflect chemostatic characteristics of US catchments. Hydrol. Process. 2009, 23, 1844–1864. [Google Scholar] [CrossRef]
- PennState. 2018. Available online: https://online.stat.psu.edu/stat462/node/180/ (accessed on 25 February 2022).
- Mi, X.C.; Zhang, J.-T.; Zhang, F.; Shangguan, T.L. Analysis of relationships between vegetation and climate in Shanxi Plateau. Acta Phytoecol. Sin. 1996, 20, 549–560, (In Chinese with English abstract). [Google Scholar]
- Zhang, J.-T. A study on relations of vegetation, climate and soils in Shanxi province, China. Plant Ecol. 2002, 162, 23–31. [Google Scholar]
- Zhang, J.-T.; Ru, W.; Li, B. Relationships between vegetation and climate on The loess plateau in china. Folia Geobot. 2006, 41, 151–163. [Google Scholar] [CrossRef]
- Goward, S.N.; Prince, S.D. Transient effects of climate on vegetation dynamics: Satellite observations. J. Biogeogr. 1995, 22, 549–563. [Google Scholar] [CrossRef]
- Fan, X.; Ma, Z.; Yang, Q.; Han, Y.; Mahmood, R. Land use/land cover changes and regional climate over the Loess Plateau during 2001–2009. Part II: Interrelationship from observations. Clim. Chang. 2015, 129, 441–455. [Google Scholar] [CrossRef] [Green Version]
- Kishtawal, C.M.; Niyogi, D.; Tewari, M.; PielkeSr, R.A.; Shepherd, J.M. Urbanization signature in the observed heavy rainfall climatology over India. Int. J. Climatol. 2010, 30, 1908–1916. [Google Scholar] [CrossRef] [Green Version]
- Costa, M.H.; Yanagi, S.N.; Oliveira, P.J.; Ribeiro, A.; Rocha, E.J. Climate change in Amazonia caused by soybean cropland expansion, as compared to caused by pastureland expansion. Geophys. Res. Lett. 2007, 34, L07706. [Google Scholar] [CrossRef]
- Sampaio, G.; Nobre, C.; Costa, M.; Satyamurty, P.; Soares-Filho, B.; Cardoso, M. Regional climate change over eastern Amazonia caused by pasture and soybean cropland expansion. Geophys. Res. Lett. 2007, 34, L17709. [Google Scholar] [CrossRef] [Green Version]
- Notaro, M.; Liu, Z. Observed vegetation–climate feedbacks in the United States. J. Clim. 2006, 19, 763–786. [Google Scholar] [CrossRef] [Green Version]
- Clark, C.A.; Arritt, R.W. Numerical Simulations of the Effect of Soil Moisture and Vegetation Cover on the Development of Deep Convection. J. Appl. Meteorol. Climatol. 1995, 34, 2029–2045. [Google Scholar] [CrossRef] [Green Version]
- Sud, Y.C.; Mocko, D.M.; Walker, G.K. Influence of land surface fluxes on precipitation: Inferences from simulations forced with four ARM-CART SCM datasets. J. Clim. 2001, 14, 3666–3691. [Google Scholar] [CrossRef]
- Freedman, J.M.; Fitzjarrald, D.R.; Moore, K.E.; Sakai, R.K. Boundary layer clouds and vegetation–atmosphere feedbacks. J. Clim. 2001, 14, 180–197. [Google Scholar] [CrossRef]
- McPherson, R.A. A review of vegetation–atmosphere interactions and their influences on mesoscale phenomena. Prog. Phys. Geogr. 2007, 31, 261–285. [Google Scholar] [CrossRef]
- Zhou, Y.; Yang, Z.; Zhang, D.; Jin, X.; Zhang, J. Inter-catchment comparison of flow regime between the Hailiutu and Huangfuchuan rivers in the semi-arid Erdos Plateau, Northwest China. Hydrol. Sci. J. 2015, 60, 688–705. [Google Scholar] [CrossRef]
- Chai, Y.; Zhu, B.; Yue, Y.; Yang, Y.; Li, S.; Ren, J.; Xiong, H.; Cui, X.; Yan, X.; Li, Y. Reasons for the homogenization of the seasonal discharges in the Yangtze River. Hydrol. Res. 2020, 51, 470–483. [Google Scholar] [CrossRef] [Green Version]
- Jaynes, D.B.; Colvin, T.S.; Karlen, D.L.; Cambardella, C.A.; Meek, D.W. Nitrate Loss in Subsurface Drainage as Affected by Nitrogen Fertilizer Rate. J. Environ. Qual. 2001, 30, 1305–1314. [Google Scholar] [CrossRef]
- Xu, Z.; Zhang, X.; Xie, J.; Yuan, G.; Tang, X.; Sun, X.; Yu, G. Total Nitrogen Concentrations in Surface Water of Typical Agro- and Forest Ecosystems in China, 2004–2009. PLoS ONE 2014, 9, e92850. [Google Scholar] [CrossRef]
- Chichester, F.W.; Richardson, C.W. Sediment and nutrient loss from clay soils as affected by tillage. J. Environ. Qual. 1992, 21, 587–590. [Google Scholar] [CrossRef]
- Franklin, D.H.; Truman, C.C.; Potter, T.L.; Bosch, D.D.; Strickland, T.C.; Jenkins, M.B.; Nuti, R.C. Nutrient losses in runoff from conventional and no-till pearl millet on pre-wetted Ultisols fertilized with broiler litter. Agric. Water Manag. 2012, 113, 38–44. [Google Scholar] [CrossRef]
- Issaka, F.; Zhang, Z.; Zhao, Z.Q.; Asenso, E.; Li, J.H.; Li, Y.T.; Wang, J.J. Sustainable conservation tillage improves soil nutrients and reduces nitrogen and phosphorous losses in maize farmland in southern China. Sustainability 2019, 11, 2397. [Google Scholar] [CrossRef] [Green Version]
- Valiela, I.; Bowen, J.L. Nitrogen sources to watersheds and estuaries: Role of land cover mosaics and losses within watersheds. Environ. Pollut. 2002, 118, 239–248. [Google Scholar] [CrossRef]
- McClain, M.E.; Richey, J.E.; Pimentel, T.P. Groundwater nitrogen dynamics at the terrestriallotic interface of a small catchment in the Central Amazon Basin. Biogeochemistry 1994, 27, 113–127. [Google Scholar] [CrossRef]
- Hedin, L.O.; von Fischer, J.C.; Ostrom, N.E.; Kennedy, B.P.; Brown MGRobertson, G.P. Thermodynamic constraints on nitrogen transformations and other biogeochemical processes at soil stream interfaces. Ecology 1998, 79, 684–703. [Google Scholar] [CrossRef] [Green Version]
- Hill, A.R.; Devito, K.J.; Campagnolo, S.; Sanmugadas, K. Subsurface denitrification in a forest riparian zone: Interactions between hydrology and supplies of nitrate and organic carbon. Biogeochemistry 2000, 51, 193–223. [Google Scholar] [CrossRef]
- Groffman, P.M.; Gold, A.J.; Simmons, R.C. Nitrate dynamics in riparian forests: Microbial studies. J. Environ. Qual. 1992, 21, 666–671. [Google Scholar] [CrossRef] [Green Version]
- Groffman, P.M.; Holland, E.; Myrold, D.D.; Robertson, G.P.; Zou, X. Denitrification. In Standard Soil Methods for Long Term Ecological Research; Robertsonn, G.P., Bledsoe, C.S., Coleman, D.C., Sollins, P., Eds.; Oxford University Press: New York, NY, USA, 1999; pp. 272–288. [Google Scholar]
- Lowrance, R. Groundwater nitrate and denitrification in a coastal plain riparian forest. J. Environ. Qual. 1992, 21, 401–405. [Google Scholar] [CrossRef]
- Horel, A.; Potyó, I.; Szili-Kovács, T.; Molnár, S. Potential nitrogen fixation changes under different land uses as influenced by seasons and biochar amendments. Arab. J. Geosci. 2018, 11, 559. [Google Scholar] [CrossRef] [Green Version]
- White, M.D.; Greer, K.A. The effects of watershed urbanization on the stream hydrology and riparian vegetation of Los Peñasquitos Creek, California. Landsc. Urban Plan. 2006, 74, 125–138. [Google Scholar] [CrossRef]
- USGS United States Geological Survey. The Quality of Our Nation’s Waters—Nutrients and Pesticides; U.S. Geological Survey Circular: Reston, VA, USA, 1999; Volume 1225, p. 82. Available online: https://pubs.usgs.gov/circ/1999/1225/report.pdf (accessed on 17 February 2022).
- USGS United States Geological Survey. 2012. Available online: https://sparrow.wim.usgs.gov/sparrow-midwest-2012/ (accessed on 17 February 2022).
- Schlesinger, W.H.; Ward, T.J.; Anderson, J. Nutrient losses in runoff from grassland and shrubland habitats in Southern New Mexico: II. Field plots. Biogeochemistry 2000, 49, 69–86. [Google Scholar] [CrossRef]
- Bertol, I.; Mello, E.L.; Guadagnin, J.C.; Zaparolli, A.L.V.; Carrafa, M.R. Nutrients losses by water erosion. Sci. Agric. 2003, 60, 581–586. [Google Scholar] [CrossRef]
- Guadagnin, J.C.; Bertol, I.; Cassol, P.C.; Amaral, A.J. Soil, water and nitrogen losses through erosion under different tillage systems. Rev. Bras. Cienc. Solo 2005, 29, 277–286. [Google Scholar] [CrossRef]
- Berhe, A.A.; Arnold, C.; Stacy, E.; Lever, R.; McCorkle EAraya, S.N. Soil erosion controls on biogeochemical cycling of carbon and nitrogen. Nat. Educ. Knowl. 2014, 5, 2. [Google Scholar]
- Bramorski, J.; Trivelin, P.C.O.; Crestana, S. Nitrogen loss by erosion from mechanically tilled and untilled soil under successive simulat-ed rainfalls. Rev. Bras. Cienc. Solo. 2015, 39, 1204–1211. [Google Scholar] [CrossRef] [Green Version]
- de Vente, J.; Poesen, J. Predicting soil erosion and sediment yield at the basin scale: Scale issues and semi-quantitative models. Earth Sci. Rev. 2005, 71, 95–125. [Google Scholar] [CrossRef]
- de Vente, J.; Poesen, J.; Arabkhedri, M.; Verstraeten, G. The sediment delivery problem revisited. Prog. Phys. Geogr. 2007, 31, 155–178. [Google Scholar] [CrossRef] [Green Version]
- Osterkamp, W.R.; Toy, T.J. Geomorphic considerations for erosion prediction. Environ. Geol. 1997, 29, 152–157. [Google Scholar] [CrossRef]
- Walling, D.E. The sediment delivery problem. J. Hydrol. 1983, 65, 209–237. [Google Scholar] [CrossRef]
- Syvitski, J.P. Supply and flux of sediment along hydrological pathways: Research for the 21st century. Glob. Planet. Chang. 2003, 39, 1–11. [Google Scholar] [CrossRef]
- Milliman, J.D.; Meade, R.H. World-wide delivery of river sediment to the oceans. J. Geol. 1983, 91, 1–21. [Google Scholar] [CrossRef]
- Milliman, J.D.; Syvitski, J.P. Geomorphic/tectonic control of sediment discharge to the ocean: The importance of small mountainous rivers. J. Geol. 1992, 100, 525–544. [Google Scholar] [CrossRef]
- Lane, L.J.; Hernandez, M.; Nichols, M. Processes controlling sediment yield from watersheds as function of spatial scale. Environ. Model. Softw. 1997, 12, 355–369. [Google Scholar] [CrossRef]
- Mutema, M.; Chaplot, V.; Jewitt, G.; Chivenge, P.; Bloschl, G. Annual water, sediment, nutrient, and organic carbon fluxes in river basins: A global meta-analysis as a function of scale. Water Resour. Res. 2015, 51, 8949–8972. [Google Scholar] [CrossRef] [Green Version]


| Pre-Industrial Nmob (Tg/Year) | Contemporary Nmob (Tg/Year) | |||||||||
|---|---|---|---|---|---|---|---|---|---|---|
| Deposition | Fixation | Total | Deposition | Fixation | Fertiliser | Livestock Load | People Load | Total | World Population Share (%) * | |
| Africa | 3.63 | 31.99 | 35.61 | 6.58 | 25.02 | 0.94 | 6.43 | 2.25 | 41.22 | 17.20 |
| Asia | 3.29 | 25.45 | 28.73 | 11.21 | 22.62 | 20.21 | 22.41 | 12.7 | 89.15 | 59.54 |
| Australia | 0.46 | 6.99 | 7.45 | 0.46 | 5.7 | 0.19 | 1.48 | 0.09 | 7.91 | 0.33 |
| Europe | 0.62 | 3.92 | 4.54 | 4.4 | 3.06 | 5.48 | 10.13 | 3.09 | 26.16 | 9.59 |
| North America | 1.27 | 9.81 | 11.07 | 6.16 | 8.76 | 5.48 | 5.85 | 1.95 | 28.21 | 7.60 |
| Oceania | 0.02 | 0.34 | 0.35 | 0.03 | 0.17 | 0.07 | 0.58 | 0.02 | 0.87 | 0.21 |
| South America | 2.75 | 20.16 | 22.91 | 3.51 | 16.12 | 1.59 | 6.63 | 1.21 | 29.06 | 5.53 |
| Totals | 12 | 99 | 111 | 32 | 81 | 34 | 54 | 21 | 223 | 100 |
| No. | River | Area (km2) | Mean Annual Precipitation (m) | Pasture/ Grassland | Forest | Barren | Agriculture | Urban | Water/ Wetland | Shrub/ Scrub | Correlation (r2) between Q-C | Correlation (r2) between Q-Y |
|---|---|---|---|---|---|---|---|---|---|---|---|---|
| 1 | Little Arkansas River near Sedgwick, KS | 3210 | 0.74 | 23.7 | 3.7 | 0.1 | 61.5 | 9.4 | 1.4 | 0.2 | 0.02+ | 0.96+ |
| 2 | Grand River near Sumner, MO | 17,820 | 0.91 | 47.2 | 17.7 | 0.2 | 26.4 | 4.7 | 3.4 | 0.4 | 0.18+ | 0.69+ |
| 3 | Elkhorn River at Waterloo, NE | 17,869 | 0.64 | 31.2 | 1.6 | 0.2 | 57.8 | 4.2 | 4.8 | 0.2 | 0.71+ | 0.97+ |
| 4 | South Platte River near Kersey, CO | 25,019 | 0.37 | 30.5 | 30.8 | 0.6 | 4.4 | 8.9 | 4.2 | 20.6 | 0.59− | 0.90+ |
| 5 | White River at Hazleton, IN | 29,279 | 0.96 | 9.5 | 31.9 | 0.3 | 44.1 | 11.7 | 2.2 | 0.3 | 0.28+ | 0.92+ |
| 6 | Iowa River at Wapello, IA | 32,369 | 0.87 | 8.6 | 4.2 | 0.2 | 75.9 | 7.2 | 3.7 | 0.2 | 0.54+ | 0.94+ |
| 7 | Yazoo River below Steele Bayou near Long Lake, MS | 34,590 | 1.22 | 10.5 | 26.8 | 0.2 | 39.1 | 5.4 | 15.9 | 2.1 | 0.09+ | 0.84+ |
| 8 | North Canadian River near Harrah, OK | 35,680 | 0.67 | 48.6 | 10.4 | 0.2 | 24 | 5.3 | 1 | 10.5 | 0.31− | 0.99+ |
| 9 | Des Moines River at Keosauqua, IA | 36,360 | 0.85 | 13.4 | 9.4 | 0.2 | 65.9 | 7.6 | 3.2 | 0.3 | 0.61+ | 0.92+ |
| 10 | Osage River near St. Thomas, MO | 37,769 | 0.97 | 45.2 | 31.4 | 0.2 | 12.6 | 5.8 | 4.3 | 0.5 | 0.14+ | 0.94+ |
| 11 | Illinois River at Valley City, IL | 69,259 | 0.92 | 4.9 | 11.7 | 0.3 | 64.8 | 14.2 | 3.8 | 0.3 | 0.41+ | 0.95+ |
| 12 | Wabash River at New Harmony, IN | 75,720 | 0.97 | 6.3 | 20.5 | 0.2 | 61 | 9.2 | 2.5 | 0.3 | 0.24+ | 0.91+ |
| 13 | Mississippi River at Hastings, MN | 96,090 | 0.69 | 9.1 | 16 | 0.3 | 46 | 7.1 | 20.8 | 0.7 | 0.51+ | 0.94+ |
| 14 | Tennessee River at Highway 60 near Paducah, KY | 104,449 | 1.18 | 21.9 | 58.5 | 0.3 | 3.4 | 9.7 | 4.1 | 2.1 | 0.45+ | 0.93+ |
| 15 | Kansas River at DeSoto, KS | 154,770 | 0.64 | 39.5 | 2 | 0.2 | 53 | 4 | 0.9 | 0.4 | 0.58+ | 0.97+ |
| 16 | Red River at Alexandria, LA | 174,819 | 0.86 | 36.6 | 21.4 | 0.5 | 14.5 | 4.7 | 6 | 16.3 | 0.26+ | 0.99+ |
| 17 | Yellowstone River near Sidney, MT | 178,919 | 0.36 | 33 | 12.5 | 1 | 3.7 | 1.3 | 2.1 | 46.4 | 0.31+ | 0.89+ |
| 18 | Platte River at Louisville, NE | 221,110 | 0.41 | 50.8 | 8.9 | 0.3 | 15.1 | 3.5 | 3.4 | 18 | 0.52+ | 0.96+ |
| 19 | Mississippi River at Clinton, IA | 221,710 | 0.84 | 10.7 | 26.3 | 0.2 | 36.5 | 6.3 | 19.2 | 0.8 | 0.13+ | 0.83+ |
| 20 | Ohio River at Cannelton Dam at Cannelton, IN | 251,230 | 0.99 | 16.9 | 59.6 | 0.5 | 10.6 | 9.9 | 1.6 | 0.9 | 0.58+ | 0.98+ |
| 21 | Arkansas River at David D Terry Lock and Dam below Little Rock, AR | 410,330 | 0.65 | 44.1 | 15.2 | 0.3 | 20.9 | 4.6 | 1.7 | 13.2 | 0.29+ | 0.97+ |
| 22 | Mississippi River Below Grafton, IL | 443,670 | 0.87 | 10.6 | 18.5 | 0.2 | 50.4 | 8.1 | 11.7 | 0.5 | 0.56+ | 0.93+ |
| 23 | Ohio River at Olmsted, IL | 525,770 | 1.05 | 17.1 | 53.7 | 0.4 | 17.8 | 7.5 | 2.5 | 1 | 0.42+ | 0.96+ |
| 24 | Missouri River at Omaha, NE | 836,050 | 0.46 | 42 | 8.5 | 0.6 | 22.3 | 2.3 | 3.5 | 20.8 | 0.16+ | 0.37+ |
| 25 | Missouri River at Hermann, MO | 1,353,370 | 0.50 | 43 | 9.4 | 0.5 | 25.8 | 3.2 | 3.2 | 14.9 | 0.39+ | 0.88+ |
| 26 | Mississippi River at Thebes, IL | 1,847,179 | 0.59 | 34.4 | 11.5 | 0.4 | 32.7 | 4.5 | 5.5 | 11 | 0.62+ | 0.94+ |
| Catchment No. | Area (km2) | Median Qarea (mm min−1) | Median Concentrations (mg TN L−1) | Median Yields (mg TN m−2 min−1) |
|---|---|---|---|---|
| 1 | 3210 | 3.97 × 10⁵ | 2.636 | 8.86 × 10⁵ |
| 2 | 17,820 | 2.78 × 10⁴ | 2.551 | 9.28 × 10⁴ |
| 3 | 17,869 | 1.62 × 10⁴ | 7.152 | 1.30 × 10³ |
| 4 | 25,019 | 6.29 × 10⁵ | 6.073 | 3.90 × 10⁴ |
| 5 | 29,279 | 8.37 × 10⁴ | 2.834 | 2.48 × 10³ |
| 6 | 32,369 | 6.01 × 10⁴ | 8.076 | 4.84 × 10³ |
| 7 | 34,590 | 7.76 × 10⁴ | 1.420 | 1.07 × 10³ |
| 8 | 35,680 | 1.05 × 10⁵ | 5.394 | 5.27 × 10⁵ |
| 9 | 36,360 | 4.24 × 10⁴ | 9.268 | 3.66 × 10³ |
| 10 | 37,769 | 3.12 × 10⁴ | 0.782 | 2.48 × 10⁴ |
| 11 | 69,259 | 6.05 × 10⁴ | 5.168 | 3.16 × 10³ |
| 12 | 75,720 | 7.49 × 10⁴ | 4.194 | 3.13 × 10³ |
| 13 | 96,090 | 3.19 × 10⁴ | 4.500 | 1.40 × 10³ |
| 14 | 104,449 | 7.51 × 10⁴ | 0.663 | 4.97 × 10⁴ |
| 15 | 154,770 | 3.11 × 10⁵ | 2.295 | 1.62 × 10⁴ |
| 16 | 174,819 | 1.80 × 10⁴ | 1.052 | 1.89 × 10⁴ |
| 17 | 178,919 | 7.37 × 10⁵ | 0.845 | 6.03 × 10⁵ |
| 18 | 221,110 | 5.79 × 10⁵ | 3.804 | 2.17 × 10⁴ |
| 19 | 221,710 | 4.37 × 10⁴ | 2.929 | 1.39 × 10³ |
| 20 | 251,230 | 8.51 × 10⁴ | 1.906 | 1.54 × 10³ |
| 21 | 410,330 | 1.12 × 10⁴ | 0.943 | 1.04 × 10⁴ |
| 22 | 443,670 | 4.93 × 10⁴ | 4.080 | 2.05 × 10³ |
| 23 | 525,770 | 8.75 × 10⁴ | 1.822 | 1.76 × 10³ |
| 24 | 836,050 | 6.76 × 10⁵ | 2.536 | 1.71 × 10⁴ |
| 25 | 1,353,370 | 9.02 × 10⁵ | 2.959 | 3.01 × 10⁴ |
| 26 | 1,847,179 | 2.27 × 10⁴ | 3.493 | 8.74 × 10⁴ |
| Area (km2) | Mean Annual Precipitation (m) | Bare Land | Forest | Wetland/Water | Grassland/Pasture | Scrub/Shrub | Urban | |
|---|---|---|---|---|---|---|---|---|
| Area (km2) | 1.00 | |||||||
| Mean annual precipitation (m) | −0.33 | 1.00 | ||||||
| Bare land | 0.30 | −0.50 | 1.00 | |||||
| Forest | −0.10 | 0.58 | 0.15 | 1.00 | ||||
| Wetland/Water | −0.04 | 0.19 | −0.18 | 0.05 | 1.00 | |||
| Grassland/Pasture | 0.26 | −0.55 | 0.22 | −0.27 | −0.42 | 1.00 | ||
| Scrub/Shrub | 0.25 | −0.71 | 0.86 | −0.19 | −0.21 | 0.48 | 1.00 | |
| Urban | −0.36 | 0.55 | −0.33 | 0.41 | −0.01 | −0.70 | −0.57 | 1.00 |
| Median Qarea (mm min−1) | Median TN Concentration (mg L−1) | Median TN Yield (mg m−2 min−1) | |
|---|---|---|---|
| Area (km2) | −0.18 | −0.16 | −0.20 |
| Mean annual precipitation (m) | 0.83 | −0.18 | 0.43 |
| Barren | −0.21 | −0.29 | −0.32 |
| Agriculture | 0.18 | 0.62 | 0.70 |
| Forest | 0.67 | −0.44 | −0.01 |
| Wetland/Water | 0.16 | 0.00 | 0.07 |
| Grassland/Pasture | −0.75 | −0.29 | −0.76 |
| Scrub/Shrub | −0.54 | −0.23 | −0.49 |
| Urban | 0.64 | 0.21 | 0.55 |
Publisher’s Note: MDPI stays neutral with regard to jurisdictional claims in published maps and institutional affiliations. |
© 2022 by the authors. Licensee MDPI, Basel, Switzerland. This article is an open access article distributed under the terms and conditions of the Creative Commons Attribution (CC BY) license (https://creativecommons.org/licenses/by/4.0/).
Share and Cite
Allafta, H.; Opp, C. Understanding the Combined Effects of Land Cover, Precipitation and Catchment Size on Nitrogen and Discharge—A Case Study of the Mississippi River Basin. Water 2022, 14, 865. https://doi.org/10.3390/w14060865
Allafta H, Opp C. Understanding the Combined Effects of Land Cover, Precipitation and Catchment Size on Nitrogen and Discharge—A Case Study of the Mississippi River Basin. Water. 2022; 14(6):865. https://doi.org/10.3390/w14060865
Chicago/Turabian StyleAllafta, Hadi, and Christian Opp. 2022. "Understanding the Combined Effects of Land Cover, Precipitation and Catchment Size on Nitrogen and Discharge—A Case Study of the Mississippi River Basin" Water 14, no. 6: 865. https://doi.org/10.3390/w14060865
APA StyleAllafta, H., & Opp, C. (2022). Understanding the Combined Effects of Land Cover, Precipitation and Catchment Size on Nitrogen and Discharge—A Case Study of the Mississippi River Basin. Water, 14(6), 865. https://doi.org/10.3390/w14060865