Article

Simulation and Prediction of the Impact of Climate Change Scenarios on Runoff of Typical Watersheds in Changbai Mountains, China

1
Key Lab of Groundwater Resources and Environment, Ministry of Education, Jilin University, Changchun 130012, China
2
Key Laboratory of Water Resources and Water Environment, Jilin University, Changchun 130012, China
3
College of New Energy and Environment, Jilin University, Changchun 130012, China
*
Author to whom correspondence should be addressed.
Water 2022, 14(5), 792; https://doi.org/10.3390/w14050792
Submission received: 9 December 2021 / Revised: 7 February 2022 / Accepted: 14 February 2022 / Published: 3 March 2022
(This article belongs to the Topic Water Management in the Era of Climatic Change)

Abstract

:
Simulating the hydrological process of a river basin helps to understand the evolution of water resources in the region and provides scientific guidance for water resources allocation policies between different river basins and water resources management within the river basin. This paper provides a scientific basis for the sustainable development of regional water resources and an accurate grasp of the future change trend of runoff by analyzing the hydrological process response of runoff in typical watersheds in Changbai Mountains, China, to climate change. The applicability of the HEC-HMS (The Hydrologic Engineering Center’s-Hydrologic Modeling System) hydrological model in the watershed is verified by calibrating and verifying the daily rainfall-runoff process in the watershed during the wet season from 2006 to 2017. The daily rainfall data of the two scenarios SSP2-4.5 and SSP5-8.5 under the BCC-CSM2-MR model in the 2021–2050 CMIP6 plan were downscaled and interpolated to in-basin stations to generate future daily precipitation series to predict runoff response to future climate change. The daily rainfall data of the two scenarios were downscaled and interpolated to the stations in the basin to generate future daily rainfall series to predict the runoff response under future climate changes. The average certainty coefficient of the HEC-HMS model for daily runoff simulation reached 0.705; the rainfall in the basin under the two climate scenarios of SSP2-4.5 and SSP5-8.5 in the next 30 years (2021–2050) will generally increase, and rainfall will be more evenly distributed in the future; the outlet flow of the basin will increase during the wet season (June–September) in the next 30 years, but it is lower than the historically measured value; the peak flow of the future will appear at most in August and September. The peak flow current time mostly appears in July and August. The time of peak occurrence has been delayed.

1. Introduction

As the foundation of human survival and development, water resources are irreplaceable natural resources for sustainable economic and social development. Global climate change inevitably and significantly affects the water cycle of the river basin, which in turn affects regional water resources security and sustainable development. In the context of continued climate warming in the future, the structure of the water resources system will continue to change. Risks related to freshwater resources, such as water supply and water utilization, will increase significantly. The response to hydrological processes under climate change has become a hot spot in the field of hydrology and water resources research [1,2,3]. Climate change scenarios are a collection of possible future climate change situations. Simulating the impact of possible climate scenarios on river runoff will help to effectively reduce floods, droughts, water shortages and pollution through rational and effective use of water resources and adapt the impact of climate change on water resources.
Currently, in making predictions and assessments based on the evolution of the hydrological cycle under different future climate change scenarios [4,5,6,7,8], medium and long-term runoff forecasting has become increasingly important [9,10]. Research usually selects future climate scenarios and climate models or uses mathematical model calculations and downscaling methods to process the data and then analyzes the evolution of future climate and hydrology [11,12,13], while carrying out prediction and response research on hydrological elements [14,15]. Among them, the uncertain factors of future scenarios and hydrological models are the most difficult points in the research [16]. In recent years, the research on global climate models has made great progress. Among them, the International Coupled Model Comparison Program (CMIP) organized by the World Climate Research Program (WCRP) has been widely used in climate change simulation and projection data. In 2019, WCRP announced the data of the sixth phase of the pilot program (CMIP6), and the analysis results based on these data will form the basis of future climate assessments. Jiang et al. [17] selected five CMIP6 global models including seven combined scenarios (SSP1-1.9, SSP1-2.6, SSP4-3.4, SSP2-4.5, SSP4-6.0, SSP3-7.0 and SSP5-8.5) for downscaling; analyzed the temporal and spatial evolution of the average temperature and precipitation in the Huaihe River Basin from 2021 to 2100; and compared with CMIP5 forecast results; they found that, under the CMIP6 scenario, future temperature growth in the Huaihe River Basin will be faster, and the increase in precipitation will be even greater. Pokhrel et al. [18] used the cumulative distribution function transformation method to correct the deviation of CMIP6 data. Considering future climate scenarios, it predicts the flow of the New River in North Carolina and assesses flood risk. Based on the RBF neural network downscaling model. Wang et al. [19] used two climate scenarios of RCP8.5 and RCP2.6 under the CanESM2 model from 2020 to 2099 to predict runoff in the upper reaches of the Han Jiang River. The results showed that the annual runoff in the upper Han Jiang River did not increase significantly. Based on the HEC-HMS model, Tang et al. [20] predicted that the future runoff in the Lanjiang River Basin will show a significant upward trend, and the increase degree will increase synchronously with the increase in radiative forcing. Li et al. [21] used the Yellow River Water Balance Model (YRWBM) hydrological model to predict future natural runoff and its temporal and spatial changes and used future climate scenarios as input. The forecast results show that the runoff of the Yellow River will decrease in the future.
Hydrological models are considered to be effective tools for water resources utilization and integrated river basin management. They can be used for river management planning; reservoir integrated operation and utilization; and river basin water environmental management in areas with little data. They can be used to simulate the water cycle process of the river basin and changes in climate and human activities. It is an important tool and method to reveal the law of runoff changes in response to water resources [22,23]. The HEC-HMS hydrological model is a basin hydrological simulation system developed by the Hydrological Engineering Center of the U.S. Army Corps of Engineers. It is a distributed hydrological model with a physical concept. Previous studies have shown that the HEC-HMS model can simulate and predict runoff based on data sets and watershed types at different time scales [24]. Most of these studies clearly show that the results of the model simulation are for data at specific locations and at different time scales, because the model contains different combinations of rainfall loss, direct runoff, base flow and channel confluence model sets. The degree of response in different regions is different [25]. Al-Abed et al. [26] used monthly runoff to study the Zhaka Basin in Jordan and showed that the HEC-HMS model has better results than other models. Radmanesh et al. [27] performed the HEC-HMS model in the Yellow River Basin in Southwestern Iran. Calibrated and verified, Sardoii et al. [28] used HEC-HMS and geographic information system GIS to simulate the rainfall-runoff process in the Amirkabir watershed and concluded that the runoff loss method of Green and Ampt can be applied in similar areas and conditions.
Changbai Mountains is the highest mountain system on the eastern edge of Eurasia. Located in the northeast of China and the southeast of Jilin Province, it is the birthplace of the Yalu River, Songhua River and Tumen River in Northeast China. It is also an important water source protection area and ecological function area. Water resources account for 78.6% of Jilin Province. It is an important water conservation area in Jilin province and even the entire Northeast. The Changbai Mountains area has abundant mineral water resources and high quality. It is listed as the world’s three major high-quality mineral water production areas alongside the European Alps and the Russian Caucasus. Affected by the climate of the alpine mountainous area, there are about 5 months of the year in the icy period where the temperature is below zero, and rainfall is extremely uneven during the year where it is mainly concentrated in the wet season from June to September. Changbai Mountains is located in the core area of the Northeast China Transect of the Global Change Land Transect. It is significantly affected by global climate change. However, there is a lack of relevant research on the evolution and development trends of regional water resources. Carrying out rainfall and runoff simulation and prediction of typical watersheds in Changbai Mountains during the wet season and studying the response relationship between regional climate and runoff under different climate change scenarios in the future can provide scientific support for water resource management in the watershed to cope with climate change and to maintain regional ecological security.

2. Materials and Methods
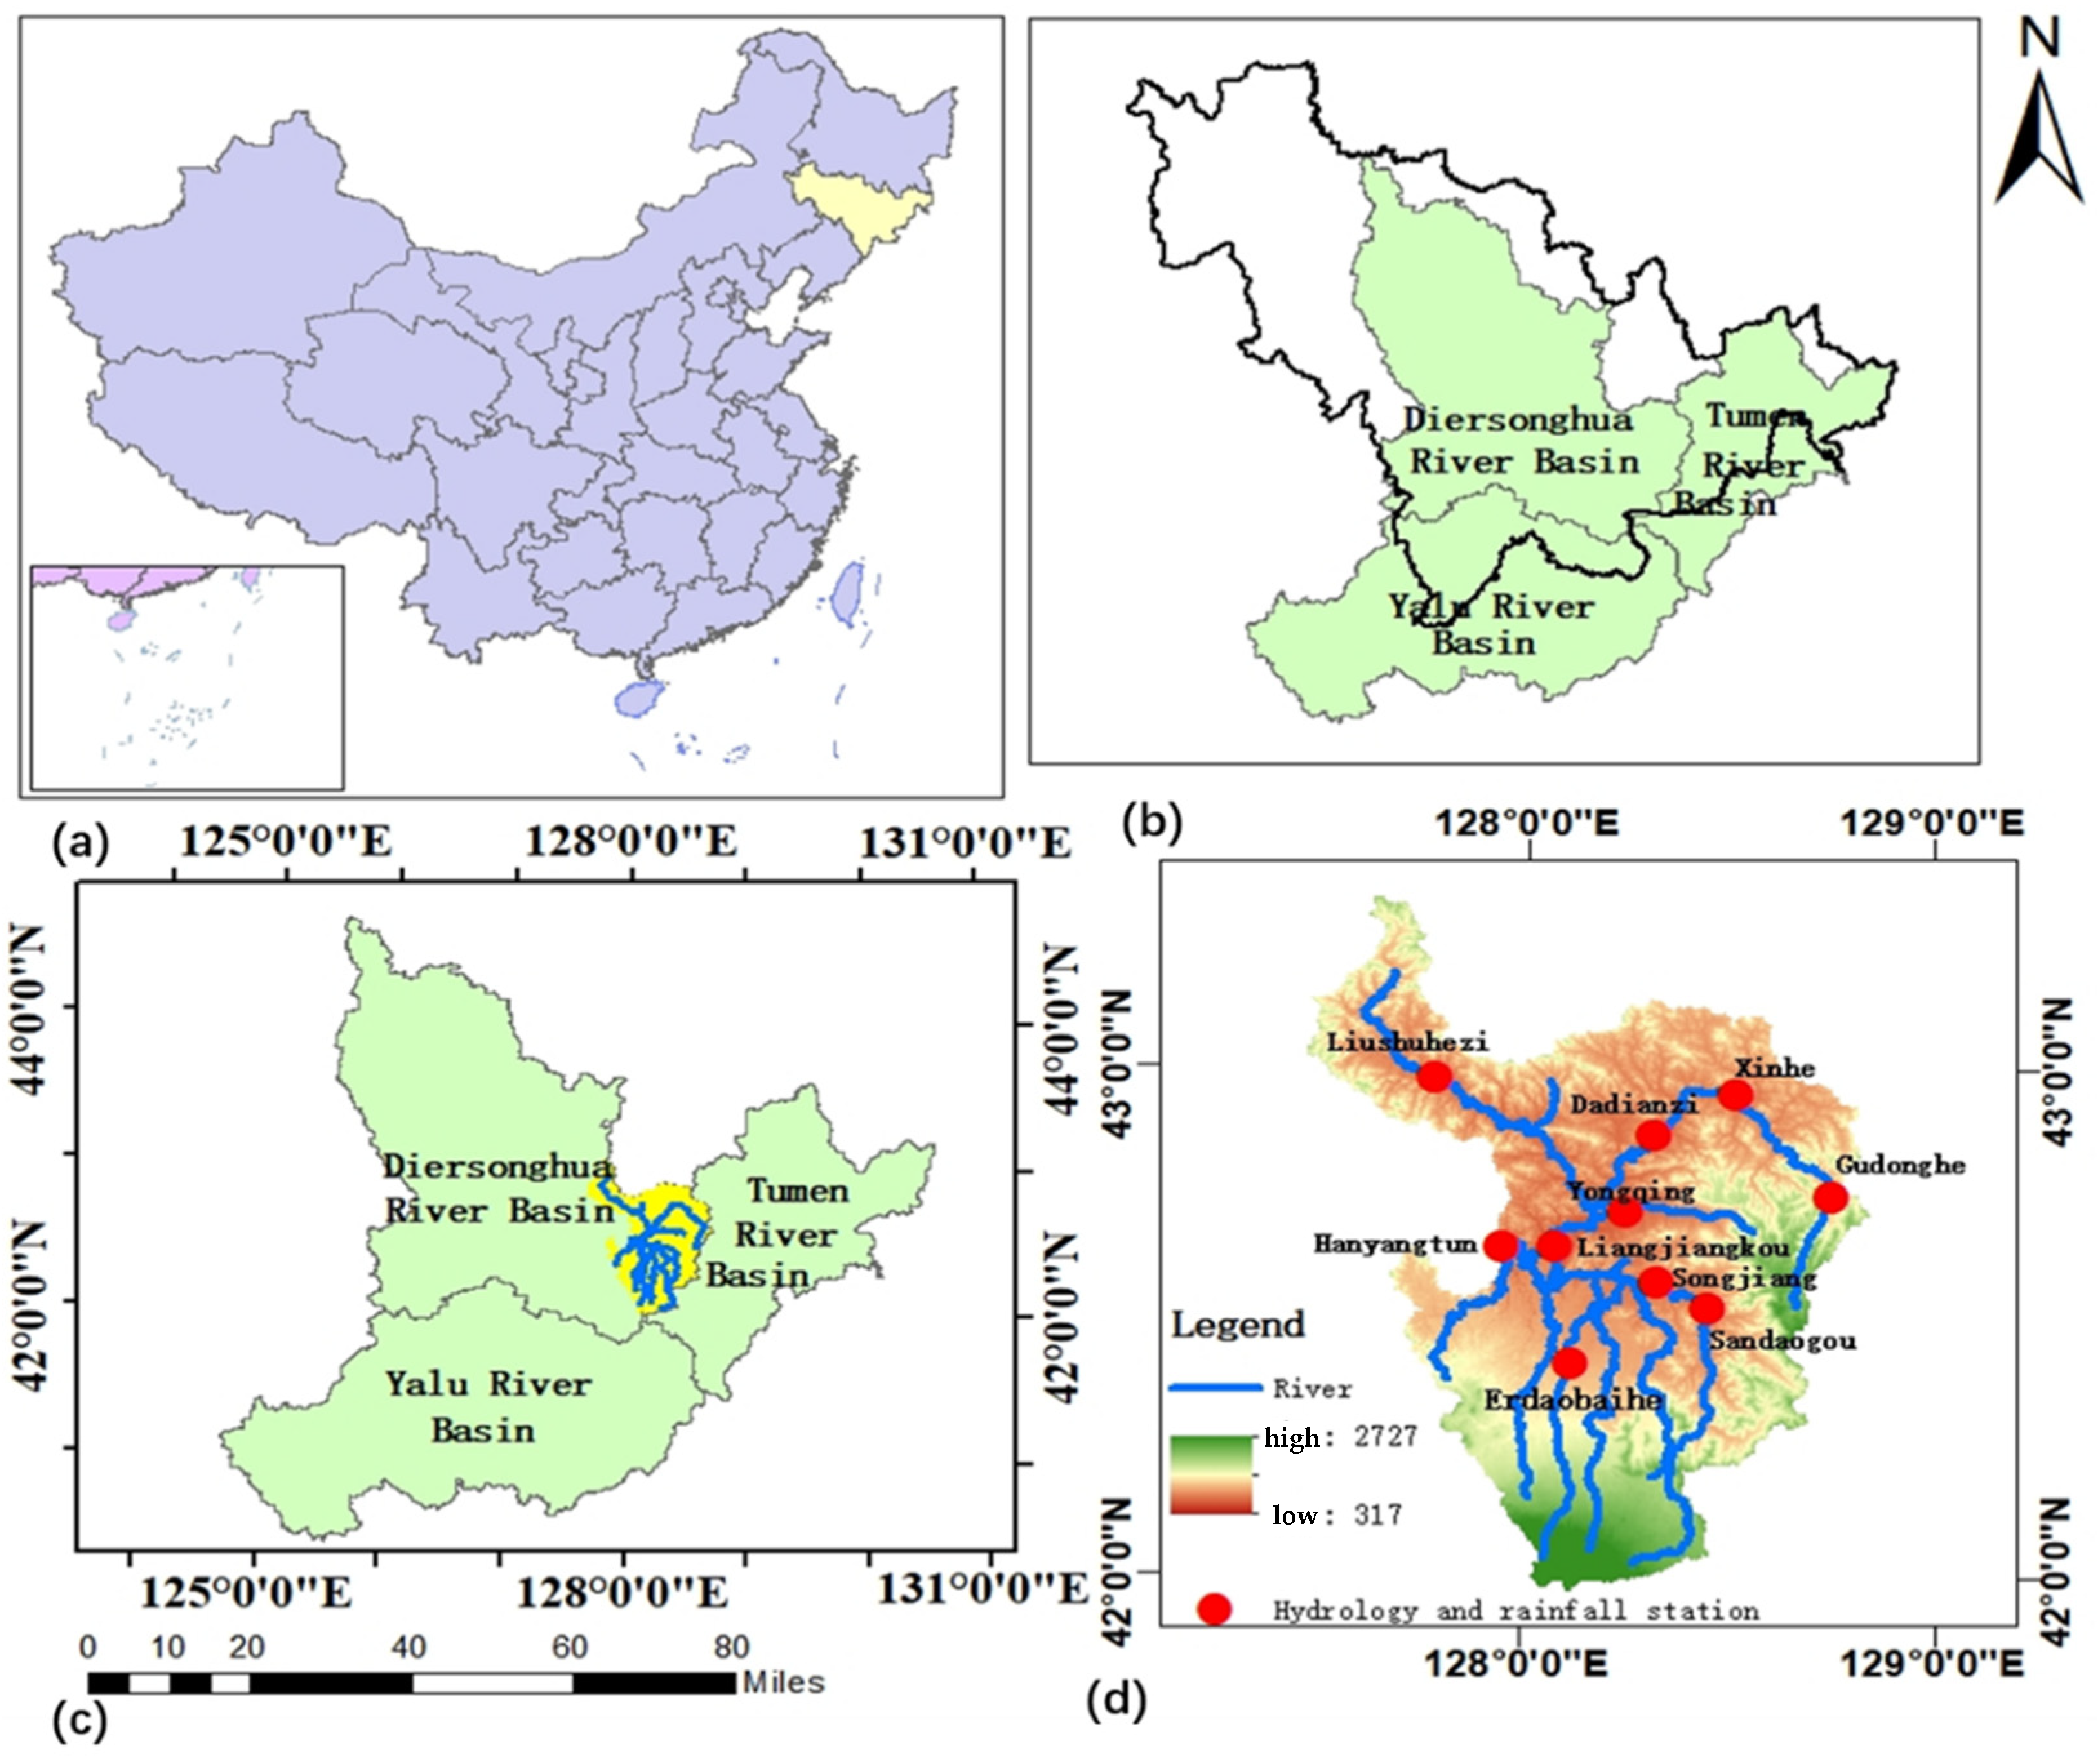
2.1. Study Area

Changbai Mountains is located in the southeast of Jilin Province, with geographic coordinates of 127°40′–128°16′ east longitude and 41°35′–42°25′ north latitude, with a total area of 196,400 hectares. The source area of the Three Rivers of Changbai Mountains can be divided into the following: Erdao Songhua River Basin, Toudao Songhua River Basin, etc. The Erdao Songhua River Basin is located at the north source of the Songhua River and northwest slope of Tianchi Lake in Changbai Mountain. The various tributaries, including Toudaobai River, Erdaobai River, Gudong River, Lushui River, etc., account for about 50% of the total area of the source area. In this study, Erdao Songhua River Basin was selected as the study area. The Erdao Songhua River has steep mountains along the two banks, and the terrain is relatively complex. The altitude ranges from about 300 to 2700 m. The terrain has a large amplitude. The river valleys are distributed radially, and flow velocity is turbulent. It has a mid-temperate continental monsoon climate, with a multiyear average temperature of 3.25 °C and a multiyear average rainfall of 655 mm. Rainfall is mainly concentrated in the wet season from June to September. In addition, river floods in the basin are mainly formed by heavy rains. Heavy rains and floods mostly occur from July to August and most often in August, accounting for more than 80% of the total. Figure 1 is an overview map of the basin.

2.2. Data Source and Processing

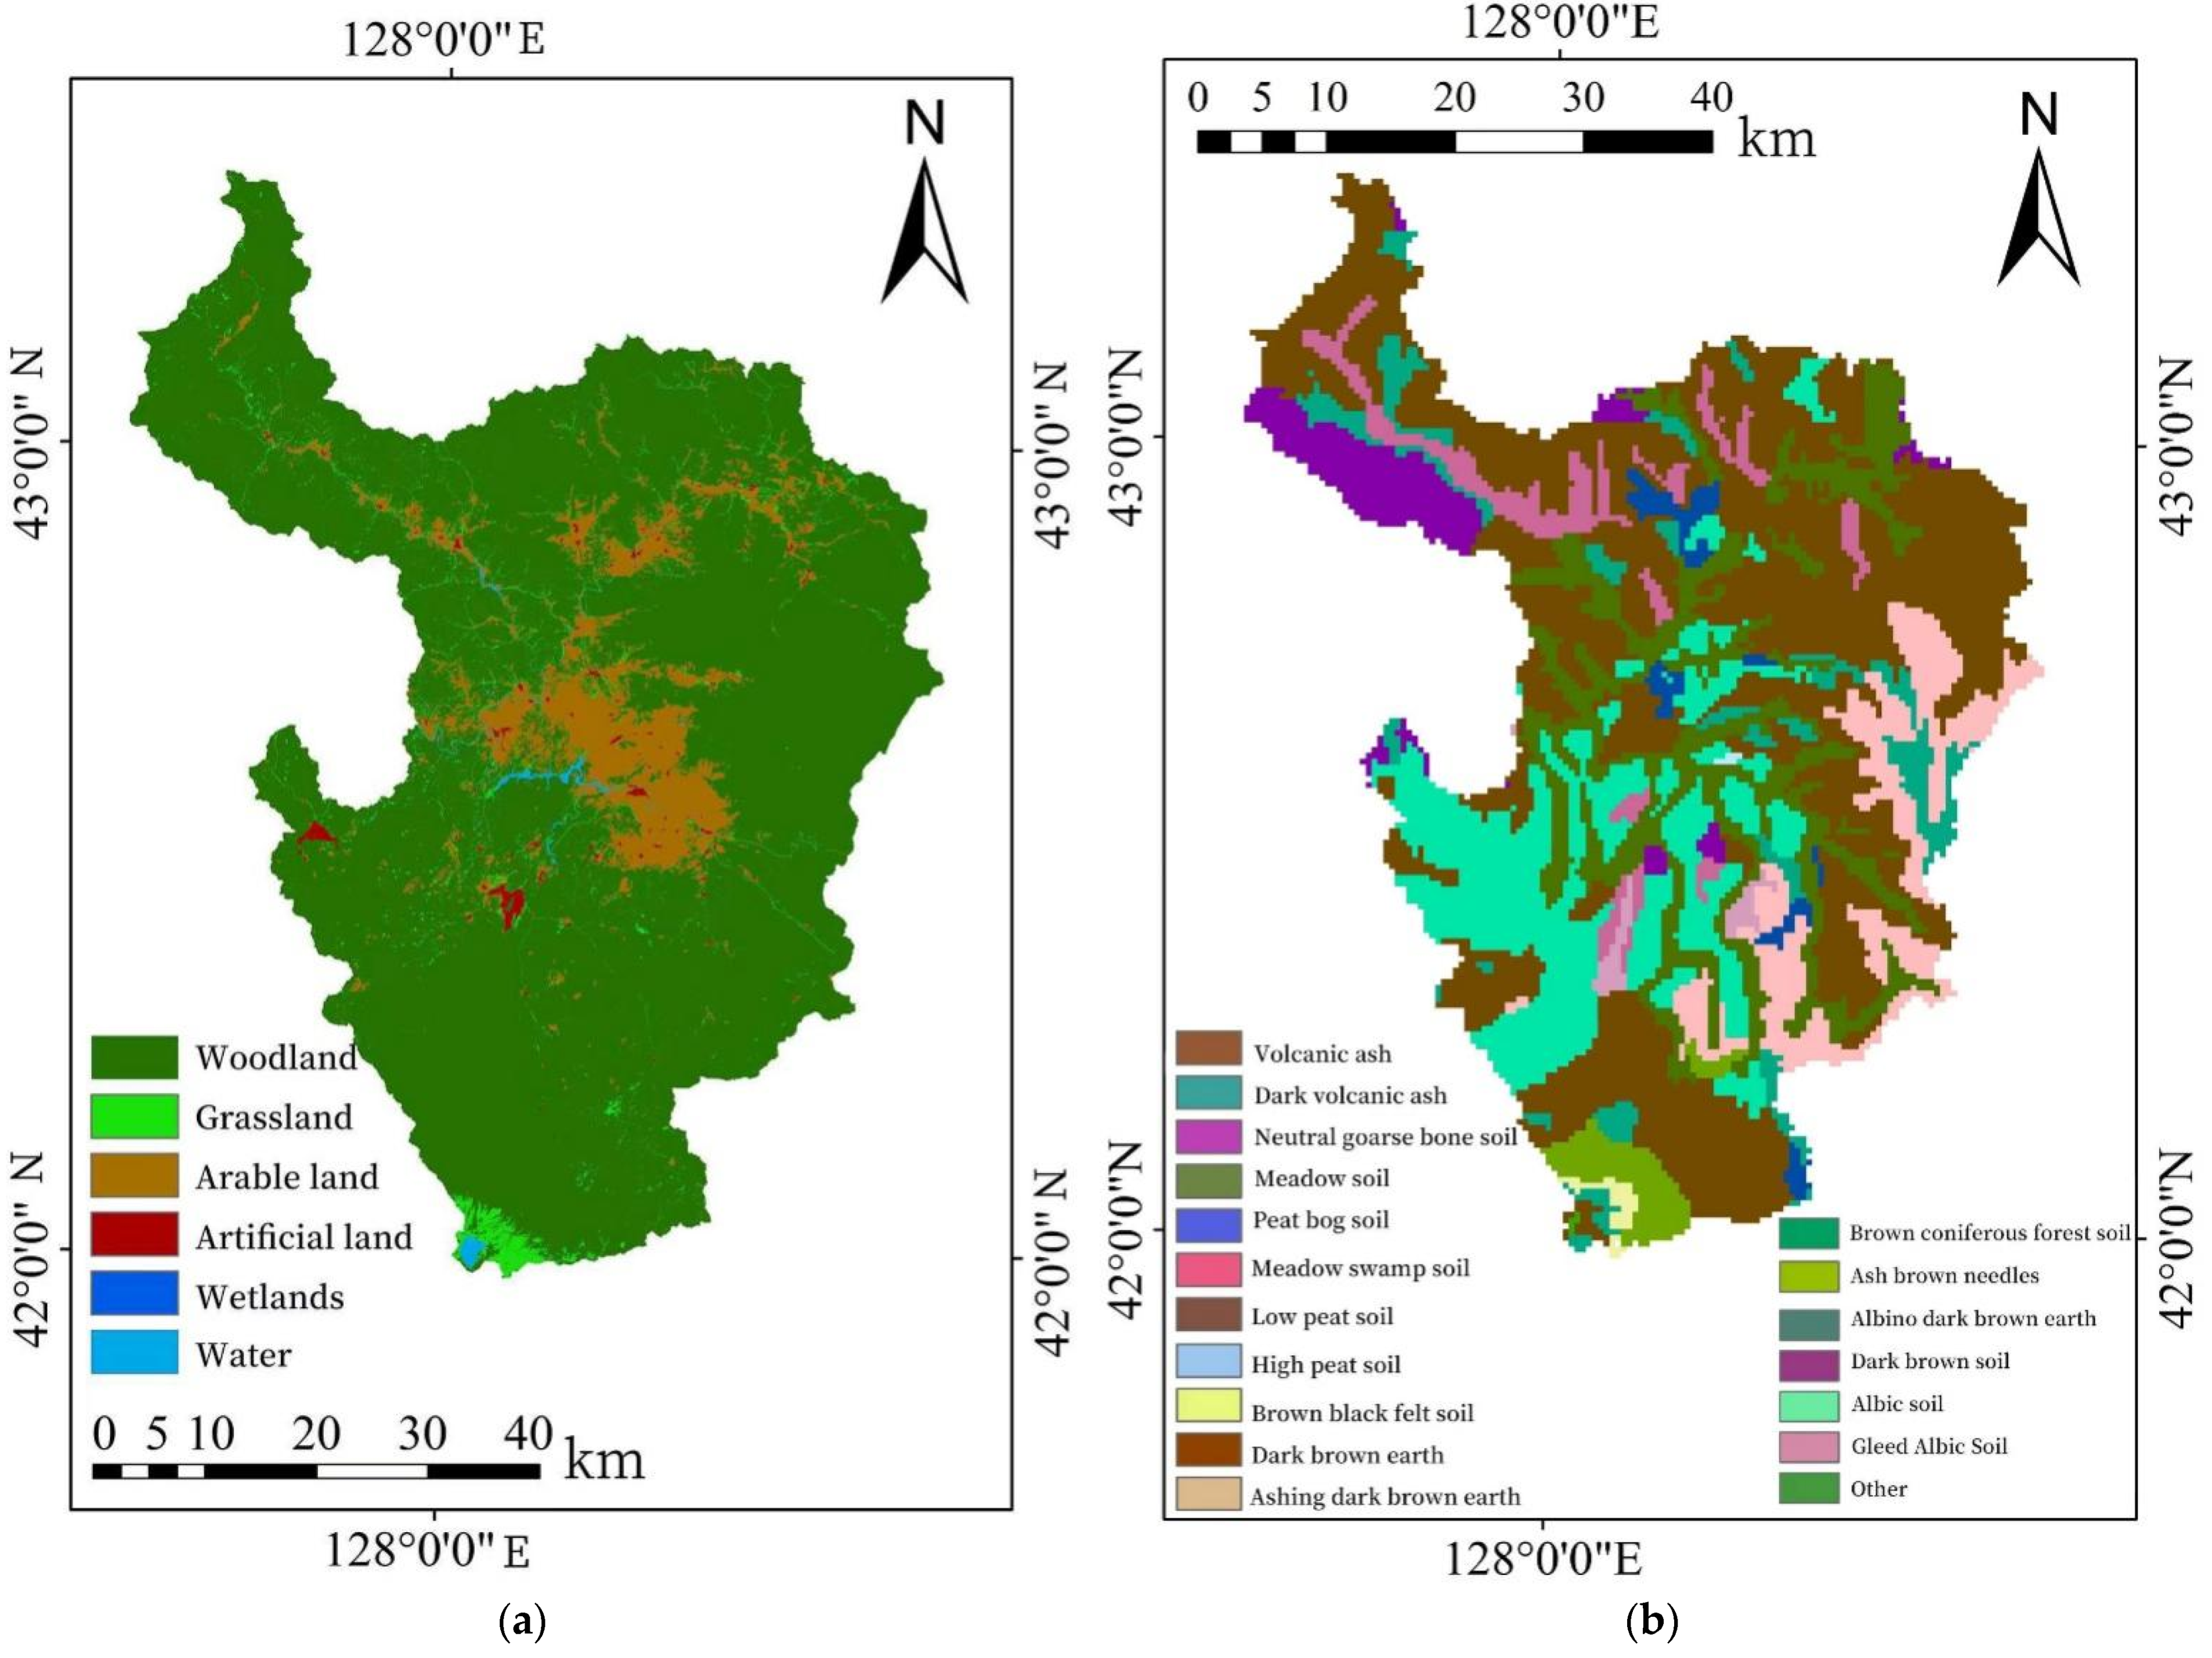
2.2.1. Geospatial Data

Geospatial data include watershed digital elevation, land use and soil distribution data. Digital elevation data comes from the 30-m resolution GDEMV230 M product data set of the geospatial data cloud platform (http://www.gscloud.cn accessed on 8 December 2021). The land use data are the global land use 10 m data set interpreted by Tsinghua University and extracted by the basin vector boundary, and soil distribution data comes from the HWSD data set of the World Soil Database, as shown in Figure 2.

2.2.2. Meteorological and Hydrological Data

The hydrometeorological data for constructing the HEC-HMS (The Hydrologic Engineering Center’s-Hydrologic Modeling System) model comes from the China Hydrological Yearbook over the years. Selected actual measurement daily rainfall data from June to September in wet season of 2006–2017 from 10 stations (Hanyangtun Station, Erdaobaihe Station, Dadianzi Station, Liangjiangkou Station, Liushuhezi Station, Yongqing Station, Gudonghe Station, Sandaogou Station, Xinhe Station and Songjiang Station) combined with the daily flow data of the Hanyangtun station of the basin’s outlet hydrological station during the wet season simulate rainfall and runoff during the 12-year wet season. In order to predict the future runoff trend in the study area, this paper selected CMIP6 experimental data, which are downloaded from https://pcmdi.llnl.gov/CMIP6/ (accessed on 8 December 2021).What the download obtains is the grid data, and we use the Make NetCDF Feature Layer tool in ArcGIS for downscaling. Then, the desired study area is cut out.
CMIP6 is being organized by the World Climate Research Project (WCRP). As one of the institutes participating in the CMIP6, the National Climate Center, China (Meteorological Administration), has three latest version of models to utilize in the project through model development in recent years. This article applied the middle-resolution climate system model, BCC-CSM2-MR, and the 2021–2050 daily rainfall sequence of two climate scenarios, SSP2-4.5 and SSP5-8.5, was selected. The SSP2-4.5 scenario represents a moderate level of greenhouse gas emissions that is compatible with social and economic development, with the goal of the effective radiative forcing value reaching 4.5 W/m2 by the end of the 21st century. SSP5-8.5 is the scenario with the highest greenhouse gas concentration, with monotonically increasing greenhouse gas emissions. The trend is to stabilize the effective radiative forcing value at 8.5 W/m2 by the end of the 21st century. The corresponding social background is a large population, high energy consumption in social development, lag in clean energy technology and lack of measures to deal with climate change. This scenario is less likely to occur.

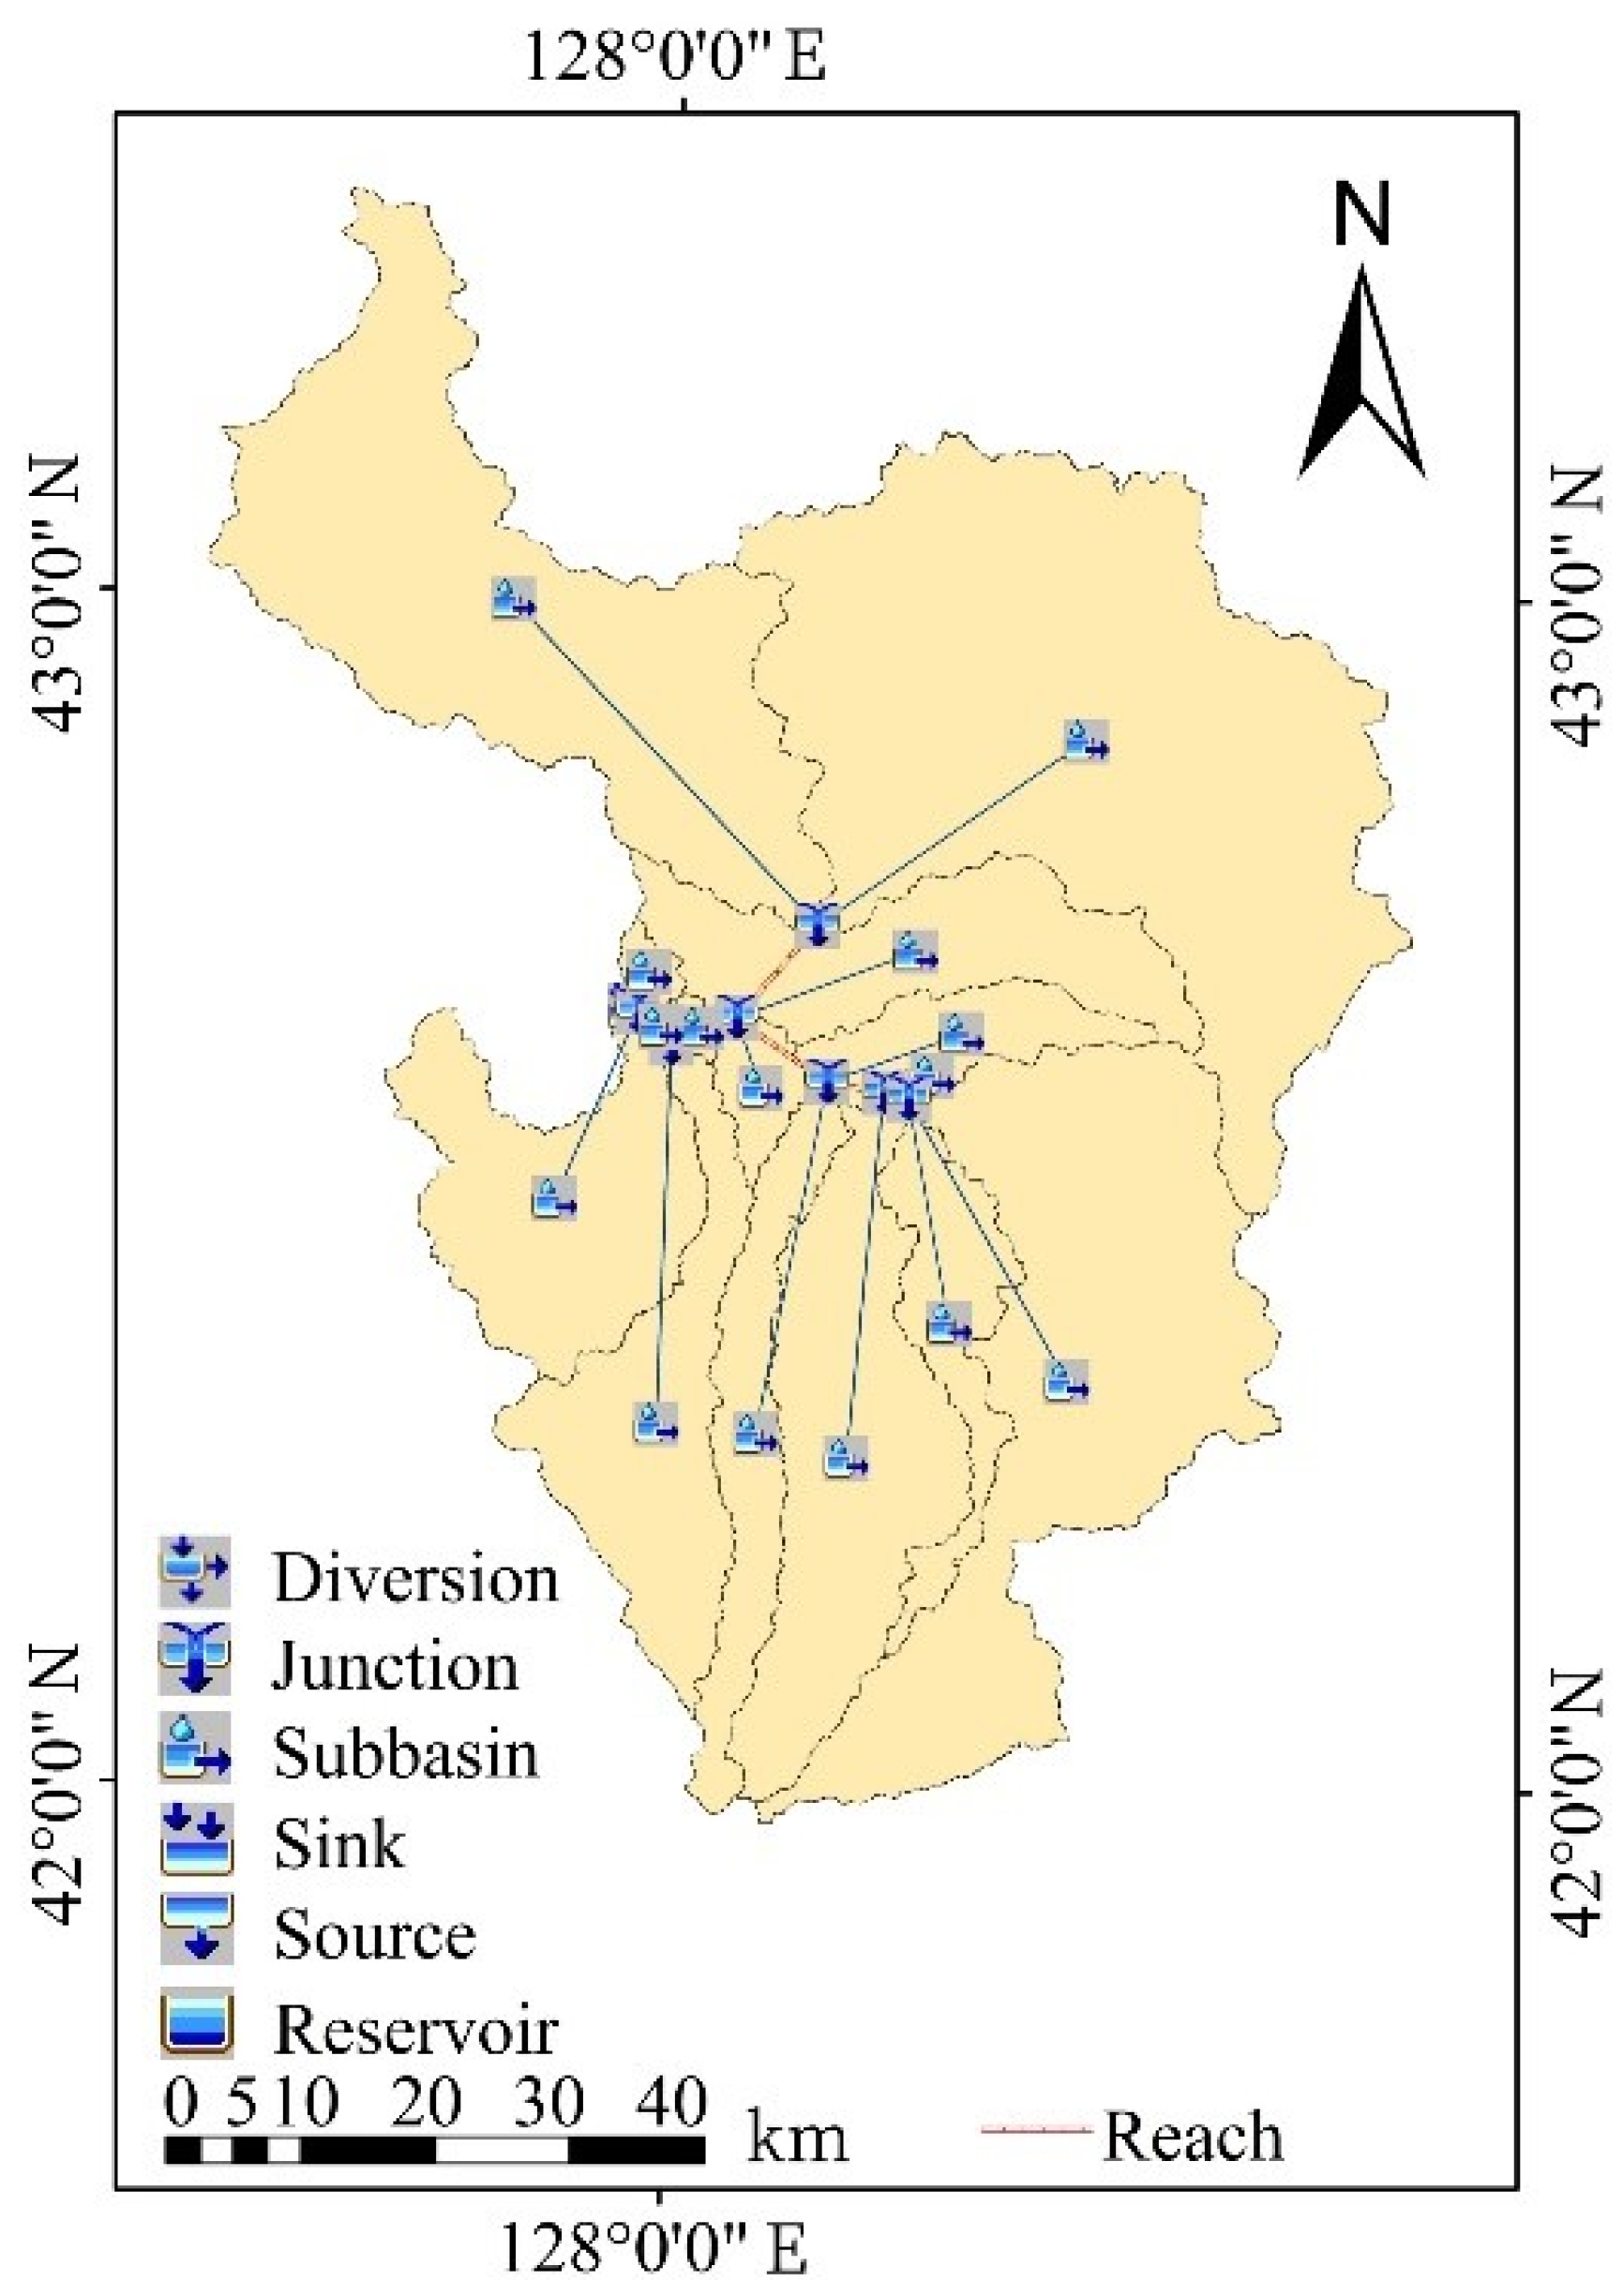
2.3. Research Methods

HEC-HMS is a distributed rainfall-runoff model with physical concepts. Most of the rainfall in the Changbai Mountains occurs from June to September, and extreme weather such as rainstorms and floods is prone to occur during this period. Thus, this model is suitable for use, and temperature changes have little effect. It includes four parts: a watershed module, a control module, a weather module and a time-series management module. The operation can use different calculation schemes to simulate hydrological processes of the basin.
In this study, DEM data of the study area were processed by HEC-Geo HMS, and water system characteristics and topographic parameters of the watershed are extracted; the watershed is divided into 15 sub-basins. The Thiessen polygon method is used to calculate the weight of the rainfall station in each sub-basin, and the HEC-HMS project file is generated on this basis. (Figure 3). The runoff generation module uses the SCS curve numerical method, the confluence module uses the SCS unit line method, the base flow module uses the exponential backwater method and the river confluence module uses the Muskingum method. The parameters include CN value, impervious and flow lag. Time (tlag), attenuation coefficient (RC), peak ratio (Ratio), storage constant (K) and flow specific gravity factor (X) are also considered. Considering that the simulation effect of the initial parameters value, input into the model is poor, and the manual trial and error method combined with the built-in peak-weighted root-mean-square objective function method of the model was used to determine the optimal parameters in the parameter calibration process. The verification model uses five indicators, namely, peak-to-current time difference (Δt), peak flow relative error (REp), total flow relative error (REv) and certainty coefficients DC and R2 to comprehensively evaluate simulation results. We formulate evaluation criteria according to the analysis results of rainfall and runoff forecasting in “Hydrological Information Forecasting Specifications” (GB/T 22482-2008). Among them, the predicted peak flow and the measured value change within 20% are qualified; the predicted peak occurrence time and the measured peak occurrence time interval are within 30%; the predicted total flow and the measured flow value error are within 10%. The assessment of the certainty coefficient DC as DC ≥ 0.70 can be used to issue a formal hydrological forecast; that is, forecast is relatively accurate.
According to the above method, the HEC-HMS model of the typical watershed in Changbai Mountains was constructed. Daily runoff data from 2006 to 2011 were selected to calibrate the model parameters, and daily runoff data from 2012 to 2017 verified the simulation effect of the model.

3. Results and Discussion

3.1. HEC-HMS Hydrological Modeling

The following parameters were determined: CN value, impervious rate (impervious), flow lag (tlag), attenuation coefficient (RC), peak ratio (Ratio), storage constant (K) and flow specific gravity factor (X). The results are shown in Table 1 and Table 2.
Table 3 shows the application of the HEC-HMS model in the evaluation of the daily runoff simulation results of the basin during the wet season. The rate regular qualifying year DC averaged to 0.704, and the average DC of the qualified years of the verification period is 0.71; the simulation effect of peak present time and peak flow is the best. Qualification rate reached 91.7%. In terms of comprehensive evaluation indicators, the total qualification rate was 75%, and the DC average of the qualified year reached 0.705.
From the comparison between simulated and measured flow results (Figure 4), it can be observed that the model simulated rainfall-runoff process in the wet season is basically consistent with the measured process trend. The model simulates extreme runoff simulation values well. There is a large deviation in the peak time in 2011 in the rate period, and all other years are within the allowable error range. The simulated peak present time in 2008 is one day after the actual measured peak present time. The rest of the years are consistent with the actual measured value, which is the regular rate in all years. The absolute value of the relative error of the peak flow rate is within 20% of the allowable error, and the average relative error is 8.2%; the relative error of the total flow at the outlet of the basin during the wet season in 2009 and 2011 is −19.9% and −17.9%, respectively. The absolute value is greater than the allowable error by 10%. During the verification period, the peak times of 2014, 2016 and 2017 are on the same day as the actual situation. The simulated peak times of 2012, 2013 and 2015 are only one day away from actual peak times, and the pass rate is 100%. Except for the relative error of the peak flow rate in 2014, which is 20.2%, the other verification years are all within the allowable error of 20%, and the pass rate is 83.3%; the absolute value of the relative error of the total export flow in 2013 and 2014 exceeds 10% of the flow forecast. In the allowable error range, the pass rate is 66.7%.

3.2. Future Runoff Simulation

The downloaded CMIP6 future climate scenario data are spatially interpolated to a resolution of 0.25° × 0.25°, and grid point data in the basin are extracted to obtain the rainfall simulation value in the historical period from 1957 to 2014 in the basin, as well as the future under the two climate scenarios. The predicted value of rainfall is taken from 2021 to 2050. As there will be a certain deviations between climate model forecast data and actual weather station data, this paper compares the data of the two historical periods from 1957 to 2014 for verification (since CMIP6 plans to simulate numerical differentiation scenarios from 2015, the simulation values before 2014 are selected for comparison and verification), and the average error is only 7%, which proves that the simulated value can be directly used to predict future rainfall.
The rainfall under the two future climate scenarios is brought into each rainfall station in the basin through spatial interpolation and input into the previously built HEC-HMS model, and the calibrated parameters are used to simulate and predict future SSP2-4.5 and SSP5-8.5. The flow conditions are at the outlet of the Erdao Songhua River basin during the wet season (June–September) under the two climate scenarios from 2021 to 2050. It is possible to predict changes in the flow during the wet season in the next 30 years in order to effectively prevent flood disasters and fully understand the future runoff of the basin. The change trend and rational management of water resources provide a scientific basis.
Figure 5 shows the change trend of average runoff during the drainage period (June–September) at the outlet of the basin from 2021 to 2050 under SSP2-4.5 climate scenarios and SSP5-8.5 climate scenarios. The runoff presents an insignificant upward trend. Under the SSP2-4.5 climate scenario, it rises at a rate of 1.77 m3/s per year, and under the SSP5-8.5 climate scenario, it rises at a rate of 1.51 m3/s per year. The SSP2-4.5 climate scenario is higher than the SSP5-8.5 climate scenario. The scenario rises slightly faster. By calculating the average flow during the wet season from 2021 to 2050, it shows that it is 101.7 m3/s under the SSP2-4.5 climate scenario and 100.3 m3/s under the SSP5-8.5 climate scenario, which is the same as the measured average flow during the wet season from 2006 to 2017 during the simulation period of the model to 152.6 m3/s. Compared with the flow, it has decreased, which is directly related to a decrease in rainfall from June to September in the next 30 years during the wet season compared to the historical period.
Figure 6 shows the changes in daily average flow during the wet season from 2021 to 2050 under the two scenarios. It can be observed from the graph that the flow from June to August gradually increased, the largest average flow was concentrated in August and gradually decreased in September. The maximum daily average flow under the SSP2-4.5 climate scenario is 7.2% higher than that under the SSP5-8.5 climate scenario, and the maximum overall flow occurs in August.
From the evaluation and analysis of the model simulation results, it can be observed that the model has a good simulation effect on the peak flow rate and the peak present time. Therefore, the two characteristic values of the next 30 years are output. The analysis found that the future peak flow will occur the most in August, accounting for 40% and 46.7% of the two scenarios, followed by September. Compared with the peak time of the historical period, most of them appeared in July and August, both accounting for 33.3%. It was found that the peak time of the next 30 years will be delayed to a certain extent. In the next 30 years, the maximum flow rate under the SSP2-4.5 scenario will be 2130.6 m3/s in 2050, and the maximum flow rate under the SSP5-8.5 scenario will be 2340.7 m3/s in 2047.

3.3. Discussion

The Changbai Mountains are affected by the climate of the alpine Mountainsous area. There are about 5 months of the year in the icy period, the temperature is below zero and rainfall is mainly concentrated in the wet season from June to September. The rainfall lasts for a short period of time, intensity is high and rainfall is concentrated; there are many hills and mountains in the basin, the upstream slope of the river is steep, confluence speed is fast and propagation time is short; thus, it is easy to form a flood process of steep ups and downs. Therefore, studying the runoff process in the Changbai Mountains during the wet season, analyzing the historical-future change trend of runoff, establishing a corresponding hydrological model for runoff simulation and improving the accuracy of runoff prediction and the foreseeable period can provide effective theoretical support for the formulation of water resources allocation plans in the basin. In order to improve the water conservation capacity of the regional ecosystem, it is possible to strengthen the temporal regulation of the uneven distribution of water resources of surface runoff during flood and dry periods and spatially regulate the distribution and circulation of surface runoff, soil runoff and underground runoff, etc. At the same time, it is also possible to estimate the situation in response to the synchronization of droughts and floods and other water conditions in the Changbai Mountains Basin or to make an early response to the situation.
On a regional scale, Changbai Mountains constitute a stable snow-covered area in China. Seasonal snow cover can last up to half a year. Therefore, it will be an important source of water supply for river runoff and groundwater during the snowmelt period. The reduction in runoff has suppressed extreme flooding. The occurrence of the incident also reduced the overall water capacity. Therefore, we should pay attention to issues such as global warming. From the perspective of hydrogeological conditions, the lava platform in the Sandaobai River and Songjiang River in the basin contains basalt holes with abundant water. Fissure water provides abundant storage space and good migration channels for groundwater, and it gushes out of the ground in the form of springs where geological faults are exposed. With abundant spring water resources, such as nipple springs, Changbai Mountains springs are the main sources of runoff replenishment. In less rainfall or dry seasons, the replenishment of groundwater and spring water makes a greater contribution to runoff. Therefore, relevant managers should formulate reasonable mineral water mining indicators in this area. Moreover, the relevant thresholds are reasonably calculated to ensure the efficient use of water resources.
In this study, the change trend of runoff in the typical watershed of Changbai Mountains was studied by analyzing future precipitation changes and combined with hydrological models. However, it is difficult to explain that the overall runoff changes in the watershed have been accurately restored by calibrating and verifying the model only through the single-outlet observation flow rate. With further analysis, the evolution trend of runoff in different regions will be the focus of future research. At the same time, changes in land use types will have a significant impact on runoff in the watershed. Full consideration of the impact of future land use, soil distribution and human activities in the watershed on runoff is a scientific issue worthy of further study.

4. Conclusions

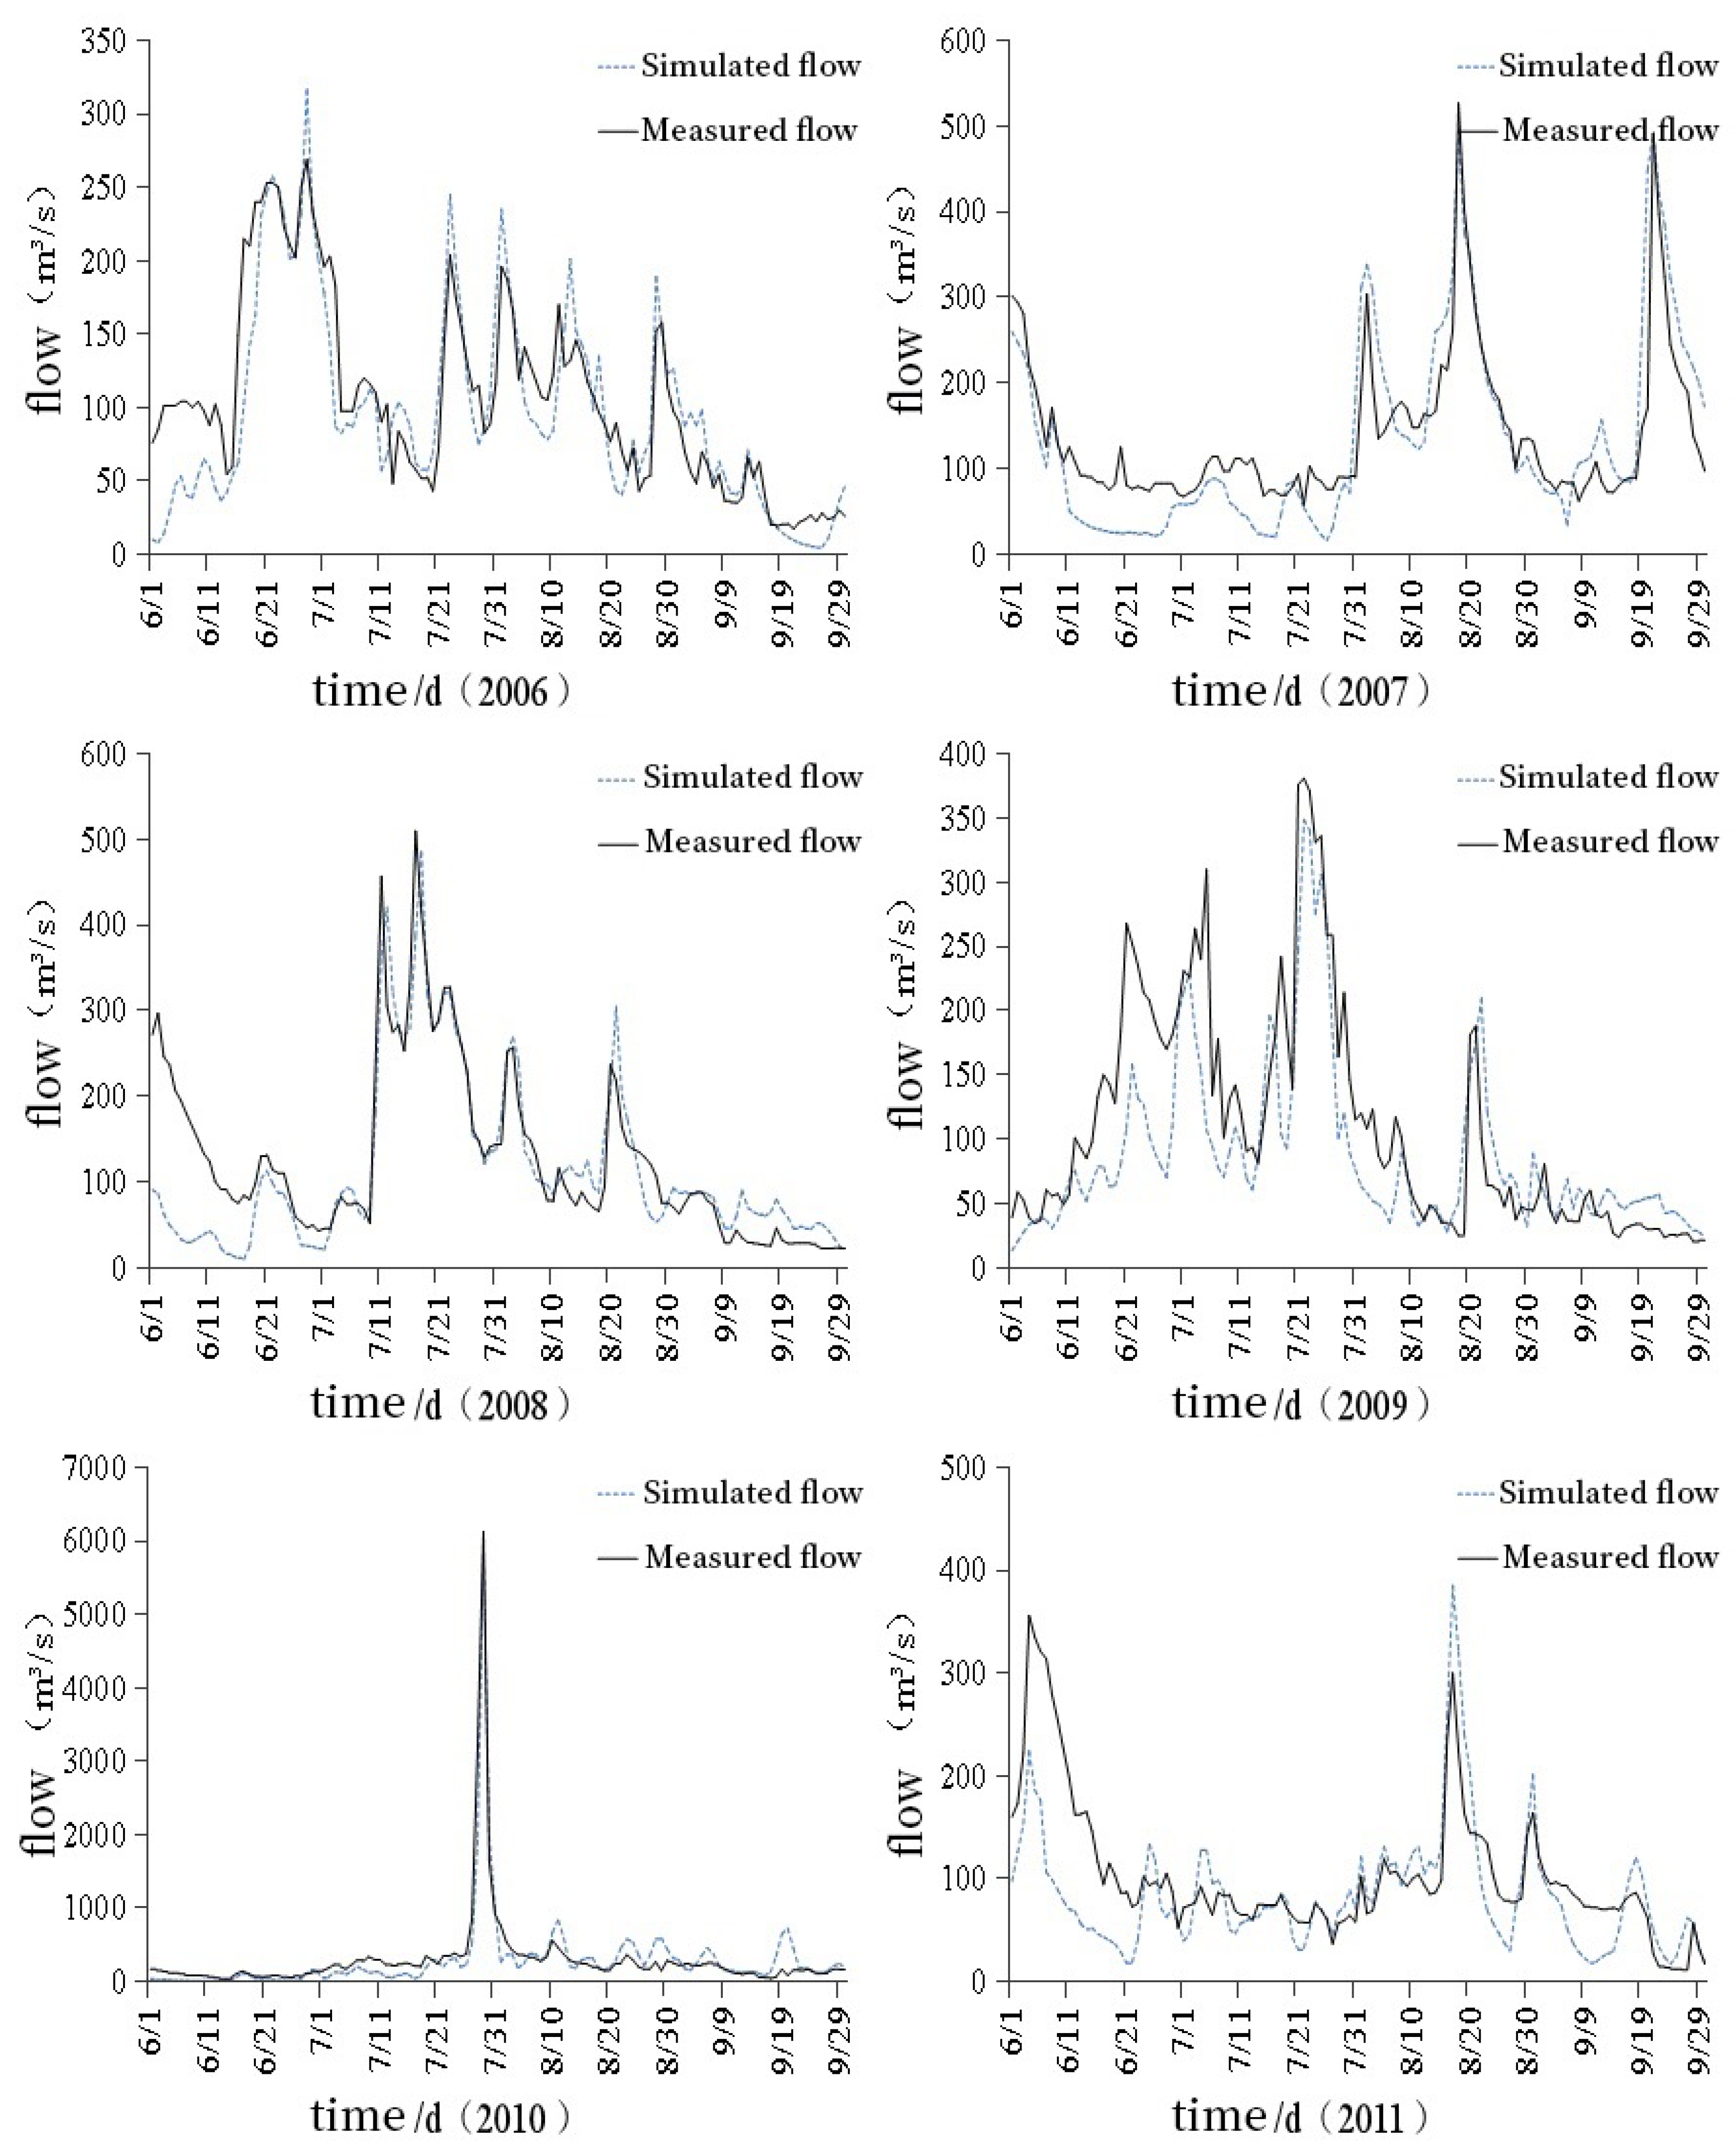
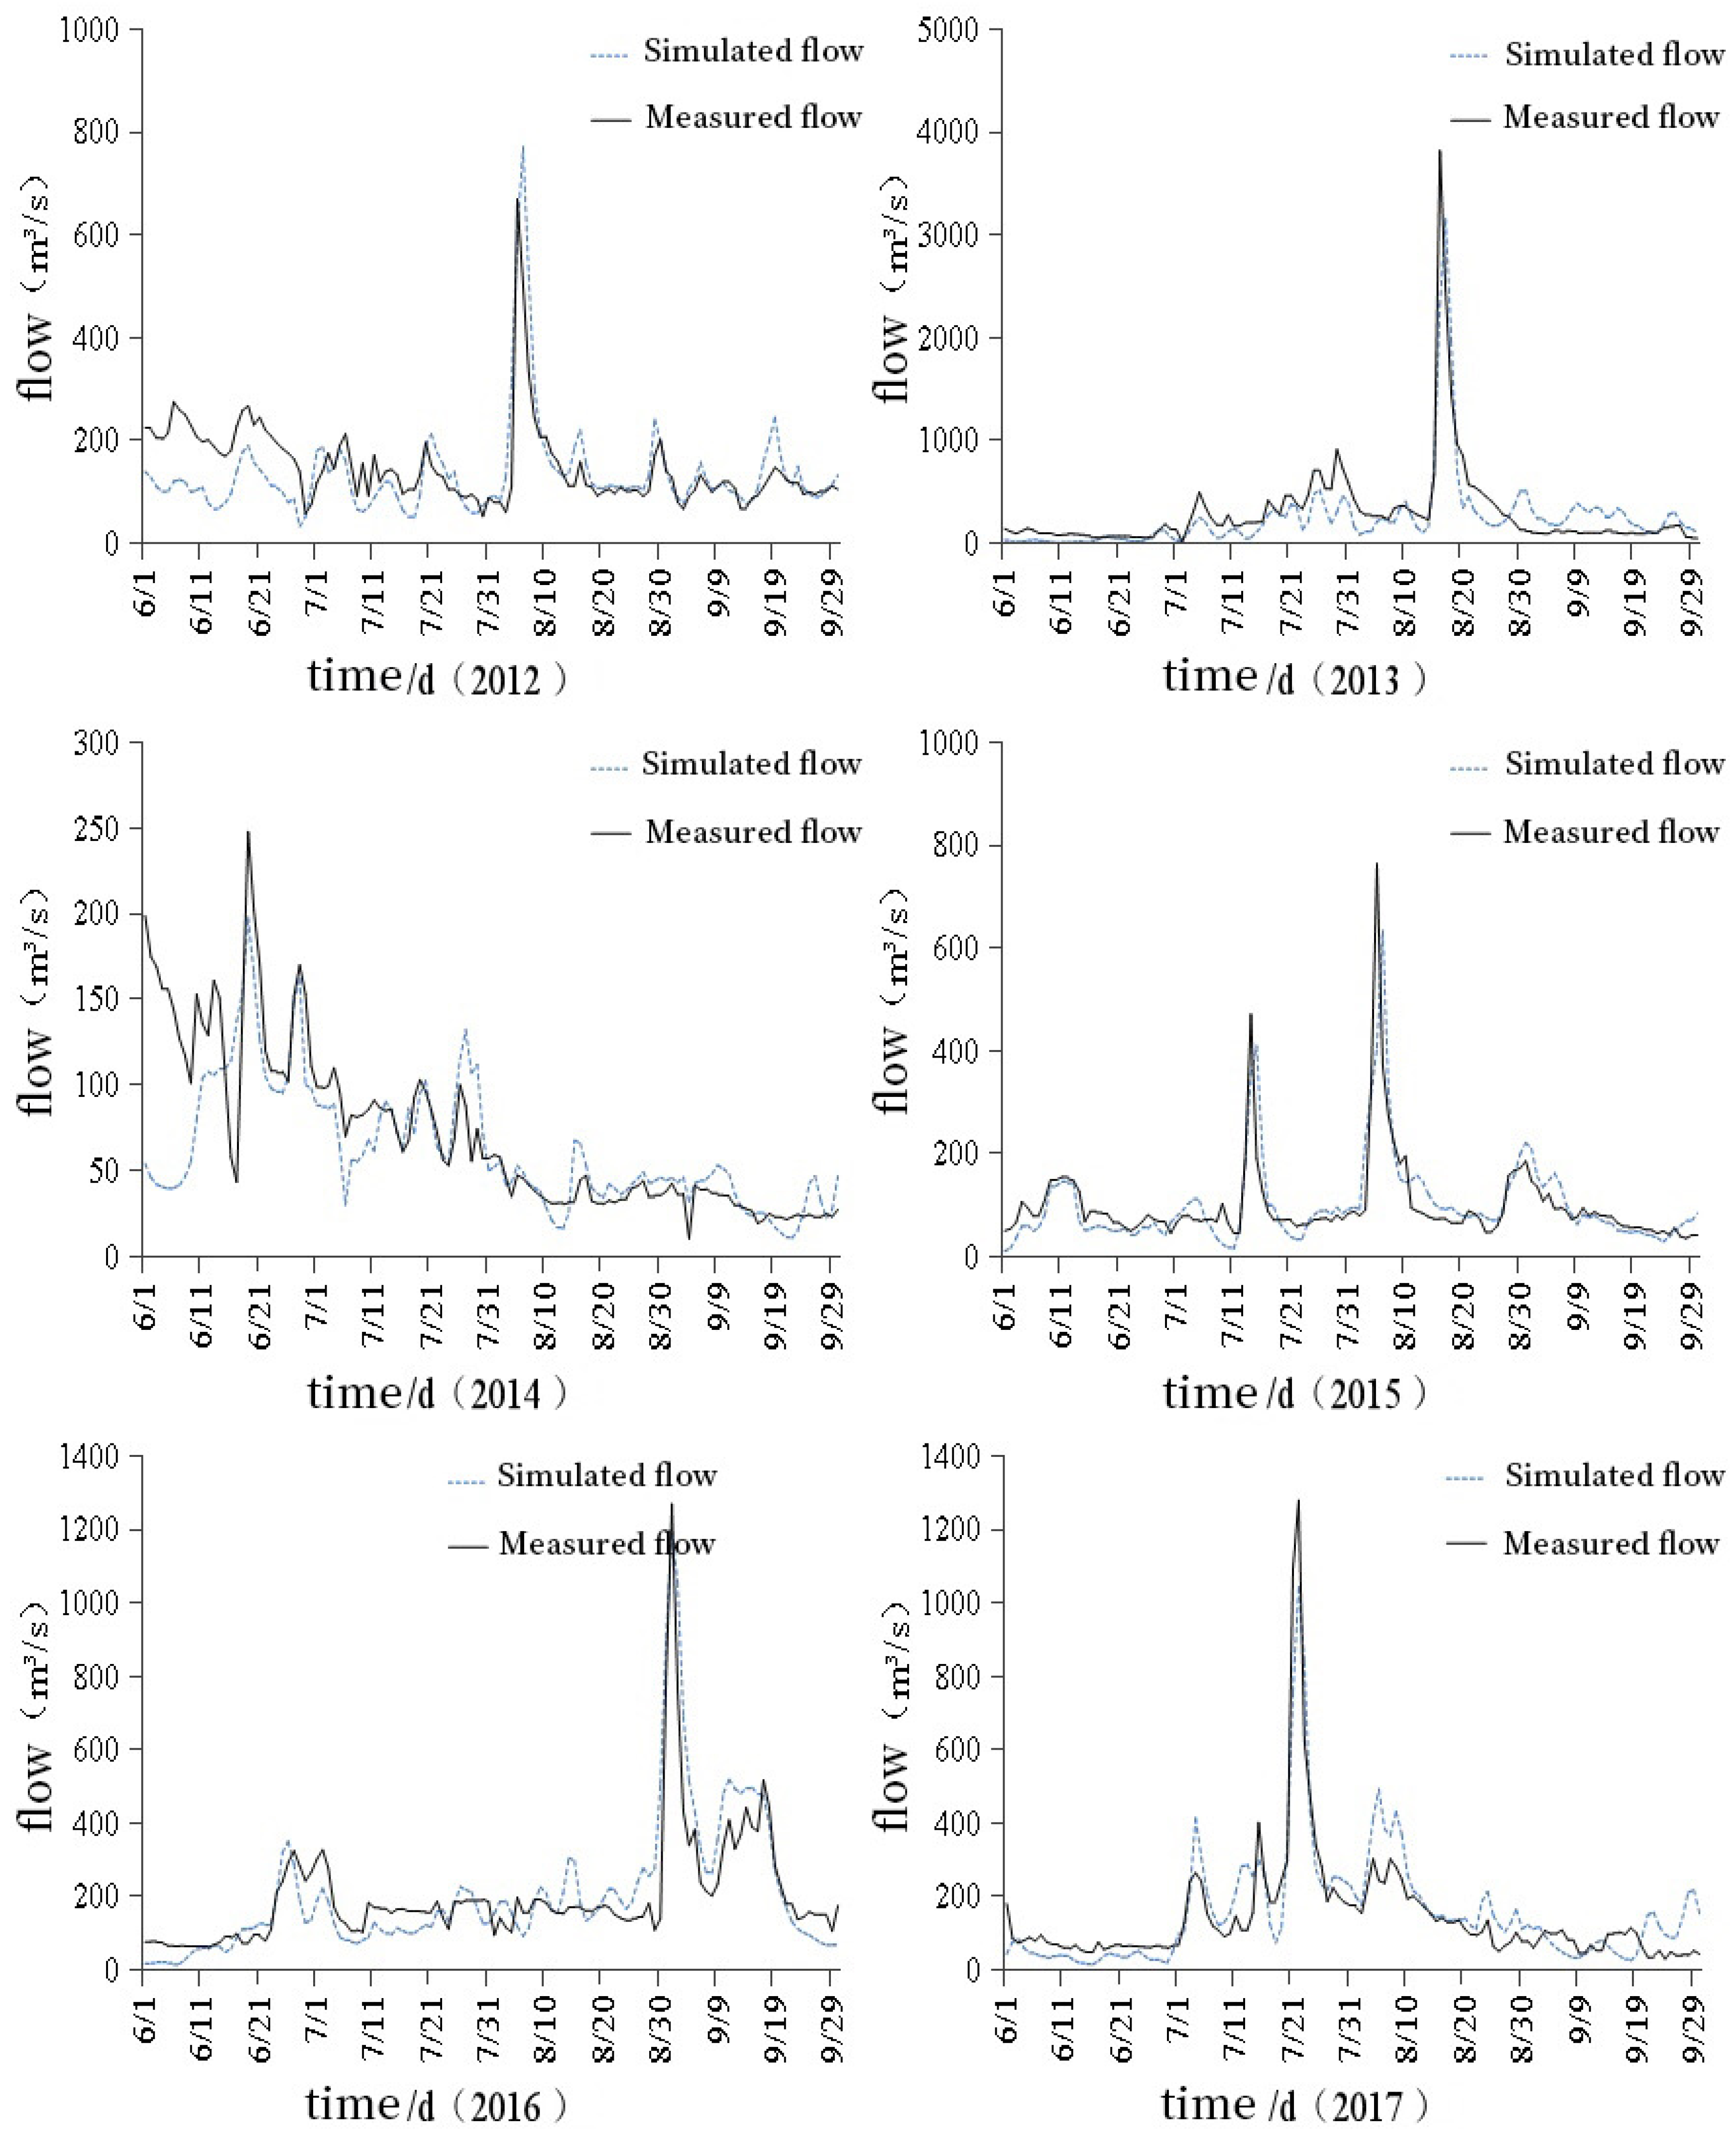
  • The HEC-HMS model has good applicability in the Erdao Songhua River Basin of Changbai Mountains. By constructing the HEC-HMS model suitable for the watershed and calibrating the model, the total qualified rate of the daily rainfall runoff simulation in the watershed during the wet season is 75%, and the DC average of the qualified year reaches 0.705. The model can accurately restore hydrological processes in the study area.
  • By conducting the analysis of the comparison chart between the simulation and the actual measurement, it can be observed that in the years with better simulation results, such as 2010, 2013 and 2017, the DC value in these years all reached above 0.7, and in 2010, it reached 0.9. The flow changes in these years were relatively gentle, but the peaks were obvious. Statistics on rainfall data found that rainfall in these years was large; it was 688.9 mm in 2010, 652.5 mm in 2013 and 542.3 mm in 2017. During the abundant rainfall period, the river runoff is obviously controlled by the rainfall process. The HEC-HMS hydrological model is mainly driven by precipitation. Thus, the greater the precipitation, the greater the contribution of the surface runoff process to the entire water cycle, and the model’s interpretation of runoff flow is more accurate. For the years 2011, 2012 and 2014 with poor simulation results, the simulated value in June was much smaller than the actual flow value, and runoff fluctuated greatly, resulting in inaccurate overall simulation results for that year. Further analysis of the reasons may be related to the geographical location and topographical conditions of the study area. There are many production processes and forms of surface runoff in this area, including melting of ice and snow, and groundwater discharges to river valley runoff in the form of springs. Therefore, when discussing the water cycle process in this region, especially in dry years and dry seasons, various recharge sources such as precipitation, surface water, groundwater and springs should be comprehensively considered.
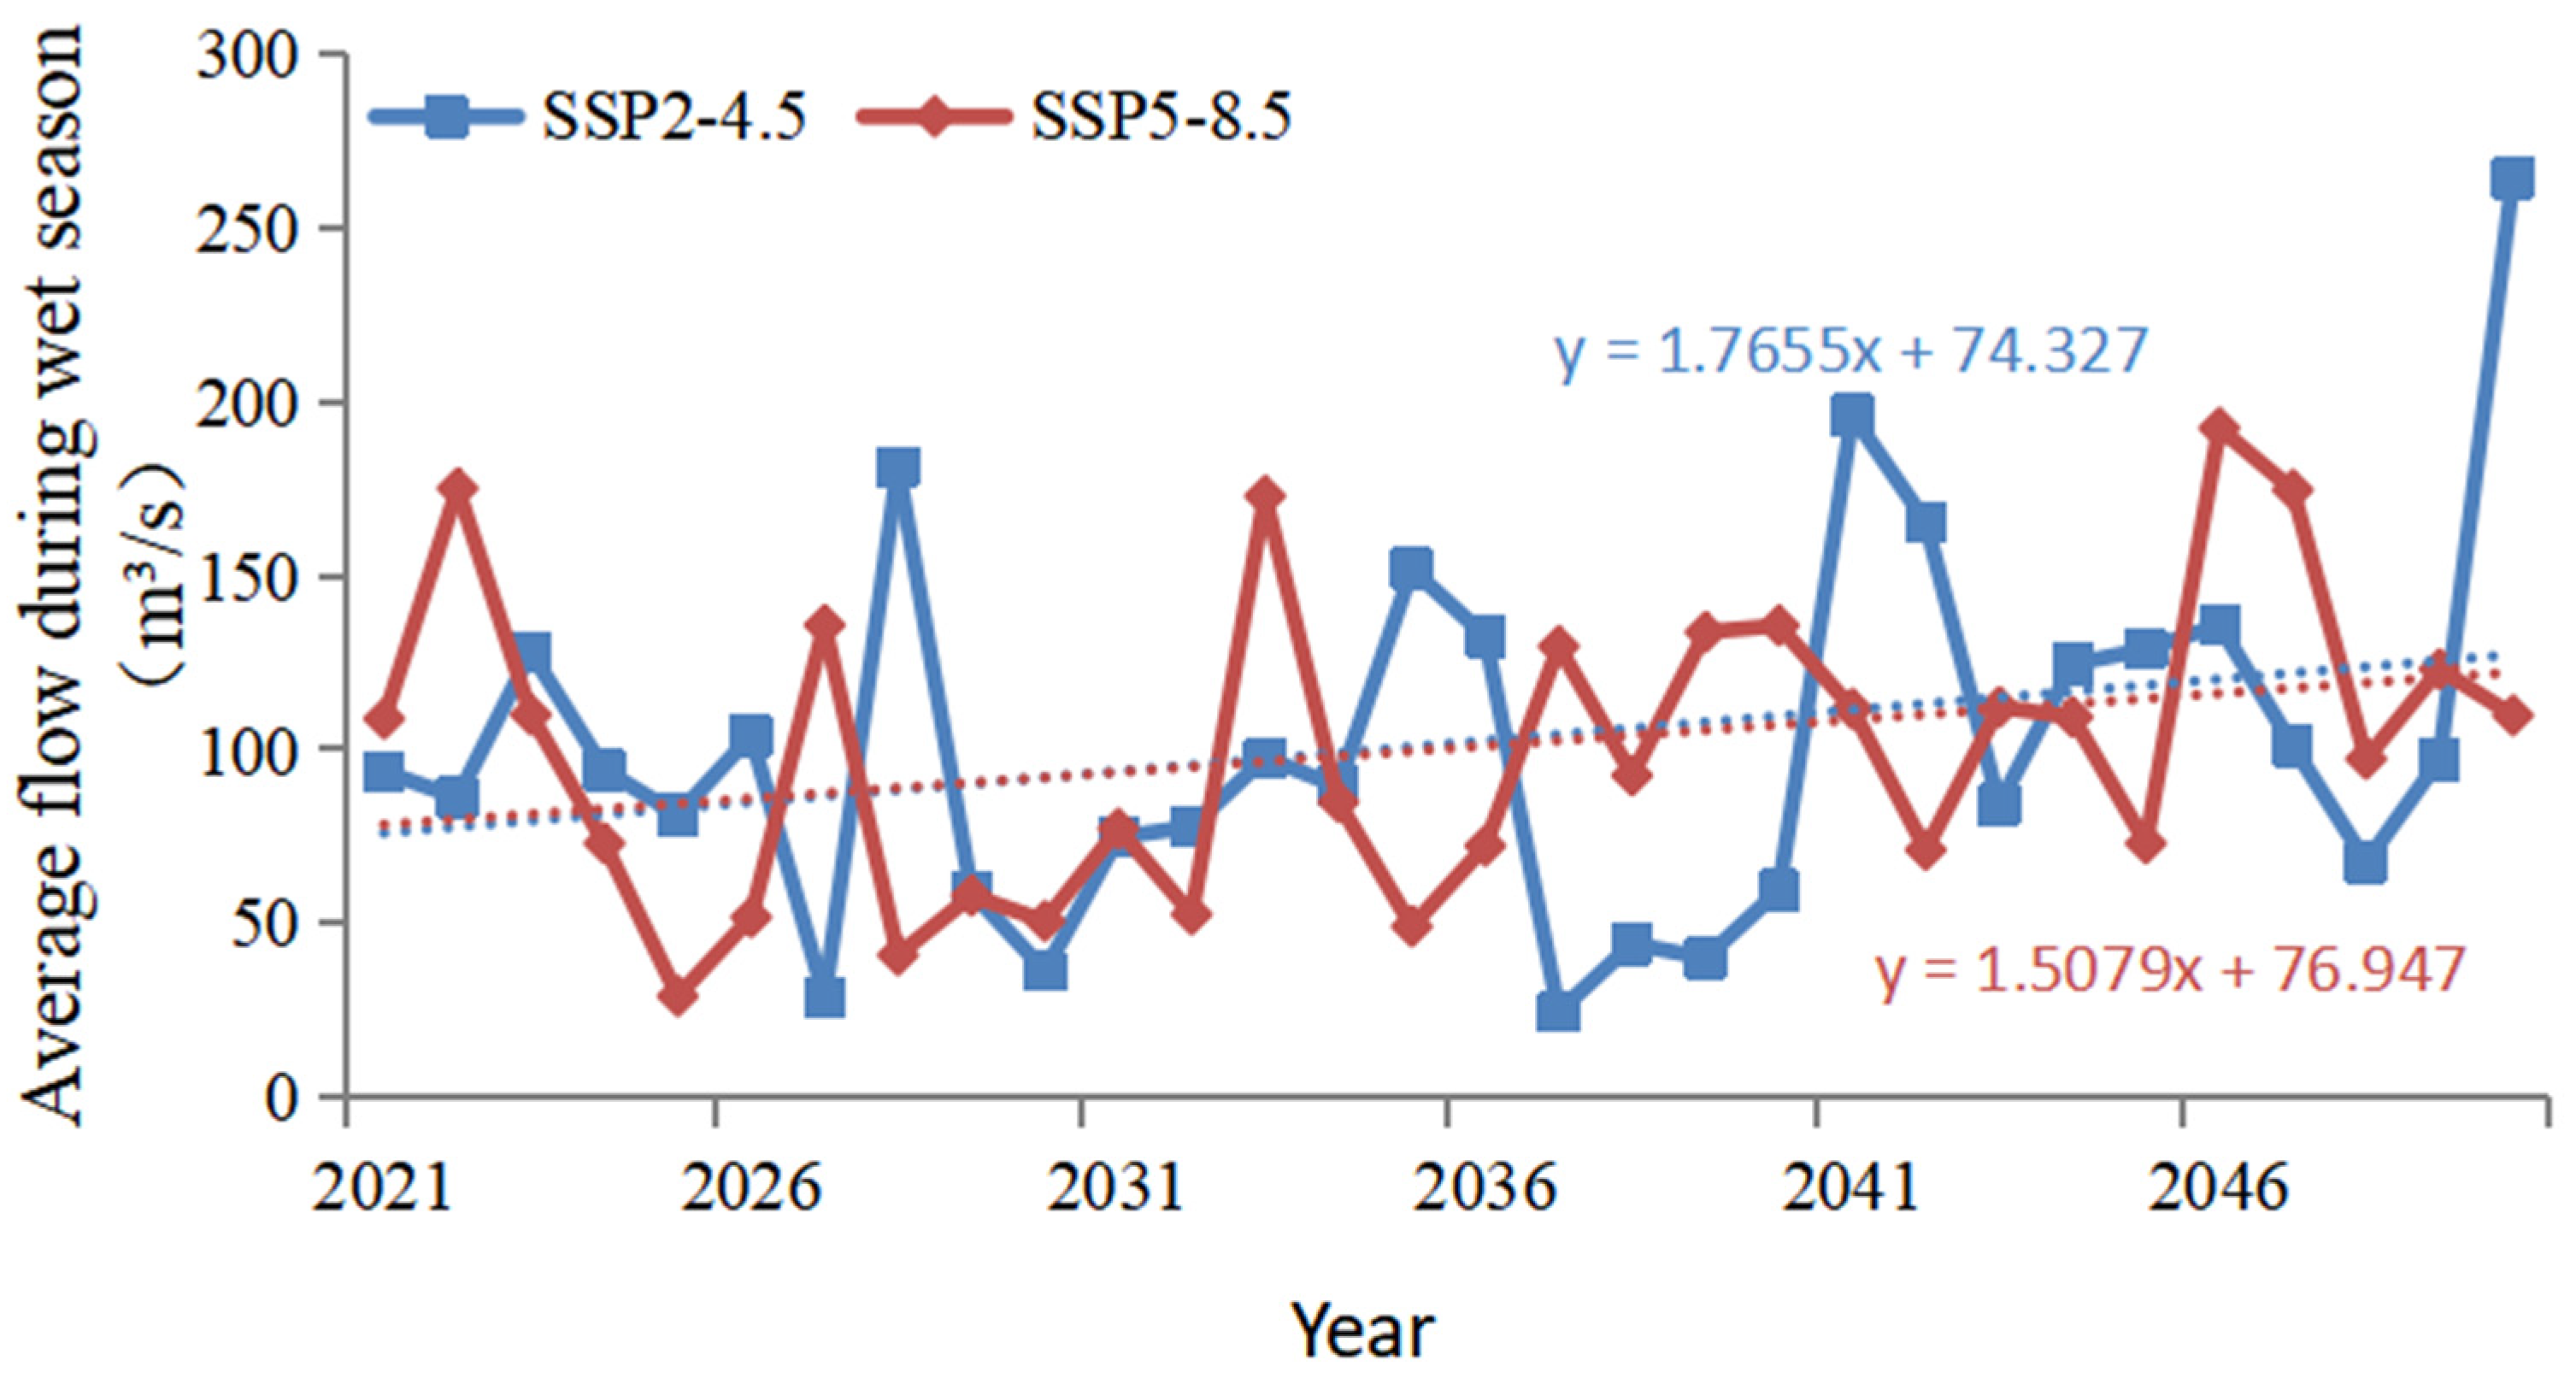
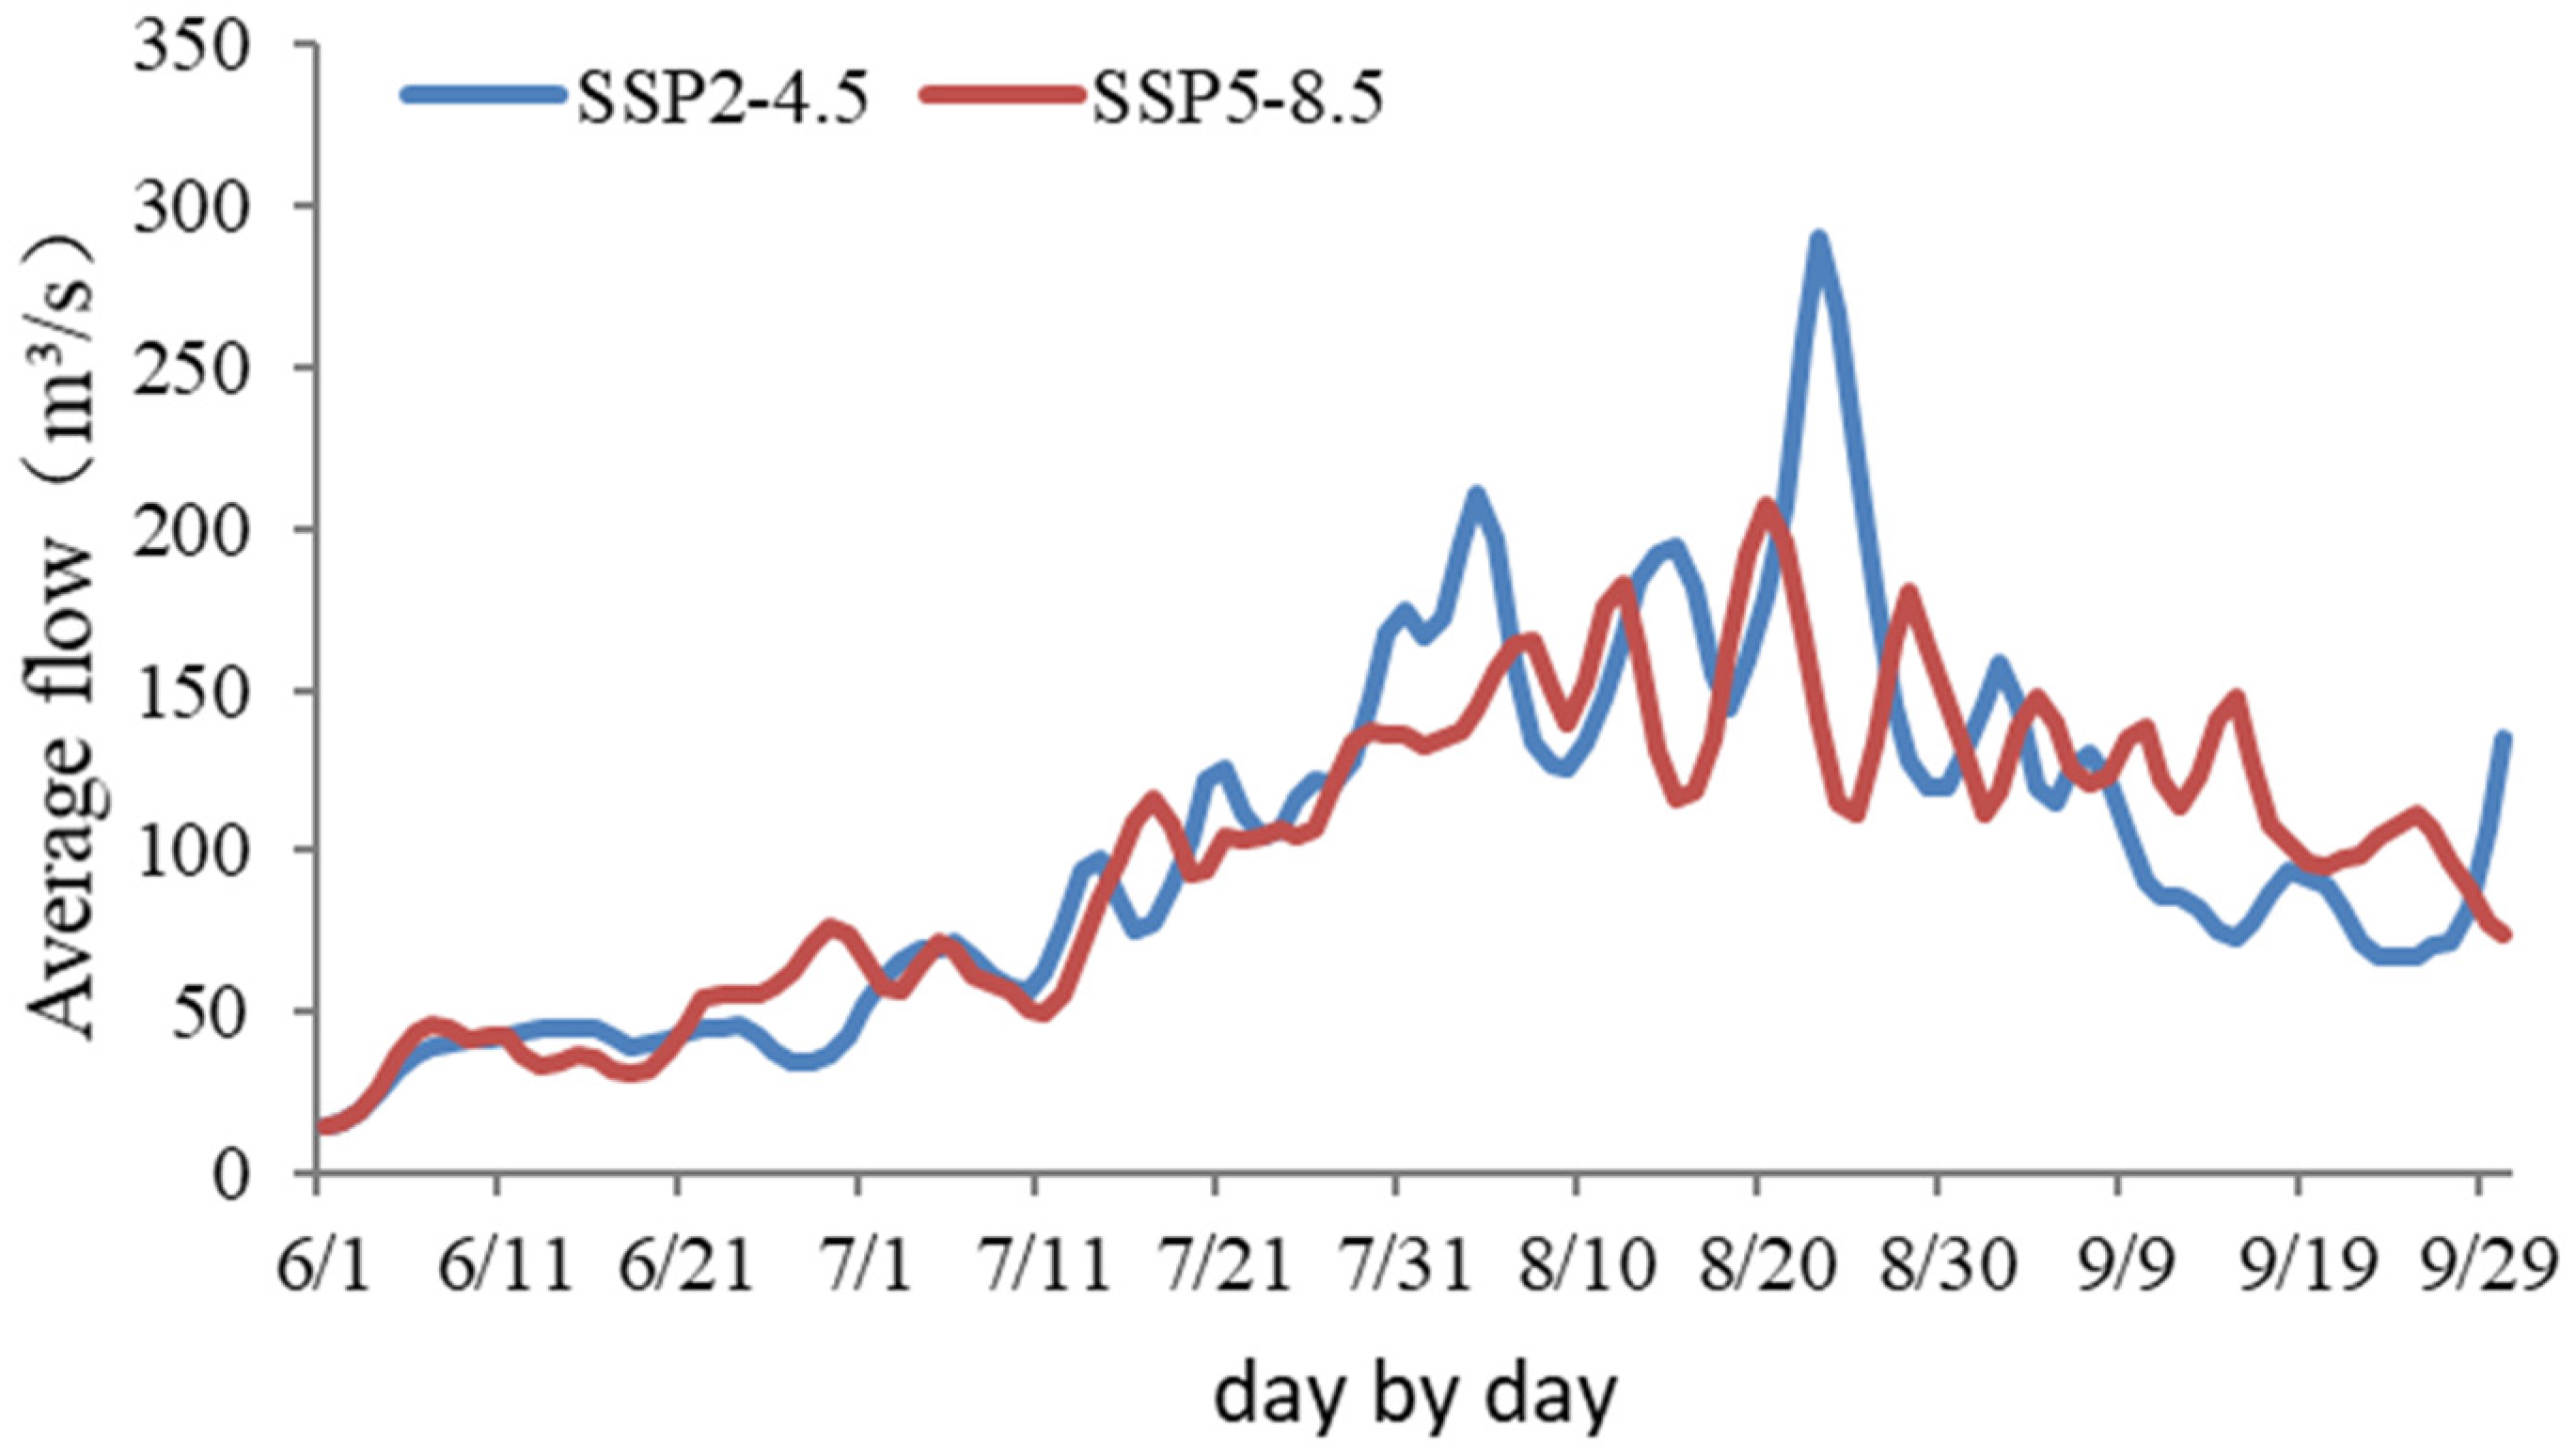
  • In the next 30 years (2021–2050), under the two climate scenarios of SSP2-4.5 and SSP5-8.5, rainfall in the basin will generally increase, and rainfall will be more evenly distributed in the future. The flow of the basin’s outlet during the wet season in the next 30 years was simulated, and it was found that the SSP2-4.5 and SSP5-8.5 scenarios have decreased by 33.3% and 34.2%, respectively. This may be related to the decrease in rainfall from June to September during the wet season in the next 30 years compared with the historical period.
  • Analysis of the simulated future runoff eigenvalues shows that the peak future runoff occurs most in August, accounting for 40% and 46.7% of the two scenarios, respectively, followed by September. Compared with the peak time in the historical period, most of them appeared in July and August, both accounting for 33.3%, indicating that there will be a certain delay in the peak time in the next 30 years. In the next 30 years, the maximum flow rate under the SSP2-4.5 scenario will be 2130.6 m3/s in 2050, and the maximum flow rate under the SSP5-8.5 scenario will be 2340.7 m3/s in 2047.

Author Contributions

Conceptualization, Z.L.; methodology, Z.L. and Y.C.; software, Y.C.; validation, Z.L.; formal analysis, Y.D.; investigation, Y.C.; resources, F.S. and Y.D.; data curation, F.S. and Z.J.; writing—original draft preparation, Y.C.; writing—review and editing, Z.L. and Y.C.; visualization, Z.J.; supervision, Z.L.; project administration, Z.L.; funding acquisition, Z.L. All authors have read and agreed to the published version of the manuscript.

Funding

This research was funded by Evolution Law and Trend Forecast of Water Resources in Changbai Mountains Area under Changing Environment of National Key R & D Project, grant number 2019YFC0409101.

Data Availability Statement

The data presented in this study are available upon request from the corresponding author.

Acknowledgments

We acknowledge the model developed by the U.S. Army Corps of Engineers Hydrology Engineering Center. We are thankful to the United States Geological Survey (USGS) and China Meteorological Data Network for providing free data. At the same time, we would like to thank the reviewers for their helpful suggestions on the improvements of this paper.

Conflicts of Interest

The authors declare no conflict of interest. The funders had no role in the design of the study; in the collection, analyses or interpretation of data; in the writing of the manuscript; or in the decision to publish the results.

References

  1. Dong, L.H.; Xiong, L.H.; Yu, K.X. Research progress of climate change and human Activities on hydrology. Adv. Water Sci. 2012, 23, 278–285. (In Chinese) [Google Scholar]
  2. Chen, S.; Yu, B.; Wu, R.; Chen, W.; Song, L. The dominant North Pacific atmospheric circulation patterns and their relations to Pacific SSTs: Historical simulations and future projections in the IPCC AR6 models. Clim. Dyn. 2021, 56, 701–725. [Google Scholar] [CrossRef]
  3. Fischer, H.; Broek, K.; Ramisch, K.; Okan, Y. When IPCC graphs can foster or bias understanding: Evidence among decision-makers from governmental and non-governmental institutions. Environ. Res. Lett. 2020, 15, 114041. [Google Scholar] [CrossRef]
  4. Cao, W.X.; Zhang, Z.Q.; Liu, Y.Q.; Band, L.E.; Wang, S.P.; Xu, H. Seasonal differences in future climate and streamflow variation in a watershed of Northern China. J. Hydrol. Reg. Stud. 2021, 38, 100959. [Google Scholar] [CrossRef]
  5. Sun, J.Q.; Li, H.Y.; Wang, X.J.; Shahid, S. Water resources response and prediction under climate change in Tao’er River Basin, Northeast China. J. Mt. Sci. 2021, 18, 2635–2645. [Google Scholar] [CrossRef]
  6. Golmohammadi, G.; Rudra, R.; Prasher, S.; Madani, A.; Mohammadi, K.; Goel, P.; Daggupatti, P. Water Budget in a Tile Drained Watershed under Future Climate Change Using SWATDRAIN Model. Climate 2017, 5, 39. [Google Scholar] [CrossRef] [Green Version]
  7. Kim, S.; Kim, H.; Kim, K.; Jun, S.M.; Hwang, S.; Kang, M.S. Assessing the Hydroclimatic Movement Under Future Scenarios Including Both Climate and Land Use Changes. Water 2021, 13, 1120. [Google Scholar] [CrossRef]
  8. Song, P.; Liu, W.; Sun, J.; Wang, C.; Kong, L.; Nong, Z.; Lei, X.; Wang, H. Annual runoff forecasting based on multi-model information fusion and residual error correction in the ganjiang river basin. Water 2020, 12, 2086. [Google Scholar] [CrossRef]
  9. Yang, M.X. Prediction of annual runoff at the danjiangkou reservoir, china based on forecast domain. Appl. Ecol. Environ. Res. 2019, 17, 9561–9575. [Google Scholar] [CrossRef]
  10. Liu, Y.; Ye, L.; Qin, H.; Ouyang, S.; Zhang, Z.; Zhou, J. Middle and long-term runoff probabilistic forecasting based on gaussian mixture regression. Water Resour. Manag. 2019, 33, 1785–1799. [Google Scholar] [CrossRef]
  11. Sun, M.; Kong, X.C.; Geng, W.H. Time series analysis of monthly Precipitation in Shandong Province based on ARIMA Model. J. Ludong Univ. 2013, 29, 244–249. (In Chinese) [Google Scholar]
  12. Sun, X.T.; Ren, G.H.; Du, K. Monthly rainfall prediction based on grey correlation method. J. Irrig. Drain. 2019, 38, 90–95. (In Chinese) [Google Scholar]
  13. Yuan, M.; Shen, J.S.; Zhang, Y.; Zhang, R.J.; Zhang, Y.H. Global Temperature Prediction Based on GA-BP Neural Network. J. Zhengzhou Inst. Aeronaut. Ind. Manag. 2020, 38, 67–75. (In Chinese) [Google Scholar]
  14. Zhou, Y.; Guo, P.; Yang, L. Prediction model of monthly Runoff in wet season based on wavelet analysis. Shaanxi Water Resour. 2019, 10, 37–39+42. (In Chinese) [Google Scholar]
  15. Sun, D.Y.; Hu, X.Q.; Wang, Z.G.; Lv, H.F. Runoff change and prediction in the Shule River Basin. Water Resour. Plan. Des. 2019, 9, 1–4+118. (In Chinese) [Google Scholar]
  16. Bao, Z.X.; Zhang, J.Y.; Yan, X.L.; Wang, G.Q.; Jin, J.L.; Liu, Y.; Guan, X.X. Future streamflow assessment in the Haihe River basin located in northern China using a regionalized variable infiltration capacity model based on 18 CMIP5 GCMs. J. Water Clim. Chang. 2020, 11, 1551–1569. [Google Scholar] [CrossRef]
  17. Jiang, T.; Lu, Y.R.; Huang, J.L.; Wang, Y.J.; Su, B.D. Overview of CMIP6 Model new Scenario (SSP-RCP) and Its Application in Huaihe River Basin. Prog. Meteorol. Sci. Technol. 2020, 10, 102–109. (In Chinese) [Google Scholar]
  18. Pokhrel, I.; Kalra, A.; Rahaman, M.M.; Thakali, R. Forecasting of Future Flooding and Risk Assessment under CMIP6 Climate Projection in Neuse River, North Carolina. Forecasting 2020, 2, 323–346. [Google Scholar] [CrossRef]
  19. Wang, L.; Zhai, W.L.; Zhang, J.H.; Cao, H.Q.; Tang, J. Prediction and characteristics of runoff in the upper Han River basin under climate change based on RBF-SWA. J. Chang. Acad. Sci. 2022, 19, 1–8. (In Chinese) [Google Scholar]
  20. Tang, Z.N.; Yang, G.L.; Liu, P.X. Prediction of Runoff in Lanjiang River Basin Based on HEC-HMS Model. Soil Water Conserv. Bull. 2021, 41, 137–145. (In Chinese) [Google Scholar]
  21. Zhang, L.; Yang, X.L. Applying a Multi-Model Ensemble Method for Long-Term Runoff Prediction under Climate Change Scenarios for the Yellow River Basin, China. Water 2018, 10, 301. [Google Scholar] [CrossRef] [Green Version]
  22. Gao, Y.F.; Chen, Y.; Jiang, Y.F.; Peng, T. Effect of DEM data source and resolution on HEC-HMS hydrological modeling. Adv. Water Sci. 2015, 26, 624–630. (In Chinese) [Google Scholar]
  23. Li, S.; Lai, Z.; Wang, Q.; Wang, Z.; Li, C.; Song, X. Distributed simulation for hydrological process in Plain River network region using SWAT model. Trans. Chin. Soc. Agric. Eng. 2013, 29, 106–112. [Google Scholar]
  24. Chu, X.; Steinman, A. Event and Continuous Hydrologic Modeling with HEC-HMS. J. Irrig. Drain. Eng. 2009, 135, 119–124. [Google Scholar] [CrossRef]
  25. Demlie, Z.; Assefa, M. Applicability of a Spatially Semi-Distributed Hydrological Model for Watershed Scale Runoff Estimation in Northwest Ethiopia. Water 2018, 10, 923. [Google Scholar]
  26. Al-Abed, N.; Abdulla, F.; Khyarah, A.A. GIS-hydrological models for managing water resources in the Zarqa River basin. Environ. Geol. 2005, 47, 405–411. [Google Scholar] [CrossRef]
  27. Meenu, R.; Rehana, S.; Mujumdar, P.P. Assessment of hydrologic impacts of climate change in Tunga-Bhadra river basin, India with HEC-HMS and SDSM. Hydrol. Processes 2013, 27, 1572–1589. [Google Scholar] [CrossRef]
  28. Sardoii, E.R.; Rostami, N.; Sigaroudi, S.K.; Taheri, S. Calibration of loss estimation methods in HEC-HMS for simulation of surface runoff (Case Study: Amirkabir Dam Watershed, Iran). Adv. Environ. Biol. 2012, 6, 343–348. [Google Scholar]
Figure 1. Study area. (a) Map of China. (b) The Yalu River, the Tumen River, and the Second Songhua River originate from Changbai Mountain, of which the Second Songhua River is located in Jilin Province. (c) The location of the study area. (d) Elevation map of the study area, as well as a schematic diagram of the site and water system.
Water 14 00792 g001
Figure 2. (a) Land use map of the study area. (b) Soil type map of the study area.
Water 14 00792 g002
Figure 3. HEC-HMS model construction.
Water 14 00792 g003
Figure 4. The simulation process of the runoff rate during the wet season and the verification period.
Water 14 00792 g004aWater 14 00792 g004b
Figure 5. Changes in annual runoff during the wet season under two climate scenarios from 2021 to 2050.
Water 14 00792 g005
Figure 6. Changes in daily average runoff during the wet season under two climate scenarios from 2021 to 2050.
Water 14 00792 g006
Table 1. Parameter optimization results of calibration period model.
CNImpervioustlagRCRatio
W2801084500.80.1
W3503584000.80.1
W3802883000.80.1
W390108600.80.1
W400158600.80.1
W4102083000.80.1
W420228600.80.1
W4301581500.80.1
W4401584000.80.1
W4502382000.80.1
W4601584000.80.1
W4702881500.80.1
W4801584000.80.1
W4903284000.80.1
W5002083000.80.1
Table 2. Parameter optimization results of regular channel confluence model.
R130R140R150R160R170R180R190
K10101020203010
X0.010.50.050.30.250.10.2
Note: W280–W500 are divided into 15 sub-basins, and R130–R190 are river confluence areas.
Table 3. Simulation results of HEC-HMS model.
PeriodYearPeak Current Time Difference ( Δ T )Relative Error of Peak Flow (REp)Relative Error of Total Flow (REv)Coefficient of Certainty (DC)R2Whether It Is Passed
Rate regulation2006017.8%−8.2%0.7100.763yes
20070−5.9%−4.5%0.6090.777yes
20081−4.7%−9.4%0.6600.700yes
20090−8.5%−19.9%0.6360.706yes
20100−4.2%−4.2%0.9060.907yes
201175−8.1%−17.9%0.3030.429no
Verification period2012115.0%−9.8%0.2880.521no
20131−17.4%−15.1%0.7390.749yes
20140−20.2%−12.4%0.4500.485no
20151−17.0%1.2%0.6030.639yes
20160−5.7%3.6%0.7200.824yes
20170−18.5%8.9%0.7600.774yes
Publisher’s Note: MDPI stays neutral with regard to jurisdictional claims in published maps and institutional affiliations.

