1. Introduction
As a complete physical geographical unit, a watershed is a complex “natural–social–economic” system composed of natural factors such as water, soil, and gas; and human factors such as population, society, and economy, which are interrelated and interact with each other [
1]. Water is the most important link between different geographical units and ecosystems in a watershed, and it is also a carrier for the migration of soil, nutrients, pollutants, and species within the watershed [
2]. Watershed ecosystems provide related products and services to human society through hydrological, geochemical, and biological processes [
3]. In the past, people usually managed watersheds as a single element through a single government agency, which makes it difficult to solve the complex problems of mutual influence and interweaving between the watershed water, ecological environment, and social economy [
4]. With the popularization of sustainable development, it is generally recognized that the effective way to solve the increasingly serious problems of overpopulation, natural resource shortages, and environmental degradation in the process of development is to carry out the systematic and comprehensive management scheme of natural resources, ecological environment, and social economy in the basin as a unit. Comprehensive development and management of watersheds has been gradually accepted by governments and scholars [
5].
Watershed water pollution control was first studied in European and North American countries. With rapid economic development after the Second World War, serious river water pollution problems appeared in Europe. Since then, many countries in the world have carried out various water environment management activities to prevent and control water pollution to solve the prominent problem of environmental degradation caused by economic development [
6,
7]. In Europe, famous rivers—such as the Seine River, the Thames River, and the Danube River—had all gone through the process of “pollution first and treatment later”, which had caused them to pay a heavy price of ecological degradation. In the renovating process, scientific water pollution control planning played a leading role, and the theory and technology of water pollution control planning also developed [
8]. After the 1960s, water pollution control entered the stage of comprehensive prevention and control, during which time countries attached more importance to the research of various technologies and methods for watershed water pollution control [
9,
10]. With the deepening of the research, scholars proposed new concepts of ecological water pollution control. They emphasized the natural laws of river and lake systems and paid attention to the restoration and protection of its natural ecology and natural environment so that the comprehensive ecological service functions of rivers and lakes could be realized. Increasingly, ideas and methods from the perspective of water ecology have been applied to comprehensive watershed water pollution control [
11,
12].
Water environmental capacity is an important basis for the total control of pollution sources and can provide an important reference for watershed pollution control. The water environmental capacity reflects the transformation, migration, and accumulation of pollutants in water and reflects the maximum limit of the pollutants that the water body can withstand under certain environmental target value constraints. At the same time, it is also the basis for formulating pollutant discharge standards and environmental standards [
13,
14]. In 1968, Japanese scholars took the lead in putting forward the concept of water environmental capacity and thus proposed a theoretical framework for total pollutant control [
15]. This theory controlled the discharge of pollutants in the basin within a certain range by setting the maximum allowable limit of the total amount of pollutants entering the regional environment, which is environmental capacity, to improve the water quality of the region [
16]. Since the 21st century, with the emergence of new calculation methods and tools, many excellent mathematical models of water quality and water quality modeling software have been applied [
17]. For instance, the DO-BOD water quality model has developed into a comprehensive water quality model including BOD, ammonia nitrogen, DO, nitrate, and other linear systems [
18]. In recent years, scholars have mostly adopted the concept of water environmental capacity, continuously optimized the research system by using mathematical water quality models, and applied the research results to the formulation of environmental standards [
19]. For example, Feng et al. used the MIKE11 model to study the impact of the operation of gates on the river network in city of Wuxi and on the water environmental capacity of the basin, which provides basic data and information for the gate management and water quality improvement of the river network [
20]. Zeng et al. used the SWAT model to quantitatively evaluate the impact of climate change on water environmental capacity in the middle and lower reaches of the Hanjiang River in China [
21].
River environmental flow is an important basis to judge whether the reasonable flow of rivers is maintained, the basic ecological quality of water is guaranteed, and that the ecological function of water bodies is safeguarded. Its research results can provide important reference for water ecological protection in the process of watershed water pollution control. There are many concepts similar to environmental flow, such as ecological environmental water demand, ecological base flow, and minimum acceptable flow. At present, the interpretation of “Environmental Flow”, described in the Brisbane Declaration in 2007, is the most widely accepted in the world. That is, “environmental flows” describe the quantity, timing, and quality of water flows required to sustain freshwater and estuarine ecosystems and the human livelihoods and well-being that depend on these ecosystems [
22]. The core idea of environmental flow is to put forward the recommended flow value for maintaining river ecological health from the perspective of maintaining the minimum flow requirements of aquatic organisms. The calculation methods mainly include the hydrologic method (Tennant method, 7Q10 method, flow duration curve method, etc.), the hydraulic method (wetted perimeter method, R2CROSS method, etc.), the habitat evaluation method (IFIM model, CASIMIR model, etc.), and the integral analysis method (BBM method, etc.) [
23,
24,
25].
Based on the concepts of the EC and EF and the MIKE11 model, a watershed water pollution control plan prediction and evaluation method is established in this study. This method can be used to explore the changes in the water environment and water ecology under different water pollution control schemes. By combining EC and EF, this method can not only obtain the effect of water pollution reduction under different schemes, but also determine whether the reasonable environmental flow can be maintained under the scheme, so as to realize the combination of water pollution control and environmental flow maintenance. The utilization of this method can provide valuable suggestions for rationally formulating water environment management and pollution control countermeasures in the watershed and provide a theoretical basis for the rational layout of agricultural and industrial development in the watershed. This is beneficial for reducing water pollution and promoting ecological environmental protection and the sustainable development of the social economy in the basin.
2. Research Methods
2.1. Study Area
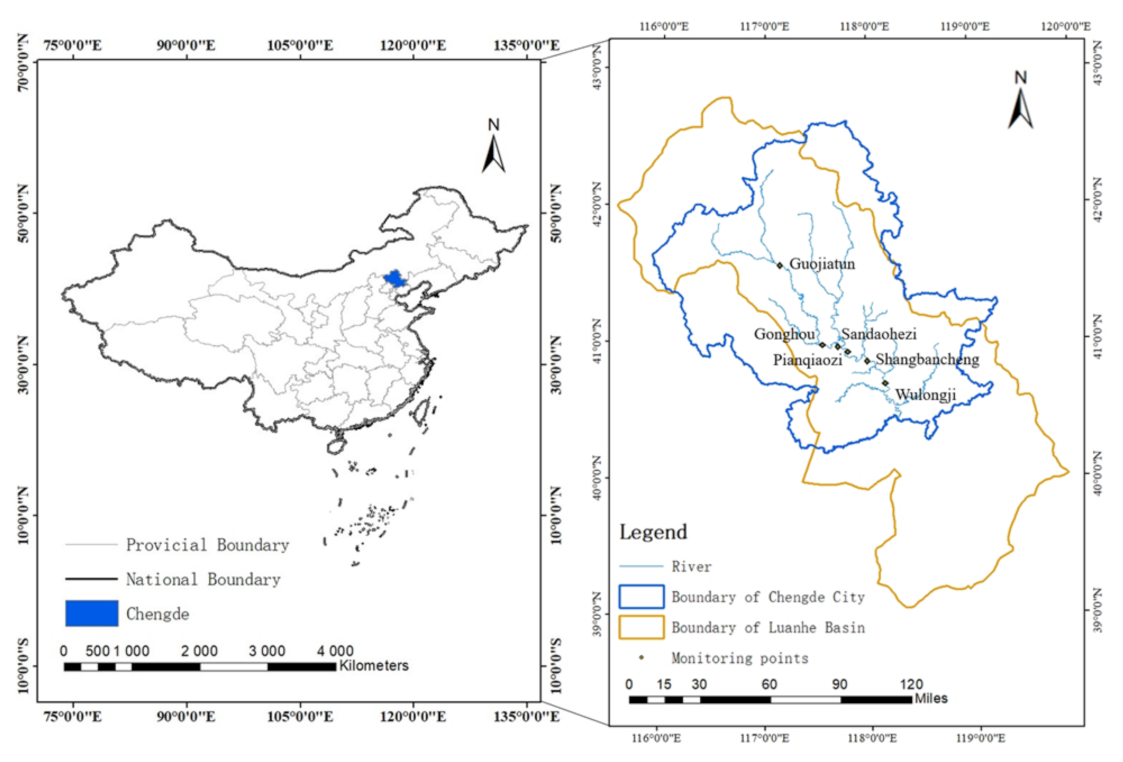
The Luanhe River is located in the northeastern North China Plain and originates from the north foot of Bayanguerrtu Mountain, Fengning County, city of Chengde, Hebei Province. It is one of the four major water systems in the Haihe River Basin. The Luanhe River Basin in Chengde is high in the north and low in the south, with complex terrain, winding mountains, and staggered rivers. The landform gradually transitions from the Bashang Plateau, to the middle and low mountains in the Yanshan Mountains, then to the hills at the south foot of the Yanshan Mountains, and on to the North China Plain. The Luanhe River has a total length of 888 km and a drainage area of 44,880 km
2. The catchment area of the Luanhe River Basin in Chengde, Hebei Province, is 28,616 km
2, accounting for 72% of the total area of the city and 64% of the total area of the whole Luanhe River Basin [
26]. The water system distribution of the Luanhe River Basin is shown in
Figure 1. The reach of the Luanhe River in Chengde plays an important role in the whole Luanhe River Basin.
The total amount of water resources is the total yield of surface water and groundwater formed by precipitation in the region. The multiyear average annual runoff of the Luanhe River Basin is 4.423 billion m3, and the multiyear average total amount of water resources in Chengde is approximately 3.701 billion m3, with a decreasing distribution from the southeast to the northwest. Since the Luanhe River Diversion Project was put into operation, the annual water transmission has reached 1 billion m3, which has greatly alleviated the difficulty of water supply in Tianjin. The Luanhe River has become an important water source in Tianjin, bringing social, ecological, and environmental benefits to some areas of Hebei Province and Tianjin. As the Luanhe River forms an ecological barrier to Beijing and Tianjin and is an important source for agricultural products (including fruits and vegetables), research on the water pollution control scheme of the Luanhe River in Chengde is of great significance to the environmental management of Beijing, Tianjin, and Hebei.
2.2. Methods
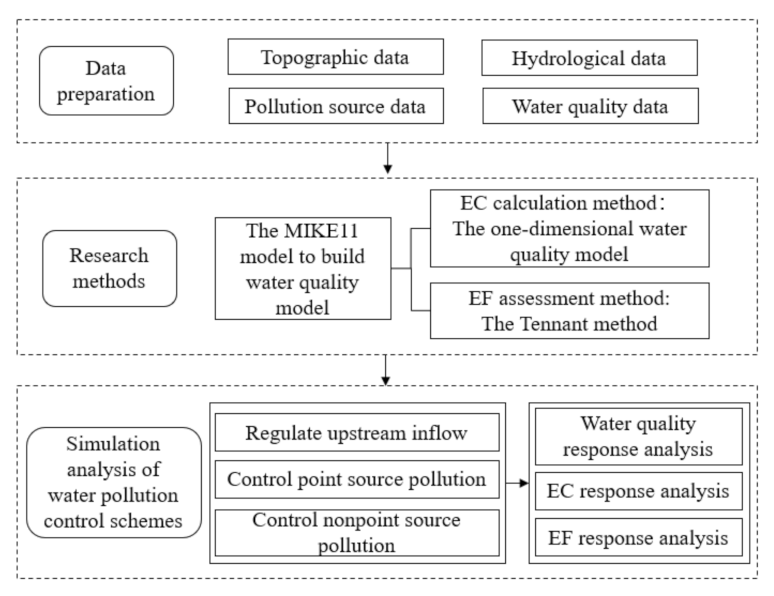
Based on the concepts of the EC and EF and the MIKE11 model, a simulation evaluation method of the basin water pollution control scheme is established to explore the changes in the water environment and water ecology under different water pollution control schemes. In this method, the MIKE11 model is used to construct the water quality model of the study area, the one-dimensional water quality model is used to calculate the water environmental capacity (EC), and the Tennant method is used to evaluate the environmental flow (EF). Different water pollution prevention and control schemes are set, and the concentration changes of NH
3-N, COD, TN, and TP under different water pollution prevention and control schemes in the study area are simulated by the method. The changes in EC and EF are compared and analyzed, which can provide valuable suggestions for reasonably formulating water pollution prevention and controlling countermeasures in the basin. The technical route is shown in
Figure 2.
2.2.1. MIKE11 Model Construction and Calibration
MIKE11 is professional engineering software suitable for simulating one-dimensional hydrodynamics, water quality, and sediment transport in estuaries, rivers, irrigation channels, and other water bodies. At present, it is widely used and verified worldwide and has become a standard tool in many countries [
27]. The MIKE11 model contains a variety of modules with different functions, which can easily and flexibly create personalized river simulation models. In this study, the hydrodynamic module (HD) and convection diffusion module (AD) were selected to model the hydrological and water quality of the main stream of the Luanhe River in Chengde.
The Mike11 HD hydrodynamic module is the main component of the MIKE11 software system and the basis and application premise of reasonable and scientific simulation research of other modules. It can carry out hydrodynamic simulation research on most one-dimensional water bodies. The basic principle of calculation is to solve the Saint-Venant system of equations by using a six-point Abbott–Lonescu finite difference scheme. The adaptive numerical calculation conditions of river flow on time and space scales are used to describe various flow environments of the river to simulate the hydrodynamic situation of the river. The formulas are
where
x is the position coordinate (m),
t is the time coordinate (s),
Q is the flow along the river section (m
3/s),
q is the lateral inflow (m
3/s),
A is the cross-sectional area of the river (m
2),
h is the water level (m),
R is the hydraulic radius (m),
C is the Chézy formula, and
α is the momentum correction coefficient [
28].
The MIKE11
AD module can simulate the temporal and spatial distribution characteristics of pollutants in a water environment after transport and diffusion under hydrodynamic conditions. The change in substances in water described in MIKE11 can be expressed by the one-dimensional convection diffusion equation
where
t is the time coordinate (s),
x is the distance coordinate (m),
C is the pollutant concentration (mg/L),
q is the lateral inflow of the river (m
3/s),
D is the longitudinal diffusion coefficient of the river (m/s),
K is the degradation coefficient of the pollutant (1/d),
A is the cross-sectional area of the river (m
2), and
C2 is the concentration of pollutant source/sink (mg/L) [
29].
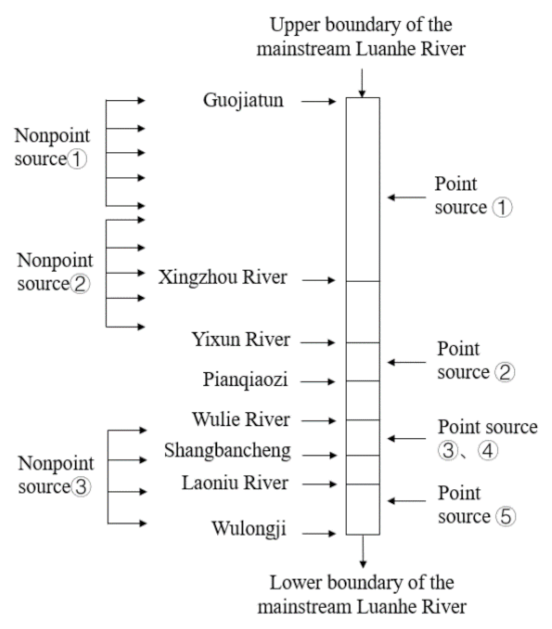
In this study, MIKE11 is used for water quality simulation. The simulated river section is mainly the Guojiatun–Wulongji section of the mainstream Luanhe River. There are four tributaries along the way—namely, the Xingzhou River, Yixun River, Wulie River and Laoniu River, from upstream to downstream. The main stream of the Luanhe River flows through five major sewage outlets, namely, the Luanping Sewage Treatment Plant, the Shuangluan Qingquan Water Company, and Phase I and Phase II of the Taipingzhuang Sewage Treatment Plant of Shuangqiao District and Chengde Qingcheng Water Company. The specific distribution is shown in
Table 1. Nonpoint source pollution is mainly distributed in Longhua County, Luanping County, and Chengde County. The specific distribution is shown in
Table 2. An overview of pollution source generalization is shown in
Figure 3. The external boundary of the simulated reach includes the Guojiatun Hydrological Station on the main stream of the Luanhe River (at the upstream boundary), the Boluonuo Hydrological Station on the Xingzhou River, the Hanjiaying Hydrological Station on the Yixun River, the Chengde Hydrological Station on the Wulie River, the Xiabancheng Hydrological Station on the Laoniu River, and the Wulongji Hydrological Station (at the downstream boundary). The internal boundary includes five lateral inflow point sources of the main stream of the Luanhe River in Chengde and three lateral inflow nonpoint sources along the reach. The hydrological data at the inner and outer boundaries are time series values. In the time series file, the model period is from 9:00 on 1 June 2019, to 9:00 on 31 July 2019.
The parameter file for the operation and calculation of the HD hydrodynamic module mainly defines the initial conditions of the simulation and riverbed roughness. According to the actual hydrodynamic conditions of the river section and considering the smooth start of the model, the initial water depth and velocity of the main stream of the Luanhe River are added. Riverbed roughness, which is assigned as n, is an important coefficient reflecting the influence of riverbed sidewall roughness on flow movement and the corresponding hydrological analysis. Its value is the key to river network hydrodynamic simulation. This model is calibrated from n = 0.03.
The parameters of the AD water quality module mainly include the pollutant components to be simulated, the initial concentration of pollutants, the diffusion coefficient of pollutants in the channel, the attenuation coefficient of pollutants, etc. The pollutants to be simulated in this study are NH3-N, COD, TN, and TP. The initial concentration is the water quality concentration of the whole basin at the beginning of the calculation. Since this simulation models a stable water quality state, the selection of the initial concentration has little impact on the simulation results. Therefore, in this model, the minimum value of each pollutant at each monitoring station is taken as the initial concentration. The diffusion coefficient in the model is a calibrating parameter. Generally, this value is 5–20 m2/s. The attenuation coefficient of the pollutant indicates the degradation of the pollutant; that is, the pollutant is decomposed into other substances by microorganisms in the water body in the process of migration with the water flow, which reduces the concentration of the pollutant in the water body. In this study, degradation, adsorption of pollutants in water, and precipitation of pollutants in water are regarded as an overall attenuation. The attenuation coefficient is not uniform in different water bodies. Therefore, the attenuation coefficient should be calibrated by the model. Considering the stability of the calculation, the length of the calculation step is set to 30 s.
2.2.2. EC Calculation
In this paper, the main stream of the Luanhe River in the water system in Chengde is taken as the research object. Hydrological data, water quality data, sewage outlet data, water intake data, pollution source data, socioeconomic index data, research regional statistical yearbooks, etc. are investigated and evaluated. The data consistency is analyzed and a database is formed. The water area is generalized and the characteristics of the river water functional area are clarified. The Guojiatun–Wulongji section of the main stream of the Luanhe River is divided into three calculation units: the Guojiatun–Pianqiaozi section, the Pianqiaozi–Shangbancheng section and the Shangbancheng–Wulongji section. The following calculation model of water environmental capacity is selected.
The one-dimensional water quality model of the river is used to calculate the water environmental capacity of three calculation units in the main stream of the Luanhe River in Chengde. The calculation model is:
where
Es is the self-purification capacity, kg/d;
S is the water quality standard, mg/L;
Cb is the river background concentration, mg/L; and
Qr is the river flow, m
3/s.
where
ED is the dilution capacity, kg/d;
S is the water quality standard, mg/L;
Qt is “the river flow + wastewater flow”, m
3/s;
l is the length of river reach, m;
k is the comprehensive attenuation coefficient, 1/d; and
u is the river velocity, m/s.
The upper limit of the corresponding environmental quality standard category in the water environment functional area is taken as the water quality target value. According to the classification of the surface water environment functional area in Hebei Province, the river water functional area of the Luanhe River Basin in Chengde is mainly planned as class III. Among them, the Guojiatun–Pianqiaozi section is class III, and the Pianqiaozi–Shangbancheng section and the Shangbancheng–Wulongji section are class IV.
2.2.3. EF Assessment
The Tennant method is used to evaluate the environmental flow level in this study. Tennant et al. proposed the Tennant method in 1976 by measuring the physical parameters of river flow—such as the width, depth, and velocity—of 58 sections of the 3145 km reach many times from 1964 to 1974. The Tennant method uses the proportion of annual average flow to link the protection of fish, wildlife, entertainment, and related environmental resources with river flow. Based on the predetermined percentage of annual average flow, Tennant method divides the recommended value of river flow for protecting water ecological and environment into maximum, optimal range, excellent, very good, good, average or relatively poor, poor or minimum, and terrible value (
Table 3). The EF level can be evaluated according to the proportion of monthly average flow to annual average flow. Macroscopically, it can guide basic water demand management in river ecological protection and can also reflect the local EF level to a certain extent.
According to this method, for most aquatic organisms, 10% of the annual average flow of the river is the minimum flow to maintain its short-term survival habitat. Thirty percent of that is the basic flow to maintain good living conditions for its general activities. When reaching 60%, an excellent habitat for their early growth and most activities is reached. In the Northern Hemisphere, the dry season is from October to March of the next year in most areas, and the river flow needs to meet general water use. The wet season is from April to September, which is the spawning and juvenile stage of most fish. The river flow needs to meet the reproduction and survival requirements of fish. Based on that, the Tennant method recommends 10% of the annual average flow for the ecological base flow from October to March of the next year in the dry season and 30% of the annual average flow for the ecological base flow from April to September in the wet season.
2.2.4. Setting of Water Pollution Prevention and Control Scheme
According to the water pollution discharge pattern and surface water resource reserves of Luanhe River Basin in Chengde, it is feasible to reduce point source pollution, reduce nonpoint source pollution, and increase upstream water inflow, which is also the main direction of water pollution prevention and control considered by Chengde Ecological Environment Bureau. Thus, these three measures—namely, reducing point source pollution, reducing nonpoint source pollution, and increasing upstream water—are selected to form eight water pollution control schemes, as shown in
Table 4. The specific implementation methods of the three measures are determined by the emission of point and nonpoint source pollutants in the study area and the relevant plans of Chengde Ecological Environment Bureau, after consulting the officers of the government.
Table 5 shows the details.
2.3. Data Sources
The topographical data required in this study are basin digital elevation model (DEM) data, which are STRM 30 × 30 m data provided by the geospatial data cloud platform of the Chinese Academy of Sciences.
The hydrological data mainly include the river width (m), river depth (m), flow velocity (m/s), and flow volume (m3) of the hydrological monitoring section of the mainstream Luanhe River, which are provided by the local Water Resources Bureau and are mainly used for the basin hydrodynamic simulation in the HD hydrodynamic module of the MIKE11 model.
The water quality data mainly include the pollution indicators and concentrations of the water quality monitoring section of the main stream of the Luanhe River, which is provided by the local Ecological and Environmental Protection Bureau and is mainly used for the calibration and verification in the AD water quality module of the MIKE11 model.
Pollution source data include point source pollution data and nonpoint source pollution data. Point source data refer to the concentration and flow of various indicators of wastewater discharged from sewage treatment plants and industrial enterprises, and nonpoint source data refer to the inflow of various pollutants caused by agricultural production, soil and water loss, and other factors. The data are provided by the local Ecological Environmental Protection Bureau and are mainly used for the construction of the AD water quality module of the MIKE11 model.
3. Results and Discussion
3.1. Model Calibration and Validation Results
Calibrated on the data of June 2019 and verified on the data of July 2019, the following results are obtained.
3.1.1. HD Hydrodynamic Module
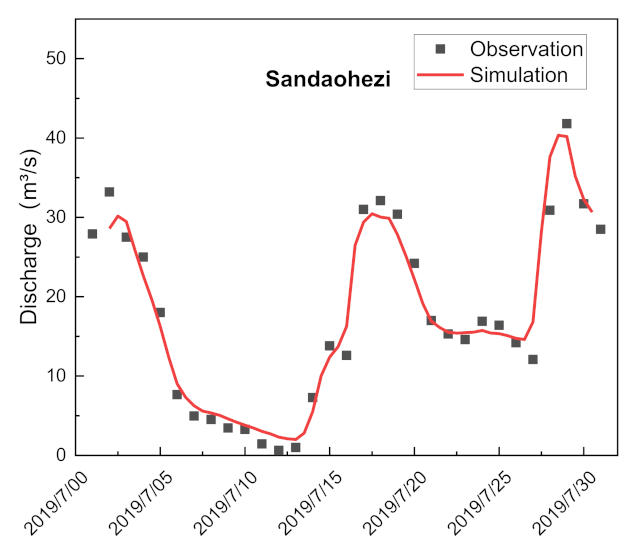
After several commissioning calculations, the roughness value conforming to hydrodynamic conditions is determined. Taking the Guojiatun hydrological station as the starting point, the roughness values of 0–70 km, 70–126 km, and 126–242 km of the main stream of the Luanhe River are taken as 0.034, 0.030, and 0.024, respectively. The discharge data of the Sandaohezi hydrological station are used for verification. The results are shown in
Figure 4. The calibration results are relatively accurate, and the water quality simulation can be carried out on the basis of these values.
3.1.2. AD Water Quality Module
The longitudinal diffusion coefficient D of the river channel is estimated and simulated. Through continuous calibration and adjustment according to the actual concentration of pollutants in the monitoring section during simulation, the final value is determined to be 9. Taking the monitoring sections of Gonghou, Pianqiaozi, and Shangbancheng as calibration points, the measured values of pollutant monitoring indicators in July 2019 are selected to calibrate the model. By constantly adjusting the attenuation coefficient of various pollutants, comparing the simulated and actual values of pollutant concentration, and observing the multiple fitting results, the coefficients with the best fit are selected as the comprehensive attenuation coefficient values of pollutants in the river section. The calibration results are shown in
Table A1.
Table 6 and
Table 7 show that the relative errors between the simulated and measured values of NH
3-N, COD, TN, and TP are controlled within ±8.00%, indicating that the water quality model has high simulation accuracy and that the selection of model parameters is reasonable.
3.2. Analysis of Simulation Results of Different Water Pollution Control Schemes
3.2.1. Water Quality Response Analysis
Under the eight schemes, the changes in NH
3-N, COD, TN, and TP concentrations in the Gonghou, Pianqiaozi, and Shangbancheng monitoring sections are shown in
Table A2.
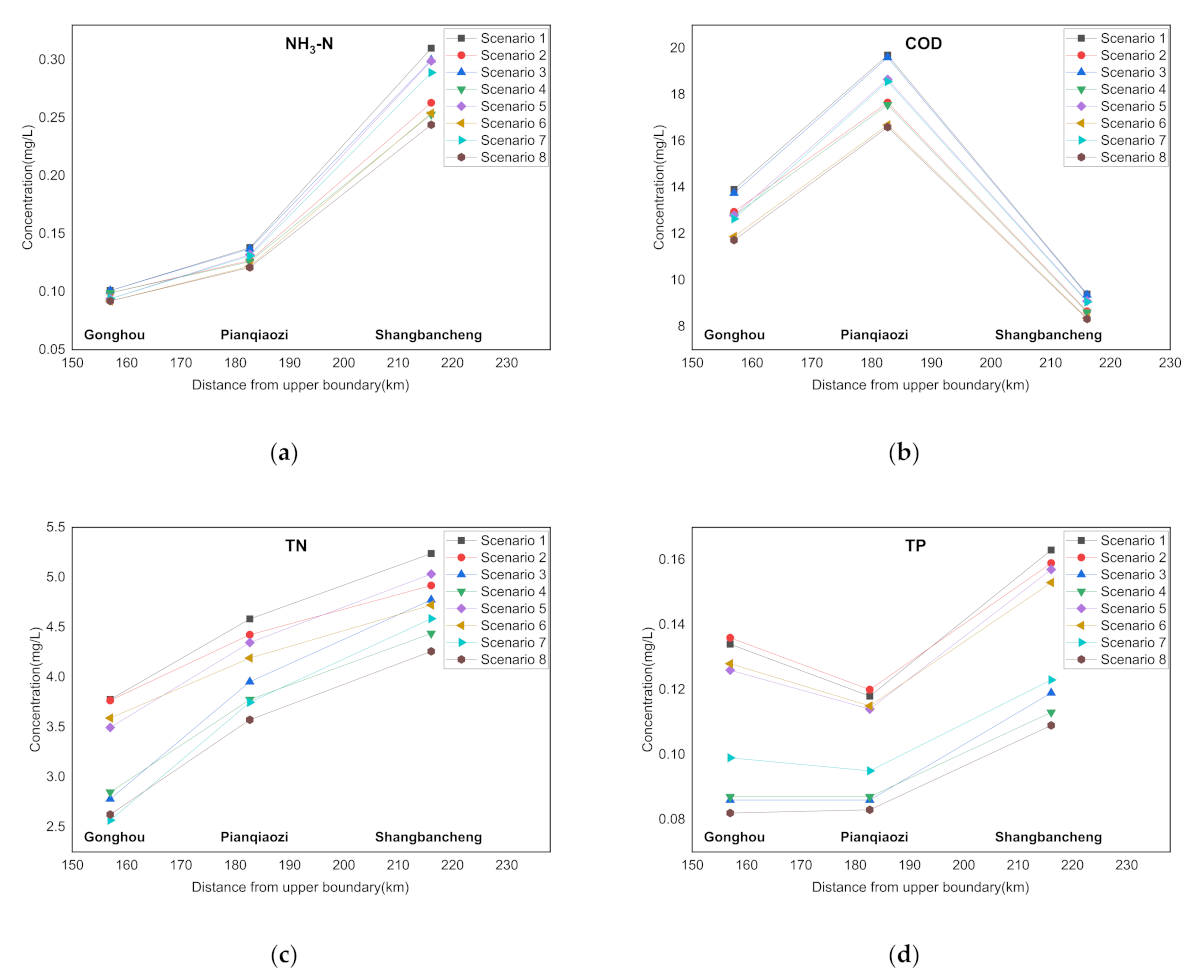
As shown in
Figure 5, on the whole, the reduction effects of reducing point source pollution on the concentrations of the four pollutants in each section are obvious, the reduction effects on NH
3-N and COD are significant, the reduction effect on TN is general, and the reduction effect on TP is weak. The reduction effects of reducing nonpoint source pollution on NH
3-N and COD in each section are not obvious, except for TN and especially TP. In the process of model building, the nitrogen nonpoint source pollutants are NH
3-N and TN, but the nonpoint source load reduction has little effect on the concentration of NH
3-N and has a great effect on the concentration of TN. It can be inferred that NH
3-N in nonpoint source pollutants may be transformed into nitrate nitrogen through chemical reactions, which increases the TN concentration. Increasing the upstream water also has a certain reduction effect on the concentration of pollutants, but the effect is often obvious near the upstream boundary. With a gradual increase in the distance from the upstream point, the reduction effect decreases gradually.
3.2.2. EC Response Analysis
According to the calculation model of the Luanhe River mainstream water environmental capacity, the NH
3-N, COD, TN, and TP capacities of the Luanhe River mainstream in the typical wet season under eight water pollution control schemes are calculated. The results are shown in
Table A3.
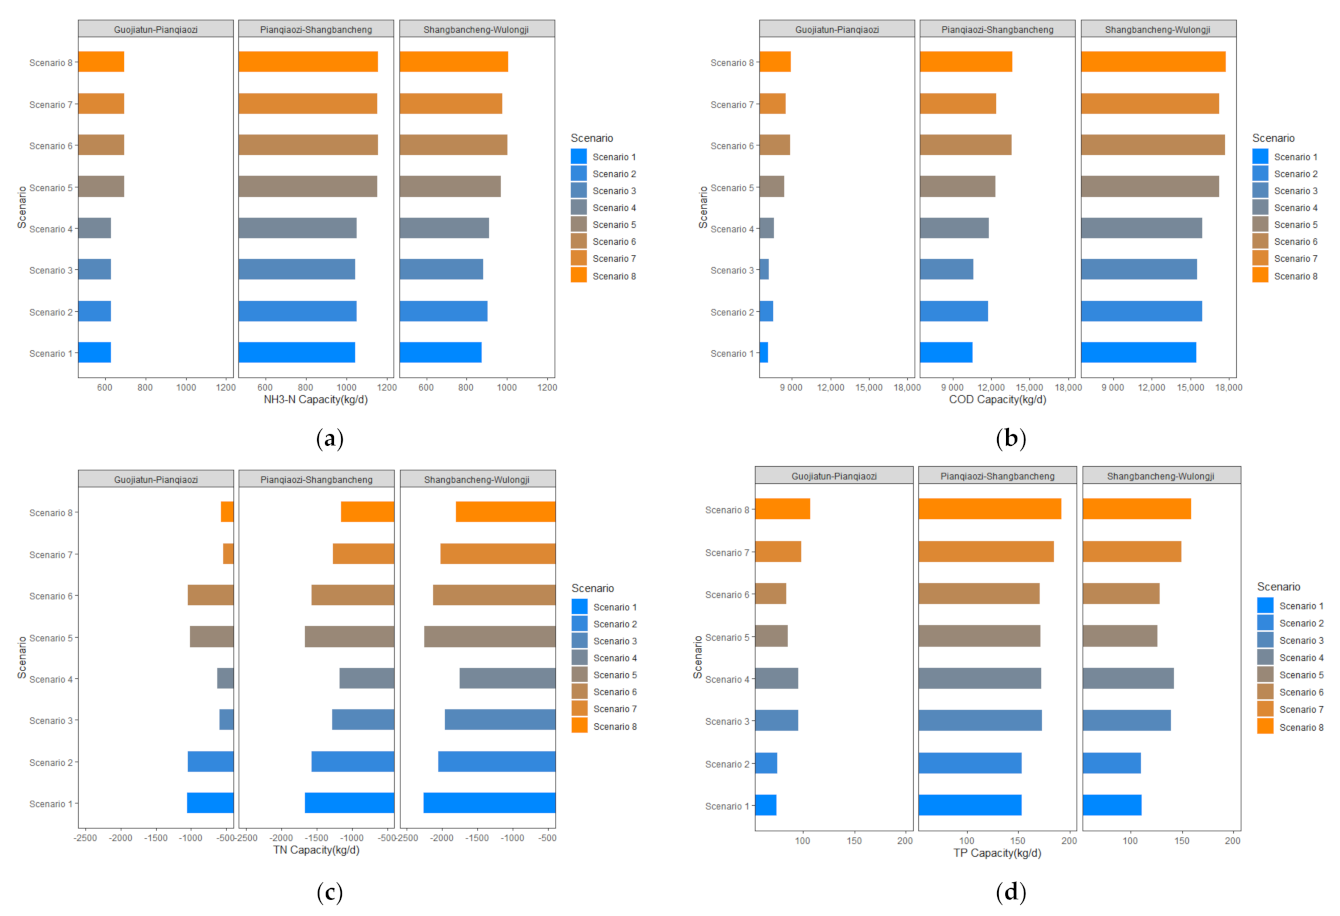
The change patterns of NH
3-N and COD capacity are basically the same.
Figure 6a shows that increasing upstream water has an obvious effect on increasing the NH
3-N capacity, reducing point source pollution can also expand the NH
3-N capacity to a certain extent, and reducing nonpoint source pollution has a weak impact on the change in NH
3-N capacity.
Figure 6b shows that increasing upstream water has the most obvious effect on increasing the COD capacity. Reducing point source pollution can also expand the COD capacity to a certain extent. Reducing nonpoint source pollution has little effect on the COD capacity. Increasing the water from upstream and reducing point source pollution at the same time has an excellent capacity expansion effect on NH
3-N and COD.
The TN capacity of the main stream of the Luanhe River in Chengde is negative, and the TN content is overloaded as a whole.
Figure 6c shows that increasing upstream water has little impact on TN capacity, reducing point source pollution has a certain promoting effect on the increase in TN capacity, and reducing nonpoint source pollution can significantly increase TN capacity. As seen from
Figure 6d, reducing point source pollution has little impact on TP capacity, increasing upstream water has a significant impact on TP capacity, and the effect of reducing nonpoint source pollution on TP capacity is slightly stronger than increasing upstream water. Reducing nonpoint source pollution and increasing upstream water at the same time can significantly expand TP capacity.
3.2.3. EF Response Analysis
The Tennant method is used to evaluate the ES status of the main stream of the Luanhe River under eight schemes, and the discharge data at Sandaohezi are taken for calculation. The results are shown in
Table 8.
The calculation results show that increasing upstream water can improve the level of ES to a certain extent and that reducing point source pollution and nonpoint source pollution has little effect on the change in ES. Generally, the main stream of the Luanhe River has sufficient flow in July, which can meet the demand under different simulation scenarios and can provide a good habitat and growth environment for aquatic animals and plants.
3.3. Discussion
According to the research results, the concentrations of NH3-N and COD in the Luanhe River Basin of Chengde City are mainly affected by point source pollution, and the concentrations of TN and TP are mainly affected by nonpoint source pollution. The water environmental capacity of NH3-N, COD, and TP is a surplus, but TN is obviously overloaded. The water in the study area is sufficient to meet the demand of the social economy and provide a good habitat and growth environment for aquatic animals and plants.
At present, the actual sewage treatment capacity of Chengde accounts for only 45% of the design treatment capacity, and some sewage treatment plants have problems, such as a lack of diversion of rainwater and sewage and the aging of pipe networks, resulting in sewage leakage and the pollution of surface and underground water resources. Therefore, Chengde can strengthen the diversion of rain and sewage, upgrade the sewage treatment plant, and speed up the improvement of the supporting pipe network and the management of sewage treatment systems to reduce the pollution load of sewage treatment plants in the water environment of the basin.
According to the survey, in addition to soil erosion and pollutants from sewage treatment plants, agricultural nonpoint source pollution has a great impact on the Luanhe River Basin. According to the analysis of the current situation of the Luanhe River Basin, agricultural nonpoint source pollution is still serious, and the proportion of total nitrogen and ammonia nitrogen flow to the environment due to agricultural pollution in 2019 is very high. At the same time, the low utilization rate of chemical fertilizers and pesticides in the basin is also one of the reasons for low amounts of agricultural nonpoint source pollution. Therefore, for the control of agricultural nonpoint sources, we should start with farmland, adopt different irrigation technologies according to local conditions, actively develop water-saving agriculture, continue to promote the mode of water fertilizer integration, and reduce farmland nutrient loss. At the same time, for some land types, the planting structure can also be adjusted appropriately to improve agricultural production efficiency.
4. Conclusions
Based on the concepts of the EC and EF and the MIKE11 model, a simulated evaluation method of the basin water pollution control scheme was established to explore the changes in the water environment and water ecology in the basin under different water pollution control schemes, and the method was applied to the Luanhe River Basin in Chengde, Hebei Province, China. Reducing point source pollution, reducing nonpoint source pollution, and increasing upstream water were selected to be combined into eight water pollution control schemes. The concentration changes of NH3-N, COD, TN, and TP under eight different water pollution control schemes in the study area were simulated, and the responses of EC and EF were compared and analyzed. The results show that in the study area: (1) Overall, within the scope of model simulation, reducing point source pollution has the most obvious effect on water pollution prevention, reducing nonpoint source pollution is slightly inferior to reducing point source pollution, and the effect of increasing upstream water on water pollution prevention is the weakest. Reducing point source pollution has obvious reduction effects on NH3-N, COD, and TN—especially on NH3-N and COD—while the reduction effect on TP is weak. Reducing nonpoint source pollution has a very obvious effect on TP reduction and contributes to TN reduction. (2) The environmental capacity of the Luanhe River’s main stream is still considerable, but TN overload is serious. The increase in upstream water inflow can greatly increase the water environmental capacity of NH3-N and COD, and reducing point source pollution can also increase the water environmental capacity of NH3-N and COD to a certain extent, but reducing nonpoint source pollution has no significant impact. The increase in upstream water inflow has little impact on TN and TP, but reducing point source pollution can reduce this impact. The water environmental capacity of TN can be greatly increased by reducing point source pollution, and the environmental capacity of TP can be greatly increased by reducing nonpoint source pollution. (3) The increase in upstream water inflow can improve the EF level to a certain extent. Generally, the main stream of the Luanhe River has sufficient flow in July, which can meet the demand under different simulation scenarios and can provide a good habitat and growth environment for aquatic animals and plants.
In summary, this method can be used to predict the changes in the water environment and water ecology in the basin under different water pollution prevention and control schemes and to provide a decision-making basis for the comprehensive prevention and control of water pollution in the basin to improve the effectiveness of water pollution prevention and control measures, highlight key points in the treatment process, promote the reduction of water pollutants, and improve the effectiveness of investment in water pollution control. At the same time, this method can also promote the completion of the total amount of control indicators of major water pollutants, and help solve the urgent problems faced by water pollution control and governance. It will be helpful to form a scientific management system for water environment protection and provide a scientific and reliable basis for water environmental capacity control and water ecological restoration in the basin.


