Article

Future Climate-Driven Runoff Change in the Large River Basins in Eastern Siberia and the Far East Using Process-Based Hydrological Models

Water Problems Institute, Russian Academy of Sciences, 119333 Moscow, Russia
Water 2022, 14(4), 609; https://doi.org/10.3390/w14040609
Submission received: 21 December 2021 / Revised: 23 January 2022 / Accepted: 15 February 2022 / Published: 17 February 2022
(This article belongs to the Special Issue Climate Changes and Hydrological Processes)

Abstract

:
The main goal of this study was to obtain new results on the physically based future hydrological consequences of climate change in the Amur, Lena, and Selenga River basins by using data from an ensemble of global climate (general circulation) models (GCMs) as boundary conditions in spatially distributed, process-based runoff formation models. This approach provides a basis for a more detailed comparison of the sensitivity of hydrological systems of neighboring large river basins in Eastern Siberia and the Far East. The greatest increases in annual flow are predicted for the Lena River under Representative Concentration Pathway (RCP) 2.6 and RCP 6.0 by the middle and end of the 21st century and for the Selenga River under RCP 6.0 by the end of the 21st century, while the Amur flow anomalies are close to zero. During the 21st century, the greatest relative changes in river flow are predicted for the spring flood, especially for the Lena and Selenga, under both scenarios. The summer–autumn and winter runoff of the Amur River has a negative change of up to 8% for the two RCPs, and, on the contrary, the anomalies are positive for the Lena and Selenga. Evaluating runoff variations between RCPs, we noted high summer–autumn and winter runoff changes for the Amur River under RCP 6.0 for the future period, a significant increase in anomalies of the spring and winter runoff of the Lena under RCP 6.0 by the end of the 21st century, and a greater prevalence of summer–autumn and winter runoff increase for the Selenga River under RCP 2.6 during the 21st century, but it is especially pronounced by its end.

1. Introduction

In the last decade, methods of assessing the regional impact of climate change on the water regime of large rivers using spatially distributed, physically based runoff formation models, in which the boundary conditions are scenarios of meteorological impacts on the river watershed according to general circulation models (GCMs) (e.g., [1,2,3]), have become increasingly common. In addition to calculating climate-driven changes in river flow, this approach can be used to determine contributions to flow generation by physical processes of the hydrological cycle, such as the formation of snow cover and snowmelt, soil freezing and thawing, evaporation, infiltration, and changes in the dynamics of soil moisture, surface and subsurface runoff, etc.
Studies of the hydrological impacts of climate change within the water sector of the international Inter-Sectoral Impact Model Intercomparison Project (ISIMIP) initiated by the Potsdam Institute for Climate Impact Research (PIK, Germany) have significantly promoted the idea of the joint use of regional hydrological and global climate models. Simulation results for river basins located in different continents and physiographic conditions showed that regional hydrological models successfully tested on observational data [4,5] are a more reliable tool for estimating future water regime changes for individual river basins [6]. Different testing methods are used for physically based regional hydrological models [4,7], which significantly reduces the uncertainty of estimates of current and future changes in the water regime of rivers compared to runoff calculations from global hydrological models or climate models [8,9].
Catchment-scale hydrological models allow the detailed consideration of the diversity of river flow formation mechanisms, the spatial distribution of land surface characteristics (relief, soils, and land use/land cover (LULC)), and other features of the river basin. To calculate future changes in water regime, hydrological models use the GCM output data under different Representative Concentration Pathways (RCPs) of global socioeconomic development, which, to a great extent, manifests in the anthropogenic influence on climate change.
Climate change significantly affects the transformation of the hydrological regime of large rivers in the Asian part of Russia. In this regard, studies have been carried out for the major rivers of Siberia and the Far East: the Amur, Lena, and Selenga. The Amur River basin is one of the most flooded territories of Russia, where a catastrophic flood, in terms of damage and duration, occurred in 2013 [10,11]. In addition, high flooding in this basin was then observed in 2019 and 2020. The Arctic Lena basin is characterized by some of the most intense changes in climate and river flow. Since the beginning of the 21st century, the Lena runoff has experienced statistically significant increases [12]. The Selenga River had an extreme low-water period in 1996–2017 [13], followed by several years of high river flows in this basin. These observations have increased the relevance of analyzing the impact of future climatic changes on the water regime of these river basins.
In [14], it was shown that the anomalies of annual runoff for the Amur River basin during the 21st century (relative to the reference period 1986–2005) were insignificant relative to the natural flow variability using the ECOMAG hydrological model and GCM data for various RCPs. Using the ECOMAG model and GCM data in [15], it was shown that the Selenga River runoff will decrease in the 21st century, especially towards the end of the period, when runoff reduction under RCP 6.0 and RCP 8.5 will be 20–40% relative to the reference period 1991–2005. More studies on the hydrological consequences of climate change have been conducted for the Lena basin using runoff formation models and GCM data. Calculations are based on catchment-scale hydrological models from ECOMAG, HBV, HYPE, mHM, MIKE SHE, SWAP, SWAT, SWIM, VIC, and WaterGAP3 [16,17,18,19,20,21]. The overall trend in Lena River flow in the 21st century is related to an increase in annual runoff under various RCPs, mainly due to an increase in snowmelt runoff. According to [22], the anomalies of normal runoff of the Lena River using different GCMs and RCPs will fall in the range of 14–30% by the end of the 21st century.
The main goal of this study was to obtain new results of physically based future hydrological consequences of climate change in the Amur, Lena, and Selenga River basins using the data of an ensemble of GCMs as boundary conditions in spatially distributed process-based runoff formation models. This approach allows future river flow to be calculated according to GCM ensemble data under different RCPs using hydrological models developed on the basis of a unified information base. This provides a basis for a more detailed comparison of the sensitivity of the hydrological systems of neighboring large river basins in Eastern Siberia and the Far East.

2. Materials and Methods
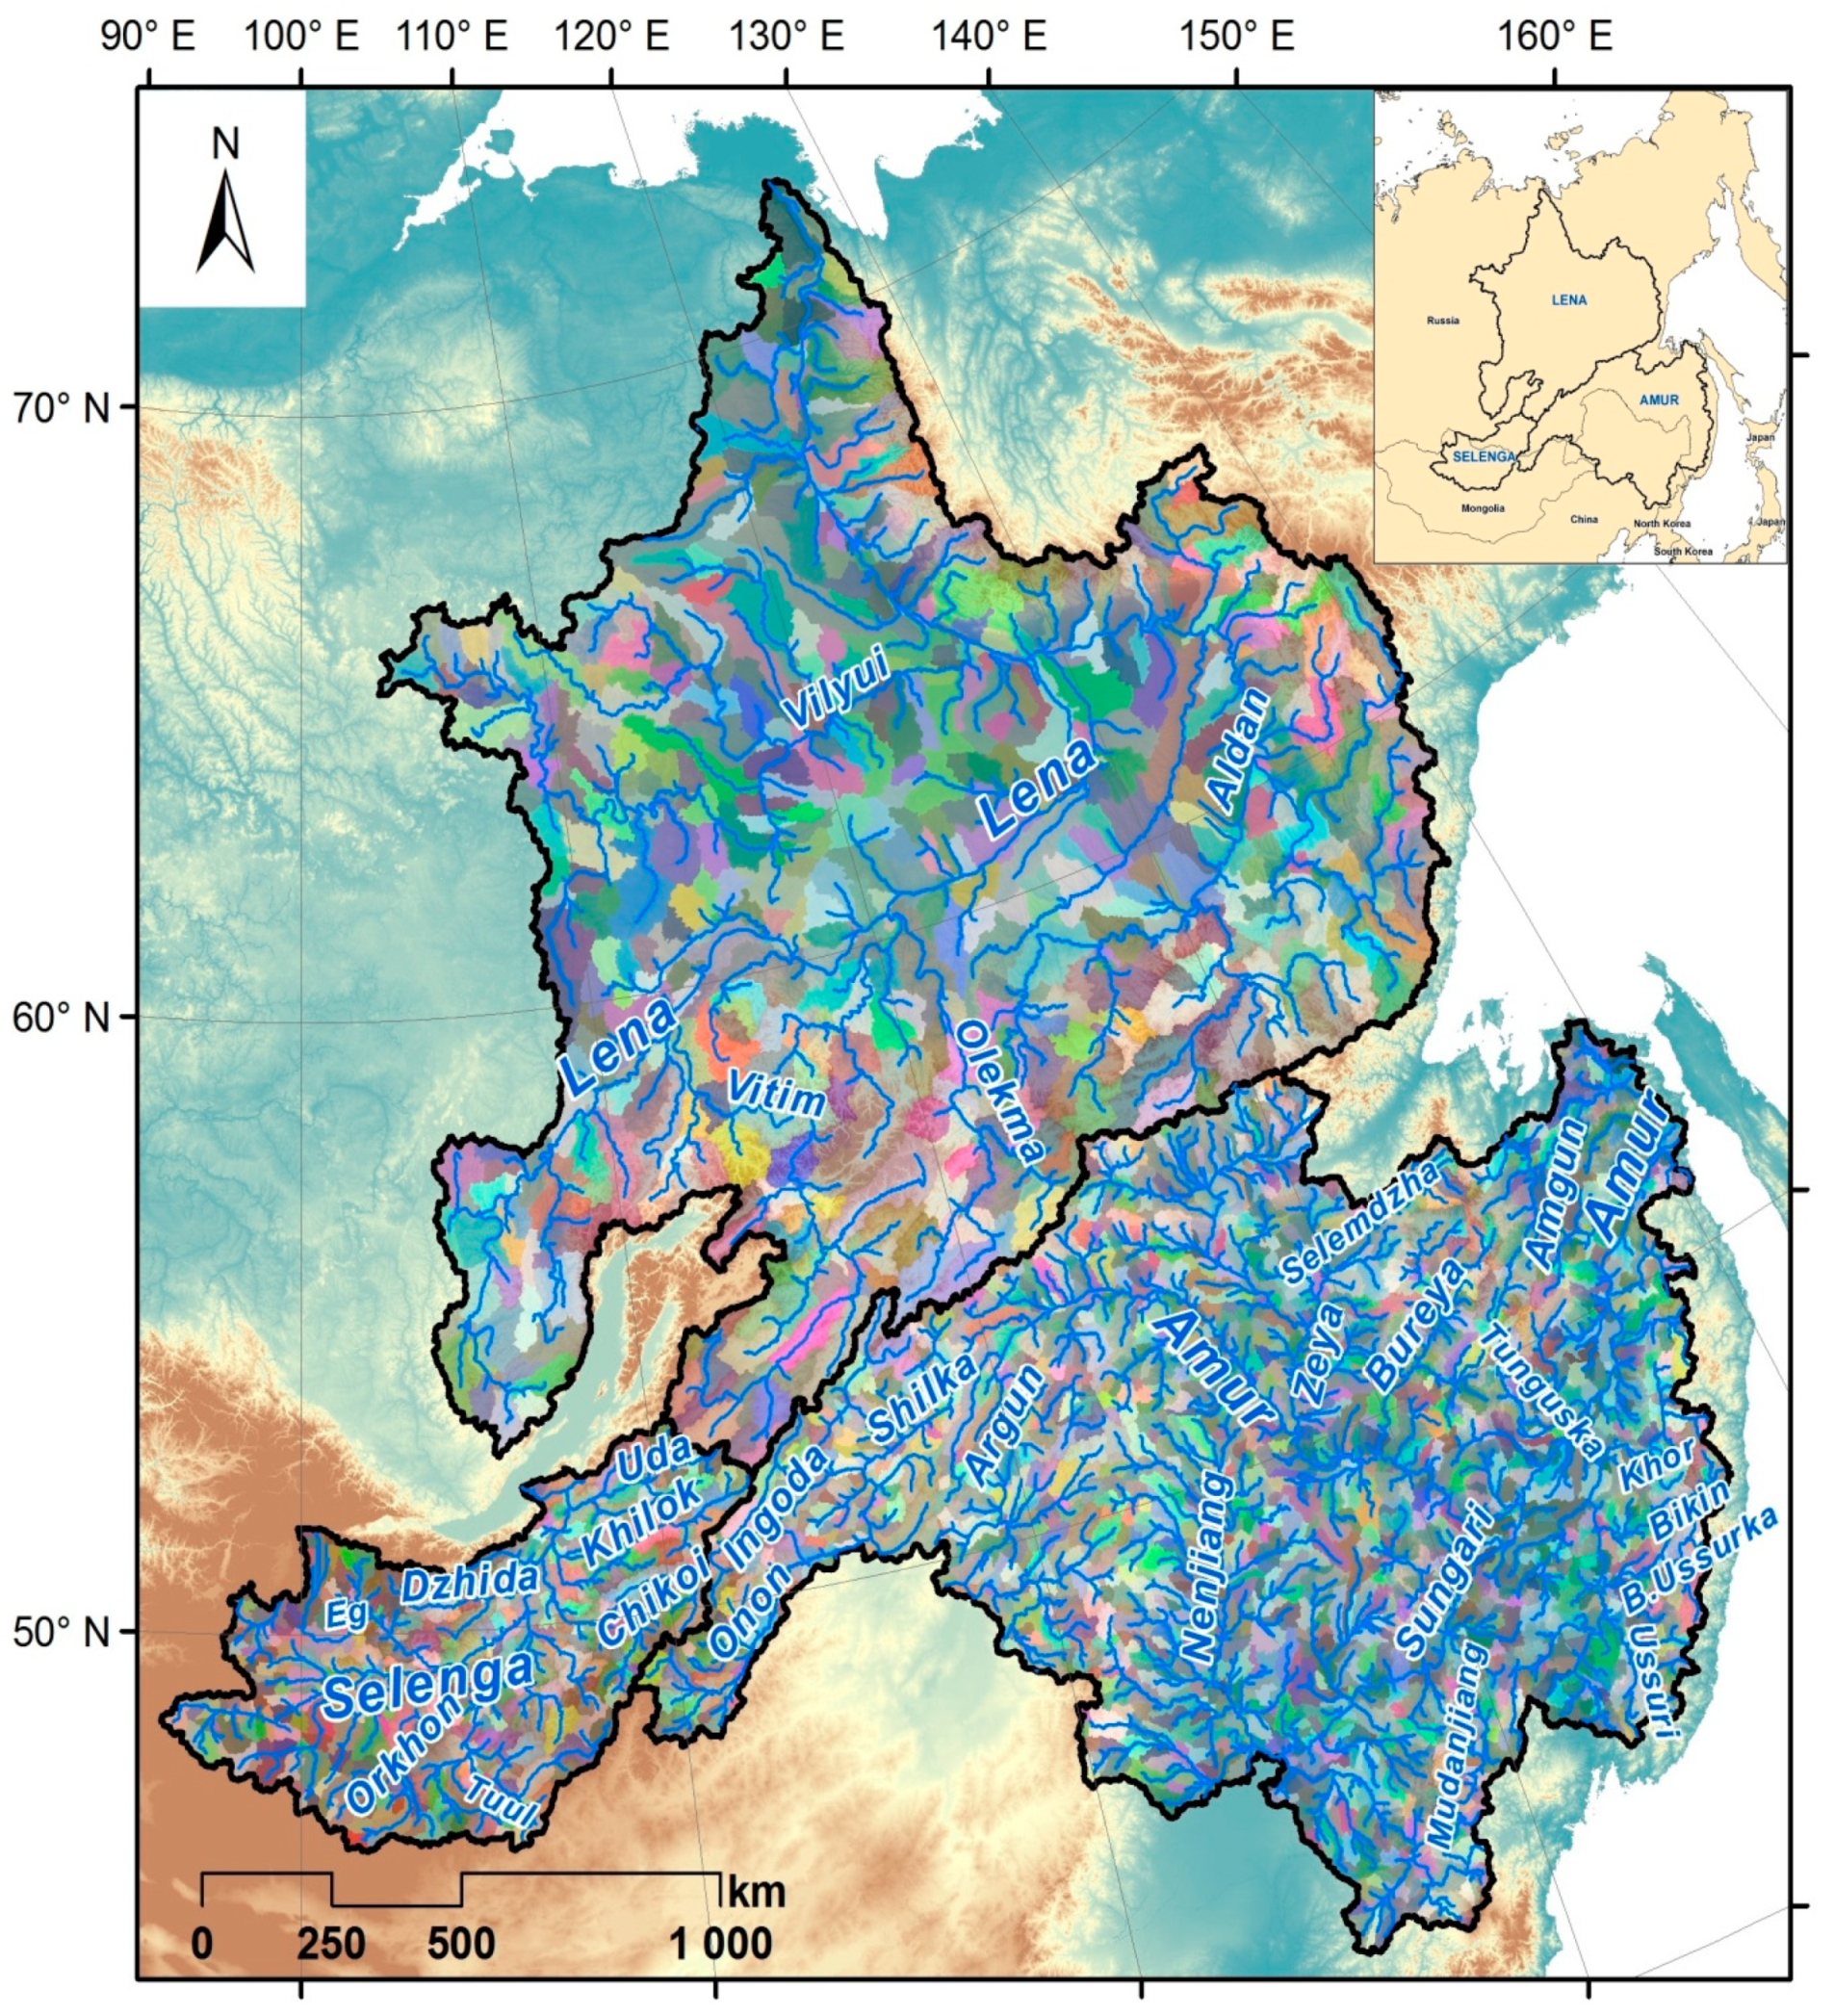
2.1. Study Area

The Amur basin is located between 42° and 56° N, 108° and 142° E. The catchment area of the Amur River is 1,855,000 km2, including 1,003,000 km2 within the Russian Federation, 820,000 km2 within the People’s Republic of China, and 32,000 km2 within Mongolia. The Amur basin is located in a temperate climate zone with monsoon circulation in the atmosphere. The average annual flow is 357 km3. The water regime is characterized by low spring flood, a series of high summer–autumn floods, and a winter low-water period. The main tributaries are the Zeya, Bureya, Sungari, and Ussuri Rivers. To reduce the risk of flooding in the Amur basin, there are several large reservoirs: the Zeya and Bureya in the Russian Federation [23] and Fengman, Baishan, Lianhua, and Nierzi in the People’s Republic of China.
The Arctic Lena River basin is located between 52° and 73° N, 103° and 142° E. The catchment area of the Amur River is 2,490,000 km2. The water regime of the Lena River is characterized by a high spring flood, summer–autumn floods, and low winter runoff. The average annual flow is 530 km3. The main tributaries are the Aldan, Vilyui, Vitim, and Olekma Rivers. The Vilyui Reservoir is in the Lena basin.
The Selenga River is the main tributary of Lake Baikal. The Selenga basin is located between 46° N and 53° N, 96° E and 113° E. The catchment area of the Lena River is 447,000 km2, and 67% and 33% of the catchment area belong to Mongolia and Russia, respectively. The water regime is characterized by a low spring flood, a series of high summer–autumn floods, and low winter runoff. The average annual flow is 27.8 km3. The main tributaries of the Selenga River are the Orkhon, Eg, Chikoi, Khilok, Uda, and Dzhida Rivers.

2.2. Hydrological Models

The runoff generation models of the studied river basins were developed based on the ECOMAG software with a daily time step and spatial resolution equal to the size of hydrological response units (HRUs), which can be used to describe the spatial distribution of snow cover formation and snowmelt over the watershed, evapotranspiration, soil freezing and thawing, vertical heat and moisture transfer in frozen and unfrozen soil, surface, subsurface and groundwater runoff, and routing flow in the river system, taking into account the influence of reservoirs. Modeling of hydrological processes at each HRU was performed for four levels: the topsoil layer, horizon of caliche, groundwater, and prechannel flow. During the cold season, snow cover was added. In the model, the subsurface and groundwater flow is described according to the Darcy equation, and the prechannel and streamflow are described by the kinematic wave equation. The total porosity in the soil aeration zone is divided into capillary and noncapillary zones. Potential evaporation was estimated according to the Dalton method. The snowmelt rate was calculated using the degree-day method. The phase transformation of precipitation depends on the air temperature. The evaporation of solid and liquid phases of snow was estimated using data on the air humidity deficit. When calculating infiltration of rain- and meltwater into frozen soil, the effect of ice content in frozen soil on the hydraulic conductivity of the soil was taken into account. A detailed description of the structure and runoff generation processes in the ECOMAG model is presented in [24,25,26]. The ECOMAG model was used for large watersheds of lowland rivers in European Russia [27,28,29,30,31], Arctic rivers [9,16,22,32], a small permafrost watershed [33], and mountain rivers with glacial runoff [34], as well as rivers with summer–autumn floods [15,35] and medium-sized semi-mountain rivers [26,36,37]. A description of the runoff generation model is given for the Amur River basin in [35], for the Lena River basin in [38], and for the Selenga River basin in [15,39].
Schematization of the river network and river basins as a set of HRUs was performed based on the HYDRO1k digital elevation model (DEM) with a spatial resolution of 1 km. The total number of constructed HRUs was 1947 in the Amur basin with an average area of 950 km2, 664 in the Lena basin with an average area of 3700 km2, and 469 in the Selenga basin with an average area of 970 km2 (Figure 1). The less detailed schematization of the Lena basin can be explained by the large catchment area of the calibration gauges, which do not require excessive detail when dividing the basin into HRUs.
Global databases were used to determine the model parameters distributed over the watersheds: the Harmonized World Soil Database and the Global Land Cover Characterization database. The meteorological input database includes time series of daily values of air temperature and relative humidity and precipitation measured at weather stations (Table 1) or according to the EWEMBI meteorological reanalysis with a regular spatial grid of 0.5° × 0.5° [40].
A database of hydrological characteristics was prepared for model calibration, which includes daily discharges at various gauges in the Amur, Lena, and Selenga basins, as well as discharges from the Zeya, Bureya, and Vilyui reservoirs. Due to the lack of data on discharges from Chinese reservoirs in the Sungari River basin, the reservoirs are described similarly to lakes using the linear capacity model. Similarly, the model takes into account discharge from Lake Khanka in the Amur River basin and from Lake Khubsugul in the Selenga River basin. Using the estimates of calculation efficiency proposed in [41] based on the combination of NSE, KGE, and PBIAS criteria, it was assumed that in the calculation of hydrographs, results are considered good if 0.70 ≤ NSE ≤ 1, 0.70 ≤ KGE ≤ 1 and |PBIAS| ≤ 15% and satisfactory if 0.50 ≤ NSE < 0.70, 0.50 ≤ KGE < 0.70 and 15% < |PBIAS| ≤ 25%.
Spatial calibration of the basin model parameters was carried out for the period 1994–2003 at 15 gauges with catchment areas from 7560 to 1,790,000 km2 for the Amur River and at 7 gauges with catchment areas from 115,000 to 2,460,000 km2 for the Lena River basin [15,35,38]. The models were validated for the same gauges using independent hydrological data for the period 2004–2013. A model calibration period of 1984–1993 was chosen for the Selenga River basin, and a validation period of 1994–2003 was chosen to assess the performance of the runoff formation model for both the high-water period before 1995 and the subsequent low-water period. Evaluation of modeling efficiency was carried out for 4 gauges with a catchment area from 282,000 to 445,000 km2.

2.3. Hydrological Modeling Using the GCM Output Data for the Historical Period

In order to reduce the existing uncertainties and increase the spatial detail of climate projections, numerical experiments with regional hydrological models for the studied river basins involved the use of daily values of surface air temperature, humidity, and precipitation, which were calculated using the ensemble of four GCMs-CMIP5 (GFDL-ESM2M, HadGEM2-ES, IPSL-CM5A-LR, MIROC-ESM-CHEM) from the ISIMIP2b project. The data were prepared by converting the primary estimated daily mean meteorological data for the historical period to the EWEMBI reanalysis data according to the bias correction procedure described in [42]. Data for the future period were climate projections in a 0.5° × 0.5° spatial grid up to 2099 under different RCPs [43]. At the same time, calculations were made according to RCP 2.6 as the optimal scenario and according to RCP 6.0, because it corresponds to the current rates of climate change in Eastern Siberia and the Far East to the greatest extent [38]. RCP 4.5 projections fall within the range of the two scenarios mentioned above, and RCP 8.5 was not considered due to its excessive extremity and weak realism in terms of its annual and seasonal values.
Numerical experiments using the developed runoff generation models and the GCM output data did not take into account the flow regulation by reservoirs located in the Amur and Lena basins, since the response of the natural hydrological system to climate change was investigated. To assess the reproduction of river flow simulated by GCMs for the reference period (1970–1999 for the Amur and Lena Rivers; 1981–2005 for the Selenga), a comparison was made with the calculation results based on data from weather stations (the Amur and Lena basins) or reanalysis (the Selenga basin).

2.4. Changes in Air Temperature and Precipitation Using the GCM Output Data for the Future Period

First, the anomalies of air temperature and precipitation for the studied river basins during the 21st century were estimated relative to the values determined for the historical reference period (1970–1999 for the Amur and Lena Rivers; 1981–2005 for the Selenga River). Anomalies of basin-averaged meteorological values (in degrees Celsius for air temperature and in percent for precipitation) were calculated for each of the four GCMs and then averaged over the ensemble for each RCP scenario and the 30-year period corresponding to the middle (2036–2065) and end (2070–2099) of the 21st century. In order to compare the three river basins, a unified division of the year into seasons was performed: winter (November–March), spring (April–May), summer (June–August), and autumn (September–October).
To assess the spatial and temporal variability of climatic characteristics, maps of mean annual air temperature and precipitation were constructed based on the calculation results of runoff formation models for HRUs in the Amur, Lena, and Selenga basins using GCM data under RCP 2.6 and RCP 6.0 for the middle and end of the 21st century. Then, these distributions were compared with those determined using GCM data for the historical period, and anomalies of mean annual air temperature and precipitation were determined.

2.5. Hydrological Modeling Using the GCM Output Data for the Future Period

At this stage, projections of daily meteorological values according to GCMs under RCPs during the 21st century were used as the input data of runoff formation models of Amur, Lena, and Selenga Rivers, the water regime characteristics of which were calculated with a daily time step and a spatial resolution equal to HRU size. Hydrological modeling during the 21st century was carried out with the same parameters that were set for the historical period.
During the 21st century, runoff anomalies were estimated similarly to the calculations for climatic characteristics. Calculations were performed for each of the four GCMs, and then ensemble averaging was carried out for each RCP and the 30-year period corresponding to the middle (2036–2065) and end (2070–2099) of the 21st century. The river flow was divided into seasons as follows: spring flood for the Amur (April–June), the Lena (May–June), and the Selenga (April–May); summer–autumn flood period for the Amur (July–October), the Lena (July–October), and the Selenga (June–October); and winter low-water period for the Amur (November–March), the Lena (November–April), and the Selenga (November–March). This choice is explained by climatic parameters, the size of catchments, the travel time of streamflow to outlet gauges for which the calculation results are presented, and the features of the water regimes of large tributaries of the studied rivers. The detection of statistical significance of climatically determined changes in river runoff was performed using the Mann–Whitney U-test [44]. Calculations were performed at 5% significance level.
Flow duration curves (FDCs) of daily discharges of the studied rivers for the historical period and the middle and end of the 21st century under RCP 2.6 and RCP 6.0 were plotted to assess the trend of high and low flow. Boxplots were constructed to compare daily flow anomalies of different exceedance probabilities (Q10, Q90). To assess the spatial and temporal variability of hydrological characteristics, mean annual runoff rate maps were constructed based on the simulation results for HRUs in the Amur, Lena, and Selenga basins according to GCMs by the middle and end of the 21st century under two RCP scenarios. Then, these maps were compared with those constructed using GCM data for the historical period.

3. Results and Discussion

3.1. Hydrological Models

Figure 2 and Figure 3 show observed and simulated daily hydrographs for outlet gauges of the Amur, Lena, and Selenga Rivers for the periods of model calibration and validation. The calculation results of statistical criteria allow us to conclude that the modeling of the Amur and Lena runoff using data from weather stations and the Selenga runoff using reanalysis data is good (Table 2). In addition, criteria were observed to have low sensitivity in the transition from the calibration period to the validation period, which indicates the robustness of the hydrological models.

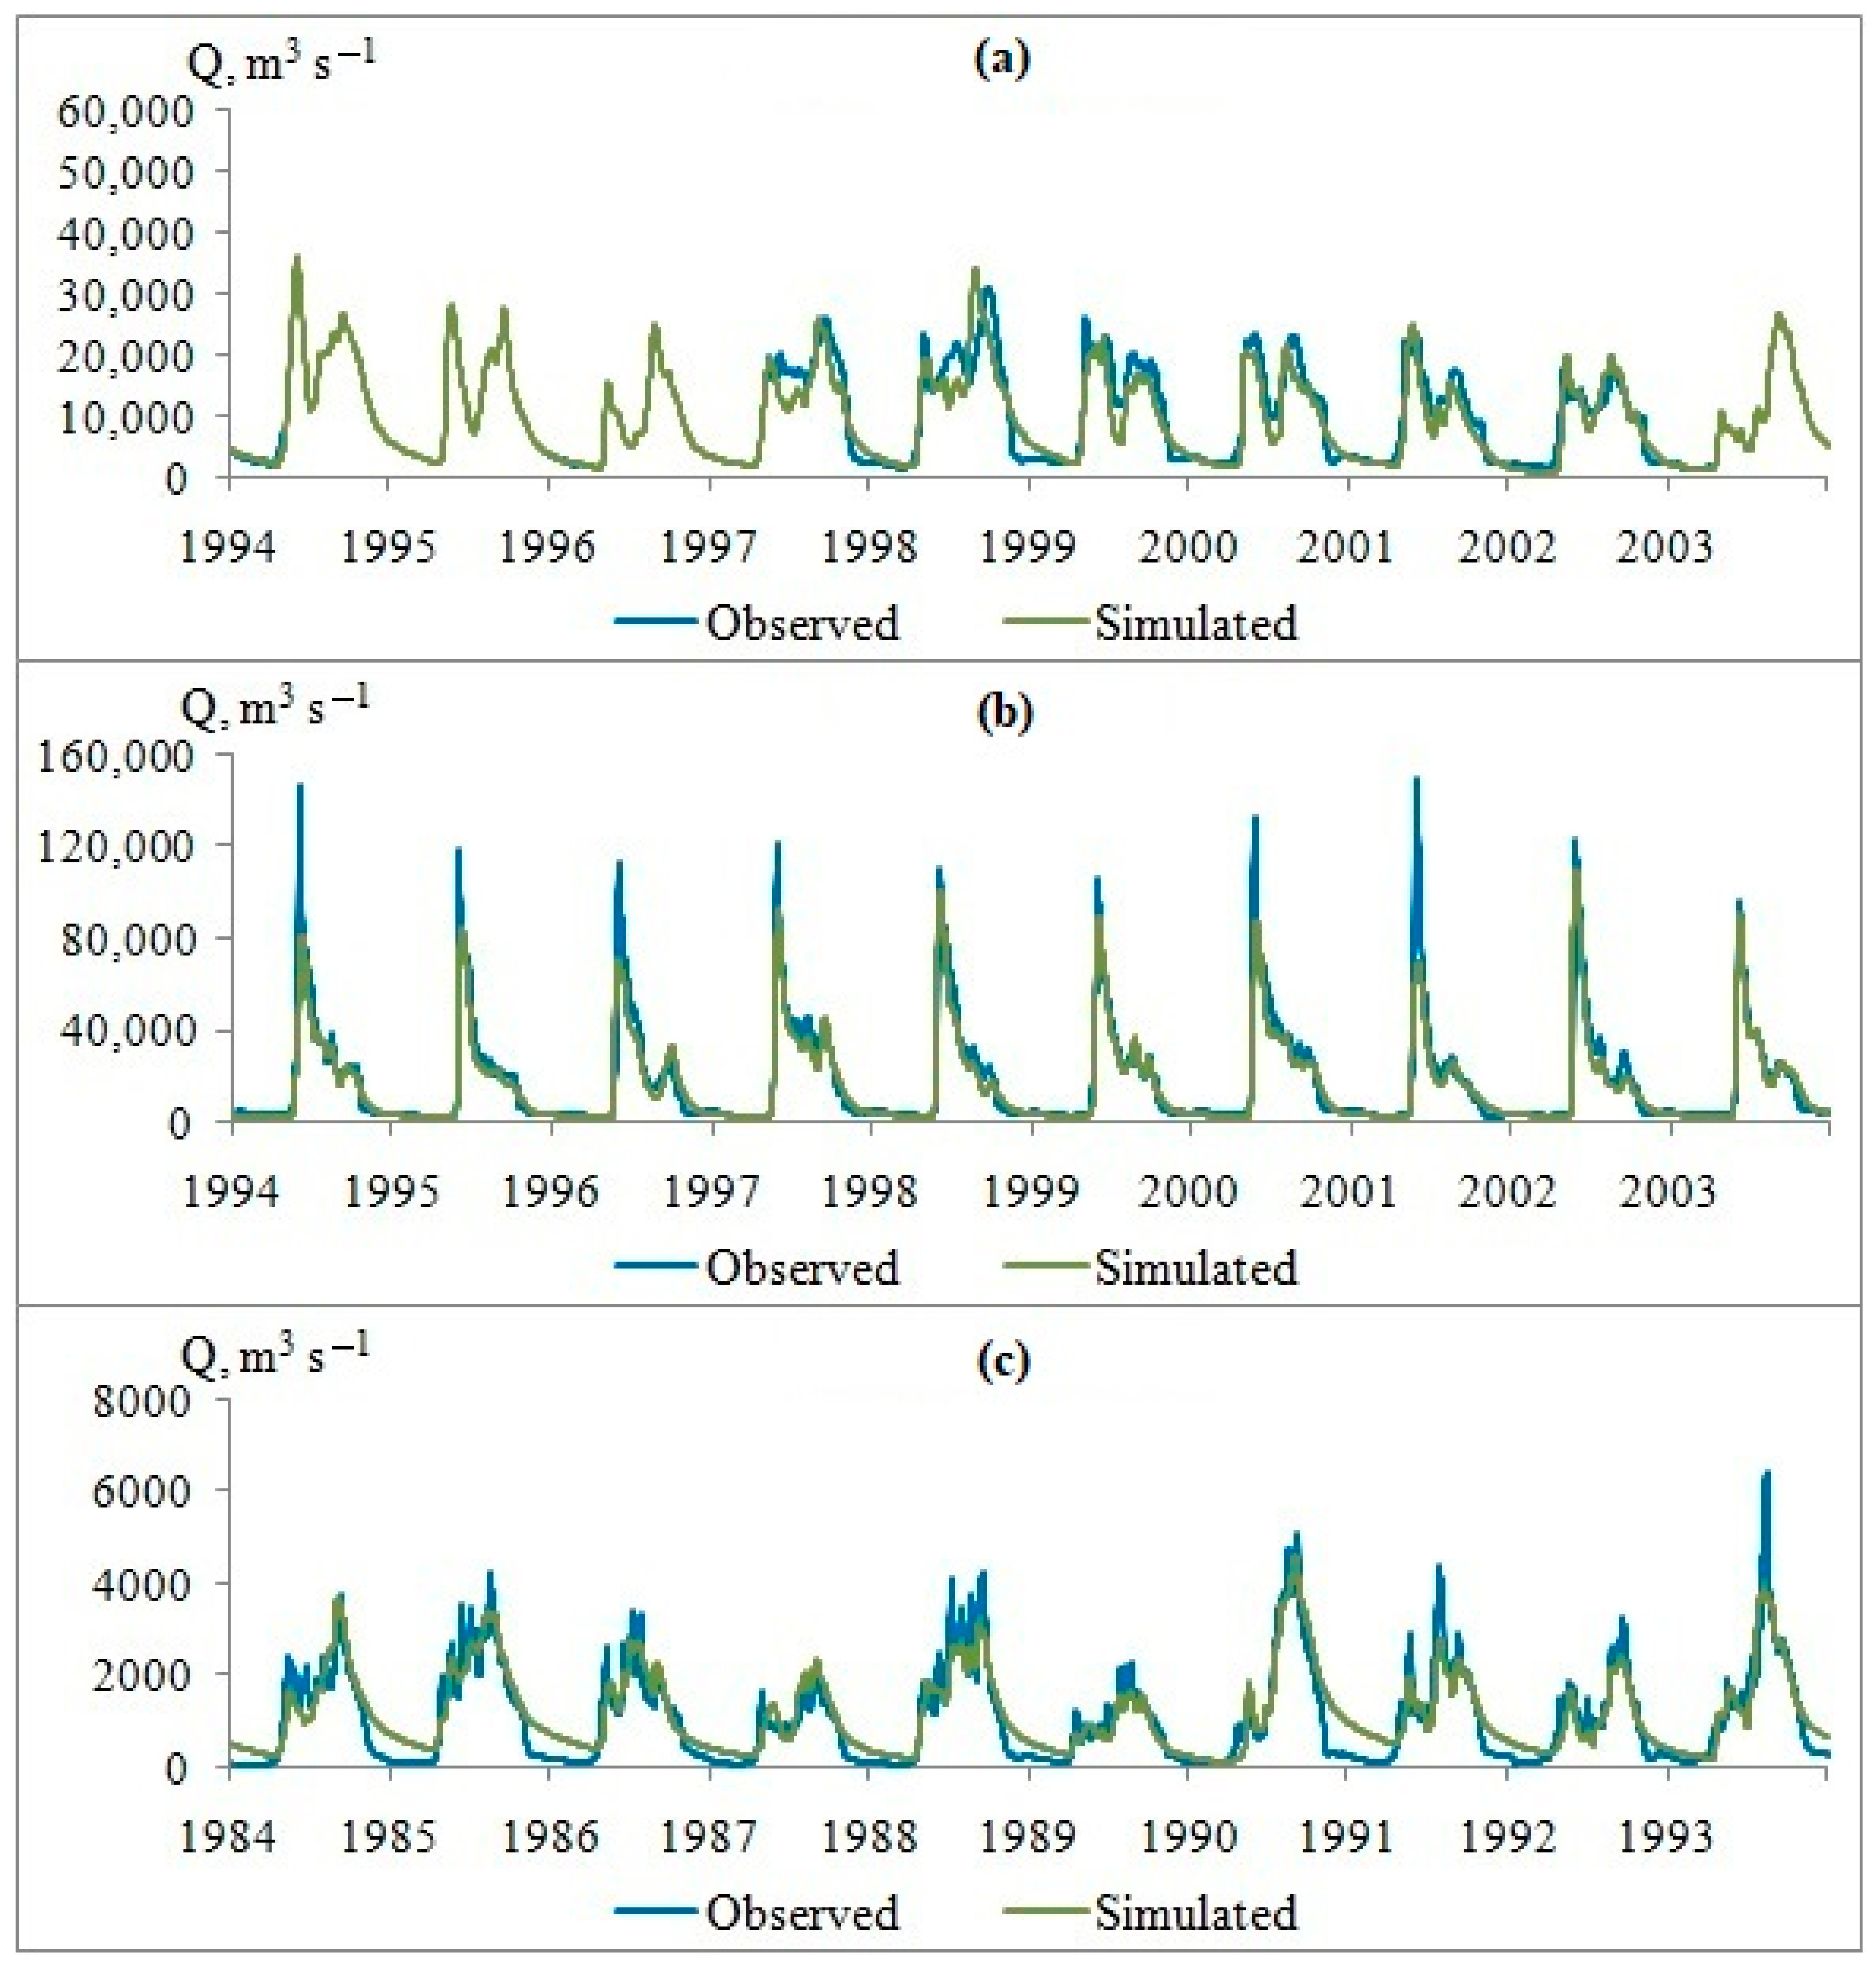
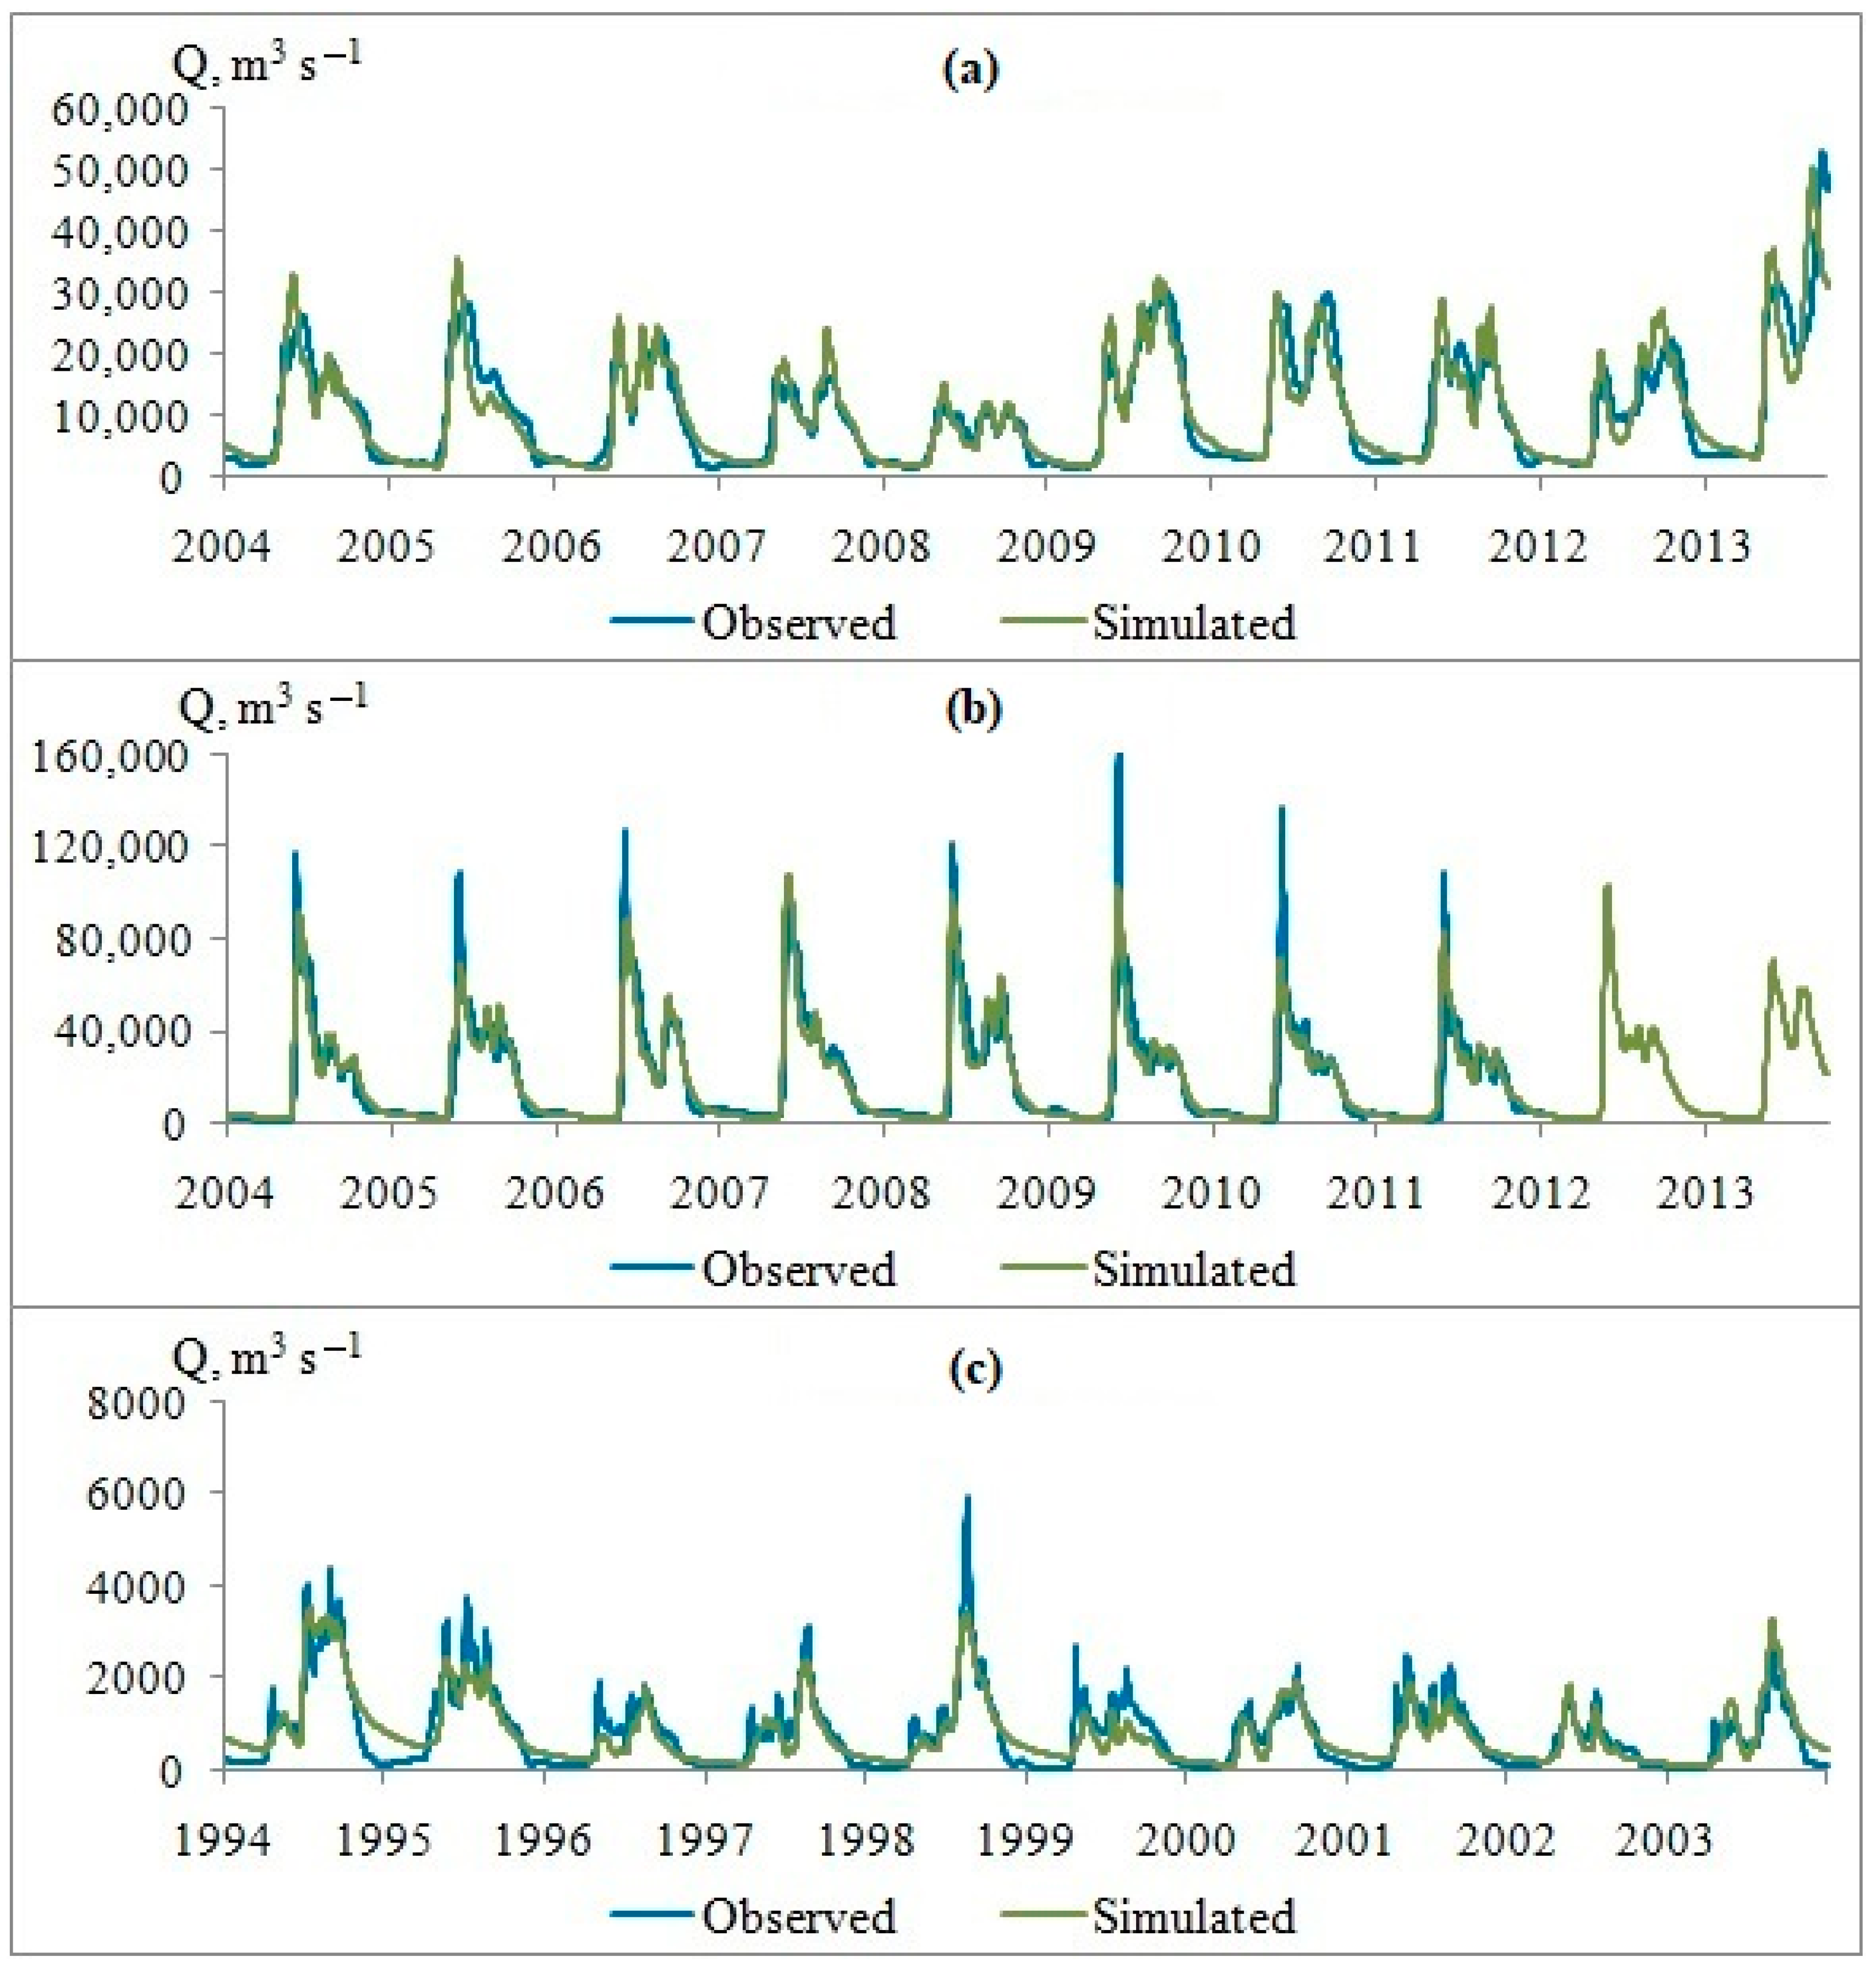
3.2. Hydrological Modeling Using the GCM Output Data for the Historical Period

When comparing the normal monthly runoff simulated using GCM data for the historical reference period to the calculations of the Amur runoff using weather station data, the flow during the spring flood was overestimated by 22%, and the flow during summer–autumn floods was underestimated by 6% [38]. According to GCM data, the Lena River was characterized by a flow overestimation of 10% in June. According to GCM data for the Selenga basin, flow overestimation of 16% in June and underestimation of 10% from August to October were observed. The calculation results of the normal annual runoff using GCM data for the reference period were more accurate. According to the GCM ensemble data, the relative error in calculating the runoff was 2.5% for the Amur River, 3.7% for the Lena River, and 5% for the Selenga River.

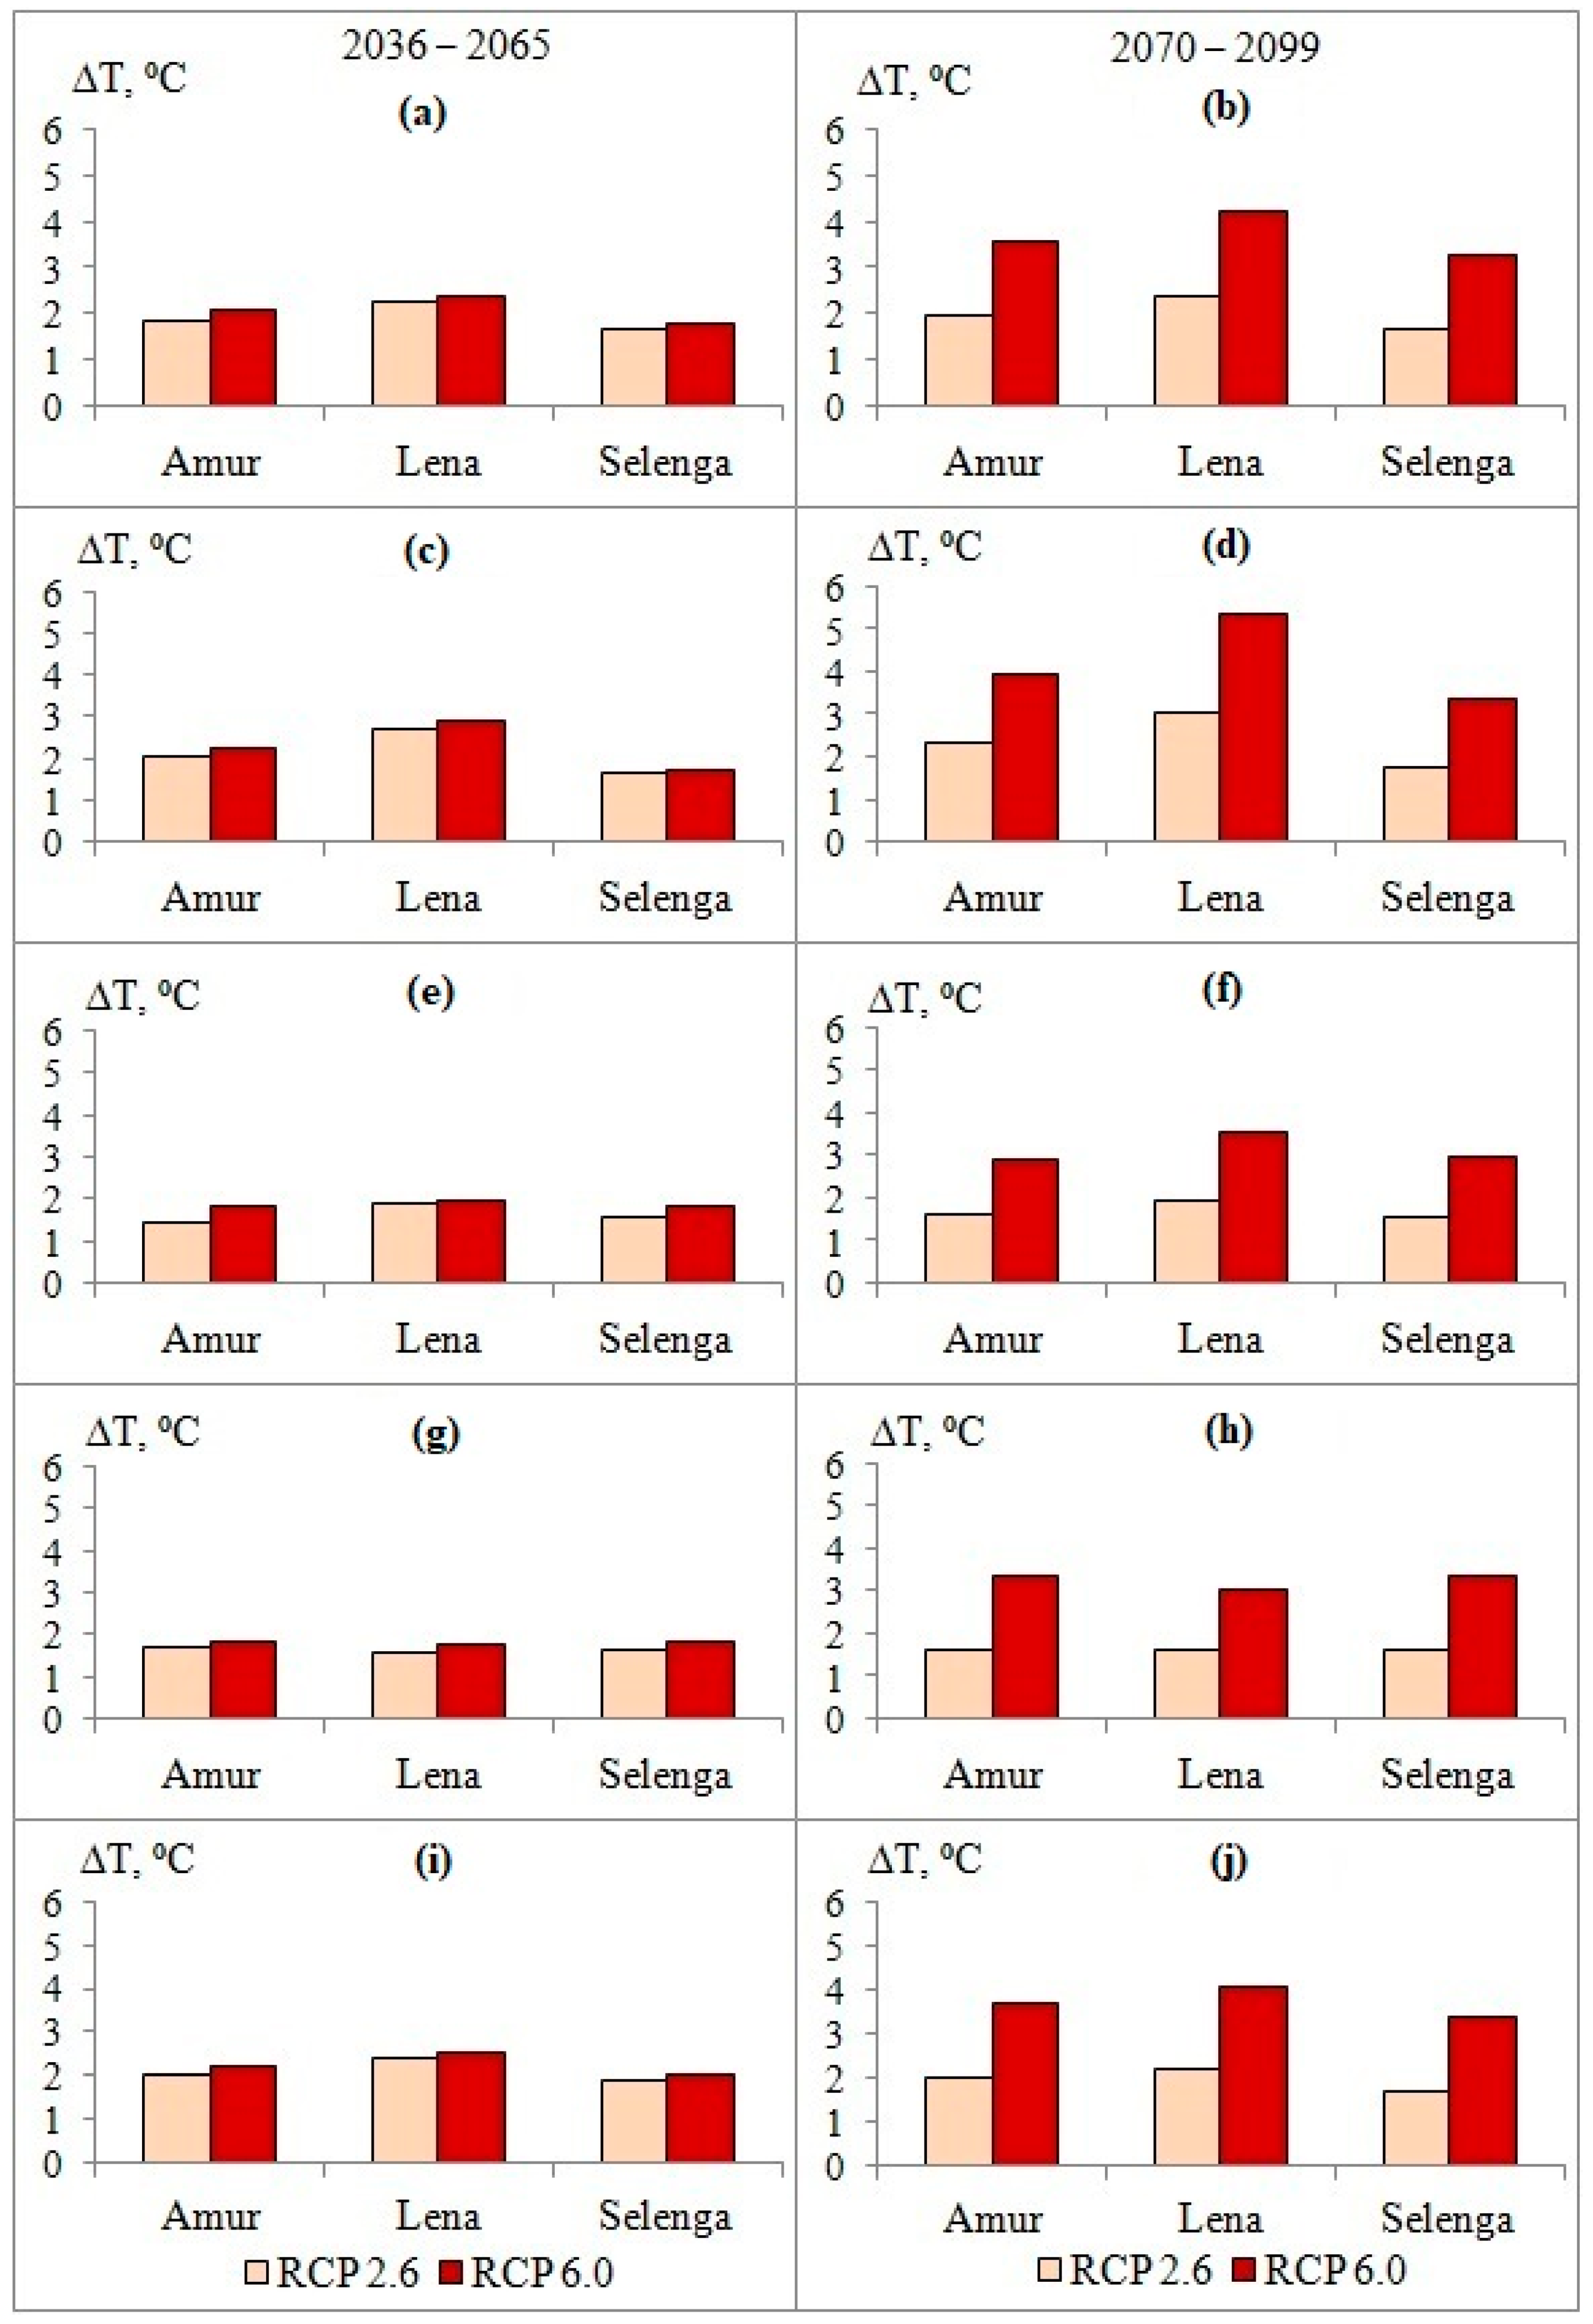
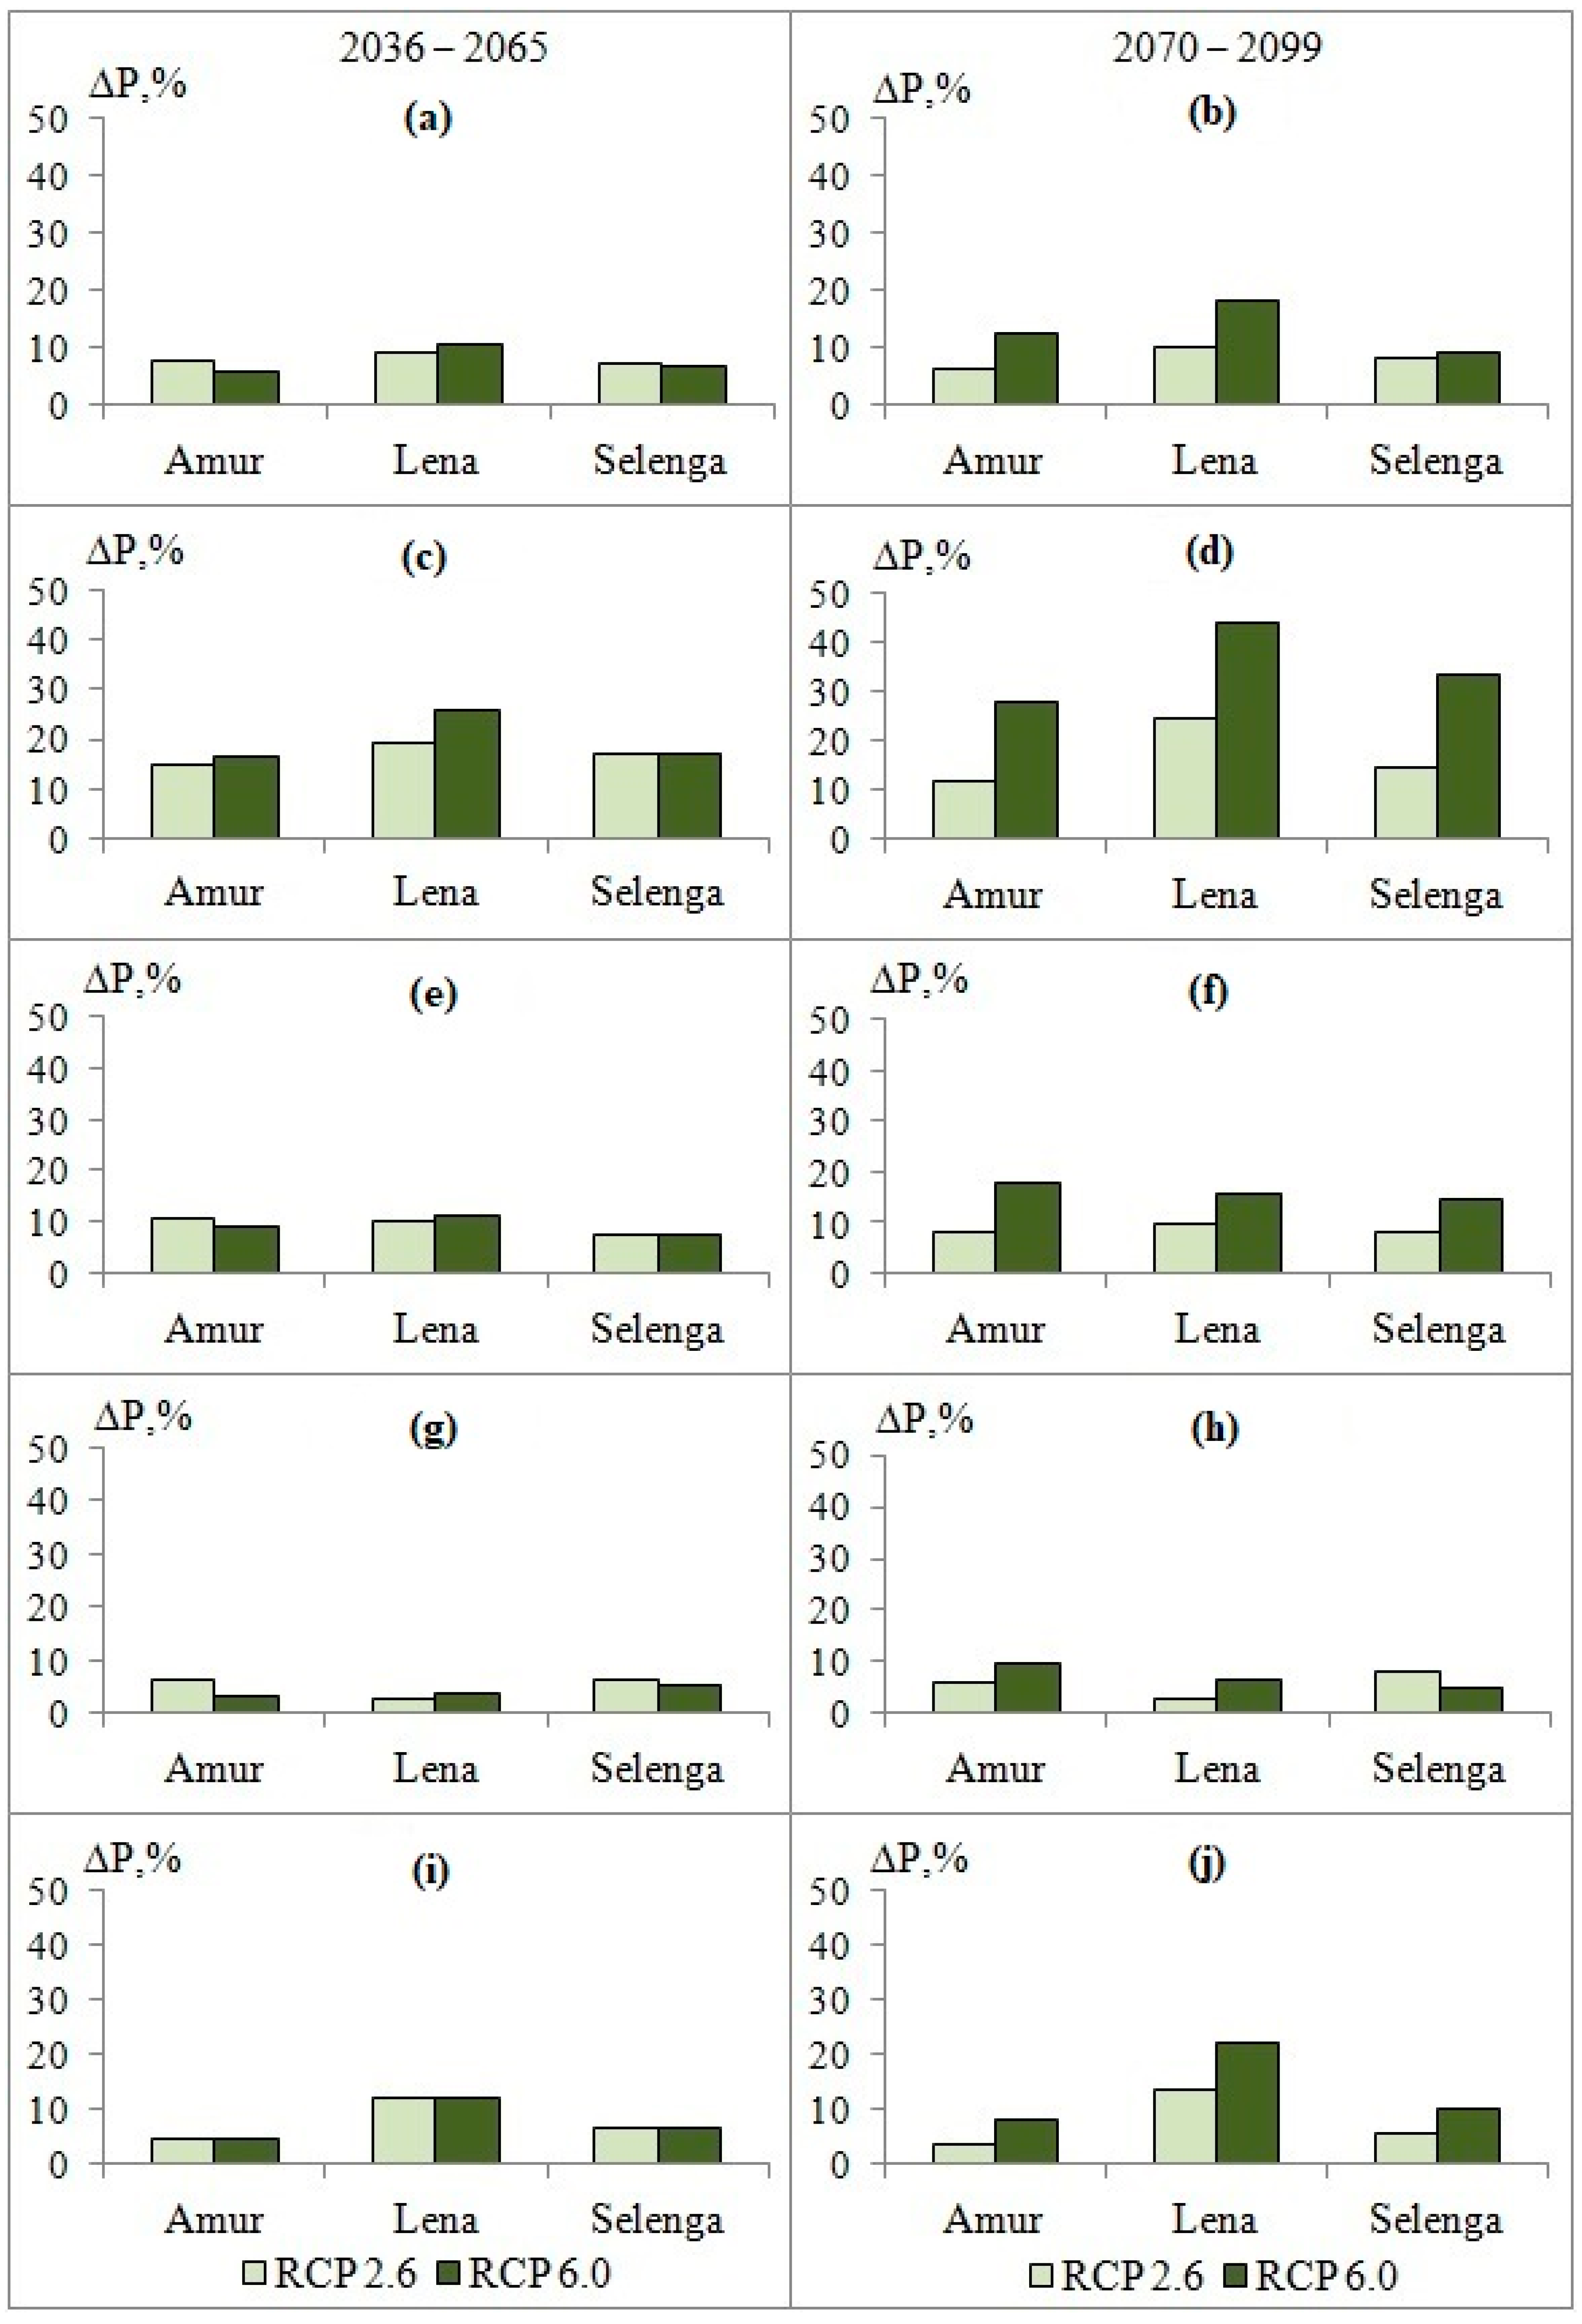
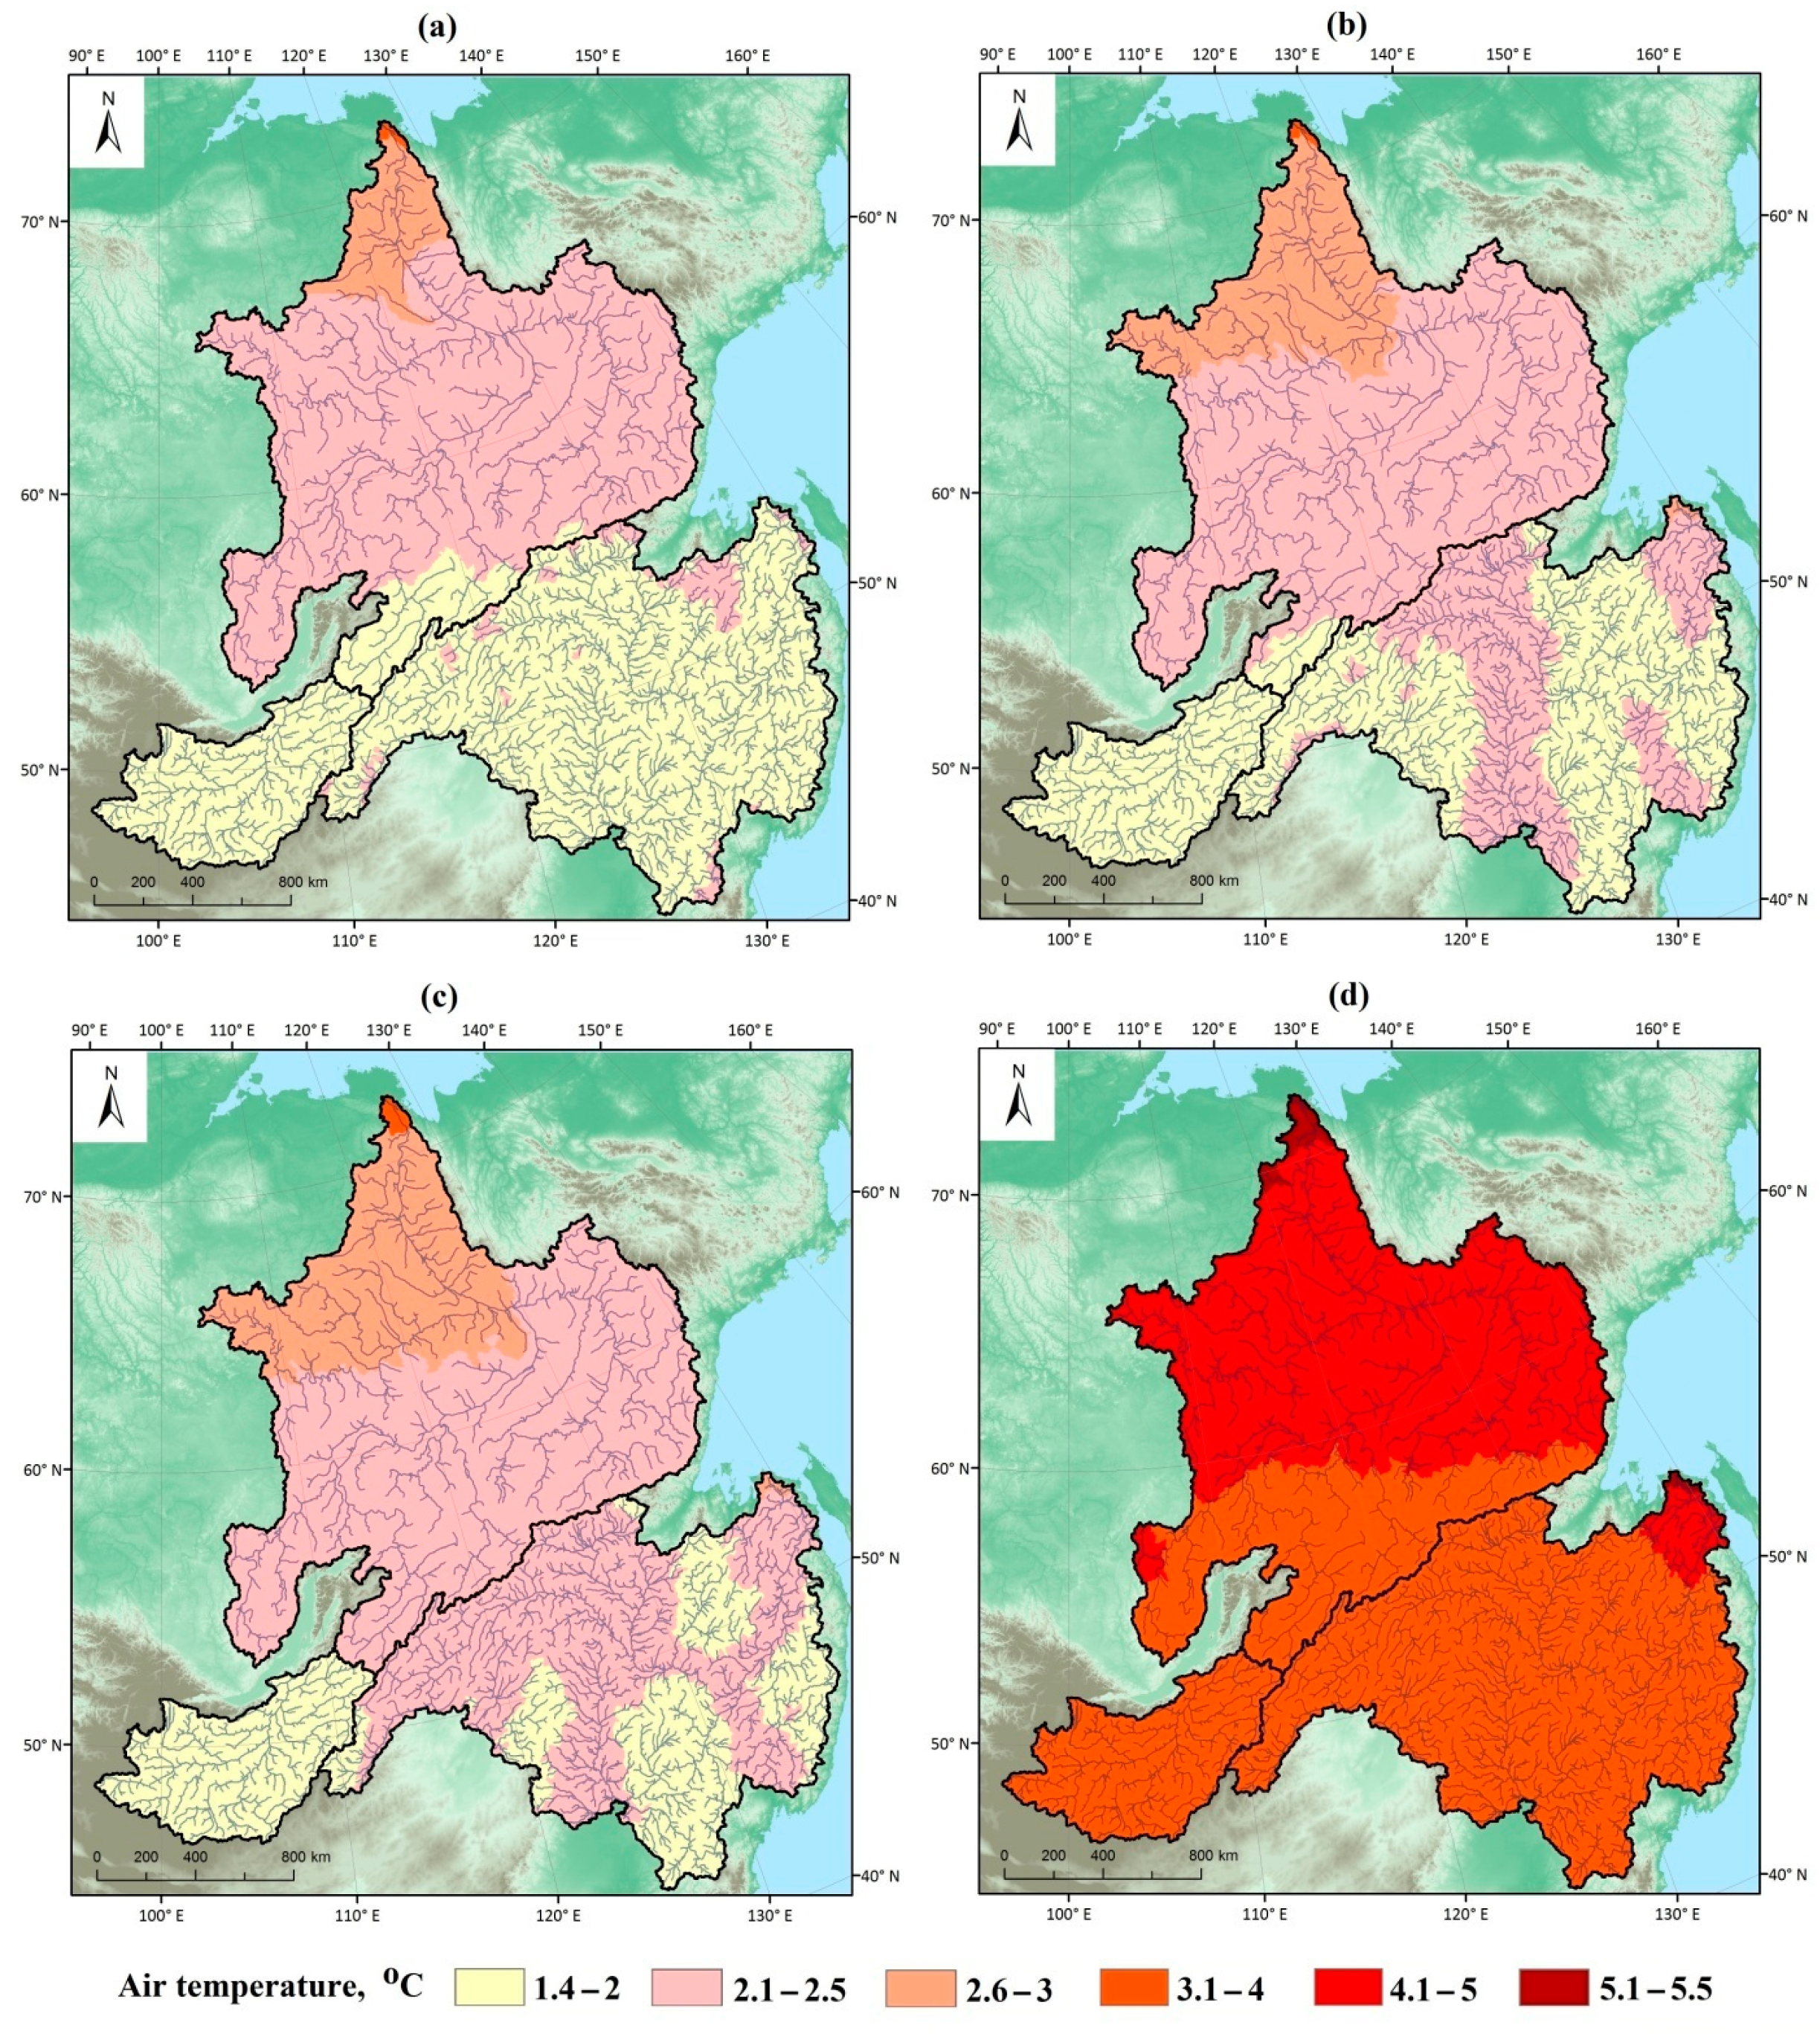
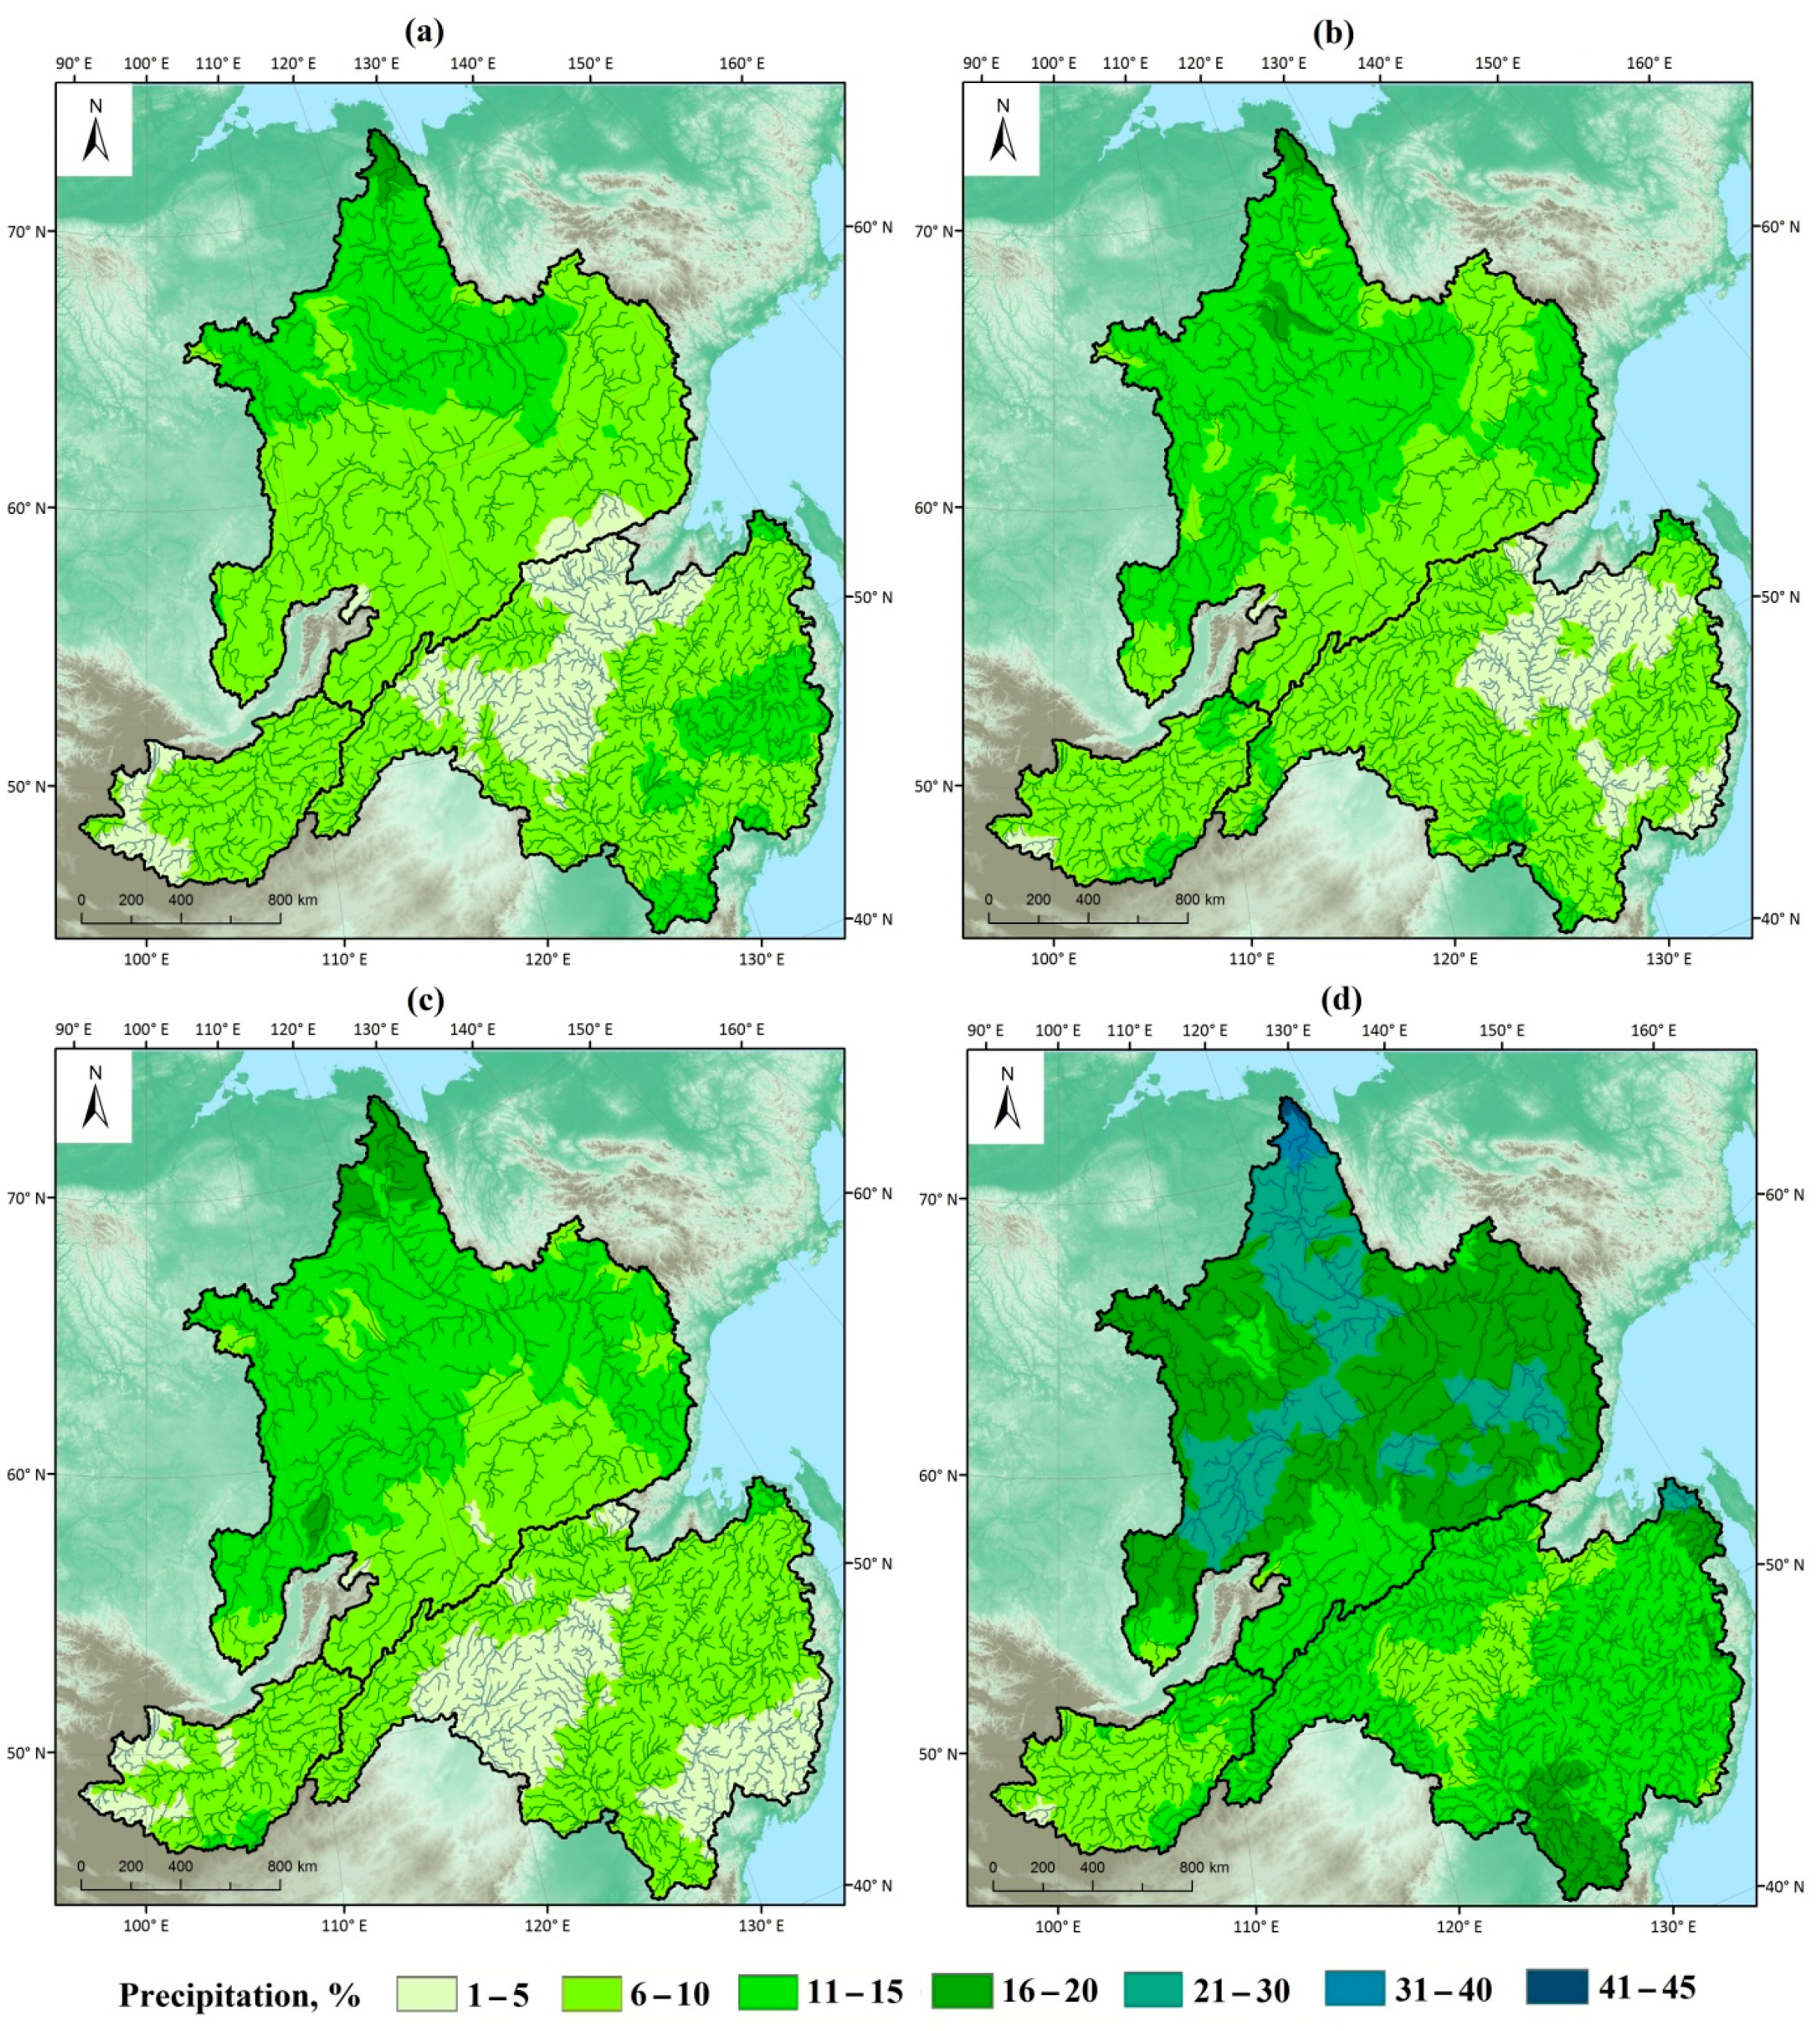
3.3. Changes in Air Temperature and Precipitation Using the GCM Output Data for the Future Period

The assessment of anomalies of basin-averaged climatic characteristics of the Amur, Lena, and Selenga Rivers by the middle (2036–2065) and end (2070–2099) of the 21st century relative to the historical period showed the following results. Both mean annual and seasonal air temperatures for the three river basins are predicted to increase, and annual and seasonal precipitation is also predicted to increase. According to RCP 2.6, the increase in mean annual air temperature will be 1.8 °C in the Amur basin, 2.2 °C in the Lena basin, and 1.7 °C in the Selenga basin by the middle of the 21st century and 2 °C, 2.4 °C, and 1.7 °C by the end of the 21st century, respectively (Figure 4). According to RCP 6.0, the increase in mean annual air temperature will be 2.1 °C in the Amur basin, 2.4 °C in the Lena basin, and 1.8 °C in the Selenga basin by the middle of the 21st century and 3.6 °C, 4.2 °C, and 3.3 °C by the end of the 21st century, respectively. According to RCP 2.6, the increase in annual precipitation will be 7% in the Amur basin, 9% in the Lena basin, and 7% in the Selenga basin by the middle of the 21st century and 6%, 10%, and 8% by the end of the 21st century, respectively (Figure 5). According to RCP 6.0, the increase in annual precipitation will be 6% in the Amur basin, 11% in the Lena basin, and 7% in the Selenga basin by the middle of the 21st century and 12%, 18%, and 9% by the end of the 21st century, respectively.
Thus, the largest increase in mean annual air temperature is found for the Lena basin, and the smallest is for the Selenga basin. The difference in warming between RCP 2.6 and RCP 6.0 by the middle of the 21st century is not significant for the three basins but is predicted to increase significantly by the end of the 21st century. The largest increase in annual precipitation is predicted for the Lena basin. A significant increase in precipitation anomalies (almost twofold) is noted for the Amur and Lena basins under RCP 6.0 compared to RCP 2.6.
The calculation results of changes in seasonal meteorological values are presented below. According to RCP 2.6, by the middle of the 21st century, the warming in the Amur, Lena, and Selenga basins will be 1.6–2.7 °C in winter, 1.4–1.9 °C in spring, 1.7 °C in summer, and 1.9–2.4 °C in autumn; by the end of the 21st century, it will be 1.8–3 °C in winter, 1.6–1.9 °C in spring, 1.6–1.7 °C in summer, and 1.7–2.2 °C in autumn (Figure 4). According to RCP 6.0, by the middle of the 21st century, the warming will be 1.7–2.9 °C in winter, 1.8 °C in spring and summer, and 2–2.5 °C in autumn; by the end of the 21st century, it will be 3.4–5.3 °C in winter, 2.9–3.5 °C in spring, 3.0–3.4 °C in summer, and 3.3–4.1 °C in autumn. According to RCP 2.6, by the middle of the 21st century, the increase in precipitation in the Amur, Lena, and Selenga basins will be 15–19% in winter, 8–11% in spring, 3–6% in summer, and 4–12% in autumn; by the end of the 21st century, it will be 12–25% in winter, 8–9% in spring, 3–8% in summer, and 4–14% in autumn (Figure 5). According to RCP 6.0, by the middle of the 21st century, the increase in precipitation will be 17–26% in winter, 7–11% in spring, 3–5% in summer, and 5–12% in autumn; by the end of the 21st century, it will be 28–44% in winter, 15–18% in spring, 5–10% in summer, and 8–22% in autumn.
The largest seasonal increase in air temperature is predicted for the Lena basin in the autumn–winter period for the two RCPs and periods. A similar trend is noted for the Amur basin but with smaller values of anomalies. There will be relatively even seasonal warming in the 21st century under RCPs for the Selenga basin. Under the two RCPs, winter makes the largest contribution to the increase in precipitation, and summer makes the smallest. A more intensive increase in autumn–winter precipitation is noted for the Lena basin and in summer precipitation for the Amur and Selenga basins. The three rivers are predicted to undergo significant increases in seasonal air temperature and precipitation by the end of the 21st century under RCP 6.0.
The results of estimation of spatial and temporal variability of mean annual air temperature and precipitation based on the results of runoff formation model calculations for HRUs in the Amur, Lena, and Selenga basins using GCM data by the middle and end of the 21st century under RCPs relative to the historical period are given below. By the middle of the 21st century, the increase in mean annual air temperature under RCP 2.6 will be 1.4–2 °C for the Amur and Selenga basins, 2–2.5 °C in most of the Lena basin, 2.5–3 °C in the Lower Lena, and 1.4–2 °C in the Upper Vitim (Figure 6). By the end of the 21st century, the increase in mean annual air temperature under RCP 2.6 will be 1.4–2 °C in the Selenga basin; 2–2.5 °C in the Amur basin for the Upper and Lower Amur, Zeya, Sungari, and left tributaries of Ussuri, and 1.4–2 °C for the remainder of the Amur basin; and 2–2.5 °C in most of the Lena basin, Lower Lena, and left tributaries of Vilyui. By the middle of the 21st century, the rate of warming under RCP 6.0 will be similar to that under RCP 2.6 by the end of the 21st century. The difference is in whether the 2 °C warming threshold is exceeded in the Upper Amur. By the end of the 21st century, the increase in mean annual air temperature under RCP 6.0 will be 3–4 °C in the Selenga and Amur basins, 4–5 °C for the Lower Amur and most of the Lena basin, and 3–4 °C for the Upper Lena, Vitim, Olekma, and Upper Aldan.
By the middle of the 21st century, the increase in annual precipitation under RCP 2.6 will be 5–10% in most of the Selenga basin and 1–5% in the western part of the basin; 5–10% in most of the Lena basin and 10–15% in the Lower Lena and Vilyui; and 1–5% in the Amur basin in the Lower Shilka and Argun, Upper Sungari, and Zeya basins, 10–15% for the Middle Amur, Middle and Lower Ussuri, and Upper Mudanjiang, and 5–10% for the remainder of the Amur basin (Figure 7). By the end of the 21st century, the increase in precipitation under RCP 2.6 will be 5–10% in most of the Selenga basin and 10–15% for the Tuul and Uda; 10–15% in most of the Lena basin and 5–10% for the Upper Lena, Vitim, Olekma, and Aldan; and 1–5% in the Amur basin for the Selemdzha, Bureya, Lower Zeya, Sungari, Upper Ussuri, and Amgun, 10–15% for the Ingoda, Onon, and Mudanjiang, and 5–10% for the remainder of the Amur basin. By the middle of the 21st century, the increase in annual precipitation under RCP 6.0 will be 5–10% in most of the Selenga basin and 1–5% in the western part of the basin; 10–15% in most of the Lena basin and 5–10% for the Upper Lena, Vitim, Olekma, Aldan, and Lower Lena; and 1–5% for the Shilka, Zeya, Bureya, Sungari, Khor, Amgun, and Middle and Lower Amur and 5–10% for the remainder of the Amur basin. By the end of the 21st century, the increase in annual precipitation under RCP 6.0 will be 5–10% in most of the Selenga basin and 10–15% for the Tuul, Chikoi, Uda, and Khilok; 15–20% in most of the Lena basin, 5–10% for the Upper Lena, Vitim, and Olekma, 20–30% for the Lower Vilyui, Middle Aldan, and Lower Lena, and up to 30–45% in the Lena delta area; and 10–15% in most of the Amur basin, 5–10% for the Upper Selemdzha and Argun, and 15–20% for the Upper Sungari and Lower Amur.

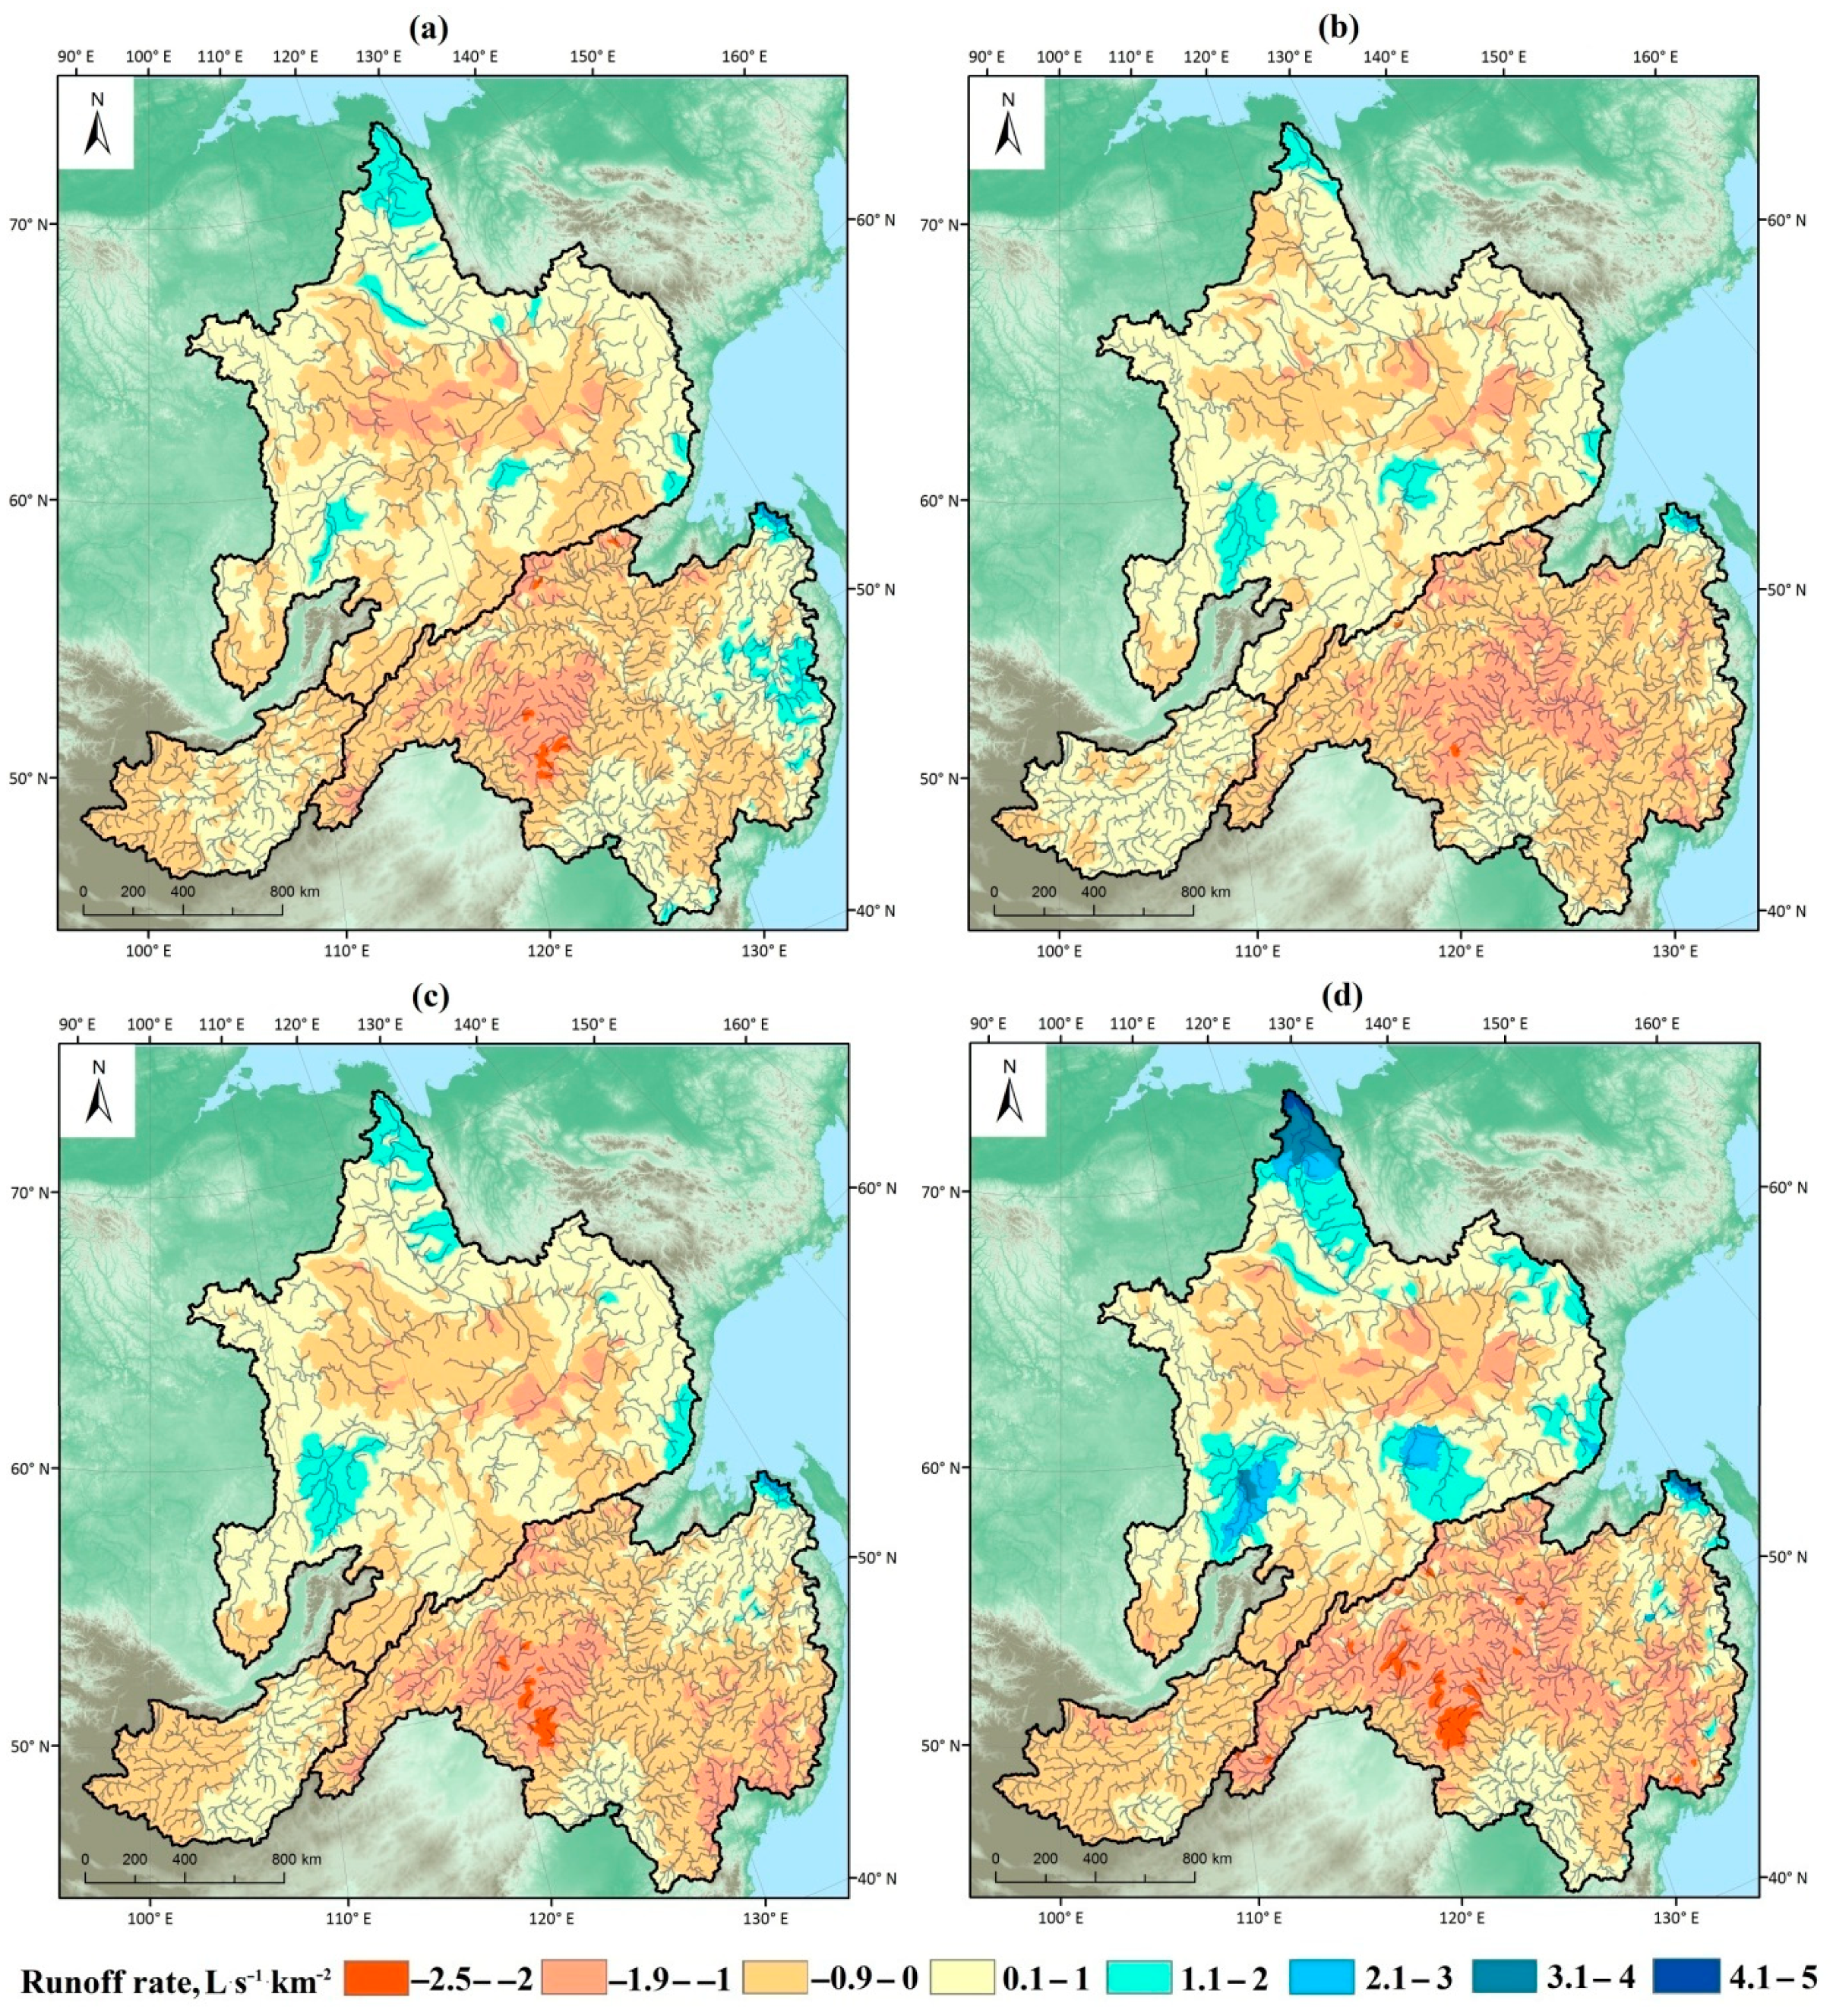
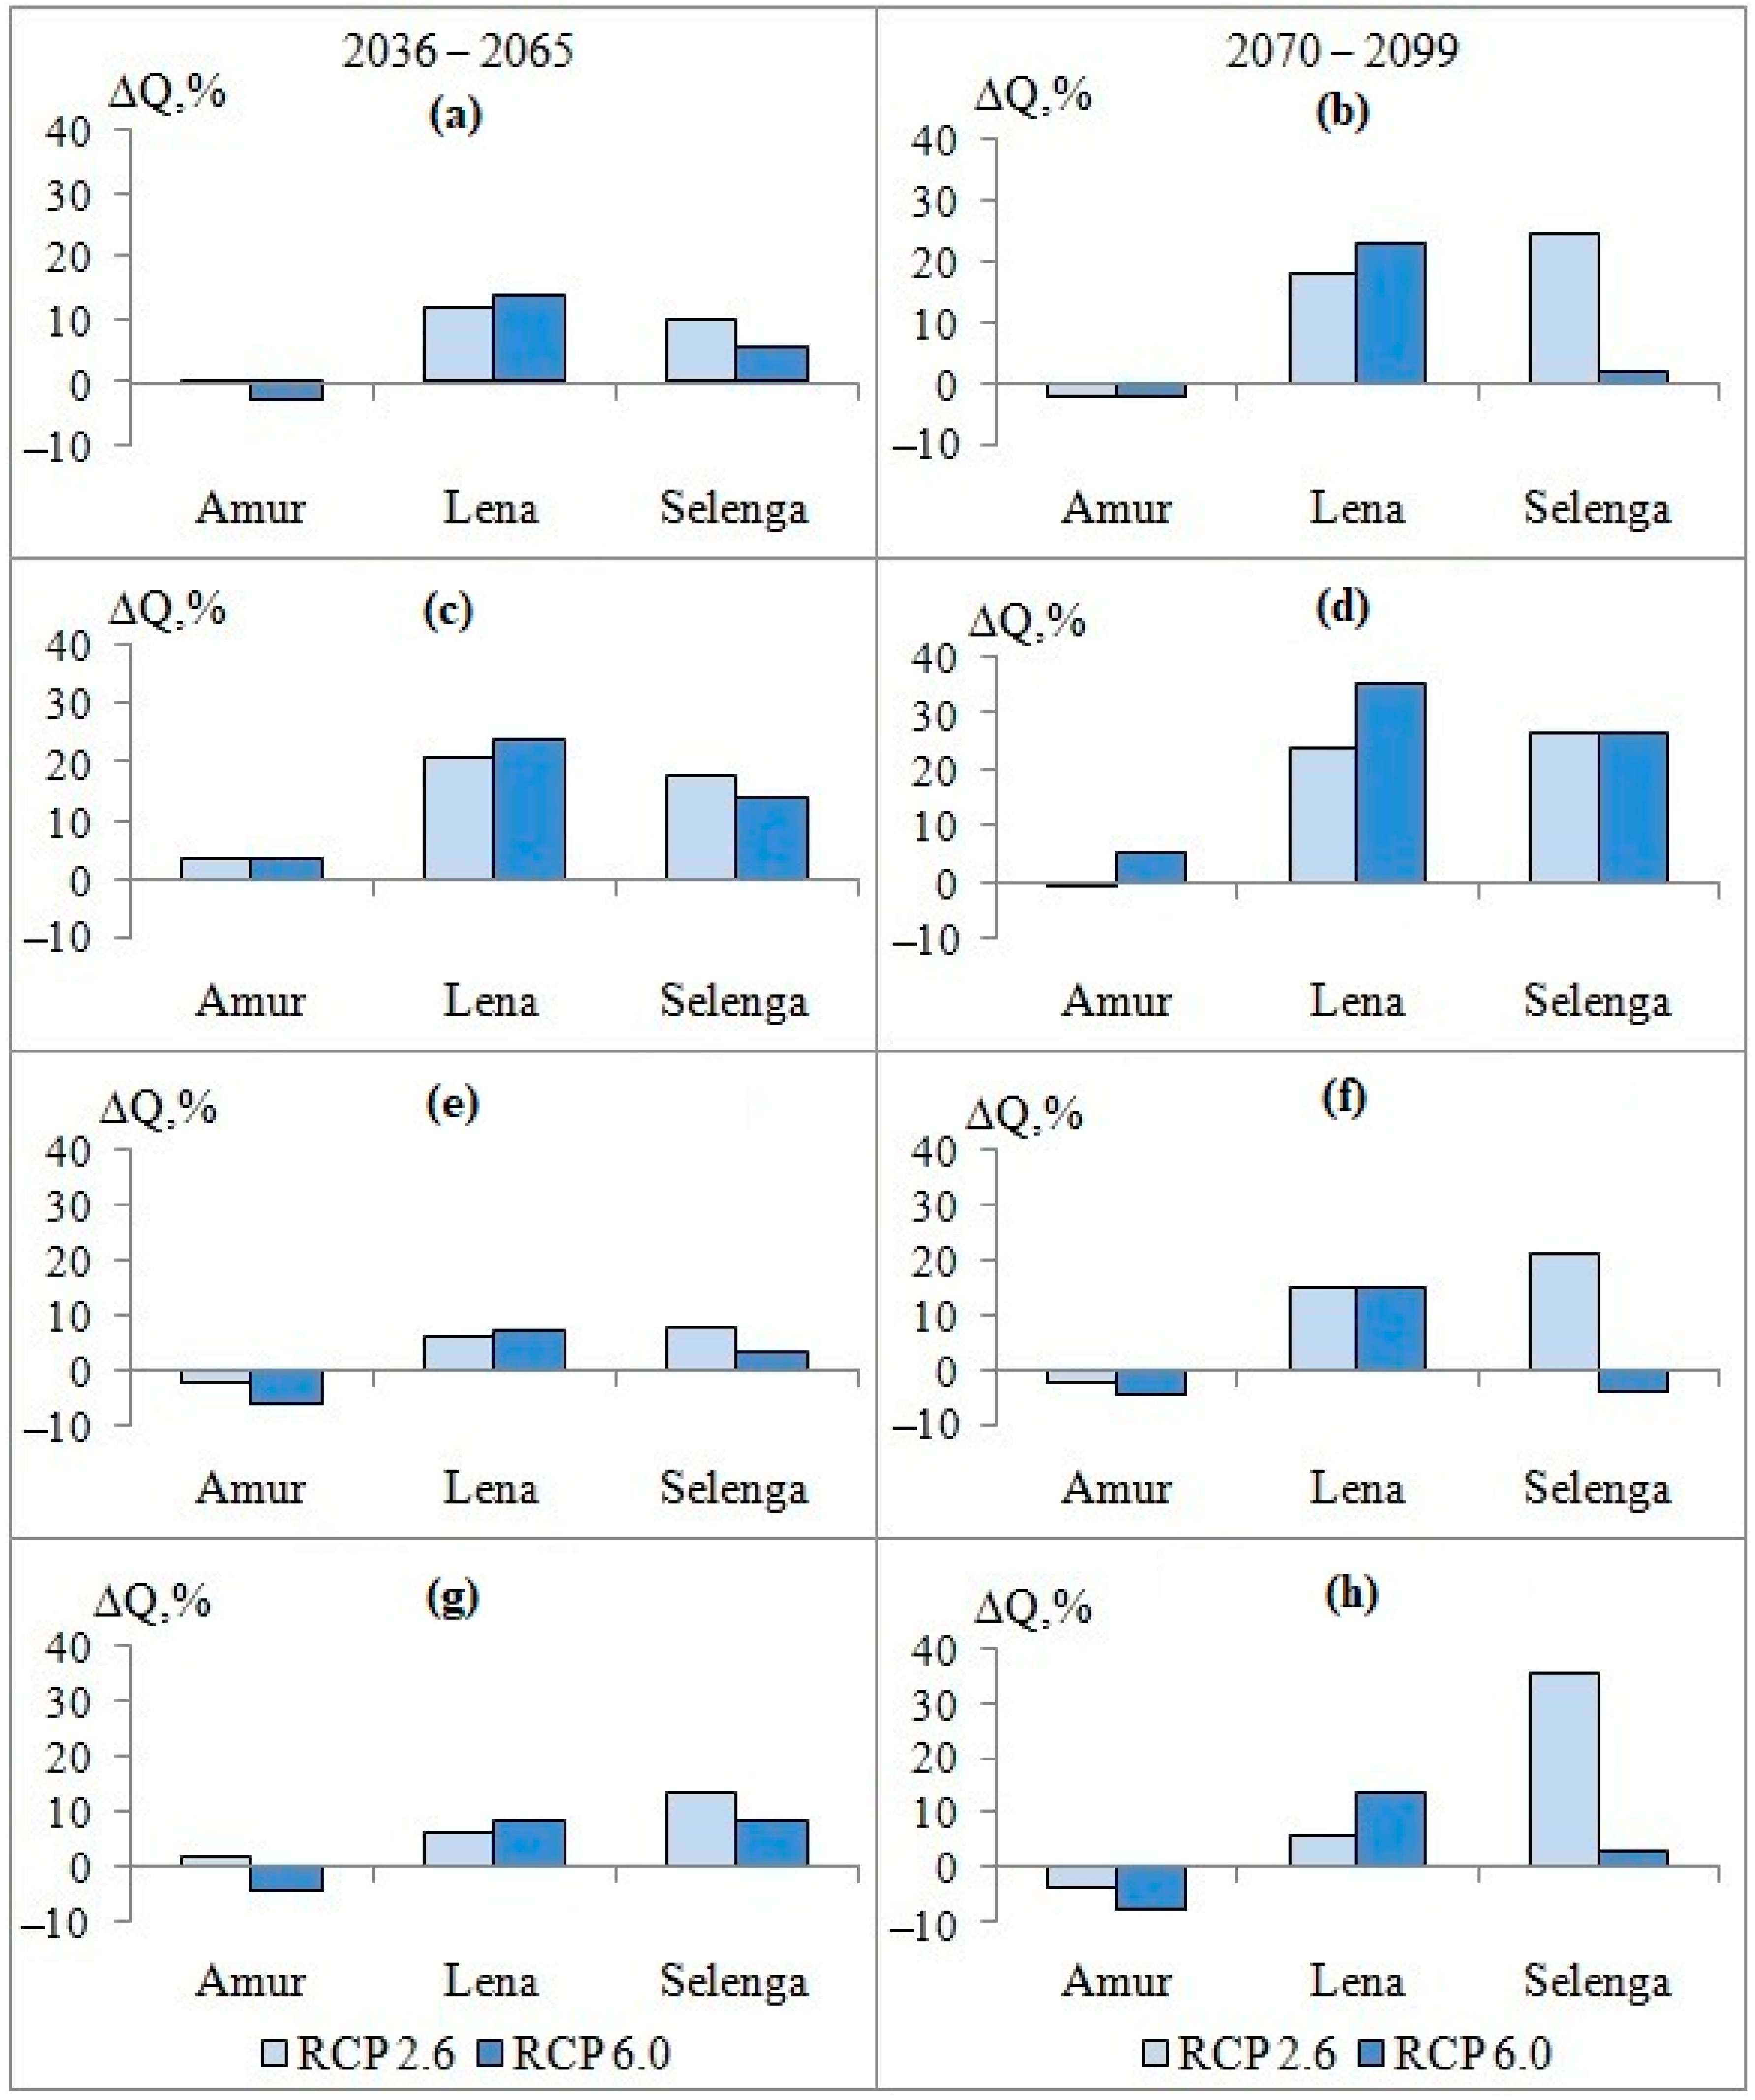
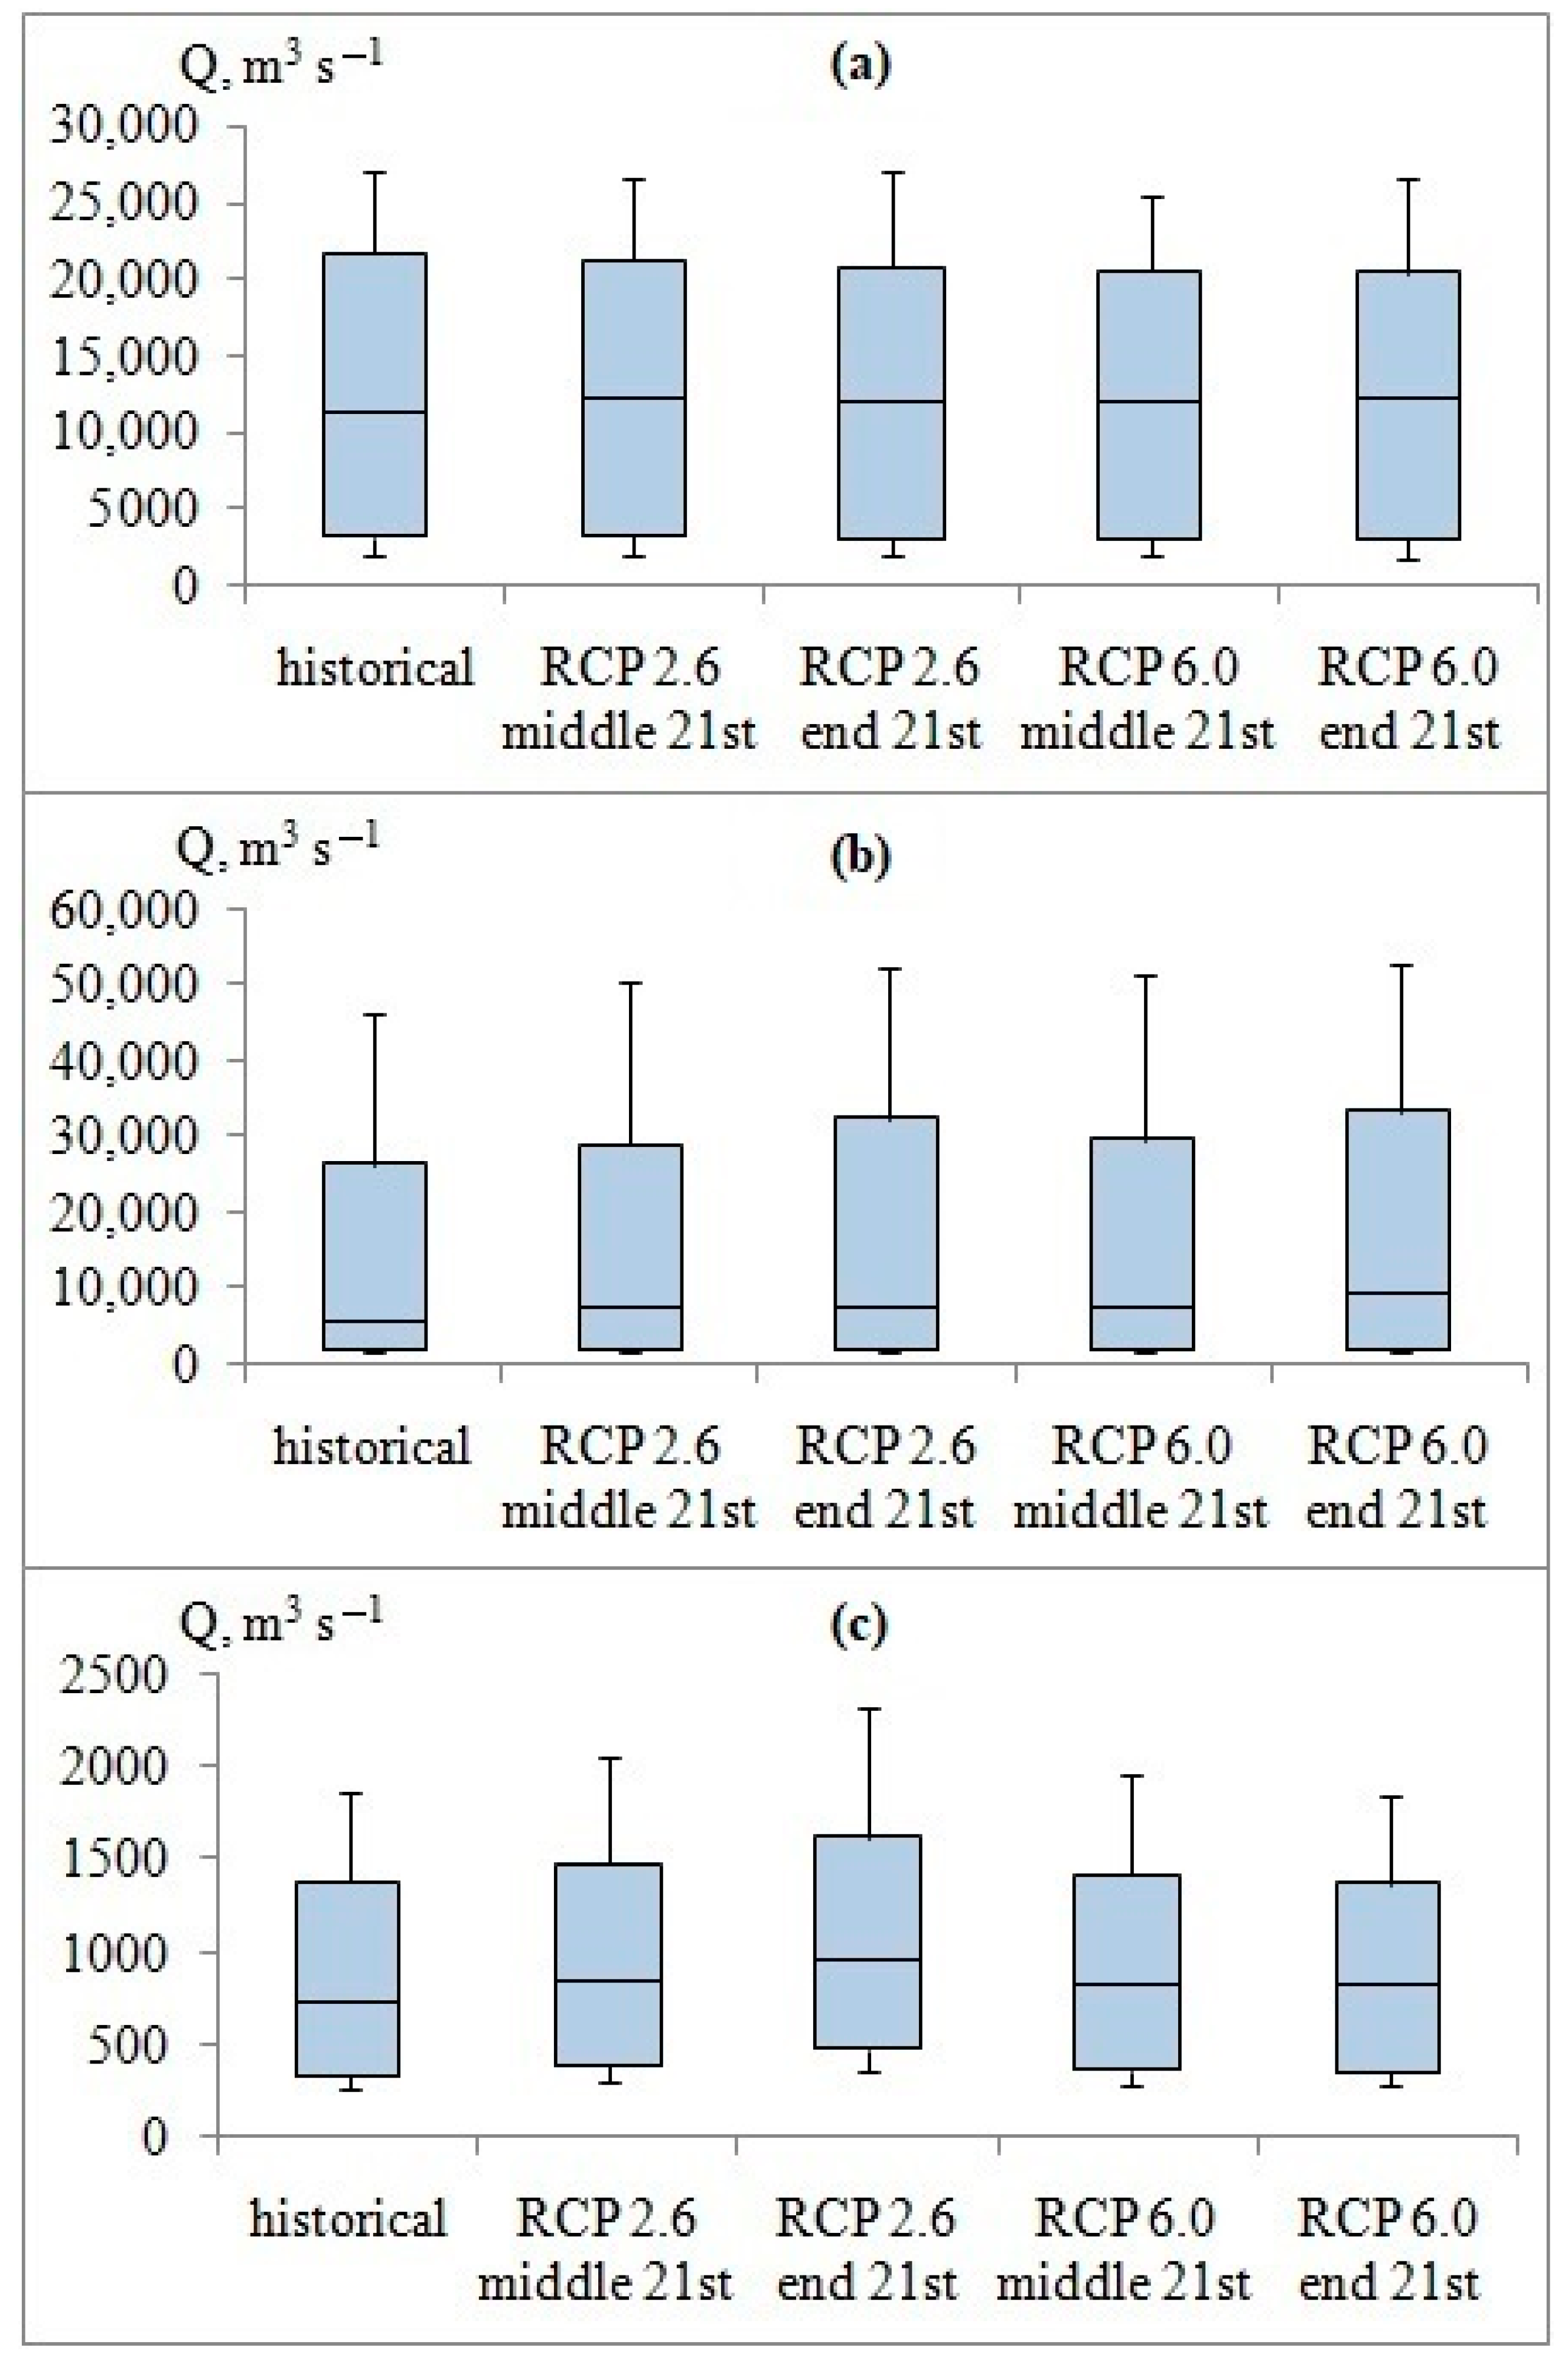
3.4. Hydrological Modeling Using the GCM Output Data for the Future Period

The assessment of annual and seasonal runoff anomalies of the Amur, Lena, and Selenga Rivers in the middle (2036–2065) and end (2070–2099) of the 21st century relative to the historical period showed the following results. According to RCP 2.6, by the middle of the 21st century, the change in annual runoff of the Amur, Lena, and Selenga predicted by the GCM ensemble will be 0.1%, 12%, and 10%, respectively. By the end of the 21st century, the change in annual runoff of the Amur, Lena, and Selenga will be −2%, 18%, and 25%, respectively (Figure 8). According to RCP 6.0, by the middle of the 21st century, the change in annual runoff of the Amur, Lena, and Selenga will be −3%, 14%, and 6%, respectively. By the end of the 21st century, the change in annual runoff of the Amur, Lena, and Selenga will be −2%, 23%, and 2%, respectively.
Analyzing the change in intra-annual runoff, it was noted that by the middle of the 21st century under RCP 2.6, the runoff change for the Amur, Lena, and Selenga basins will be 4%, 21%, and 18% during the spring flood, respectively; −2%, 6%, and 7% during summer–autumn floods; and 2%, 6%, and 14% during the winter low-water period. By the end of the 21st century, the runoff change for the Amur, Lena, and Selenga basins will be −0.4%, 24%, 26%, respectively, during the spring flood; −2%, 15%, and 21% during summer–autumn floods; and −4%, 5%, and 35% during the winter low-water period (Figure 8). According to RCP 6.0, by the middle of the 21st century, the runoff change for the Amur, Lena, and Selenga basins will be 4%, 24%, and 14%, respectively, during the spring flood; 6%, 7%, and 3% during summer–autumn floods; and 4%, 8%, and 9% during the winter low-water period. By the end of the 21st century, the runoff change for the Amur, Lena, and Selenga basins will be 5%, 35%, and 27%, respectively, during the spring flood; 4%, 15%, and −4% during the summer–autumn floods; and 8%, 14%, and 3% during the winter low-water period.
The greatest increase in the long-term annual runoff is predicted for the Lena River under RCP 2.6 and RCP 6.0 by the middle and end of the 21st century and for the Selenga River under RCP 6.0 by the end of the 21st century, while the Amur flow anomalies are close to zero. During the 21st century, the greatest relative changes in river flow are characteristic of the spring flood, especially for the Lena and Selenga under both scenarios. The summer–autumn and winter runoff of the Amur River has a negative change of up to 8% for the two RCPs and periods of the 21st century, and on the contrary, positive anomalies are observed for the Lena and Selenga. Evaluating runoff variations between RCPs, we noted high summer–autumn and winter runoff changes of the Amur River under RCP 6.0 during the future period, significant increases in anomalies of the spring and winter Lena runoff under RCP 6.0 by the end of the 21st century, and a greater prevalence of summer–autumn and winter runoff increase of the Selenga River under RCP 2.6 during the 21st century, but it is especially pronounced by its end. The Mann–Whitney U-test showed statistically significant (at 5% level) changes in the annual and seasonal Lena runoff during the 21st century under both RCPs, as well as the Amur winter runoff under RCP 6.0 by the middle of the 21st century (Table 3).
Further, the results of changes in high and low runoff based on FDC of daily discharges of the studied rivers for the historical period and the middle and end of the 21st century under RCP 2.6 and RCP 6.0 are reported (Figure 9). A comparison of daily flow anomalies of exceedance probability (Q10, Q90) showed that the high flow (Q10) of the Amur River will decrease by 5% by the middle of the 21st century under RCP 6.0 (other values will be about 1%), the Lena will increase by 9–14% depending on the RCP and period of the 21st century, and the Selenga will increase by 10–25% under RCP 2.6 and by 6% under RCP 6.0 by the middle of the 21st century and will decrease by 1% by the end of the 21st century. The low flow (Q90) will decrease by 5–9% for the Amur, whereas it will increase by 2–4% for the Lena and by 7–42% for the Selenga depending on the RCP and period of the 21st century. The above results show that the probability of flooding in the Lena and Selenga will increase, and for the Amur, no significant changes in high flow are revealed, while the probability of hydrological droughts will decrease.
The results of the assessment of scenario (differences between RCPs) and model (differences between GCMs) uncertainties of the mean annual values of air temperature, precipitation, and river runoff in the Amur, Lena, and Selenga basins showed that the model uncertainty of air temperature changes is prevalent by the middle of the 21st century. Its relative contribution to the general uncertainty of the projections is 85–90% for the basins of the studied rivers, and by the end of the 21st century, the scenario uncertainty increases to 46–53%. For precipitation, the contribution of model uncertainty by the middle of the 21st century is greatest for the Lena basin at 85% and decreases to 57% by the end of the calculation period, whereas for the Selenga basin, it is the lowest by the middle of the 21st century at 63% and increases to 67% by the end of the calculation period, making it the source of the greatest uncertainty of the three studied river basins. River flow filters uncertainties in climatic characteristics to some extent. During the 21st century, the scenario uncertainty of Lena and Selenga runoff increases from 30% and 15% to 49% and 41%, and the Amur runoff uncertainty, on the contrary, decreases from 34% to 28%.
Both areas with a positive and negative trend in the studied river basins are marked by assessing the spatial variability of the mean annual runoff rate. According to RCP 2.6, by the middle of the 21st century, there will be a decrease in the runoff rate of 1 L·s−1· km−2 in the Upper Selenga, Orkhon, Eg, Chikoi, Khilok, and Uda and an increase in the runoff rate of 1 L·s−1·km−2 for the remainder of the Selenga basin (Figure 10). The Lena basin will be characterized by a decrease in runoff rate in the Upper and Middle Lena, Vitim, Olekma, Aldan, and Vilyui, with the highest values (up to 2 L·s−1·km−2) for Central Yakutia, and the remainder of the basin will have a positive trend, with the highest values (up to 2 L·s−1·km−2) in the Lower Lena. There will be mainly a decrease in runoff rate in the Amur basin for the Shilka, Argun, Zeya, Sungari, and Upper Bureya, with the highest values (up to 2–2.5 L·s−1·km−2) for the tributaries of the Zeya Reservoir and Upper Argun, and the Tunguska, Khor, and Bikin will have the highest increase in runoff rate of 2 L·s−1·km−2. According to RCP 2.6, the following changes will occur by the end of the 21st century: the catchment area with a negative runoff trend will decrease in the Selenga and Lena, while the overall distribution will remain similar to that in the middle of the 21st century. On the contrary, the area with a negative runoff trend will increase significantly in the Amur basin, including the Lower Zeya, while the runoff will increase in the Lower Nenjiang, Khor, and mouth area of the Amur River.
By the middle of the 21st century, the Lena basin will have a similar distribution of runoff rate changes under RCP 6.0 compared to RCP 2.6, and the area with the greatest decrease will be smaller (Figure 10). In the Selenga basin, the area of decreased runoff rate will extend to the Dzhida and the entire watershed up to the Orkhon mouth. In the Amur basin, the Upper Sungari and the Russian part of the Ussuri basin will be added to the area with a negative trend in the annual runoff. At the same time, the greatest decrease in runoff is noted in the Upper Ussuri and Mudanjiang. By the end of the 21st century, the Lena basin will be characterized by a similar distribution of runoff rate changes under RCP 6.0 compared to RCP 2.6, but the difference in these changes will increase. The runoff will decrease even further in the middle part of the Lena basin, and the anomalies will increase from 1–2 to 2–4 L·s−1·km−2 for some mountainous areas. The runoff rate will decrease by 0.1–1 L·s−1·km−2 in the Selenga basin. A similar distribution of runoff rate changes will remain in the Amur basin, but its decrease will become greater in the Shilka, Zeya, and Ussuri basins.

4. Conclusions

The calculation of changes in the annual runoff of the Amur, Lena, and Selenga Rivers by the middle and end of the 21st century relative to the period of the end of the 20th century showed almost zero anomalies of the Amur runoff under different RCPs, increases in the Lena runoff of 12–18% under RCP 2.6 and 14–23% under RCP 6.0, and increases in the Selenga runoff of 10–25% under RCP 2.6 and 2–6% under RCP 6.0. An increase in the Amur runoff during the spring flood of up to 5%, a runoff decrease during summer–autumn floods of 2–6%, and a change in winter runoff from −8% to 2% were revealed. An increase in the Lena runoff during the spring flood of 21–35%, a runoff decrease during summer–autumn floods of 2–6%, and increases in winter flow of 5% under RCP 2.6 and 8–14% under RCP 6.0, depending on the period of the 21st century, were detected. It was determined that the Selenga runoff during the spring flood will increase by 14–18% and 27% by the middle and end of the 21st century, and runoff during summer–autumn floods will increase by 3% and 7% under RCP 6.0 and RCP 2.6 by the middle of the 21st century. By the end of the 21st century, the Selenga runoff will have contrasting changes: a runoff increase during summer–autumn floods of 21% under RCP 2.6 and a decrease of 4% under RCP 6.0, an increase in winter runoff of 9–14% under the two RCPs by the middle of the 21st century, and increases in winter runoff of 35% under RCP 2.6 and 3% under RCP 6.0 by the end of the 21st century.
The greatest increase in the long-term annual runoff is predicted for the Lena River by the middle and end of the 21st century under RCP 2.6 and RCP 6.0 and for the Selenga River by the end of the 21st century under RCP 6.0, while the Amur flow anomalies are close to zero. During the 21st century, the spring flood is characterized by the greatest relative changes in river flow, especially for the Lena and Selenga under both scenarios. The summer–autumn and winter runoff of the Amur River has a negative change of up to 8% for the two RCPs and both periods of the 21st century, and on the contrary, positive anomalies are observed for the Lena and Selenga. Evaluating runoff variations between RCPs, we noted large changes in the summer–autumn and winter runoff of the Amur River under RCP 6.0, a significant increase in anomalies of the spring and winter Lena runoff under RCP 6.0 by the end of the 21st century, and a greater prevalence of summer–autumn and winter runoff increase of the Selenga River under RCP 2.6 during the 21st century, but it is especially pronounced by its end. The Mann–Whitney U-test showed statistically significant changes in the annual and seasonal Lena runoff during the 21st century under both RCPs, as well as the Amur winter runoff under RCP 6.0 by the middle of the 21st century.
The high flow of the Amur River will decrease by 5% by the middle of the 21st century under RCP 6.0 (other values will be about 1%), the Lena will increase by 9–14%, depending on the RCP and period of the 21st century, and the Selenga will increase by 10–25% under RCP 2.6 and by 6% under RCP 6.0 by the middle of the 21st century and will decrease by 1% by the end of the 21st century. The low flow will decrease by 5–9% for the Amur and will increase by 2–4% for the Lena and by 7–42% for the Selenga, depending on the RCP and period of the 21st century. The results show that the probability of flooding in the Lena and Selenga will increase, and for the Amur, no significant changes in high flow are revealed, while the probability of hydrological droughts will decrease.
Thus, the verification of runoff generation modeling of the intra-annual water regime using GCM data for the historical period allowed us to obtain similar results of annual runoff changes for the Amur River [14] and Lena River [22], as well as to specify changes in the Selenga runoff [15], for which we should expect alternating high-water and low-water periods rather than a monotonic decrease in flow by the end of the 21st century, reaching critical values. Prospects for refining the calculation results of water regime anomalies could be to account for LULC dynamics in climate projections for the 21st century. However, future LULC changes derived from the models mainly include the dynamics of the area occupied by different crops or urban landscapes [45,46]. In other words, the impact of anthropogenic transformation of landscapes under different socioeconomic scenarios, rather than a gradual change in natural vegetation cover due to air temperature and precipitation over the 21st century, is estimated. The use of climatic projections calculated based on the GCM output data of the CMIP6 may allow the estimates of the hydrological consequences of climate change to be refined. In addition, this may be facilitated by modern accounting of global socioeconomic change scenarios, but the uncertainties of runoff calculations associated with both the internal structure of hydrological models and the selection of the optimal GCM and RCP will still exist. Moreover, these uncertainties will increase as the calculation time horizon increases.

Funding

This research was funded by the Ministry of Science and Higher Education of the Russian Federation (project MK-1753.2020.5—calculations of runoff changes in the Lena and Selenga basins) and the Governmental Order to Water Problems Institute, Russian Academy of Sciences (subject no. FMWZ-2022-0001—calculations of runoff changes in the Amur basin).

Institutional Review Board Statement

Not applicable.

Informed Consent Statement

Not applicable.

Data Availability Statement

The GCM output data are available on the ISIMIP server (data link https://www.isimip.org/gettingstarted/input-data-bias-correction/, accessed on 21 December 2021).

Acknowledgments

The author is grateful to the ISIMIP for the GCM output data used for hydrological modeling.

Conflicts of Interest

The author declares no conflict of interest.

References

  1. Huang, S.; Kumar, R.; Florke, M.; Yang, T.; Hundecha, Y.; Kraft, P.; Gao, C.; Gelfan, A.; Liersch, S.; Lobanova, A.; et al. Evaluation of an ensemble of regional hydrological models in 12 large-scale river basins worldwide. Clim. Chang. 2017, 141, 381–397. [Google Scholar] [CrossRef]
  2. Krysanova, V.; Hattermann, F. Intercomparison of climate change impacts in 12 large river basins: Overview of methods and summary of results. Clim. Chang. 2017, 141, 363–379. [Google Scholar] [CrossRef]
  3. Krysanova, V.; Vetter, T.; Eisner, S.; Huang, S.; Pechlivanidis, I.; Strauch, M.; Gelfan, A.; Kumar, R.; Aich, V.; Arheimer, B.; et al. Intercomparison of regional-scale hydrological models and climate change impacts projected for 12 large river basins worldwide-a synthesis. Environ. Res. Lett. 2017, 12, 10. [Google Scholar] [CrossRef]
  4. Krysanova, V.; Donnelly, C.; Gelfan, A.; Gerten, D.; Arheimer, B.; Hattermann, F.; Kundzewicz, Z. How the performance of hydrological models relates to credibility of projections under climate change. Hydrol. Sci. J. 2018, 63, 696–720. [Google Scholar] [CrossRef]
  5. Gel’fan, A.; Kalugin, A.; Krylenko, I.; Nasonova, O.; Gusev, E.; Kovalev, E. Testing a hydrological model to evaluate climate change impact on river runoff. Russ. Meteorol. Hydrol. 2020, 45, 353–359. [Google Scholar] [CrossRef]
  6. Krysanova, V.; Hattermann, F.; Kundzewicz, Z. How evaluation of hydrological models influences results of climate impact assessment—An editorial. Clim. Chang. 2020, 163, 1121–1141. [Google Scholar] [CrossRef]
  7. Klemeš, V. Operational testing of hydrological simulation models. Hydrol. Sci. J. 1986, 31, 13–24. [Google Scholar] [CrossRef]
  8. Hattermann, F.; Krysanova, V.; Gosling, S.; Dankers, R.; Daggupati, P.; Donnelly, C.; Huang, S.; Motovilov, Y.; Buda, S.; Yang, T.; et al. Cross-scale intercomparison of climate change impacts simulated by regional and global hydrological models in eleven large river basins. Clim. Chang. 2017, 141, 561–576. [Google Scholar] [CrossRef]
  9. Gelfan, A.; Kalugin, A.; Krylenko, I.; Nasonova, O.; Gusev, Y.; Kovalev, E. Does a successful comprehensive evaluation increase confidence in a hydrological model intended for climate impact assessment? Clim. Chang. 2020, 163, 1165–1185. [Google Scholar] [CrossRef]
  10. Danilov-Danilyan, V.; Gelfan, A.; Motovilov, Y.; Kalugin, A. Disastrous flood of 2013 in the Amur basin: Genesis, recurrence assessment, simulation results. Water Resour. 2014, 41, 115–125. [Google Scholar] [CrossRef]
  11. Bugaets, A.; Gartsman, B.; Gelfan, A.; Motovilov, Y.; Sokolov, O.; Gonchukov, L.; Kalugin, A.; Moreido, V.; Suchilina, Z.; Fingert, E. The integrated system of hydrological forecasting in the Ussuri River basin based on the ECOMAG model. Geosciences 2018, 8, 5. [Google Scholar] [CrossRef] [Green Version]
  12. Magritsky, D.; Frolova, N.; Evstigneev, V.; Povalishnikova, E.; Kireeva, M.; Pakhomova, O. Long-term changes of river water inflow into the seas of the Russian Arctic sector. Polarforschung 2017, 87, 177–194. [Google Scholar] [CrossRef]
  13. Törnqvist, R.; Jarsjö, J.; Pietron, J.; Bring, A.; Rogberg, P.; Asokanb, S.; Destouni, G. Evolution of the hydro-climate system in the Lake Baikal basin. J. Hydrol. 2014, 519, 1953–1962. [Google Scholar] [CrossRef] [Green Version]
  14. Gelfan, A.; Kalugin, A.; Motovilov, Y. Assessing Amur water regime variations in the XXI century with two methods used to specify climate projections in river runoff formation model. Water Resour. 2018, 45, 307–317. [Google Scholar] [CrossRef]
  15. Moreido, V.; Kalugin, A. Assessing possible changes in Selenga River water regime in the XXI century based on a runoff formation model. Water Resour. 2017, 44, 390–398. [Google Scholar] [CrossRef]
  16. Eisner, S.; Florke, M.; Chamorro, A.; Daggupati, P.; Donnelly, C.; Huang, J.; Hundecha, Y.; Koch, H.; Kalugin, A.; Krylenko, I.; et al. An ensemble analysis of climate change impacts on streamflow seasonality across 11 large river basins. Clim. Chang. 2017, 141, 401–417. [Google Scholar] [CrossRef]
  17. Gusev, E.; Nasonova, O.; Kovalev, E.; Ayzel, G. Impact of possible climate change on extreme annual runoff from river basins located in different regions of the globe. Water Resour. 2019, 46, S126–S136. [Google Scholar] [CrossRef]
  18. Pechlivanidis, I.; Arheimer, B.; Donnelly, C.; Hundecha, Y.; Huang, S.; Aich, V.; Samaniego, L.; Eisner, S.; Shi, P. Analysis of hydrological extremes at different hydro-climatic regimes under present and future conditions. Clim. Chang. 2017, 141, 467–481. [Google Scholar] [CrossRef] [Green Version]
  19. Vetter, T.; Reinhardt, J.; Flörke, M.; van Griensven, A.; Hattermann, F.; Huang, S.; Koch, H.; Pechlivanidis, I.; Plötner, S.; Seidou, O.; et al. Evaluation of sources of uncertainty in projected hydrological changes under climate change in 12 large-scale river basins. Clim. Chang. 2017, 141, 419–433. [Google Scholar] [CrossRef]
  20. Gosling, S.; Zaherpour, J.; Mount, N.; Hattermann, F.; Dankers, R.; Arheimer, B.; Breuer, L.; Ding, J.; Haddeland, I.; Kumar, R.; et al. A comparison of changes in river runoff from multiple global and catchment-scale hydrological models under global warming scenarios of 1 °C, 2 °C and 3 °C. Clim. Chang. 2017, 141, 577–595. [Google Scholar] [CrossRef]
  21. Hudson, C.; Thompson, J. Hydrological modelling of climate change impacts on river flows in Siberia’s Lena River Basin and implications for the Atlantic Meridional Overturning Circulation. Hydrol. Res. 2019, 50, 1577–1595. [Google Scholar] [CrossRef] [Green Version]
  22. Gelfan, A.; Gustafsson, D.; Motovilov, Y.; Arheimer, B.; Kalugin, A.; Krylenko, I.; Lavrenov, A. Climate change impact on the water regime of two great Arctic rivers: Modeling and uncertainty issues. Clim. Chang. 2017, 141, 499–515. [Google Scholar] [CrossRef]
  23. Motovilov, Y.; Danilov-Danilyan, V.; Dod, E.; Kalugin, A. Assessing the flood control effect of the existing and projected reservoirs in the Middle Amur basin based on physical-mathematical hydrological models. Water Resour. 2015, 42, 580–593. [Google Scholar] [CrossRef]
  24. Motovilov, Y.; Gottschalk, L.; Engeland, K.; Rodhe, A. Validation of a distributed hydrological model against spatial observations. Agric. For. Meteorol. 1999, 98–99, 257–277. [Google Scholar] [CrossRef]
  25. Motovilov, Y. Hydrological simulation of river basins at different spatial scales: 1. Generalization and averaging algorithms. Water Resour. 2016, 43, 429–437. [Google Scholar] [CrossRef]
  26. Kalugin, A. Process-based modeling of the high flow of a semi-mountain river under current and future climatic conditions: A case study of the Iya River (Eastern Siberia). Water 2021, 13, 1042. [Google Scholar] [CrossRef]
  27. Motovilov, Y. Hydrological simulation of river basins at different spatial scales: 2. test results. Water Resour. 2016, 43, 743–753. [Google Scholar] [CrossRef]
  28. Kalugin, A. The impact of climate change on surface, subsurface and groundwater flow: A case study of the Oka River (European Russia). Water Resour. 2019, 46, S31–S39. [Google Scholar] [CrossRef]
  29. Frolova, N.; Grigorev, V.; Krylenko, I.; Zakharova, E. State-of-the-art potential of the GRACE satellite mission for solving modern hydrological problems. Vestn. St. Petersburg Univ. Earth Sci. 2021, 66, 107–122. [Google Scholar] [CrossRef]
  30. Gelfan, A.; Kalugin, A. Permafrost in the Caspian Basin as a possible trigger of the Late khvalynian transgression: Testing hypothesis using a hydrological model. Water Resour. 2021, 48, 831–843. [Google Scholar] [CrossRef]
  31. Kalugin, A. Modelling of future changes in the water regime of the Upper Kama River. In IOP Conference Series: Earth and Environmental Science; IOP Publishing: Bristol, UK, 2021; Volume 834, p. 012007. [Google Scholar] [CrossRef]
  32. Kalugin, A. Climate change attribution in the Lena and Selenga River runoff: An evaluation based on the Earth system and regional hydrological models. Water 2022, 14, 118. [Google Scholar] [CrossRef]
  33. Kalugin, A.; Lebedeva, L. Runoff generation at the small permafrost river basin in Eastern Siberia: Data analysis and hydrological modeling. In E3S Web of Conferences; EDP Sciences: Ulis, France, 2020; Volume 163, p. 01006. [Google Scholar] [CrossRef]
  34. Kornilova, E.D.; Krylenko, I.N.; Rets, E.P.; Motovilov, Y.G.; Bogachenko, E.M.; Krylenko, I.V.; Petrakov, D.A. Modeling of Extreme Hydrological Events in the Baksan River Basin, the Central Caucasus, Russia. Hydrology 2021, 8, 24. [Google Scholar] [CrossRef]
  35. Kalugin, A.; Motovilov, Y. Runoff formation model for the Amur River basin. Water Resour. 2018, 45, 149–159. [Google Scholar] [CrossRef]
  36. Gelfan, A.; Motovilov, Y.; Krylenko, I.; Moreido, V.; Zakharova, E. Testing the robustness of the physically-based ECOMAG model with respect to changing conditions. Hydrol. Sci. J. 2015, 60, 1266–1285. [Google Scholar] [CrossRef]
  37. Motovilov, Y.; Bugaets, A.; Gartsman, B.; Gonchukov, L.; Kalugin, A.; Moreido, V.; Suchilina, Z.; Fingert, E. Assessing the sensitivity of a model of runoff formation in the Ussuri River basin. Water Resour. 2018, 45, S128–S134. [Google Scholar] [CrossRef]
  38. Kalugin, A. Variations of the present-day annual and seasonal runoff in the Far East and Siberia with the use of regional hydrological and global climate models. Water Resour. 2018, 45, S102–S111. [Google Scholar] [CrossRef]
  39. Karthe, D.; Chalov, S.; Moreydo, V.; Efimov, V.; Romanchenko, A.; Batbayar, G.; Kalugin, A.; Westphal, K.; Malsy, M.; Flörke, M. Assessment of runoff, water and sediment quality in the Selenga river basin aided by a web-based geoservice. Water Resour. 2017, 44, 399–416. [Google Scholar] [CrossRef]
  40. Frieler, K.; Lange, S.; Piontek, F.; Reyer, C.; Schewe, J.; Warszawski, L.; Zhao, F.; Chini, L.; Denvil, S.; Emanuel, K.; et al. Assessing the impacts of 1.5 °C global warming—Simulation protocol of the Inter-Sectoral Impact Model Intercomparison Project (ISIMIP2b). Geosci. Model Dev. 2017, 10, 4321–4345. [Google Scholar] [CrossRef] [Green Version]
  41. Moriasi, D.; Arnold, J.; Van Liew, M.; Bingner, R.; Harmel, R.; Veith, T. Model evaluation guidelines for systematic quantification of accuracy in watershed simulations. Trans. Asabe 2007, 50, 885–900. [Google Scholar] [CrossRef]
  42. Hempel, S.; Frieler, K.; Warszawski, L.; Schewe, J.; Piontek, F. A trend-preserving bias correction—The ISI-MIP approach. Earth Syst. Dyn. 2013, 4, 219–236. [Google Scholar] [CrossRef] [Green Version]
  43. Lange, S. Trend-preserving bias adjustment and statistical downscaling with ISIMIP3BASD (v1.0). Geosci. Model Dev. 2019, 12, 3055–3070. [Google Scholar] [CrossRef] [Green Version]
  44. Mann, H.; Whitney, D. On a test of whether one of two random variables is stochastically larger than the other. Ann. Math. Stat. 1947, 18, 50–60. [Google Scholar] [CrossRef]
  45. Ren, Y.; Lü, Y.; Comber, A.; Fu, B.; Harris, P.; Wu, L. Spatially explicit simulation of land use/land cover changes: Current coverage and future prospects. Earth-Sci. Rev. 2019, 190, 398–415. [Google Scholar] [CrossRef]
  46. Sohl, T.; Wimberly, M.; Radeloff, V.; Theobald, D.; Sleeter, B. Divergent projections of future land use in the United States arising from different models and scenarios. Ecol. Model. 2016, 337, 281–297. [Google Scholar] [CrossRef] [Green Version]
Figure 1. Hydrological response units (HRUs) in hydrological models of the Amur, Lena, and Selenga River basins.
Water 14 00609 g001
Figure 2. Observed and simulated daily hydrographs for outlet gauges over the calibration period of models for the Amur (a), Lena (b) (1994–2003), and Selenga (c) (1984–1993) Rivers (there are no data on the observed Amur runoff for 1994–1996 and 2003).
Water 14 00609 g002
Figure 3. Observed and simulated daily hydrographs for outlet gauges over the validation period of models for the Amur (a), Lena (b) (2004–2013), and Selenga (c) (1994–2003) Rivers (there are no data on the observed Lena runoff for 2012–2013).
Water 14 00609 g003
Figure 4. Anomalies of annual (a,b) and seasonal (winter (c,d), spring (e,f), summer (g,h), autumn (i,j)) air temperature in the Amur, Lena, and Selenga River basins by the middle (2036–2065) and end (2070–2099) of the 21st century under RCP 2.6 and RCP 6.0 relative to the historical period.
Water 14 00609 g004
Figure 5. Anomalies of annual (a,b) and seasonal (winter (c,d), spring (e,f), summer (g,h), autumn (i,j)) precipitation in the Amur, Lena, and Selenga River basins by the middle (2036–2065) and end (2070–2099) of the 21st century under RCP 2.6 and RCP 6.0 relative to the historical period.
Water 14 00609 g005
Figure 6. Anomalies of mean annual air temperature in the Amur, Lena, and Selenga River basins by the middle (a,c) and the end (b,d) of the 21st century under RCP 2.6 (a,b) and RCP 6.0 (c,d) relative to the historical period.
Water 14 00609 g006
Figure 7. Anomalies of annual precipitation in the Amur, Lena, and Selenga River basins by the middle (a,c) and the end (b,d) of the 21st century under RCP 2.6 (a,b) and RCP 6.0 (c,d) relative to the historical period.
Water 14 00609 g007
Figure 8. Anomalies of annual (a,b) and seasonal (spring flood (c,d), summer-autumn floods (e,f), winter low flow (g,h)) runoff of the Amur, Lena, Selenga rivers by the middle (2036–2065) and end (2070–2099) of the 21st century under RCP 2.6 and RCP 6.0 relative to the historical period.
Water 14 00609 g008
Figure 9. Boxplots of daily flow of the Amur (a), Lena (b), and Selenga (c) Rivers of different exceedance probabilities (Q10, Q25, Q50, Q75, and Q90) for the historical period and the future period of the 21st century under RCP 2.6 and RCP 6.0.
Water 14 00609 g009
Figure 10. Anomalies of mean annual runoff rate in the Amur, Lena, and Selenga River basins by the middle (a,c) and the end (b,d) of the 21st century under RCP 2.6 (a,b) and RCP 6.0 (c,d) relative to the historical period.
Water 14 00609 g010
Table 1. Characteristics of river basins and input information for hydrological models.
ParameterAmurLenaSelenga
Catchment area, km21,855,0002,490,000447,000
DEMHydro1k
Basin schematization, number of HRUs1947664469
SoilHarmonized World Soil Database
LULCGlobal Land Cover Characterization
Meteorological data232 weather stations203 weather stationsEWEMBI reanalysis
Air temperature, °C−0.3−8.9−2.3
Precipitation, mm555372322
Runoff depth, mm18122961
Table 2. Performance of hydrological modeling of daily discharges of the Amur, Lena, and Selenga Rivers for the periods of calibration and validation.
River–GaugeCatchment Area, km2CalibrationValidation
NSEKGEPBIAS, %NSEKGEPBIAS, %
Amur–Bogorodskoe1,790,0000.830.89−5.70.830.910.7
Lena–Kusur2,430,0000.910.89−6.90.900.91−2.7
Selenga–Mostovoi440,0000.840.7310.80.800.86−6.4
Table 3. Significance of changes in annual and seasonal runoff of Amur, Lena, and Selenga Rivers in 21st century under RCP 2.6 and RCP 6.0 by the Mann–Whitney U-test at 5% level.
RiverPeriodAnnualSpring FloodSummer–Autumn FloodsWinter Low Flow
RCP 2.6RCP 6.0RCP 2.6RCP 6.0RCP 2.6RCP 6.0RCP 2.6RCP 6.0
Amur2036–2065+
2070–2099
Lena2036–2065++++++++
2070–2099++++++++
Selenga2036–2065
2070–2099
Publisher’s Note: MDPI stays neutral with regard to jurisdictional claims in published maps and institutional affiliations.

