Article

Observation Experiment of Wind-Driven Rain Harvesting from a Building Wall

School of Civil, Environmental and Architectural Engineering, College of Engineering, Korea University, Seoul 02841, Korea
*
Author to whom correspondence should be addressed.
Water 2022, 14(4), 603; https://doi.org/10.3390/w14040603
Submission received: 27 November 2021 / Revised: 12 February 2022 / Accepted: 14 February 2022 / Published: 16 February 2022
(This article belongs to the Special Issue Nature Based Solutions as Urban Blue-Green-Brown Infrastructures)

Abstract

:
Rainwater harvesting is generally assumed to collect rainwater from the roof or ground. However, this study shows that this structural limitation of rainwater harvesting can be overcome by employing a building wall. The rainfall on a building wall is called wind-driven rain (WDR), which is the target for the rainwater harvesting addressed in this study. To prove the possibility of WDR harvesting, this study prepared three different gauges to collect the rainwater from a building wall. These gauges are like miniature buildings used to collect the WDR on the building wall inside a storage tank at the bottom. The WDR harvesting gauges were located on the rooftop of the Engineering Building, Korea University, and a total of 15 rainfall events were observed during the rainy season in Korea from June to September 2020. Our analysis of the collected data confirms the significant role of the building wall in rainwater harvesting. For a building height of 0.5 m, the rainwater additionally harvested from the wall was about 40% that from the roof, which became about 70% for the height of 1.0 m and about 90% for the height of 1.5 m. In addition, Cho et al. (2020)’s empirical equation for estimating the WDR is found to be useful for estimating the amount of rainwater harvested from the building wall. The correlation coefficients between the measurements and estimates were estimated to be high as 0.94, 0.92 and 0.91 for building heights of 0.5 m, 1.0 m, and 1.5 m, respectively.

1. Introduction

Rainwater harvesting is the collection of rainwater from the roof or ground. The harvested rainwater can then be used for various domestic and agricultural purposes. Rainwater harvesting is known to have a long history of over 6000 years. In the Roman era, rainwater harvesting facilities were installed to collect rainwater from the roof [1]. Rainwater harvesting is still popular in regions where the annual rainfall amount is small, as well as in regions where the domestic water supply is limited [2,3,4,5]. Rainwater harvesting is also popular in urban areas. Rainwater harvesting is believed to alleviate flood risk, and harvested rainwater is used for various purposes such as cleaning and gardening [6,7,8,9]. Harvested rainwater is also used to alleviate the heat island effect, reduce air pollution, and increase infiltration to improve the urban water cycle [10,11,12,13,14,15,16].
A building roof is generally considered to be a rainwater-harvesting place [12,17,18,19,20,21,22,23]. A building roof must offer a clean and wide surface, which can be directly used for rainwater harvesting, without much structural supplementation. A building roof is also known to be very efficient for rainfall harvesting. For example, Abdulla and Al-Shareef [12] showed that the amount of rainwater collected from a building roof in Jordan was up to 19.7% of the total household water demand. Mehrabadi et al. [17] showed that the reliability of rainwater harvesting from a building roof in Iran could range from 45% to 70% depending on the size of the building roof. Gado and El-Agha [18] showed a similar result: rainwater harvesting could supply about 12% of the total household water demand in Alexandria, Egypt.
Large buildings have generally been required to introduce rainwater harvesting facilities. It has been a recommendation in some cities and an obligation in others [2,24,25,26]. However, the roof garden as a green infrastructure has become more popular nowadays. It is true that the roof garden is quite effective for alleviating the heat island effect in a city [27,28,29,30]. Residents of a building also prefer to use the building roof as a garden, since this has recreational benefits [31,32,33]. In recent studies, the method of rainwater harvesting with a green roof has been developed [34,35,36], but its applicability is quite limited in most countries. Instead, various gymnasiums or dorm-type buildings are more actively considered for rainwater harvesting [37,38,39]. In simple terms, the places for rainwater harvesting decrease as the number of green infrastructures, such as roof gardens, increases.
Under this circumstance, a building wall can be a good alternative. Due to the wind, a large portion of rain called wind-driven rain (WDR) collides with the building wall. The possibility of rainwater harvesting from the building wall has also been suggested by Cho et al. [40]. They showed that, in the case of a wind speed 4 m/s or higher, the amount of harvested rainwater from the building wall could be higher than 50% of that from the building roof of the same area. Additionally, if the area of the building wall is 10 times larger than that of the building roof, the amount of harvested rainwater from the building wall could be more than that from the building roof, where the wind speed is only around 1 m/s. This estimate by Cho et al. [40] is an analytical one, which should be proven by field tests and evaluations.
The objective of this study is to show that the structural limitation of rainwater harvesting can be overcome by considering the building wall instead of the building roof. In this sense, different from the two-dimensional approach of conventional rainwater harvesting, rainwater harvesting can be extended to become three-dimensional, considering both the building roof and wall. If the building roof is used for other purposes, such as a roof garden, it is possible to consider only the building wall. In the case of tall buildings, the amount of rainwater to be harvested from the wall could be more than that from the roof. To date, a building wall has only been considered for urban greening [41,42,43,44,45,46]. Samzadeh et al. [47] estimated the level of rainwater harvested from the building wall by applying an empirical equation, but a direct observation of the rainwater from the wall has not been conducted yet. In this study, three WDR-harvesting gauges of different heights were prepared to directly observe the rainwater from a building wall. These gauges are similar to miniature buildings, but the WDR on the building wall is collected into a storage tank at the bottom of the miniature building. The WDR harvesting gauges were located on the rooftop of the Engineering Building, Korea University. To validate the amount of harvested rainwater, the WDR was also observed independently with different gauges for WDR measurement. The rainfall on the horizontal surface, which is the generally mentioned rainfall, was also observed, together with the wind speed and simultaneously with the WDR and the rainwater harvested. These gauges were managed for the rainy season in Korea from June to September 2020, and a total of 15 rainfall events were observed for analysis in this study.

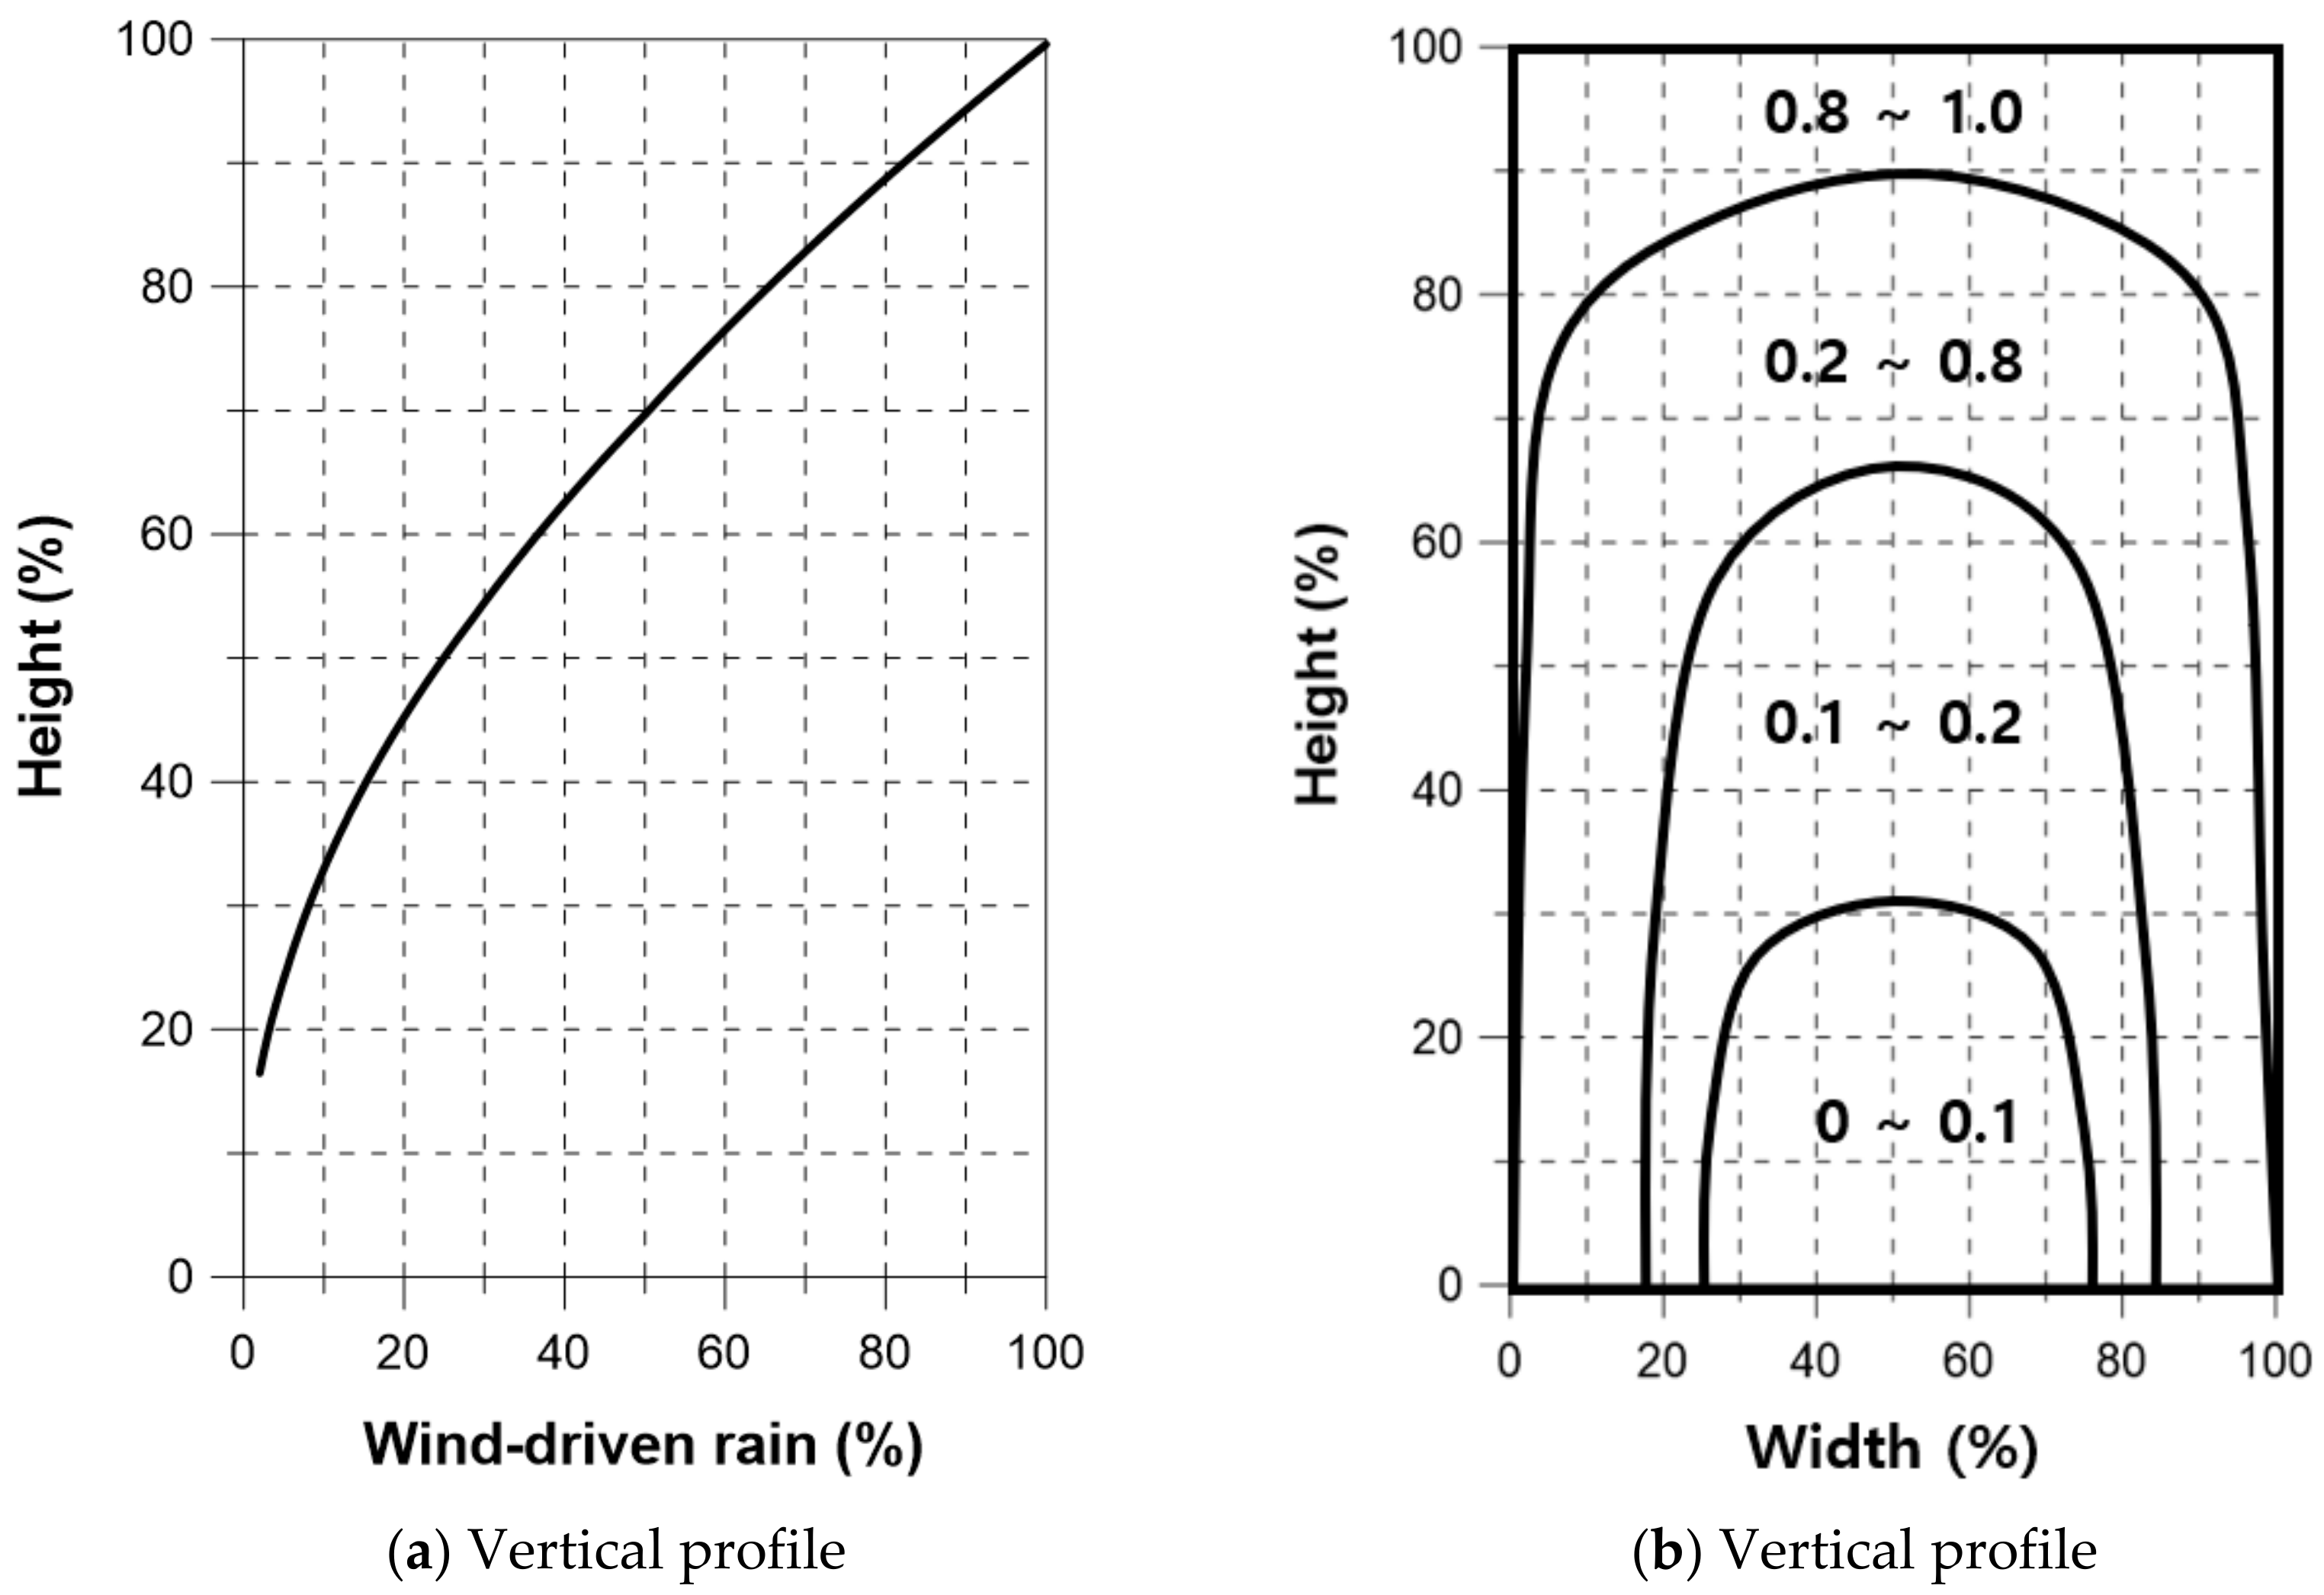
2. WDR and Its Estimation

WDR is generally estimated by an empirical equation, mostly derived by analyzing the observed data. There are also semi-empirical methods used to calculate WDR, such as the Straube–Burnett method [48], and the ISO Standard method [49]. The typical form of the empirical equation is as follows:
Rwdr = α·U·Rh0.88·cosθ
where Rwdr is the intensity of the WDR (mm/h), Rh is the rainfall intensity observed on the horizontal surface (mm/h), U is the wind speed (m/s), and θ is the angle between the wind direction and the normal of the building wall. This equation is generalized by introducing the constant α. The constant α is known to vary depending on the location of the building wall, as well as its shape. The smallest value of 0.02 was found in the study by Lacy [50] and Hens and Ali Mohamed [51], and the largest value of 0.26 was found by Flori [52].
The vertical profile of the WDR was derived by analyzing the observed data. In particular, Beijer and Johansson [53] summarized the vertical profile of the WDR for several rainfall events, whose schematic can also be found in Figure 1a. This vertical profile may be approximated by first-order or second-order functions. However, the spatial distribution of the WDR over the building wall cannot be derived by analyzing the observed data. This is because the direction of the wind and rainfall intensity varies significantly. This problem was overcome through simulation studies [54,55,56,57,58,59]. In particular, Choi [60,61,62] showed several important simulation results to be used for deriving the spatial distribution of the WDR. Figure 1b shows a derived schematic based on these studies. This spatial distribution of the WDR over the building wall is also consistent with the vertical profile of the WDR in Figure 1a.
Cho et al. [40] also proposed a typical form of the empirical equation for estimating the amount of WDR by analyzing the previous studies:
Qwdr = γ·B·H·U·Rh0.88
where Qwdr is the WDR intercepted by the building wall (mm/h∙m2), B is the width (m), H is the height (m) of the building wall, and γ is an empirically determined constant. Cho et al. [40] also determined this constant to be 0.161 through a lab experiment under various conditions. They considered 36 sets of rainfall intensity and wind speed, as well as six different shapes of building wall.
In the empirical equation considered in this study (Equation (2)), the wind direction θ is not included. In reality, it is difficult to determine a unique wind direction for WDR estimation, because of the ever-changing wind direction. For this reason, in the estimation of the WDR, it could be more reasonable to consider all four building walls [63,64,65]. The empirical equation for estimating the WDR by Cho et al. [40] was also the same for considering all four building walls.

3. Observation Settings

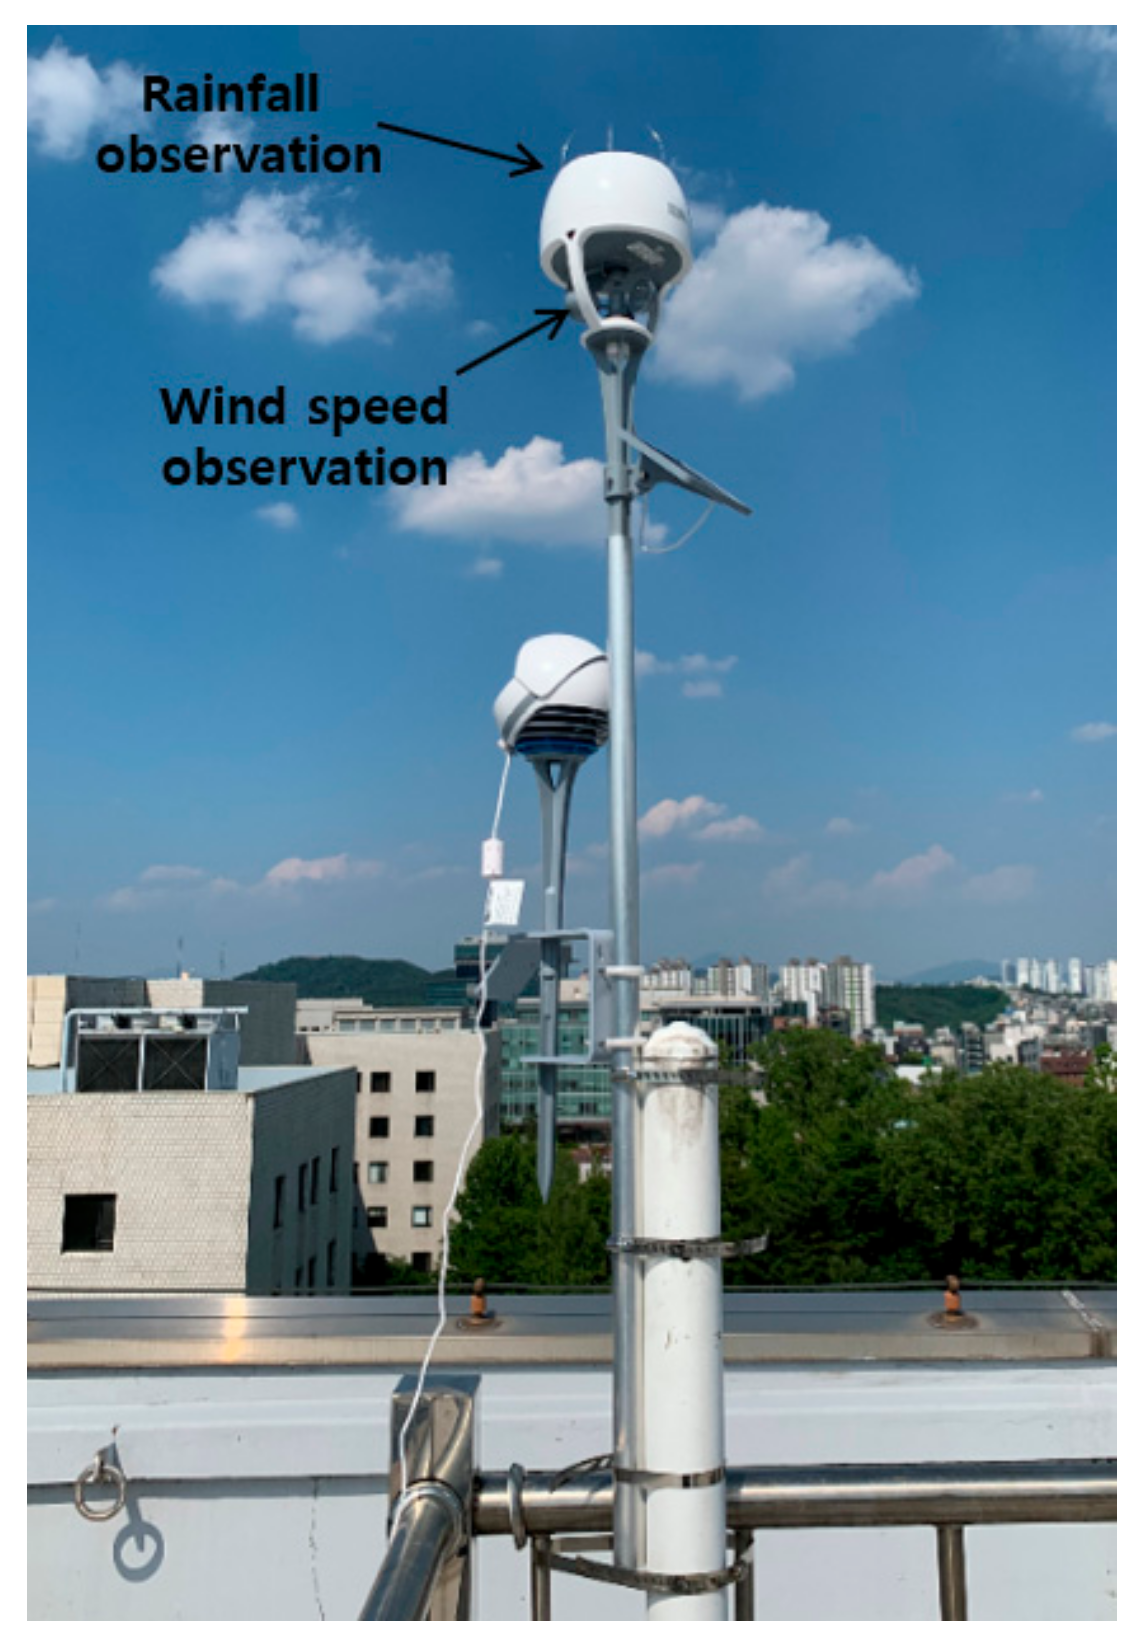
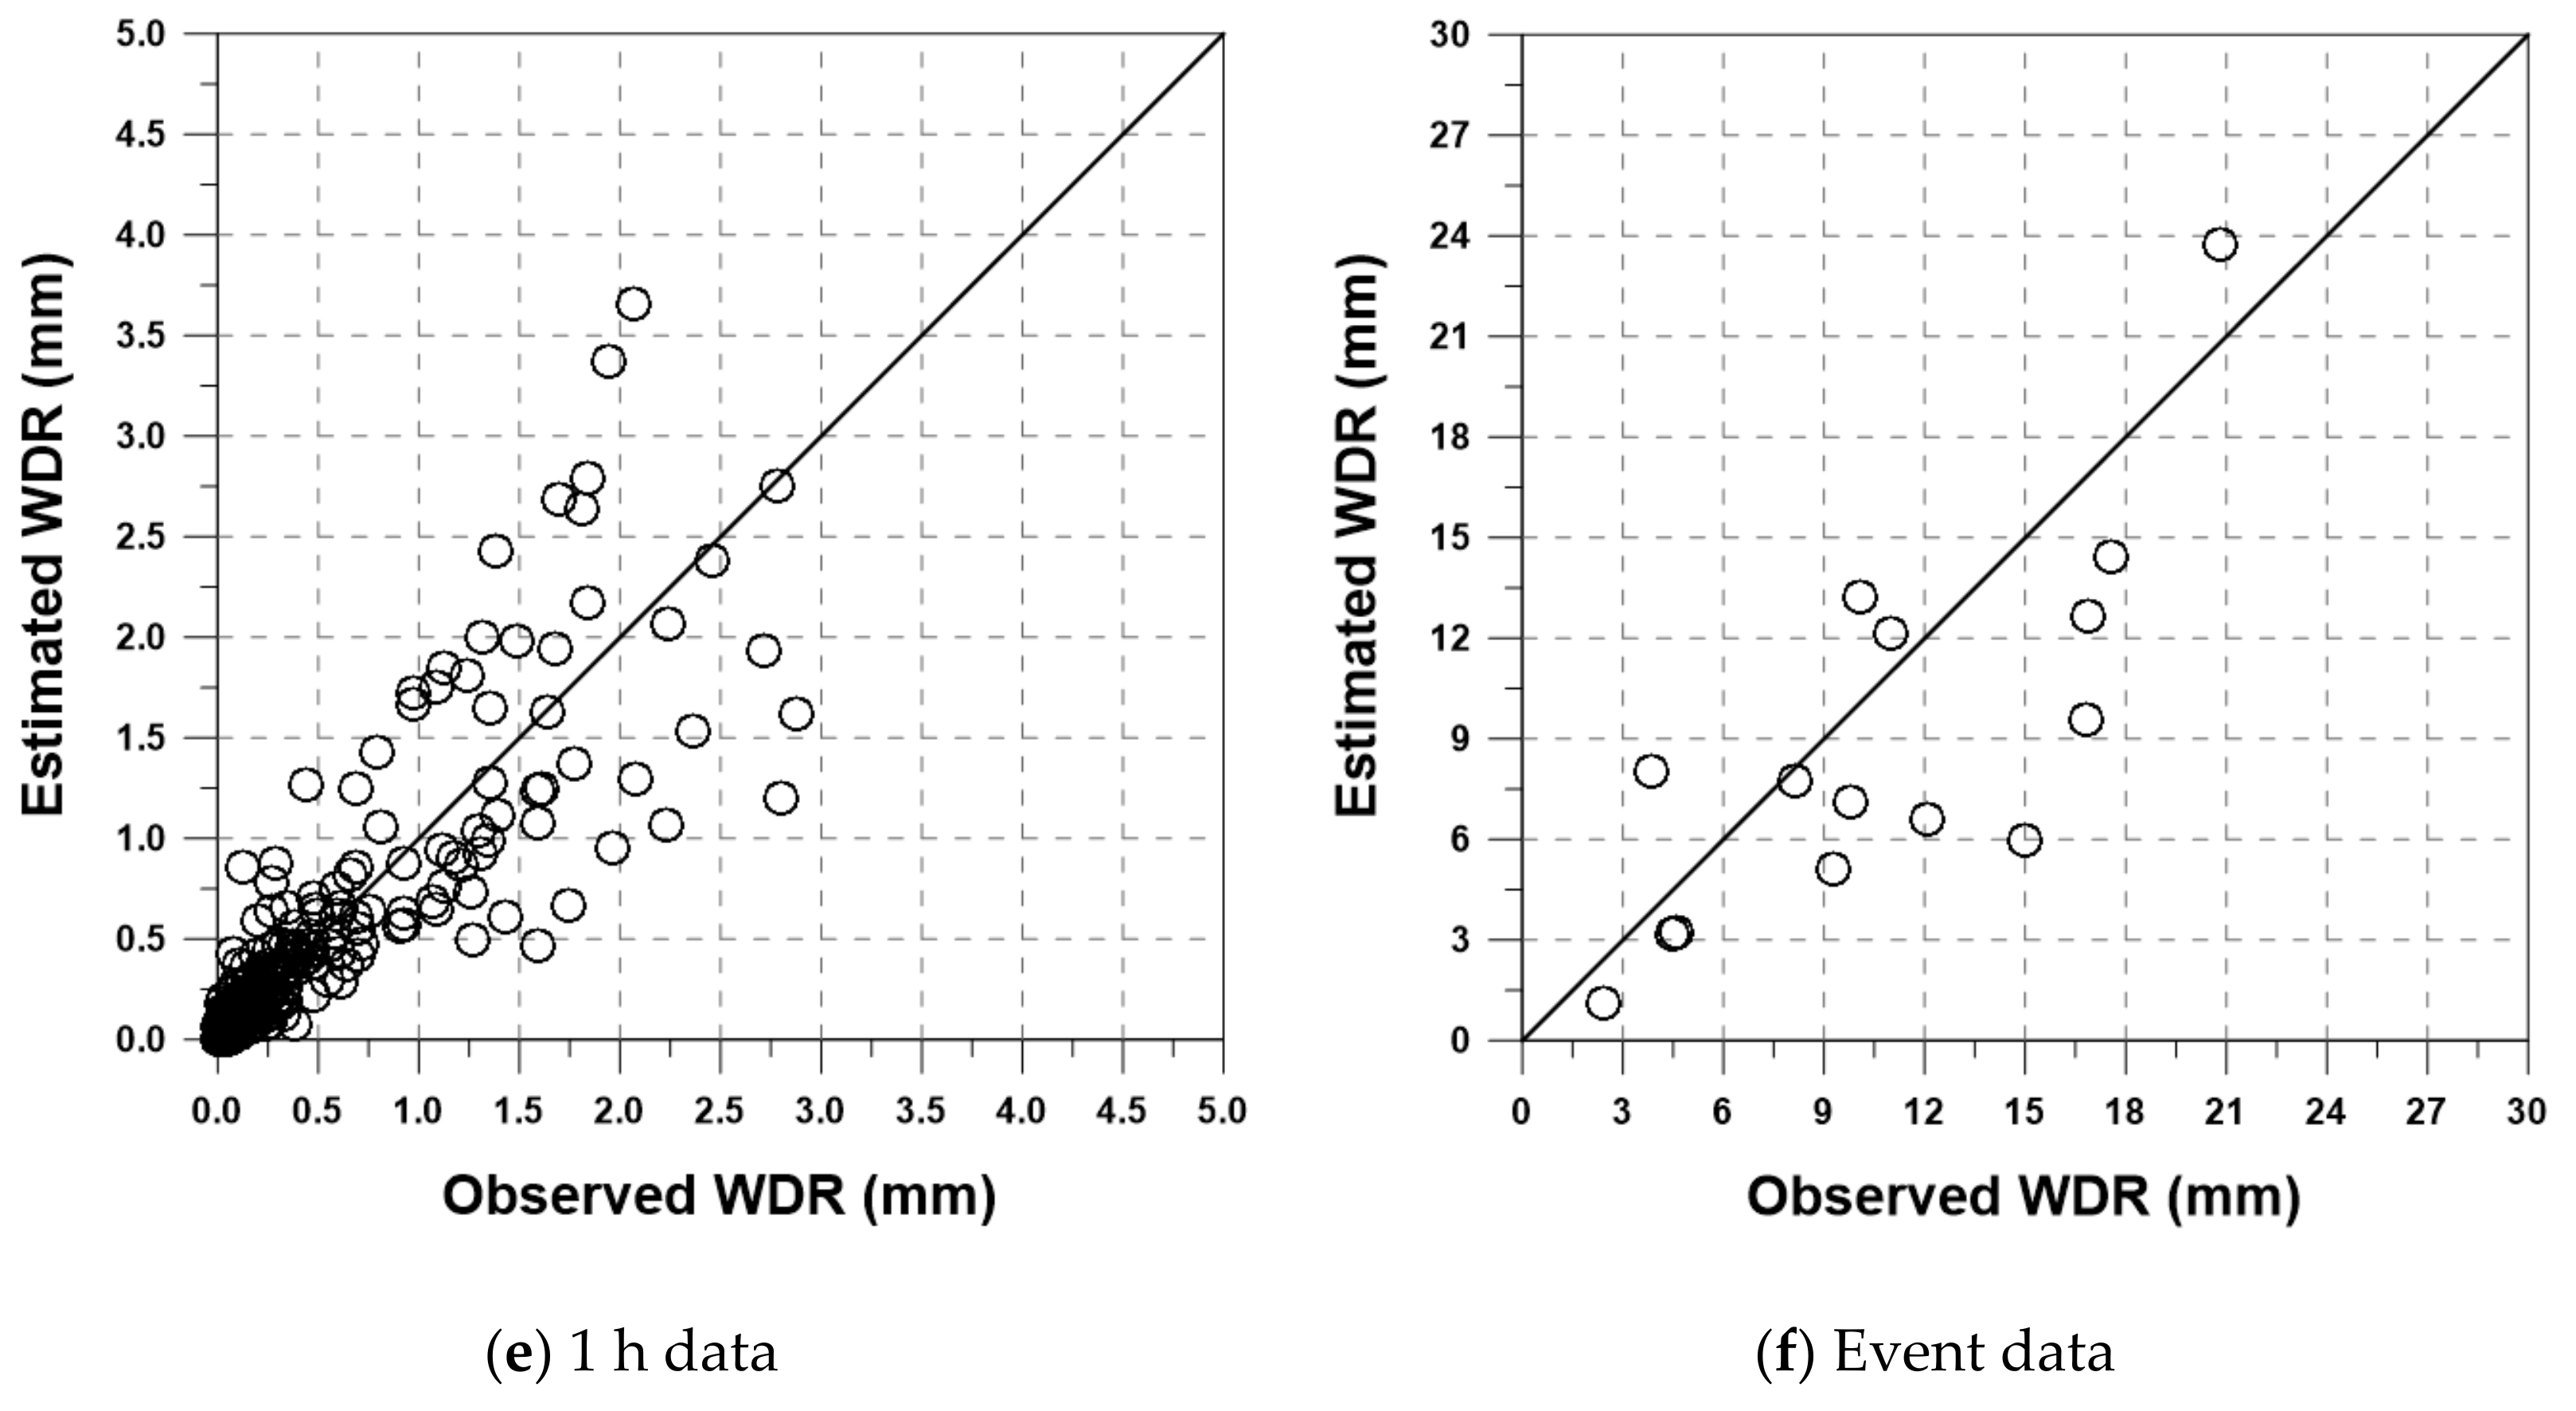
3.1. Observation of WDR

This study collected the data during the rainy season in Korea from June to September 2020. A total of 15 rainfall events were observed. The first rainfall event occurred on 24 June 2020, and the last event on 7 September 2020. Both the rainfall data and wind speed data were collected for each rainfall event by using several different gauges.
First, the WDR measurement was event-based, i.e., only the information including the beginning time, end time, and the total rainfall volume were observed. The WDR was observed by the gauges attached to the four walls of a two-meter high and one-meter-wide miniature building. This miniature building was located on the rooftop of the Engineering Building, Korea University (Latitude 127°1′31′′ E, Longitude 37°35′01′′ N). Figure 2 shows a picture and schematic diagram of this miniature building. The gauges used to observe the WDR were the same gauges used in Cho et al. [40]. In fact, this study used three different rain gauges (i.e., Types 1, 2, and 3) to observe the WDR on the building wall more accurately. The structures of these three gauges were all similar, but the Type 1 gauge was used to observe a rather large volume of WDR up to 125 mm, the Type 2 gauge for the medium volume of WDR up to 75 mm, and the Type 3 gauge for the small volume of WDR up to 25 mm. Figure 3 compares the structure of these three WDR gauges.
Additionally, this study used four rain gauges (mass cylinder type) to observe the rainfall on a horizontal surface. These rain gauges, located about two meters away from the four corners of the miniature building, also observed the total rainfall depth for each rainfall event (Figure 2a). The average of these four rain gauge measurements was assumed to be the ground truth in this study. Finally, this study also considered the rainfall data collected by BloomSky [66]. BloomSky was installed five meters apart from the miniature building for observation. BloomSky uses a tipping-bucket type rain gauge to observe the rainfall. Its detection limit is 0.2 mm, and its temporal resolution is one minute. In this study, BloomSky rainfall data were considered to reveal the temporal distribution of the WDR gauge data, as well as the rain gauge data.
Wind speed data were also collected by BloomSky. BloomSky provides one-minute wind speed data, and its error is known to be less than 5% [66]. In this study, BloomSky wind speed data were compared with the data from nearby automatic weather station (AWS) wind speed data for verification. The name of this AWS is Dongdaemoon AWS, and it is managed by the Korea Meteorological Administration (KMA). This AWS, also provides one-minute wind speed data. Figure 4 shows a picture of BloomSky located at the rooftop of the Engineering Building, Korea University.

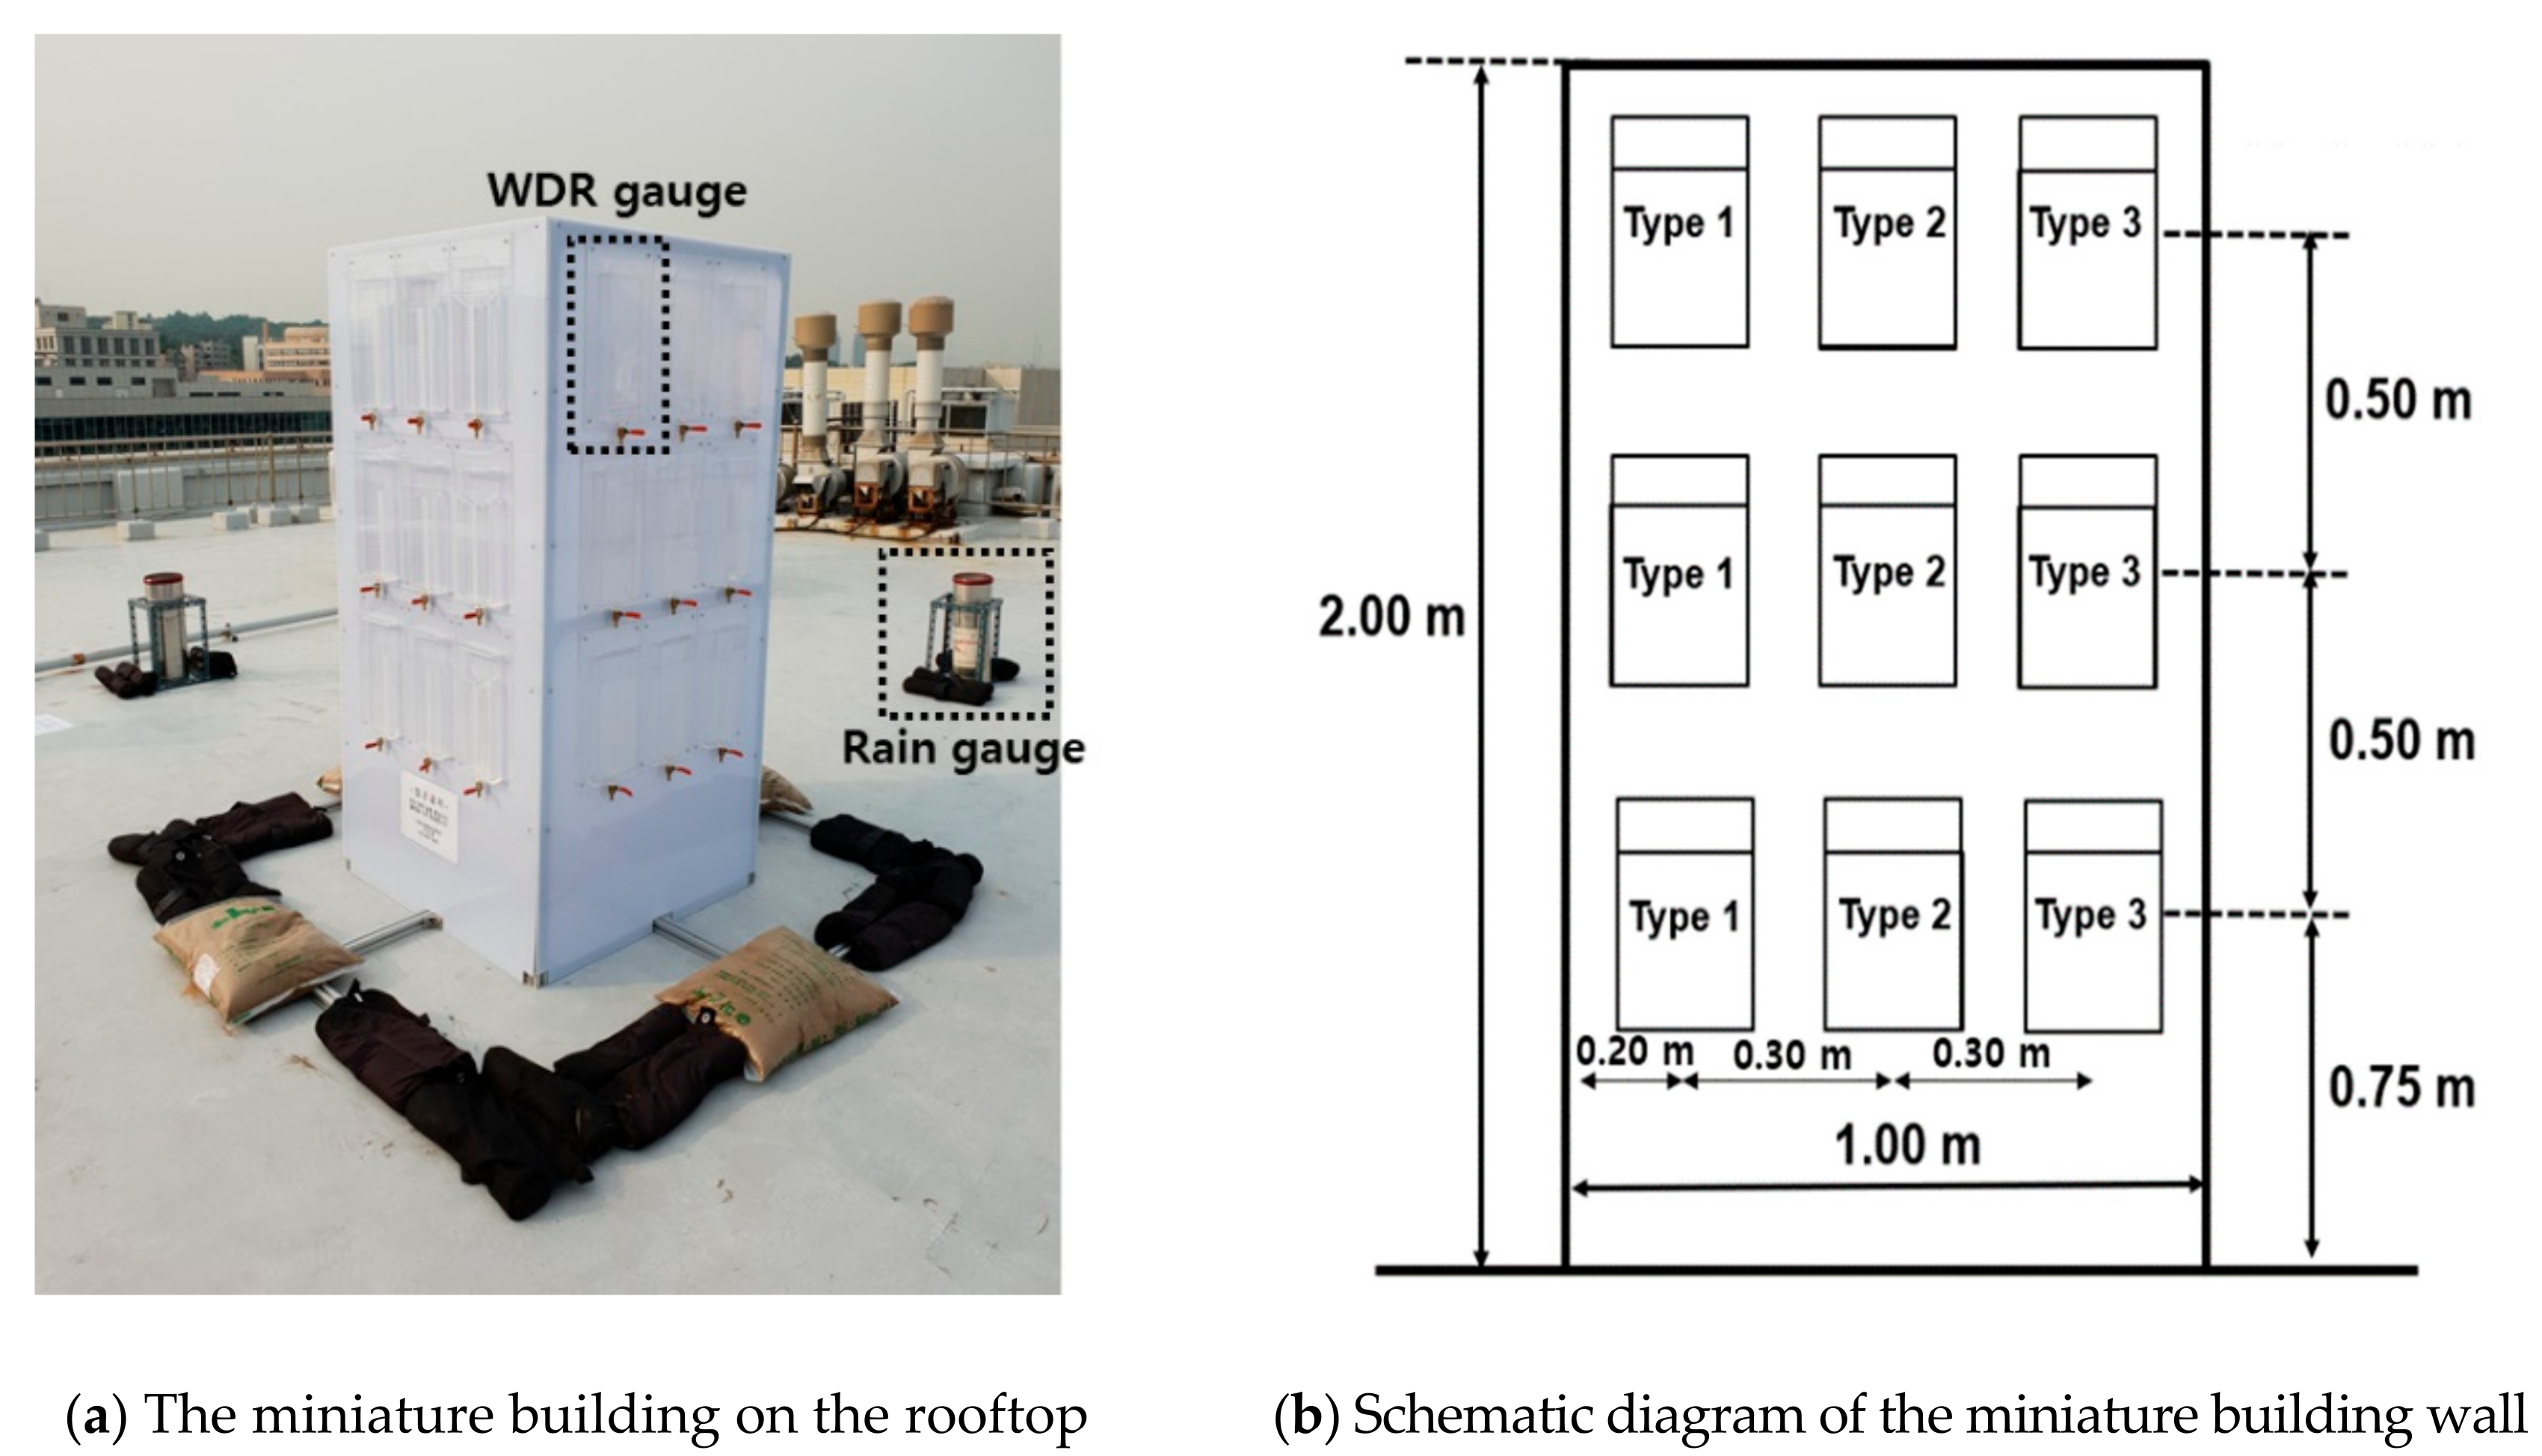
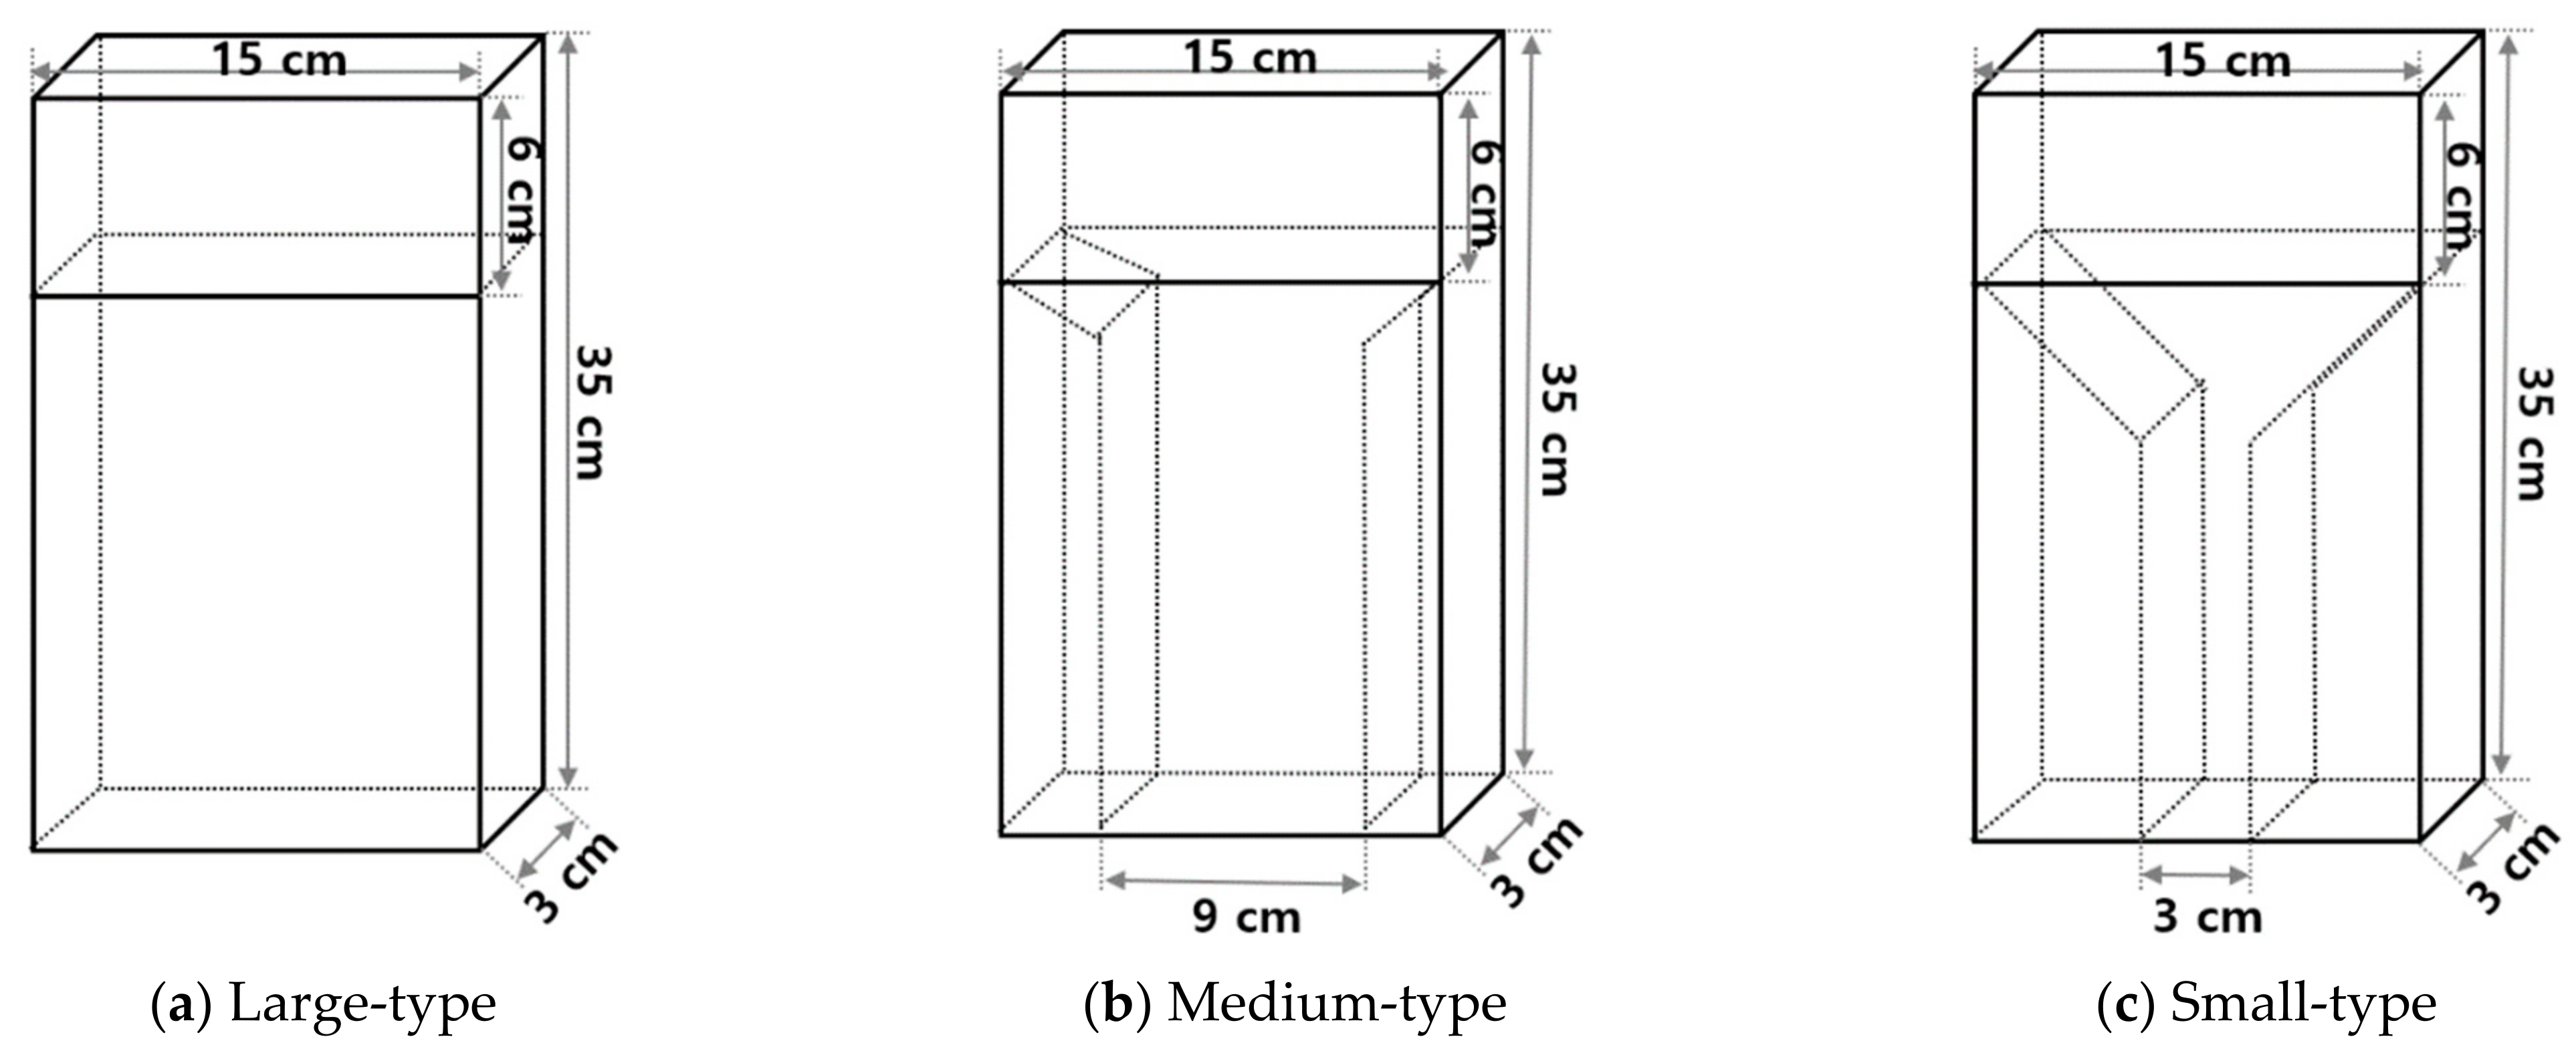
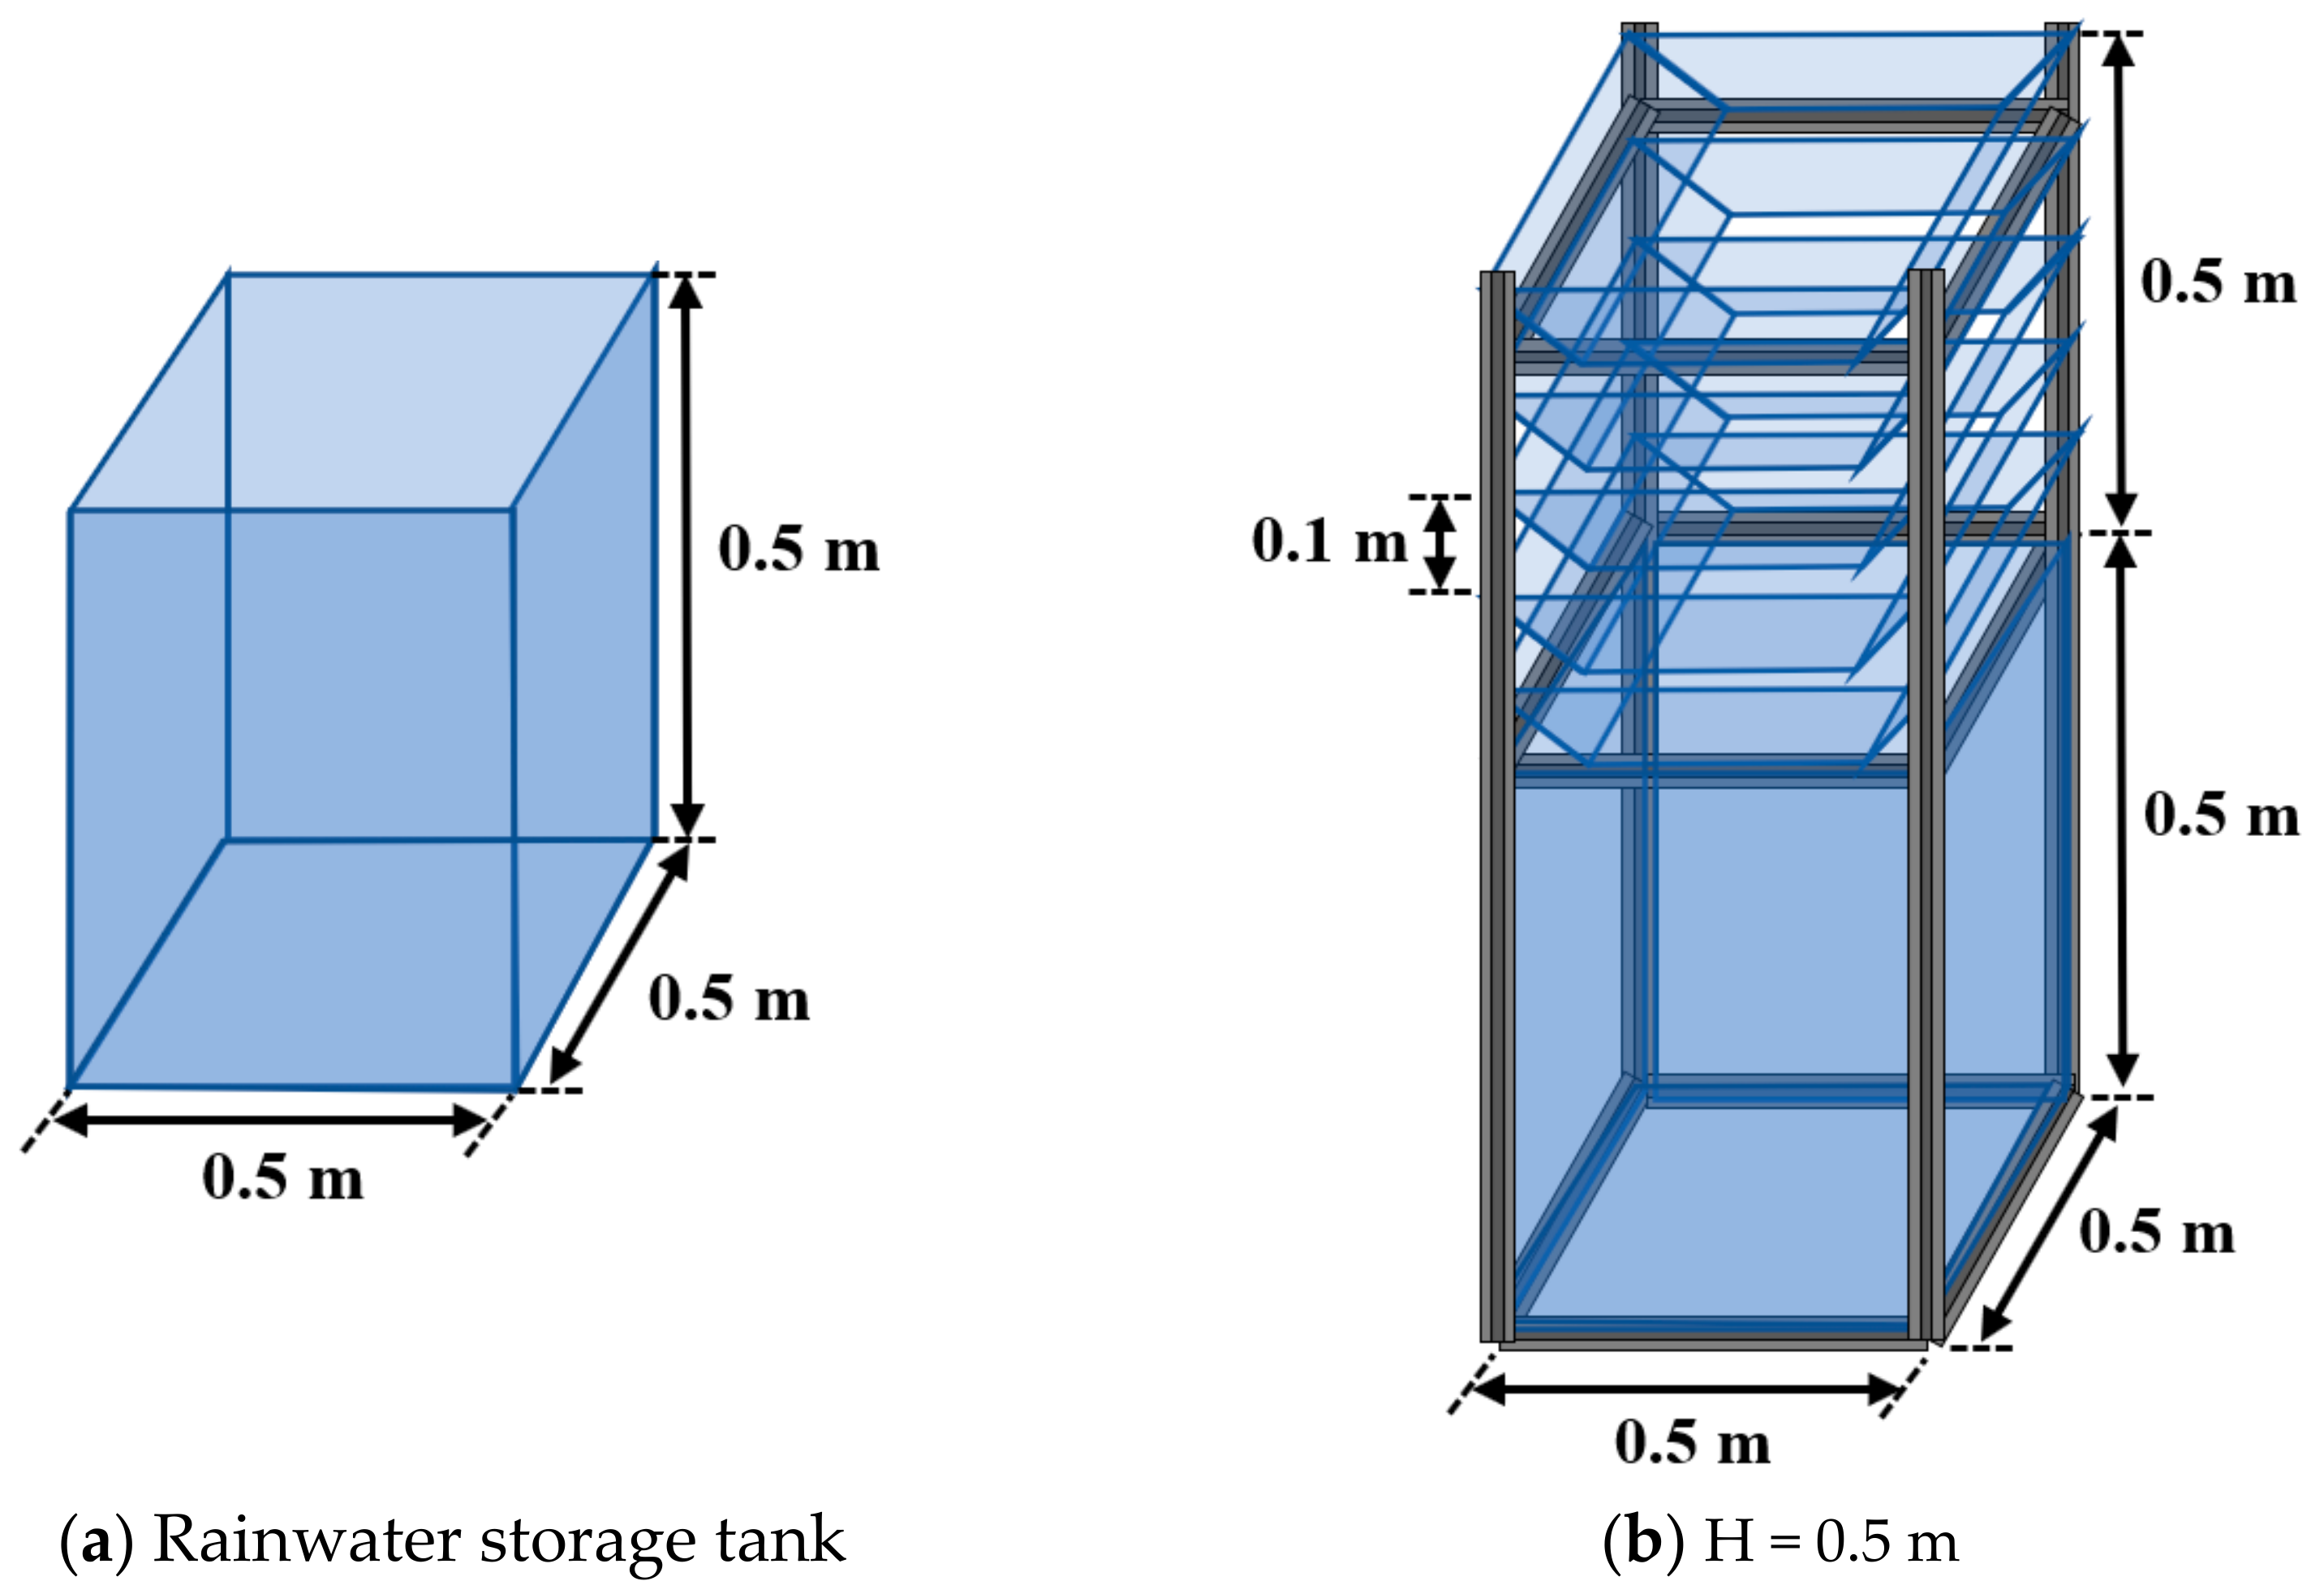
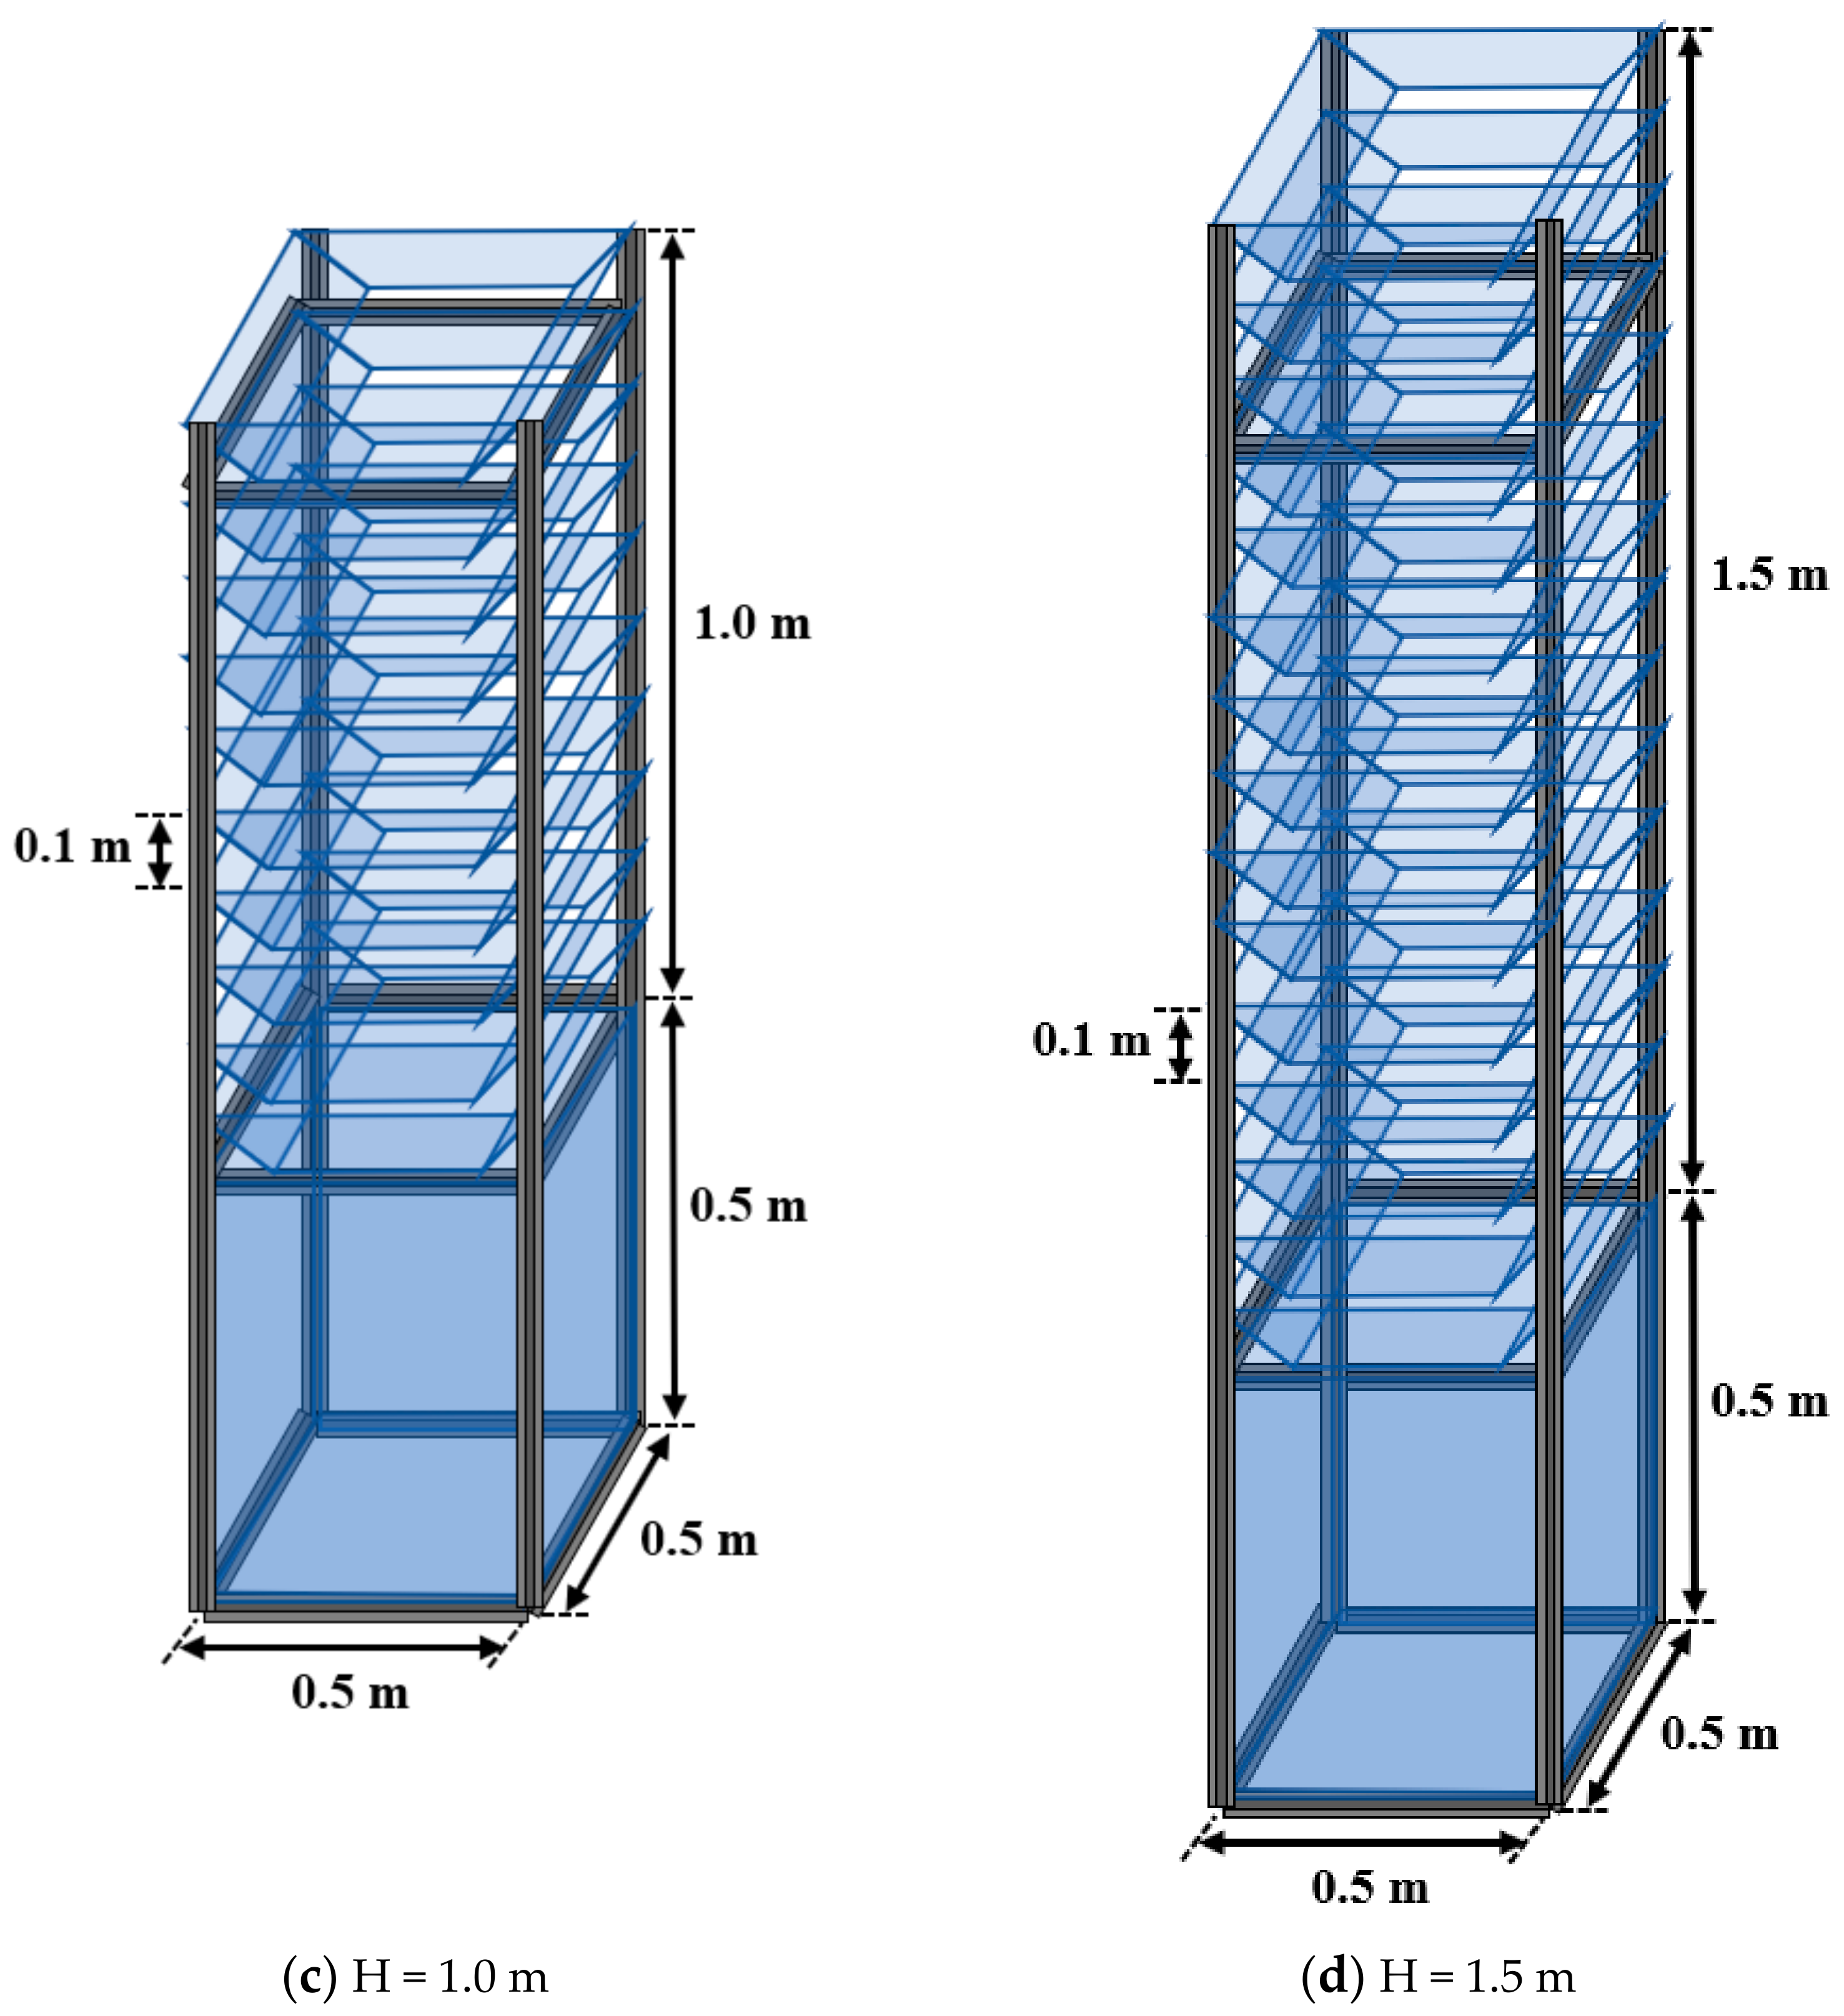
3.2. Observation of WDR Harvesting

This study additionally prepared a WDR harvesting gauge to observe the rainwater harvested by the building wall. This gauge has the shape of a miniature building, which collects the WDR on all four walls, as well as the rainfall on the horizontal plane of the rooftop. The rooftop of the miniature building is simply open. Three different WDR harvesting gauges were prepared in this study. All of these WDR harvesting gauges had the same 0.5 m width rectangular base but different heights of 1.0 m, 1.5 m, and 2.0 m. As the bottom part of this gauge (0.5 m height) is used for the storage tank of harvested rainwater, the height of the building wall for WDR harvesting becomes 0.5 m, 1.0 m, and 1.5 m, respectively. When using only this bottom part, as the top is open, only the rainfall on the building roof is harvested. Figure 5 shows the shapes of these three WDR harvesting gauges, and that the WDR colliding with the building wall is all collected by the WDR harvesting gauge. The WDR on the building wall is guided into the storage tank by the rain lead, which is just 3 mm thick and located every 10 cm. It is also slanted downward by 60 degrees, to prevent the WDR from dripping off. This structure is the same for all four sides of the WDR harvesting gauge.
The amount of rainwater collected by the WDR harvesting gauge was also observed as event-based. That is, only the beginning time, end time, and the total amount of harvested rainwater were observed. The same 15 rainfall events could be observed from 24 June to 7 September 2020, as with the WDR measurement. The measurements also include the case of using only the storage tank, which represents the case of considering only the building roof for rainwater harvesting.

4. Validation of the Observed Data
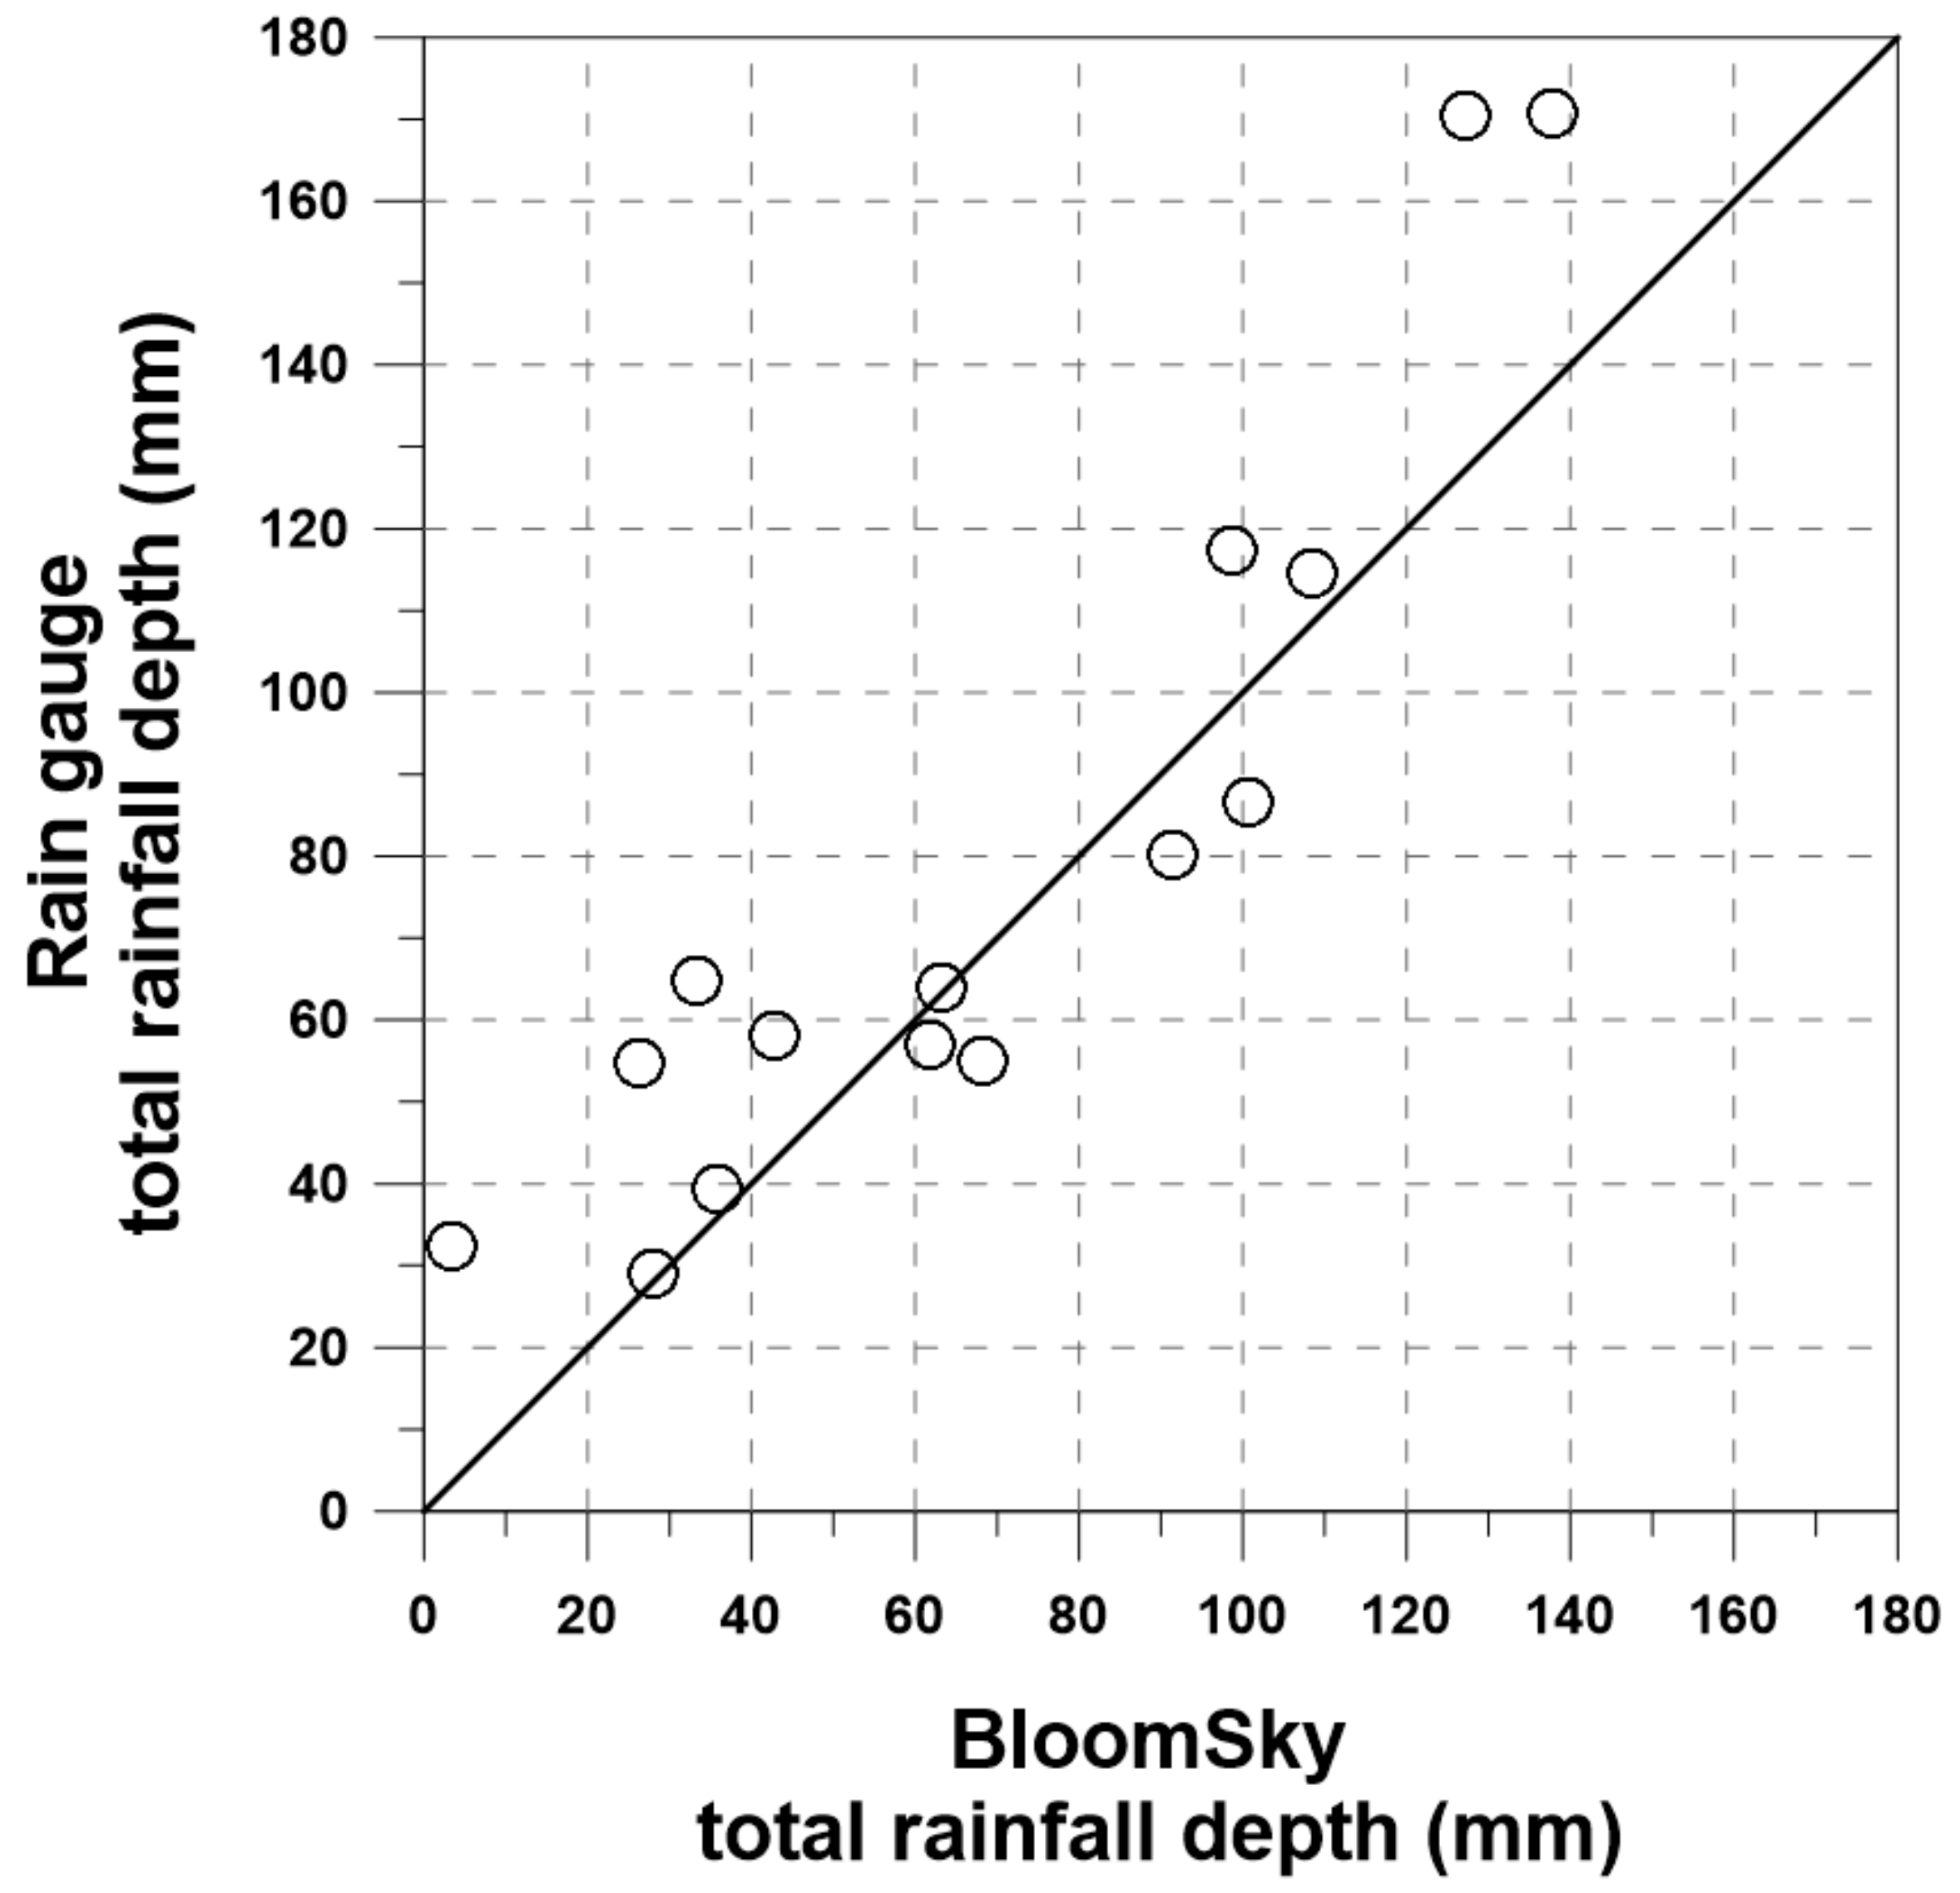
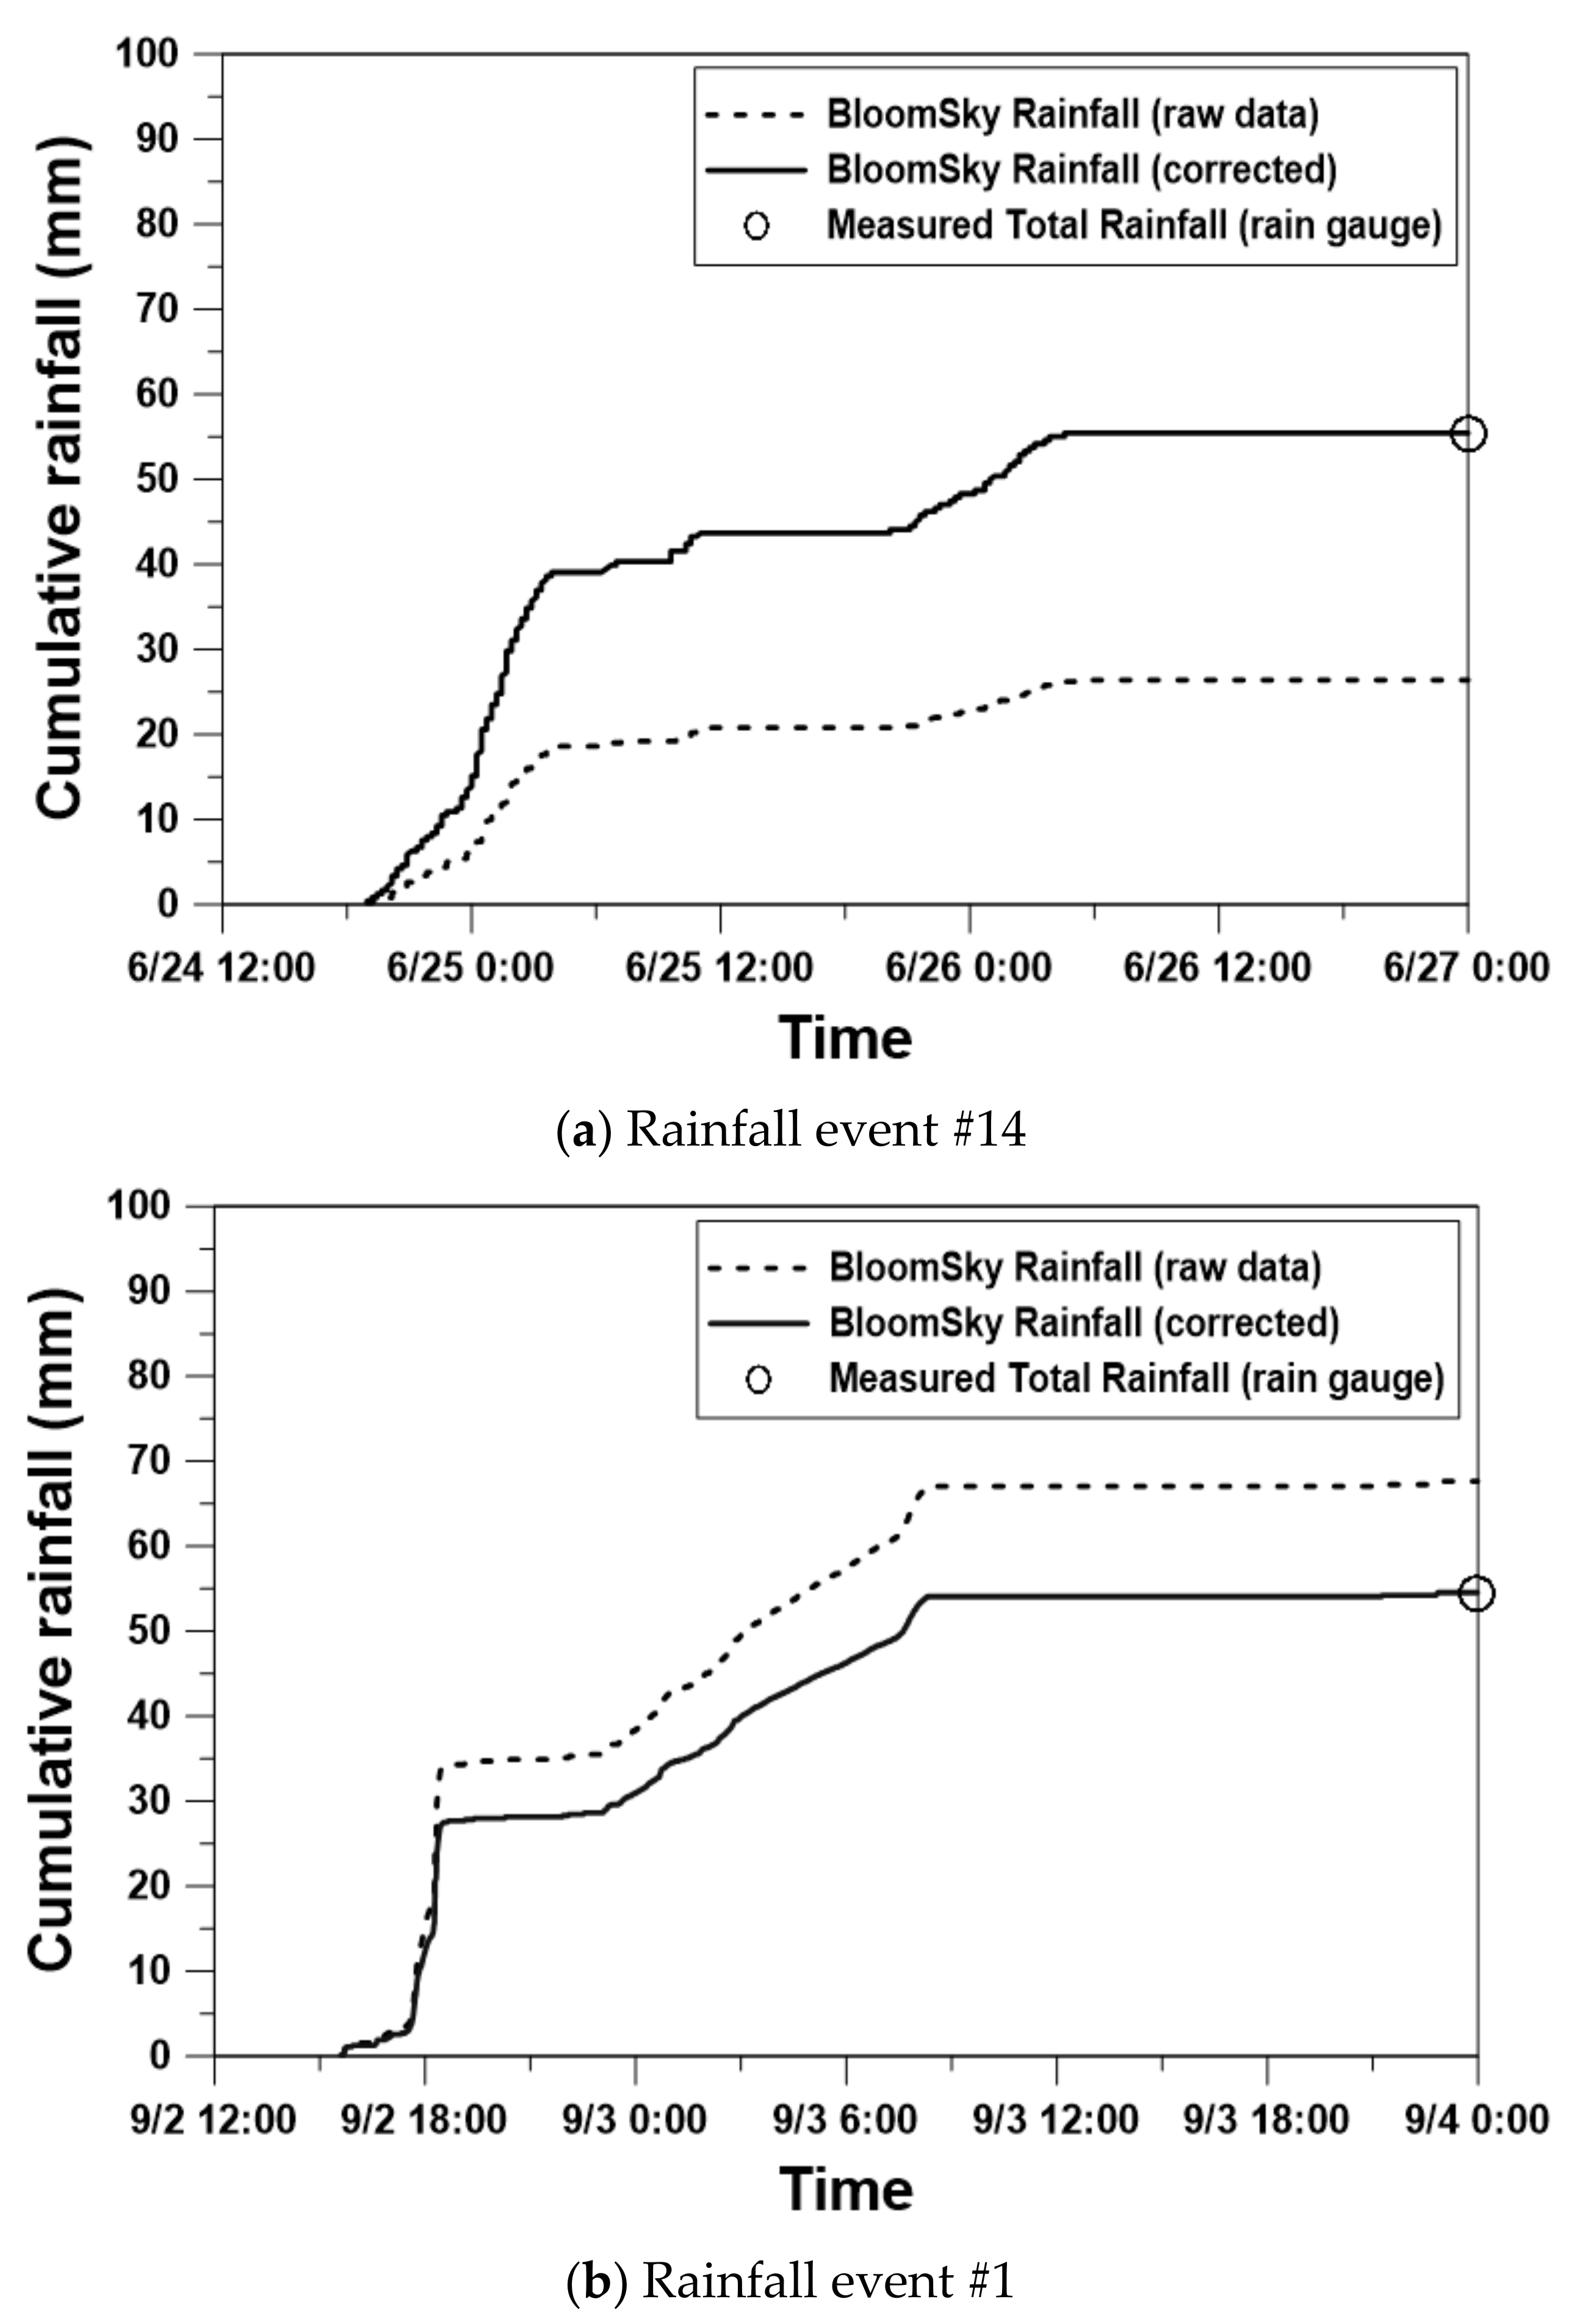
4.1. Rainfall Data

As mentioned in the previous sections, this study used the four rain gauges (mass cylinder type) and BloomSky (tipping-bucket type) to obtain additional information about the rainfall falling on a horizontal surface. Even though the rain gauge data are nothing but the total rainfall depth for each rainfall event, BloomSky data are one-minute data, i.e., the temporally distributed data over the entire rainfall duration. The information about the rainfall duration could also be derived from BloomSky data. On the other hand, the rain gauge data, i.e., the total rainfall depth for each rainfall event, was assumed to be the ground truth in this study. Table 1 compares the rain gauge data and BloomSky data for the total of 15 rainfall events obtained in this study. The mean rainfall intensity was derived by simply dividing the total amount of rainfall by the rainfall duration.
Table 1 shows that the rain gauge measurements were quite similar to BloomSky ones. Their correlation coefficient was also estimated to be very high at 0.94 for the mean rainfall intensity data, and 0.91 for the total rainfall depth data. However, they were not exactly the same, and included some amount of random difference. The scatterplot of these two data also shows their relation (Figure 6). Overall, while the rain gauge data seem to be slightly higher than BloomSky data, it is also possible to find the opposite cases. The average value of rain gauge data was 79.6 mm, while that of BloomSky data was 68.5 mm. The standard deviations of the rain gauge and BloomSky data were 45.0 mm and 40.5 mm, respectively. The largest difference was found in event #7, and the least difference in event #13. Neither the total rainfall depth nor the mean rainfall intensity were found to be the dominant causes of the difference between the two data. The size of the difference, as well as its sign, seems to be rather random.
This study assumed that the temporal distribution of BloomSky data was valid, and the total rainfall depth observed by the rain gauge was correct. As a result, by combining these two data, i.e., simply by multiplying the ratio between the total rainfall depths of the rain gauge and BloomSky, the temporally distributed rainfall data could be derived. Figure 7 shows the procedure for deriving the temporally distributed rainfall data by combining the two different data. The dotted line in this figure represents the accumulated rainfall data of BloomSky, and the empty circle represents the total rainfall depth observed by the rain gauge. Finally, the solid line represents the derived temporally accumulated rainfall data. Figure 7a shows the case where the BloomSky data were lower than the rain gauge data, while Figure 7b shows the opposite case. As BloomSky provides one-minute data, the derived data also became one-minute data. Additionally, this study considered other accumulation times for further analysis, which included 5 min, 10 min, 30 min, and 1 h, as well as the total amount of rainfall for each rainfall event.

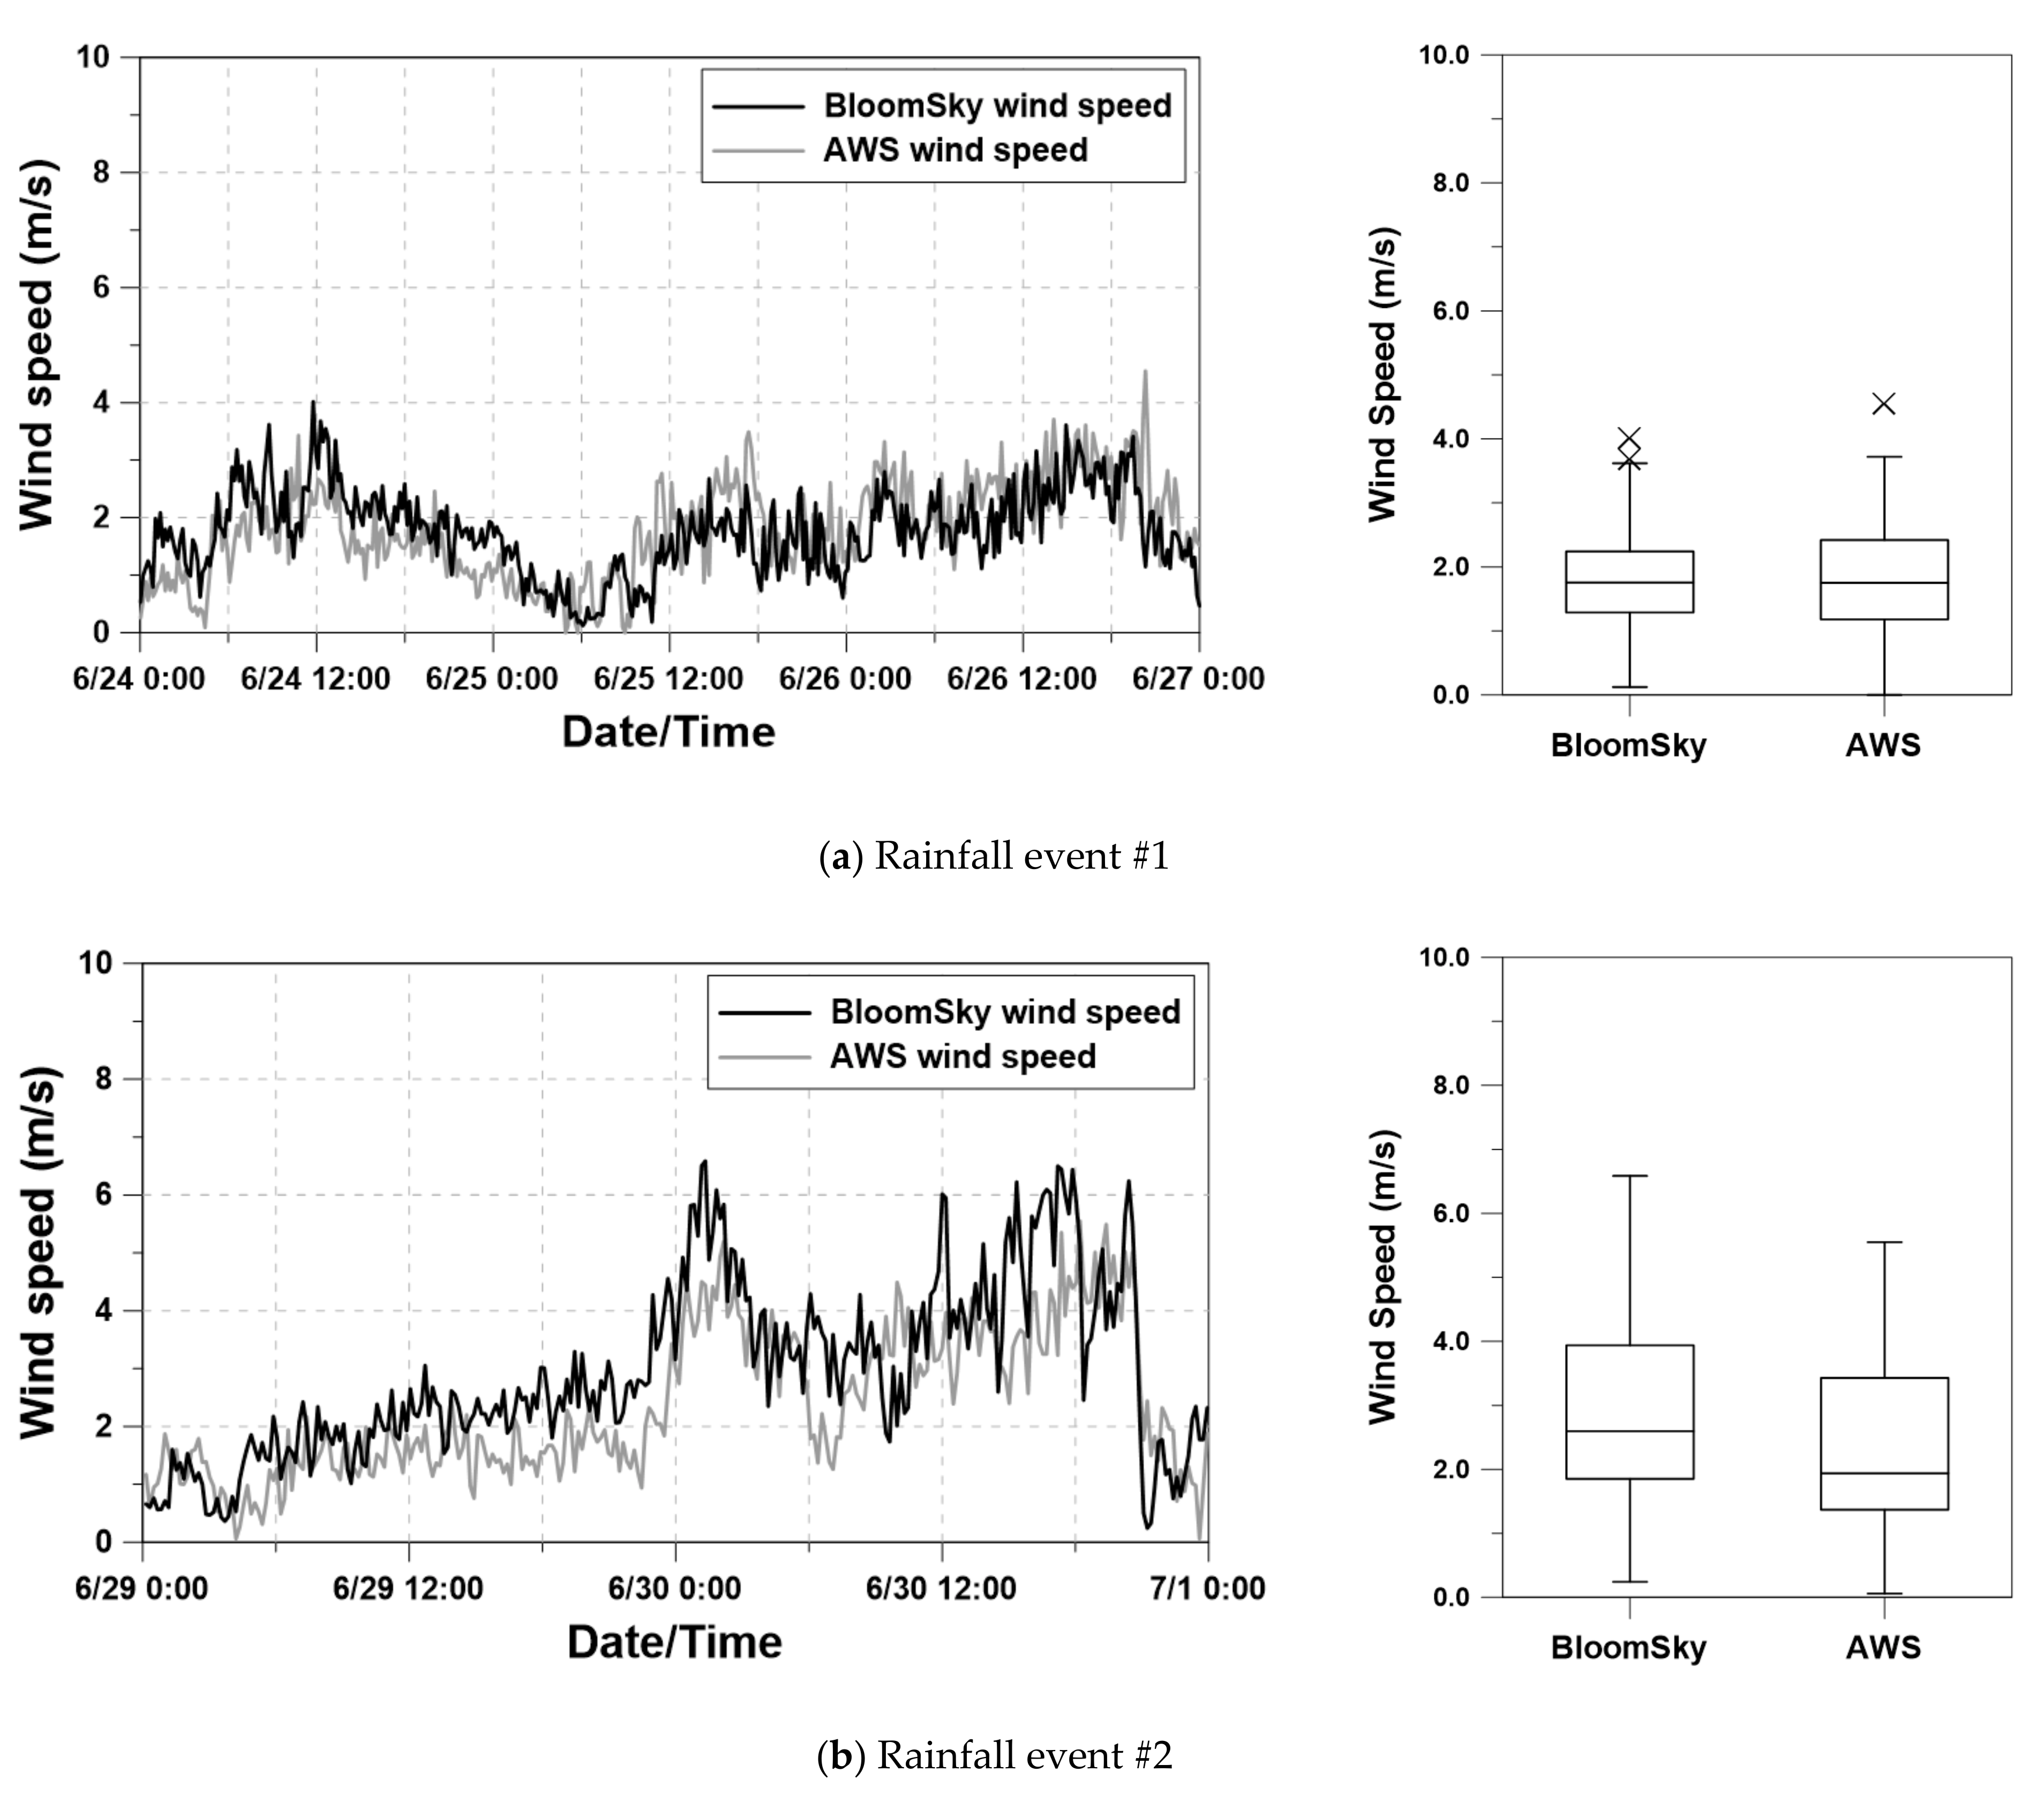
4.2. Wind Speed Data

The mean wind speed values recorded by BloomSky for those 15 rainfall events ranged from 1.2 m/s to 3.3 m/s. This wind speed was derived as the arithmetic average of the one-minute wind speed data over the rainfall duration. To validate this wind speed, this study compared it with the wind speed data from Dongdaemoon AWS. The distance between the Engineering Building and this AWS was about 3.1 km. This AWS also provided one-minute wind speed data. Figure 8 shows that the comparison of these two wind speed data was carried out independently for each rainfall event. To compare two data more clearly, both data were time-averaged as 10 min data and compared with statistical observes, similar to the correlation coefficient. In fact, the two panels of this figure are those with high and low correlation coefficients, respectively.
Figure 8 shows that the two data share the same overall trend of increases and decreases. In the case with the high correlation coefficient (Figure 8a), the difference between their mean speeds was small, at just 0.03 m/s (i.e., 1.77 m/s for the BloomSky data vs. 1.80 m/s for the AWS data), and the standard deviation was also similar (i.e., 0.73 m/s for the BloomSky data vs. 0.83 m/s for the AWS data). On the other hand, in the case with the low correlation coefficient (Figure 8b), the mean speed observed by BloomSky was about 0.56 m/s higher than the AWS (i.e., 2.92 m/s vs. 2.36 m/s). However, the standard deviation was observed rather similarly with their difference being just 0.25 m/s (i.e., 1.51 m/s vs. 1.26 m/s). Table 2 summarizes these basic statistics of the wind speed data for the 15 rainfall events.
Table 2 shows that the basic statistics of the wind speed data observed by BloomSky were quite similar to those observed by the AWS. That is, the overall trends, as well as their actual values, were found to be very similar to each other. When considering all the data together, their difference was found to be even smaller. That is, the overall mean of the BloomSky data was 2.09 m/s, while that of the AWS was 2.13 m/s. The overall standard deviation of the BloomSky data was 1.68 m/s, while that of the AWS data was 1.58 m/s. Based on this evaluation result, the authors assumed that the BloomSky wind speed data could be used without any further correction. As in the case of rainfall data analysis, several time-averaged wind speed data were also derived for further analysis, which include 5 min, 10 min, 30 min, 1 h, and the entire duration of each rainfall event.

5. Results

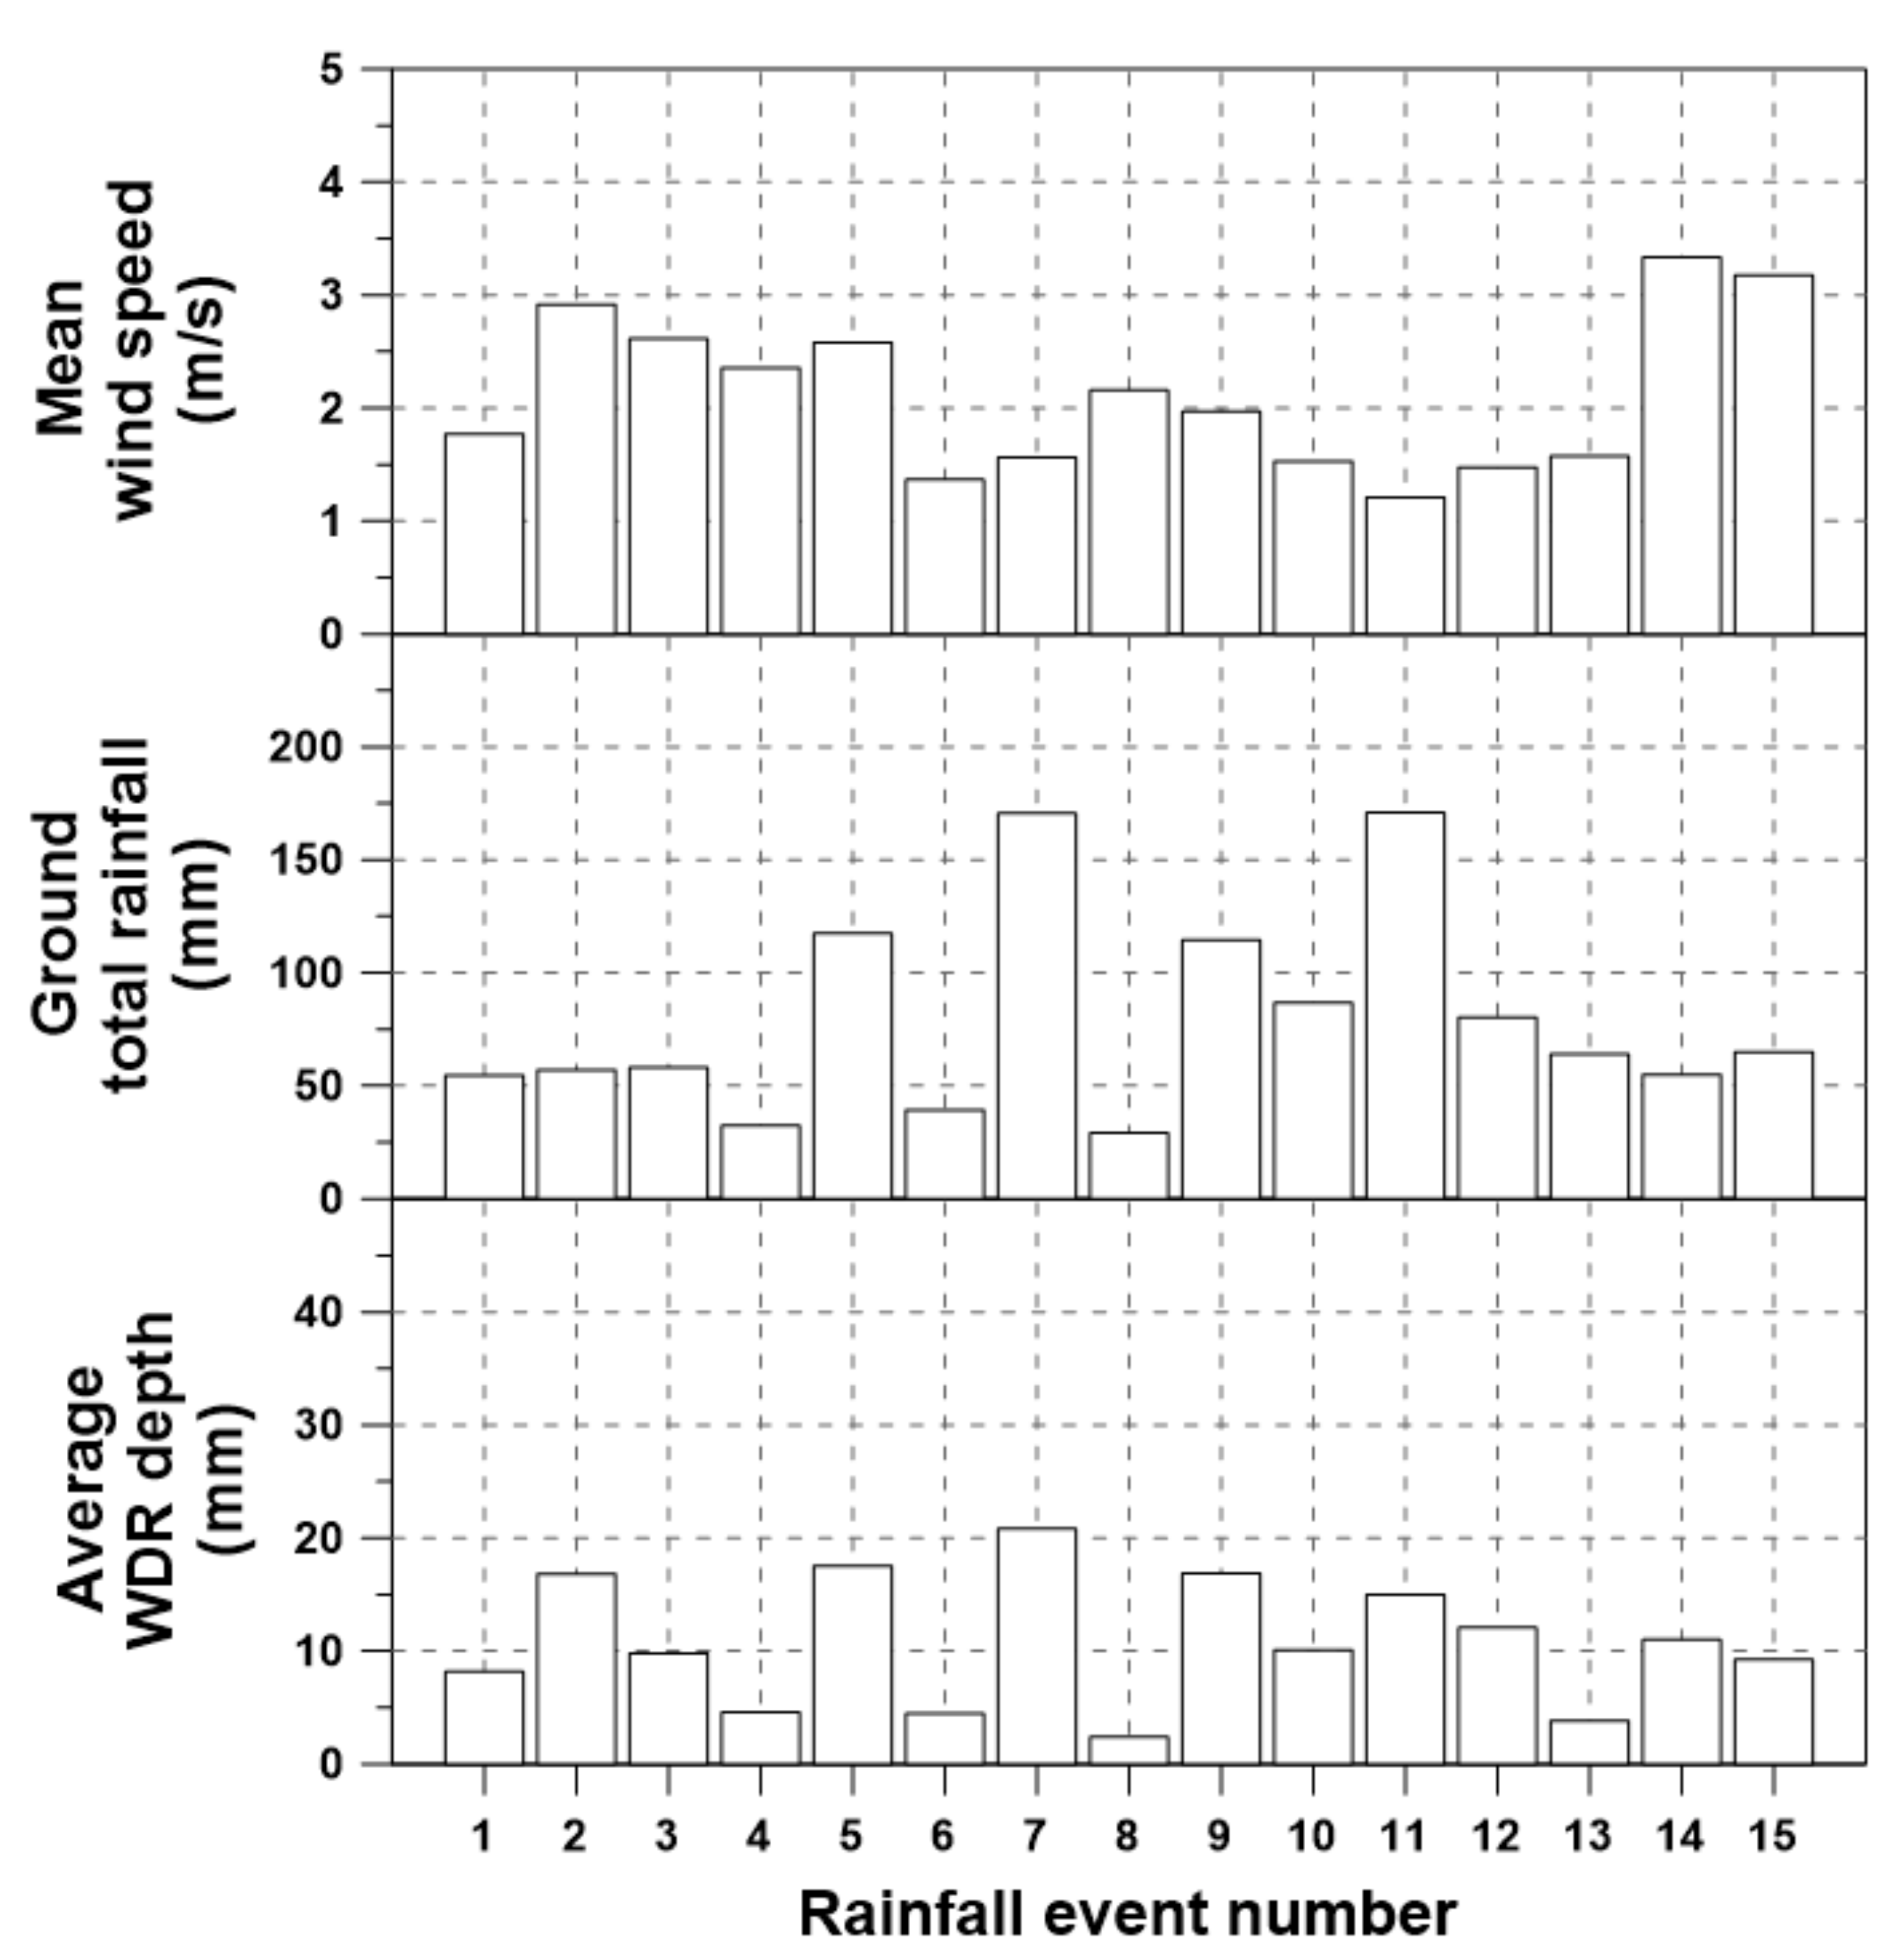
5.1. WDR vs. Ground Rain

This study observed the WDR by the unit of rainfall event. That is, only the total WDR was observed over the entire rainfall duration. The WDR was observed by a total of 36 WDR gauges attached to the four walls of the miniature building. The reason for using nine gauges per building wall was to consider the spatial distribution of WDR over the building wall. The WDR for the given miniature building was then determined as their arithmetic average. Figure 9 compares the average WDRs for the 15 rainfall events considered in this study. This figure also provides the total rainfall depths observed by the rain gauges on the horizontal surface, and the mean wind speeds over the rainfall duration. Among the 15 rainfall events, the largest WDR was recorded as 20.8 mm by event #7, while the smallest one was recorded as 2.4 mm by event #8. The average of all 15 WDRs was estimated to be 10.9 mm.
Figure 9 shows some important characteristics of the WDR. First, the WDR is strongly affected by the total rainfall depth, thus its correlation is simply very high. For example, the rainfall events with a large total rainfall depth, such as events #5, #7, #9, and #11, also showed rather large WDR. On the other hand, those events with small total rainfall depth, such as events #4, #6, and #8, also showed rather small WDR. Second, the role of wind speed could be superior to the total rainfall depth in some events. It was not difficult to find cases in which the wind speed played the dominant role in determining the WDR. For example, events #13 and #14 were found to have similar total rainfall depths (i.e., 64.0 mm and 55.0 mm, respectively), but their WDRs were observed to be quite different. In fact, due to the low wind speed, the WDR of rainfall event #13 was observed to be significantly smaller than that of rainfall event #14 (i.e., 3.8 mm and 11.0 mm, respectively). The WDR of event #14 was almost three times that of event #13. Based on Equation (2), the WDR is linearly proportional to the wind speed.

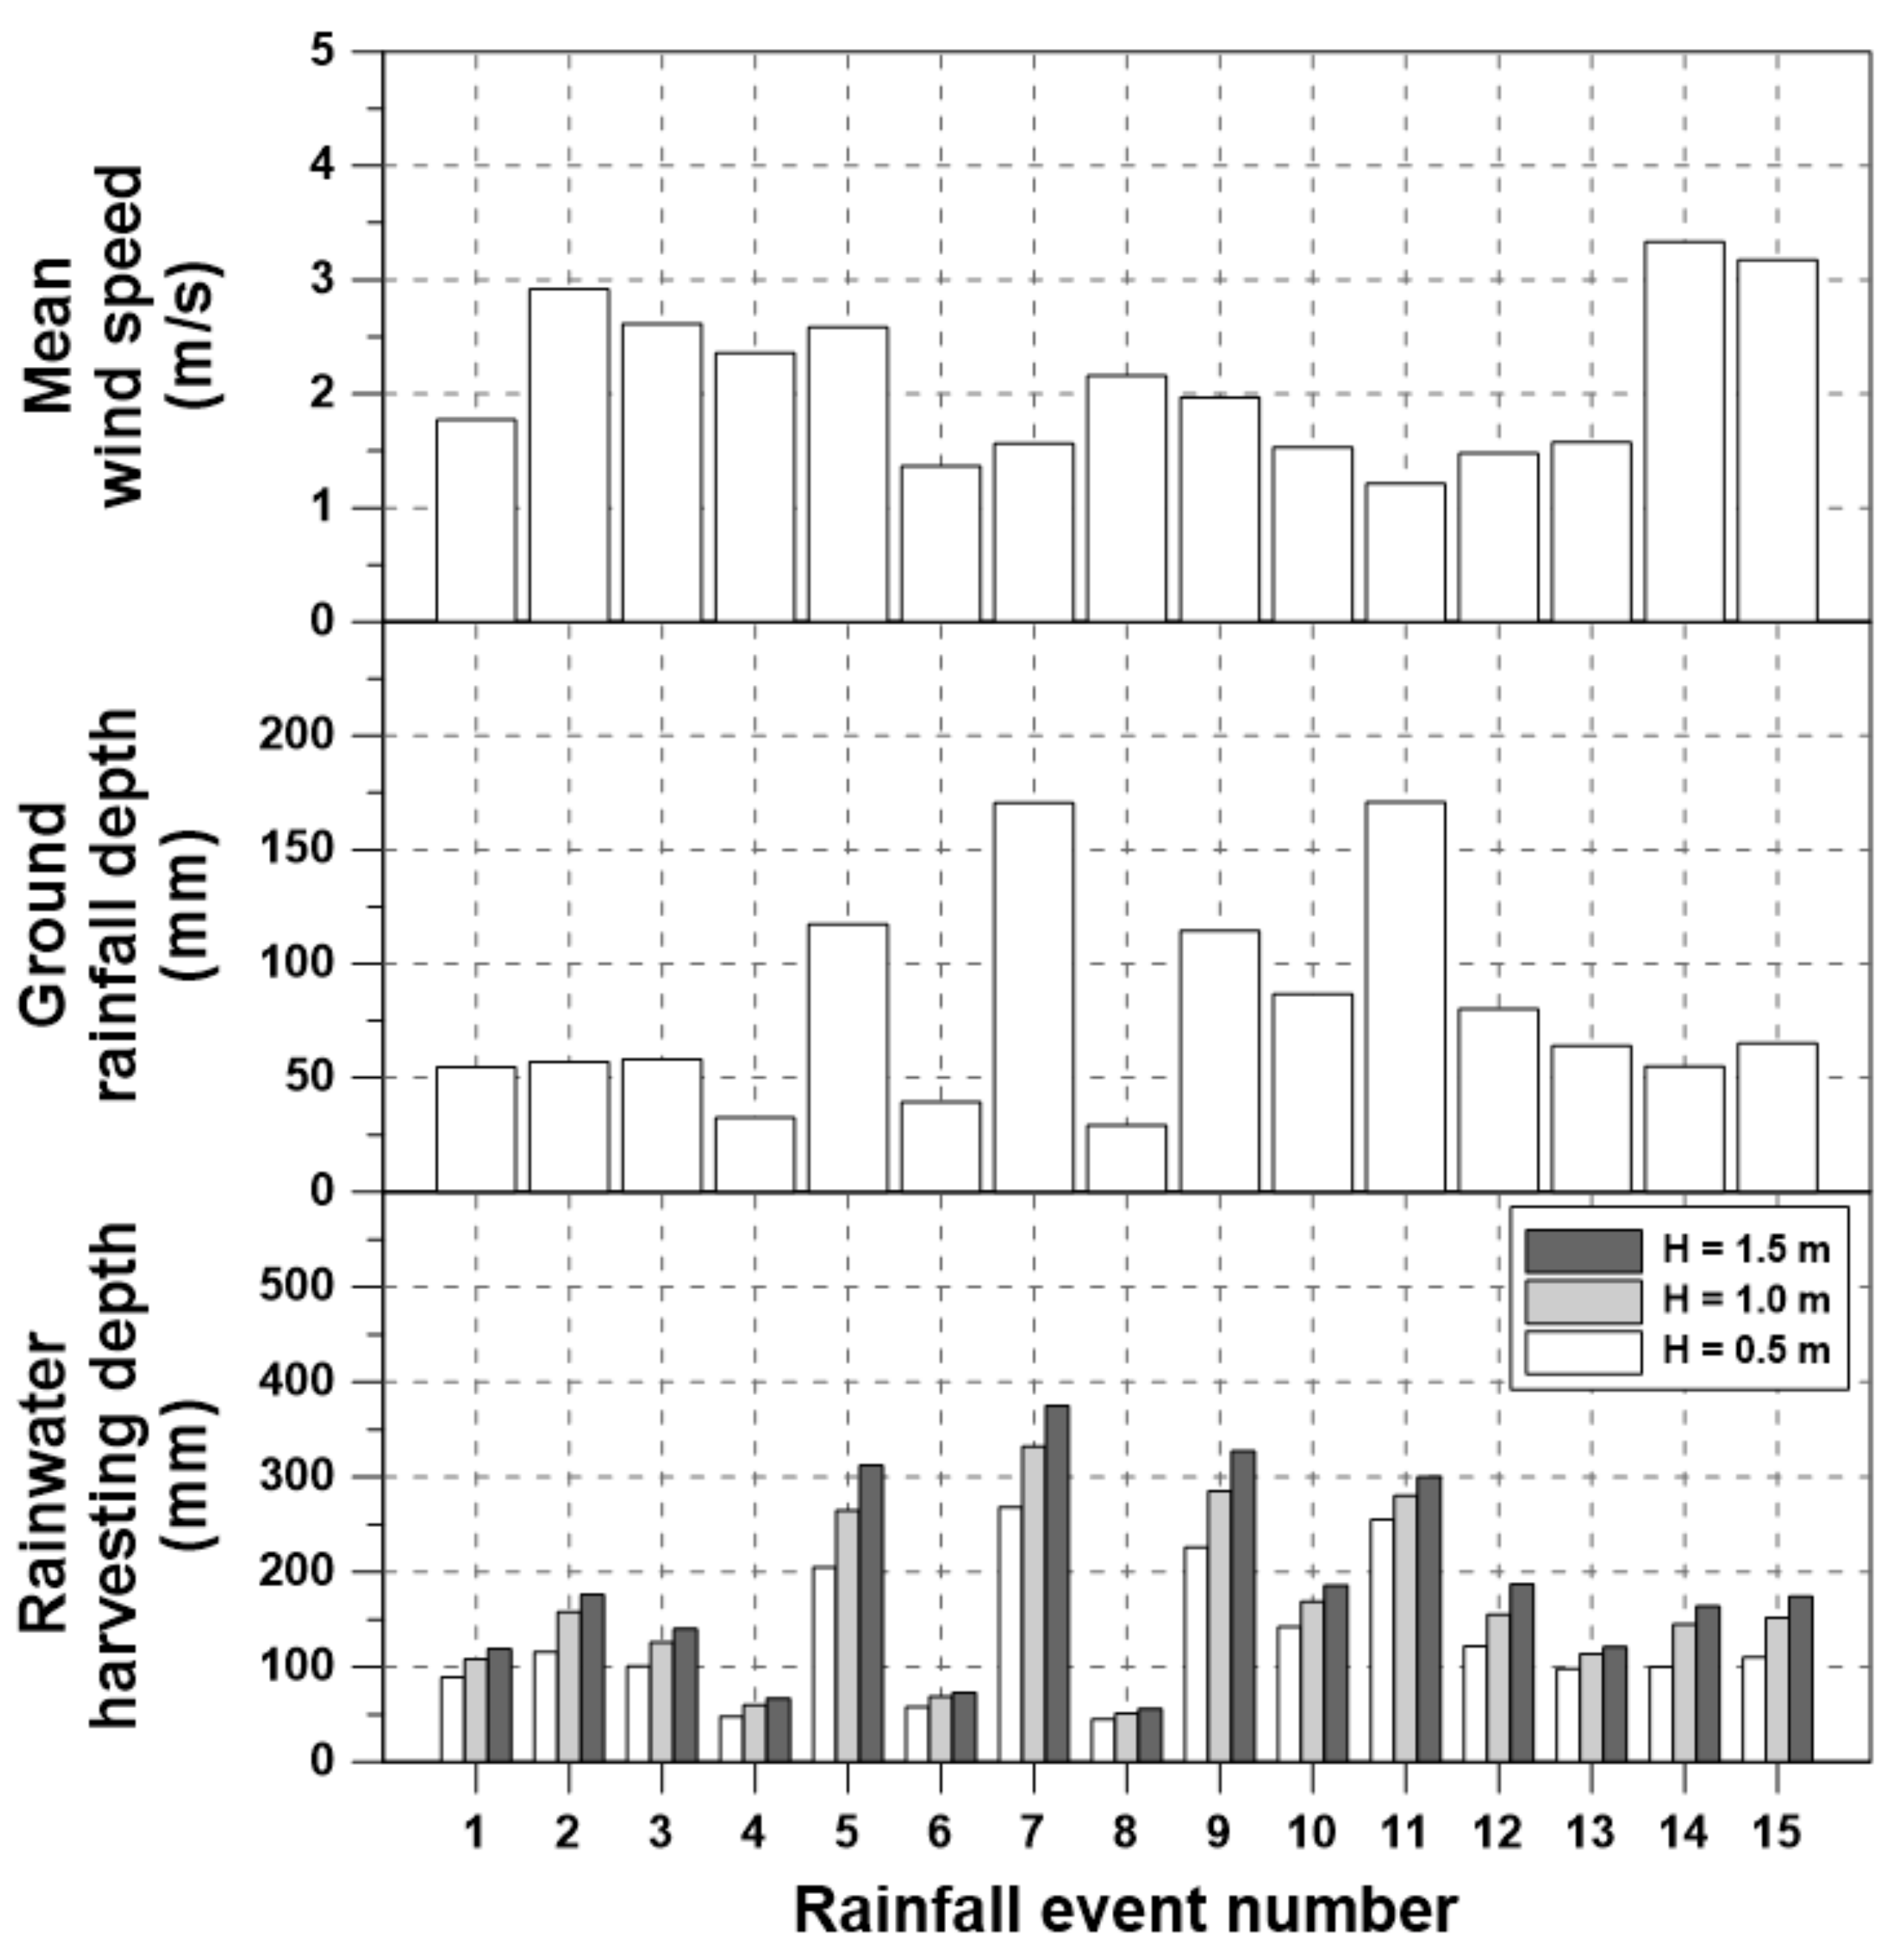
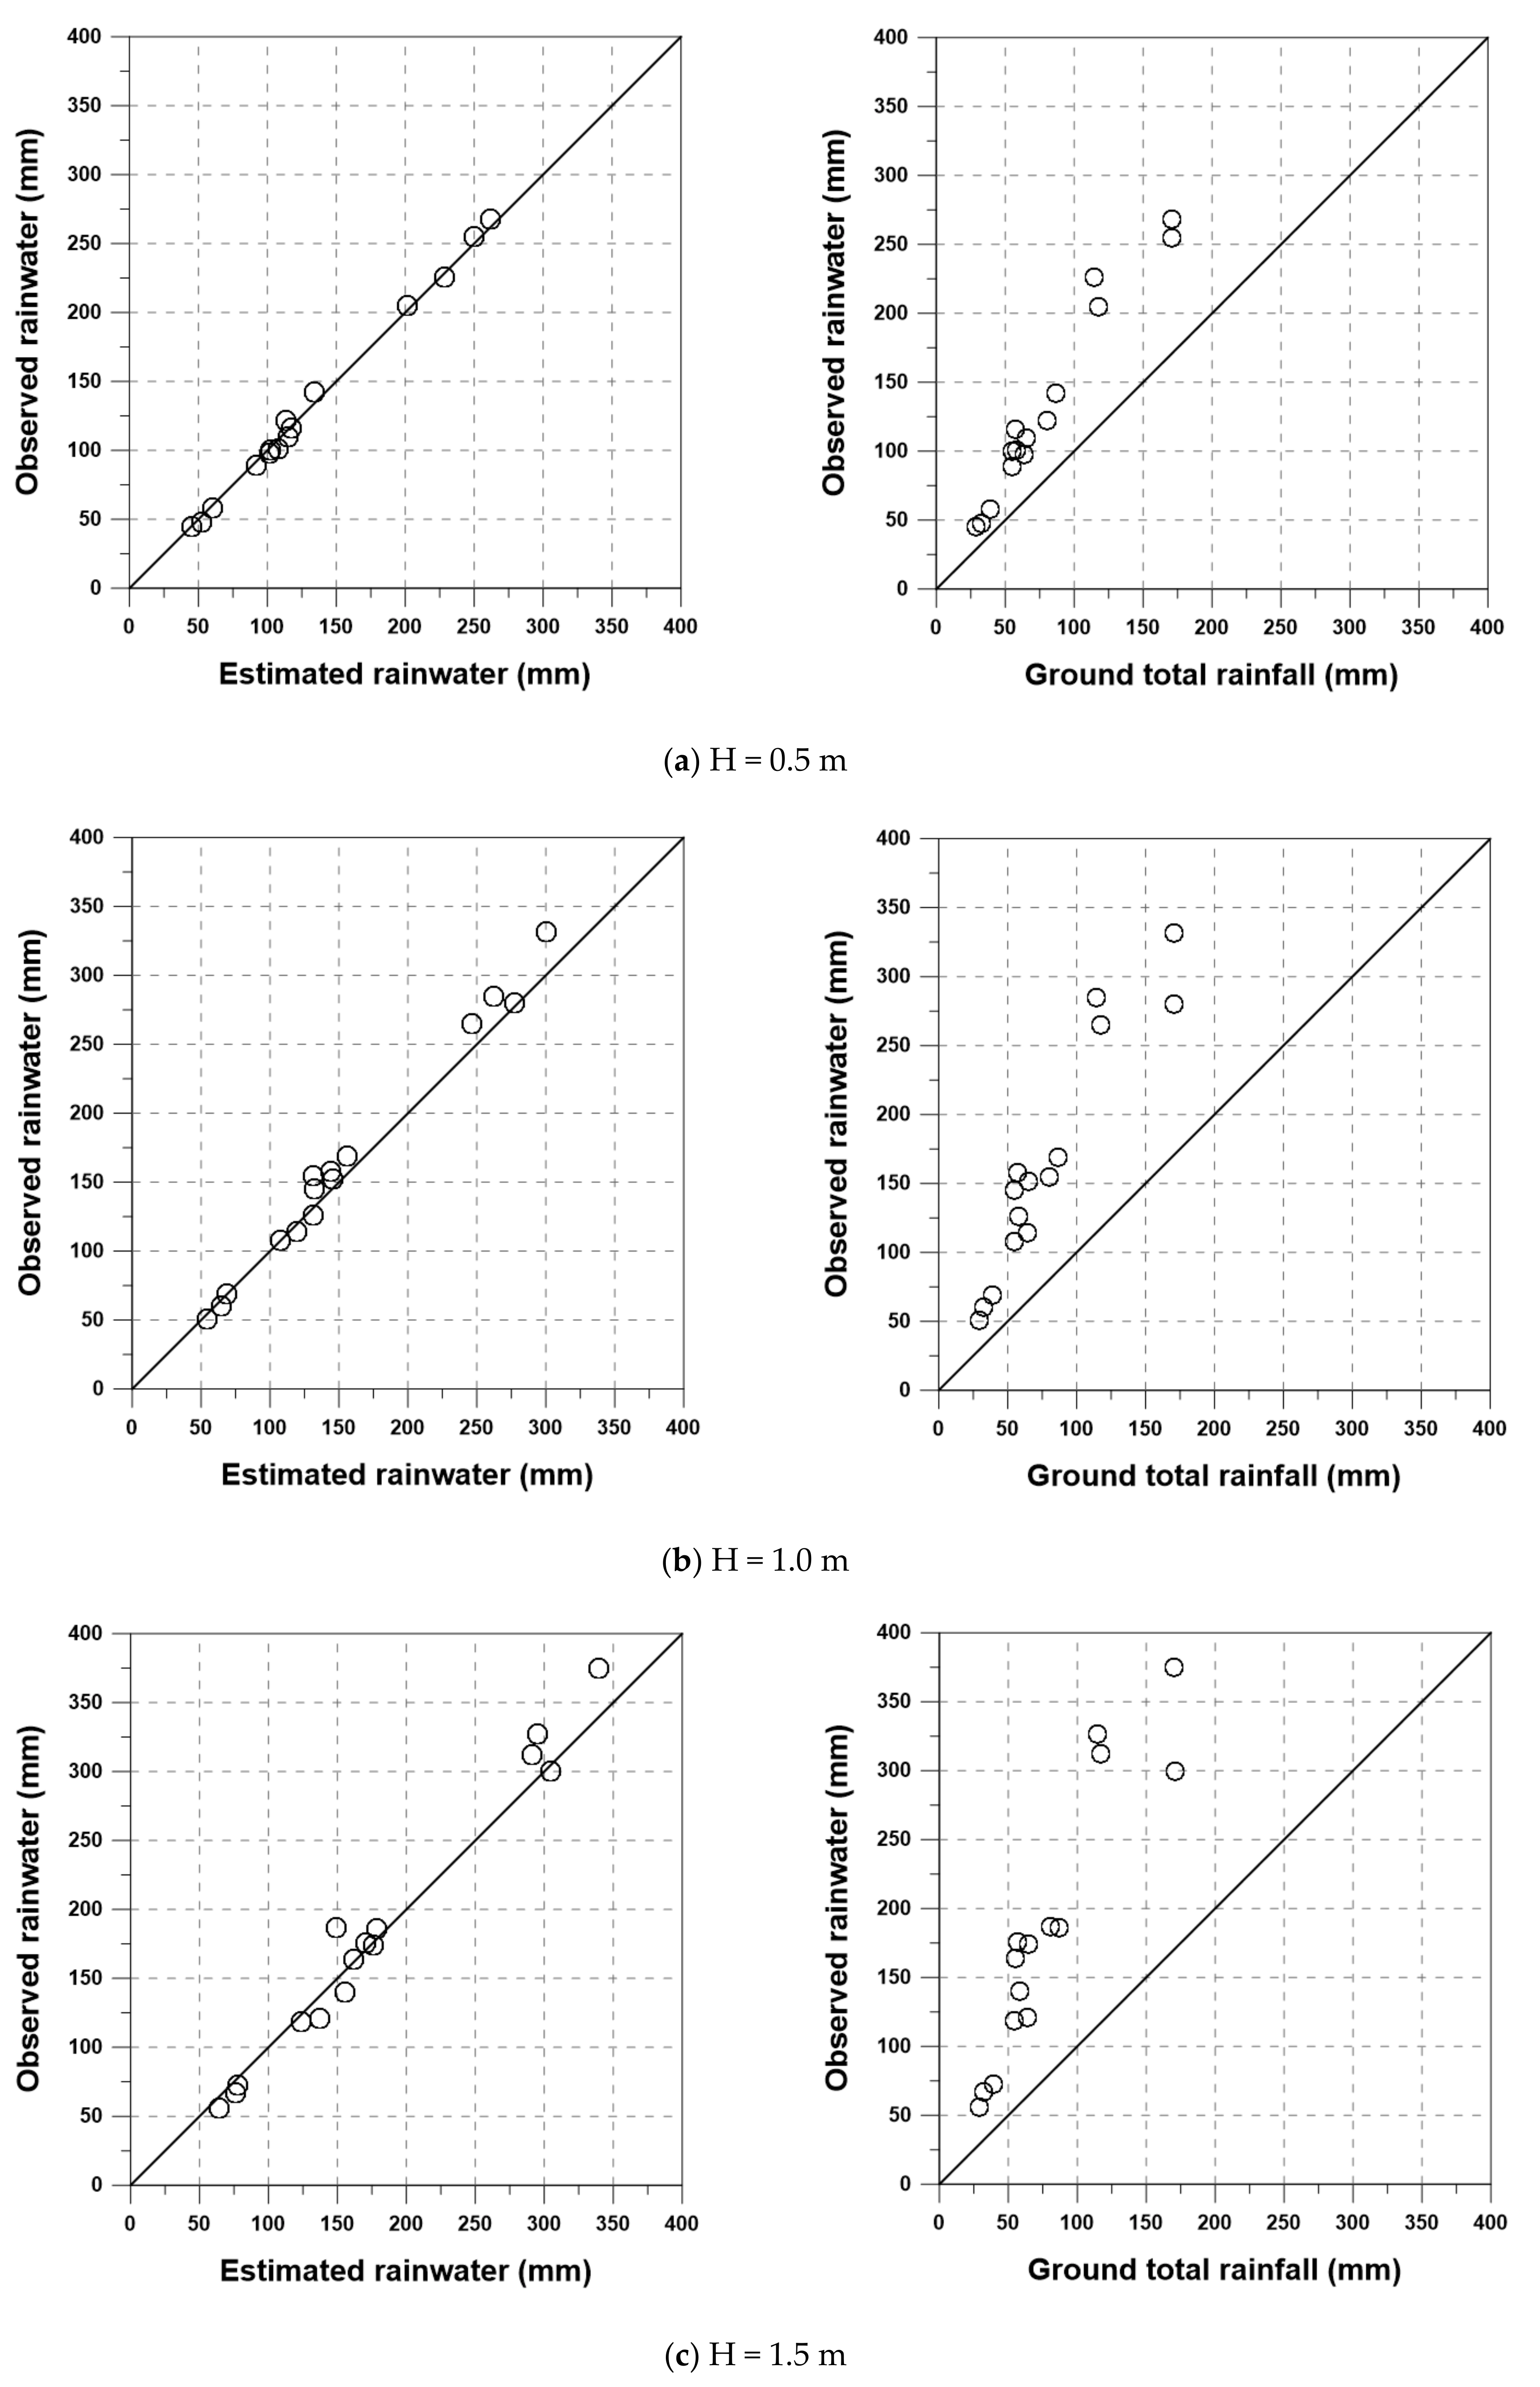
5.2. WDR Harvesting from the Building Wall

This study also observed the amount of rainwater harvested from both the building wall and building roof. As explained in Section 3, the WDR harvesting gauge has three different heights, i.e., 0.5 m, 1.0 m, and 1.5 m. Just as in the WDR measurements, the total amount of rainwater was observed for each rainfall event. As a result, a total of 15 measurements could be obtained in this study. The amount of harvested rainwater was observed by the depth of rainwater in the storage tank, which represents the total amount of harvested rainwater divided by the roof area (or the bottom area, since they are the same in this study). Figure 10 compares the mean wind speed, total rainfall depth observed on the horizontal surface, and total amount of rainwater harvested from both the building wall and building roof for each rainfall event.
In the bottom panel of Figure 10, the total amounts of rainwater collected by the three different WDR harvesting gauges were found to differ significantly from one another. First, the effect of the building wall could easily be determined. The amount of rainwater harvested by the WDR harvesting gauge was simply proportional to its height. That is, the average amounts of harvested rainwater were only 132.2 mm, 164.6 mm, and 185.1 mm for heights of the WDR harvesting gauge of 0.5 m, 1.0 m, and 1.5 m, respectively. Their standard deviations were also found to be proportional to the average and were 72.6 mm, 87.4 mm, and 99.9 mm, respectively.
Figure 10 also confirms that the rainwater amount collected by the WDR harvesting gauge is essentially proportional to the total rainfall observed on the horizontal surface. For example, both the total rainfall depth and the amount of rainwater harvested at event #7 were all greater than the other measurements. On the other hand, both the total rainfall depth and the rainwater harvested at event #8 were all the smallest. However, it was also found that this linear relation could be broken by the wind speed. Even though the total rainfall depth of rainfall event #14 was smaller by about 15% than that of event #13, the rainwater harvested for rainfall event #14 was larger by about 21%. This was mainly due to the higher wind speed, i.e., the wind speed of rainfall event #14 was about 27% higher than that of event #13. As explained by Equation (2), the effect of wind speed on WDR harvesting becomes more significant when it is higher. The effect of wind speed can be quantified by the ratio between the amount of WDR harvested by the gauge of height 1.5 m, and that by the gauge of height 0.5 m. For example, rainfall event #11 with the lowest wind speed showed that the ratio was just 1.18. On the other hand, it became as high as 1.64 for rainfall event #12 with the highest wind speed.

6. Discussion

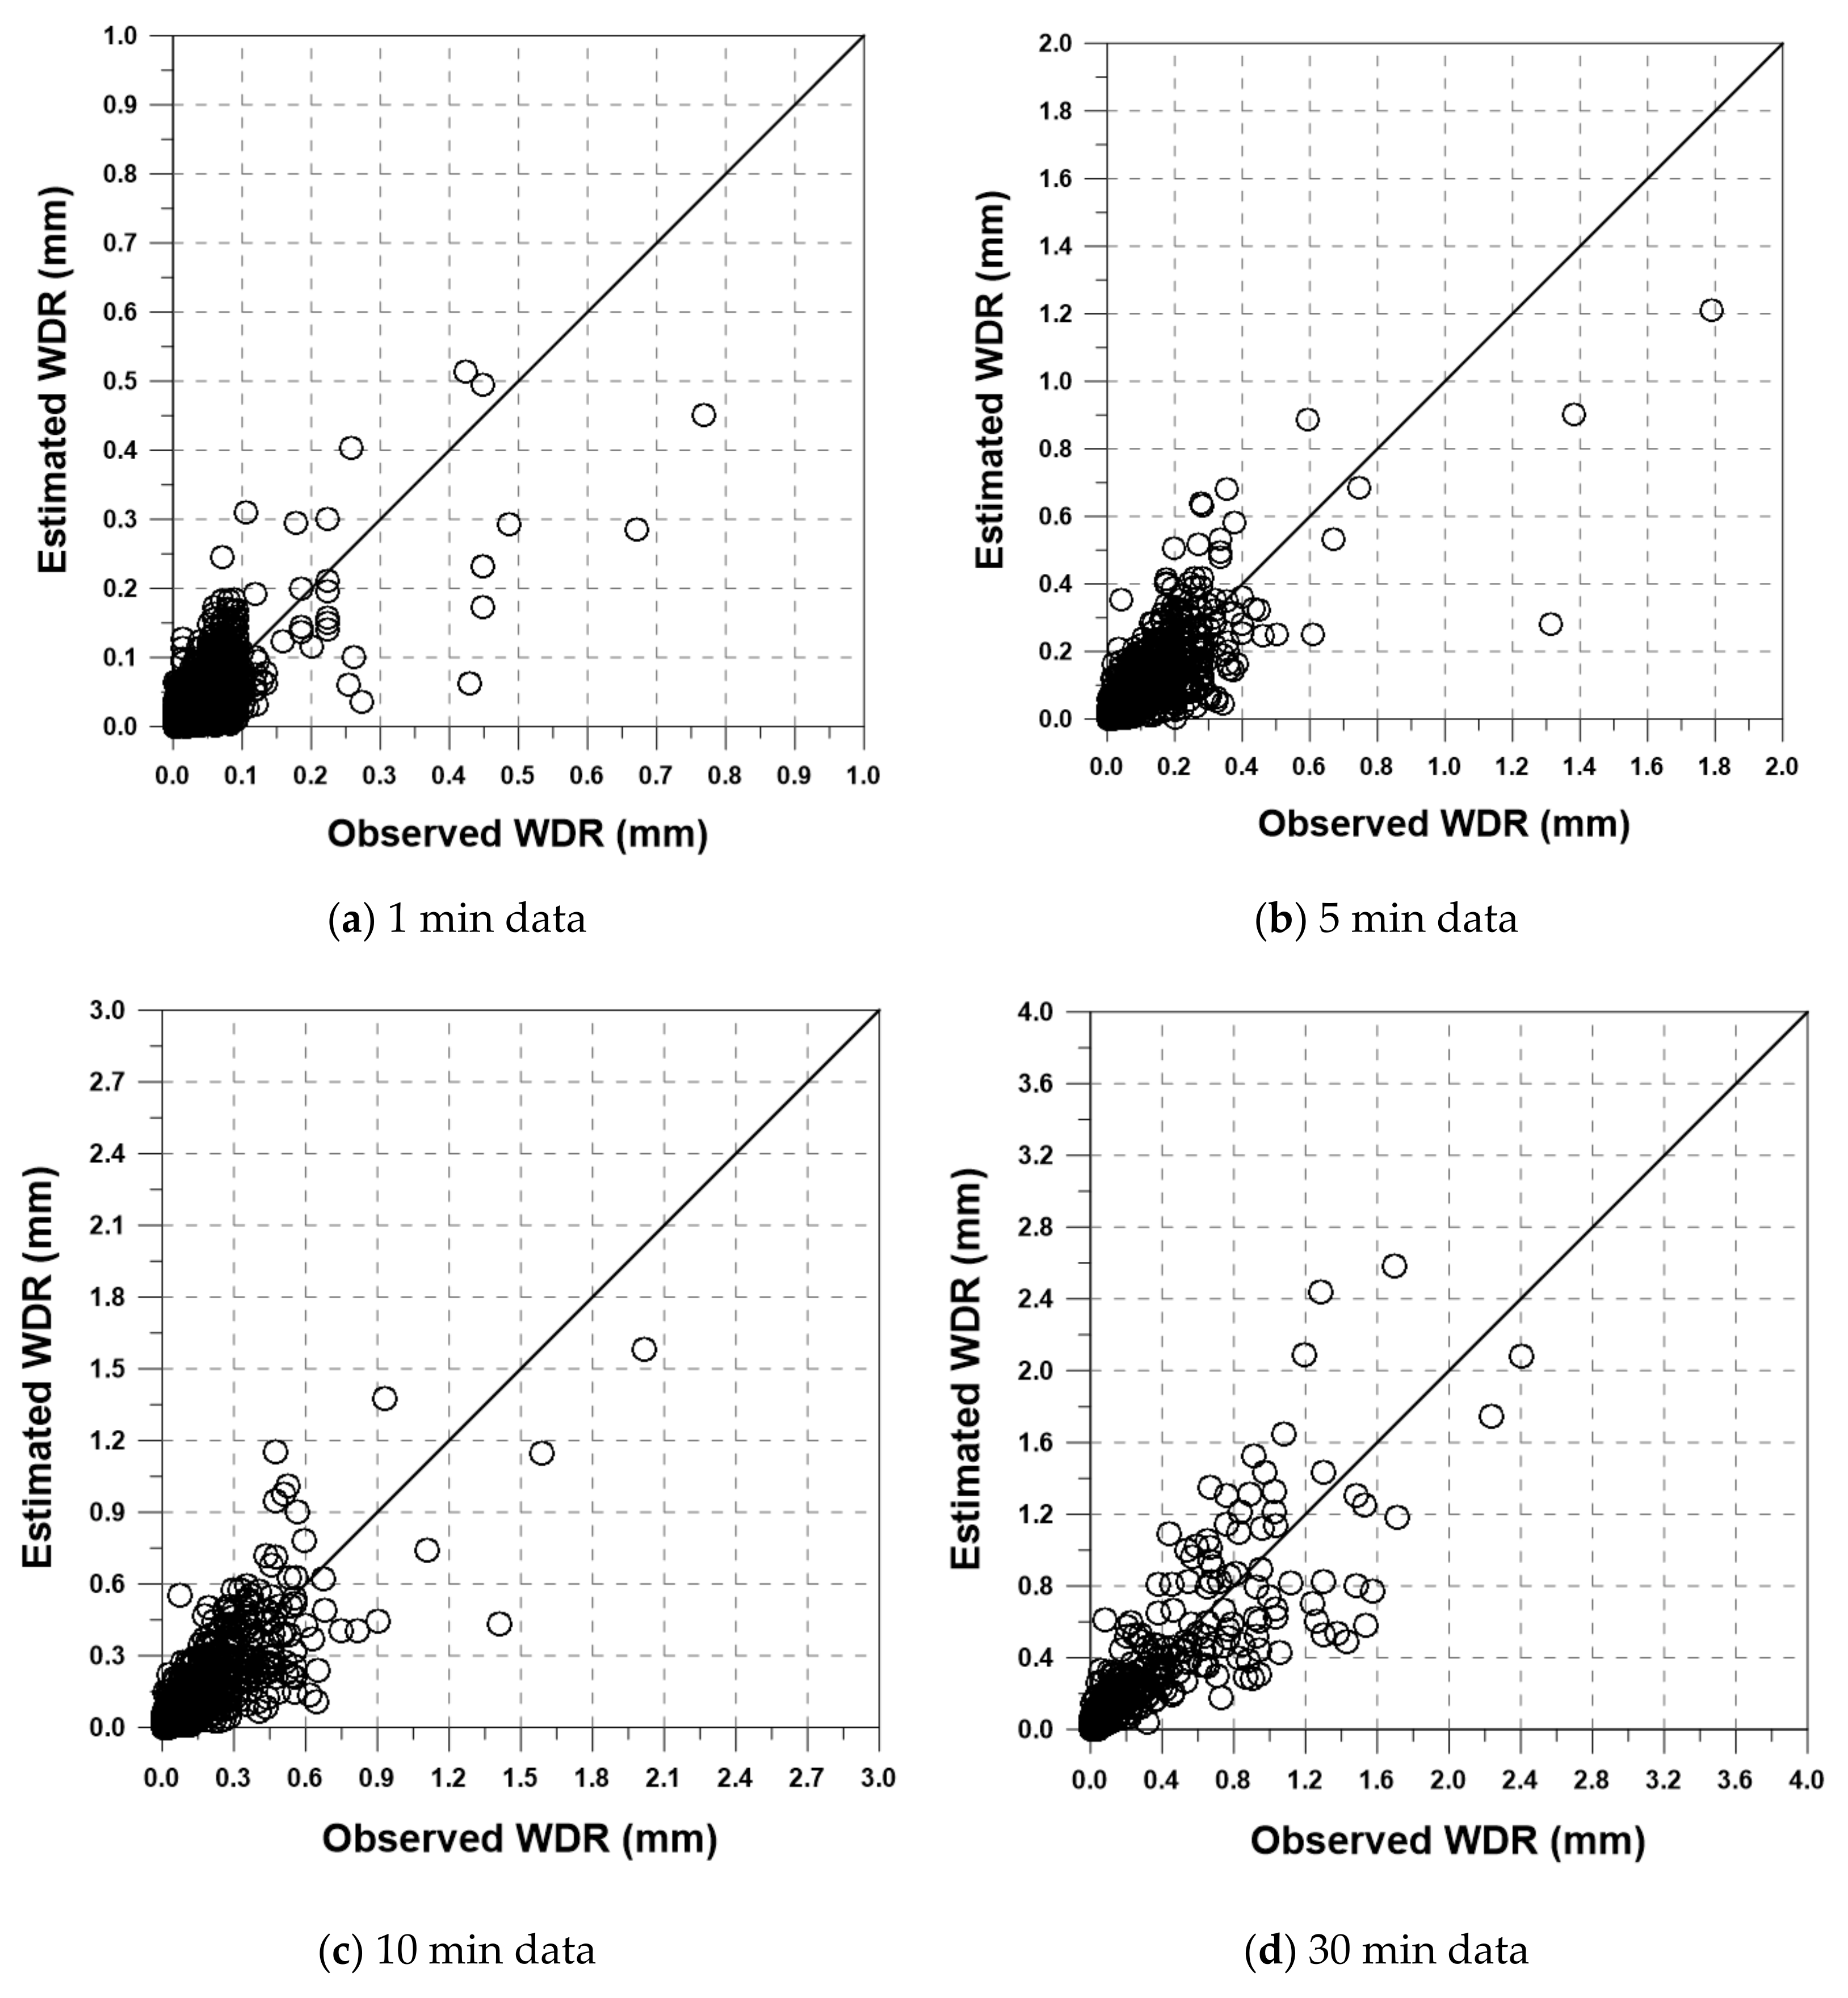
6.1. On the Validation of the Empirical Equation

Figure 11 compares the WDR observed in this study with those estimated by Equation (2). As mentioned in Section 2, Cho et al. [40] derived the empirical equation to estimate the WDR by analyzing the data collected in the lab experiment. They considered various combinations of rainfall intensity and wind speed, as well as several different shapes of building walls. As a result, the constant of the empirical equation to estimate the WDR (i.e., Equation (2)) was determined to be 0.161. The comparison in this part of the study was made for six different time units: 1 min, 5 min, 10 min, 30 min, 1 h and, finally, the entire duration of the rainfall event. When considering a long time unit, due to the smoothing effect, the rainfall intensity also becomes smoothed. As the empirical equation for WDR considers the rainfall intensity with its exponent less than one, the overall amount of WDR can be changed. Even though the wind speed is considered linearly in the estimation of the WDR, its combination with the rainfall intensity can also change significantly, depending on the time unit considered.
Figure 11 shows the effect of the time unit used in the comparison of the observed and estimated WDR. For example, for the cases with time units of 1 min and 5 min, the observed values seem to be higher than the estimated values in the high value zone. However, in the cases with the longer time units, such as 10 min, 30 min, and 1 h, these outliers almost disappeared. In comparison with the time unit of the entire rainfall duration, the overall values became quite similar, but some exceptions were still found where the observed value was slightly higher than the estimated value. The correlation coefficients also confirmed the above findings, i.e., 0.69 and 0.79 for the cases with the time units of 1 min and 5 min; and 0.81, 0.84, and 0.86 for time units of 10 min, 30 min, and 1 h, respectively. Finally, the correlation coefficient for the case with the time unit of entire rainfall duration was estimated to be 0.77. Even though the correlation coefficient was estimated to be slightly different depending on the time unit considered, the overall results show that the empirical equation by Cho et al. [40] is quite reasonable and valid.
To confirm the validity of the empirical equation by Cho et al. [40], this study estimated the constant gamma of Equation (2) using the method of least mean square errors (LMSE). As can be expected, the constants were estimated in a similar way to those of Cho et al. [40]. That is, the constants were 0.155, 0.156, 0.152, 0.149, 0.132, and 0.164, respectively, for each time unit from 1 min to the unit of the entire rainfall duration. The most similar case to Cho et al. [40] was the case of considering the entire rainfall event duration. The coefficient of determination was also estimated to be high as 0.70, 0.75, 0.77, 0.80, 0.82, and 0.84, respectively, for each time unit from 1 min to the unit of the entire rainfall duration. That is, the coefficient of determination was found to become higher when considering the longer time unit.
Finally, this study estimated the confidence interval of the constant gamma of Equation (2) in Cho et al. [40], and tested if the estimated constants in this study were within the confidence interval. The 95% confidence interval of the constant 0.161 of Cho et al. [40] was estimated to be from 0.151 to 0.171. As a result, most of the estimated constants in this study, except for the cases with the time units of 30 min and 1 h, were found to be within the 95% confidence interval. It is ironic that the cases with the time units of 1 min and 5 min, which were slightly worse in their visual evaluation than the other cases, provided better estimations of the coefficient of the WDR empirical equation. However, the overall results also confirm that the empirical equation by Cho et al. [40] was quite valid for the new WDR measurements in this study.
It is also interesting to use Equation (2) for the estimation of the amount of harvested rainwater. This study applied Equation (2) to all 15 rainfall events considered in this study to estimate the amount of rainwater via the WDR harvesting gauge. That is, the wind speed data collected by the BloomSky and rainfall intensity data, prepared by considering the total rainfall depth by the rain gauge and the rainfall temporal distribution by BloomSky, were applied to the empirical equation to derive the WDR on the building wall. The shape of the WDR harvesting gauge was also considered in the estimation of the amount of harvested rainwater.
The estimated amount of harvested rainwater was then divided by the roof area of the WDR harvesting gauge to derive the depth-unit value. Additionally, the WDR harvesting gauge in this study observes both the WDR on the building wall and the rainfall on the building roof; therefore, the rainfall observed on the horizontal surface should additionally be added. The time unit of 10 min was considered in this comparison. The choice of 10 min as the time unit in this comparison was based on the evaluation result of the empirical equation by Cho et al. [40] in Section 4.2. In both the qualitative and quantitative evaluation, the time interval of 10 min was found to produce a better result. The WDR was estimated every 10 min by applying the empirical equation, which was then accumulated to derive the total amount of harvested rainwater for the given rainfall event. Figure 12 compares the estimated and the observed total amount of harvested rainwater for each rainfall event from both the building wall and building roof. This figure also compares the results of the total amount of harvested rainwater (i.e., both from the building wall and building roof), and the total rainfall depth observed on the horizontal surface (i.e., only from the building roof).
As can be seen in this figure, the estimated total amount of harvested rainwater for each rainfall event was found to be very similar to the observed values. In all three cases with different building heights, the correlation coefficients for the heights of 0.5 m, 1.0 m, and 1.5 m were also estimated to be very high, at 0.94, 0.92, and 0.91, respectively. As a result, the empirical equation by Cho et al. [40] was proven to be valid in this application case. The right-hand panel of Figure 12 once again shows the role of the building wall in WDR harvesting. Essentially, the WDR harvesting is advantageous in the case that the building wall is higher. In this study, the case with the height of 1.5 m more clearly shows the role of WDR in rainwater harvesting.
Table 3 summarizes the basic statistics of the estimated and observed total amount of harvested rainwater for each rainfall event. The statistics in this table also confirm the results derived by analyzing Figure 12. The statistics in both cases were all found to be similar, and the largest difference of the mean for the 1.5 m height was also found to be statistically insignificant by t-test under the significance level of 5%.

6.2. Effect of Rainfall Intensity, Wind Speed, and Building Height on the Amount of Harvested Rainwater

In this part of the study, the effect of the rainfall intensity and wind speed on the amount of harvested rainwater is evaluated. In this evaluation, the ratio of the amount of harvested rainwater to the total rainfall depth observed on the horizontal surface was calculated for comparison. Here, the total rainfall depth observed on the horizontal surface is simply the total rainfall depth collected by the storage tank only (Figure 5a). It is also the same as that collected by the building roof. This study calls this ratio the rainwater harvesting ratio (Rratio), which must be higher than one. The Rratio can be simply expressed as follows:
R =   R t o t a l R r o o f
where Rtotal is the rainwater harvested from both the building roof and building wall, and Rroof is the rainwater harvested from only the building roof. An Rratio equal to one indicates that the rainwater is harvested by the building roof only. The contribution from the building wall can thus be estimated by subtracting one from Rratio.
The Rratio was calculated for all 15 rainfall events, and compared with respect to the rainfall intensity and wind speed. In this part of the study, both the estimated and observed rainwater amount in the WDR harvesting gauges were used to calculate the Rratio. Figure 13 shows the scatterplot of the calculated Rratio with respect to the rainfall intensity and wind speed. In this figure, the grey circles represent the Rratio calculated by the estimated result, and the white circles represent that calculated by the observed result.
Figure 13 shows the effect of the rainfall intensity and wind speed on the amount of harvested rainwater well. Overall, the effect of the wind speed on the amount of harvested rainwater was found to be much clearer than that of the rainfall intensity. In all three WDR harvesting gauges, a somewhat significant correlation between the amount of harvested rainwater and wind speed could be observed. For the gauge of 0.5 m height, the effect of wind speed seemed not so significant; however, it became very significant in the cases of 1.0 m and 1.5 m height.
Considering the observed data, for the gauge of 0.5 m, 1.0 m, and 1.5 m height, the correlation coefficient between the Rratio and the wind speed was estimated to be just 0.56, 0.76, and 0.72, respectively. However, considering the estimated data, for the gauge of 0.5 m, 1.0 m, and 1.5 m height, the correlation coefficient between the Rratio and the wind speed was estimated to be much higher: 0.88, 0.92, and 0.94, respectively. This difference seems to arise from the randomness of the observed data. In fact, no obvious difference between the two observed and estimated Rratio values can be found in Figure 13. The overall trends of the Rratio with respect to the rainfall intensity and wind speed were also found to coincide well with each other.
On the other hand, no clear effect of rainfall intensity on the amount of harvested rainwater could be detected in any of the three WDR harvesting gauges. For the gauge of 0.5 m height, the correlation coefficient between the Rratio of the observed data and the rainfall intensity was negligible. The correlation coefficients for the cases of 1.0 m and 1.5 m height were also estimated to be near zero, at −0.11 and −0.06, respectively. For the gauges with the heights of 0.5 m, 1.0 m, and 1.5 m, the correlation coefficients for the Rratio of the estimated data were estimated a bit higher, but were still insignificant, at just −0.16, −0.21 and −0.24, respectively.
Finally, this study evaluated the effect of the building height on the amount of harvested rainwater. The Rratio values of the 15 rainfall events were summarized as box plots to be compared with respect to the building height. Figure 14 shows the box plots of the calculated Rratio with respect to the building height. Figure 14a shows the results calculated by the observed data, while Figure 14b shows those calculated by the estimated data.
The role of building height on the amount of harvested rainwater can be clearly seen in Figure 14. Essentially, the higher the building wall, the higher the Rratio. It is also possible to find some cases with slightly higher Rratio, even though the building height is shorter, which are some exceptions under the conditions of high wind speed. Overall, as the building wall becomes higher, the Rratio becomes higher. In the case of the Rratio calculated by the observed data, i.e., in Figure 14a, the average value of Rratio for the building heights of 0.5 m, 1.0 m, and 1.5 m was about 1.4, 1.7, and 1.9, respectively. The building heights for the Rratio calculated by the estimated data for the building heights of 0.5 m, 1.0 m, and 1.5 m were very similar: 1.3, 1.6, 1.9, respectively. Interestingly, the average value of Rratio for the building height of 1.5 m was identical at 1.9. Additionally, the value of Rratio = 1.9 for the height of 1.5 m indicates that the amount of rainwater harvested from the building wall was almost the same as that from the building roof.

7. Summary and Conclusions

This study showed that the structural limitation of rainwater harvesting can be overcome by considering the building wall instead of the building roof. This study prepared three WDR harvesting gauges of different heights (i.e., 0.5 m, 1.0 m, and 1.5 m) and observed the rainwater that was collected from the building wall. These gauges were similar to miniature buildings, but the WDR on the building wall was collected in the storage tank at the bottom of the miniature building (0.5 m × 0.5 m square). These WDR harvesting gauges were located at the rooftop of the Engineering Building, Korea University. To validate the amount of harvested rainwater, the WDR was also observed independently with different WDR gauges. The rainfall on the horizontal surface and the wind speed were also observed simultaneously with the WDR and harvested rainwater. A total of 15 rainfall events were observed during the rainy season in Korea from June to September of 2020 in this study.
The main results may be summarized as follows. First, the measurements of the WDR were proven to be valid in the comparison with the estimates based on Cho et al. [40]. The correlation coefficients between the two were also estimated to be relatively high, from 0.69 to 0.86, depending on the time unit considered in the comparison. When comparing the coefficients with the time unit of the entire rainfall duration, the correlation coefficient was estimated to be 0.77. Second, the role of building height on the amount of harvested rainwater was clearly confirmed in this study. Essentially, the higher the building wall, the greater the rainwater it harvests. For the building height of 0.5 m, the additional rainwater harvested from the building was about 40% that from the building roof, which became about 70% for the height of 1.0 m, and about 90% for the height of 1.5 m. The role of rainfall intensity and/or wind speed was also found to be important in some cases, but was not so consistent.
Third, the empirical equation proposed by Cho et al. [40] was found to be useful for estimating the amount of harvested rainwater from the building wall, as well as estimating the WDR itself; this study applied the empirical equation to the 15 rainfall events considered in this study to confirm its validity. In all three cases with different building heights (i.e., 0.5 m, 1.0 m, and 1.5 m), the correlation coefficients between the measurements and estimates were all estimated to be very high: 0.94, 0.92, and 0.91, respectively.
This study successfully shows the possibility of using the building wall as a location for rainwater harvesting. In particular, buildings with a relatively large wall area can be very efficient for rainwater harvesting. However, at this time, the method for collecting rainwater from the building wall is not that clear. To put it simply, the WDR that strikes the building could be collected on the ground around the building. There might be other efficient methods for collecting rainwater from the building wall, which could increase the rainwater harvest from the building wall. This problem should be solved to promote rainwater harvesting from building walls.
Additionally, the idea of using the building wall for rainwater harvesting can be applied to many other cases. The basic idea is that the amount of harvested rainwater can be increased by introducing a three-dimensional structure for the rainwater harvesting place. The amount of harvested rainwater from the roof, generally used as the rainwater harvesting location, can be increased simply by putting some objects or branches on the roof; this is akin to adding some walls to the roof; changing a two-dimensional surface into a three-dimensional one for rainwater harvesting. If the quality of rainwater does not affect its use, the efficiency of rainwater harvesting can be increased very easily. If the water quality does matter, clean and harmless material should be considered. This approach is valid anywhere that rainwater harvesting is important, which includes desert, wild, and remote regions.
Furthermore, it should be mentioned that additional experimental studies are needed to apply the results of this study in practice. The first limitation of this study is that observation was not conducted using an actual-size building wall. Accordingly, there might be limitations in applying the methodology of this study to actual-size buildings. These limitations of this study can be overcome through future studies. In addition, in the actual practice, the amount of rainwater from the wall can be different depending on the height and density of the surrounding buildings. Additional experiments are also required to evaluate the effect of surrounding buildings on rainwater harvesting from the wall.

Author Contributions

Conceptualization, C.Y.; Writing—original draft, C.Y. and E.C.; Writing—review and editing, C.Y. and E.C.; Supervision, C.Y.; Formal analysis, E.C.; Methodology, E.C.; Software, E.C.; Visualization, E.C.; Investigation, M.L. and S.K.; Data curation, M.L. and S.K. All authors have read and agreed to the published version of the manuscript.

Funding

This work was supported by Korea Environment Industry and Technology Institute (KEITI) through Water Management Research Program, funded by Korea Ministry of Environment (MOE) (127559), and the National Research Foundation of Korea (NRF) grant funded by the Korea government (MSIT) (No. 2020R1A2C2008714).

Institutional Review Board Statement

Not applicable.

Informed Consent Statement

Not applicable.

Data Availability Statement

Data available upon request.

Conflicts of Interest

The authors declare no conflict of interest.

References

  1. Mays, L.; Antoniou, G.P.; Angelakis, A.N. History of water cisterns: Legacies and lessons. Water 2013, 5, 1916–1940. [Google Scholar] [CrossRef] [Green Version]
  2. Lee, K.E.; Mokhtar, M.; Hanafiah, M.M.; Halim, A.A.; Badusah, J. Rainwater harvesting as an alternative water resource in Malaysia: Potential, policies and development. J. Clean. Prod. 2016, 126, 218–222. [Google Scholar] [CrossRef]
  3. Tamaddun, K.; Kalra, A.; Ahmad, S. Potential of rooftop rainwater harvesting to meet outdoor water demand in arid regions. J. Arid Land 2018, 10, 68–83. [Google Scholar] [CrossRef] [Green Version]
  4. Hatibu, N.; Mutabazi, K.; Senkondo, E.; Msangi, A. Economics of rainwater harvesting for crop enterprises in semi-arid areas of East Africa. Agric. Water Manag. 2006, 80, 74–86. [Google Scholar] [CrossRef]
  5. Shadeed, S.; Lange, J. Rainwater harvesting to alleviate water scarcity in dry conditions: A case study in Faria Catchment, Palestine. Water Sci. Eng. 2010, 3, 132–143. [Google Scholar] [CrossRef]
  6. Moges, G.; Hengsdijk, H.; Jansen, H. Review and quantitative assessment of ex situ household rainwater harvesting systems in Ethiopia. Agric. Water Manag. 2011, 98, 1215–1227. [Google Scholar] [CrossRef]
  7. Ennenbach, M.W.; Concha Larrauri, P.; Lall, U. County-scale rainwater harvesting feasibility in the United States: Climate, collection area, density, and reuse considerations. J. Am. Water Resour. Assoc. 2018, 54, 255–274. [Google Scholar] [CrossRef]
  8. Ghisi, E.; Montibeller, A.; Schmidt, R.W. Potential for potable water savings by using rainwater: An analysis over 62 cities in southern Brazil. Build. Environ. 2006, 41, 204–210. [Google Scholar] [CrossRef]
  9. Mitchell, V.G.; McCarthy, D.T.; Deletic, A.; Fletcher, T.D. Urban stormwater harvesting–sensitivity of a storage behaviour model. Environ. Model. Softw. 2008, 23, 782–793. [Google Scholar] [CrossRef]
  10. Akter, A.; Ahmed, S. Potentiality of rainwater harvesting for an urban community in Bangladesh. J. Hydrol. 2015, 528, 84–93. [Google Scholar] [CrossRef]
  11. Castonguay, A.C.; Urich, C.; Iftekhar, M.S.; Deletic, A. Modelling urban water management transitions: A case of rainwater harvesting. Environ. Model. Softw. 2018, 105, 270–285. [Google Scholar] [CrossRef]
  12. Abdulla, F.A.; Al-Shareef, A. Roof rainwater harvesting systems for household water supply in Jordan. Desalination 2009, 243, 195–207. [Google Scholar] [CrossRef]
  13. Eroksuz, E.; Rahman, A. Rainwater tanks in multi-unit buildings: A case study for three Australian cities. Resour. Conserv. Recy. 2010, 54, 1449–1452. [Google Scholar] [CrossRef]
  14. Ibrahim, M.B. Rainwater harvesting for urban areas: A success story from Gadarif City in Central Sudan. Water Resour. Manag. 2009, 23, 2727–2736. [Google Scholar] [CrossRef]
  15. Mahmoud, W.H.; Elagib, N.A.; Gaese, H.; Heinrich, J. Rainfall conditions and rainwater harvesting potential in the urban area of Khartoum. Resour. Conserv. Recy. 2014, 91, 89–99. [Google Scholar] [CrossRef]
  16. Mouli, T.; Krupavathi, K.; Rao, C.S.G. Urban rooftop area assessment for estimation of rooftop rainwater-harvesting potential. Int. J. Agric. Environ. Biotechnol. 2020, 13, 275–283. [Google Scholar] [CrossRef]
  17. Mehrabadi, M.H.R.; Saghafian, B.; Fashi, F.H. Assessment of residential rainwater harvesting efficiency for meeting non-potable water demands in three climate conditions. Resour. Conserv. Recy. 2013, 73, 86–93. [Google Scholar] [CrossRef]
  18. Gado, T.A.; El-Agha, D.E. Feasibility of rainwater harvesting for sustainable water management in urban areas of Egypt. Environ. Sci. Pollut. Res. 2020, 27, 32304–32317. [Google Scholar] [CrossRef] [PubMed]
  19. Helmreich, B.; Horn, H. Opportunities in rainwater harvesting. Desalination 2009, 248, 118–124. [Google Scholar] [CrossRef]
  20. Farreny, R.; Morales-Pinzón, T.; Guisasola, A.; Tayà, C.; Rieradevall, J.; Gabarrell, X. Roof selection for rainwater harvesting: Quantity and quality assessments in Spain. Water Res. 2011, 45, 3245–3254. [Google Scholar] [CrossRef]
  21. Moniruzzaman, M.; Imteaz, M.A. Generalized equations, climatic and spatial variabilities of potential rainwater savings: A case study for Sydney. Resour. Conserv. Recy. 2017, 125, 139–156. [Google Scholar] [CrossRef]
  22. Sturm, M.; Zimmermann, M.; Schütz, K.; Urban, W.; Hartung, H. Rainwater harvesting as an alternative water resource in rural sites in central northern Namibia. Phys. Chem. Earth 2009, 34, 776–785. [Google Scholar] [CrossRef]
  23. Zhang, Q.; Wang, X.; Hou, P.; Wan, W.; Li, R.; Ren, Y.; Ouyang, Z. Quality and seasonal variation of rainwater harvested from concrete, asphalt, ceramic tile and green roofs in Chongqing, China. J. Environ. Manag. 2014, 132, 178–187. [Google Scholar] [CrossRef] [PubMed]
  24. De Gouvello, B.; Gerolin, A.; Le Nouveau, N. Rainwater harvesting in urban areas: How can foreign experiences enhance the French approach? Water Sci. Technol. Water Supply 2014, 14, 569–576. [Google Scholar] [CrossRef] [Green Version]
  25. Fricano, R.J.; Grass, A.K. Evaluating American rainwater harvesting policy: A case study of three US cities. J. Sustain. Dev. 2014, 7, 133. [Google Scholar] [CrossRef] [Green Version]
  26. Schuetze, T. Rainwater harvesting and management–policy and regulations in Germany. Water Sci. Technol. Water Supply 2013, 13, 376–385. [Google Scholar] [CrossRef]
  27. Lehmann, S. Low carbon districts: Mitigating the urban heat island with green roof infrastructure. City Cult. Soc. 2014, 5, 1–8. [Google Scholar] [CrossRef]
  28. Heidarinejad, G.; Esmaili, A. Numerical simulation of the dual effect of green roof thermal performance. Energy Convers. Manag. 2015, 106, 1418–1425. [Google Scholar] [CrossRef]
  29. Qin, X.; Wu, X.; Chiew, Y.; Li, Y. A green roof test bed for stormwater management and reduction of urban heat island effect in Singapore. Br. J. Environ. Clim. Chang. 2012, 2, 410–420. [Google Scholar] [CrossRef] [PubMed] [Green Version]
  30. Shafique, M.; Kim, R.; Rafiq, M. Green roof benefits, opportunities and challenges–A review. Renew. Sust. Energ. Rev. 2018, 90, 757–773. [Google Scholar] [CrossRef]
  31. Kim, E.; Jung, J.; Hapsari, G.; Kang, S.; Kim, K.; Yoon, S.; Lee, M.; Han, M.; Choi, Y.; Choe, J.K. Economic and environmental sustainability and public perceptions of rooftop farm versus extensive garden. Build. Environ. 2018, 146, 206–215. [Google Scholar] [CrossRef]
  32. Taib, N.; Ali, Z.; Abdullah, A.; Yeok, F.S.; Prihatmanti, R. The performance of different ornamental plant species in transitional spaces in urban high-rise settings. Urban For. Urban Green. 2019, 43, 126393. [Google Scholar] [CrossRef]
  33. Zhang, G.; He, B.-J.; Dewancker, B.J. The maintenance of prefabricated green roofs for preserving cooling performance: A field measurement in the subtropical city of Hangzhou, China. Sustain. Cities Soc. 2020, 61, 102314. [Google Scholar] [CrossRef]
  34. Monteiro, C.M.; Calheiros, C.S.; Pimentel-Rodrigues, C.; Silva-Afonso, A.; Castro, P.M. Contributions to the design of rainwater harvesting systems in buildings with green roofs in a Mediterranean climate. Water Sci. Technol. 2016, 73, 1842–1847. [Google Scholar] [CrossRef] [PubMed]
  35. Pimentel-Rodrigues, C.; Silva-Afonso, A. Determination of runoff coefficients with a view to integration of green roofs with rainwater harvesting systems. Int. J. Environ. Sci. 2017, 2, 366–372. [Google Scholar]
  36. Almeida, A.P.; Liberalesso, T.; Silva, C.M.; Sousa, V. Dynamic modelling of rainwater harvesting with green roofs in university buildings. J. Clean. Prod. 2021, 312, 127655. [Google Scholar]
  37. Ward, S.; Memon, F.; Butler, D. Performance of a large building rainwater harvesting system. Water Res. 2012, 46, 5127–5134. [Google Scholar] [CrossRef] [PubMed]
  38. Hashim, H.; Hudzori, A.; Yusop, Z.; Ho, W. Simulation based programming for optimization of large-scale rainwater harvesting system: Malaysia case study. Resour. Conserv. Recy. 2013, 80, 1–9. [Google Scholar] [CrossRef]
  39. van Dijk, S.; Lounsbury, A.W.; Hoekstra, A.Y.; Wang, R. Strategic design and finance of rainwater harvesting to cost-effectively meet large-scale urban water infrastructure needs. Water Res. 2020, 184, 116063. [Google Scholar] [CrossRef] [PubMed]
  40. Cho, E.; Yoo, C.; Kang, M.; Song, S.-u.; Kim, S. Experiment of wind-driven-rain measurement on building walls and its in-situ validation. Build. Environ. 2020, 185, 107269. [Google Scholar] [CrossRef]
  41. Feitosa, R.C.; Wilkinson, S.J. Attenuating heat stress through green roof and green wall retrofit. Build. Environ. 2018, 140, 11–22. [Google Scholar] [CrossRef]
  42. Manso, M.; Teotónio, I.; Silva, C.M.; Cruz, C.O. Green roof and green wall benefits and costs: A review of the quantitative evidence. Renew. Sust. Energ. Rev. 2021, 135, 110111. [Google Scholar] [CrossRef]
  43. Lee, L.S.; Jim, C.Y. Transforming thermal-radiative study of a climber green wall to innovative engineering design to enhance building-energy efficiency. J. Clean. Prod. 2019, 224, 892–904. [Google Scholar] [CrossRef]
  44. Weinmaster, M. Are green walls as “green” as they look? An introduction to the various technologies and ecological benefits of green walls. J. Green Build. 2009, 4, 3–18. [Google Scholar] [CrossRef] [Green Version]
  45. Prenner, F.; Pucher, B.; Zluwa, I.; Pitha, U.; Langergraber, G. Rainwater Use for Vertical Greenery Systems: Development of a Conceptual Model for a Better Understanding of Processes and Influencing Factors. Water 2021, 13, 1860. [Google Scholar] [CrossRef]
  46. Jurga, A.; Pacak, A.; Pandelidis, D.; Kaźmierczak, B. A Long-Term Analysis of the Possibility of Water Recovery for Hydroponic Lettuce Irrigation in an Indoor Vertical Farm. Part 2: Rainwater Harvesting. Appl. Sci. 2021, 11, 310. [Google Scholar] [CrossRef]
  47. Samzadeh, M.; Din, N.C.; Abdullah, Z.; Mahyuddin, N.; Ismail, M.A. Feasibility of Vertical Rainwater Harvesting via In-situ Measurement of Wind-driven Rain Loads on Building Facades in a Tropical Climate. Int. J. Built Environ. Sustain. 2021, 8, 27–45. [Google Scholar] [CrossRef]
  48. Straube, J.; Burnett, E. Simplified prediction of driving rain on buildings. In Proceedings of the International Building Physics Conference; Eindhoven University of Technology Eindhoven: Eindhoven, The Netherlands, 2000. [Google Scholar]
  49. ISO. Hygrothermal Performance of Buildings–Calculation and Presentation of Climatic Data–Part 3: Calculation of a Driving Rain Index for Vertical Surfaces from Hourly wind and Rain Data; European Committee for Standardization: Bruxelles, Belgium, 2009. [Google Scholar]
  50. Lacy, R.E. Driving rain maps and the onslaught of rain on buildings. In Proceedings of the RILEM/CIB Symposium on Moisture Problems in Buildings, Helsinki, Finland, 16–18 August 1965. [Google Scholar]
  51. Hens, H.; Ali Mohamed, F. Preliminary Results on Driving Rain Estimation; T2-B-94/02: Contribution to the IEA annex 24, Task 2—Environmental conditions; International Energy Agency: Paris, France, 1994. [Google Scholar]
  52. Flori, J.-P. Influence des Conditions Climatiques sur le Mouillage et le Sechage d’une Facade Verticale; Cahiers du CSTB: Paris, France, 1992. [Google Scholar]
  53. Beijer, O.; Johansson, A. Driving Rain against Externall Walls of Concrete [Slagregn mot Betongfasader]; Swedish Cement and Concrete Research Institute at the Institute of Technology: Stockholm, Sweden, 1977. [Google Scholar]
  54. Blocken, B.; Carmeliet, J. A simplified numerical model for rainwater runoff on building facades: Possibilities and limitations. Build. Environ. 2012, 53, 59–73. [Google Scholar] [CrossRef]
  55. Kubilay, A.; Derome, D.; Blocken, B.; Carmeliet, J. Numerical simulations of wind-driven rain on an array of low-rise cubic buildings and validation by field measurements. Build. Environ. 2014, 81, 283–295. [Google Scholar] [CrossRef] [Green Version]
  56. Fang, A.; Chen, Y.; Wu, L. Modeling and numerical investigation for hygrothermal behavior of porous building envelope subjected to the wind driven rain. Energy Build. 2021, 231, 110572. [Google Scholar] [CrossRef]
  57. Briggen, P.; Blocken, B.; Schellen, H. Wind-driven rain on the facade of a monumental tower: Numerical simulation, full-scale validation and sensitivity analysis. Build. Environ. 2009, 44, 1675–1690. [Google Scholar] [CrossRef]
  58. Van den Brande, T.; Blocken, B.; Roels, S. Wind-driven rain and runoff on a medium-rise building: Experimental and numerical analysis. In Proceedings of the 10th Nordic Symposium on Building Physics, Lund, Sweden, 15–19 June 2014. [Google Scholar]
  59. Wang, X.; Li, Q.; Li, J. Field measurements and numerical simulations of wind-driven rain on a low-rise building during typhoons. J. Wind Eng. Ind. Aerod. 2020, 204, 104274. [Google Scholar] [CrossRef]
  60. Choi, E.C. Numerical simulation of wind-driven rain falling onto a 2-D building. In Proceedings of the Asian Pacific Conference on Computational Mechanics, Hong Kong, China, 11–13 December 1991. [Google Scholar]
  61. Choi, E.C. Simulation of wind-driven-rain around a building. J. Wind Eng. Ind. Aerod. 1993, 46, 721–729. [Google Scholar] [CrossRef]
  62. Choi, E.C. Determination of wind-driven-rain intensity on building faces. J. Wind Eng. Ind. Aerod. 1994, 51, 55–69. [Google Scholar] [CrossRef]
  63. Pérez-Bella, J.M.; Domínguez-Hernández, J.; Cano-Suñén, E.; del Coz-Díaz, J.J.; Alonso-Martínez, M. Global analysis of building façade exposure to water penetration in Chile. Build. Environ. 2013, 70, 284–297. [Google Scholar] [CrossRef]
  64. Pérez-Bella, J.M.; Domínguez-Hernández, J.; Cano-Suñén, E.; Martínez-Martínez, J.E.; del Coz-Díaz, J.J. Avoiding the need to directionally determine the exposure to rainwater penetration for façade designs. Build. Environ. 2020, 176, 106850. [Google Scholar] [CrossRef]
  65. Pérez-Bella, J.M.; Domínguez-Hernández, J.; Rodríguez-Soria, B.; Del Coz-Díaz, J.J.; Cano-Suñén, E. Estimation of the exposure of buildings to driving rain in Spain from daily wind and rain data. Build. Environ. 2012, 57, 259–270. [Google Scholar] [CrossRef]
  66. Raychev, J.; Kinaneva, D.; Hristov, G.; Zahariev, P.; Staevska, G. Investigating the Possibilities of Integrating Cloud Weather Data into Existing Applications. In Proceedings of the 2019 27th National Conference with International Participation (TELECOM), Sofia, Bulgaria, 30–31 October 2019. [Google Scholar]
Figure 1. Typical shape of the vertical profile and spatial distribution of WDR on building walls [40].
Water 14 00603 g001
Figure 2. Picture and schematic diagram of the miniature building located on the rooftop of the Engineering Building, Korea University [40].
Water 14 00603 g002
Figure 3. Three different types of rain gauges used in this study to measure WDR on the building wall.
Water 14 00603 g003
Figure 4. Picture of BloomSky used in this study.
Water 14 00603 g004
Figure 5. Three types of WDR harvesting gauge with three different wall heights (H = 0.5, 1.0, and 1.5 m) developed in this study.
Water 14 00603 g005aWater 14 00603 g005b
Figure 6. Comparison of total rainfall observed by BloomSky and rain gauge.
Water 14 00603 g006
Figure 7. Examples of BloomSky rainfall data correction by the rain gauge data.
Water 14 00603 g007
Figure 8. Comparison of time series plots (left) and box plots (right) of the BloomSky wind speed and AWS wind speed data.
Water 14 00603 g008
Figure 9. Observed wind speed, rainfall intensity on the horizontal plane, and the average of observed WDR.
Water 14 00603 g009
Figure 10. Comparison of observed mean wind speed, the total rainfall depth observed on the horizontal surface, and the total amount of rainwater harvested by the three WDR harvesting gauges.
Water 14 00603 g010
Figure 11. Scatter plot comparing estimates by Equation (2) and the observed amount of WDR for various time intervals.
Water 14 00603 g011aWater 14 00603 g011b
Figure 12. Comparison of estimated and observed rainwater (left) and scatter plot of ground total rainfall and observed rainwater (right) in three WDR harvesting gauges.
Water 14 00603 g012
Figure 13. Rainwater harvesting ratios with respect to the rainfall intensity (left) and wind speed (right) for three WDR harvesting gauges.
Water 14 00603 g013
Figure 14. Rainwater harvesting ratios calculated with different heights of WDR harvesting gauge.
Water 14 00603 g014
Table 1. Basic characteristics of the observed rainfall events in this study.
#Starting TimeEnding
Time
Mean Rainfall Intensity
(mm/h)
Total Rainfall Depth
(mm)
Rainfall Duration
(h)
Rain GaugeBloomSkyRain GaugeBloomSky
12020-06-24 18:552020-06-26 04:361.60.854.726.433.7
22020-06-29 22:132020-06-30 21:282.52.757.061.823.3
32020-07-13 06:152020-07-14 04:572.61.958.142.822.7
42020-07-19 08:492020-07-20 09:251.30.132.43.424.6
52020-07-23 08:152020-07-24 11:464.33.6117.498.627.5
62020-07-29 01:102020-07-30 05:001.41.339.335.827.8
72020-08-01 23:132020-08-03 13:424.43.3170.5127.238.5
82020-08-03 15:442020-08-04 07:301.81.829.128.015.8
92020-08-05 06:242020-08-06 11:024.03.8114.5108.428.6
102020-08-08 12:382020-08-10 15:591.72.086.8100.851.4
112020-08-10 16:002020-08-11 09:119.98.0170.8137.817.2
122020-08-21 21:262020-08-22 19:523.64.180.291.422.4
132020-08-27 21:472020-08-30 22:350.90.964.063.272.8
142020-09-02 15:372020-09-03 22:511.82.255.068.231.2
152020-09-07 09:012020-09-08 00:154.32.265.033.415.2
Table 2. Basic statistics of AWS and BloomSky wind speed used in this study.
#Starting TimeEnding TimeAWS Wind SpeedBloomSky Wind Speed
Mean
(m/s)
Standard Deviation (m/s)Mean
(m/s)
Standard Deviation (m/s)
12020-06-24 18:552020-06-26 04:361.801.131.770.96
22020-06-29 22:132020-06-30 21:282.361.542.911.76
32020-07-13 06:152020-07-14 04:572.011.082.611.06
42020-07-19 08:492020-07-20 09:252.351.432.361.08
52020-07-23 08:152020-07-24 11:462.201.632.571.81
62020-07-29 01:102020-07-30 05:001.571.071.350.80
72020-08-01 23:132020-08-03 13:421.921.241.621.38
82020-08-03 15:442020-08-04 07:302.001.391.981.50
92020-08-05 06:242020-08-06 11:022.391.562.011.32
102020-08-08 12:382020-08-10 15:591.621.201.520.99
112020-08-10 16:002020-08-11 09:111.531.111.200.91
122020-08-21 21:262020-08-22 19:521.521.101.380.96
132020-08-27 21:472020-08-30 22:351.761.581.551.44
142020-09-02 15:372020-09-03 22:513.181.983.301.84
152020-09-07 09:012020-09-08 00:153.321.723.181.65
Table 3. Basic statistics of measured and estimated rainwater.
Height of the WDR Harvesting Gauge
(m)
Measured RainwaterEstimated Rainwater
Mean (mm)Standard Deviation (mm)Mean (mm)Standard Deviation (mm)
0.5132.272.6137.371.4
1.0164.687.4165.781.8
1.5185.199.9194.292.7
Publisher’s Note: MDPI stays neutral with regard to jurisdictional claims in published maps and institutional affiliations.

