Article

Dynamic Adsorption Characteristics of Phosphorus Using MBCQ

College of Environmental Science and Engineering, Central South University of Forestry and Technology, Changsha 410004, China
*
Author to whom correspondence should be addressed.
Water 2022, 14(3), 508; https://doi.org/10.3390/w14030508
Submission received: 6 January 2022 / Revised: 27 January 2022 / Accepted: 1 February 2022 / Published: 8 February 2022
(This article belongs to the Section Wastewater Treatment and Reuse)

Abstract

:
Biochar is a new type of adsorption material with excellent performance, but it has some problems, such as light texture, poor sedimentation, and difficult recovery, which limits its practical application. In this study, biochar microspheres (MBCQ) were prepared by the sol–gel method using powdery biochar from Hydrocotyle vulgaris as raw material and sodium alginate as a granular carrier. Experiments were performed to investigate the dynamic adsorption characteristics of phosphorus by MBCQ in the adsorption column and the influences of particle size, initial phosphorus concentration, flow rate, and column height on the breakthrough curve. The results showed that the static adsorption properties of different particles varied and that 3-millimeter particles were optimal. The breakthrough time positively correlated with column height and negatively correlated with initial phosphorus concentration, flow rate, and particle size. Flow velocity significantly impacted breakthrough time and length of mass transfer. The bed depth/service time model accurately predicted the relationship between breakthrough times and column heights. When ct/c0 = 0.6, the average relative deviation between predicted and measured values was the lowest. The Thomas model described the MBCQ adsorption process of Ph (R2 > 0.95), which indicated that diffusion in MBCQ adsorption was not a rate-limiting step.

Graphical Abstract

1. Introduction

Phosphorus (Ph) is an indispensable element of living things and plays an important role in plant growth and development and human metabolism [1]. With the wide use of Ph in agriculture, industry, and daily life, excess Ph is discharged into water bodies, thereby causing water eutrophication and seriously damaging the water ecosystem [2]. Therefore, the development of cost-effective Ph control technology is crucial for blocking water eutrophication. At present, commonly used Ph removal methods mainly include membrane filtration, ion exchange, chemical precipitation, adsorption, biological treatment and crystallization [3,4,5]. Among them, adsorption has attracted much attention for its advantages, including high efficiency, low energy consumption, low cost, simple operation, wide application, and recyclable adsorption materials [6].
Biochar is a new type of adsorption material that achieves excellent performance [7]. It is a type of porous material that forms when biomass cracks at high temperatures under oxygen-limited conditions. It has the characteristics of a large specific surface area, developed pores, stable physical and chemical properties, acid and alkali resistance, high temperature, and high-pressure resistance [8]. The raw materials used for preparing biochar have a wide range of sources and are easily available [9], hence biochar has become a research hotspot in the environmental field in recent years [10]. However, due to electrostatic mutual repulsion of the negative charge on the surface of biochar, it has weak adsorbability for anions such as phosphate. To enhance the adsorption capacity of biochar to phosphate, it is necessary to adopt appropriate measures to modify the surface structure and composition of biochar [11]. Studies have found that biochar loaded with lanthanum [12], aluminum [13], iron [14], magnesium [15], and other heavy metal elements can significantly enhance the capacity of adsorption to Ph. Among them, magnesium is a component of chloroplasts and plays an important role in plant photosynthesis. Magnesium-loaded biochar only produces good Ph removal effects but also promotes plant growth and development, which is beneficial to the restoration of water ecosystems. However, the application of biochar in engineering is limited due to practical problems such as light texture, floating, large dispersion, poor sedimentation, and difficulty separating water and sewage. Studies have shown [16] that sodium alginate (SA) is an excellent granular carrier material that is rich in hydroxyl and carboxyl groups and can be cross-linked with divalent metal ions to form a gel with a three-dimensional network structure, thereby ensuring a good adsorption effect. At the same time, it can effectively achieve biochar granulation.
As an ecological sewage treatment technology, constructed wetland has a series of advantages, such as good decontamination effects, low cost, easy operation and maintenance, and high landscape value [17]. It has been widely used in the treatment of domestic sewage [18], tail-water from sewage treatment plants [19], industrial wastewater [20], and surface runoff [21], etc. Wetland plants can increase biomass to purify water by absorbing and adsorbing elements such as nitrogen and Ph in the water during their normal growth cycle. Additionally, secondary pollution caused by the return system for which plant growth slows down can promote the purification effect of constructed wetland [22]. Hydrocotyle vulgaris is a commonly used wetland aquatic plant for its high landscape value, strong reproduction, good adaptation, and high efficiency in the removal of nitrogen, Ph, and heavy metals [23]. At present, research on Hydrocotyle vulgaris mainly focuses on physiological characteristics, growth, reproduction, allelopathy, biological invasiveness, water pollution prevention, and environmental remediation, etc. [24,25], whereas resource utilization of discarded Hydrocotyle vulgaris has seldom been reported. Therefore, this study aimed to study the dynamic adsorption characteristics of MBCQ (Magnesium-modified Hydrocotyle vulgaris biochar microspheres) to Ph under different conditions of particle size, initial Ph concentration, flow rate, and column height by using magnesium-carrying Hydrocotyle vulgaris biochar (MBC) as raw material, Ph as a polluting target, SA as a granular carrier, and calcium chloride as a cross-linking agent, thereby aiming to provide basic data and a theoretical basis for the resource utilization of discarded Hydrocotyle vulgaris and the control of Ph pollution in water bodies. The aim of this study is to the efficient phosphorus removal MBCQ can provide a new idea for the resource utilization of waste Hydrocotyle vulgaris and phosphorus removal method.

2. Materials and Methods

2.1. Experimental Instruments and Materials

Hydrocotyle vulgar was taken from Yanghu Wetland Park in Changsha City, Hunan Province, China (28°07′36.19″ N, 112°55′45.12″ E). All chemicals, magnesium chloride hexahydrate (≥98.0%), dipotassium hydrogen phosphate (≥99.0%), sodium alginate (≥99.0%), and calcium chloride (≥99.0%), all of analytical grade, were purchased from Sinopharm Chemical Reagents Co., Ltd. (Sinopharm Chemical Reagents Co., Ltd, Shanghai, China). De-ionized water (18.25 MΩ) (UPH-IV-10T, Ulupure, Chengdu, Sichuan, China) was used in the experiments. The main instruments used in the experiment: the peristaltic pump (WX10-14) is manufactured by Longer (Longer, Shijiazhuang, Hebei, China), the oil bath stirring device (DF-I) is manufactured by Daxluot (Daxluot, Shanghai, China).

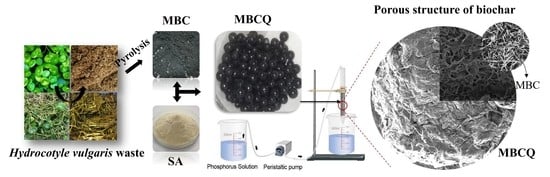
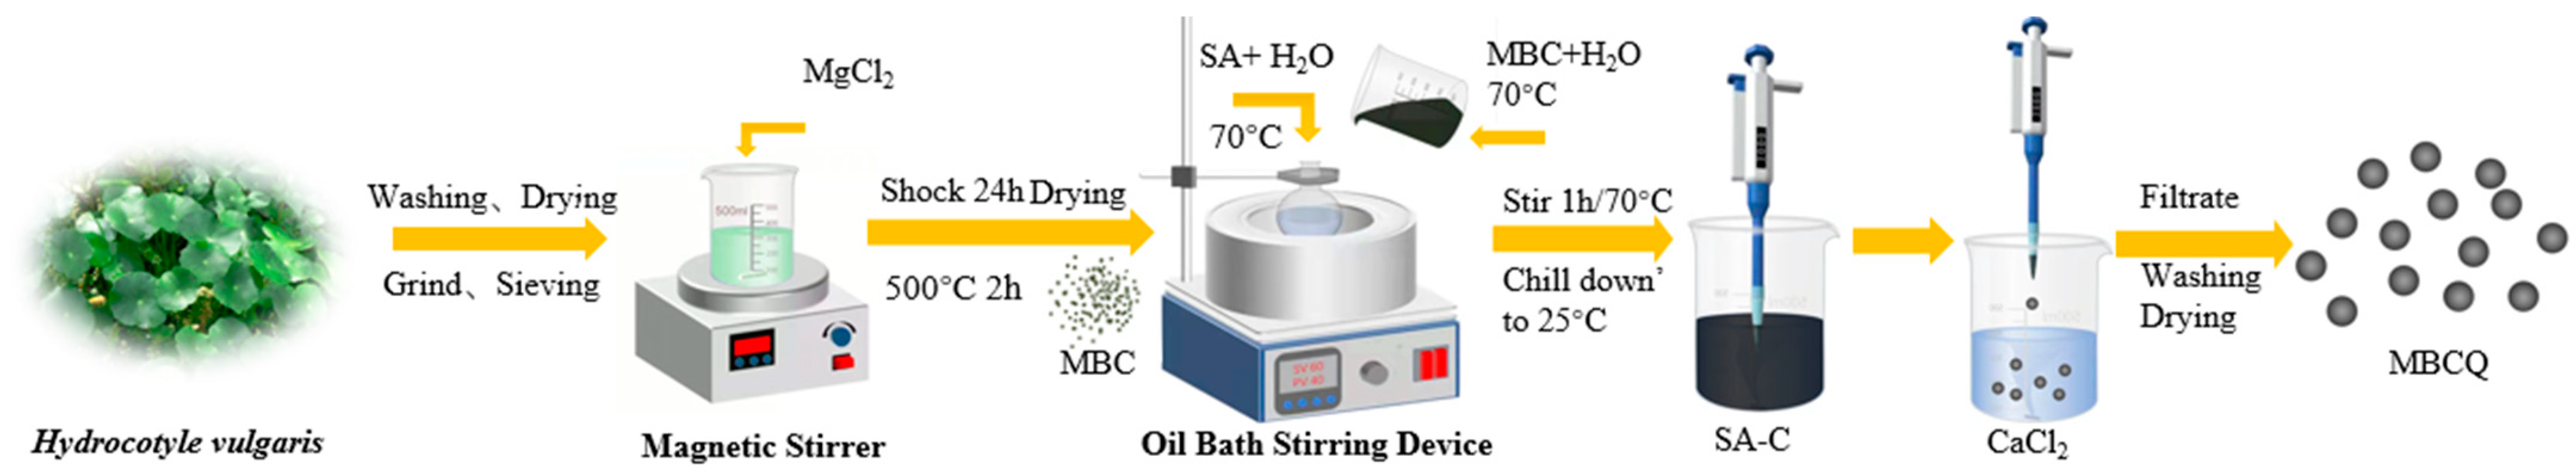
2.2. Preparation of an Adsorbent

2.2.1. Preparation of MBC

The fabrication process of MBCQ is schematically depicted in Figure 1. Hydrocotyle vulgar was washed with deionized water and then dried, ground, passed through a 50-mesh sieve and placed in a sealed bag. Biomass powder at the weight of 100 g was combined with 1 L of 3 mol/L MgCl2·6H2O solution. After stirring for 10 min with a magnetic agitator, the solution was placed in a thermostatic oscillator and oscillated at 25 °C, 150 r/min for 24 h to fully mix them. After filtration, washing, and drying, Mg-loaded biomass was obtained. The Mg-loaded biomass was placed in a tubular furnace in N2 atmosphere, heated to 500 °C at 10 °C/min, maintained for 2 h, then cooled to room temperature. The biochar obtained was recorded as MBC.

2.2.2. Preparation of Biochar Particle (MBCQ)

An appropriate amount of SA was dissolved in deionized water to obtain 0.8% SA solution. Under the heating condition of 70 °C, the MBC prepared above was added into the SA solution and stirred at 70 °C for 1 h to make it evenly mixed. The mixed solution was recorded as SA-C, loaded into syringes of different sizes, and dropped into 0.1 mol/L CaCl2 solution, which could form small balls when the solution was stirred slowly to avoid adhesion. The balls were collected and dried, and the resulting biochar particles were recorded as MBCQ. 1 g MBCQ contains 0.087 g of MBC.

2.3. Static Adsorption Experiment

Into a 250-milliliter corked conical flask, 100 mL of KH2PO4 solution was placed, and 1 g MBCQ of each different particle size was added. The pH of the solution was adjusted to 7.0 by the sodium hydroxide and hydrochloric acid solution, and the concentration of total phosphorous (Ph) in the supernatant (fluid) was determined after 24 h of oscillation in a 150 r/min constant temperature oscillator at 25 °C. Three parallel samples were set up for each group of experiments.

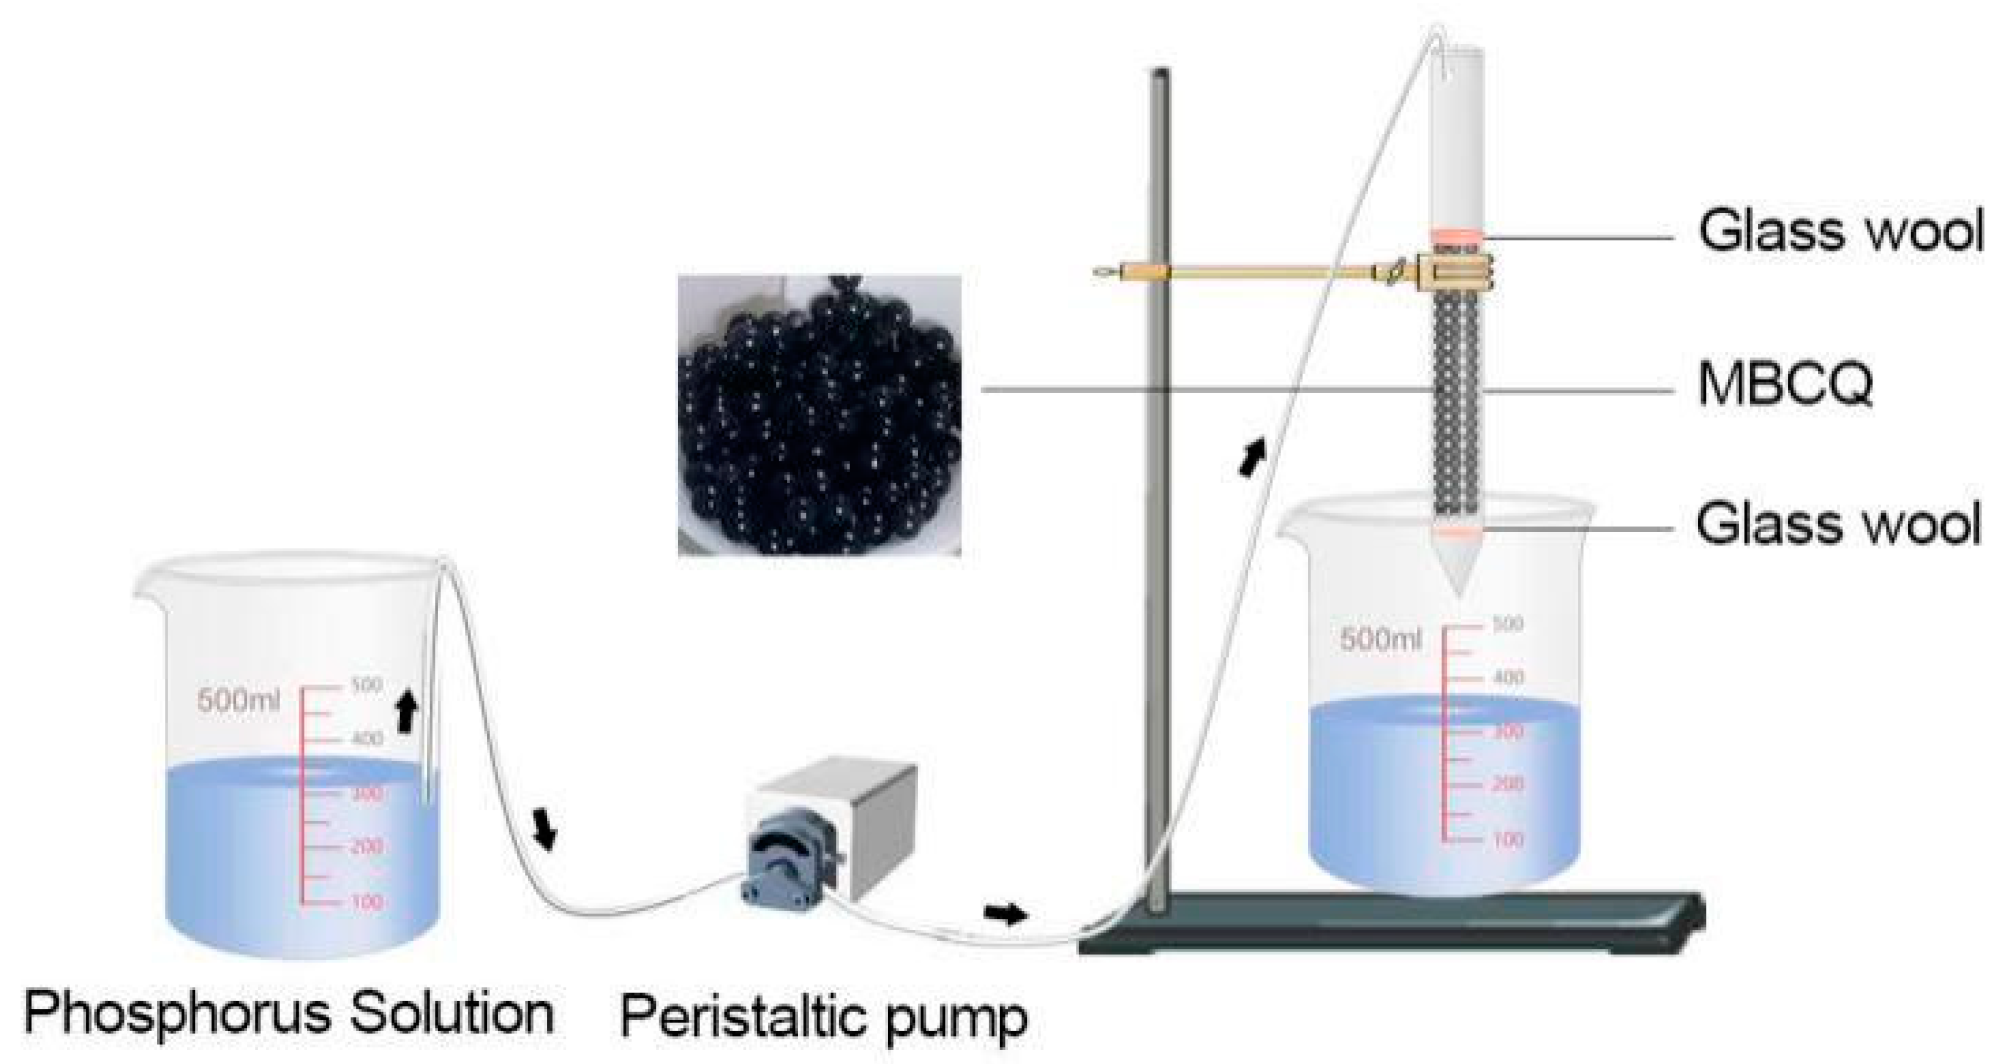
2.4. Adsorption Column Experiment

A self-made adsorption column as shown in Figure 2 was utilized for the adsorption column experiment. It was made of glass with an inner diameter of 20 mm and a height of 250 mm. The column was filled with MBCQ adsorbent material. To avoid the loss of adsorbent during the adsorption process, the upper and lower ends were filled with an appropriate amount of glass wool. Before adsorption, the MBCQ adsorption material was fully infiltrated with deionized water to make it evenly filled, and then KH2PO4 solution was added from top to bottom through a peristaltic pump to measure the effluent concentration regularly. In this study, 95% c0 (initial ion concentration) was set as the saturation point and 10% c0 as the breakthrough point.

2.5. Calculation of Adsorption Column Parameters

The total amount of Ph adsorbed by the adsorption column (Mad) from the beginning of the adsorption reaction to the adsorption saturation can be calculated from the following equation (Equation (1)).
Mad = Q 1000 0 t e ( c 0 c t ) dt
qexp is the dynamic adsorption capacity of the adsorbent, which can be calculated from the following equation (Equation (2)).
qexp = Mad/m
H is the length of the adsorption column mass transfer zone, which can be calculated from the following equation (Equation (3)).
H = c0Q(tetb)/(1000qexpρ0A)
where m (g) is the adsorbent mass; Q (mL/min) is the inlet water flow rate; tb and te (min) are the adsorption breakthrough point and saturation point time; c0 and ct (mL/L) are Ph concentrations of inlet and outlet water; A (cm2) is the adsorption column cross-sectional area; ρ0 (g/cm3) is the adsorption column filling density.

2.6. Adsorption Model Fitting

2.6.1. Adsorption Isotherm Equation

The Langmuir and Freundlich isotherm models were used to fit their adsorption data, and the calculation equation is as (Equations (4) and (5)).
ce/Qe = ce/Qmax + 1/kLQmax
lnQe = lnKF + lnce
where ce (mg/L)is the concentration of Ph solution at equilibrium; Qe (mg/g) is the adsorption capacity at equilibrium; Qmax (mg/g) is the maximum adsorption capacity of the adsorbent; KL and KF (L/g) are the adsorption equilibrium constants of the Langmuir and Freundlich equations; n is the constant indicating the linearity of this adsorption isotherm.

2.6.2. The Bed Depth Service Time Model

The BDST (Bed depth service time) model predicts the adsorption time at different column heights, flow rates, and other factors which are often applied in adsorption systems. The model assumes that the adsorbent is directly adsorbed on the adsorbent surface, ignoring the resistance between mass transfer and internal diffusion, and is an idealized model [26]. The predicted time can be calculated by equation (Equation (6)).
t = N0z/(c0v) − ln(c0/ct − 1)/kc0
The linear expression for this is (Equation (7)).
t = az + b
where N0 (mg/g) is the maximum adsorption amount; v (cm/h) is the inlet water linear velocity; k (L·mg−1·h−1) is the adsorption rate constant; z (cm) is the adsorption column height; t (min) is the adsorption time; a and b are the slope and intercept.
In the same system, when only the flow rate changes, a changes and b remains unchanged, which can be calculated by equation (Equation (8)). Only when only the initial concentration changes, both a and b change, which can be calculated by equations (Equations (9) and (10)).
a = Qa/Q
va′ = c0a/c0
b′ = b(c0/c0′)[ln(c0′/ct′ − 1)·L − 1n(c0/ct − 1)]
where c0′ (mg/g) is the inlet water Ph concentration after the change; Q′ (mg/min) is the inlet water flow rate after the change; a′ and b′ are the slope and intercept after the change.

2.6.3. The Tomas Model

The Tomas model is a simplified model based on the Langmuir equation, assuming only advective flow action in the adsorption process and no axial diffusion [27]. It is commonly used to describe dynamic adsorption performance, estimate adsorption capacity and adsorption rate constants. Its calculation formula is shown in (Equation (11)).
ct/c0 = 1/[1 + exp(Kthqcalm/QKthc0t)]
where Kth (10−3 L·min−1·mg−1) is the Tomas model rate constant; x (g) is the adsorption column mass; q0 (mg/g) is the equilibrium adsorption volume; v (mL/min) is the flow rate; t (min) is the adsorption time.

2.7. Analytical Methods and Instruments

The concentration of Ph was determined according to the Water and Waste Water Monitoring Analysis Method (SEPA, 2002) using a UV-visible spectrophotometer (HACH-DR/6000, HACH, Loveland, CO, USA). The surface morphology of MBCQ was analyzed using a scanning electron microscope (SEM, QUANTA, FEI Company, Holland, The Netherlands). The specific surface area of MBCQ was measured by the Brunauer–Emmett–Teller method (BET, Autosorb-IQ-MP, Quantachrome Instrument Corp., Norcross, GA, USA). The crystalline structure of MBCQ was characterized by X-ray diffractometer (XRD, D8 Advance, BRUKER, Karlsruhe, Germany).

3. Results

3.1. MBC Phosphorus Removal Performance Analysis

Table 1 compares the maximum adsorption capacities of MBCand different types of adsorbents media previously reported [28,29,30,31,32,33] for the removal of Ph. It can be seen that the adsorption capacity of MBC for phosphorus can reach 223.4 mg/g, which is much higher than other reported biochar-based materials. This shows that Hydrocotyle vulgar is a potential raw material for high-efficiency phosphorus removal and adsorption, but the powder biochar (MBC) of Hydrocotyle vulgar is light in texture, dispersed and difficult to recover. Therefore, in the next research, the powder biochar is prepared into microspheres (MBCQ), and the adsorption performance of MBCQ on phosphorus is studied to provide basic data for its practical application.

3.2. Static Adsorption Performance of MBCQ

Under the conditions of a temperature of 25 °C, the initial Ph concentration of 5 mg/L, carbon content of 4.4 mg/g, and mass of 1 g, the static Ph adsorption effect of MBCQ with nine particle sizes is shown in Figure 3. The Ph removal rates of MBCQ with nine particle sizes were all higher than 90%, and the adsorption capacity ranged from 90.00 mg/g to 96.10 mg/g, which indicated that the Ph removal effect of granulated biochar was more effective in removing Ph. However, the difference in particle size had an effect on the adsorption performance of MBCQ, which was 3 mm > 9 mm > 10 mm > 2 mm > 4 mm > 7 mm > 5 mm > 6 mm > 8 mm in descending order according to the Ph removal rate; 3 mm MBCQ had the highest Ph removal rate (96.10%), followed by 9 mm MBCQ (95.34%). This may be related to the fact that MBCQ, with a particle size of 3 mm, has a suitable specific surface area and pore structure, which can provide more contact interfaces between the adsorbent and the adsorbate [27].
The Freundlich and Langmuir models were used to fit the adsorption data for nine particle sizes of MBCQ, the results of which are shown in Table 2. The adsorption mechanism can be preliminarily determined according to the applicable conditions of the two adsorption isotherms. The goodness of fit of the model to the adsorption data of different particle sizes of MBCQ was higher than the goodness of fit of the Freundlich model, which indicates that the surface adsorption of Ph on MBCQ was dominated by chemisorption, and the Langmuir model was more suitable to describe the process. The qm of different particle sizes ranged from 10.735~14.752 mg/g, with the highest qm value obtained for 3-millimeter MBCQ (14.752 mg/g), followed by 9-millimeter MBCQ (13.946 mg/g). This was similar to the pattern of KL differences at each particle size, which indicates that the particle sizes 3 mm and 9 mm showed the largest increase in adsorption capacity after granulation. The n value of the Freundlich model was less than 1, which indicated that chemical adsorption was dominant, whereas an n value >1 indicated that physical adsorption was dominant. The n values of different particle sizes ranged from 3.378 to 5.128, all of which were >1. It can be assumed that if Ph adsorption on the MBCQ surface occurred by Coulombic or van der Waals force, physical adsorption was dominant. Therefore, Ph adsorption by MBCQ was the result of a combination of physical and chemical adsorption processes.

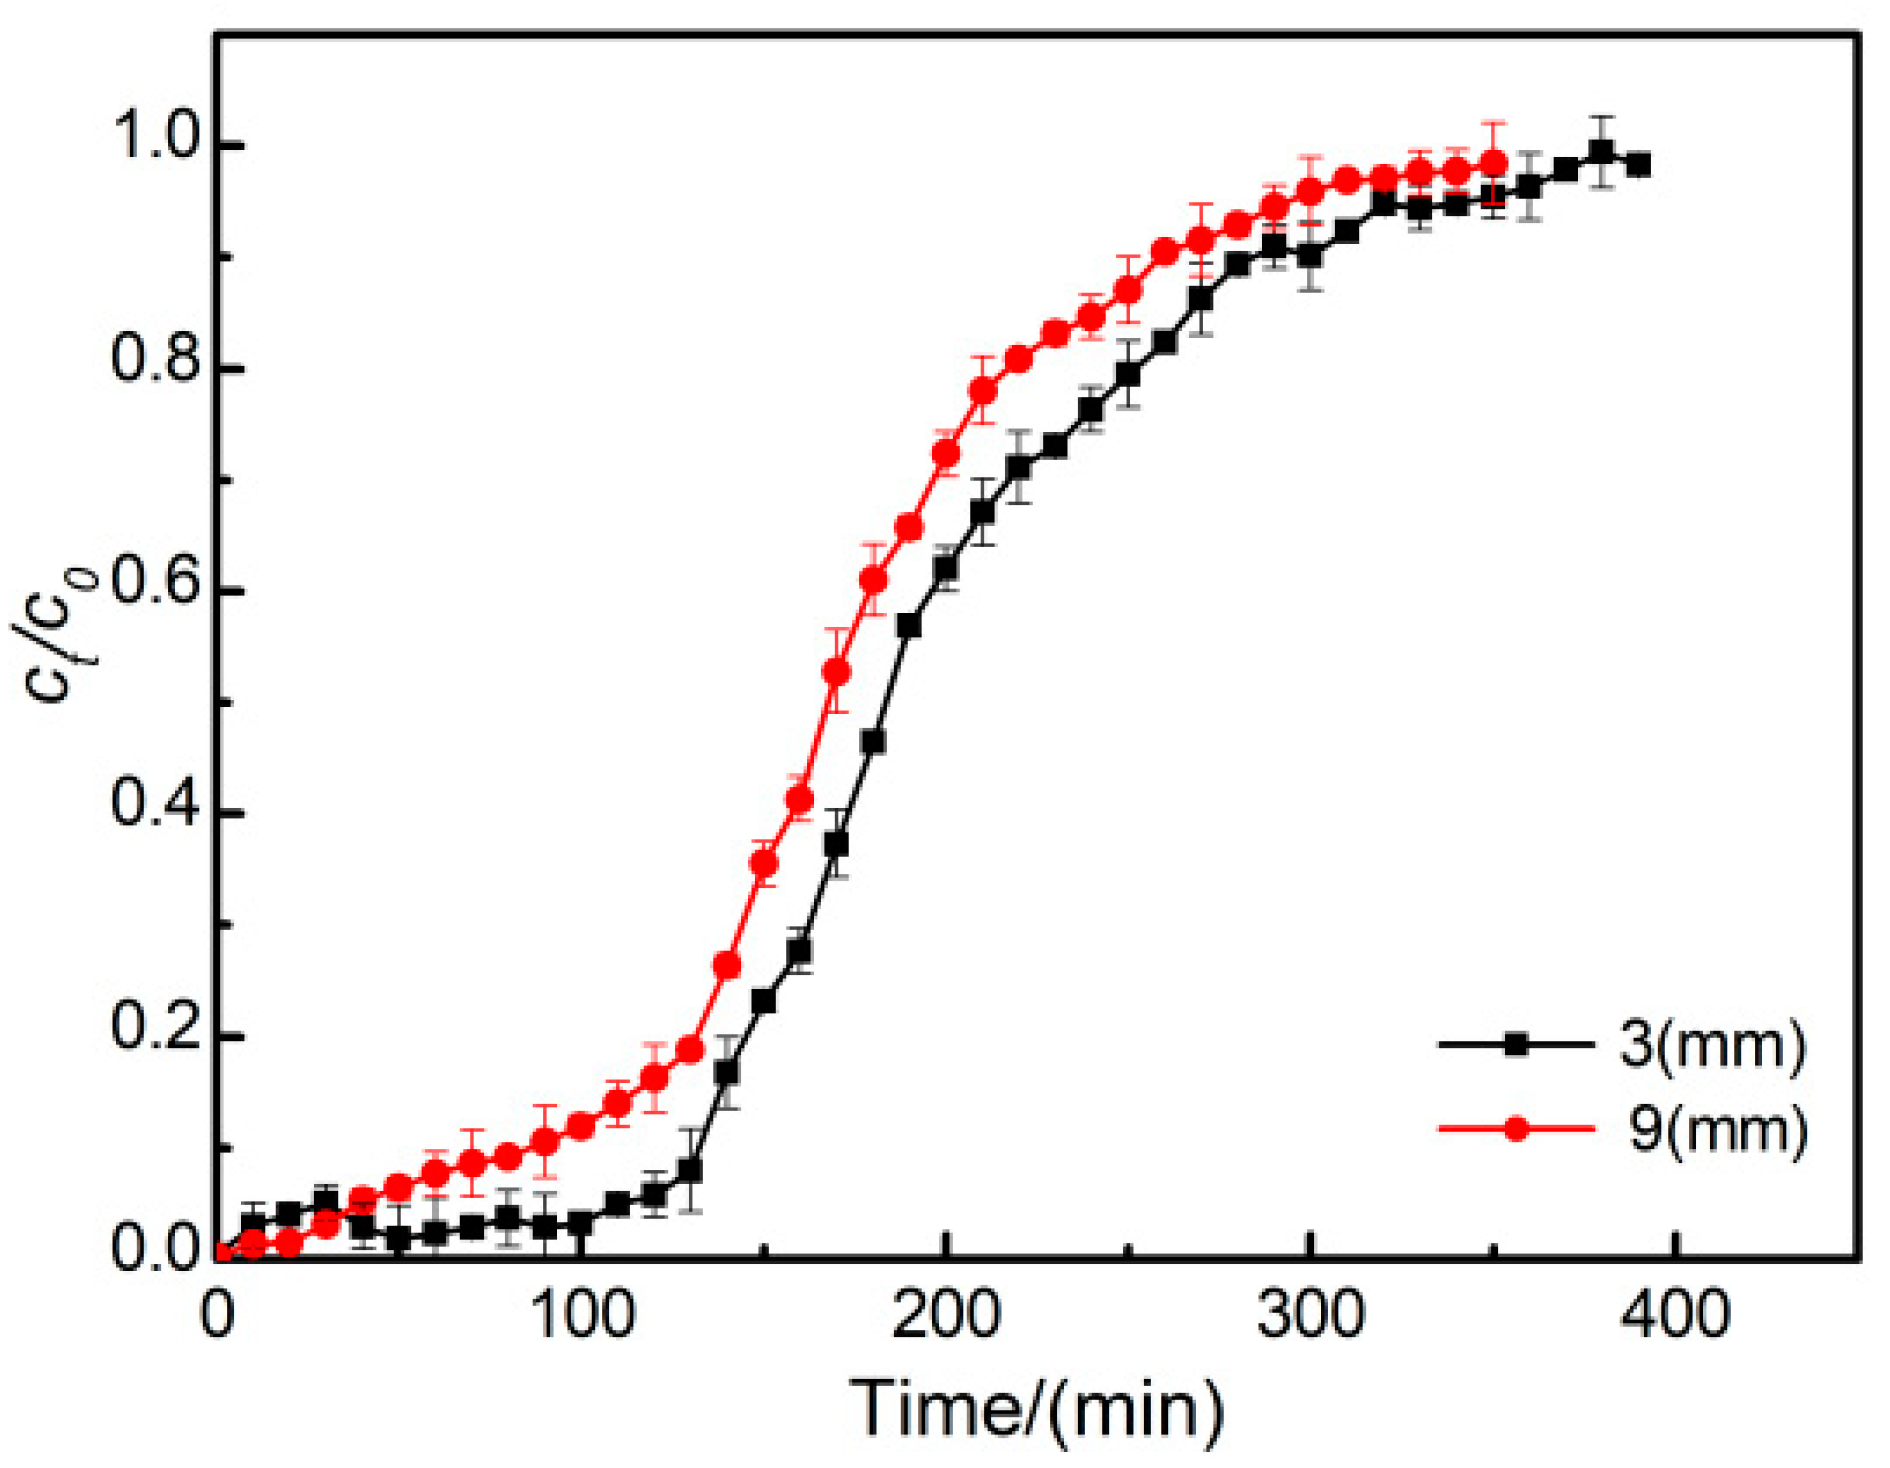
3.3. Effect of Particle Size on the Breakthrough Curve

MBCQ, with excellent static adsorption performance and particle sizes of 3 mm and 9 mm, were selected as dynamic adsorption materials (in order of notation as MBCQ3, then MBCQ9). Figure 4 demonstrates the adsorption penetration curves of Ph by MBCQ3 and MBCQ9 at an initial concentration of 5 mg/L, a column height of 10 cm, and a flow rate of 3 mL/min. The penetration point times of MBCQ3 and MBCQ9 were 135 and 95 min, respectively, and the saturation point times were 345 and 295 min, respectively. This shows that the smaller particle size penetration time points and saturation time points were significantly delayed. The effects of the two particle sizes on the penetration curves were further compared, as shown in Table 3. Compared with MBCQ9, the total adsorption amount (Mad) of MBCQ3 was 9.18% higher, and the dynamic adsorption capacity (qexp) was 7.55% higher. Compared with the static adsorption test, the dynamic adsorption test better reflected the differences in the Ph removal performance between the two particle sizes of MBCQ, which indicated that the Ph adsorption of MBCQ with a particle size of 3 mm was more rapid and effective. MBCQ3 also had a shorter mass transfer zone length than MBCQ9, which indicated that MBCQ3 has less mass transfer resistance and higher adsorbent utilization. MBCQ3 is simple to prepare, provides a low-cost alternative, and achieves an excellent adsorption effect. Further study of its dynamic adsorption characteristics under different conditions can provide basic data for future industrial applications [34].

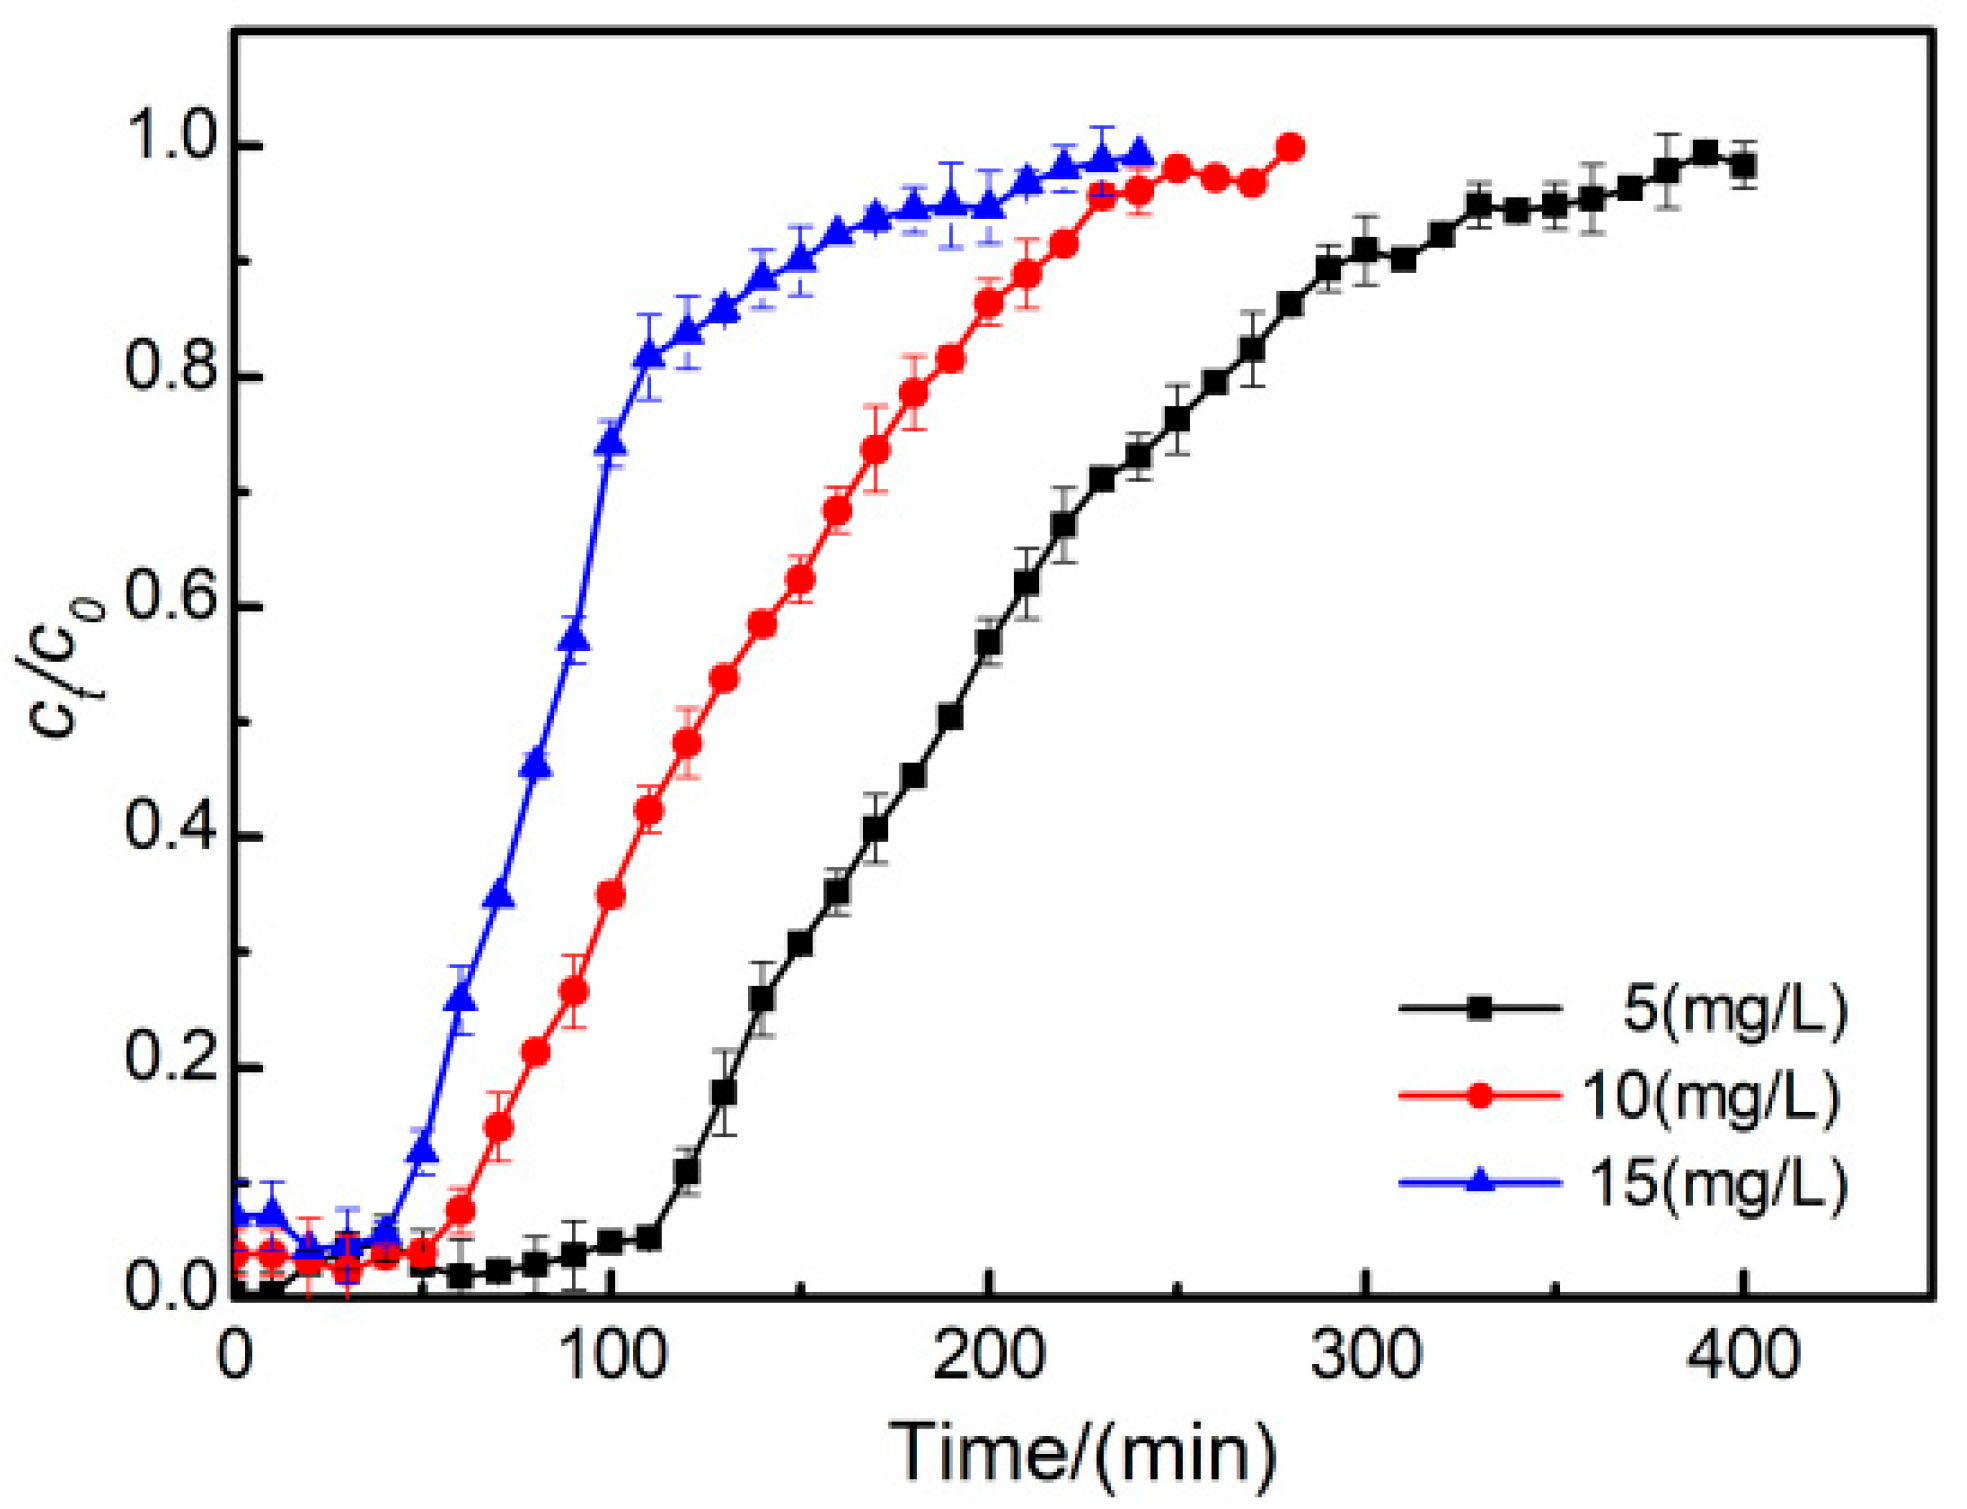
3.4. Effect of Initial Phosphate Concentration on the Penetration Curve

Figure 5 shows the adsorption penetration curves of Ph by MBCQ3 at a column height of 10 cm, flow rate of 3 mL/min, and initial Ph concentrations of 5 mg/L, 10 mg/L, 15 mg/L. As can be seen from the figure, the slope of the curve increases sharply with the increase of the initial Ph concentration. The penetration time decreases from 130 min to 70 min and 35 min, and the saturation time decreases from 355 min to 225 min and 185 min. This was due to the fact that as the Ph concentration increases, the internal driving force increases, the mass transfer rate is accelerated, and MBCQ3 does not have sufficient contact with Ph [35]. Thus, there were shortened penetration and saturation times, a lower utilization rate of the adsorption column, and a lower Ph removal effect.

3.5. Effect of Flow Rate on the Breakthrough Curve

Figure 6 illustrates that the breakthrough curves of Ph adsorption by MBCQ3 were measured at an initial Ph concentration of 10 mg/L, column height of 10 cm, and flow rates of 1.5, 3, and 4.5 mL/min. As the inlet flow rate increased, the shape of the penetration curve gradually became steeper and the penetration and saturation times shorter. When the flow rate was 1.5, 3, and 4.5 mL/min, the adsorption penetration time decreased from 120 min to 70 min and 50 min; and the adsorption saturation time decreased from 320 min to 230 min and 130 min. The increase in influent flow rate reduces the contact time between Ph and MBCQ, resulting in an insufficient time for Ph to undergo membrane diffusion and intraparticle diffusion [36]. The MBCQ utilization rate decreased with the increase of the mass transfer zone length. The use cycle and treatment effect of the adsorption column were affected by the flow rate. How to control the flow rate of adsorbent to fully exploit the role of the adsorbent under the premise of ensuring optimal water yield is an important parameter to consider in the practical application of an adsorption column [36].

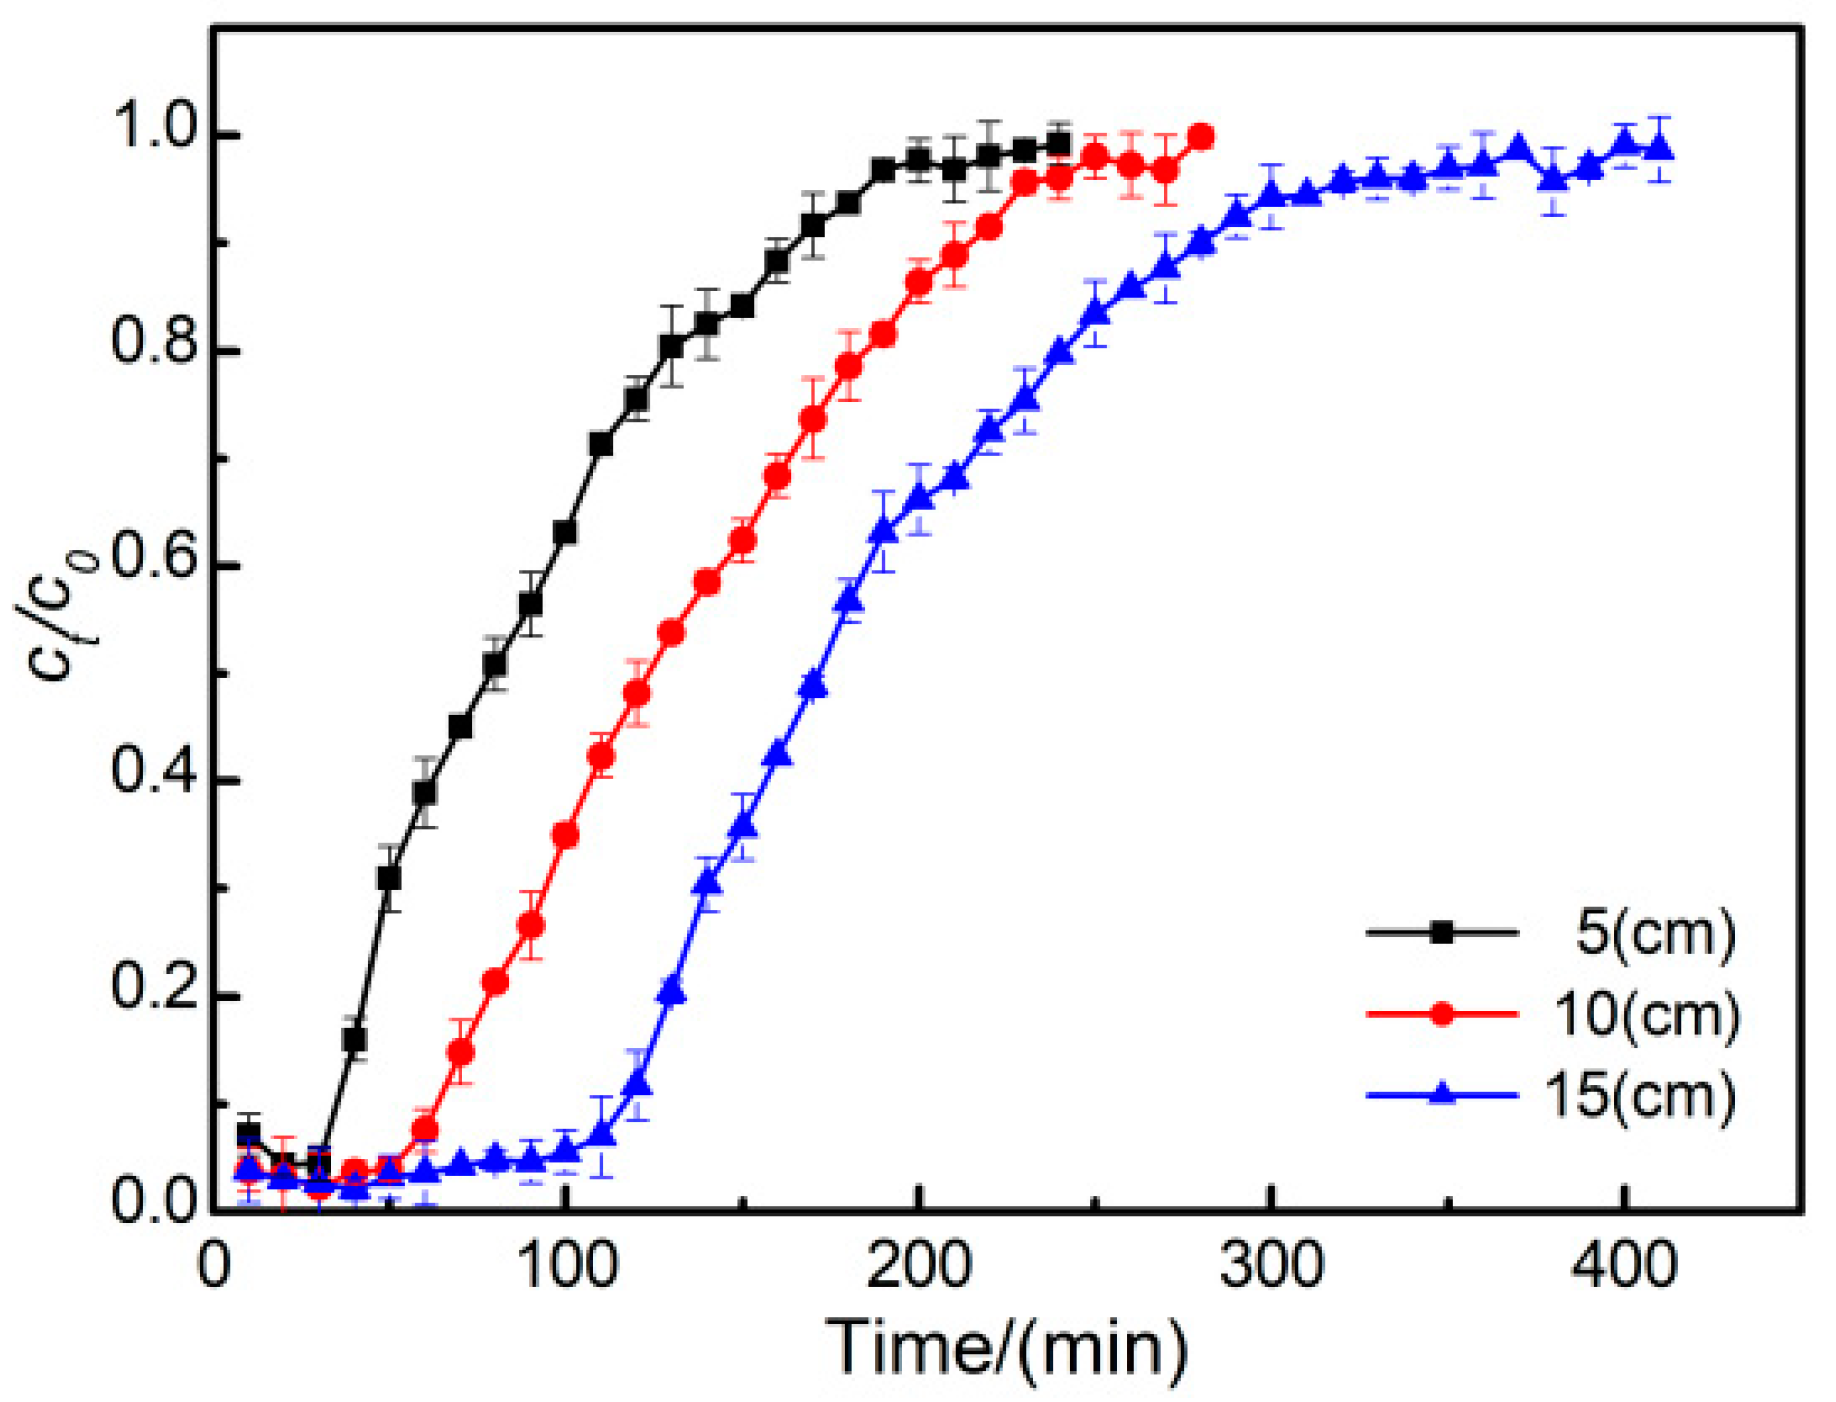
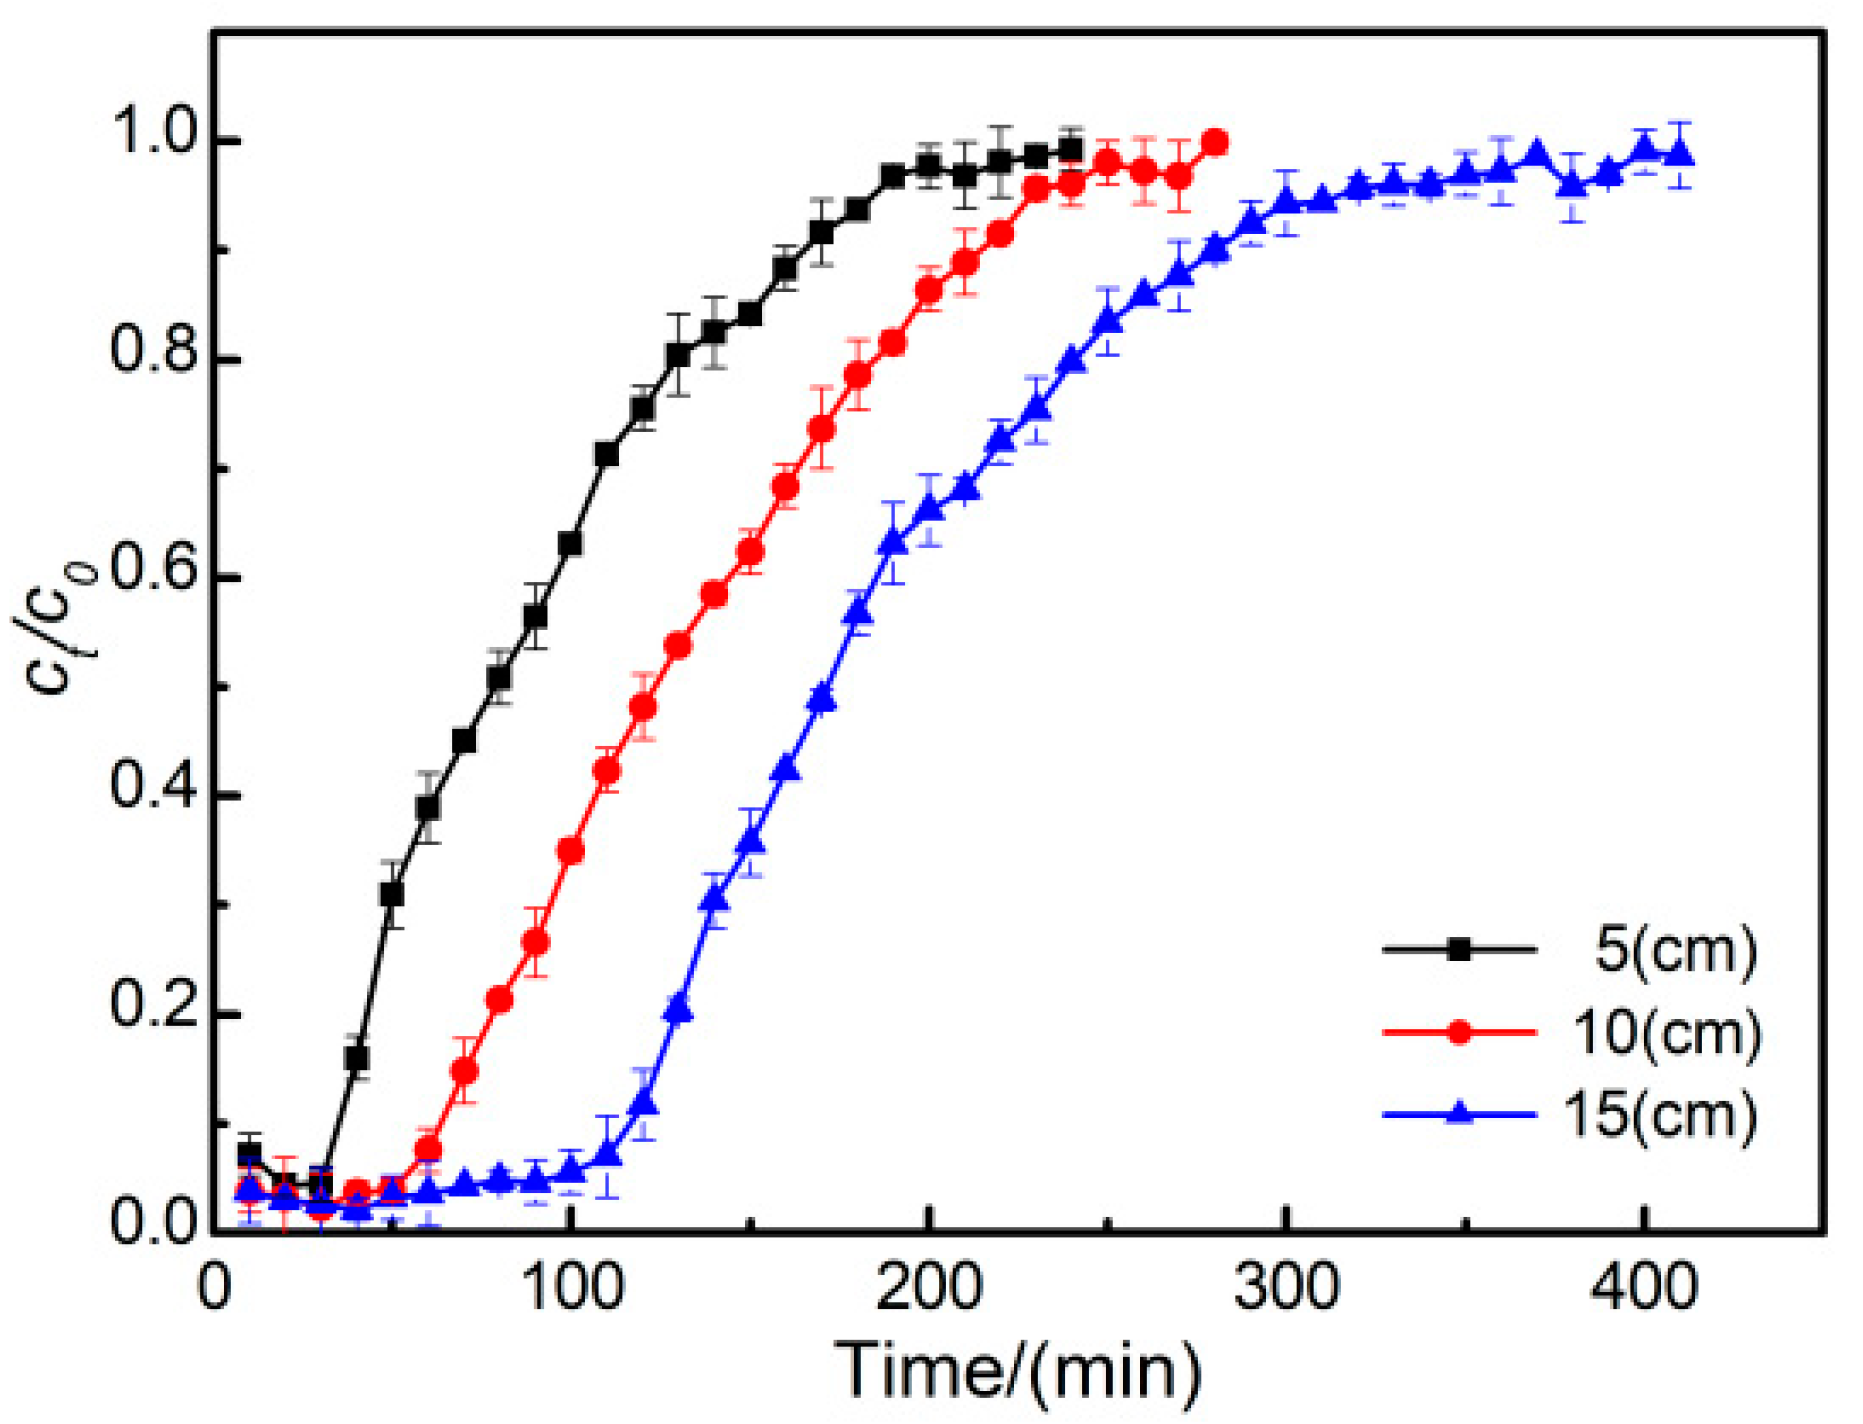
3.6. Effect of Column Height on the Breakthrough Curve

Figure 7 shows the effect of column height on the penetration curve for an initial Ph concentration of 10 mg/L and a flow rate of 3 mL/min. When the column height was 5 cm, 10 cm, and 15 cm, the breakthrough time of MBCQ was 45 min, 65 min, and 115 min, respectively, and the saturation point time was 175 min, 230 min, and 315 min, respectively. It can be seen that with the increase of column height, the breakthrough point time and saturation point time were evidently prolonged. The increase of the adsorption column height meant there was an increase of adsorbent and adsorption sites, which prolonged the contact time between adsorbent Ph and MBCQ, increased the adsorption capacity of MBCQ, and thus improved its adsorption effects [37]. However, the change of column height had little influence on the shape of the breakthrough curve and length of the mass transfer zone, which may have been related to the diffusion rate of mass transfer and adsorption equilibrium.

3.7. Analysis of the Influence of Different Factors on the Breakthrough Curve

Ph adsorption by MBCQ3 is influenced by the initial Ph concentration, flow rate, and column height. The degree of influence was measured as the ratio of mass transfer zone length (H) and breakthrough time (tb) to the amount of variation of different factors; i.e., |ΔH/Δx| and |Δtb/Δx|, the results of which are shown in Table 4. According to MBCQ3 at the initial phosphorus concentration, flow velocity, column height, and the factors influencing the particle sizes of the four conditions of |ΔH/Δx| and |Δtb/Δx| value, the change of flow velocity had the greatest influence on the length of mass transfer zone and the penetration time, and the initial phosphorus concentration had the second greatest influence. Column height and particle size had little effect on the length of mass transfer zone and penetration time.

3.8. Fit of the BDST Model to the Breakthrough Curve

To further analyze the relationship between column height z and adsorption time t under the conditions of an initial Ph concentration of 10 mg·min−1, flow rate of 3 mL/min, and adsorption column height of 5 cm, 10 cm, and 15 cm, the corresponding time when ct/c0b = 0.3, 0.6, and 0.8 was measured, and the linear fitting curve of the BDST model was plotted as shown in Figure 8 and Table 5. The relationships between the adsorption column height z, different ct/c0, and time t were: t0.8 = 12.963z + 31.969, t0.6 = 9.503z + 23.132, t0.3 = 8.563z + 6.236, which had the correlation coefficient R2 > 0.95. This indicates that the BDST model can better describe the dynamic adsorption process of MBCQ, and the BDST model can be used to predict the Ph penetration characteristics in MBCQ under different operating conditions.
As can be seen from Table 4, when ct/c0 is 0.3, 0.6, and 0.8, the average relative errors are 9.33%, 4.99%, and 11.33%, respectively, which indicates that the column height has less influence on the penetration curve and the BDST model can predict its penetration time better. The BDST model has the best-predicted fit to the penetration curve when ct/c0 is close to 0.6. The reason for this may be that during the initial stage, the measured t-value is small, and the relative error will be large under the same condition of absolute error. It is also possible that the BDST model was established based on the premise of ignoring internal diffusion and resistance between mass transfer. The difference in solid-liquid concentration during the early stage of adsorption is large, and its internal diffusion process cannot be ignored, which limits the BDST application and leads to a relatively large error of ct/c0 = 0.3. When ct/c0 = 0.8, the measured t-values are smaller than the predicted t-values, which may be due to the increase of the MBCQ desorption rate in the near saturation state and the corresponding increase of the Ph concentration in the effluent [38]. When ct/c0 = 0.6, the BDST model achieved the best predicted fit to the penetration curve, and the predicted t-values were closer to the measured values. This may be due to the stabilization of the adsorption column system at this time, which reduced the experimental error and improved the model prediction accuracy [39].

3.9. Fitting of the Thomas Model Breakthrough Curve

The Thomas model is based on the Langmuir equation, which assumes the absence of axial diffusion. According to the results of the static adsorption experiments, the Langmuir model fit the MBCQ adsorption process well (R2 > 0.97), thus indicating that the dynamic adsorption behavior of MBCQ on Ph met the conditions for the application of the Thomas model. As shown in Table 6, the measured values of adsorption and the model predictions fit well (R2 > 0.95), which indicated that the Thomas model better described the dynamic adsorption process of Ph by MBCQ. It can also be tentatively assumed from the Thomas model assumptions that diffusion is not a rate-limiting step for dynamic Ph uptake by MBCQ. As the initial concentration increases, the adsorption density (qexp) increased and the rate constant Kth decreased. This was because the increase in initial concentration increased the concentration difference between solid and liquid, which enhanced the mass transfer zone driving force and boosted the adsorption capacity of the system. As the flow rate increased, the rate constant increased and adsorption density decreased, and the contact time between the adsorbent and adsorbent mass was not sufficient, which resulted in a decrease in the adsorption amount. The adsorption density and rate constant increased with the increase of column height. This may have been attributed to the increase of column height, which increased the amount of adsorbent and prolonged adsorption time [40] so that the adsorbent and adsorbate had more time and points to fully combine, thus enhancing the adsorption efficiency. As can be seen in Table 6, different factors have an effect on the dynamic adsorption behavior of the adsorption column, although there is a difference in this effect. Therefore, to obtain the desired removal effect, the adsorption performance and related parameters of the adsorption column need to be studied first in practice.

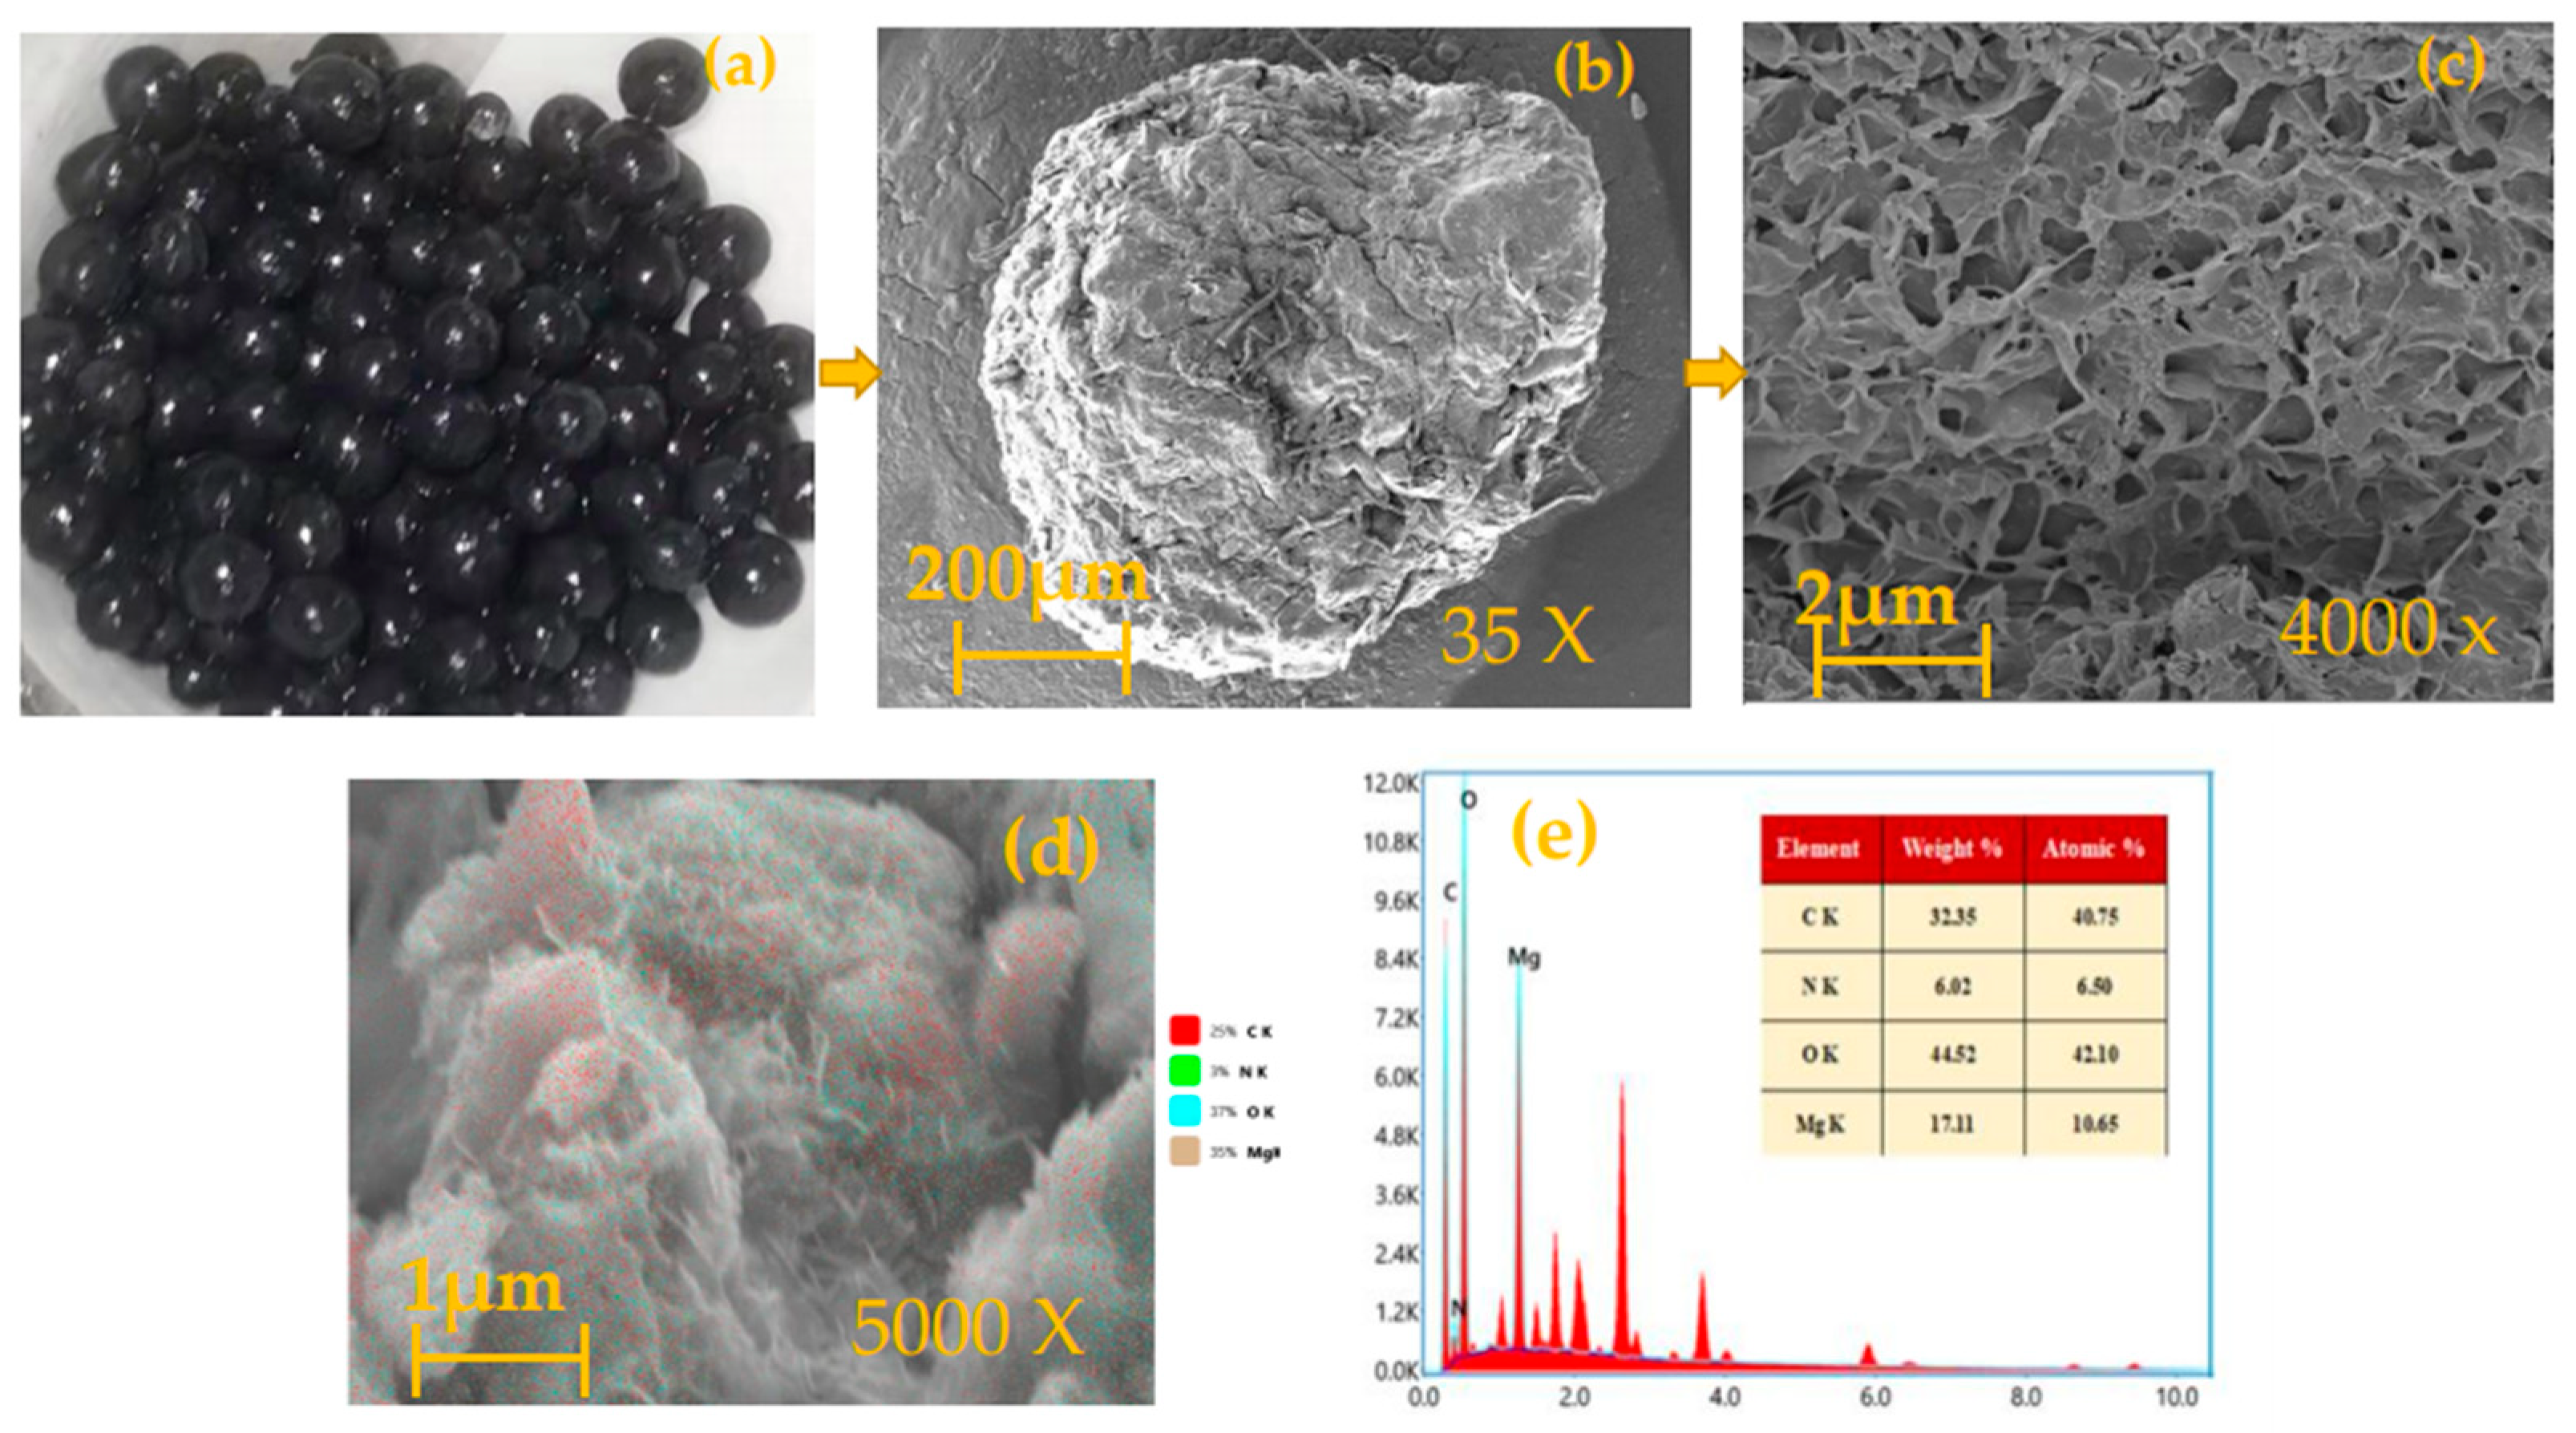
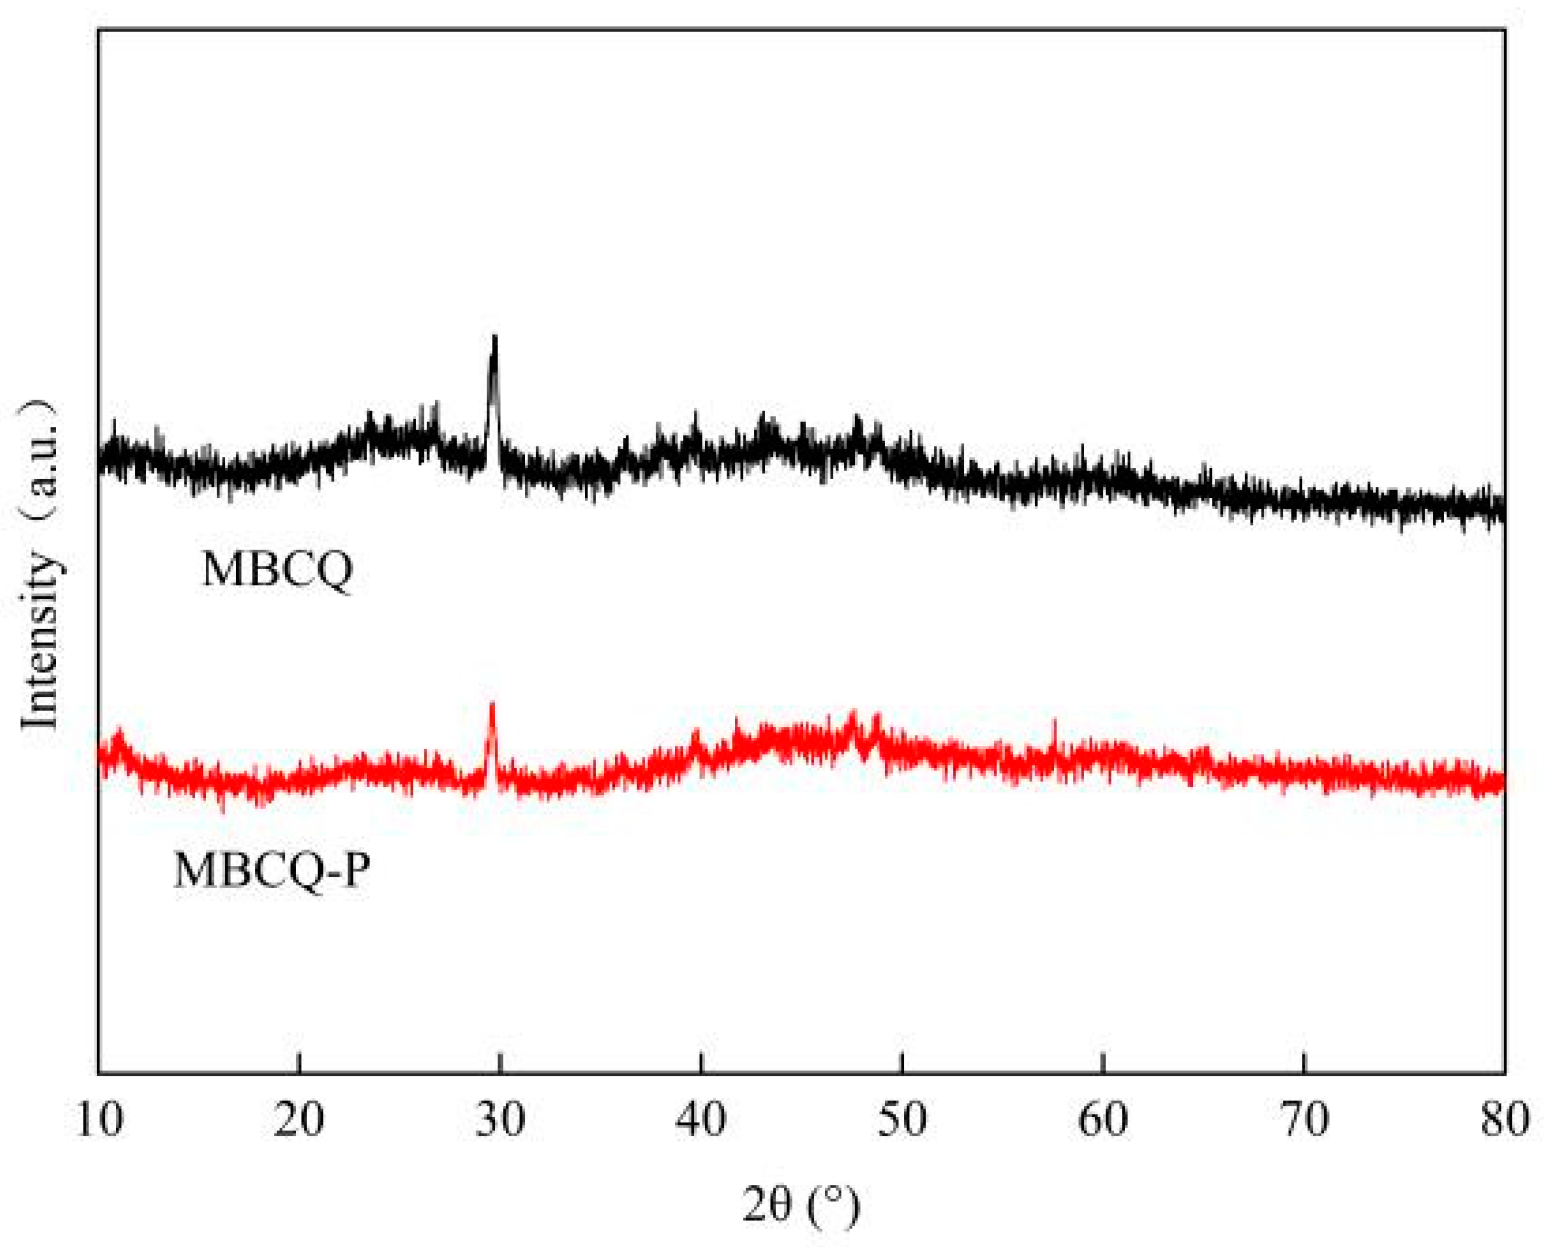
3.10. Characterization of the MBCQ

The optical and SEM images of MBCQ are shown in Figure 9. The surface of MBCQ is rich in pore structure, which can provide more adsorption sites for MBCQ. According to the qualitative and semi-quantitative analysis of elements by EDS spectrum, the main elements of MBCQ are C, N, O and Mg.
The N2 adsorption/desorption isotherms and BJH pore size distributions of the MBCQ3 are shown in Figure 10, and BET-specific surface area and pore characteristics data are presented in Table 7. The N2 adsorption–desorption isotherm of MBCQ belongs to the typical type IV. Due to the existence of mesopores, the capillary condensation of MBCQ occurs in the adsorption process, resulting in the desorption hysteresis loop. The specific surface area of MBCQ is 266.423 m2/g, the total pore volume is 0.614 cm3/g, and the pore diameter is mainly 2–5 nm, followed by 5–10 nm and 30–60 nm, with an average pore diameter of 7.956 nm. A large specific surface area and abundant pore structure can provide good adsorption conditions for MBCQ [28].
The X-ray diffraction pattern of MBCQ before and after phosphorus adsorption (Figure 11) clearly demonstrates that the surface crystal characteristics of MBCQ did not change significantly after the adsorption reaction, but both had significant MgO crystal structure—except that the peak strength was slightly decreased after adsorption, which might be due to the formation of the complex between phosphorus and the functional groups in MBCQ. In general, the adsorption peaks of MBCQ were less, which meant that MBCQ had good amorphous property. Studies have shown that the low crystallinity of the material facilitates the diffusion of ions into the material, thus improving the adsorption force of the material [41].

4. Conclusions

The static adsorption data show that MBCQ is effective in Ph removal. The Freundlich and Langmuir models can both describe its adsorption process better, which indicates that Ph absorption by MBCQ is the joint result of physical and chemical adsorption. The static adsorption performance varied among particle sizes, with MBCQ3 having a relatively optimal Ph removal power of 96.1% and qm of 14.752 mg/g.
In the adsorption column experiment, the length of the mass transfer zone increased, and the penetration time decreased as the initial Ph concentration and flow rate increased; the length of the mass transfer zone decreased slightly, and the penetration time was postponed as the column height increased. The penetration experiments of MBCQ3 and MBCQ9 showed that the penetration time of the smaller particle size was delayed, and the length of the mass transfer zone was reduced. The effects of particle size, initial Ph concentration, flow rate, and column height on the penetration time and mass transfer zone length were as follows: flow rate > initial Ph concentration > column height > particle size, respectively.
The BDST model can better fit the dynamic adsorption process of MBCQ (R2 > 0.95). When ct/c0 = 0.6, the average value of relative error between predicted and measured values was the lowest, especially at the initial concentration of 5 mg/L and flow rate of 3 mL/min, as the relative error value was only 0.81%. The fit between the predicted and measured values of the Thomas model was higher than 0.95, which indicated that the Thomas model can better describe the dynamic adsorption behavior of MBCQ on Ph, while diffusion is not the rate-limiting step of its adsorption process.
The characterization data show that MBCQ has a rich pore structure and good amorphous characteristics, with a specific surface area of 266.423 m2/g and pore size of 2–5 nm. These physical characteristics can provide good conditions for MBCQ adsorption.

Author Contributions

Q.L. and X.F. carried out the data analysis; X.F. wrote the manuscript; Q.L translated this article, X.F. and P.W. revised it. X.L. and P.Z. checked spelling and grammar. All authors have read and agreed to the published version of the manuscript.

Funding

Leading plan for scientific and technical innovation of new and high-tech industries (2020SK2039), Hunan University Innovation Platform open fund project (20K147), 2020 provincial environmental protection scientific research project (9), Initial scientific research fund of Central South University of Forestry and Technology (2019yj040).

Institutional Review Board Statement

Not applicable.

Informed Consent Statement

Not applicable.

Conflicts of Interest

The authors declare no conflict of interest.

References

  1. Sun, Q.; Yue, F.; Chen, J.; Wang, J.; Li, Y.; Li, X.; Bhat, M.A.; Liu, J.; Li, S. Nitrogen and Phosphorus Diffusion Fluxes: Insight from High-Resolution Technology and Hydrodynamic Modeling. Water 2021, 13, 3232. [Google Scholar] [CrossRef]
  2. Wang, X.; Daigger, G.; de Vries, W.; Kroeze, C.; Yang, M.; Ren, N.-Q.; Liu, J.; Butler, D. Impact hotspots of reduced nutrient discharge shift across the globe with population and dietary changes. Nat. Commun. 2019, 10, 2627. [Google Scholar] [CrossRef] [PubMed] [Green Version]
  3. Nir, O.; Sengpiel, R.; Wessling, M. Closing the cycle: Phosphorus removal and recovery from diluted effluents using acid resistive membranes. Chem. Eng. J. 2018, 346, 640–648. [Google Scholar] [CrossRef]
  4. Liu, R.; Hao, X.; Chen, Q.; Li, J. Research advances of Tetrasphaera in enhanced biological phosphorus removal: A review. Water Res. 2019, 166, 115003. [Google Scholar] [CrossRef]
  5. Bacelo, H.; Pintor, A.M.; Santos, S.C.; Boaventura, R.A.; Botelho, C.M. Performance and prospects of different adsorbents for phosphorus uptake and recovery from water. Chem. Eng. J. 2020, 381, 122566. [Google Scholar] [CrossRef]
  6. Huang, Q.; Song, S.; Chen, Z.; Hu, B.; Chen, J.; Wang, X. Biochar-based materials and their applications in removal of organic contaminants from wastewater: State-of-the-art review. Biochar 2019, 1, 45–73. [Google Scholar] [CrossRef] [Green Version]
  7. Li, H.; Dong, X.; da Silva, E.B.; de Oliveira, L.M.; Chen, Y.; Ma, L.Q. Mechanisms of metal sorption by biochars: Biochar characteristics and modifications. Chemosphere 2017, 178, 466–478. [Google Scholar] [CrossRef]
  8. Zhou, L.; Xu, D.; Li, Y.; Pan, Q.; Wang, J.; Xue, L.; Howard, A. Phosphorus and Nitrogen Adsorption Capacities of Biochars Derived from Feedstocks at Different Pyrolysis Temperatures. Water 2019, 11, 1559. [Google Scholar] [CrossRef] [Green Version]
  9. Vikrant, K.; Kim, K.-H.; Ok, Y.S.; Tsang, D.C.; Tsang, Y.F.; Giri, B.S.; Singh, R.S. Engineered/designer biochar for the removal of phosphate in water and wastewater. Sci. Total Environ. 2018, 616–617, 1242–1260. [Google Scholar] [CrossRef]
  10. Srivatsav, P.; Bhargav, B.S.; Shanmugasundaram, V.; Arun, J.; Gopinath, K.P.; Bhatnagar, A. Biochar as an Eco-Friendly and Economical Adsorbent for the Removal of Colorants (Dyes) from Aqueous Environment: A Review. Water 2020, 12, 3561. [Google Scholar] [CrossRef]
  11. Tang, Q.; Shi, C.; Shi, W.; Huang, X.; Ye, Y.; Jiang, W.; Kang, J.; Liu, D.; Ren, Y.; Li, D. Preferable phosphate removal by nano-La(III) hydroxides modified mesoporous rice husk biochars: Role of the host pore structure and point of zero charge. Sci. Total Environ. 2019, 662, 511–520. [Google Scholar] [CrossRef]
  12. Yin, Q.; Ren, H.; Wang, R.; Zhao, Z. Evaluation of nitrate and phosphate adsorption on Al-modified biochar: Influence of Al content. Sci. Total Environ. 2018, 631–632, 895–903. [Google Scholar] [CrossRef]
  13. Wu, K.; Wu, C.; Jiang, X.; Xue, R.; Pan, W.; Li, W.-C.; Luo, X.; Xue, S. Remediation of arsenic-contaminated paddy field by a new iron oxidizing strain (Ochrobactrum sp.) and iron-modified biochar. J. Environ. Sci. 2022, 115, 411–421. [Google Scholar] [CrossRef]
  14. Deng, Y.; Li, X.; Ni, F.; Liu, Q.; Yang, Y.; Wang, M.; Ao, T.; Chen, W. Synthesis of Magnesium Modified Biochar for Removing Copper, Lead and Cadmium in Single and Binary Systems from Aqueous Solutions: Adsorption Mechanism. Water 2021, 13, 599. [Google Scholar] [CrossRef]
  15. Siwek, H.; Bartkowiak, A.; Włodarczyk, M. Adsorption of phosphates from aqueous solutions on alginate/goethite hydrogel composite. Water 2019, 11, 633. [Google Scholar] [CrossRef] [Green Version]
  16. Biswas, S.; Bal, M.; Behera, S.K.; Sen, T.K.; Meikap, B.C. Process Optimization Study of Zn2+ Adsorption on Biochar-Alginate Composite Adsorbent by Response Surface Methodology (RSM). Water 2019, 11, 325. [Google Scholar] [CrossRef] [Green Version]
  17. Fu, X.; Wu, X.; Zhou, S.; Chen, Y.; Chen, M.; Chen, R. A Constructed Wetland System for Rural Household Sewage Treatment in Subtropical Regions. Water 2018, 10, 716. [Google Scholar] [CrossRef] [Green Version]
  18. Chunjian, Y.; Liu, R.; Li, X.; Song, Y.; Gao, H. Degradation of dissolved organic matter in effluent of municipal wastewater plant by a combined tidal and subsurface flow constructed wetland. J. Environ. Sci. 2021, 106, 171–181. [Google Scholar]
  19. Vymazal, J.; Zhao, Y.; Mander, U. Recent research challenges in constructed wetlands for wastewater treatment: A review. Ecol. Eng. 2021, 169, 106318. [Google Scholar] [CrossRef]
  20. Zhao, C.; Xu, J.; Shang, D.; Zhang, Y.; Zhang, J.; Xie, H.; Kong, Q.; Wang, Q. Application of constructed wetlands in the PAH remediation of surface water: A review. Sci. Total Environ. 2021, 780, 146605. [Google Scholar] [CrossRef]
  21. Liu, H.; Cheng, C.; Wu, H. Sustainable utilization of wetland biomass for activated carbon production: A review on recent advances in modification and activation methods. Sci. Total Environ. 2021, 790, 148214. [Google Scholar] [CrossRef] [PubMed]
  22. Li, J.; Li, Y.; Tang, S.; Zhang, Y.; Zhang, J.; Li, Y.; Xiong, L. Toxicity, uptake and transport mechanisms of dual-modal polymer dots in penny grass (Hydrocotyle vulgaris L.). Environ. Pollut. 2020, 265, 114877. [Google Scholar] [CrossRef] [PubMed]
  23. Liu, K.; Liang, X.; Li, C.; Wang, L.; He, X.; Qin, R.; Li, Y.; Yu, F. Hydrocotyle vulgaris L.: A new cadmium-tolerant landscape species and its physiological responses to cadmium exposure. Environ. Sci. Pollut. Res. 2021, 28, 26045–26054. [Google Scholar] [CrossRef]
  24. Tang, L.; Mo, K.; Chen, Q.; Zhang, J.; Xia, J.; Lin, Y. An experimental study on potential changes in plant community evapotranspiration due to the invasion of Hydrocotyle vulgaris. J. Hydro-Environ. Res. 2020, 30, 63–70. [Google Scholar] [CrossRef]
  25. Boni, M.; Marzeddu, S.; Tatti, F.; Raboni, M.; Mancini, G.; Luciano, A.; Viotti, P. Experimental and Numerical Study of Biochar Fixed Bed Column for the Adsorption of Arsenic from Aqueous Solutions. Water 2021, 13, 915. [Google Scholar] [CrossRef]
  26. Ye, J.; Yang, M.; Ding, X.; Tan, W.; Li, G.; Fang, S.; Wang, H. Fixed-bed column dynamics of ultrasound and Na-functionalized diatomite to remove phosphate from water. Environ. Sci. Pollut. Res. 2021, 29, 12441–12449. [Google Scholar] [CrossRef]
  27. Shin, H.; Tiwari, D.; Kim, D.-J. Phosphate adsorption/desorption kinetics and P bioavailability of Mg-biochar from ground coffee waste. J. Water Process Eng. 2020, 37, 101484. [Google Scholar] [CrossRef]
  28. Frišták, V.; Pipíška, M.; Turčan, V.; Bell, S.M.; Laughinghouse, H.D.; Ďuriška, L.; Soja, G. Preparation and Characterization of Novel Magnesium Composite/Walnut Shells-Derived Biochar for As and P Sorption from Aqueous Solutions. Agriculture 2021, 11, 714. [Google Scholar] [CrossRef]
  29. Nardis, B.O.; Carneiro, J.S.D.S.; De Souza, I.M.G.; De Barros, R.G.; Melo, L.C.A. Phosphorus recovery using magnesium-enriched biochar and its potential use as fertilizer. Arch. Agron. Soil Sci. 2020, 68, 1017–1033. [Google Scholar] [CrossRef]
  30. Haddad, K.; Jellali, S.; Jeguirim, M.; Ben Hassen Trabelsi, A.; Limousy, L. Investigations on phosphorus recovery from aqueous solutions by biochars derived from magnesi-um-pretreated cypress sawdust. J. Environ. Manag. 2018, 216, 305–314. [Google Scholar] [CrossRef]
  31. Takaya, C.; Fletcher, L.; Singh, S.; Anyikude, K.; Ross, A. Phosphate and ammonium sorption capacity of biochar and hydrochar from different wastes. Chemosphere 2016, 145, 518–527. [Google Scholar] [CrossRef]
  32. Cui, X.; Dai, X.; Khan, K.Y.; Li, T.; Yang, X.; He, Z. Removal of phosphate from aqueous solution using magnesium-alginate/chitosan modified biochar micro-spheres derived from Thalia dealbata. Bioresour. Technol. 2016, 218, 1123–1132. [Google Scholar] [CrossRef]
  33. Villanueva, M.E.; del Rosario-Diez, A.M.; Gonzales, J.A.; Lazaro-Martinez, J.M.; Campo Dall’Orto, V.; Copello, G.J. Phosphorus adsorption by a modified polyampholyte-diatomaceous earth material containing im-idazole and carboxylic acid moieties: Batch and dynamic studies. New J. Chem. 2017, 41, 7667–7673. [Google Scholar] [CrossRef] [Green Version]
  34. Shi, W.; Fu, Y.; Jiang, W.; Ye, Y.; Kang, J.; Liu, D.; Ren, Y.; Li, D.; Luo, C.; Xu, Z. Enhanced phosphate removal by zeolite loaded with Mg–Al–La ternary (hydr)oxides from aqueous solutions: Performance and mechanism. Chem. Eng. J. 2019, 357, 33–44. [Google Scholar] [CrossRef]
  35. Lu, S.; Huang, X.; Tang, M.; Peng, Y.; Wang, S.; Makwarimba, C.P. Synthesis of N-doped hierarchical porous carbon with excellent toluene adsorption properties and its activation mechanism. Environ. Pollut. 2021, 284, 117113. [Google Scholar] [CrossRef] [PubMed]
  36. Conidi, D.; Parker, W.J.; Smith, S. Effect of solids residence time on dynamic responses in chemical P removal. Water Environ. Res. 2019, 91, 250–258. [Google Scholar] [CrossRef]
  37. Ha, S.-H.; Younis, S.A.; Vikrant, K.; Szulejko, J.E.; Kim, K.-H. Evidence of the dominant role of particle size in controlling the dynamic adsorption breakthrough behavior of gaseous benzene in a microporous carbon bed system. Chem. Eng. J. 2022, 427, 130977. [Google Scholar] [CrossRef]
  38. He, Z.J.; Lu, Y.Q.; Zhu, L.; Qiao, F.M. Phosphorus Dynamic Adsorption from Wastewater by Iron-Oxide-Coated-Zeolite. Appl. Mech. Mater. 2014, 522–524, 660–664. [Google Scholar] [CrossRef]
  39. Yu, Y.; Chen, N.; Wang, D.; Tian, C.; Li, M.; Feng, C. Adsorption of phosphorus based on Hangjin clay granular ceramic from aqueous solution and sewage: Fixed-bed column study. Environ. Prog. Sustain. Energy 2017, 36, 1323–1332. [Google Scholar] [CrossRef]
  40. Xi, H.; Li, Q.; Yang, Y.; Zhang, J.; Guo, F.; Wang, X.; Xu, S.; Ruan, S. Highly effective removal of phosphate from complex water environment with porous Zr-bentonite alginate hydrogel beads: Facile synthesis and adsorption behavior study. Appl. Clay Sci. 2020, 201, 105919. [Google Scholar] [CrossRef]
  41. Sankararamakrishnan, N.; Sanghi, R. Preparation and characterization of a novel xanthated chitosan. Carbohydr. Polym. 2006, 66, 160–167. [Google Scholar] [CrossRef]
Figure 1. Schematic of the fabrication process of MBCQ.
Water 14 00508 g001
Figure 2. Schematic of the fabrication process of MBCQ.
Water 14 00508 g002
Figure 3. Static adsorption of Ph by biochar.
Water 14 00508 g003
Figure 4. Effects of MBCQ with two particle sizes on the breakthrough curves.
Water 14 00508 g004
Figure 5. Effects of the initial Ph concentration on breakthrough curves.
Water 14 00508 g005
Figure 6. Effects of flow rate on breakthrough curves.
Water 14 00508 g006
Figure 7. Effects of bed height on breakthrough curves.
Water 14 00508 g007
Figure 8. Fitting curves in the BDST model.
Water 14 00508 g008
Figure 9. Optical and SEM images of (ac) MBCQ, (e) spectrum and (d) EDS mapping of MBCQ.
Water 14 00508 g009
Figure 10. N2 adsorption-desorption isotherms of MBCQ3, pore size distribution diagram of MBCQ.
Water 14 00508 g010
Figure 11. XRD diagram of MBCQ before and after phosphorus adsorption.
Water 14 00508 g011
Table 1. Comparison of phosphate adsorption capacity by relevant adsorbents.
Feedstock Modifying AgentSpecific Surface/(m2/g)Adsorption Capacity/(mg/g)Ref.
Hydrocotyle vulgar (MBC)MgCl2·6H2O931.1223.4This study
Ground coffee waste MgCl2·6H2O36.456.0[28]
Walnut shellsMgCl2·6H2O/2.6[29]
Sewage sludge MgCl2·6H2O/28.1[30]
Raw cypress sawdustMgCl2·6H2O/66.7[31]
Holm OakMgCl2·6H2O/64.6[32]
Thalia dealbataMgCl2-alginate46.246.6[33]
Table 2. Estimated parameters of the traditional adsorption isotherm models.
MBCQ Particle Size/(mm)LangmuirFreundlich
qmKLR2KF 1/ nR2
212.1930.2030.9835.7010.2330.962
314.7520.2940.9736.6340.2960.984
411.2350.1920.9725.6540.2250.959
510.9080.0930.9815.0620.2150.973
610.8890.0860.9734.9730.2030.959
711.3240.2050.9565.4670.2290.962
810.7350.0770.9875.7480.1950.961
913.9460.2600.9845.9340.2490.953
1012.8490.2370.9638.7860.2300.966
Note: The data in the table are the average of three groups of experiments, and the error range is 1.4–6.9%.
Table 3. Effects of MBCQ with two particle sizes on breakthrough time and mass transfer zone length.
Particle Size
/(mm)
Tb
/(min)
Te
/(min)
Mad
/(mg)
Qexp
/(mg/g)
H
/(cm)
Δtb
/(min)
Δte
/(min)
ΔMad
/(mg)
Δqexp
/(mg/g)
ΔH/
(cm)
31353459.3743.9019.94240500.7880.274−1.814
9952958.5863.62711.756
Note: The data in the table are the average of three groups of experiments, and the error range is 0.52–5.7%.
Table 4. Effects of different conditions on the breakthrough curve.
FactorsxH (cm)tb (min)ΔxΔH/(cm)Δtb/(min)tbx|Hx|
Initial concentration
/(mL/L)
59.9421301016.110−858.5001.611
1017.86165
1526.05245
Flow rate
/(mL/min)
1.58.874110314.699−7023.3334.900
317.86165
4.523.57340
Adsorption column height
/(cm)
519.0623510−3.487808.0000.349
1017.86165
1515.749115
Particle size
/(mm)
39.94213061.814−355.8330.302
911.75695
Note: The data in the table are the average of three groups of experiments, and the error range is 1.2–4.8%.
Table 5. BDST parameters for different conditions.
ct/c0Q
/(mL/min)
C0
/(mg/L)
aabbProjections
t/(min)
Actual Measurement t/(min)Relative Error/(%)
0.31.5108.5217.056.246.24176.701703.94
0.34.5108.525.686.246.2463.065514.65
0.3358.5217.056.243.12173.581655.20
0.33108.528.526.246.2491.47857.61
0.33158.524.266.2412.4755.106515.24
0.61.5109.5019.0123.1323.13213.192054.00
0.64.5109.506.3423.1323.1386.48808.10
0.6359.5019.0123.1311.57201.632000.81
0.63109.509.5023.1323.13118.161255.47
0.63159.504.2523.1346.2688.78956.54
0.81.51012.9625.9331.9731.97291.232659.90
0.84.51012.968.6431.9731.97118.3910018.39
0.83512.9625.9331.9715.99275.252605.86
0.831012.9612.9631.9731.97161.601704.94
0.831512.966.4831.9763.94128.7611017.05
Note: The data in the table are the average of three groups of experiments, and the error range is 0.2–5.3%.
Table 6. Thomas parameters for different conditions.
ProjectInitial Concentration/(mg/L)Flow Rate/(mL/min)Column Height/(cm)
510151.534.551015
Initial concentration/(mg/L)101010101010
Flow Rate/(mL/min)333333
Column height/(cm)101010101010
Kth/[mL/(min·mg)]1.0540.8530.6130.6950.8531.2320.7190.8530.921
qcal/(mg/g)5.0837.1468.1438.0847.1466.1356.4657.1469.125
qexp/(mg/g)3.9015.5815.9727.7435.5814.5614.3375.5817.947
R20.9880.9790.9740.9730.9790.9540.9630.9790.958
Note: The data in the table are the average of three groups of experiments, and the error range is 0.32–3.95%.
Table 7. BET specific surface area and pore characteristics of MBCQ.
MaterialSpecific Surface Area/(m2/g)Mean Pore Size/(nm)Total Pore Volume/(cm3/g)Microporous Pore Volume/(cm3/g)Micropore Specific Area/(m3/g)External Surface Area/(m2/g)
MBCQ266.4237.9560.6140.013170.423196.233
Publisher’s Note: MDPI stays neutral with regard to jurisdictional claims in published maps and institutional affiliations.

