Article

The Dynamics Characteristics of Soil Water Infiltration and Capillary Rise for Saline–Sodic Soil Mixed with Sediment

1
College of Water Conservancy and Civil Engineering, Shandong Agricultural University, Tai’an 271018, China
2
School of Agronomy and Environment, Weifang University of Science and Technology, Weifang 262700, China
3
Key Laboratory of Crop Water Use and Regulation, Ministry of Agriculture, Farmland Irrigation Research Institute, Chinese Academy of Agricultural Sciences, Xinxiang 453000, China
4
College of Hydraulic Engineering, Tianjin Agricultural University, Tianjin 300384, China
*
Authors to whom correspondence should be addressed.
Water 2022, 14(3), 481; https://doi.org/10.3390/w14030481
Submission received: 4 January 2022 / Revised: 4 February 2022 / Accepted: 4 February 2022 / Published: 6 February 2022
(This article belongs to the Special Issue Water and Soil Resources Management in Agricultural Areas)

Abstract

:
Yellow River sediment is the potential resource for saline–sodic soil reclamation. Experiments of one-dimensional soil columns were conducted to investigate the upward and downward soil water transportation characteristics for saline–sodic soil mixed with different sediment addition (0, 10, 20 kg/m2 in the top 20 cm layer). The saturated hydraulic conductivity, ratio of macroporosity, cumulative capillary adsorption and infiltration rate all increased with the increase in sediment addition. No significant differences were detected for both the initial capillary rise rate and the initial infiltration rate for the upward and downward water transportation treatments, respectively. The average adsorption and infiltration rates showed an increasing trend with the increased sediment addition. The initial and average infiltration rates were higher than the initial capillary rise rate and average adsorption rates. The Philip model seems the optimal choice for the dynamic simulation of both upward and downward soil water transportation. The results may provide useful information for soil salinization amelioration.

1. Introduction

The Yellow River Delta is one of the three major estuary deltas in China, which plays an important role in the ecological environment construction and conservation [1,2,3]. The saline–sodic land in this region is about 2.36 × 10⁵ hm2, which accounts for more than 30% of the total delta region’s area [4]. In the delta region, the soils have high salinity (with an electrical conductivity more than 20 dS/m for saturated extract), with an average sodium adsorption ratio (SAR) of more than 30 (mmol/L)0.5 and an exchangeable sodium percentage (ESP) of more than 20%; moreover, a low ratio of precipitation (580 mm annual on average) to evaporation (1880 mm annual on average) as well as the shallow groundwater table (0.5–1.5 m deep) exacerbates salinization [5]. Indeed, soil permeability is seriously blocked due to the poor soil particle distribution [6]. It is necessary to take proper measures to improve and reduce the current saline–sodic soil for this region.
In order to prevent salt accumulation and increase desalinization, various materials are used for soil water and salt transportation management in saline–sodic soils [7,8,9]. Li et al. [10] found that in the semi-arid loess region of Northwest China, the use of a gravel-sand effectively reduced soil evaporation and runoff and highly improved soil infiltration and temperature. Sun et al. [11] found that the soil salinization slowed down as the capillary rise was cut off after a gravel sand layer was embedded in the soil in North China. In the Huang Huai Hai plain of China, Zhang et al. [12] found that punching sediment could increase the water infiltration rate of the saline–sodic soil. There are about 1.08 × 10⁹ tons of sediments per year transported from the Loess Plateau to the downstream delta by the Yellow River, and only 10–15% of the sediments are transported to the field by irrigation. Most sediments (mainly silt particles) are deposited on both sides of the riverbed, where ecological problems such as soil desertification and sandstorms often occur [13,14]. Because the sand particle content is relatively high and the available water is low for the sediment, how to deal with the accumulated sediments remains a serious problem [15,16,17]. Previous studies have shown that sediment addition can change both the soil particle composition ratio and soil texture, thus changing the water and salt transport pattern of saline–sodic soil [18,19]. On the other hand, sediment addition can enhance the soil aggregate structure and increase the soil water retention and storage capacity [20,21]. Therefore, sediment addition to the soil can not only increase the infiltration capacity of soil but can also increase the water content of soil below the sediment addition layer, which can effectively inhibit the evaporation of soil water and the accumulation of salt in the surface layer [22]. However, the improvement mechanism of sediment on saline–sodic soil and the dynamic characteristics of soil water and salt movement after sediment addition are not clear.
Modeling is widely accepted for its convenience and labor-saving. The accurate performance of the soil water transportation is of critical importance in hydrological modeling. Numerous water transportation models have been established in the past 100 years, such as the Green–Ampt, Kostiakov, Horton and Philip models [23,24,25,26,27], and they are tested and evaluated under various conditions [26,27]. However, most of the previous studies mainly paid attention to the influence of soil texture, vegetation cover and rainfall intensity and seldom considered the impacts of layered soil which were influenced by human activity or natural disturbance [27,28,29]. Finding the proper water transportation models for layered soil is critical for soil water management and saline–sodic soil amendment.
We hypothesized that after mixing saline–sodic soil with sediment, the soil pore distribution changes (because there are significant differences in the proportion of soil particles between the two materials) and affects the soil water and salt movement process. Based on the above analysis, the purpose of this study is to evaluate the effects of sediment addition on soil infiltration, the capillary rise process and the soil water and salt transport mechanism of saline–sodic soil. Moreover, the performance of three water transportation models (Kostiakov, Horton and Philip) will be evaluated with the addition of sediment. The results can provide a theoretical basis for the improvement of saline–sodic soil by sediment in the Yellow River Delta.

2. Materials and Methods

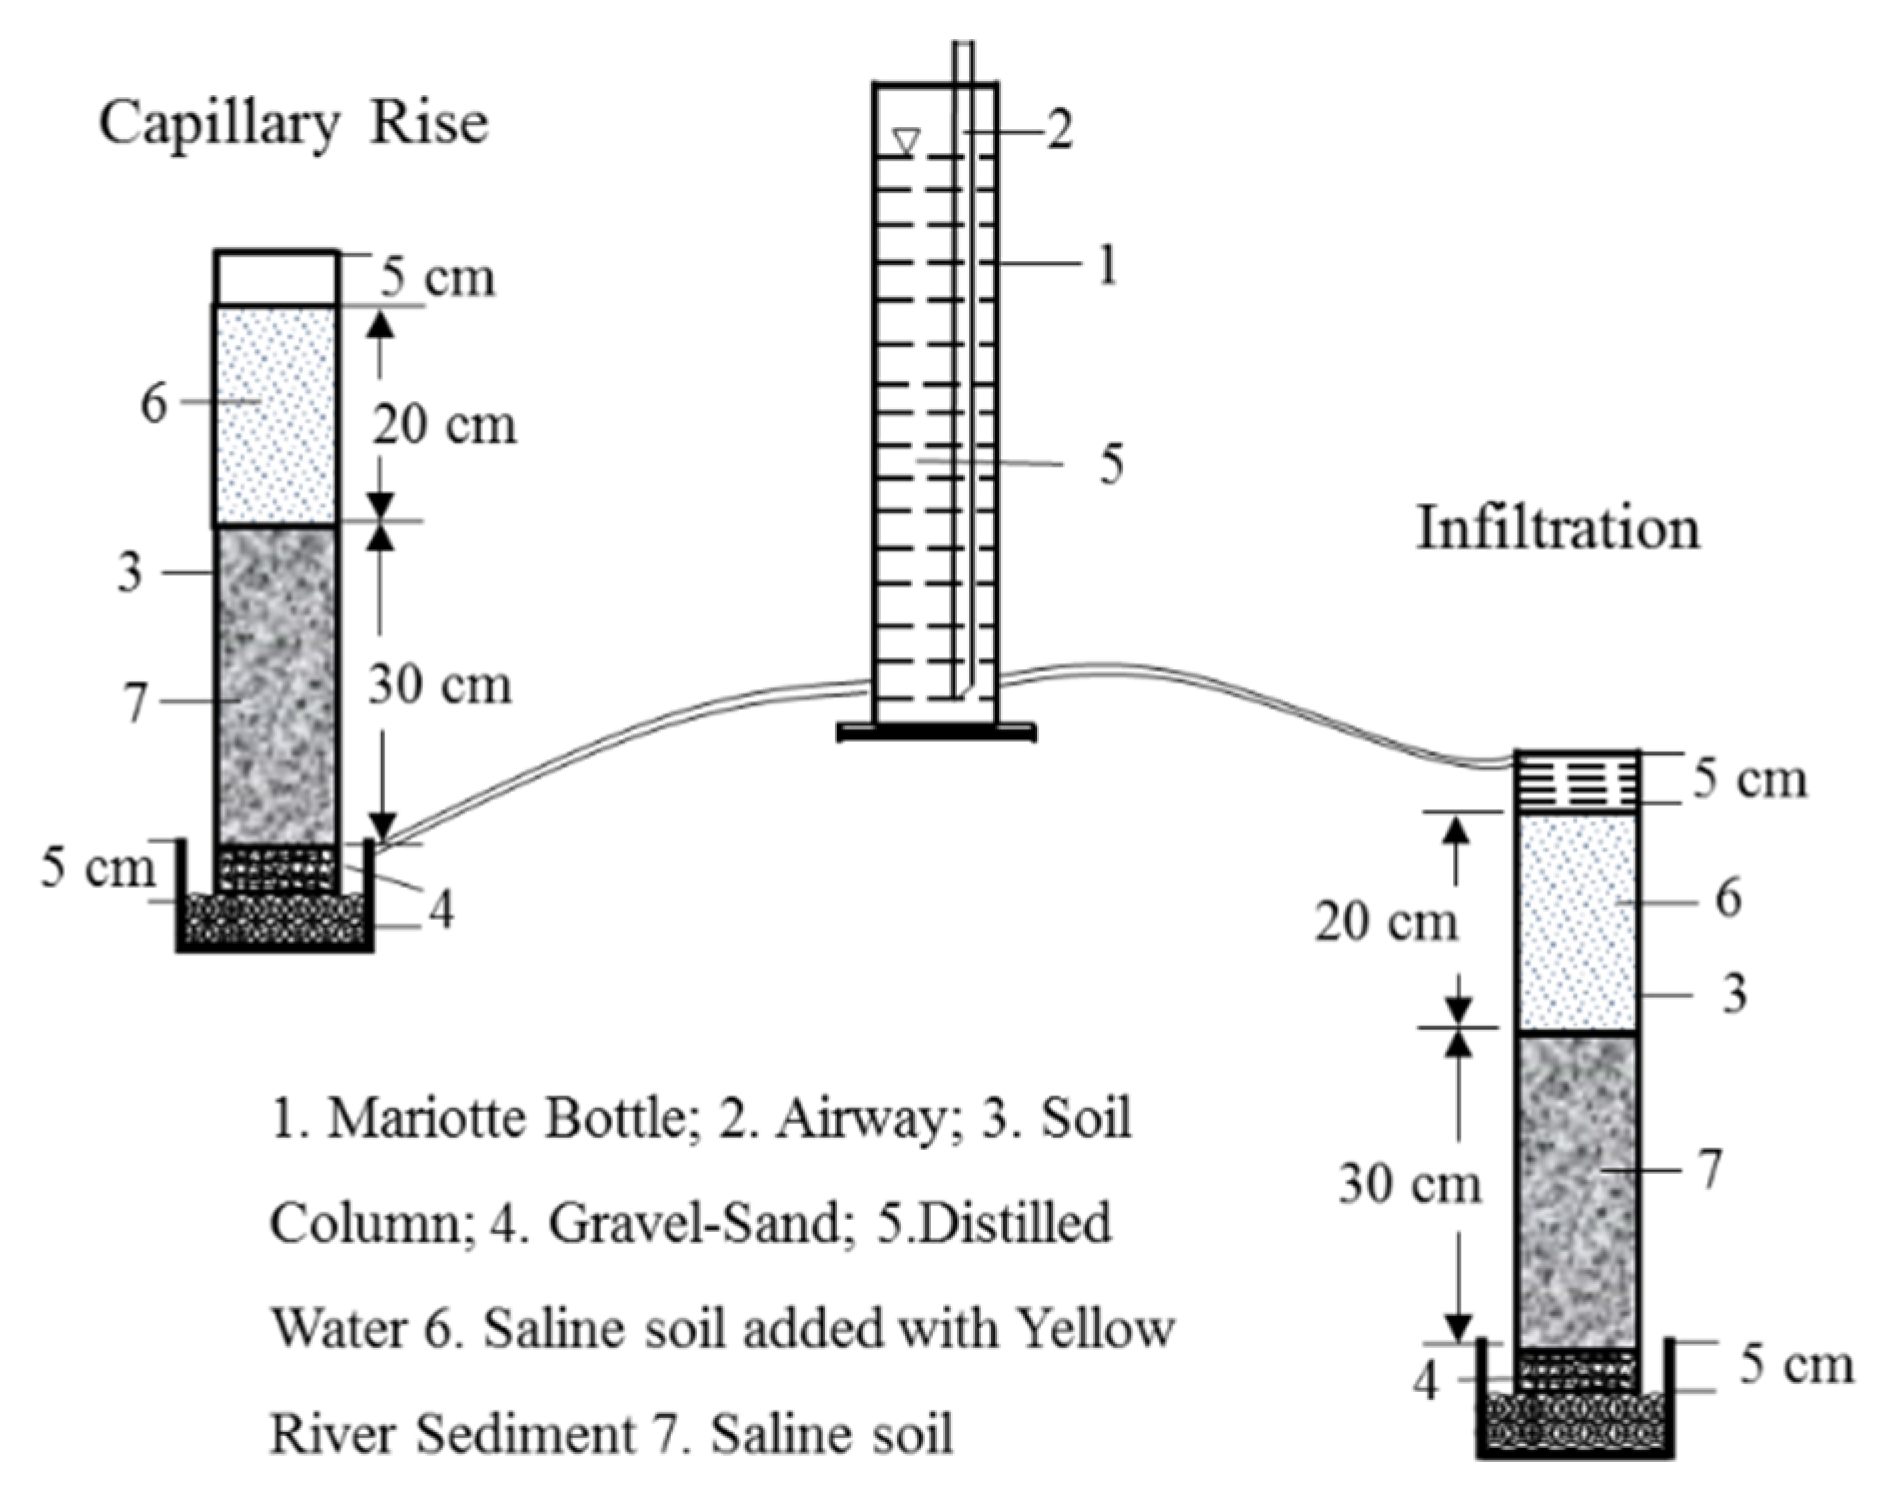
2.1. Experimental Design

The experiment was conducted in the Water Conservancy and Civil Engineering Center of Shandong Agricultural University from 2018-12 to 2019-03. The air temperature was 12–18 °C and the relative humidity was 17–50% during the experimental period. The soil samples were taken from Bin-Zhou City, Shandong Province (37°17′–38°03′ N, 117°42′–118°04′ E; 4 m above sea level), and the sediments were taken from the settling basin of Xiao Kai He irrigation district (serves as an ideal site for large-scale application of Yellow River sediment). According to our previous investigation, the saline–sodic soil has high clay content and low sand content with a soil salt content of 4.01 g/kg, and the soil texture is sandy clay, while the Yellow River sediment has low clay content and high sand content, and the soil texture of the sediment is loamy fine sand (Table 1). According to the conclusions of Mao et al. and Wang et al. [18,30], three sediment additions (0 kg/m2,10 kg/m2 and 20 kg/m2) were mixed with saline–sodic soil in the upper 0–20 cm layer with a bulk density of 1.35 g/cm3 to simulate the capillary water rise (upward) and soil water infiltration (downward) process. The experiment included 6 treatments, and each treatment was repeated 3 times. For the capillary water level rise (upward water) treatments, the sediment additions of 0 kg/m2,10 kg/m2 and 20 kg/m2 were named U0, U10 and U20, respectively. Correspondingly, the soil water infiltration (downward water) treatments were D0, D10 and D20, respectively. Therefore, both U10 and D10 and U20 and D20 have the same soil physical properties (Table 1).
Plexiglass tubes with uniform perforation at the bottom (aperture 1.5 mm) were prepared for the experiment, and the tubes were 14 cm in inner diameter and 60 cm in height with a thickness of 0.5 cm. A gravel-sand (2–3 mm in diameter) layer was placed at the bottom of the column, and filter paper was placed between the saline–sodic soil and the gravel-sand filter layer to prevent mixing. The gravel-sand was cleaned with diluted hydrochloric acid and distilled water before the experiment. The saline–sodic soil was filled in layers (5 cm at a time) to a height of 50 cm, and there was a 5 cm space reserved at the top of the plexiglass column (Figure 1). The soils and sediments were air-dried, crushed and passed through a 2 mm sieve before being statically compacted. The water head height is maintained at 5 cm for one-dimensional pounding infiltration, controlled by Mariotte bottle. The gravel-sand was immersed in the beaker to simulate the capillary rise of groundwater under natural conditions. The outlet of the Mariotte flask was consistent with the gravel-sand surface.

2.2. Simulation Models

The Kostiakov (Equation (1)), Philip (Equation (2)) and Horton (Equation (3)) models corresponding with time were selected to adjust the observed values [23,24,25,26]:
y = α k x α 1
y = a + 1 2 k x 0.5
y = b + c e β x
where y is the infiltration rate (mm/h) and x is the infiltration time (min); α, β, a, b, c and k are statistical parameters of the models and estimated by nonlinear regression using the least squares method.

2.3. Data Collection and Analysis

Saturated hydraulic conductivity for sediment additions of 0, 10 and 20 kg/m2 soil samples were measured with Ksat hydraulic conductivity equipment (Germany) based on the falling head method. Soil samples were prepared to the special ring knife (80 mm in inner diameter and 50 mm in height). The samples were saturated with water before measuring, Ksat can be calculated with the Darcy’ Law as water passes through the ring knife from the bottom to the top layer at a certain time. Soil porosity is important for water movement, and we regarded pore diameters of 0.2–1 μm, 1–30 μm and >30 μm as microporosity, mesoporosity and macroporosity, respectively, according Nimmo, Rabot et al. [31,32]. Equivalent pore diameter and its porosity ratio calculation can be referred to Equations (4) and (5):
d = 4 σ h
p = ν ω ν s × 100 %
where d represents diameter of permeable pore, μm; σ means surface tension of water, 75 × 10−5 N/cm; h means soil water potential, cm; p means soil porosity ratio, %; υw means soil water volume discharged above the corresponding soil water potential, cm3; υs means volume of soil sample, cm3.
For pore diameters of 0.2–1 μm, 1–30 μm and >30 μm, we simply set their equivalent pore diameters as 0.6 μm, 15.5 μm and 1015 μm, respectively. The soil water characteristic curve can be measured by the pressure-membrane method, and a 10 mm in height and 50 mm in diameter soil sample should be prepared before measuring. For both of the saturated hydraulic conductivity and water characteristic curve soil samples, three replications (with a dry density of 1.35 g/cm3) are needed to minimize the measurement error.
The depth of wetting front, amount of infiltration and recording time were recorded at 30 min intervals at the beginning, at increasing intervals as the experiment progressed and at approximately 24 h intervals at the end of the experiment. We ended the experiments as the wetting front moves to the top layer for the capillary rise process and to the bottom layer (above the gravel sand layer) for the infiltration process. A balance with an accuracy of ±0.01 g was used to measure the cumulative capillary adsorption amount during the capillary rise process. In order to understand the characteristics of capillary water rise in different periods, the capillary water rise height was arbitrarily divided into initial, steady, transition and sandy periods of capillary water rise, which indicated the 0–10 cm, 10–20 cm, 20–30 cm and 30–50 cm stages, respectively, from bottom to top. After the experiment ended, the soil moisture and electrical conductivity of the saturated extract (ECe) were measured by oven-drying method and conductivity method from 3 repeated soil samples with depths of 0–5, 5–10, 10–15, 15–20, 20–25, 25–30, 30–35, 35–40, 40–45 and 45–50 cm. The soil samples prepared for soil moisture and electrical conductivity were collected using a soil corer.
The coefficients of determination R2 were used to evaluate the regression goodness, and the calculation of R2 can be referred to Formulas (6)–(8):
R 2 = 1 S S r e s S S tot
S S tot = i = 1 n ( y i y ) 2
S S r e s = i = 1 n ( f i y ) 2
where SSres means residual sum of squares, SStot means total sum of squares, y means average value of yi and fi means error for yi. The coefficient of determination R2 is between 0 to 1, and the higher the value, the better the performance.
The statistical analyses were carried out by using SPSS (Ver. 16.0, SPSS Inc., Chicago, IL, USA). An analysis of variance (ANOVA) with least significant difference (LSD) (p < 0.05) was used to determine the differences between means. The distributions of soil water content, and ECe were analyzed by using Excel 2007.

3. Results and Discussion

3.1. Variation of Saturated Soil Hydraulic Conductivity and Porosity Ratio

As shown in Table 2, the saturated soil hydraulic conductivity of 10 kg/m2 (U10/D10) and 20 kg/m2 (U20/D20) sediment addition treatments increased significantly (p < 0.05), and were 3.28 and 12.06 times higher than that of 0 kg/m2 (U0/D0). For 10 kg/m2 (U10/D10) and 20 kg/m2 (U20/D20) treatments, the ratio of macroporosity increased by 19.85% and 63.45%, respectively, while the ratio of microporosity decreased by 24.91% and 60.32%, respectively. Therefore, it can be seen that sediment addition mainly increased the macroporosity ratio and decreased the microporosity ratio, and the increase in the macroporosity ratio could increase the saturated soil hydraulic conductivity to some extent [11,23].

3.2. Characteristics of Upward Water Transportation

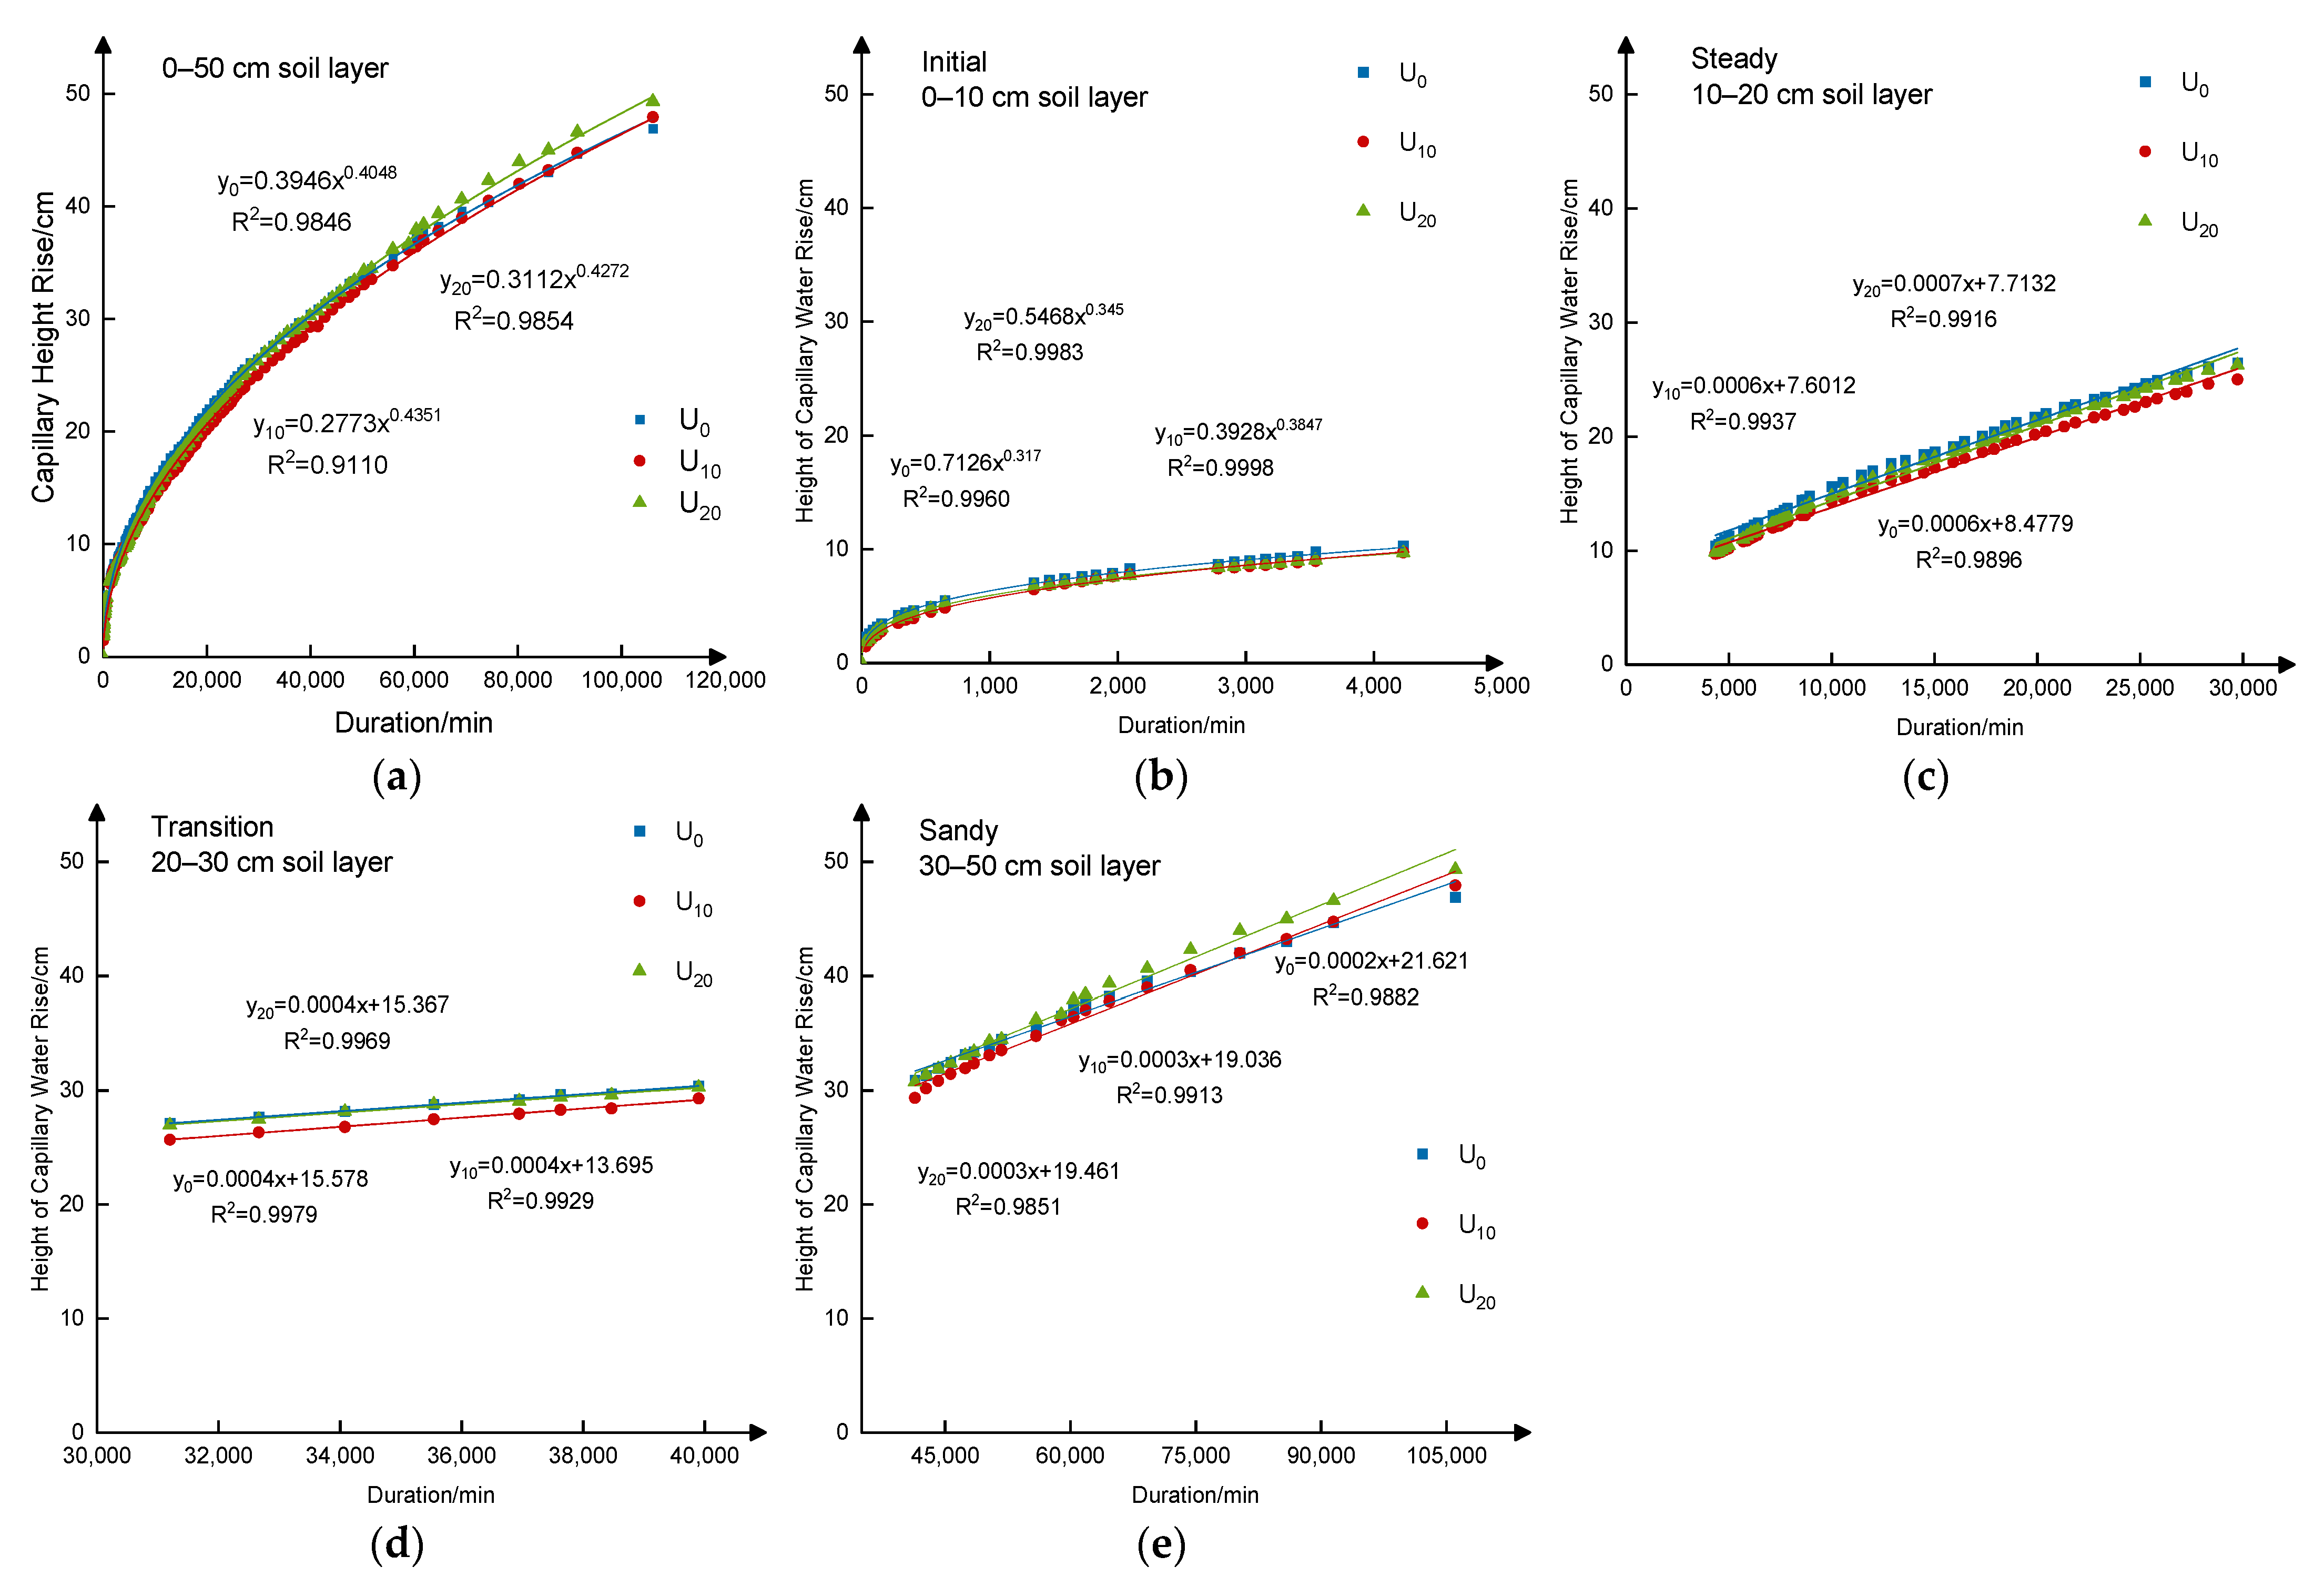
3.2.1. Variation of Capillary Water Rise Height

It showed that the height of capillary water rise increased with time in the 0–50 cm layer, and there was no significant difference among U0, U10 and U20 at the same time (Figure 2). In the 0–10 cm soil layer, the capillary water rise height over time followed the power relationship with the determination coefficients higher than 0.99 for U0, U10 and U20 (Figure 2b). In the 10–20 cm and 20–30 cm soil layers, the capillary rise height of U0, U10 and U20 showed a linear relationship with time, and the capillary water rise height of U0 was higher than that of U10 and U20 at the same time. For the 30–50 cm soil layer, the capillary water rise height varied with time and showed a linear relationship. The actual capillary water rise height is higher than the simulated height (Figure 2e), which can be attributed to the comprehensive impact of the soil particle composition structure and soil water gravity on the soil layer with the added sediment [33].

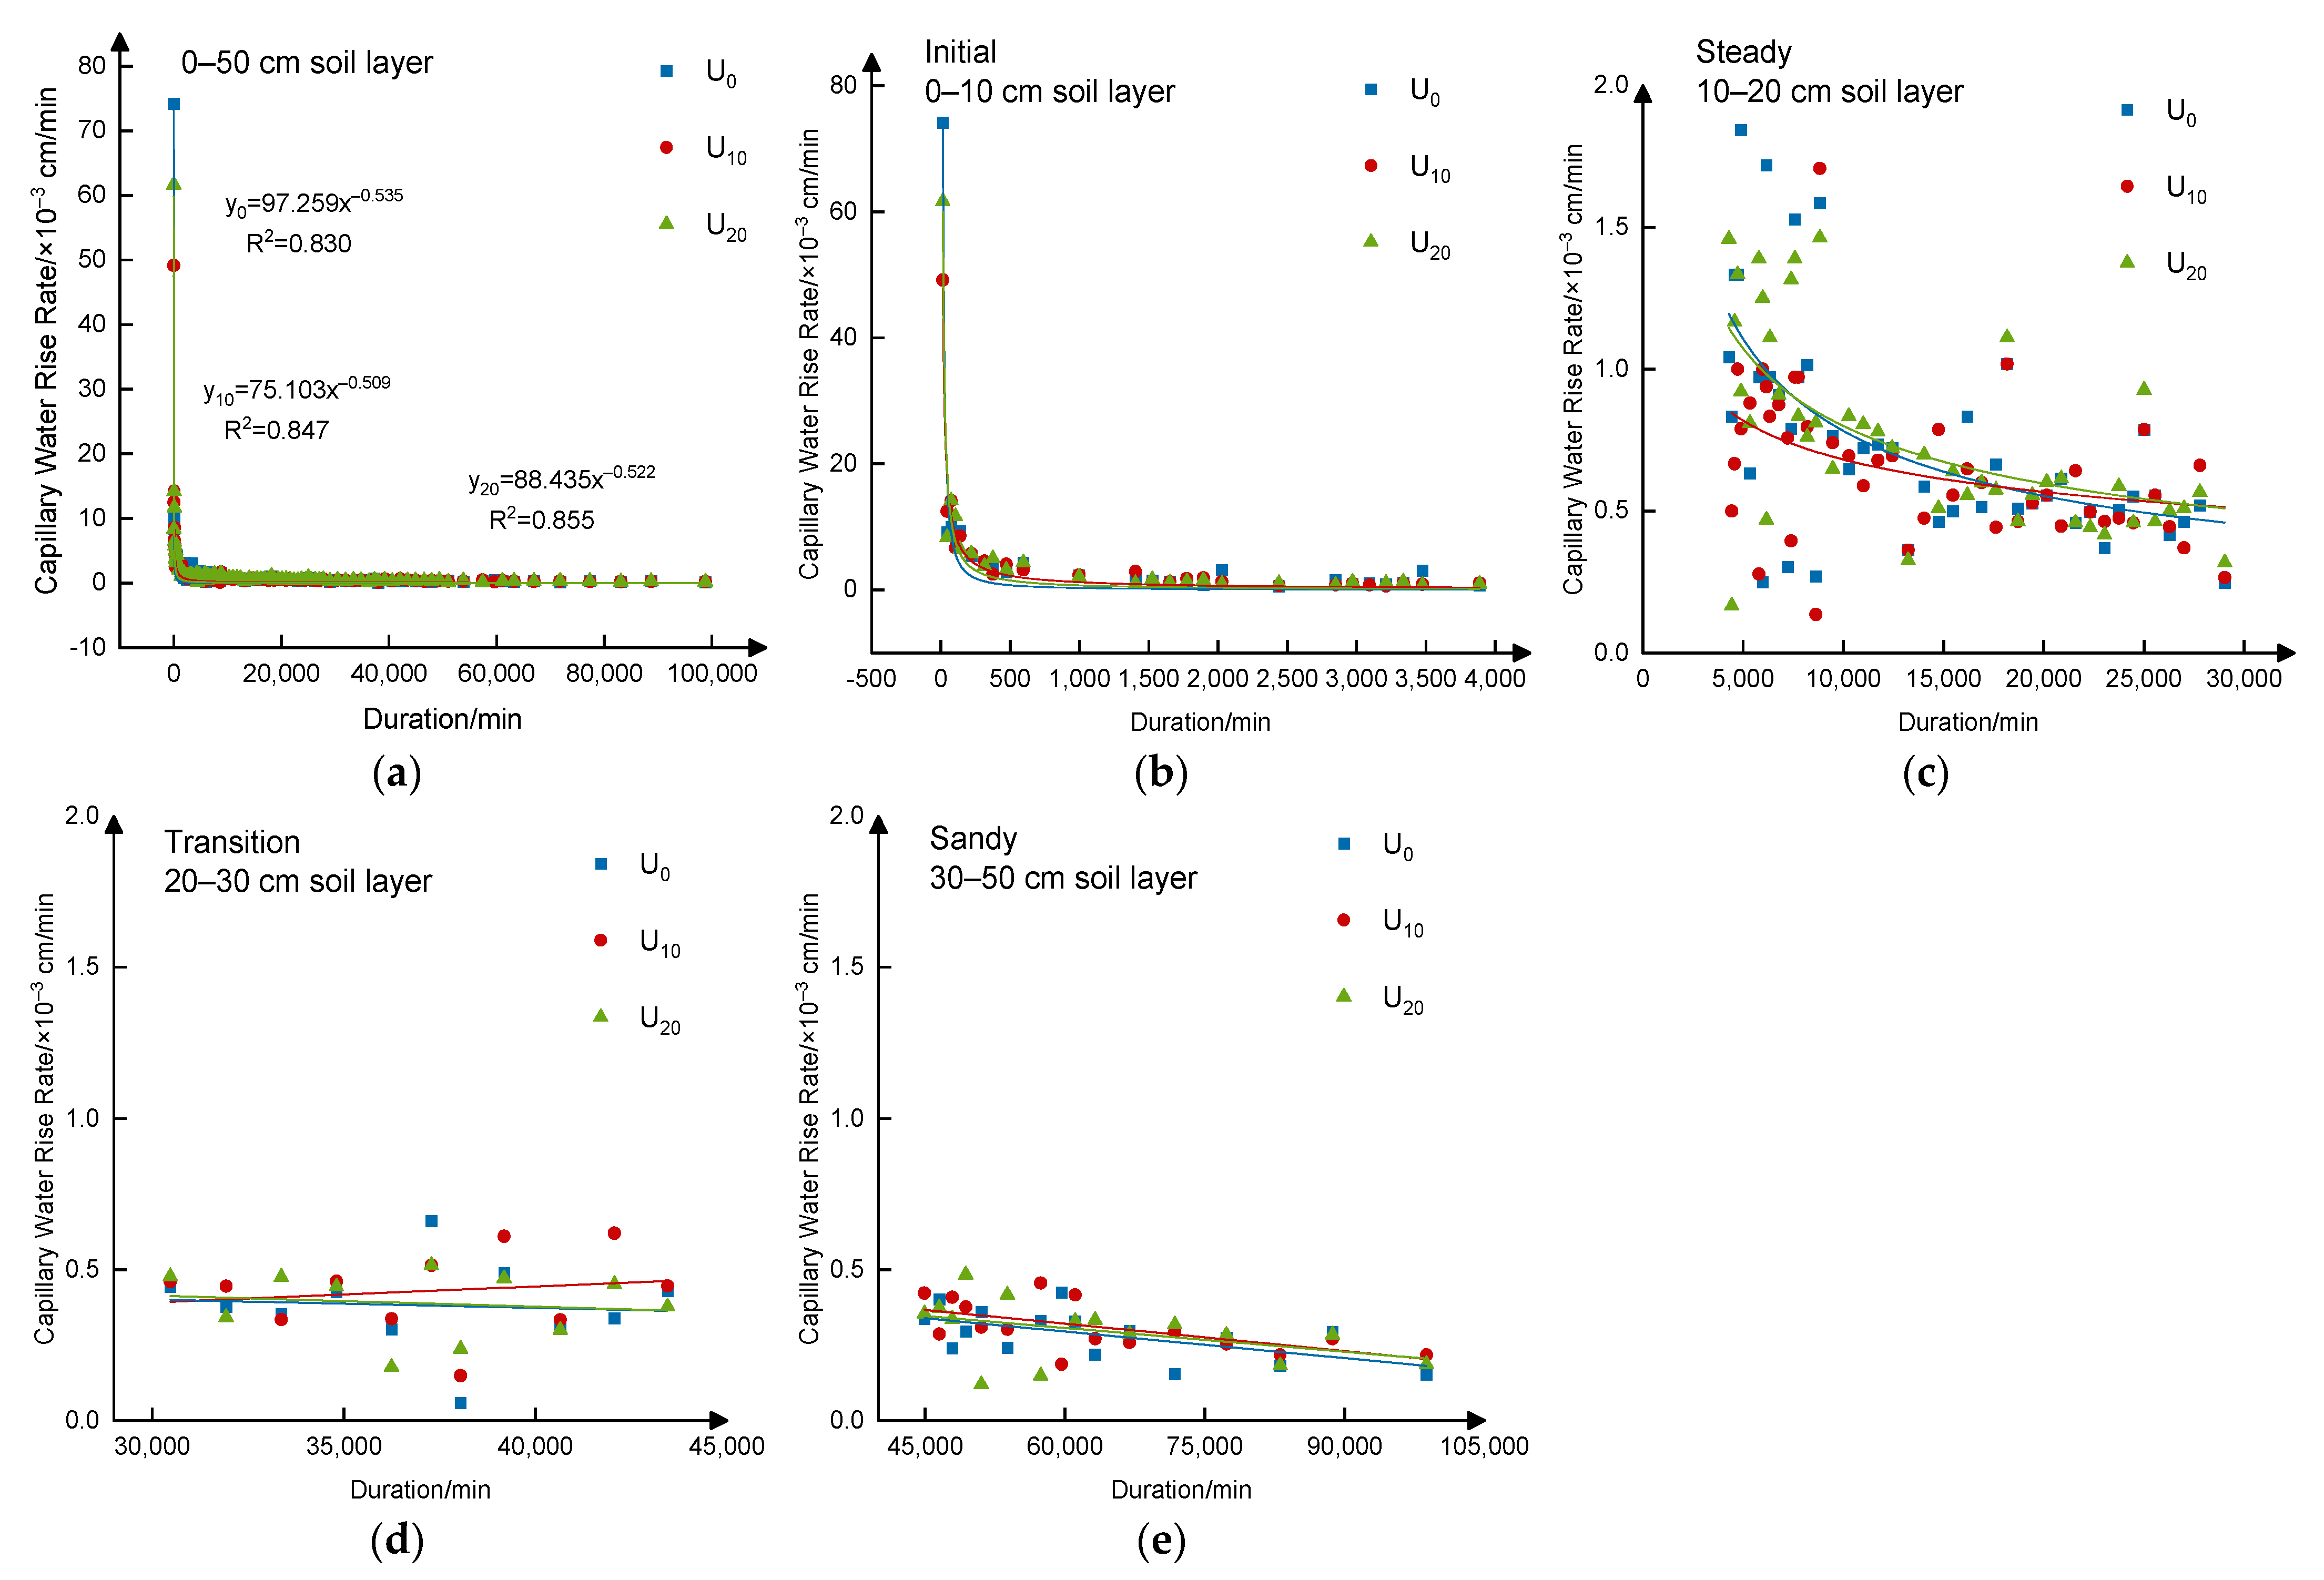
3.2.2. Variation of Capillary Rise Rate

The capillary rise rate decreased rapidly in the 0–400 min period, and the capillary rise rate fluctuated within 0.1–0.5 × 10⁻³ cm/min for U0, U10 and U20 (Figure 3) during the sandy period. The capillary rise rates were 74.17 × 10⁻³ cm/min, 49.17 × 10⁻³ cm/min and 61.67 × 10⁻³ cm/min at the beginning and were 1.8947 × 10⁻³ cm/min, 1.5762 × 10⁻³ cm/min and 1.7504 × 10⁻³ cm/min on average during the whole experimental period for U0, U10 and U20, respectively (Figure 3). The capillary rise rates for the beginning and the average of the three treatments were not significantly different (p < 0.05, Figure 3). In the 0–10 cm layer, the capillary rise rate treated by U0, U10 and U20 showed a power relationship with time, and the determination coefficients were more than 0.9. The capillary rise rate of U0 and U20 were 24.61% and 11.24% higher than those of U10 in 0–10 cm layers, and were 18.72% and 18.87% higher than those of the U10 in 10–20 cm layers, while the capillary rise rate of U10 and U20 were higher than those of U0 in both the 20–30 cm and the 30–50 cm layers (Table 3). According to the relationship between the capillary rise height and soil porosity [34], it can be seen that the sediment addition to saline–sodic soil will affect the capillary rise rate to a certain extent.

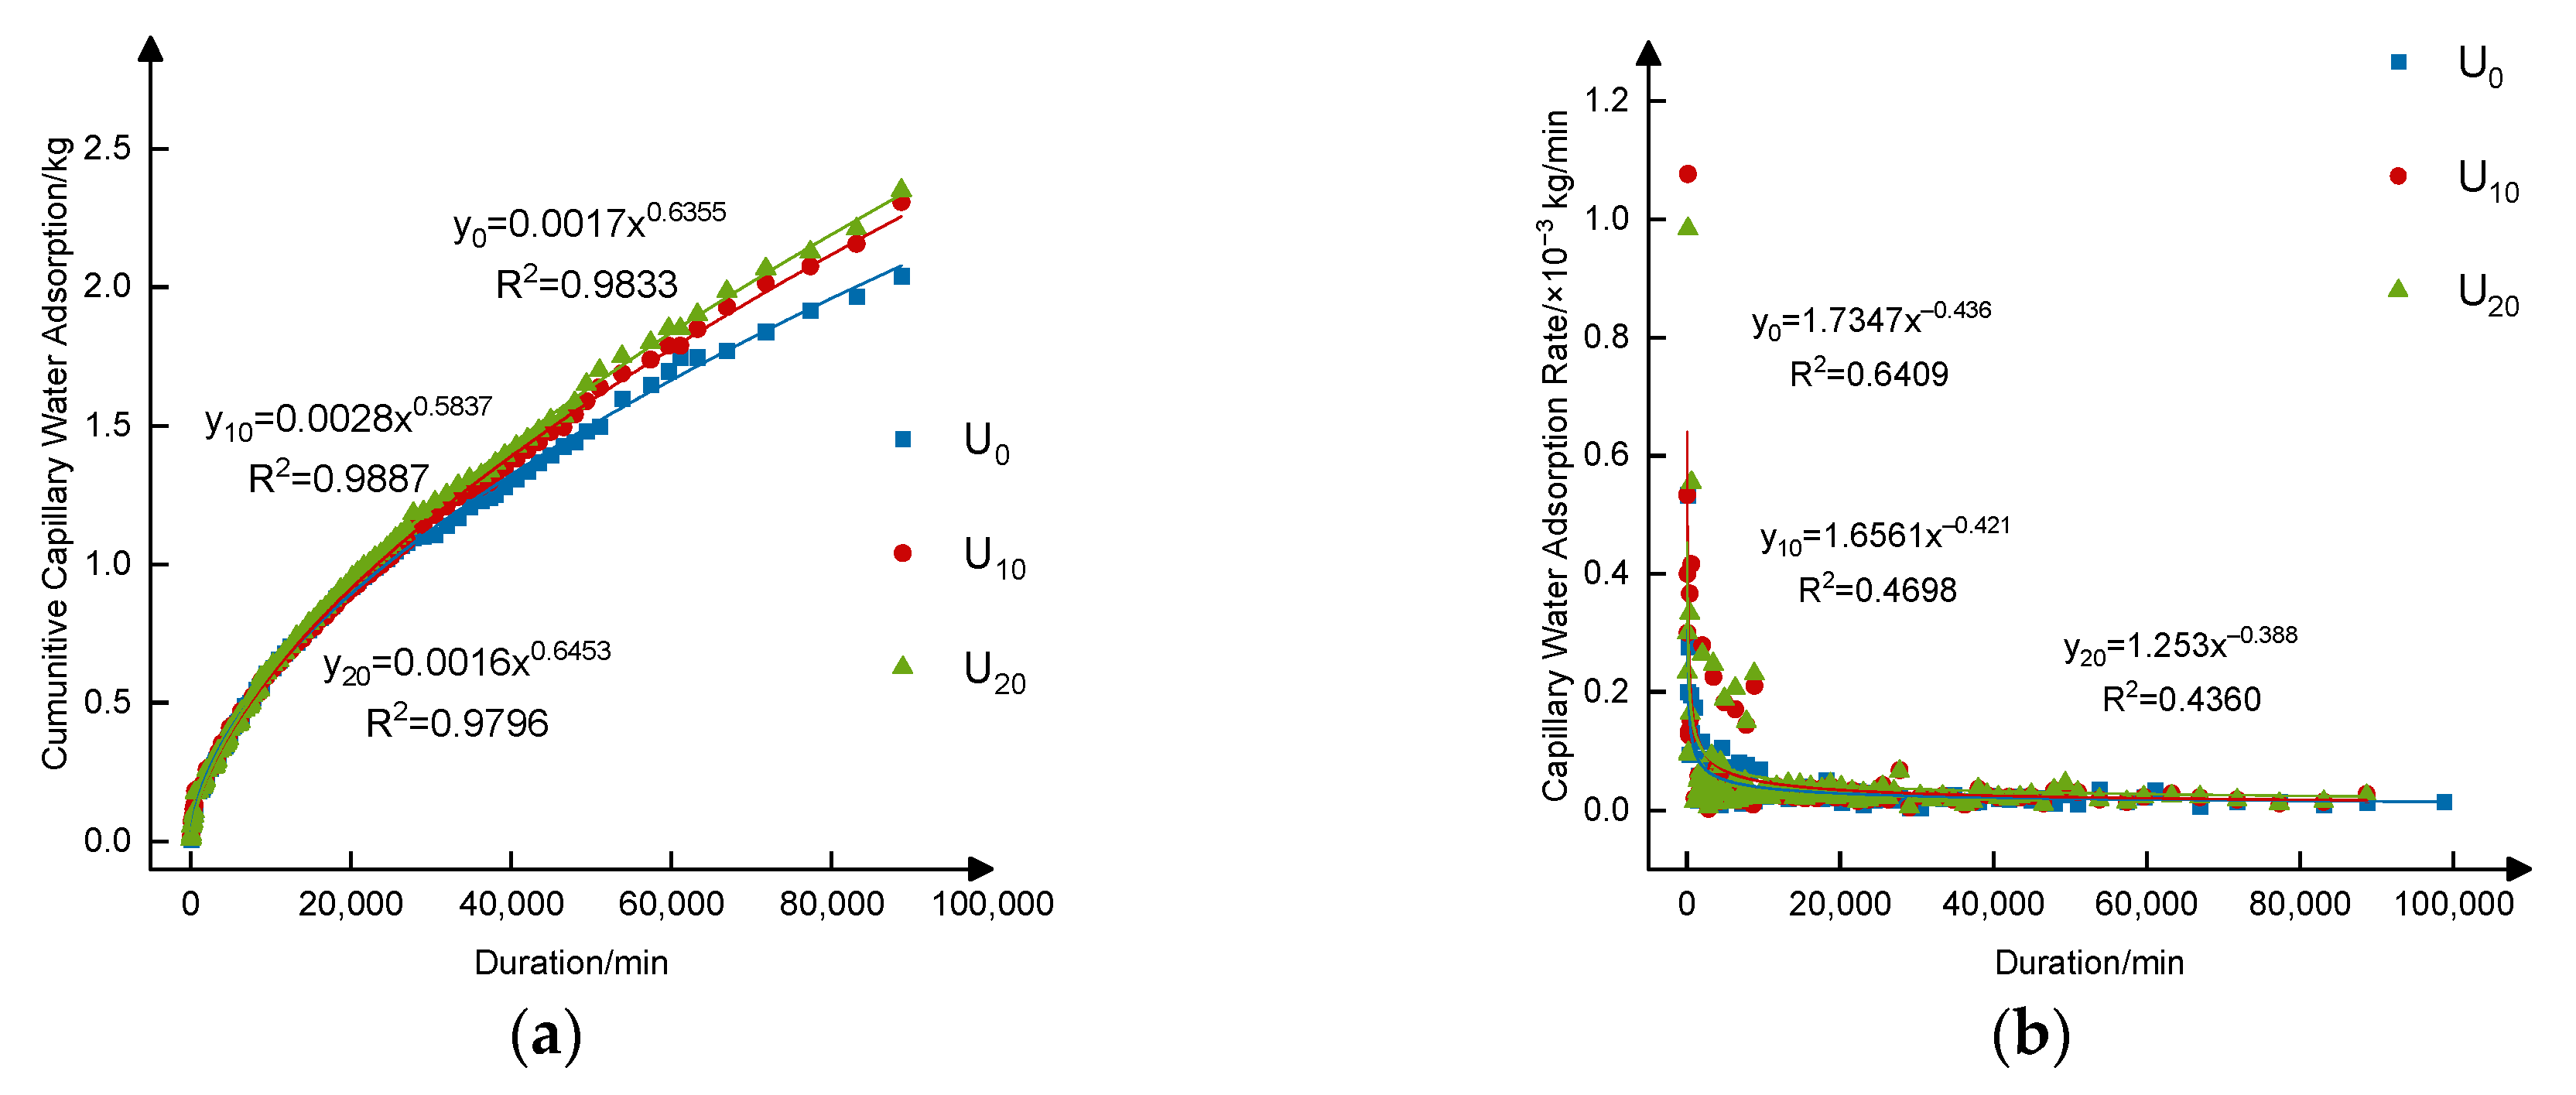
3.2.3. Variation of Soil Water Adsorption

Similar to the variation of the capillary rise height with time, the cumulative capillary soil water adsorption with time also presents power relationship for U0, U10 and U20 (Figure 4a). Compared with U0, the cumulative capillary soil water adsorption of U10 and U20 increased by 9.06% and 3.80% for the initial period, increased by 8.91% and 6.65% for the steady period, increased by 16.88% and 23.88% for the transition period and increased by 17.48% and 25.62% for the sandy period (Table 3). The results showed that the mixed sediment layer not only increased the adsorption capacity of the mixed layer to soil water but also had a positive impact on its adjacent layers, and similar results can also be seen in Song et al.’s investigation [35].
During the capillary rise period, the soil adsorption rate showed a power formula with time for the upward water treatments (U0, U10, U20). The capillary soil water adsorption rate of each treatment decreases sharply and then tends to be stable (Figure 4b). The capillary soil water adsorption rates of U0, U10 and U20 were 0.200 × 10⁻³ kg/min, 0.533 × 10⁻³ kg/min and 0.233 × 10⁻³ kg/min at the beginning. The capillary soil water adsorption rate varies between 0 and 0.05 ×10⁻³ kg/min with a small fluctuation amplitude during the final period. The average capillary soil water adsorption rate showed a gradual decrease for U0, U10 and U20 in the initial, steady, transition and sandy periods, and the average capillary soil water adsorption rate of U10 and U20 was higher than that of U0 during the whole experimental period (Table 3), which is similar to previous studies [12,13].

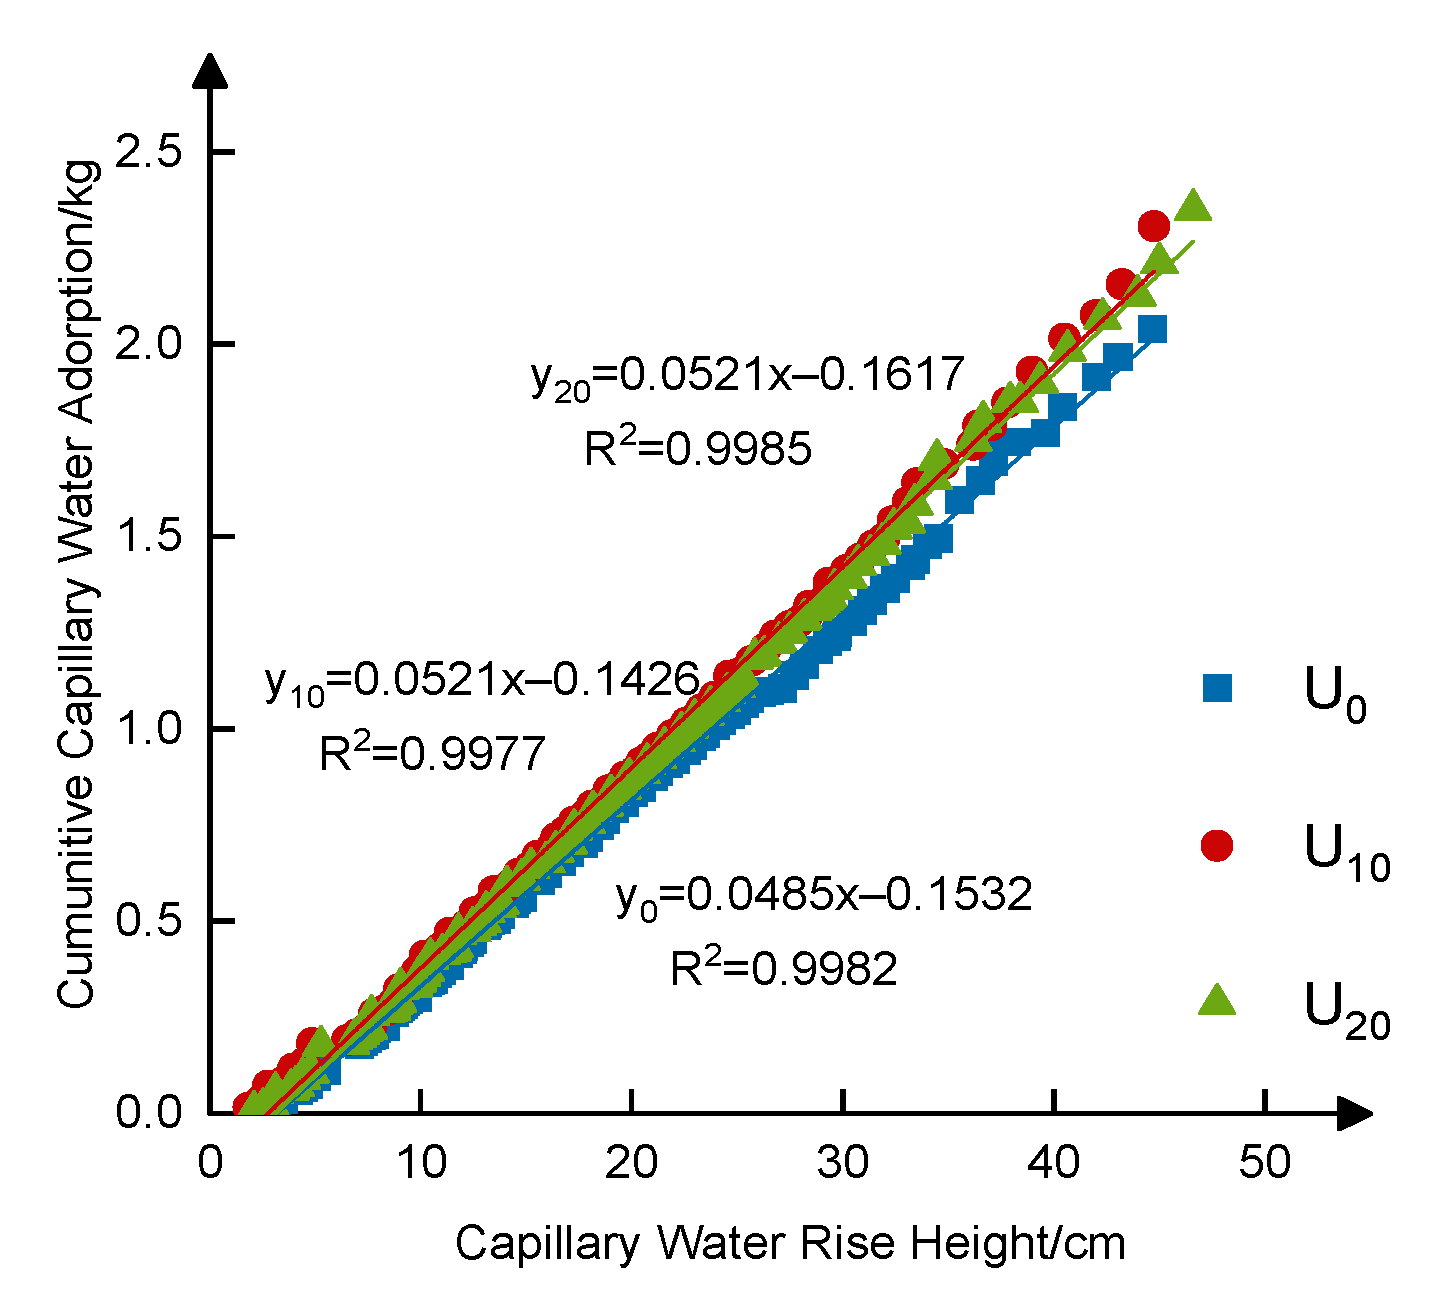
3.2.4. Relationship between Capillary Rise Height and Cumulative Soil Water Adsorption Amount

The fitting results showed that there was a linear correlation (R2 > 0.99) between the capillary rise height and soil water adsorption (Figure 5). The slope of the fitting equations of U10 and U20 were slightly higher than that of U0, which indicated that saline–sodic soil mixed with sediment could increase soil water adsorption and improve the soil water holding capacity under the same conditions of capillary rise. Similar conclusions can also be seen from Ma et al. [3] and Philip [27].

3.3. Characteristics of Downward Soil Water Transportation

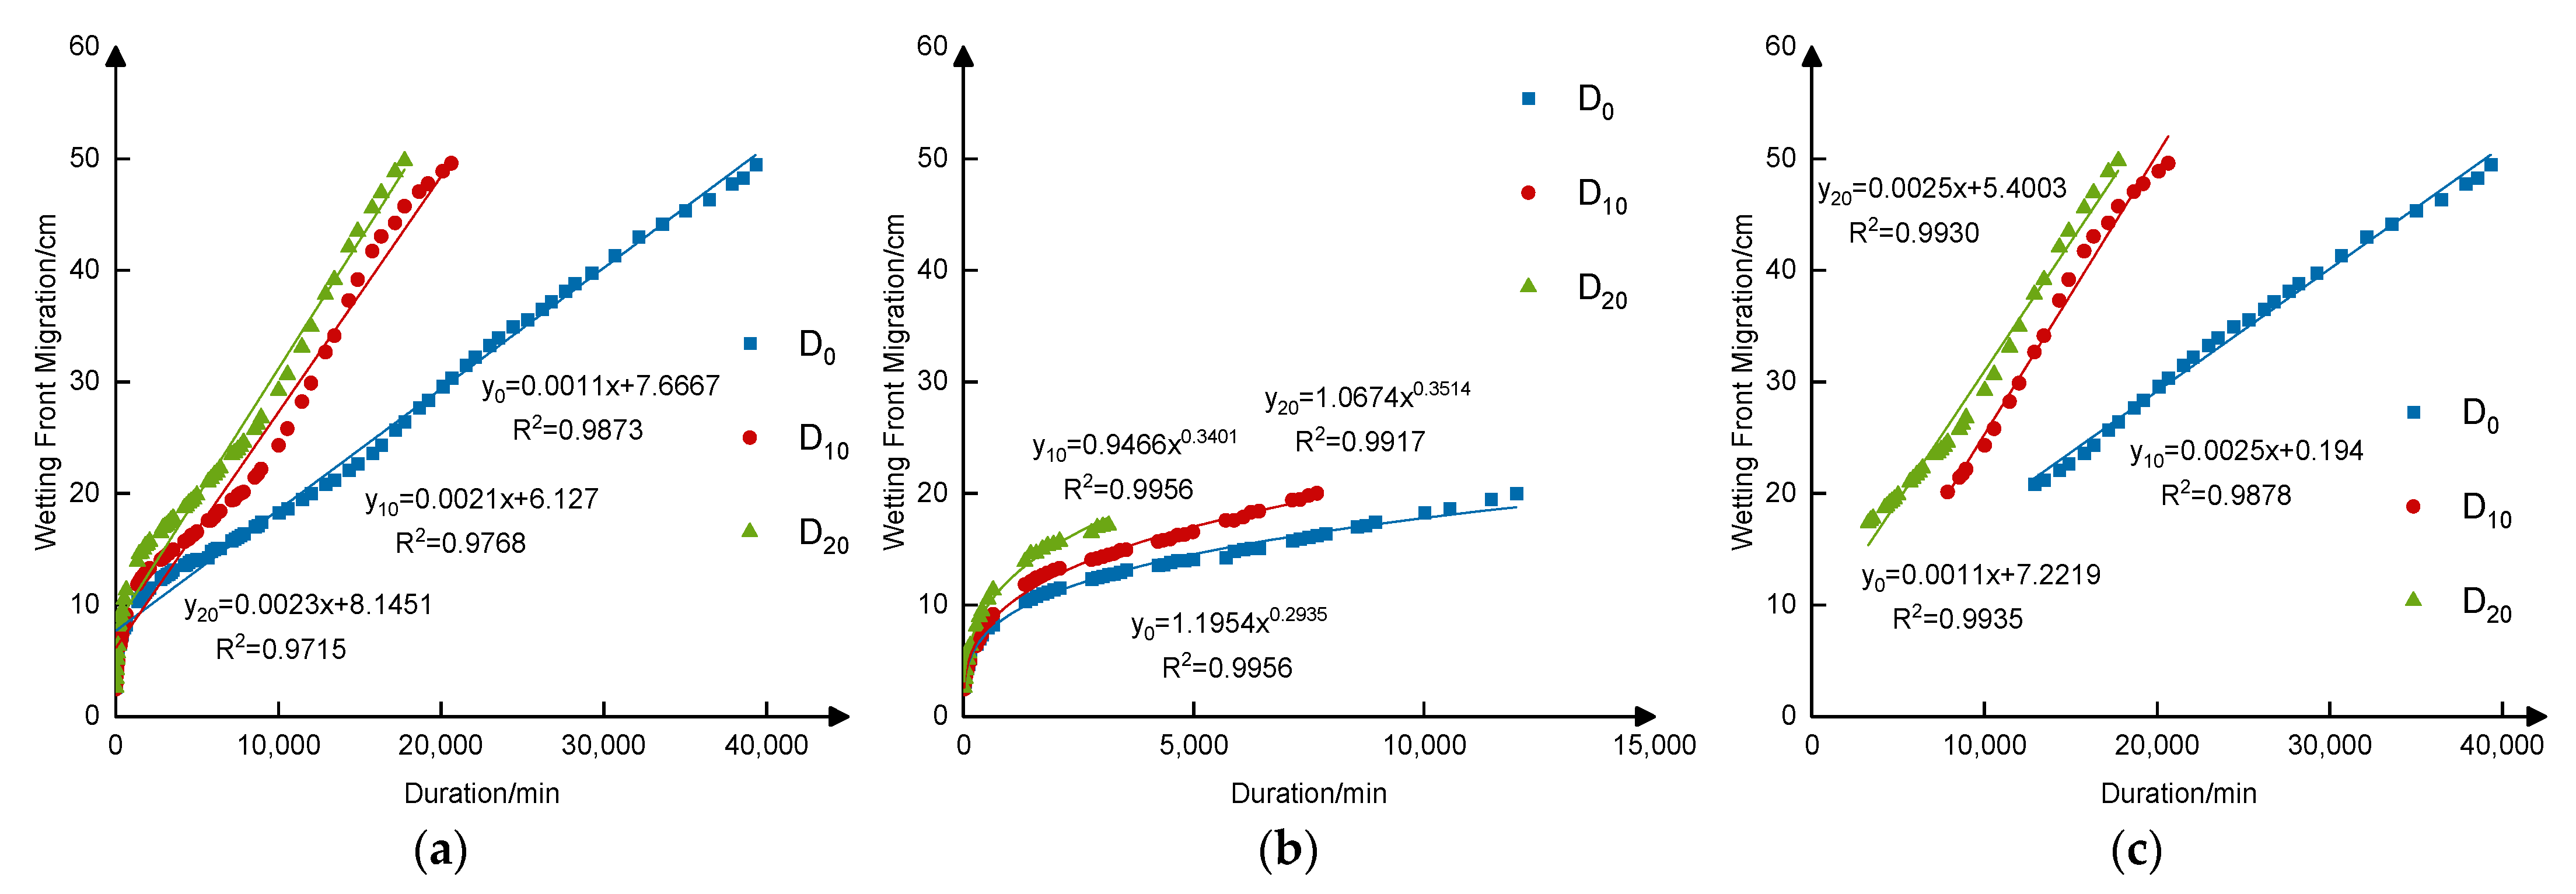
3.3.1. Wetting Front Migration

In the 0–50 cm soil layer, the wetting front migration is positively correlated with time. The determination coefficients (R2) of D0, D10 and D20 are greater than 0.97, and the slopes of D10 and D20 are greater than that of D0, which indicates that the infiltration rate of D10 and D20 is high (Figure 6a). This can be attributed to the ratio of the macroporosity increase with the addition of sediment. However, in the 0–20 cm soil layer, the infiltration wetting front showed an exponential relationship with time, and the determination coefficients were all above 0.99 for D0, D10 and D20 (Figure 6b). Furthermore, a positive correlation was shown in the 20–50 cm layer with the determination coefficients of 0.993, 0.9878 and 0.9935 for D0, D10 and D20, respectively (Figure 6c). The simulation of piecewise functions is better than full-time simulation, which is similar to Mathur et al. [21] and Gan et al. [36]. The difference of the fitting curve among the D0, D10 and D20 treatments at different soil layers can mainly be attributed to the air resistance as poor ventilation inside the soil [30].
Under the condition of constant head infiltration, it takes 12,000 min, 7675 min and 4985 min to migrate from the surface to 20 cm depth for D0, D10 and D20, respectively (Figure 6b). The time required for D0 was approximately 1.56 and 2.41 times higher than that of D10 and D20, respectively. Moreover, it takes 27,331 min, 12,960 min and 12,770 min for the wetting front to move from the 20 cm to 50 cm depth for D0, D10 and D20, respectively (Figure 6c). These results indicate that sediment addition to the saline–sodic soil not only improved the wetting front migration rate in the mixed layers but also improved the migration rate of the wetting front in unmixed soil layer, which is similar to Song et al. [35] and Mathur et al. [21].

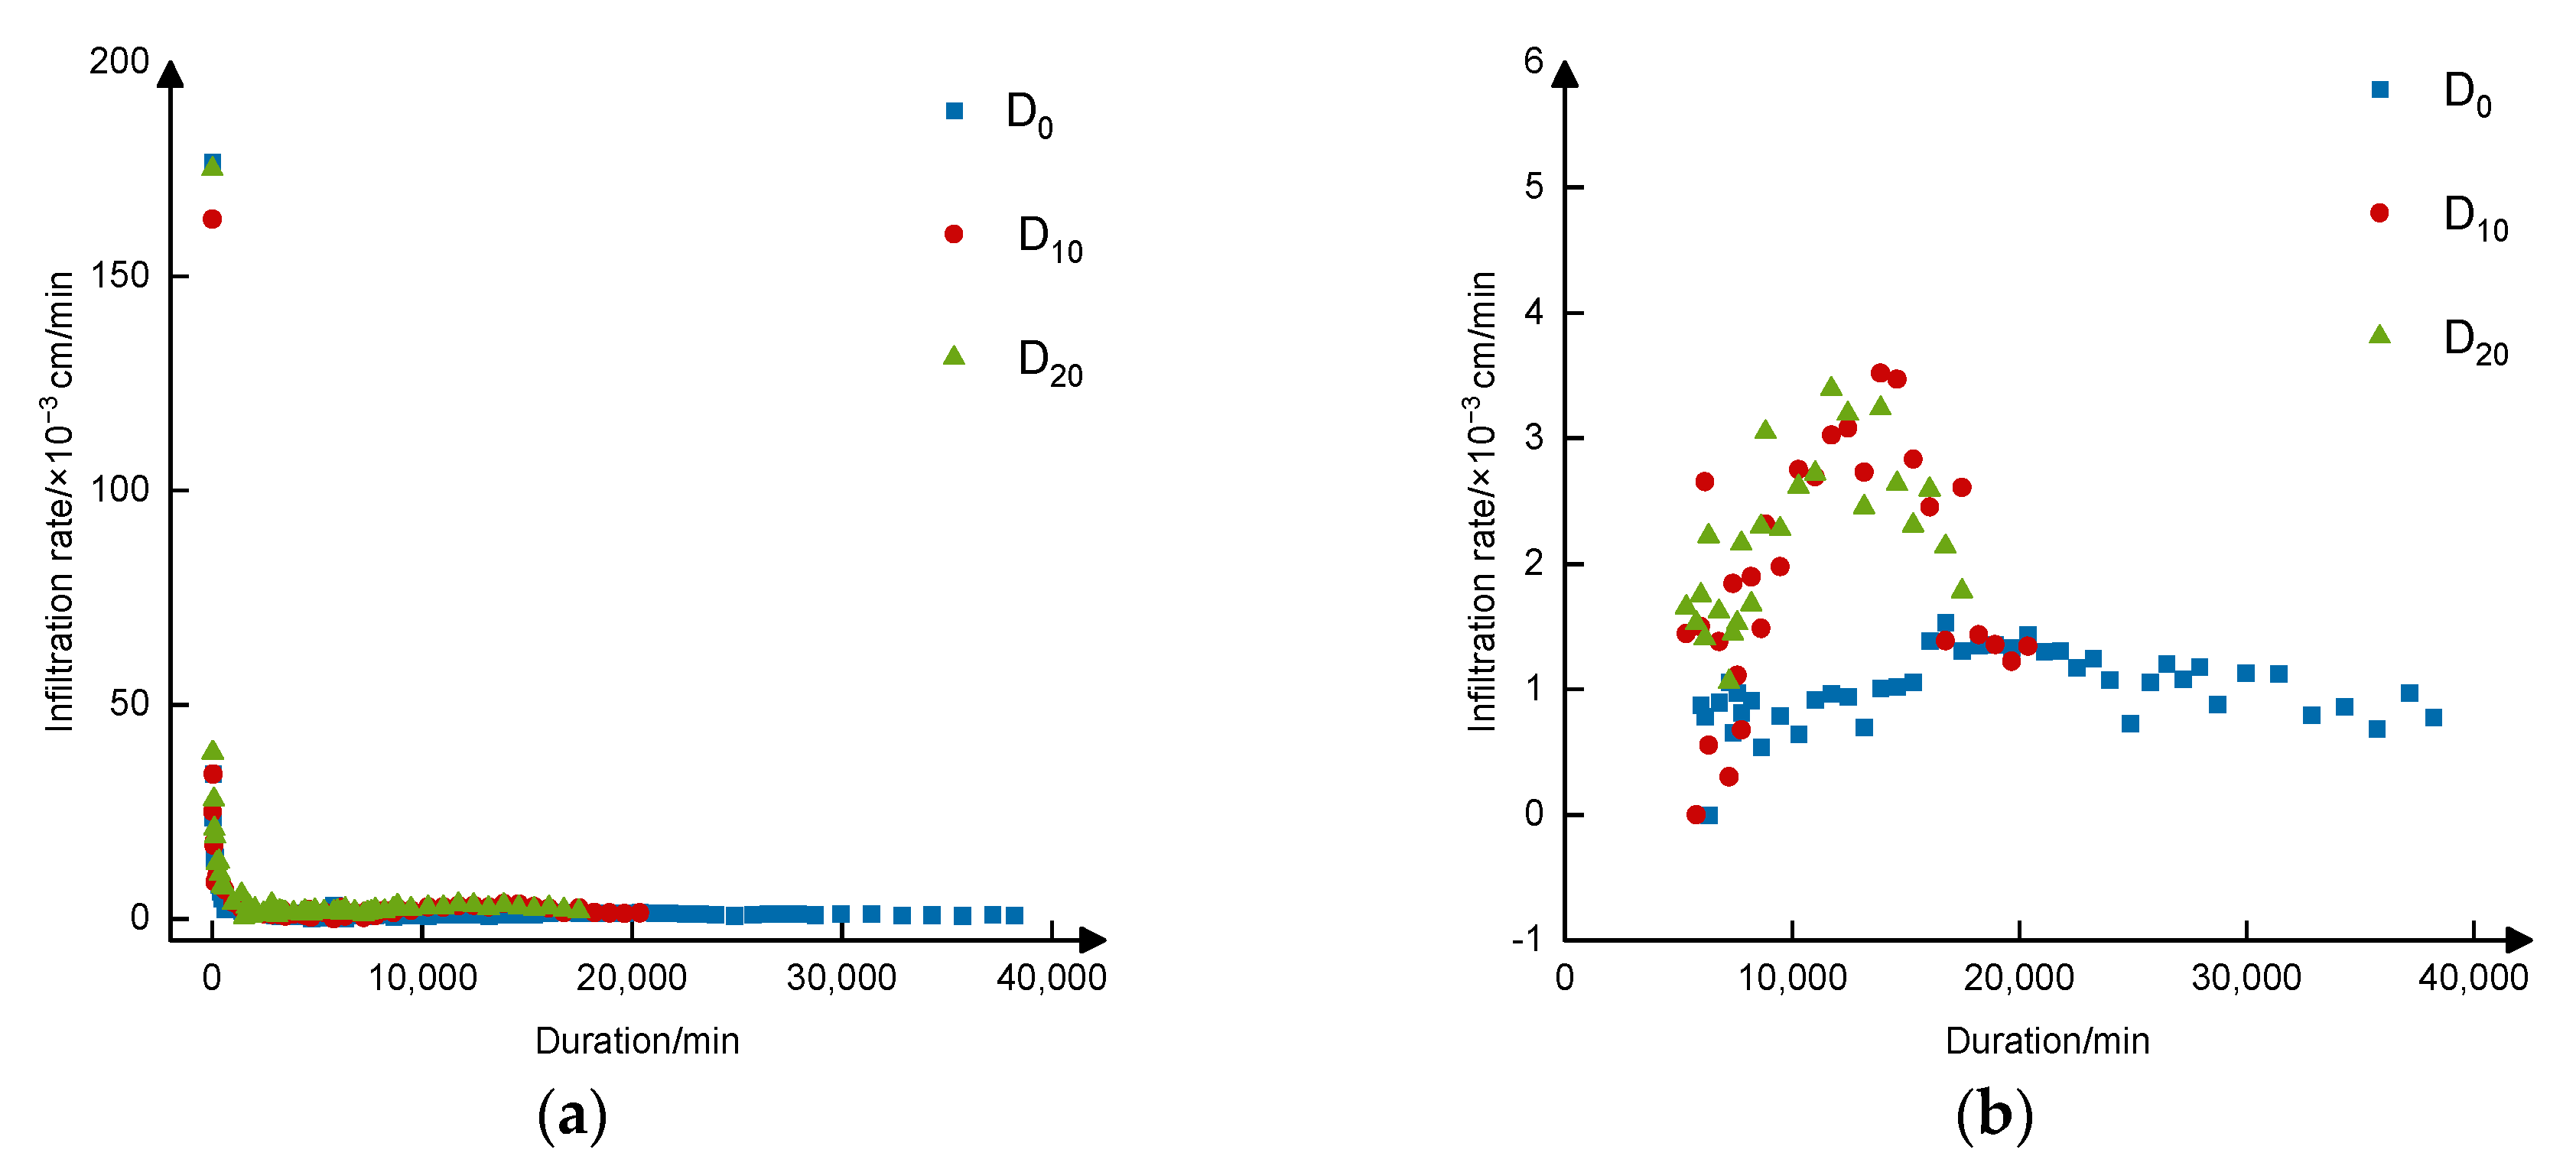
3.3.2. Soil Water Infiltration Rate

In the 0–20 cm layer, the infiltration rates of D0, D10 and D20 were rapidly reduced from 176.67 × 10⁻³ cm/min, 163.3 × 10⁻³ cm/min and 175.0 × 10⁻³ cm/min at the beginning to 0.963 × 10⁻³ cm/min, 1.111 × 10⁻³ cm/min and 1.974 × 10⁻³ cm/min at the end, which were reduced by 183.46, 147.01 and 88.65 times, respectively (Figure 7a). The average infiltration rates of the 0–20 cm layer for D0, D10 and D20 were 7.834 × 10⁻³ cm/min, 8.733 × 10⁻³ cm/min and 13.254 × 10⁻³ cm/min, respectively. The infiltration rate of the three treatments initially increased and then decreased with time in the 20–50 cm layer (Figure 7b), and D10 and D20 both reached a maximum infiltration rate at 13,887 min (corresponding to infiltration depths of 37.5 cm and 42.5 cm, respectively), while D0 reached a maximum infiltration rate at 20,000 min (corresponding to an infiltration depth of 25.6 cm). During the water infiltration progress, the average infiltration rate of D0 was significantly lower than those of D10 and D20 in the 20–50 cm layer (which were 1.10 × 10⁻³ cm/min, 2.16 × 10⁻³ cm/min and 2.19 × 10⁻³ cm/min for D0, D10 and D20, respectively). In the 0–50 cm layer, the average infiltration rates for D0, D10 and D20 were 4.936 × 10⁻³ cm/min, 6.560 × 10⁻³ cm/min and 8.315 × 10⁻³ cm/min, respectively.
Considering the effect of capillary water gravity, the soil infiltration rates of D0, D10 and D20 showed significant differences (p < 0.05). The infiltration rate of D0, D10 and D20 increased first and then decreased, and the infiltration rates of D10 and D20 were significantly higher than D0 (Figure 7b). This can be explained by the theory of soil liquid and air exchange during the infiltration process: soil air gradually migrates to the bottom and is replaced by water [37]. Moreover, this phenomenon may also be related to the water conductivity and air conduction performance of the bottom filter layer (thickness, filter gradation) [38,39].

3.4. Comparison of Downward and Upward Soil Water Movement

3.4.1. Duration Time

For the process of water capillary rise and infiltration, the initial capillary water absorption/infiltration rate of soil is much higher than that in the steady state, which is due to the low soil water content and high soil water absorption in the initial state [40,41]. The water conveyance time to pass through the 50 cm height soil column for U0, U10 and U20 is 2.5, 4.9 and 5.7 times higher than that of D0, D10 and D20, respectively, which can be attributed to the water gravity resistance in the process of capillary water rise. Moreover, we can also see that the effect of sediment addition on water infiltration is more obvious than that of capillary rise, and the greater the sediment addition, the shorter the infiltration time. This is because with the sediment addition, both the soil-saturated hydraulic conductivity and macroporosity are increased (Table 2).

3.4.2. Soil Water and Salt Distribution

The distribution of soil water and salt after the capillary rise/infiltration process are shown in Figure 8. It can be seen that the soil moisture of D0, D10 and D20 decreases from the surface to the bottom layer (Figure 8a), while the soil ECe increases with the increase in soil depth (Figure 8b). The distribution results of soil moisture and ECe in U0, U10 and U20 were opposite with those of D0, D10 and D20 (Figure 8). The soil water moisture distribution of capillary rise and infiltration was symmetrically distributed at x = 32% m/m, and the soil ECe was symmetrically distributed with y = 25 cm. However, the distributions of both the soil moisture and ECe for water capillary rise and infiltration process are not strictly symmetrical. In the 0–50 cm soil layer, the average soil moisture of downward treatments (D0, D10, D20) is 17.81% higher, and the average ECe is 31.47% lower than that of the upward treatments (U0, U10, U20), mainly because the duration time for the upward water treatments (U0, U10, U20) is relatively long and the cumulative evaporation amount is relatively high compared with the downward treatments (D0, D10, D20).

3.5. Modeling of Soil Water Infiltration and Capillary Water Rise

The wetting font migration rate for soil water infiltration and capillary water rise were simulated with the Kostiakov, Philip, and Horton models, and the results are shown in Table 4. We can see that the Philip model performs the best among the three models in fitting both the upward and downward water process of saline–sodic soil, with the R2 all above 0.74, while the average R2 of the Horton model was the lowest among the three models, indicating that the Philip model can simulate both upward and downward water migration processes. Moreover, we can also see that the Kostiakov model performs better in the upward treatments (U0, U10 and U20) than the downward treatments (D0, D10 and D20), which is mainly because of the air resistance and the complicated pore distribution structure [37,39].

4. Conclusions

The results showed that with the increase in sediment addition, both the macroporosity ratio and saturated soil hydraulic conductivity of the mixed soil increased. The addition of sediment significantly increased the soil water wetting front migration rate and promoted the soil water adsorption amount. A liner relationship was established between the capillary rise height and soil cumulative water absorption amount. The Philip model is more suitable for both modelling the capillary water rise and soil water infiltration process. Considering the water and salt distribution after the infiltration/capillary rise process, the 20 kg/m2 sediment addition seems to be more helpful to promote salt leaching or prevent salt accumulation. As the dynamics of soil water and salt movement are influenced by various factors, further study needs to be conducted.

Author Contributions

Conceptualization, C.S. and M.Z.; methodology, C.S. and P.Z.; validation, D.F. and C.Y.; formal analysis, X.H. and X.S.; investigation, J.S.; resources, H.H. and J.S.; data curation, W.M.; writing—original draft preparation, C.S. and M.Z.; writing—review and editing, C.S. and P.Z.; visualization, C.Y.; supervision, J.S.; project administration, C.S., M.Z. and P.Z.; funding acquisition, C.S. and M.Z. All authors have read and agreed to the published version of the manuscript.

Funding

This study was supported by the National Natural Science Foundation of China (No. 52109059, 32001473), the Natural Science Foundation of Shandong Province (No. ZR2018BEE048, ZR2019PC008), the Shandong Provincial Key Research and Development Program-Major Scientific and Technological Innovation Project (No. 2019JZZY010727) and the Zhongke Shandong Dongying Institute of Geographic Sciences Open Fund (No. 202104).

Data Availability Statement

The data presented in this study are available on request from the corresponding author.

Acknowledgments

The authors are grateful to editors and reviewers for their constructive comments and suggestions on this manuscript.

Conflicts of Interest

The authors declare no conflict of interest.

References

  1. Cui, B.; Yang, Q.; Yang, Z.; Zhang, K. Evaluating the ecological performance of wetland restoration in the Yellow River delta, China. Ecol. Eng. 2009, 35, 1090–1103. [Google Scholar] [CrossRef]
  2. Peng, J.; Chen, S.; Dong, P. Temporal variation of sediment load in the yellow river basin, china, and its impacts on the lower reaches and the river delta. Catena 2010, 83, 135–147. [Google Scholar] [CrossRef]
  3. Ma, T.; Li, X.; Bai, J.; Ding, S.; Zhou, F.; Cui, B. Four decades’ dynamics of coastal blue carbon storage driven by land use/land cover transformation under natural and anthropogenic processes in the yellow river delta, China. Sci. Total Environ. 2019, 655, 741–750. [Google Scholar] [CrossRef] [PubMed]
  4. Guan, Y.; Liu, G. Remote sensing detection of dynamic variation of the saline land in the yellow river delta. Remote Sens. Nat. Resour. 2003, 15, 19–22. [Google Scholar]
  5. Xiao, Y.; Zhao, G.; Li, T.; Zhou, X.; Li, J. Soil salinization of cultivated land in Shandong province, China—dynamics during the past 40 years. Land Degrad. Dev. 2019, 30, 426–436. [Google Scholar] [CrossRef]
  6. Li, X.; Wan, S.; Kang, Y.; Chen, X.; Chu, L. Chinese rose (Rosa chinensis) growth and ion accumulation under irrigation with waters of different salt contents. Agric. Water Manag. 2016, 163, 180–189. [Google Scholar] [CrossRef]
  7. Yu, S.; Liu, J.; Eneji, A.; Han, L.; Tan, L.; Liu, H. Dynamics of soil water and salinity under subsurface drainage of a coastal area with high groundwater table in spring and rainy season. Irrig. Drain. 2016, 65, 360–370. [Google Scholar] [CrossRef]
  8. Zhao, Y.; Wang, S.; Li, Y.; Zhuo, Y.; Liu, J. Effects of straw layer and flue gas desulfurization gypsum treatments on soil salinity and sodicity in relation to sunflower yield. Geoderma 2019, 352, 13–21. [Google Scholar] [CrossRef]
  9. Berezniak, A.; Ben-Gal, A.; Mishael, Y.; Nachshon, U. Manipulation of soil texture to remove salts from a drip-irrigated root zone. Vadose Zone J. 2018, 17, 170019. [Google Scholar] [CrossRef] [Green Version]
  10. Li, X.Y. Gravel–sand mulch for soil and water conservation in the semiarid loess region of northwest china. Catena 2002, 52, 105–127. [Google Scholar] [CrossRef]
  11. Sun, J.; Kang, Y.; Wan, S. Effects of an imbedded gravel–sand layer on reclamation of coastal saline soils under drip irrigation and on plant growth. Agric. Water Manag. 2013, 123, 12–19. [Google Scholar] [CrossRef]
  12. Zhang, Y.; Li, H.; Hong, H.; Wang, X.; Chen, W. Punching and filling sand method increasing water infiltration and desalting rate of saline-alkali soil under flooding irrigation. Trans. CSAE 2017, 433, 76–83. [Google Scholar] [CrossRef]
  13. Nie, J.; Stevens, T.; Rittner, M.; Stockli, D.; Pan, B. Loess plateau storage of northeastern Tibetan plateau-derived Yellow River sediment. Nat. Commun. 2015, 6, 8511. [Google Scholar] [CrossRef] [Green Version]
  14. Dai, Q.; Cao, W.H.; Shi, H.L.; Wang, Y.H. Analyses on some problems in irrigation districts and benefits of allocating diverted water and sediment along the lower yellow river. J. China Inst. Water Resour. Hydropower Res. 2007, 5, 15–20. [Google Scholar] [CrossRef]
  15. Wang, Q.; Shao, M.A.; Wang, Z. Mechanism and simulating model for muddy water infiltration. Trans. CSAE 1999, 15, 135–138. [Google Scholar]
  16. Yao, X.; Li, J.; Huang, X.; Sun, X. Distribution of yellow river’s silt in field under border irrigation. Trans. CSAE 2016, 32, 147–152. [Google Scholar] [CrossRef]
  17. Liu, L.; Niu, W.; Wu, Z.; Olusola, O.; Guan, Y. Effect of fertilization and sediment flow hydraulic characteristics on emitter clogging in muddy water drip fertigation system. Irrig. Drain. 2018, 67, 713–723. [Google Scholar] [CrossRef]
  18. Mao, W.; Kang, S.; Wan, Y.; Sun, Y.; Wang, Y. Yellow river sediment as a soil amendment for amelioration of saline land in the yellow river delta. Land Degrad. Dev. 2016, 27, 1595–1602. [Google Scholar] [CrossRef]
  19. Alqahtani, M.R.A. Effect of addition of sand and soil amendments to loam and brick grit media on the growth of two turf grass species (Lolium perenne and Festuca rubra). J. Appl. Sci. 2009, 9, 2485–2489. [Google Scholar] [CrossRef] [Green Version]
  20. Li, W.; Li, X.; Li, H.; Yang, Y.; Lei, K.; Yao, X. Effects on micro-ecological characteristics in clayey soil of tobacco area under different sand adding proportions. J. Northwest Agric. For. Univ. Sci. Technol. Nat. Sci. Ed. 2012, 40, 85–96. [Google Scholar] [CrossRef]
  21. Mathur, O.P.; Mathur, S.K.; Talati, N.R. Effect of addition of sand and gypsum to fine-textured salt-affected soils on the yield of cotton and jower (Sorghum) under Rajasthan Canal Command Area conditions. Plant Soil 1983, 74, 61–65. [Google Scholar] [CrossRef]
  22. Zhou, L.; Li, R.; Miao, Q.; Dou, X.; Tian, F.; Yu, D.; Sun, C. Effects of different sand ratios on infiltration and water-salt movement of heavy saline-alkali soil in Hetao irrigation area. Trans. CSAE 2020, 36, 116–123. [Google Scholar] [CrossRef]
  23. Kostiakov, A. On the dynamics of the coefficient of water percolation in soils and on the necessity of studying it from a dynamic point of view for purposes of amelioration. Trans. 6th Comm. Int. Soc. Soil Sci. Russ. 1932, 1, 17–21. [Google Scholar]
  24. Horton, R.E. The role of infiltration in the hydrologic cycle. Trans. Am. Geophys. Union 1933, 14, 446–460. [Google Scholar] [CrossRef]
  25. Horton, R.E. Analysis of runoff-plat experiments with varying infiltration-capacity. Trans. Am. Geophys. Union 1939, 20, 693–711. [Google Scholar] [CrossRef]
  26. Philip, J. The theory of infiltration: 4. Sorptivity and algebraic infiltration equations. Soil Sci. 1957, 84, 257–264. [Google Scholar] [CrossRef]
  27. Philip, J. The theory of infiltration: 7. Soil Sci. 1958, 85, 333–337. [Google Scholar] [CrossRef]
  28. Al-Dosary, N.; Al-Sulaiman, M.A.; Aboukarima, A.M. Modelling the unsaturated hydraulic conductivity of a sandy loam soil using Gaussian process regression. Water SA 2019, 45, 121. [Google Scholar] [CrossRef] [Green Version]
  29. Zolfaghari, A.A.; Mirz, E.S.; Gorji, M. Comparison of Different Models for Estimating Cumulative Infiltration. Int. J. Soil Sci. 2012, 7, 108–115. [Google Scholar] [CrossRef] [Green Version]
  30. Wang, P.; Jiang, E.; Zhang, Q. Study on the Benefits of Sediment Recycling Model in Yellow River Irrigation District. Yellow River 2010, 32, 143–144. [Google Scholar] [CrossRef]
  31. Nimmo, J.R. Porosity and Pore Size Distribution. In Encyclopedia of Soils in the Environment; Hillel, D., Ed.; Elsevier: Amsterdam, The Netherlands, 2004; Volume 3, pp. 295–303. [Google Scholar] [CrossRef]
  32. Rabot, E.; Wiesmeier, M.; Schlüter, S.; Vogel, H.J. Soil structure as an indicator of soil functions: A review. Geoderma 2018, 314, 122–137. [Google Scholar] [CrossRef]
  33. He, F.; Pan, Y.; Tan, L. Zhang, Z. Li, P. Liu, J. Study of the water transportation characteristics of marsh saline soil in the yellow river delta. Sci. Total Environ. 2017, 574, 716–723. [Google Scholar] [CrossRef] [PubMed]
  34. Li, P.; Pan, Y.H.; He, F.H.; Tan, L.L.; Ji, S.X. Research on capillary water adsorption characteristics of yellow river delta wetland soil. Chin. J. Agrometeorol. 2017, 38, 378–387. [Google Scholar] [CrossRef]
  35. Song, R.; Chu, G.; Ye, J.; Bai, L.; Zhang, R.; Yang, J. Effects of surface soil mixed with sand on water infiltration and evaporation in laboratory. Trans. CSAE 2010, 26, 109–114. [Google Scholar]
  36. Gan, Y.; Liu, H.; Jia, Y.; Zhao, S.; Wei, J.; Xie, H. Infiltration-runoff model for layered soils considering air resistance and unsteady rainfall. Hydrol. Res. 2019, 50, 431–458. [Google Scholar] [CrossRef]
  37. White, I.; Sully, M. Macroscopic and microscopic capillary length and time scales from field infiltration. Water Resour. Res. 1987, 23, 1514–1522. [Google Scholar] [CrossRef]
  38. Li, Y.N. Study on the effect of muddy irrigation on soil air pressure. Agric. Res. Arid. Areas 2003, 21, 91–93. [Google Scholar]
  39. Rodgers, M.; Mulqueen, J.; Healy, M. Surface clogging in an intermittent stratified sand filter. Soil Sci. Soc. Am. J. 2004, 68, 1827. [Google Scholar] [CrossRef]
  40. Hu, H.; Mao, X.; Barry, D.; Liu, C.; Li, P. Modeling reactive transport of reclaimed water through large soil columns with different low-permeability layers. Hydrogeol. J. 2015, 23, 351–364. [Google Scholar] [CrossRef]
  41. Liu, B.; Wang, S.; Kong, X.; Liu, X. Soil matric potential and salt transport in response to different irrigated lands and soil heterogeneity in the North China Plain. J. Soils Sediments 2019, 19, 3982–3993. [Google Scholar] [CrossRef]
Figure 1. Experimental equipment.
Water 14 00481 g001
Figure 2. Variation of capillary rise height with time (a), initial (b), steady (c), transition (d) and sandy (e) period. U0, U10 and U20 indicate the upward water treatments of the sediment addition with 0 kg/m2,10 kg/m2 and 20 kg/m2, respectively.
Water 14 00481 g002
Figure 3. Variation of capillary rise rate with time (a), initial (b), steady (c), transition (d, and sandy (e) period. U0, U10 and U20 indicate the upward water treatments of the sediment addition with 0 kg/m2,10 kg/m2, and 20 kg/m2, respectively.
Water 14 00481 g003
Figure 4. Variation of cumulative capillary water adsorption (a) and capillary adsorption rate (b) with time. U0, U10 and U20 indicate the upward water treatments of the sediment addition with 0 kg/m2,10 kg/m2 and 20 kg/m2, respectively.
Water 14 00481 g004
Figure 5. Relationship between the capillary rise height and the cumulative adsorption water amount. U0, U10 and U20 indicate the upward water treatments of the sediment addition with 0 kg/m2, 10 kg/m2 and 20 kg/m2, respectively.
Water 14 00481 g005
Figure 6. Variation of soil wetting font migration with time (a), 0–20 cm soil layer (b), 20–50 cm soil layer (c). D0, D10 and D20 indicate the downward water treatments of the sediment addition with 0 kg/m2,10 kg/m2 and 20 kg/m2, respectively.
Water 14 00481 g006
Figure 7. Variation of soil infiltration rate with time (a) and detail variation of relative low infiltration rate from 5700 min to the final period (b). D0, D10 and D20 indicate the downward water treatments of the sediment addition with 0 kg/m2,10 kg/m2 and 20 kg/m2, respectively.
Water 14 00481 g007
Figure 8. Distribution of soil moisture (a, c) and saturated extract electrical conductivity (ECe) (b, d) for downward/upward water treatments. D0, D10 and D20 indicate the sediment addition treatments with 0 kg/m2,10 kg/m2 and 20 kg/m2, respectively, for downward water; U0, U10 and U20 indicate the sediment addition treatments with 0 kg/m2,10 kg/m2 and 20 kg/m2, respectively, for upward water.
Water 14 00481 g008
Table 1. Soil physical properties for different treatments.
TreatmentsSoil TexturePercentage of Particle Content (%)pHECe (dS/m)Organic Matter (g/kg)Total N (g/kg)ESP
(%)
Clay
0–2 μm
Silt
2–50 μm
Sand
50–2000 μm
SedimentLoamy Fine Sand0.3922.9176.697.61.7812.421.4228.7
U0/D0Sandy Clay35.1319.2545.628.26.523.280.4710.2
U10/D10Sandy Clay35.4918.3446.178.26.473.350.5110.1
U20/D20Sandy Clay36.0716.6447.298.16.503.610.569.7
Note: Soil particles were measured with pipette sampling method; ECe is the electrical conductivity for saturate soil; ESP is the exchangeable sodium percentage.
Table 2. Variation in saturated soil hydraulic conductivity and porosity ratio for different sediment addition.
Sediment Addition
(kg/m2)
TreatmentsSaturated Soil Hydraulic Conductivity
(×103 cm/min)
Ratio of Soil Porosity (%)
MacroporosityMesoporosityMicroporosity
0U0/D00.36 c9.52 c13.75 a8.67 a
10U10/D101.18 b11.41 b12.18 ab6.51 b
20U20/D204.34 a15.56 a11.37 b3.44 c
Note: Values followed by the same letter within a column are not significantly different at p < 0.05, as determined by the LSD test. U0/D0, U10/D10 and U20/D20 indicate the treatments of the sediment addition with 0 kg/m2,10 kg/m2 and 20 kg/m2, respectively.
Table 3. Capillary water adsorption variation for different treatments.
TreatmentsCumulative Capillary
Adsorption Amount (kg)
Capillary Rise Rate
(×10−3 cm/min)
Capillary Adsorption Rate
(×10−3 kg/min)
Initial
0–10 cm
Steady
10–20 cm
Transition
20–30 cm
Sandy
30–50 cm
Initial
0–10 cm
Steady
10–20 cm
Transition
20–30 cm
Sandy
30–50 cm
Initial
0–10 cm
Steady
10–20 cm
Transition
20–30 cm
Sandy
30–50 cm
U00.342 c0.707 c0.231 c0.761 c6.11 a0.780 a0.397 a0.294 c0.13 c0.036 b0.017 b0.018 a
U100.373 a0.770 a0.27 b0.894 b4.90 c0.657 b0.412 a0.335 a0.19 a0.042 ab0.020 a0.022 a
U200.355 b0.754 b0.285 a0.956 a5.49 b0.781 a0.412 a0.318 b0.17 b0.047 a0.019 ab0.022 a
Note: U0, U10 and U20 indicate the upward water treatments of the sediment addition with 0 kg/m2, 10 kg/m2 and 20 kg/m2, respectively. Values followed by the same letter within a column are not significantly different at p < 0.05, as determined by the LSD test.
Table 4. Simulation results of soil water infiltration and capillary water rise model.
TreatmentsKostiakovR2PhilipR2HortonR2
U0y = 97.259×x−0.5350.8302y = 194.77×x−0.5 − 1.67940.7477y = 17.23×EXP(−0.001×x) + 0.24910.3184
U10y = 75.103×x−0.5090.8478y = 146.95×x−0.5 − 1.02530.8713y = 16.106× EXP (−0.001×x) + 0.25860.3837
U20y = 88.435×x−0.5220.8551y = 171.57×x−0.5 − 1.34320.8013y = 14.444× EXP (−0.001×x) + 0.27550.4576
D0y = 87.723×x−0.4790.706y = 360.38×x−0.5 − 4.71210.8017y = 116.96× EXP (−0.0015×x) + 0.65280.6868
D10y = 164.21×x−0.5980.609y = 344.85×x−0.5 − 4.73470.8242y = 109.77× EXP (−0.0015×x) + 1.38040.701
D20y = 176.56×x−0.5190.6738y = 392.07×x−0.5 − 5.24180.8849y = 125.33× EXP (−0.0015×x) + 1.97910.7658
Note: U0, U10 and U20 indicate the treatments of the sediment addition with 0 kg/m2,10 kg/m2 and 20 kg/m2, respectively, for upward water; D0, D10 and D20 indicate the downward water treatments of the sediment addition with 0 kg/m2,10 kg/m2 and 20 kg/m2, respectively, for downward water.
Publisher’s Note: MDPI stays neutral with regard to jurisdictional claims in published maps and institutional affiliations.

