Article

Reservoir Sediment Management and Downstream River Impacts for Sustainable Water Resources—Case Study of Shihmen Reservoir

1
Hydrotech Research Institute, National Taiwan University, Taipei 10617, Taiwan
2
Water Resources Research Center, Disaster Prevention Research Institute, Kyoto University, Gokasho, Uji, Kyoto 611-0011, Japan
*
Author to whom correspondence should be addressed.
Water 2022, 14(3), 479; https://doi.org/10.3390/w14030479
Submission received: 10 December 2021 / Revised: 2 February 2022 / Accepted: 3 February 2022 / Published: 6 February 2022
(This article belongs to the Special Issue Water Resources Management and Extreme Events)

Abstract

:
Sustainable water resources of reservoirs depend on preserving the valuable storage capacity. Sediment management is a crucial task in reservoir operations. Extreme floods caused by typhoon events have brought a massive amount of sediments from the watershed of Shihmen Reservoir in Taiwan. In the case study of Shihmen Reservoir, the primary purpose of the sediment management strategies is to minimize sediment deposition and recover reservoir capacity. Two assessment indexes, the capacity–inflow ratio (CIR) and the capacity–sediment ratio (CSR) are investigated to provide a feasible assessment of desilting techniques. Three desilting projects have been planned and implemented in progress, including one modified power plant penstock and two desilting tunnels. Without effective sediment management strategies, the projected storage capacity may drop to 32.9% of the initial storage capacity in the next fifty years. On the other hand, if sediment management is implemented as per the project schedule, 70.3% of the initial storage capacity may be retained, enabling the provision of sustainable water supplies to meet projected water demands. In investigating the impacts caused by the desilting operations, the floodwater level and riverbed variations along the downstream river of the dam are simulated by the hydromorphological model. From simulated results, the downstream river morphology may adjust toward the equilibrium state under the long-term desilting operations of Shihmen Reservoir. Although relatively high sediment concentration is released during the desilting operation, it decays gradually along the downstream river. In addition, riverbed deposition does not significantly affect the floodwater level caused by the increment of riverbed elevation in desilting operations.

1. Introduction

The storage preservation of existing reservoirs is crucial for sustainable water resources worldwide. The United Nations proposed the sustainable development goals (SDGs) in 2015 to provide water for all by ensuring the availability and sustainability of water resources. Goal 6 of the SDGs demonstrates that water scarcity is a critical issue, highlighting the need for clean and accessible water [1,2]. The total volume of water on Earth comprises 97.5% salt water and 2.5% fresh water. Out of 2.5% fresh water, only 0.3% of freshwater is in liquid form and available for consumption [3]. A reservoir is formed by constructing a dam across the river, providing freshwater storage space. For sustainable development of water resources, the reservoir storage space can be considered a natural resource that stores fresh water for multiple purposes such as irrigation, water supply, power generation, recreation, and flood control [4,5,6,7].
A reservoir impounded by a dam interrupts sediment transport through a river system, resulting in sediment trapping in the reservoir. Sediment trapping causes reservoir sedimentation problems, typically losing reservoir storage space or storage capacity. Based on the existing data on reservoir sedimentation trapping rates, Mahmood (1987) [8] estimated the global annual loss of storage capacity of the reservoirs was around 1%. The global average sedimentation rate was estimated at 0.8% per year [9]. According to the study by Wisser et al. (2013) [10], global annual loss rates compared to original reservoir storage capacity were projected to range between 0.5 and 1%, equivalent to about 30 to 60 billion cubic meters per year. Jiang and Fu (1998) [11] estimated the annual average loss rate of reservoir capacity to be 2.3% in China. Patra et al. (2019) [12], while taking into account 243 reservoirs in India, reported the annual average sedimentation rate to be 1.41%. According to recent statistics, the mean sedimentation rate of reservoirs worldwide was 0.94% [13]. The global trend of continuous loss of reservoir storage capacity year after year to sedimentation problems has been alarming [14]. Sedimentation problems have also been experienced at sites, reducing the storage capacity for water supply, hydropower, flood control, and environmental benefits. Reservoir sediment management is no longer a problem to be put off until the future, which has become a contemporary problem to solve [14,15,16]. Based on the available statistics, Taiwan’s yearly average sedimentation rate is 0.87%. In the case study of Shihmen Reservoir, the average annual sediment volume deposited from 1963 to 2020 was approximately 1.82 Mm3/yr, and its storage capacity loss was estimated to be 34% of its initial capacity [13]. The sustainable use of reservoirs requires efficient water and sediment management. As a result, effective sediment management has been discussed and implemented promptly [17,18,19,20].
While the reservoir gradually fills with sediment, the primary aim of conventional sediment management strategies is to reduce or remove sediment deposition. In contrast, the functional sediment management strategy may include a variety of desilting techniques without disturbing the functioning of the reservoir. From a practical perspective, the pressing issues are how desilting techniques and facilities can effectively screen or reduce sediment inflow, mitigate reservoir sedimentation, and ensure long-term storage capacity usage [21,22]. The feasible desilting techniques are usually classified as hydraulic desiltation and mechanical removal [4,14]. For hydraulic desiltation, desilting techniques focus on passing sediment through or around the reservoir by sediment bypassing or sluicing to minimize sediment settling in the reservoir [23,24]. Dredging is performed under the water surface for mechanical removal, whereas dry excavation removes exposed sediment [25]. It is crucial to adopt appropriate sediment management in reservoir desilting operations, primarily determining which desilting techniques are most efficient in a specified reservoir. Basson and Rooseboom (1997) [26] studied hydrological data and storage capacity in many reservoirs and proposed two indexes to evaluate desilting techniques. These indexes include the capacity–inflow ratio (CIR), defined as the reservoir capacity (CAP) divided by the mean annual runoff (MAR), and the capacity–sediment ratio (CSR), defined as the CAP divided by the mean annual sediment (MAS). Using experience and judgment to delineate ranges of these two indexes, they analyzed sediment sluicing or flushing to be technically feasible. Sumi et al. (2009, 2012) [27,28] further collected more reservoir data worldwide and adopted these quantitative indexes for assessing suitable desilting techniques in sediment management strategies. According to the classification by Basson and Rooseboom (1997) [26] and Palmieri et al. (2003) [29], the lower and upper bounds of CIR values for desilting technique options were studied and determined. Based on hydrological data and field desilting operations, a reservoir with a lower CIR value may adopt hydraulic desiltation. On the other hand, a reservoir with a higher CIR value may use mechanical removal [7,23,30].
Owing to hydromorphological processes, the significant variations in sediment concentration and floodwater level by desilting operation may cause downstream river impacts [16,31]. Downstream challenges must be considered, such as maintaining water and sediment equilibrium within the entire downstream river, typically affecting water supply intake and changing the equilibrium state of the downstream river morphology in flood events. The floodwater stage and riverbed alterations throughout the downstream river reach should be evaluated for long-term consequences on flood risk to communities, businesses, infrastructure, and the environment [32,33]. Therefore, selecting suitable sediment management techniques during reservoir desilting operations is also critical in flood events.
In this study, the purpose is to investigate the long-term sedimentation effects on water resources and downstream morphological impacts caused by sediment desilting operations in Shihmen Reservoir. Initially, the classification of sediment management strategies is introduced to assess various desilting techniques for mitigating reservoir sedimentation problems. Two assessment indexes, the capacity–inflow ratio (CIR) and the capacity–sediment ratio (CSR), are analyzed to select suitable desilting techniques for Shihmen Reservoir. The sediment deposition volume is then estimated by the annual sediment trapping efficiency from the Brune curve approach. Three sediment desilting projects are evaluated and planned by adopting sediment sluicing and sediment bypassing techniques to minimize inflow sediment deposition and sustain reservoir storage capacity. Based on hydrological data of the typhoon flood events and annual water resources demand projection, the trend line of the reservoir storage capacity with/without the sediment desilting projects are calculated and analyzed for the turnover rate of the next fifty years. A hydromorphological model is applied to simulate the floodwater level and sediment concentration variations to assess downstream river impacts resulting from reservoir desilting operations. The long-term simulations of floodwater stages and riverbed elevation changes are evaluated to determine flood risk along the downstream river reaches.

2. Materials

Shihmen Reservoir was adopted as the study case to investigate the long-term sedimentation effects on water resources and downstream morphological impacts caused by sediment desilting operations. Initially, the fundamental geographic and hydrological conditions in Shihmen Reservoir are described. The upper reach of Shihmen Reservoir watershed has deep valleys and fragile geological characteristics, which may generate a significant amount of sediment yield during typhoon flood events. Historical data of annual sediment deposition volumes and typhoon flood events were collected. Three projects for sediment management undertaken by adopting sediment desilting techniques are introduced herein, including the modified power plant penstock, the Amuping desilting tunnel, and the Dawanping desilting tunnel.

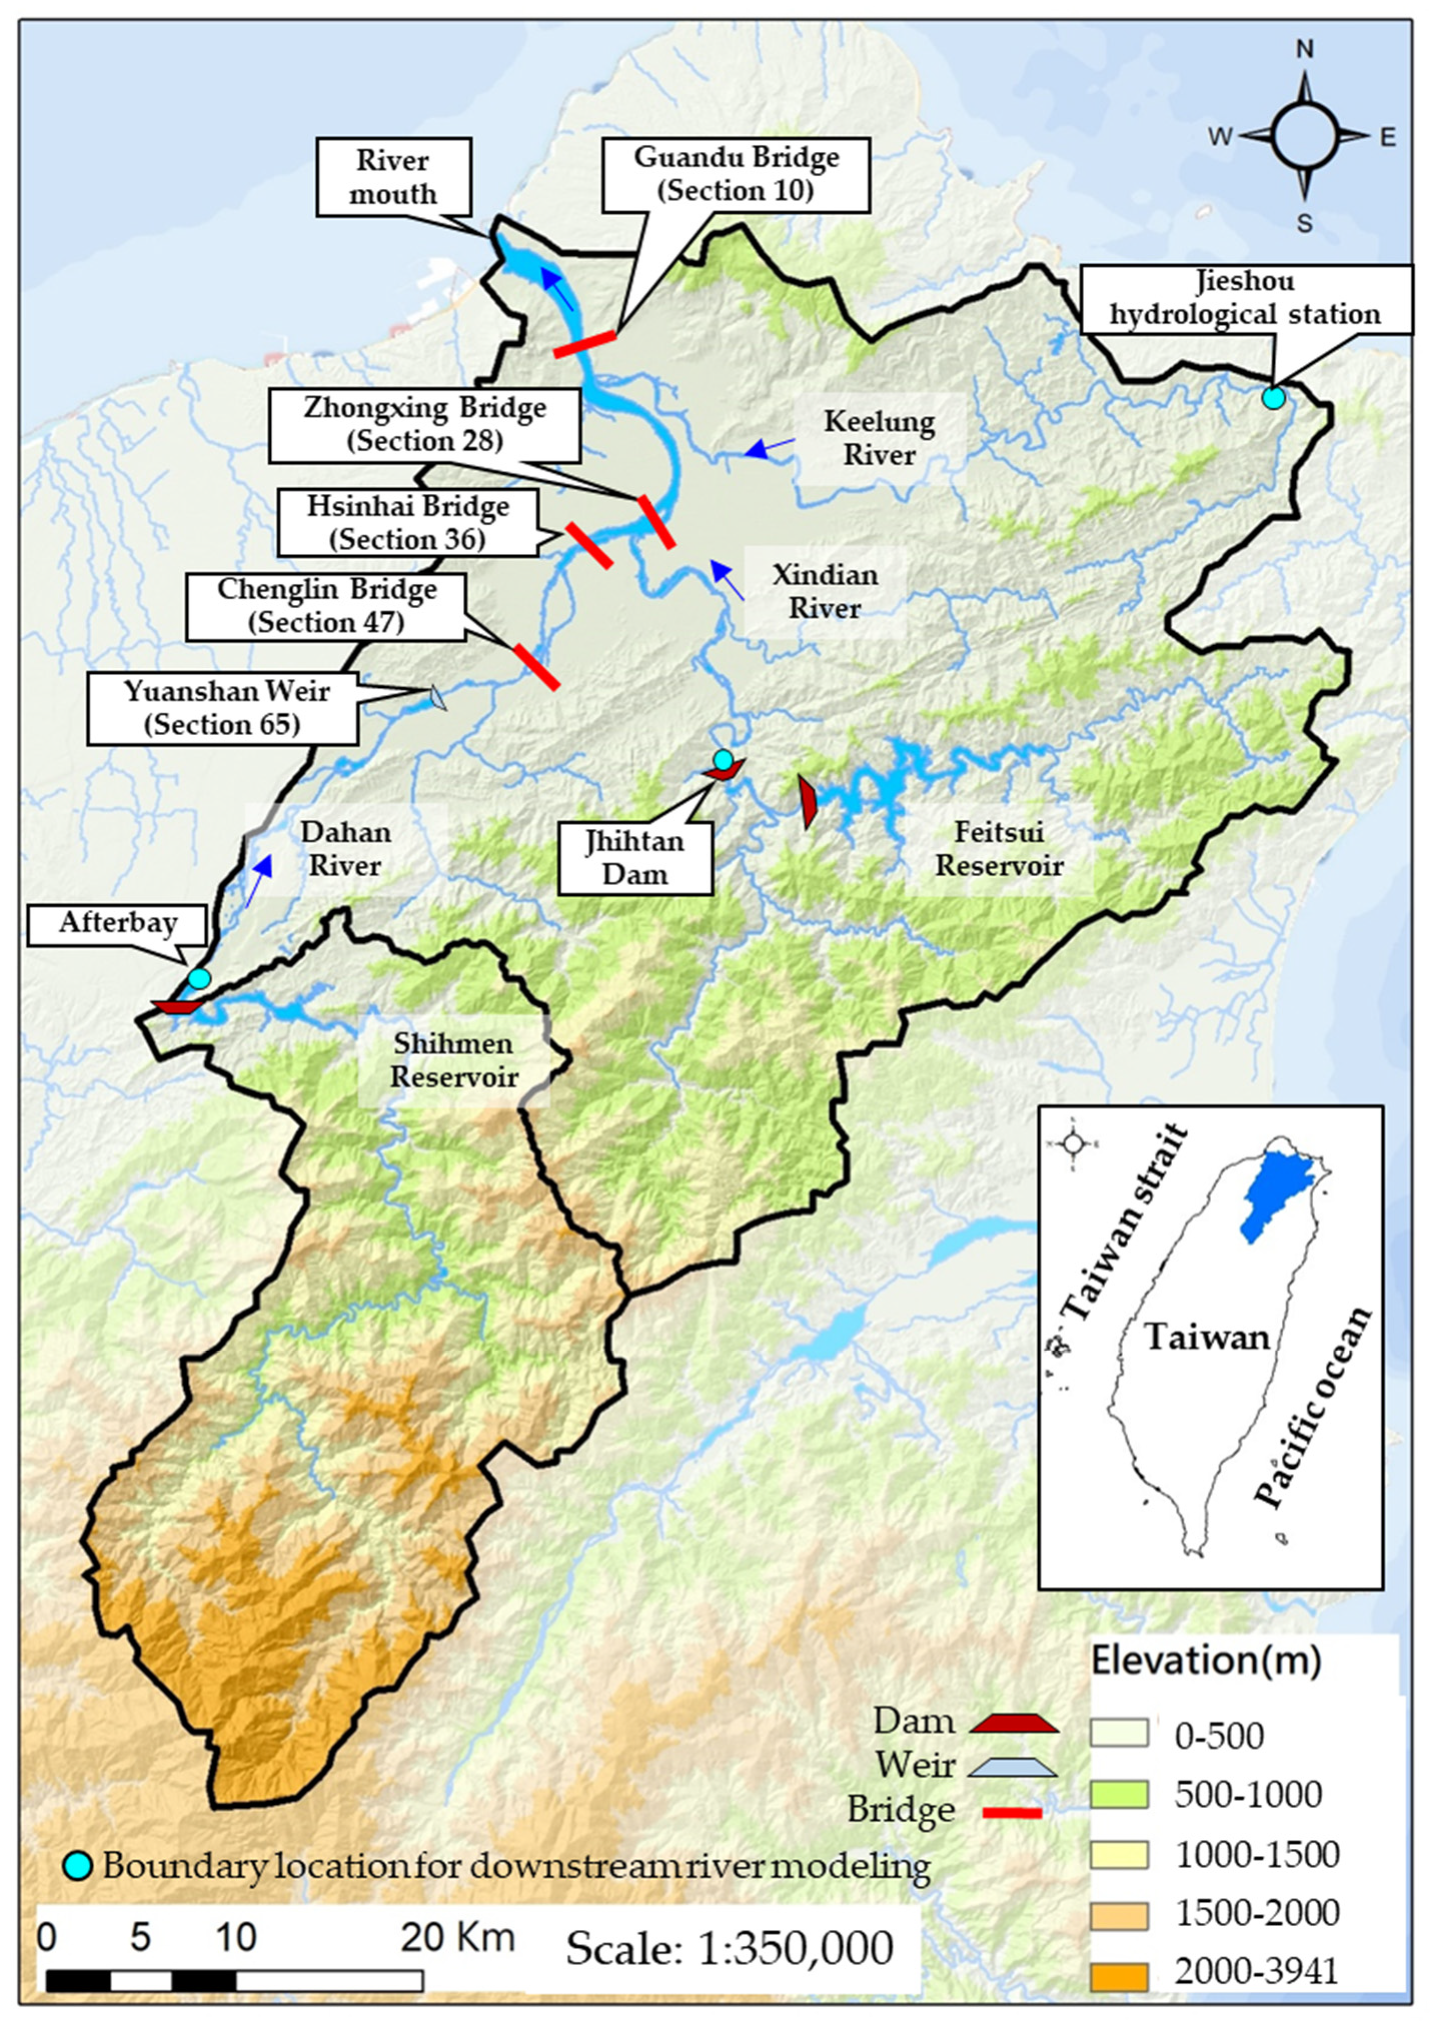
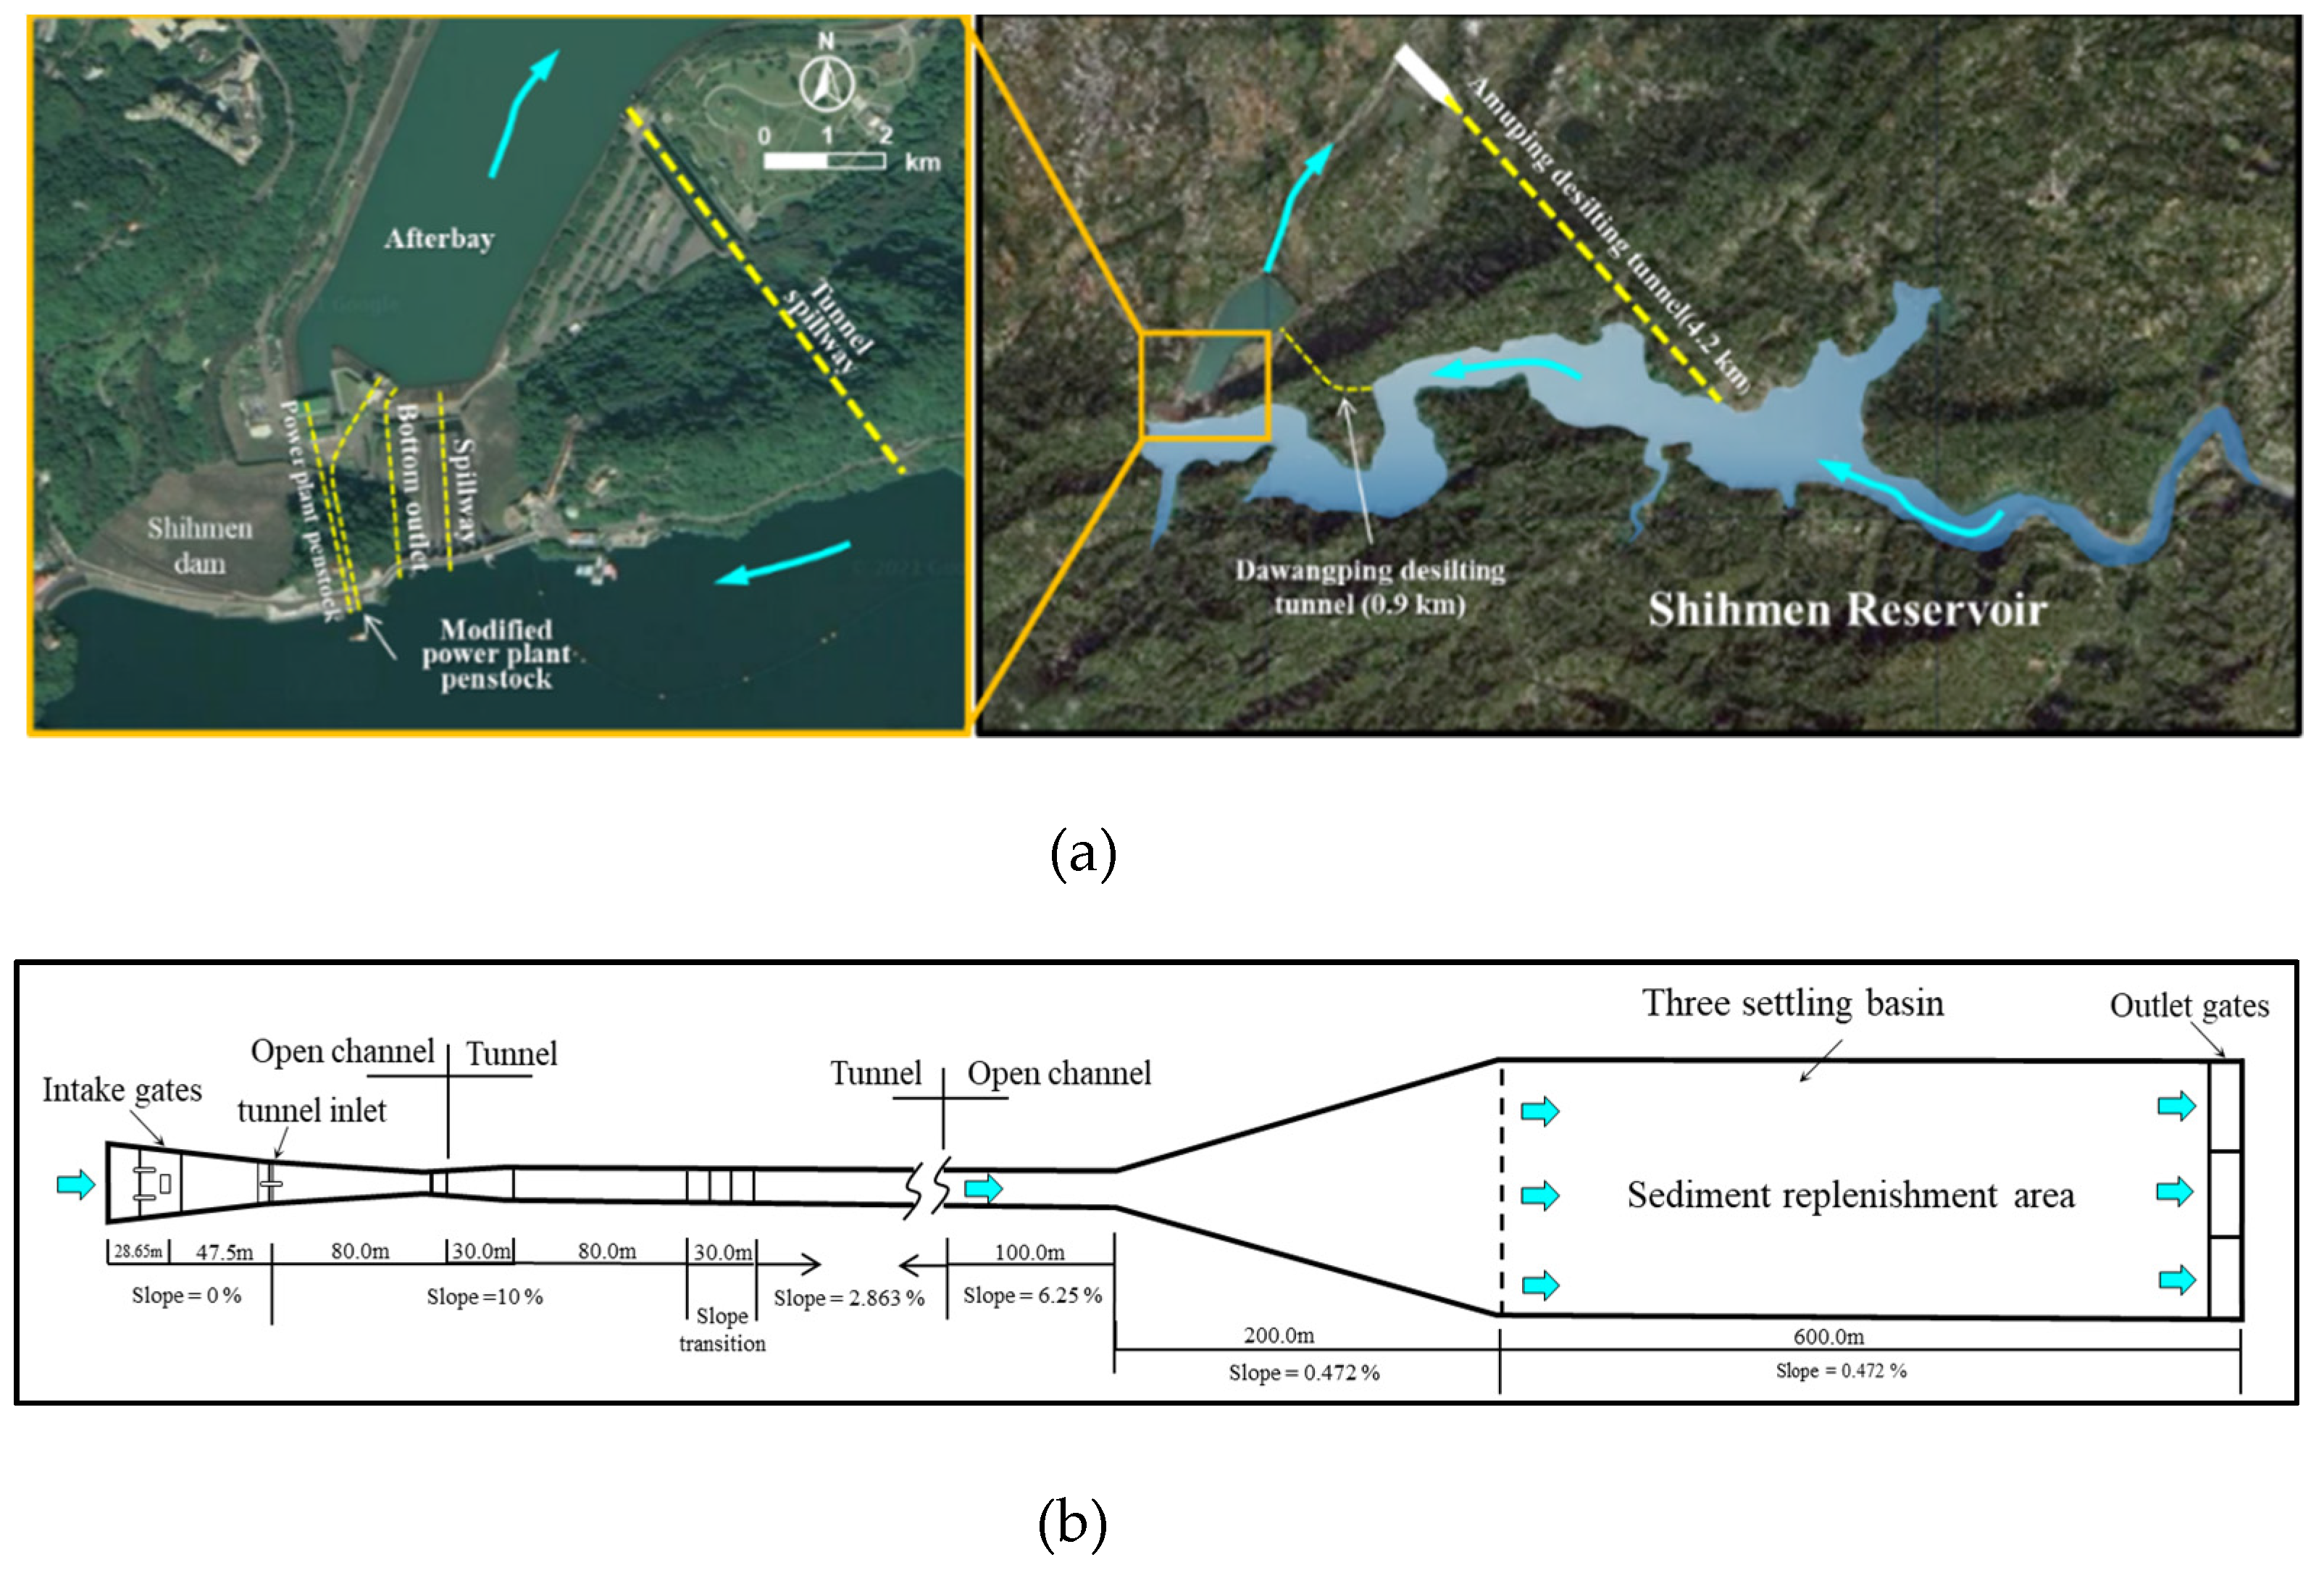
2.1. Study Site and Hydrological Conditions

Shihmen Reservoir, built in 1964, is located in the middle reach of the Dahan River. The Dahan River is one of the tributaries in the Tamsui River basin, the largest river basin in northern Taiwan (see Figure 1). The Tamsui River basin has a natural drainage area of 2726 km2 and a length of 159 km, which consists of three tributaries named Dahan River, Xindian River, and Keelung River, converging at Taipei City, the center of politics, economy, and culture. As a multifunctional reservoir, Shihmen Reservoir has its functions, including irrigation, water supply, power generation, flood control, and tourism. The irrigation area of 365 Mm2 (M = 106) covers Taoyuan, Hsinchu, and Taipei areas in northern Taiwan. The reservoir supplies water to 28 districts with a population of 3.4 million, providing significant water resources for livelihood. Using the water impoundment at Shihmen Dam, the Shihmen power plant annually generates 2.3 hundred million kWh (kilowatt per hour), contributing to electric power demand at peak hours. Another function of the reservoir is to mitigate flood damage in downstream areas during typhoons and heavy rain seasons by reducing flood peak discharge to protect more than 6.9 million people who live in the Taipei metropolitan area.
Shihmen Reservoir was formed by a 133 m high embankment dam with six spillways, two tunnel spillways, two power plant intakes, and one bottom outlet. The elevations of the spillway crest, tunnel spillway, power plant intake, and bottom outlet are 235, 220, 173, and 169.5 m, respectively. The design discharges of six outlets, including spillways, tunnel spillways, power plant intakes, and bottom outlet, are 11,400, 2400, 137.2, and 34 m3/s, respectively. At a normal water level of elevation 245 m, the reservoir pool is approximately 16.5 km in length and forms a water surface area of 8.15 km2. The initial storage capacity was 310 Mm3, and the initial active storage was 250 Mm3.
The watershed of Shihmen Reservoir is located in the southern part of the Tamsui River. The Dahan River traverses the watershed, and its irregular tributaries spread across the steep slopes of the subwatersheds (angle from 20° to 85° with the elevation between 220 m and 3527 m) (see Figure 1). The upper reach of the Shihmen Reservoir watershed has deep valleys and vulnerable geological features. Hills cover most of the watershed, with a slope greater than 55% in more than 60% of the area [34]. The watershed is densely vegetated with a variety of coniferous and broadleaved trees, both natural and artificial, aided by the subtropical monsoon climate and annual rainfall between 2200 and 2800 mm. However, the trends in rainfall patterns have increased over the past decades to create concerns about soil erosion. However, poor land use in the catchment area of Shihmen Reservoir has contributed to a severe sedimentation problem in the reservoir. Sediment mainly comes from landslides and other erosion-related issues in the steep-sloped and rugged drainage basin, aggravated by deforestation, land clearing for agriculture, and road construction. Many observable landslide areas appeared after the Chi-Chi earthquake in 1999 [35]. The sediment yield from watershed contribution (>96%) of landslides on sediment supply was much more significant than that caused by soil erosion (<4%) [36]. Another study also concluded that large amounts of sediments remain at the foot of the slope and in the streams, which become a potential source of reservoir sedimentation [37].
Bathymetric survey data were collected from the Northern Region Water Resources Office, Water Resources Agency (WRA), Ministry of Economic Affairs (MOEA) (2020) [38]. The storage capacity through a bathymetric survey has been annually measured from 1963 to 2020. In the bathymetric survey, the water depth was measured by sounding lead or single-beam echo sounders before 2014. After 2014, the water depth was obtained by multibeam echo sounders. Figure 2 presents the historical sedimentation records of accumulative and annual deposition volumes in Shihmen Reservoir. The lowest points were selected from the bathymetric survey data at each cross-section. Then, the longitudinal bed elevations along the thalweg (i.e., the line of lowest elevation within a watercourse) were determined [38], as shown in Figure 3. As seen in Figure 2, the accumulated deposition volume is 104.96 Mm3, and the existing storage capacity of Shihmen Reservoir is 204.16 Mm3. Thus, the storage capacity of Shihmen Reservoir was estimated to be 66.03% of its initial capacity. Impacted by extreme typhoon events over the past few decades, Shihmen Reservoir has confronted increased sediment yields from its upstream watershed. However, it was not sufficient desilting outlets to release incoming sediment during flood events. As a result, the sedimentation rate has been faster than the design target since dam completion. The original design sedimentation rate of Shihmen Reservoir was 0.8 Mm3/yr. In the first four decades, several major typhoon events, including Typhoon Gloria in 1963, Typhoon Elsie in 1969, and Typhoon Bess in 1971, disrupted the reservoir operation and caused the total capacity loss of 38.60 Mm3 [39,40]. Since 1972, many engineering projects in Shihmen Reservoir have been proposed to preserve the reservoir life and reduce sediment yields. More than 100 check dams were built in the upstream catchments, in addition to soil conservation and landside control measures. As a result, the annual deposition volume had decreased progressively after 1973, as seen in Figure 2. Dredging the small amount of sediment deposits near the dam site had been the primary reservoir desilting operation. However, the check dam gradually filled up by sediment yields, and the disposal field constrained the dredging operation. In Figure 2, the hydrological records reveal that extreme floods caused by typhoon events brought a massive amount of sediments into Shihmen Reservoir, especially after Typhoon Aere in 2004.
In the typhoon Aere event, the flood peak discharge in Shihmen Reservoir was estimated to be about a 100-year return period flood. As a catastrophic disaster flood event, it carried a massive amount of sediment and deposited 27.88 Mm3, nearly 9% of its original storage capacity, which caused the water supply system to shut down for 18 days. Among 100 check dams, 38 check dams were damaged, and 74 were filled with sediments after Typhoon Aere [41]. Before Typhoon Aere, the accumulative deposition volume presents a mild increment with a yearly average deposition rate of 1.37 Mm3/yr. The yearly average deposition rate is defined as the average sediment depositional volume per year. However, in the absence of effective sediment management strategies, the average deposition rate shows a steeper tendency of 3.42 Mm3/yr after Typhoon Aere.
Table 1 lists the field measured data with desilting efficiency in significant typhoon occurrences in the past years (selected by the flood peak discharge surpassing 1700 m3/s, i.e., about 2-year return-period flood). The critical data recorded in the events include flood peak discharge, inflow discharge volume, inflow sediment volume, deposited sediment volume, and desilting efficiency. The desilting efficiency in a flood event is defined as the ratio of outflow sediment volume to inflow sediment volume.

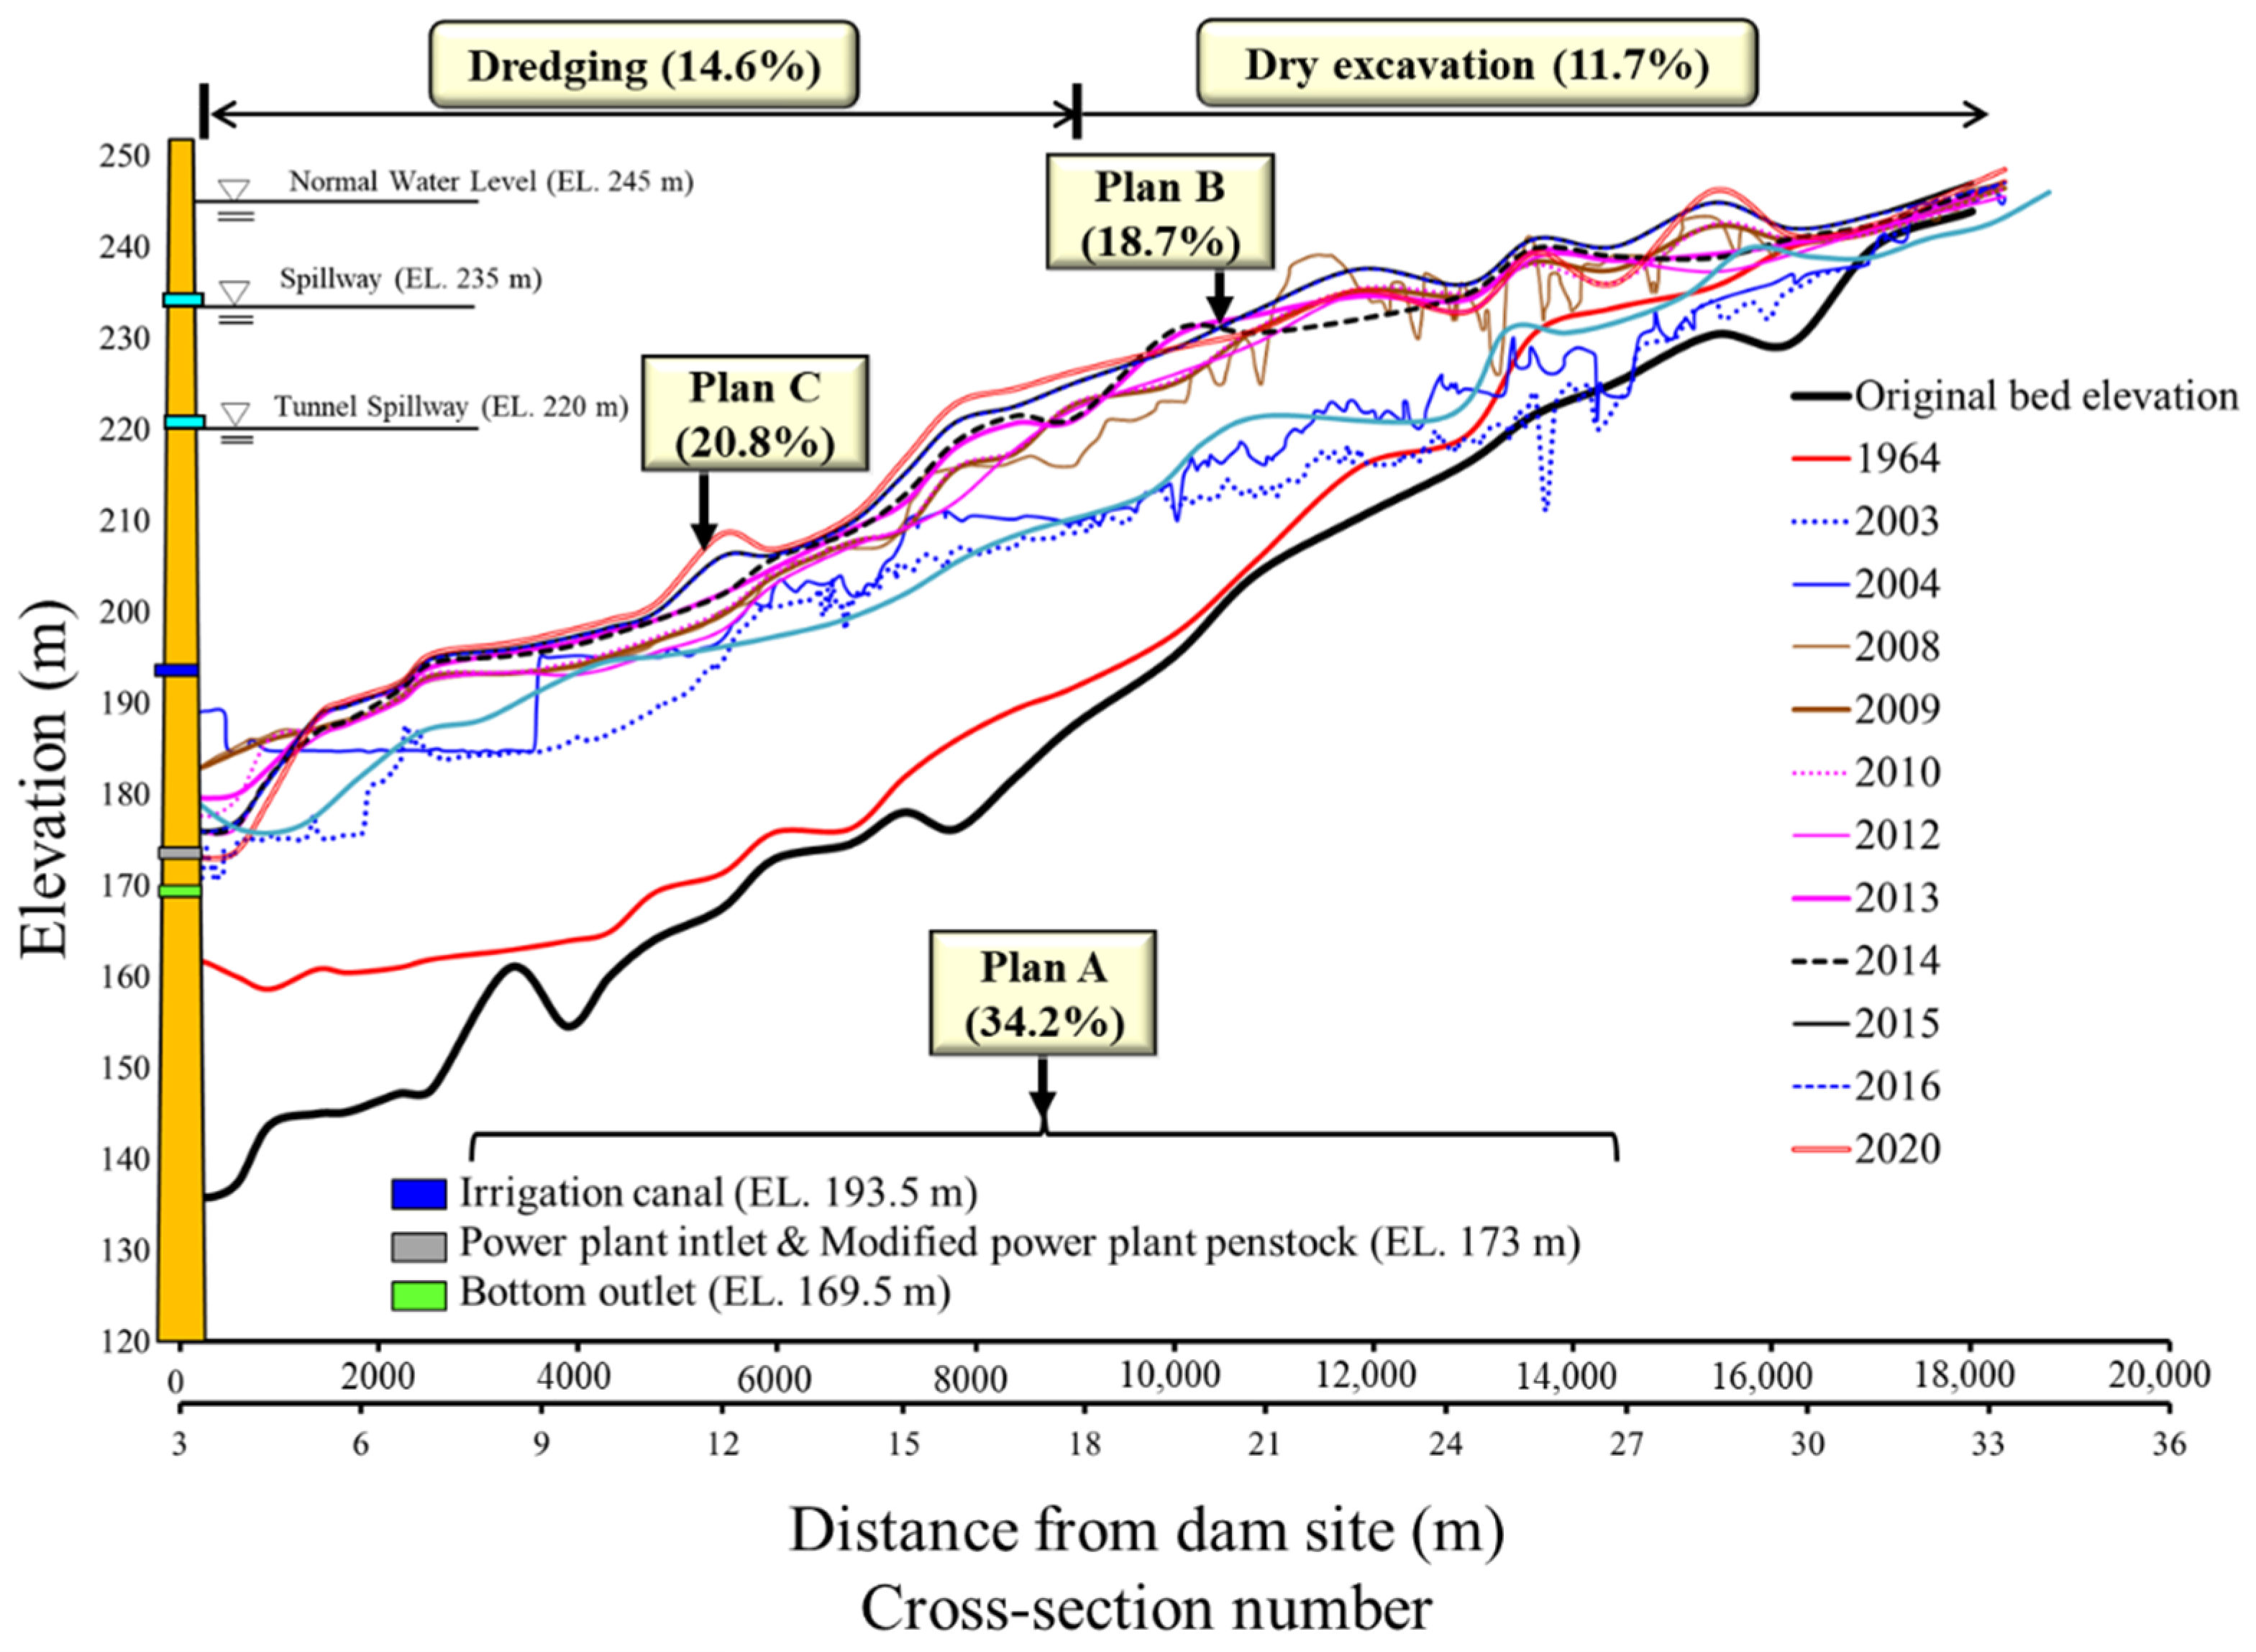
2.2. Desilting Plans in Shihmen Reservoir

The sustainable use of reservoir storage capacity for stable water demand requires effective sediment management. Owing to a lack of efficient desilting measures, the reservoir longitudinal bed elevations in Shihmen Reservoir rose over time after dam completion [38], as shown in Figure 3. At the time of dam completion, the bed bottom elevation near the dam site was recorded as EL. 135.8 m. When Typhoon Aere hit in 2004, the flood-induced deposits caused the bed elevation to increase up to EL. 189.0 m, burying both inlets of the power plant and the bottom outlet. In the meantime, the deltaic depositional formation along the reservoir had moved forward closer to the dam site. Severe sedimentation occurred in Shihmen Reservoir during Typhoon Aere in 2004. Since then, the Northern Region Water Resources Office, in charge of Shihmen Reservoir, has realized that the reservoir is losing its storage capacity without effective sediment management strategies. Based on the trend after Typhoon Aere in Figure 2, the average deposition rate is estimated to be 3.42 Mm3/yr and adopted as the design sediment deposition volume needed to be removed every year from Shihmen Reservoir. Three projects for sediment management have been planned and undertaken by the Northern Region Water Resources Office [13].
According to the design sediment deposition volume entering the reservoir, the prospective desilting efficiency of different sediment desilting techniques is discerned in Figure 3, which depicts the overall desilting plan. Three desilting projects, Plans A, B, and C, were planned and designed, including the modified power plant penstock, the Amuping desilting tunnel, and the Dawanping desilting tunnel [13]. The physical model study of Shihmen Reservoir was proposed and conducted by the Water Resources Planning Institute, WRA, MOEA, to evaluate the three desilting projects [42]. The model was constructed using a 1/100 undistorted scale model, based on the field bathymetrical survey data in 2003 before Typhoon Aere. It covered the 15.5 km longitudinal length of the reservoir. The similarity law of Froude number and sediment fall velocity were adopted for the model scale ratio. The sediment used in the physical model study was taken from those deposited in front of the dam. The median diameter of the deposited sediments was 4-8 μm, classified as clay. The experimental results of the outflow sediment discharges were measured at the spillway, the tunnel spillways, the irrigation canal, the power plant outlet, the modified power plant penstock, and the bottom outlet. The desilting efficiency of the Amuping and the Dawanping desilting tunnels in the physical model was measured to be 18.7% and 20.8%, respectively [42,43,44]. Besides the modified power plant penstock, Plan A consists of the facilities, including the spillways, the tunnel spillways, the irrigation canal, the power plant inlet, and the bottom outlet. In the planning stage, the annual inflow sediment of 1.77 Mm3, i.e., 34.2% of the design sediment deposition volume, is expected to sluice out of the reservoir, which is a little more than that resulting from the physical model. Currently, the facilities in Plan A are ready for desilting operation during flood events. The modified power plant penstock was built in 2012 and started to serve in 2013, as seen in the last column of Table 1. Plans B and C were proposed to construct the facilities for sediment bypassing, including the Amuping desilting tunnel and the Dawanping desilting tunnel. In Plan B, illustrated in Figure 3, the Amuping desilting tunnel located near cross-section 20 in the reservoir is currently under construction, and will be completed in 2022 to increase the flood diversion discharge and sediment removal at the middle reach of the reservoir. Based on experimental data obtained from the physical model test, the desilting efficiency for Plans B and C was obtained [42,43,44]. The sediment volume bypassing through the Amuping desilting tunnel and dredging boat operating near the entrance is estimated to be 0.64 Mm3/yr, 18.7% of the design sediment deposition volume. In Plan C, shown in Figure 3, the Dawanping desilting tunnel near cross-section 12 is under the planning stage, proposed for completion in 2030, to increase the flood diversion discharge and bypass sediment volume 0.71 Mm3/yr, 20.8% of the design sediment deposition volume. The modified power plant penstock, the Amuping desilting tunnel, and the Dawanping desilting tunnel are described in Section 2.2.1 and Section 2.2.2.
Mechanical removal is involved in sediment management, including dredging and dry excavation. The dredging is conducted under the water surface between the middle reach of the reservoir and the dam site, while the dry excavation is to remove exposed sediments around the upper stream part of the reservoir. Based on data from 2009 to 2019 for the mechanical removal operations, the average extraction and dredged deposit volumes were approximately 0.47 and 0.36 Mm3/yr, respectively. Therefore, the dredging and dry excavation volumes are planned to conduct 0.5 and 0.4 Mm3/yr, i.e., 14.6% and 11.7% of the design sediment deposition volume, respectively.

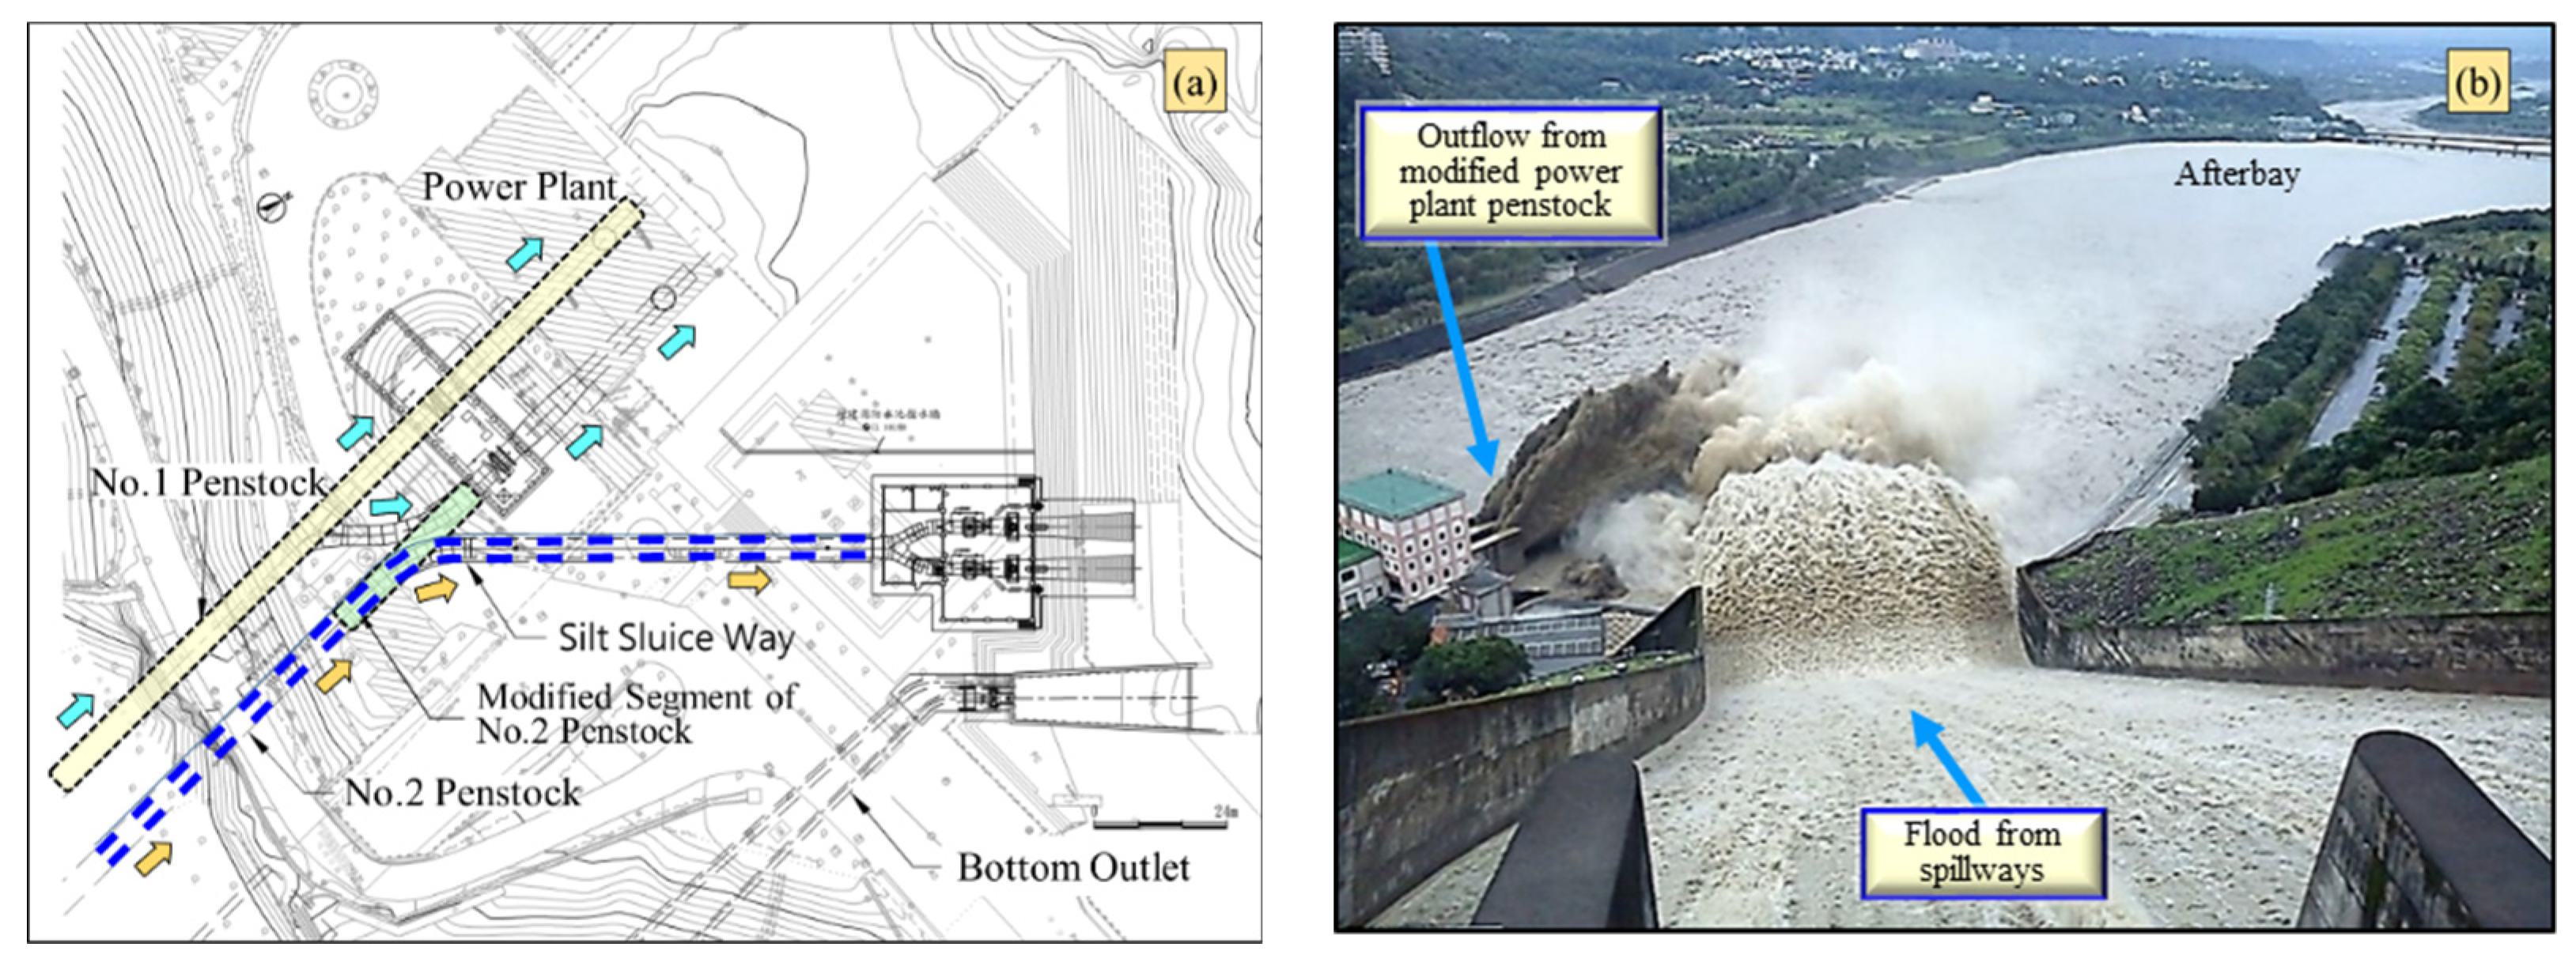
2.2.1. Modification of Power Plant Penstock

The original design of Shihmen Reservoir did not equip low-level outlets with large outflow discharges for desilting sediment. Most outflow discharges could only rely on the spillways and the tunnel spillways (see Figure 3). Consequently, it may release the clear water and store the muddy water during a flood event. The priority is to increase the discharge capacity of existing low-level outlets. Among the existing outlets, the outlet discharge capacities of the irrigation canal and the bottom outlet are small; thus, the power plant penstocks were considered. Hence, the No. 2 power plant penstock modification was executed and completed in June 2012 to improve sediment sluicing capacity. Figure 4a shows the layout sketch of two original penstocks and the modified power plant penstock No. 2, reconstructed as a desilting tunnel dedicated to sluicing sediment only (not for power generation). As a result, the sluicing discharge increased from 137 to 380 m3/s. Figure 4b shows that the outflow with high sediment concentration is released through modified penstock No. 2, and flood discharge rushed from spillways during the first operation in 2013 Typhoon Soulik. A significant amount of sediment was discharged into the downstream river through the outlet. The measured outflow sediment volume through the modified power plant penstock outlet was 6.65% of the total inflow sediment volume during this flood event (see Table 1). The outflow sediment sizes were classified as silt and clay [45]. In the major typhoon flood events following 2013, the average total desilting efficiency of the outlets with the modified power plant penstock is 32.26 percent, as shown in Table 1. In general, the higher outflow sediment concentration is observed through the low-level outlets according to the field measurement.

2.2.2. Amuping and Dawanping Desilting Tunnels

For flood control purposes, the increment of the design flood discharge has always been a concern due to the uncertainty of hydrological conditions. Besides considering the flood diversion capacity of a reservoir, sediment reduction is the other key issue while diverting the flood discharge to the downstream river. As mentioned in Section 2.2, Plans B and C have been proposed to construct the sediment bypass tunnels, including the Amuping desilting tunnel and the Dawanping desilting tunnel.
Under the Plan B project, the Amuping desilting tunnel currently under construction will be finished in 2022, and its layout is presented in Figure 5a. The Amuping desilting tunnel of 4.2 km long is located at the middle reach of Shihmen Reservoir, where its intake crest elevation is EL. 210 m with three radial gates of width 5.3 m and height 6.5 m. The design discharge is 600 m3/s at the normal water level EL. 245 m. A dredging operation is planned to remove the coarser sediment deposits around the intake in the middle reach of the reservoir by transporting the dredged materials to the settling basin. It provides flood discharge to flush sediment disposal for replenishment with a maximum disposal volume of 0.32 × 10³ m3 in the settling basin. At the end reach of the tunnel, as shown in Figure 5b, the settling basin is 600 m long and 62 m wide, which is divided into three channels. From experimental results, sediment removal by lateral erosion is accomplished by supplying overflow water from two side weirs with relatively low discharge [46,47].
The project of Plan C, the Dawanping desilting tunnel located downstream reach of Shihmen Reservoir near cross-section 12, shown in Figure 5a, is under the planning stage, which is proposed for completion in 2030, to increase the flood diversion discharge of 1600 m3/s and bypass sediments. The preliminary designed tunnel is divided into the intake segment, the intake tunnel segment (formed by two parallel 115.65 m elephant-trunk-shaped steel pipes), the gate-and-shaft segment, the tunnel segment, and the outlet segment. The centerline elevation at the inlet is EL. 195.0 m. The gate-and-shaft segment also consists of two parallel flow passages, each equipped with one vertical slide gate of width 6 m and height 9.3 m, and with one radial gate of width 6 m and height 8.3 m. The two flow passages then combine into a single tunnel of 13 m diameter. Finally, flow is discharged into Afterbay by the flip bucket at the outlet. The function of the Dawanping desilting tunnel is planned for turbidity current venting and muddy lake desilting [48]. Due to intake elevation and muddy lake consolidation, the Dawanping desilting tunnel outperforms the Amuping desilting tunnel in terms of outflow sediment desilting efficiency.

3. Methods

Reservoir storage capacity varies as a consequence of hydrological conditions and sediment management. Two assessment indexes related to the reservoir capacity, the annual inflow discharge and annual inflow sediment, are applied and analyzed for selecting suitable desilting techniques in a newly designed or existing reservoir. The flood caused by a typhoon or heavy rainstorm event usually brings a massive amount of sediment to a reservoir from its watershed. Therefore, the Brune curve approach is adopted to estimate the annual sediment trapping efficiency and calculate the actual deposition volume and available storage capacity. The projection of annual water resources demand can then be assessed by storage capacity preserved. A hydromorphological model is used to simulate sediment concentration and the floodwater level variations under reservoir desilting operations, evaluating the impacts on the downstream river.

3.1. Assessment Indexes of Sediment Desilting Techniques

Two indexes, CIR and CSR, were proposed by Basson and Rooseboom (1997), which were further implemented to evaluate desilting techniques based on hydrological data and storage capacity in many reservoirs [26]. The capacity–inflow ratio (CIR) is defined as the reservoir capacity (CAP) divided by the mean annual runoff (MAR), and the capacity–sediment ratio (CSR) is defined as the CAP divided by the mean annual sediment (MAS). Based on CIR and CSR values, desilting techniques applied to the major reservoirs in Japan and Taiwan are presented in Figure 6. Accordingly, reservoir life may be indicated by the CSR value, and the CIR value may indicate the residence time of water [30].
By employing these two indexes to delineate ranges, it was found that the upper and lower bounds of CIR values were 0.3 and 0.02, respectively, for the sluicing or bypassing technique [26,29]. More data were acquired later from Japan and Switzerland, with the upper and lower bounds of CIR values estimated to be 0.3 and 0.04, respectively [23,32,49]. Furthermore, employing the updated data collected in 2020 from Taiwan cases, as shown in Figure 6, the upper and lower bounds of CIR values obtained are 0.4 and 0.04, respectively, considering the original design capacity and the existing storage capacity. Based on hydrological data, a reservoir with an estimated CIR value higher than 0.4 contributes less annual runoff, which provides low potential by using hydraulic desiltation; hence, only mechanical removal or watershed conservation could be suitable for sediment management strategies. On the other hand, if CIR is lower than 0.04, the reservoir has a large volume of inflowing water compared to the reservoir capacity, which offers high potential for hydraulic desilting; hence, sediment flushing could be an effective drawdown operation technique. If CIR ranges between 0.04 and 0.4, sediment flushing is less suitable because of insufficient annual runoff; instead, sediment bypassing and sediment sluicing could be adopted. However, these two techniques cannot remove accumulated deposits; mechanical removal could complement the storage capacity recovery. Referring to the report studied by Mahmood (1987) [8], the global average sedimentation rate was estimated at 1% annually, implying the CSR value of 100, i.e., the reservoir can accommodate sediment for an expected reservoir life of about 100 years. A higher CSR value indicates that the reservoir capacity could have more space for deposited sediments and does not require immediate sediment removal. In other words, if a reservoir with a CSR of lower than 100, sediment reduction is more urgent by equipping the desilting techniques for sustaining reservoir life.
Compared with the design capacity (i.e., initial storage capacity), the existing storage capacity of each reservoir decreases due to sedimentation, which leads to the decrease of two indexes, CIR and CSR, as revealed in Figure 6. For example, the sediment management strategies of Zengwen, Baihe, and Nanhua Reservoirs in Taiwan were initially classified as adopting watershed conservation or mechanical removal. However, serious sedimentation problems have caused the data points to shift the desilting technique to sediment bypassing or sediment sluicing in these three reservoirs. Another case of Dapu Reservoir in Taiwan was initially classified in the sediment sluicing strategy category. The shift in the desilting technique due to sedimentation is seen in the Dapu reservoir as well, where sediment flushing is employed to reclaim storage space occupied by sediment deposits. Thus, it indicates that the current active storage capacity needs to be considered while planning sediment management for a reservoir. Recently, besides dredging and dry excavation, desilting techniques of sediment flushing or sediment bypassing have also been applied in many reservoirs in Japan. Flushing for Dashidaira and Unazuki Reservoirs, bypassing for Asahi, Miwa, Koshibu, and Matsukawa Reservoirs, as shown in Figure 6, are a few such examples from Japan. Thus, the integrated approaches for restoring effective sediment transport in the routing system from mountains to coastal areas have been initiated [30,33].

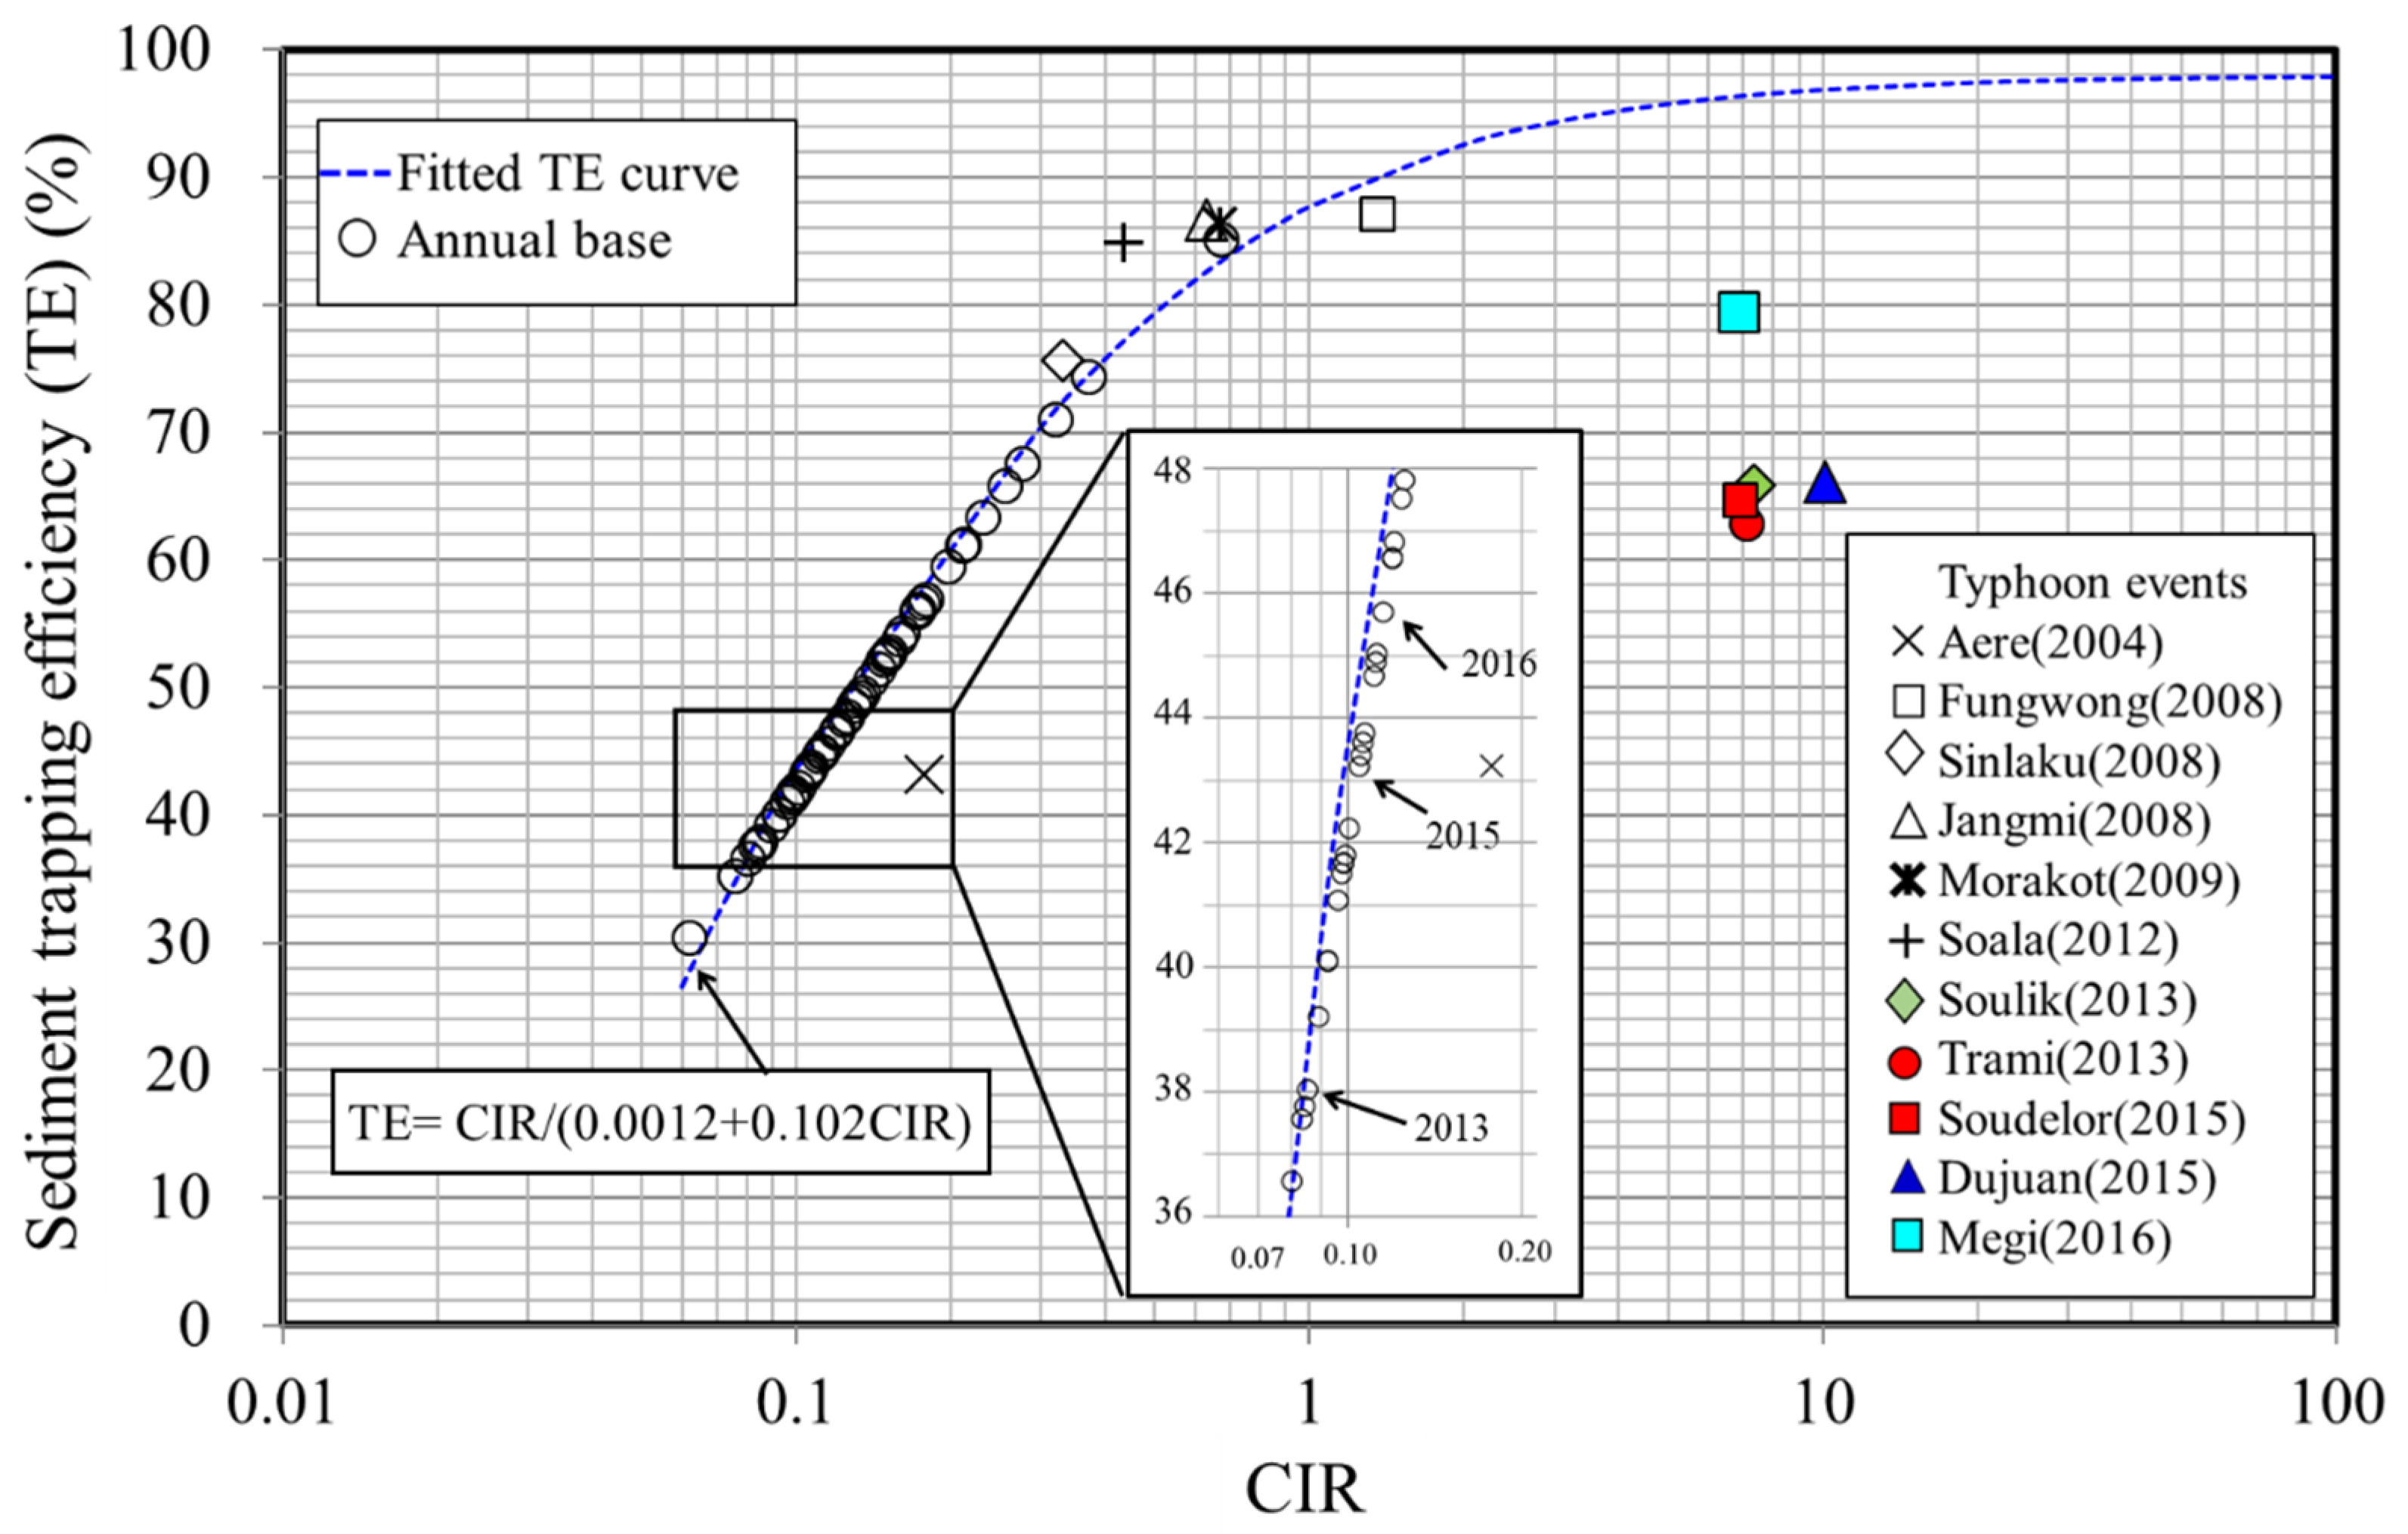
3.2. Brune Curve Approach for Trapping Efficiency

The sediment trapping efficiency (TE) is used to calculate the actual deposition volume and remaining storage capacity, which is a valuable and straightforward parameter for evaluating the life expectancy of a reservoir. The sediment trapping efficiency is expressed as the ratio of annual sediment deposition volume to incoming annual sediment volume. Analyzing the measured data of 44 reservoirs in the U.S., Brune (1953) [50] developed an empirical curve that has been the most widely adopted method for assessing reservoir trapping efficiency [51,52]. The sediment trapping efficiency presents a trend relationship with the CIR index based on the curve approach, which can be fitted by a curve equation as plotted in Figure 7. Using the data collected from Shihmen Reservoir, the sediment trapping efficiency agrees with the tendency of the Brune curve under an annual temporal scale. However, the trapping efficiency may differ significantly from the Brune curve for one flood event with a desilting operation. As a result, the sediment trapping efficiency varies between an annual temporal scale and a single typhoon flood event. When multiple flood events occur in a year, the sediment trapping efficiency follows the Brune curve trend, as seen in 2013, 2015, and 2016 (see Figure 7). Moreover, different hydrological conditions may occur in sediment desilting operations during flood events. The trapping efficiency corresponding to one flood event may not fall close to the Brune curve. Therefore, the annually based calculation is suggested to estimate the annual sediment trapping efficiency for planning desilting strategies. The annual sediment deposition volume in a reservoir can be estimated by using the Brune curve approach. Since some reservoirs may have a dredging or excavation plan in execution, one needs to calculate the actual deposition volume to avoid underestimating inflow sediment.

3.3. Hydromorphological Model

After completing the installation of modified power plant penstock and the future construction of the desilting tunnels at Shihmen Reservoir, there should be a reduction in the sedimentation problem to sustain the storage capacity. However, the impact on the downstream river due to sediments released by hydraulic desiltation or mechanical removal from the reservoir needs to be evaluated. Herein, hydromorphological modeling is performed to simulate the spatial variation of sediment concentration, riverbed aggregation/degradation effects, and floodwater levels along the downstream river.
A hydromorphological model can simulate water and sediment interaction to determine sediment concentration and riverbed variations in a flood. In the present study, the NETSTARS model developed by Lee and Hsieh (2003) [53] is employed to simulate the impacts on the downstream rivers during the sediment desilting operation at Shihmen Reservoir. The NETSTARS model is a movable-bed sediment routing model consisting of hydrodynamics and sediment transport. In the model, suspended load and bed load are treated separately in sediment transport simulation. Hence, it can simulate the depositional behavior of the suspended sediment under a nonequilibrium process. In addition, sediment transport formulas and convection–dispersion equations are used to transport sediment mixtures of different grain sizes, accounting for hiding and exposure effects through empirical relations. The governing equations for mobile-bed simulation can be solved numerically, consisting of the sediment continuity equation, convection–dispersion equation, and bed load transport equation. The sediment continuity equation is given as:
( 1 p ) A d t t + x k = 1 N s i z e Q C k + Q b x = 0
where p = river bed porosity, Adt = amount of sediment scouring/deposition per unit length, Q = flow discharge, C k = depth-averaged concentration of the suspended sediment of size fraction k, and Qb = bed load transport rate. The bed load transport rate Qb equals to k = 1 N s i z e Q b k ; where Qbk is defined as the bed load transport rate of size fraction k. The concentration C k is calculated using the convection–dispersion equation, which is expressed as:
( C k A ) t + x ( C k Q ) = x ( A k x C k x ) + S k + ( h k z C k z )
where A = river cross-sectional area, kx and kz = longitudinal and transverse dispersion coefficients, the relations kx = 5.93 h u* and kz = 0.23 h u*, h = water depth, and Sk = source term of the suspended sediment of size fraction k. The Rouse number wu* is used to distinguish between bed load and suspended load, where w = sediment fall velocity, κ = Von Karman constant, and u* = shear velocity. Particles with wu* ≤ 5 are treated as suspended load, and particles with wu* > 5 are treated as bed load.
The evaluation of model performance is undertaken to produce compelling results through comparison to an analytical solution, multiple hydraulic physical model test results, and application to the Tamsui River basin in Taiwan. Since the NETSTARS model is one-dimensional, the secondary current and local scour near the hydraulic structures cannot be simulated. However, the transverse bed evolution can be estimated using the stream tube concept to satisfy equal conveyance requirements across the river section [53,54].
The downstream river impacts are investigated from the boundary at the downstream side of Shihmen Dam to the river mouth. The Tamsui River basin and specific locations of structures can be seen in Figure 1. In the Tamsui River basin, the upstream boundary locations for the three tributaries are imposed at Afterbay, Jhihtan Dam, and Jieshou hydrological station. The upstream boundary conditions are derived from field monitoring data by a regression formula of the discharge and sediment load relationship. The water level of downstream boundary conditions at the river mouth is set by using the monitoring data of tidal height. In addition, based on the riverbed material survey in the Tamsui River basin, the sampled sediment grain size d50 ranges from 10 to 100 mm in the river reach from Chenglin Bridge (at river-section 47, about 30 km from the river mouth) to Afterbay. The grain size d50 ranges from 0.0001 to 1 mm in the river reach from Chenglin Bridge to the estuary [48]. The floodwater level and sediment transport in the Tamsui River basin are simulated using the NETSTARS hydromorphological model to investigate downstream river impacts caused by desilting operations.

4. Results and Discussions

Water–sediment transport through the river system is significantly interrupted by the dam. The accumulated sediment deposition volume is analyzed for the projection of storage capacity at Shihmen Reservoir in the next five decades. The projection of the reservoir storage capacity with/without the scheduled desilting projects is evaluated and discussed to assess the suitability of desilting techniques by CIR and CSR indexes for Shihmen Reservoir in the long-term base. The projection of water demand with/without the planned desilting projects is estimated to evaluate the turnover rate in the future years. It is critical to consider downstream river impacts caused by reservoir desilting operations. The floodwater level and sediment concentration variations are simulated and evaluated for flood risk along the downstream river reaches. The integration of the water–sediment management from Shihmen Reservoir through the downstream river to the river mouth is analyzed and discussed in the following sections.

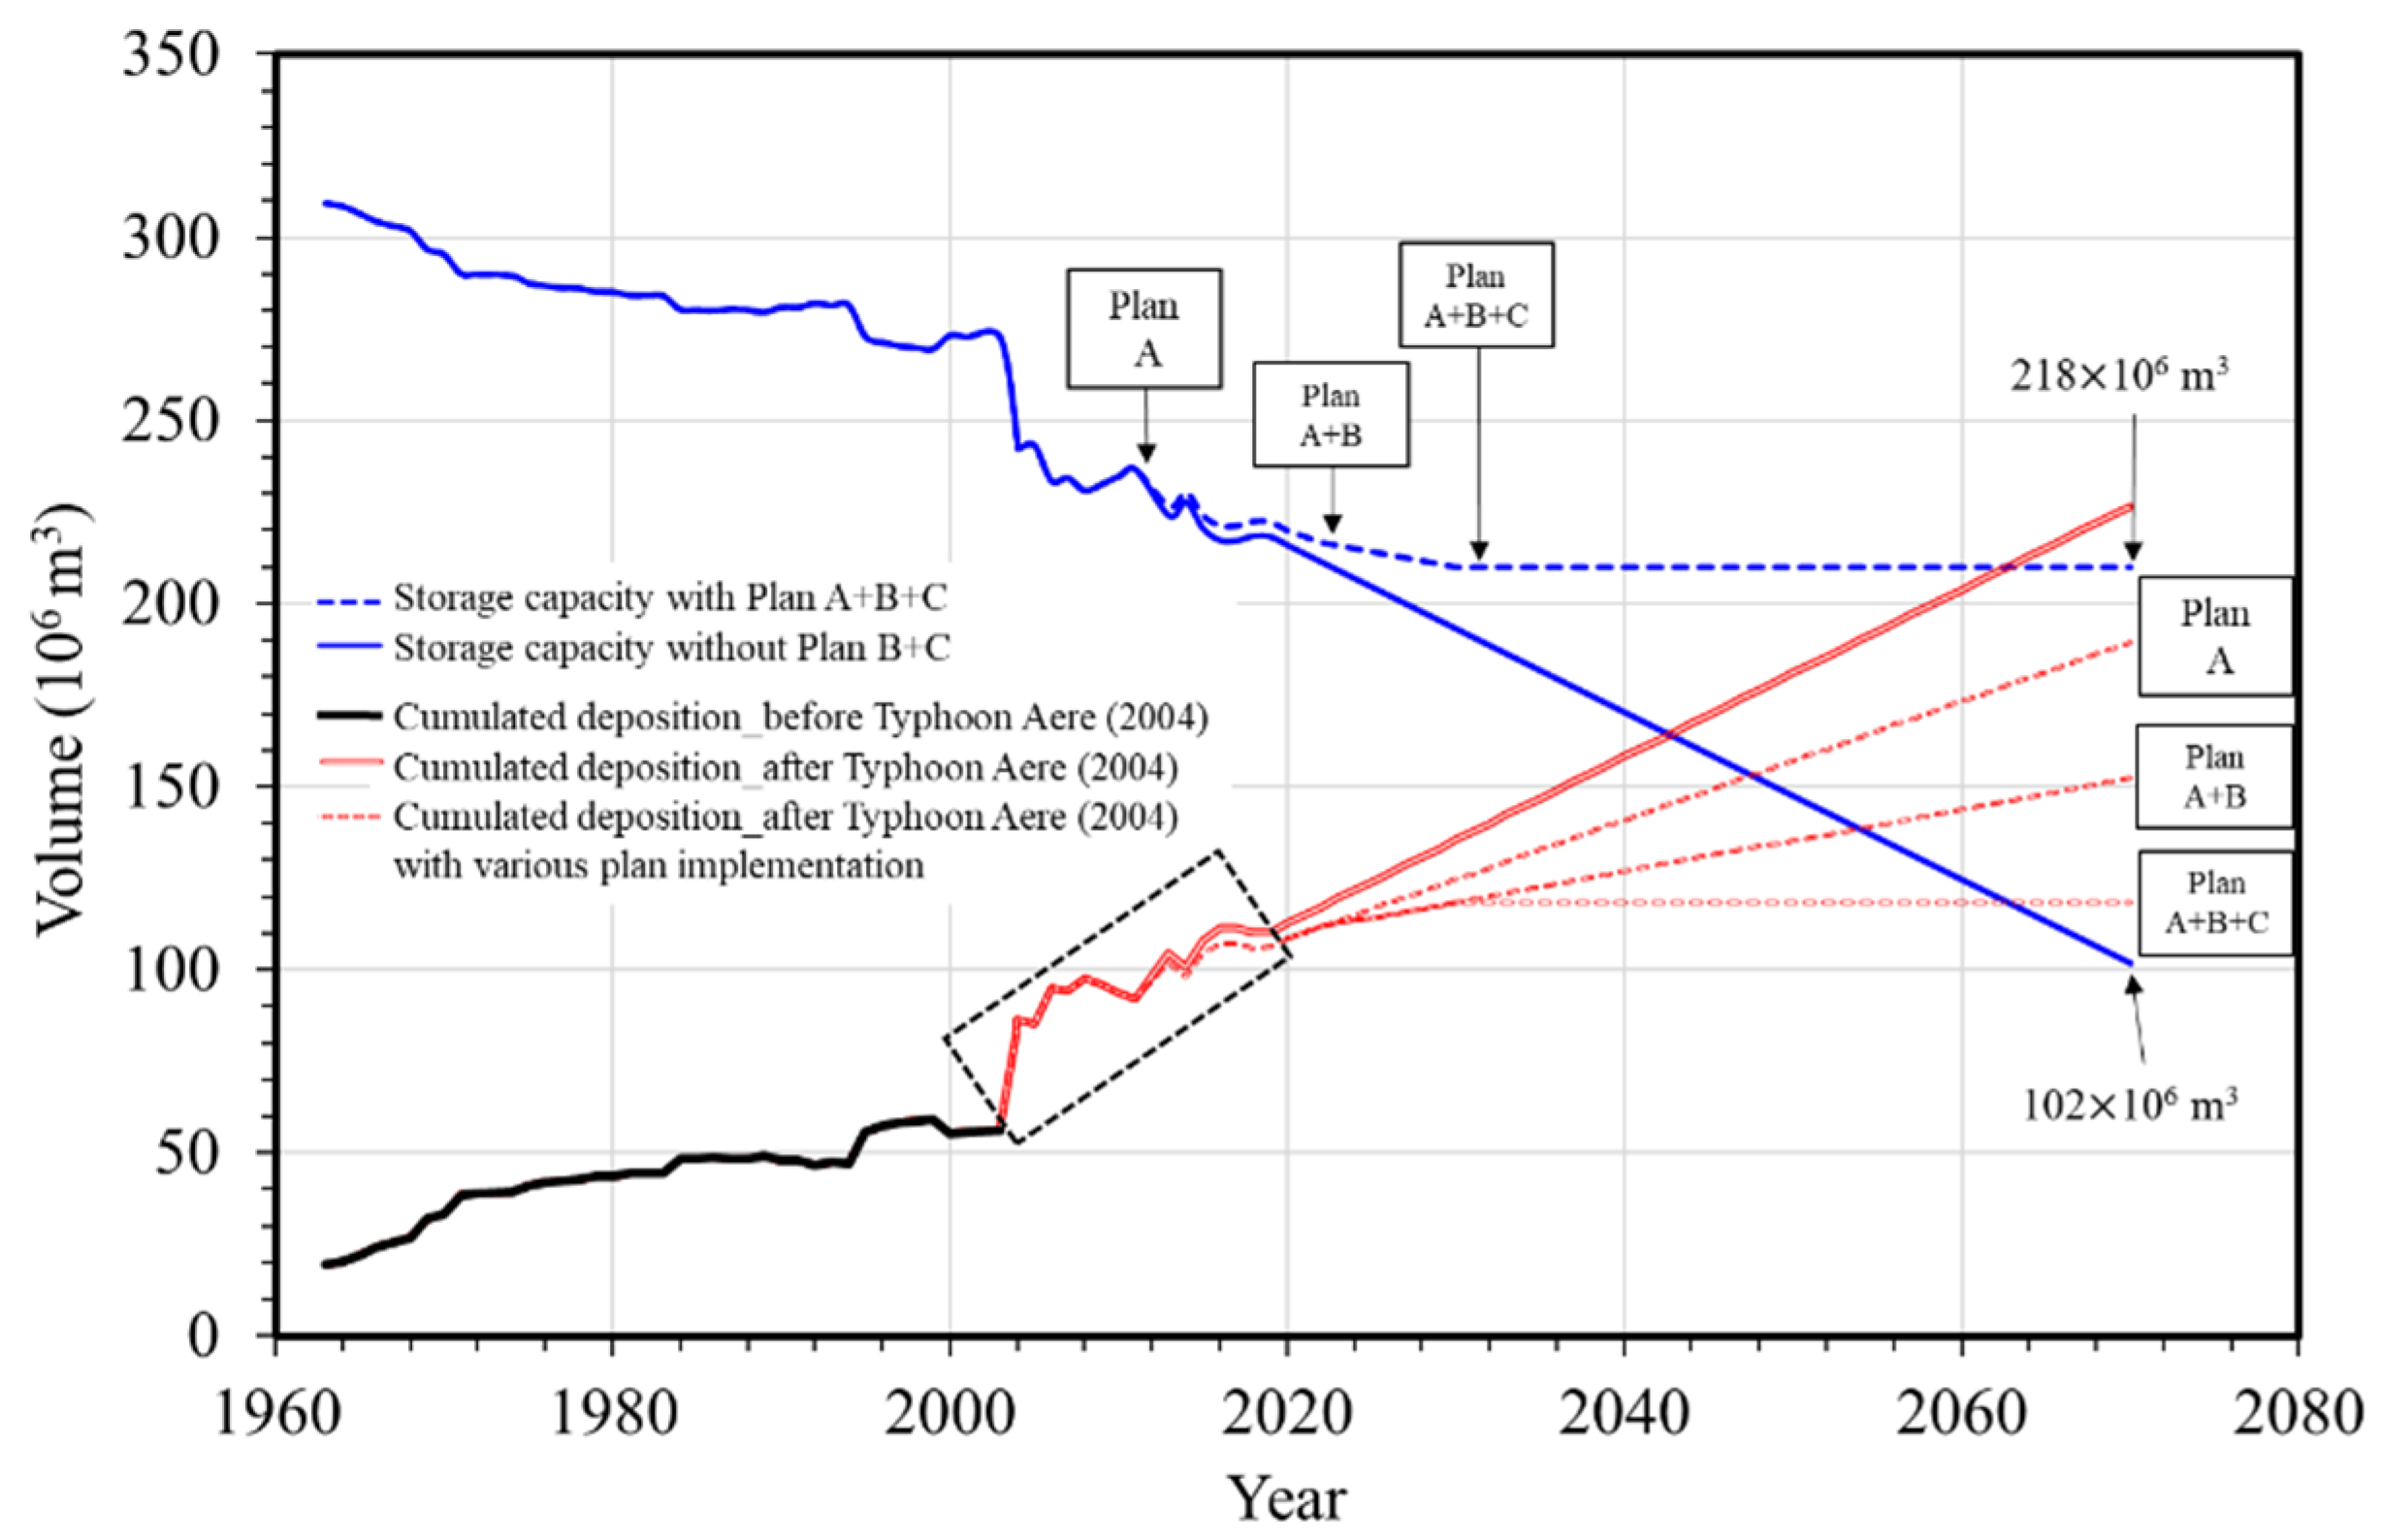
4.1. Long-Term Projection of Storage Capacity under Sediment Management

Projections of storage capacity and cumulated sediment deposition volume at Shihmen Reservoir for the next five decades under various desilting strategies are analyzed and plotted in Figure 8. It is considered that mechanical removal by dredging and dry excavation is regularly applied for the next fifty years. Besides mechanical removal, Plan A, B, and C projects by hydraulic desilting measures are adopted for sustainable water usage. Since 2013, when project Plan A was implemented by installing the modified power plant penstock, the total desilting efficiency based on field-measured data presents an average value of about 32.26% listed in Table 1, higher than that of those without the modified power plant penstock. As mentioned in Section 2.2, the expected desilting efficiency of 34.2% is designed in Plan A with the modified power plant penstock, which is close to the value (32.26%) taken from the measured data. Plans B and C propose to construct the facilities for sediment bypassing, including the Amuping desilting tunnel and the Dawanping desilting tunnel, which will be completed in 2022 and 2030, respectively. According to data obtained from the Water Resources Planning Institute and Northern Region Water Resources Office [42,43,44], the desilting efficiency for Plans B and C is estimated to be 18.7% and 20.8%, respectively.
Based on the average deposition rate of 3.42 Mm3/yr after Typhoon Aere (see Figure 2), the trend line of cumulative sediment deposition volume in the next fifty years is illustrated in Figure 8. It indicates that without effective sediment management strategies, the projected storage capacity applied may drop to 102 Mm3 (about 32.9% of the initial storage capacity) in 2070. When Plan B is implemented to join the desilting operation in 2022, the trend line of cumulative sediment deposition volume in the next fifty years presents a mild slope in Figure 8. Similarly, when Plan C is completed in 2030, it presents a flat trend line corresponding to the storage capacity changes. Therefore, if the integrated sediment management strategies can be implemented by following the planned schedule mentioned above, the sustainable management of water resources may be achieved to preserve 218 Mm3 of the reservoir storage capacity in 2070, which is about 70.3% of the initial storage capacity.
To evaluate the desilting techniques employed in Shihmen Reservoir, assessment indexes CIR and CSR are calculated and discussed using the future trend of storage capacity in Figure 8. Based on index classification in Figure 6, the CIR and CSR values using the existing reservoir capacity of Shihmen Reservoir are calculated to be 0.15 and 115, respectively. Thus, it indicates that implementing desilting operation by sediment sluicing or bypassing is suitable for Shihmen Reservoir. According to three desilting projects mentioned in Section 2.2, the authority of Shihmen Reservoir has currently performed Plan A (i.e., with the modified power plant penstock by adopting sediment sluicing technique). In contrast, they have carried on Plans B and C (i.e., Amuping desilting tunnel and the Dawanping desilting tunnel) by adopting sediment bypassing techniques to minimize inflow sediment deposition. By preserving 70.3% of the initial storage capacity with Plans A + B + C implementation in 2070, CIR and CSR values are calculated to be 0.14 and 111, respectively. Without Plans B + C, CIR and CSR values are calculated to be 0.09 and 73 using the diminishing reservoir capacity (about 32.9% of the initial storage capacity) in 2070. The loss of capacity causes the decrease of the index values. The CIR value ranges between 0.04 and 0.4, thus adopting sediment bypassing and sluicing measures in Shihmen Reservoir is still suitable (see Figure 6). However, the CSR value drops from 115 (existing capacity in 2020) to 73 (without Plans B + C in 2070), indicating the expected reservoir life decrease due to a significant loss of storage capacity. As a result, using appropriate desilting techniques to reduce sediment is more crucial than ever for preserving reservoir life. Finally, in this study example, the index assessment approach for assessing suitable desilting techniques proves to be a valuable tool in reservoir sediment management.

4.2. Long-Term Projection of Water Demand under Sediment Management

Shihmen Reservoir provides storage space as a natural resource for irrigation and water supply. The historical data of various demands per year from irrigation, public water supply, and industrial water since Shihmen Reservoir was built are plotted in Figure 9. In 2020, as seen in Figure 9, the total water demand is approximate 3.3 times the reservoir storage capacity, i.e., the annual turnover rate of water demand is 3.3. Herein, the annual turnover rate of water demand is defined as the ratio of the annual total water demand volume to the existing reservoir storage capacity. Based on the latest statistical data of the population projection by the National Development Council, Taiwan, and the projected water resource usage by WRA, Taiwan, the water resources demand will diminish in the next fifty years, corresponding to population decrease.
Under the current situation of sediment management in 2020, reservoir storage capacity tends to decrease due to severe sedimentation with Plan A only (see Figure 8). Suppose storage capacity continues to decline after 2020 without implementing Plans B+C. In that case, the total water demand provided by Shihmen Reservoir might reach 5.8 times storage capacity in 2070, as shown in Figure 9. It indicates that the projected storage capacity in 2070 needs to be filled 5.8 times to meet the demands of water resources. However, if there is no effective operational planning of sustainable strategies, water resource utilization would face a high-risk challenge in the future, especially with the uncertainty of hydrological conditions. Therefore, planning desilting strategies for Shihmen Reservoir is a vital task of sediment management, which can help water resource allocation and mitigate water scarcity. Moreover, if Plans A + B + C follow the project schedule, in that case, the annual turnover rate of water demand in 2070 is 2.7 (see Figure 9), i.e., the total water demand supplied by Shihmen Reservoir requires to be 2.7 times reservoir storage capacity. It indicates that the annual turnover rate of water demand projected in 2070 is less than that in 2020, demonstrating that the integrated sediment management strategies have proven quite successful.

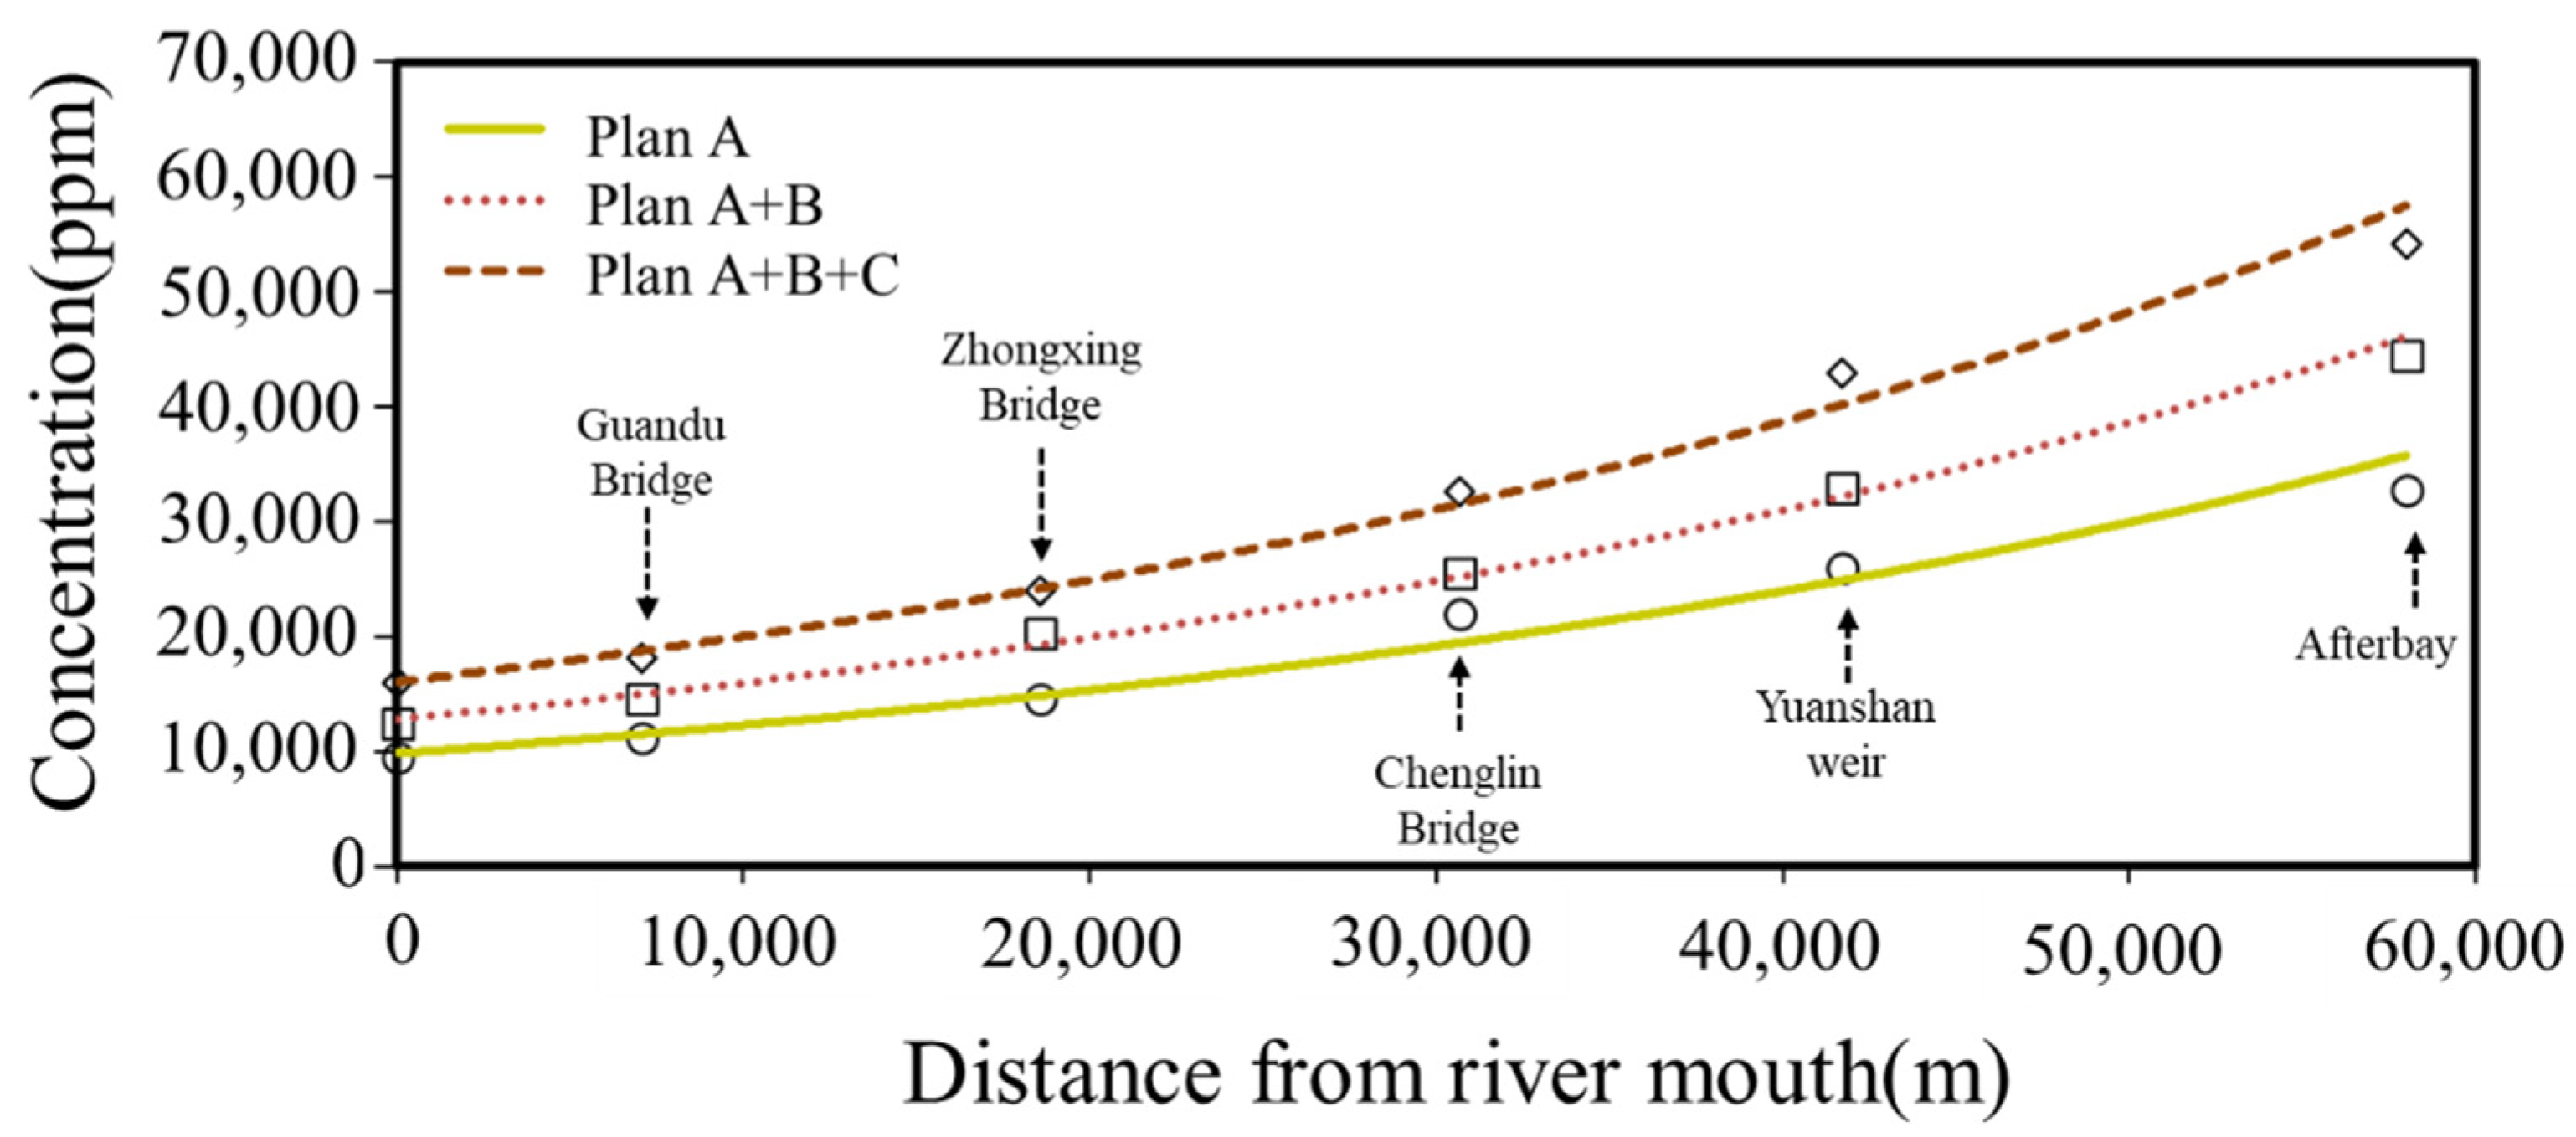
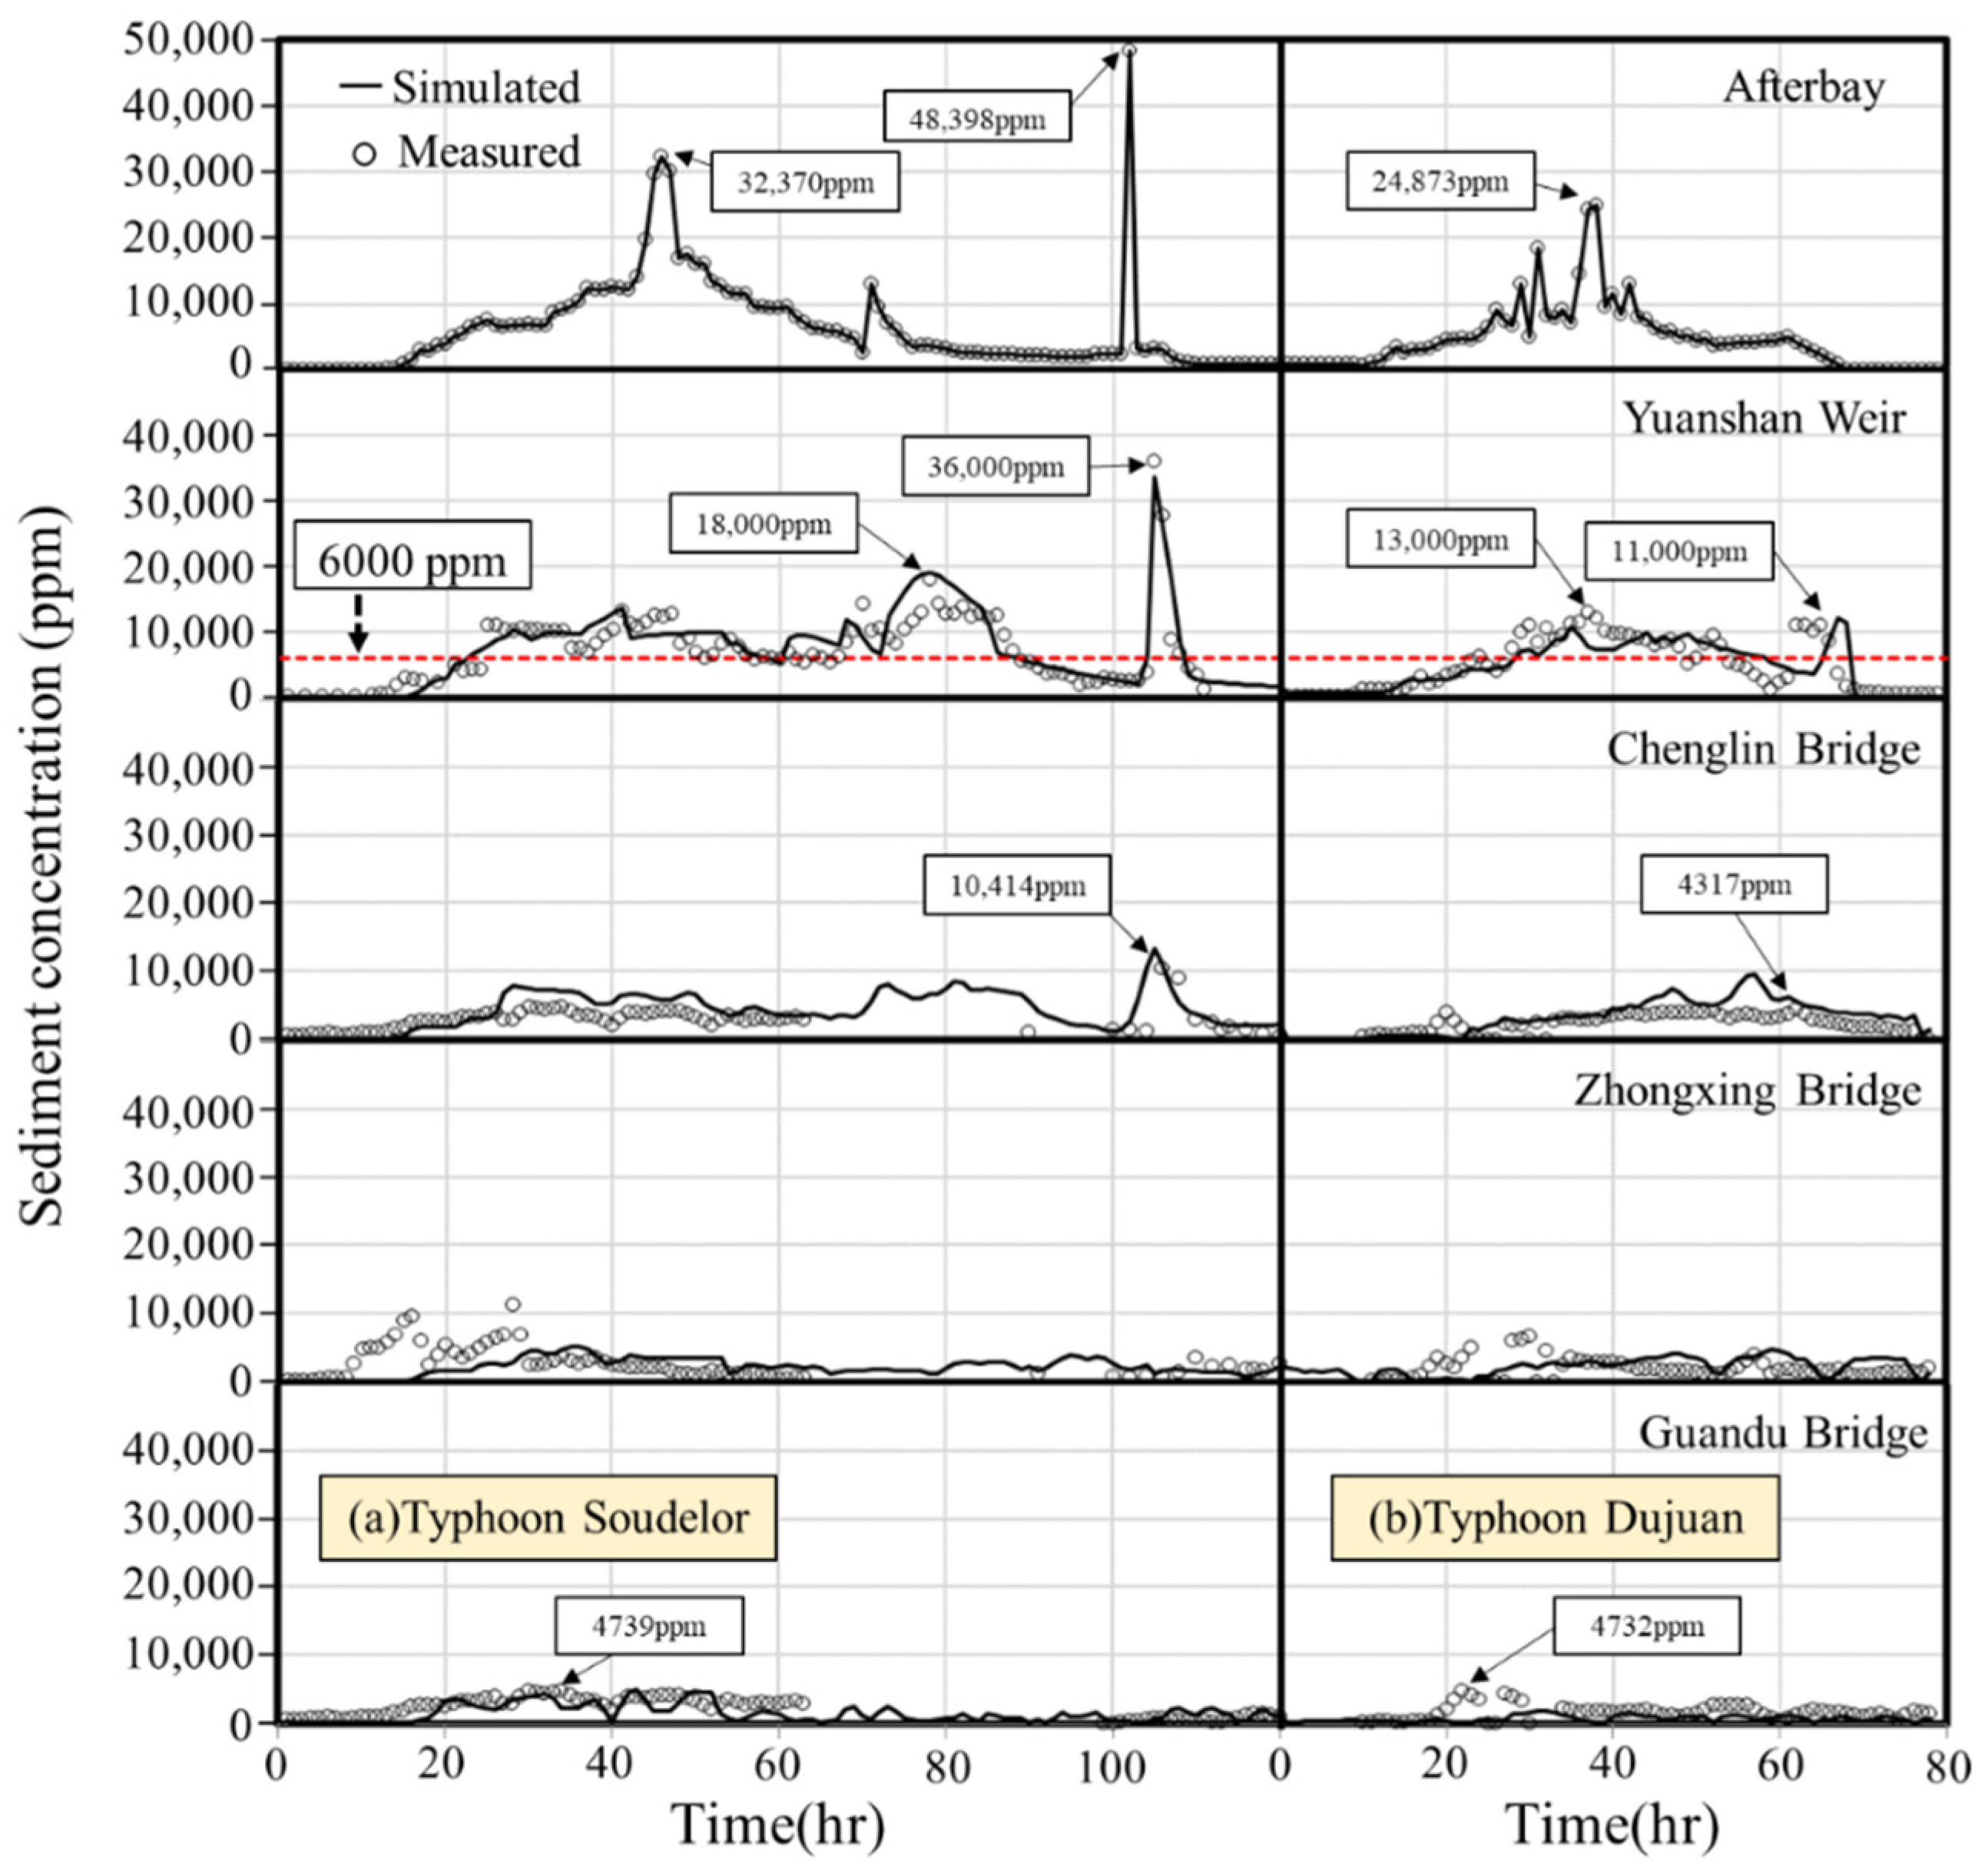
4.3. Sediment Concentration Variations in the Downstream River during the Flood Event

The modified power plant penstock has been operational since 2013 by sluicing sediment in turbidity current venting to reduce sediment deposition rate. Based on the measured total desilting efficiency through outlets from 2013 to 2016 as listed in Table 1, the operational results are close to the planned desilting strategy of Plan A described in Section 2.2.1. The average total desilting efficiency after 2013 reached 32.26%, i.e., about one-third of inflow sediments were sluiced out of the reservoir annually. As a result, a significant amount of sediment released from the outlets caused immediate water quality problems at the downstream water supply intakes, located at Afterbay and Yuanshen Weir (at river-section 65, approximately 16.5 km downstream from Afterbay, as shown in Figure 1), downstream of the Shihmen Dam. Therefore, the desilting operation timing of the modified power plant penstock is regulated by water treatment plant limitations. According to the capabilities of the Bansin Water Treatment Plant, turbid water can be treated while the sediment concentration is lower than 6000 mg/L. The reduction of sediment concentration released from Shihmen Reservoir to the Yuanshan Weir is approximately 90% [55]. Hence, the outflow sediment concentration released from Afterbay is constrained to 6667 mg/L as a prerequisite for the Bansin Water Treatment Plant [56]. Therefore, considering the water storage and treatment capacity of the Bansin Water Treatment Plant, the duration of desilting operations is restricted due to the sediment concentration released. In addition, the conditions of Typhoon Soudelor and Typhoon Dujuan in 2015 are applied as study events to calibrate and verify the numerical model.
Figure 10 illustrates hydrographs of the measured and simulated sediment concentration against time in the Typhoon Soudelor and Typhoon Dujuan events which involved 130 and 90 h durations of flooding, respectively. In Typhoon Soudelor, the measured data at Yuanshan Wier reveal that the peak sediment concentration reaches around 36,000 mg/L at the third time desilting operation, and sediment concentration is much higher than 6000 mg/L most of the time (see Figure 10a). During sluicing operations, sediments were released through the spillways, the tunnel spillways, the bottom outlet, and the modified power plant penstock during the flood events. In addition, the outflowing sediments were sampled and classified as silt and clay, which could affect the water quality of the intake at Yuanshan Weir due to exceeding the raw water turbidity limitation of 6000 mg/L. The simulated results in both flood cases indicate that fine sediments could be transported far downstream to the Chenglin Bridge within the tidal river reach and the Guandu Bridge near the river mouth, as shown in Figure 10a,b. In addition, based on the grain size, such fine sediment released from Shihmen Reservoir may affect the deposition mechanism in the tidal river reach. However, when the released turbid water flows into the tidal-affected area, the sediment concentration can be lower than 6000 mg/L due to flow mixing with the floodwater from the tributaries of the Xindian River and Keelung River. The sediment concentration varied throughout the downstream river during these two flood events. Although sediment concentration released from outlets during the desilting operations could be relatively high, it decays gradually along the downstream river. Furthermore, the simulated sediment concentration variations against time agree well with the measured data, demonstrating good performance of the model.
After model validation, the hydrological conditions of Typhoon Aere in 2004 are utilized to investigate and discuss the changes in the trend of sediment concentration along the downstream river of Shihmen Reservoir before and after the completion of the power plant penstock modification (Plan A), the Amuping desilting tunnel (Plan B), and the Dawanping desilting tunnel (Plan C). Since the construction of the dam, Typhoon Aere caused the most severe sedimentation problem in Shihmen Reservoir. Following various scenarios, the simulation analysis of peak sediment concentration at different locations along the river is plotted in Figure 11. After completing the Amuping desilting tunnel and the Dawanping desilting tunnel, the simulated results for concentration released at Afterbay indicate that the sediment concentration of Plans A + B + C increases about 1.6 times that of Plan A. The simulated sediment concentration in the estuary is about 30% of that at Afterbay in the scenario of Plans A + B + C. The spatial variation of sediment concentration along the downstream river presents an exponential trend line from Afterbay to the river mouth. Herein, the simulated results from hydromorphological modeling are reasonable to investigate long-term impacts on the downstream river resulting from reservoir desilting operation.

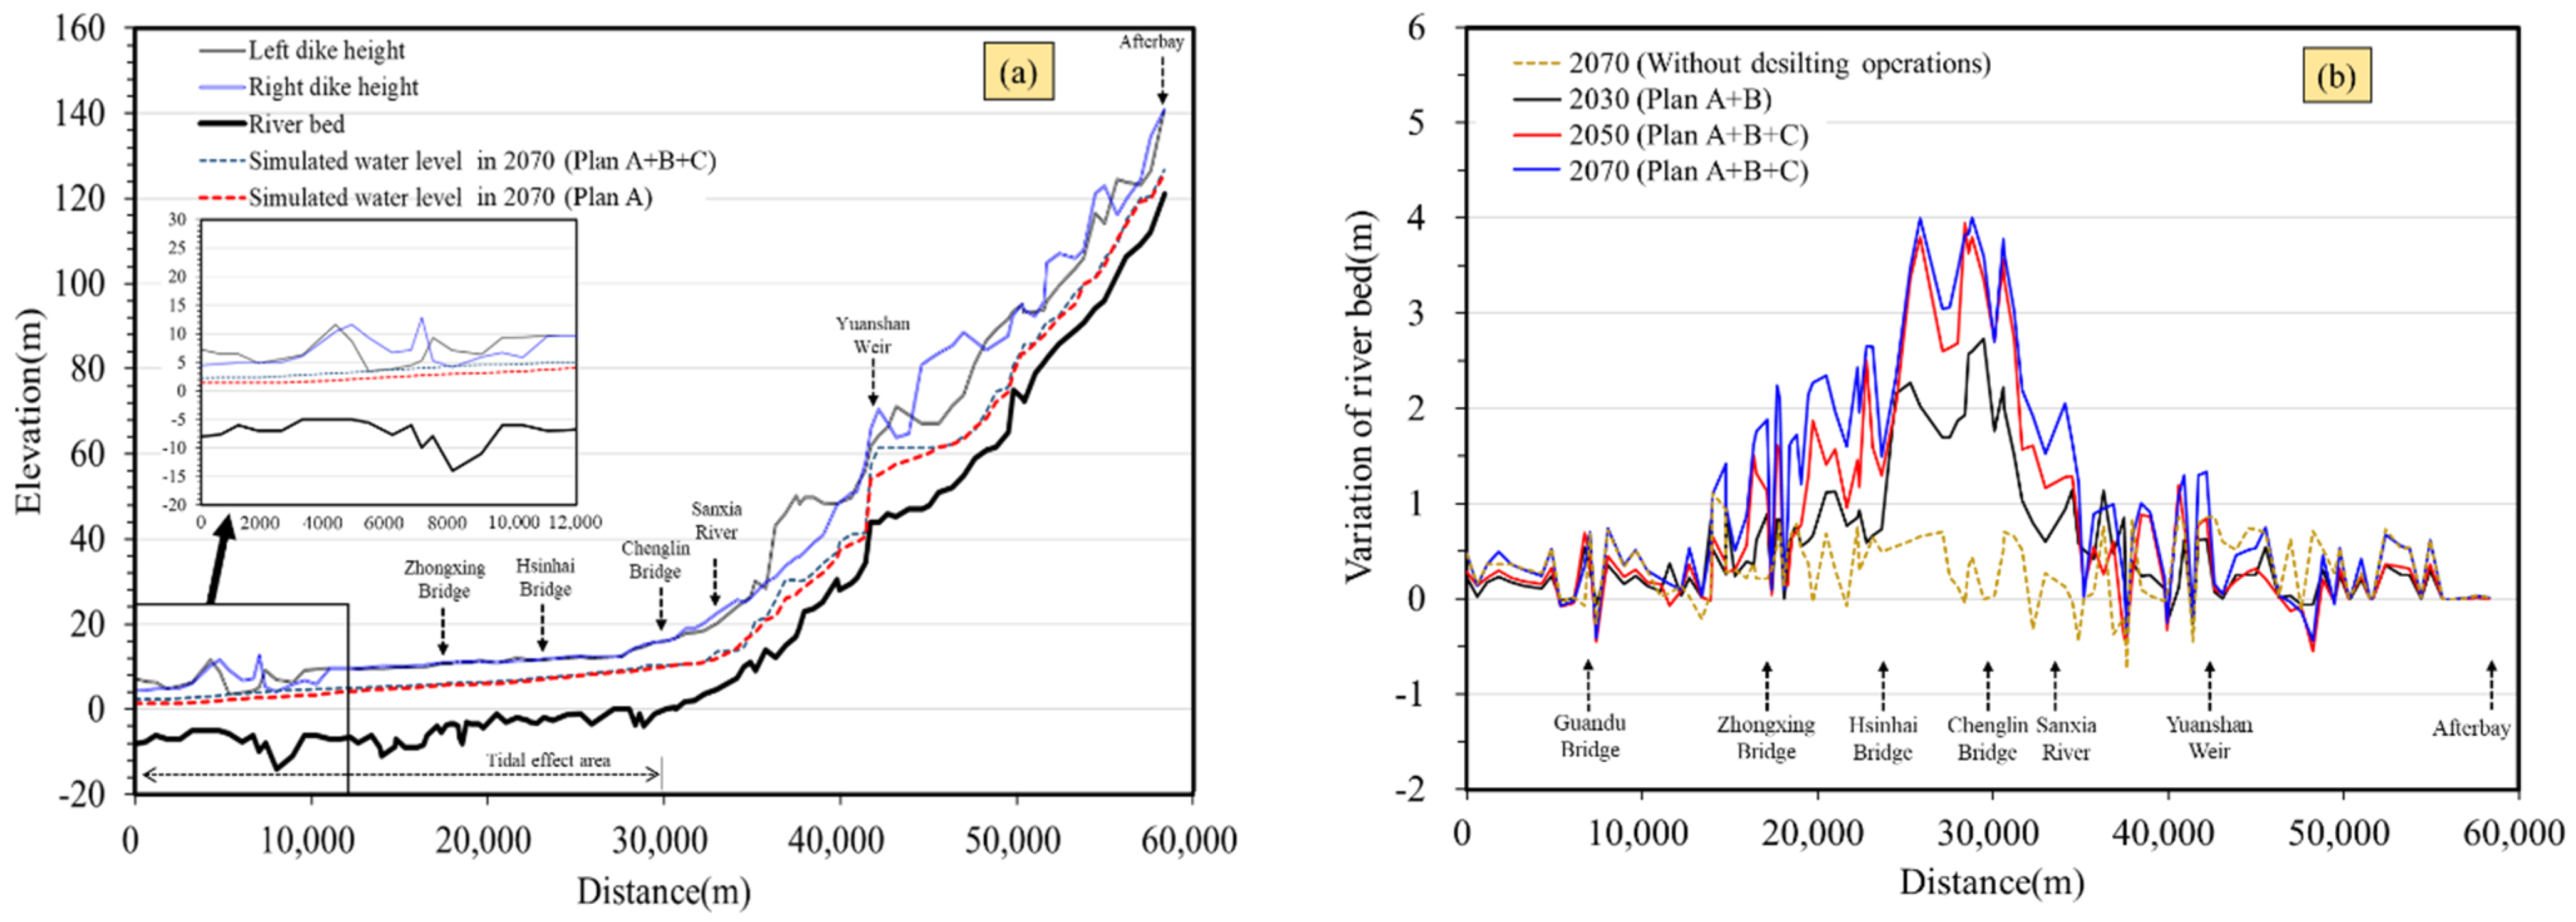
4.4. Long-Term Downstream Impact under Desilting Operation

Since 2013, the modified power plant penstock has been operational in Shihmen Reservoir for sluicing sediment during typhoon events. Abundant sediment was released by desilting operation to the downstream river. Adopting the hydromorphological model, the NETSTARS model is employed to investigate long-term hydrodynamic and sediment transport phenomena from the upstream boundaries of three tributaries to the downstream river mouth in the Tamsui River basin. The transportation of sluiced and released sediments along the downstream rivers by the Amuping and Dawanping desilting tunnels is simulated to understand desilting effects. The floodwater stage and riverbed elevation along the downstream river reach are investigated for long-term impacts on levee safety. Levees built along the Tamsui River reduce flood risk to people, businesses, critical infrastructure, and the environment. The typhoon events listed in Table 1 are imposed as the boundary conditions for hydromorphological modeling. It presumes that the hydrological conditions in the past two decades may occur in the future again. The long-term impacts on the downstream river by sediment desilting operations in Shihmen Reservoir during typhoon floods can then be analyzed.
Given the same hydrological conditions of past typhoon events in Table 1, Figure 12a shows the simulated results of long-term floodwater levels. The results show that the floodwater stage in 2070 does not overflow either of the riverbanks from Afterbay to the river mouth, except the river reaches upstream of Yuanshan Weir, and the river reaches around Guandu Bridge. However, if the floodwater stage exceeds the warning water level, evacuation actions need to initiate inundation disaster emergency response. Based on the riverbed elevation in 2020 as a datum, Figure 12b shows simulated riverbed elevation changing along the river thalweg in 2030, 2050, and 2070. The reach from Afterbay to Yuanshan Weir is an exposed rock bed with a steep slope, so sediment deposition is much less than that of the river reach with a gentle bed slope, typically at the reach between Sanxia River and Zhongxing Bridge. However, due to the tidal effect and mild bed slope, more significant deposition is observed in the simulation scenarios with desilting operations of Plans A + B + C. As seen in Figure 12b, between Hsinhai Bridge and Chenglin Bridge, the increment of sediment deposition estimated in the next 10 years is about 1.45 m, in the next 20 years is about 2.26 m, and in the next 50 years is about 2.73 m.
On the other hand, without implementing sediment desilting operations, the increment of sediment deposition estimated between Hsinhai Bridge and Chenglin Bridge presents insignificant deposition only. Moreover, there is a mild tendency of riverbed aggregation within reach between Hsinhai Bridge and Chenglin Bridge. Therefore, the downstream river morphology may adjust toward the equilibrium state in the long-term desilting operations from Shihmen Reservoir. The riverbed deposition does not significantly affect the floodwater level caused by riverbed aggregation. However, climate change may strongly affect the boundary conditions of tidal height rising and watershed precipitation increment. Therefore, further research is needed in the future.

5. Conclusions

Because of highly elevated reservoir sedimentation rates over the years, maintaining the storage capacity of the existing reservoir is crucial for sustainable water resources. Implementing functioning desilting techniques to alleviate sedimentation problems is essential for reservoir sediment management. In the case study at Shihmen Reservoir, extreme floods caused by typhoon events brought a massive amount of sediments from the upstream watershed. The storage capacity of Shihmen Reservoir in 2020 was estimated to be 66.03% of its initial capacity due to the lack of sufficient desilting outlets to release incoming sediment during flood events. Three desilting projects have been scheduled and initiated by adopting sediment sluicing and bypassing strategy to minimize inflow sediment settling and maintain the storage capacity. According to experimental and field data obtained from the physical model and in situ measurements in the previous study, the hydraulic desilting efficiency for Plans A, B, and C is estimated to be 34.2%, 18.7%, and 20.8%, respectively. Besides hydraulic measures, mechanical removal by dredging and dry excavation is introduced as part of the integrated strategies.
In the present study, two indexes, the capacity–inflow ratio (CIR) and the capacity–sediment ratio (CSR), are applied to assess the feasibility of various desilting techniques. The annual sediment trapping efficiency estimates the annual sediment deposition volume by the Brune curve approach. CIR is calculated using the future trend of storage capacity, which ranges between 0.04 and 0.4. Thus, adopting sediment bypassing and sluicing techniques will continue to be appropriate for the next fifty years as well. Moreover, the CSR value drops from 115 (existing capacity in 2020) to 73 (without Plans B + C in 2070), indicating a decrease in the expected reservoir life due to a significant loss of storage capacity. Therefore, sediment reduction is crucial to the long-term viability of the reservoir. In addition, based on the latest statistical projections of population and the water resources demand, the analysis of the annual turnover rate of water demand in 2070 with and without Plans B + C is found to be 2.7 and 5.8, respectively. It reveals that integrated sediment management is successful by implementing effective desilting techniques for Shihmen Reservoir to preserve water resources. Notably, the assessment indexes are quite simple and useful for engineering purposes, which provide straightforward concepts as the policy and governance determinants. The index assessment procedure proves to be a valuable tool for evaluating suitable desilting techniques in reservoir sediment management.
For investigating downstream river impacts caused by the desilting operations, the sediment concentration transport and floodwater level variation along the Tamsui River are calculated by the NETSTARS model for modeling hydromorphological processes. Although relatively high sediment concentration is released during the desilting operations, it decays gradually along the downstream river. Based on various desilting plans, the spatial variations of sediment concentration along the downstream river present an exponential trend line from Afterbay to the river mouth. The simulated trend lines can provide water quality information on suspended sediment concentrations for water treatment plants or aquatic ecosystems.
Furthermore, the hydrological conditions of the typhoon events in the past two decades are used to replicate the long-term sequential scenarios of desilting operations. The simulated floodwater levels indicate that until 2070 the floodwater stage does not overflow the riverbanks, except the river reaches upstream of Yuanshan Weir, and the river reaches nearby Guandu Bridge. Notably, the simulated results of the floodwater stage can provide warning information for inundation disaster emergency responses and evacuation actions to the general public. Owing to the tidal effect and mild bed slope between Hsinhai Bridge and Chenglin Bridge, significant deposition is observed in the scenario under desilting operations of Plans A + B + C. From simulated outcomes, the downstream river morphology may adjust toward the equilibrium state in the long-term desilting operations from Shihmen Reservoir. In other words, an increase in the riverbed elevation due to the deposition during desilting operations does not significantly contribute to the floodwater level. However, further research is needed in the future as the boundary conditions related to tidal height rising and watershed precipitation increasing may be profoundly affected by climate changes.

Author Contributions

F.-Z.L. developed the methodology, analyzed data, and wrote the manuscript. J.-S.L. provided research directions and revised the manuscript. T.S. was responsible for data collection regarding desilting techniques and providing practice suggestions. All authors have read and agreed to the published version of the manuscript.

Funding

This work was supported by the Ministry of Science and Technology (Grant No. MOST 109-2625-M-002-009 and MOST 109-2625-M-002-001).

Institutional Review Board Statement

Not applicable.

Informed Consent Statement

Not applicable.

Data Availability Statement

Not applicable.

Acknowledgments

The authors acknowledge the Northern Region Water Resources Office and the Water Resources Planning Institute, Water Resources Agency (WRA), Ministry of Economic Affairs (MOEA), Taiwan, for providing valuable data in this study. The authors also appreciate the Hydrotech Research Institute of National Taiwan University for its computing facilities and technical support.

Conflicts of Interest

The authors declare no conflict of interest.

References

  1. Ait Kadi, M. Water for development and development for water: Realizing the Sustainable Development Goals (SDGs) Vision. Aquat. Procedia 2016, 6, 106–110. [Google Scholar] [CrossRef]
  2. United Nations. Sustainable Development Goal 6: Synthesis Report 2018 on Water and Sanitation; United Nations: New York, NY, USA, 2018. [Google Scholar]
  3. Shiklomanov, I.A. Chapter 2 World Fresh Water Resources. In Water in Crisis: A Guide to the World’s Fresh Water Resources; Peter, H.G., Ed.; Oxford University Press: New York, NY, USA, 1993. [Google Scholar]
  4. Morris, G.L.; Fan, J.H. Reservoir Sedimentation Handbook: Design and Management of Dams, Reservoirs, and Watersheds for Sustainable Use; Electronic Version, Version 1.01; McGraw-Hill Book Co: New York, NY, USA, 2009. [Google Scholar]
  5. Chen, R.S.; Tsai, C.M. Development of an evaluation system for sustaining reservoir functions—A Case Study of Shiwen Reservoir in Taiwan. Sustainability 2017, 9, 1387. [Google Scholar] [CrossRef] [Green Version]
  6. Peters, R.; Berlekamp, J.; Lucía, A.; Stefani, V.; Tockner, K.; Christiane Zarfl, C. Integrated impact assessment for sustainable hydropower planning in the Vjosa catchment (Greece, Albania). Sustainability 2021, 13, 1514. [Google Scholar] [CrossRef]
  7. Daus, M.; Koberger, K.; Koca, K.; Beckers, F.; Fernández, J.E.; Weisbrod, B.; Dietrich, D.; Gerbersdorf, S.U.; Glaser, R.; Haun, S.; et al. Interdisciplinary reservoir management—A Tool for sustainable water resources management. Sustainability 2021, 13, 4498. [Google Scholar] [CrossRef]
  8. Mahmood, K. Reservoir Sedimentation: Impact, Extent, Mitigation; World Bank Technical Report No. 71; World Bank: Washington, DC, USA, 1987. [Google Scholar]
  9. ICOLD. Sedimentation and Sustainable Use of Reservoirs and River Systems; Sedimentation Committee 2009; Draft ICOLD Bulletin; ICOLD: Paris, France, 2009. [Google Scholar]
  10. Wisser, D.; Frolking, S.; Hagen, S.; Bierkens, M.F.P. Beyond peak reservoir storage? A global estimate of declining water storage capacity in large reservoirs. Water Resour. Res. 2013, 49, 5732–5739. [Google Scholar] [CrossRef] [Green Version]
  11. Jiang, N.; Fu, L. Problems of reservoir sedimentation in China. Chin. Geogr. Sci. 1998, 8, 117–125. [Google Scholar] [CrossRef]
  12. Patra, B.; Giri, S.; Narayan, P. Reservoir sedimentation in Indian dam: Trend and challenges. In Proceedings of the International Dam Safety Conference, Bhubaneswar, India, 13–14 February 2019. [Google Scholar]
  13. Water Resources Planning Institute. Reservoir Desiltation Technology and Management; Water Resources Agency: Taipei, Taiwan, 2020. [Google Scholar]
  14. Annandale, G.W.; Morris, G.L.; Karki, P. Extending the Life of Reservoirs: Sustainable Sediment Management for Dams and Run-of-River Hydropower; World Bank Publications: Washington, DC, USA, 2016. [Google Scholar]
  15. Ehrbar, D.; Schmocker, L.; Doering, M.; Cortesi, M.; Bourban, G.; Boes, R.M.; Vetsch, D.F. Continuous seasonal and large-scale periglacial reservoir sedimentation. Sustainability 2018, 10, 3265. [Google Scholar] [CrossRef] [Green Version]
  16. Kondolf, G.M. Sediment management at the river-basin scale: Challenges and opportunities. In Proceedings of the 3rd International Workshop on Sediment Bypass Tunnels, Taipei, Taiwan, 9–12 April 2019. [Google Scholar]
  17. Wang, H.W.; Tsai, B.S.; Hwang, C.; Chen, G.W.; Kuo, W.C. Efficiency of the drawdown flushing and partition desilting of a reservoir in Taiwan. Water 2020, 12, 2166. [Google Scholar] [CrossRef]
  18. Gurmu, Z.A.; Ritzema, H.; de Fraiture, C.; Ayana, M. Stakeholder roles and perspectives on sedimentation management in small-scale irrigation schemes in Ethiopia. Sustainability 2019, 11, 6121. [Google Scholar] [CrossRef] [Green Version]
  19. Du, M.; Mu, X.; Zhao, G.; Gao, P.; Sun, W. Changes in runoff and sediment load and potential causes in the Malian river basin on the Loess Plateau. Sustainability 2021, 13, 443. [Google Scholar] [CrossRef]
  20. Bhatti, M.T.; Ashraf, M.; Anwar, A.A. Soil erosion and sediment load management strategies for sustainable irrigation in arid regions. Sustainability 2021, 13, 3547. [Google Scholar] [CrossRef]
  21. Lai, J.S.; Shen, H.W. Flushing sediment through reservoirs. J. Hydraul. Res. 1996, 34, 237–255. [Google Scholar] [CrossRef]
  22. Shen, H.W.; Lai, J.S. Sustain reservoir useful life by flushing sediment. Intl. J. Sediment. Res. 1996, 11, 10–17. [Google Scholar]
  23. Kondolf, M.; Gao, Y.; Annandale, G.W.; Morris, G.L.; Jiang, E.; Zhang, J.; Cao, Y.; Carling, P.; Fu, K.; Guo, Q.; et al. Sustainable sediment management in reservoirs and regulated rivers: Experiences from five continents. Earths Future 2014, 2, 256–280. [Google Scholar] [CrossRef]
  24. Atkinson, E. The Feasibility of Flushing Sediment from Reservoirs; Report OD 137; HR Wallingford: Wallingford, UK, 1996. [Google Scholar]
  25. Ren, S.; Zhang, B.; Wang, W.J.; Yuan, Y.; Guo, C. Sedimentation and its response to management strategies of the Three Gorges Reservoir, Yangtze River, China. Catena 2021, 199, 105096. [Google Scholar] [CrossRef]
  26. Basson, G.R.; Rooseboom, A. Dealing with Reservoir Sedimentation. South Africa; Report No. TT 91/97; Water Research Commission: Pretoria, South Africa, 1997. [Google Scholar]
  27. Sumi, T.; Kobayshi, K.; Yamaguchi, K.; Takata, Y. Study on the applicability of the asset management for reservoir sediment management. In Proceedings of the International Congress on Large Dams, Brasilia, Brazil, 25–29 May 2009. [Google Scholar]
  28. Sumi, T.; Lee, F.Z.; Lai, J.S.; Tan, Y.C.; Huang, C.C. Flushing replenished sediment on floodplain downstream of a reservoir. In Proceedings of the International Symposium on Dams for a Changing World, Kyoto, Japan, 5 June 2012. [Google Scholar]
  29. Palmieri, A.; Shah, F.; Annandale, G.; Dinar, A. Reservoir conservation—Economic and Engineering Evaluation of Alternative Strategies for Managing Sedimentation in Storage Reservoirs: The RESCON Approach; World Bank: Washington, DC, USA, 2003; Volume 1. [Google Scholar]
  30. Sumi, T.; Kantoush, S.A. Innovative strategies for managing reservoir sedimentation in Japan. Hydrolink 2018, 4, 100–104. [Google Scholar]
  31. Sumi, T. New sediment bypass schemes in Sakuma and Yahagi Dams in Japan. In Proceedings of the 3rd International Workshop on Sediment Bypass Tunnels, Taipei, Taiwan, 10–13 April 2019. [Google Scholar]
  32. Boes, R.M.; Müller-Hagmann, M.; Albayrak, I. Design, operation and morphological effects of bypass tunnels as a sediment routing technique. In Proceedings of the 3rd International Workshop on Sediment Bypass Tunnels, Taipei, Taiwan, 9–12 April 2019. [Google Scholar]
  33. Sakamoto, T.; Sumi, T.; Hakoishi, N. New paradigms on sediment management for reservoir and river sustainability in Japan. Hydropower Dams 2018, 25(2). Available online: https://www.hydropower-dams.com/articles/new-paradigms-on-sediment-management-for-reservoir-and-river-basin-sustainability-in-japan/ (accessed on 2 February 2022).
  34. Tsai, F.; Lai, J.-S.; Chen, W.W.; Lin, T.-H. Analysis of topographic and vegetative factors with data mining for landslide verification. Ecol. Eng. 2013, 61, 669–677. [Google Scholar] [CrossRef]
  35. Lin, C.P.; Chung, C.C.; Wu, I.L.; Wu, P.L.; Lin, C.H.; Wu, C.H. Extensive monitoring system of sediment transport for reservoir sediment management. In Natural Resources and Control Processes, 1st ed.; Springer: Basel, Switzerland, 2016; Volume 17, pp. 449–492. [Google Scholar]
  36. Chiu, Y.J.; Lee, H.Y.; Wang, T.L.; Yu, J.; Lin, Y.T.; Yuan, Y. Modeling sediment yields and stream stability due to sediment-related disaster in Shihmen Reservoir watershed in Taiwan. Water 2019, 11, 332. [Google Scholar] [CrossRef] [Green Version]
  37. Lin, B.S.; Chen, C.K.; Thomas, K.; Hsu, C.K.; Ho, H.C. Improvement of the k-factor of USLE and soil erosion estimation in Shihmen reservoir watershed. Sustainability 2019, 11, 355. [Google Scholar] [CrossRef] [Green Version]
  38. Northern Region Water Resources Office, WRA, MOEA. 109 Annual Topographic Survey of Reservoirs and Dams under the Administration of the Bureau Topographic Survey Results Report for the Water Storage Area of Shihmen Reservoir; Northern Region Water Resources Office: Taoyuan, Taiwan, 2020. (In Chinese) [Google Scholar]
  39. Wang, H.W.; Kondolf, G.M.; Tullos, D.; Kuo, W.C. Sediment management in Taiwan’s reservoirs and barriers to implementation. Water 2018, 10, 1034. [Google Scholar] [CrossRef] [Green Version]
  40. Huang, C.C.; Lai, Y.G.; Lai, J.S.; Tan, Y.C. Field and numerical modeling study of turbidity current in Shimen Reservoir during typhoon events. J. Hydraul. Eng. 2019, 145, 05019003. [Google Scholar] [CrossRef]
  41. Chen, C.Y.; Chen, L.K.; Yu, F.C.; Lin, Y.C.; Lee, C.L.; Wang, Y.T. Landslides affecting sedimentary characteristics of reservoir basin. Environ. Earth Sci. 2010, 59, 1693–1702. [Google Scholar] [CrossRef] [Green Version]
  42. Water Resources Planning Institute. Hydraulic Model Studies for Sediment Sluicing and Flood Diversion Engineering of Shihman Reservoir; Technical report; Water Resources Planning Institute: Taichung, Taiwan, 2012. (In Chinese) [Google Scholar]
  43. Water Resources Planning Institute. Feasibility Study of Dawanping Desilting Tunnel Project in Shihmen Reservoir; Summary Report; Water Resources Planning Institute: Taichung, Taiwan, 2011. (In Chinese) [Google Scholar]
  44. Northern Region Water Resources Office, WRA, MOEA. Desilting Tunnel of Shimen Reservoir (First Stage); The Basic Design Report of Amouping Tunnel; Northern Region Water Resources Office: Taoyuan, Taiwan, 2015. (In Chinese) [Google Scholar]
  45. Northern Region Water Resources Office, WRA, MOEA. Shihmen Reservoir Existing Facility Desilting Enhance Project—Phase 1 Power Plant Desilting Project Completion Report; Northern Region Water Resources Office: Taoyuan, Taiwan, 2013. (In Chinese) [Google Scholar]
  46. Water Resources Agency, MOEA. Amuping Desilting Project of Shihmen Reservoir, Technical report of approved version; Water Resources Agency: Taipei, Taiwan, 2014. (In Chinese) [Google Scholar]
  47. Lai, J.S.; Lee, F.Z.; Wu, C.H.; Tan, Y.C.; Sumi, T. Sediment bypass tunnels of the Shihmen Reservoir in Taiwan. In Proceedings of the 1st International Workshop on Sediment Bypass Tunnels, Zurich, Switzerland, 27–29 April 2015. [Google Scholar]
  48. Northern Region Water Resources Office. Impacts and Improvement Strategies on the Downstream River Sediment Concentration and Bed Evolution by the Operation of Flood Control and Sediment Desiltation of the Shihmen Reservoir; Technical Report; National Taiwan University: Taipei, Taiwan, 2015. (In Chinese) [Google Scholar]
  49. Sumi, T.; Kantoush, S.A. Comprehensive Sediment Management Strategies in Japan: Sediment Bypass Tunnels. In Proceedings of the 34th IAHR World Congress, Brisbane, Australia, 26 June–1 July 2011; pp. 1803–1810. [Google Scholar]
  50. Brune, G.M. Trap efficiency of reservoirs. Trans. Am. Geophys. Union 1953, 34, 407–418. [Google Scholar] [CrossRef]
  51. Lewis, S.E.; Bainbridge, Z.T.; Kuhnert, P.M.; Sherman, B.S.; Henderson, B.; Dougall, C.; Cooper, M.; Brodie, J.E. Calculating sediment trapping efficiencies for reservoirs in tropical settings: A case study from the burdekin falls dam, NE Australia. Water Resour. Res. 2013, 49, 1017–1029. [Google Scholar] [CrossRef]
  52. Tan, G.; Chen, P.; Deng, J.; Xu, Q.; Tang, R.; Feng, Z.; Yi, R. Review and improvement of conventional models for reservoir sediment trapping efficiency. Heliyon 2019, 5, e02458. [Google Scholar] [CrossRef] [PubMed] [Green Version]
  53. Lee, H.Y.; Hsieh, H.M. Numerical simulations of scour and deposition in a channel network. Int. J. Sediment Res. 2003, 18, 32–49. [Google Scholar]
  54. Lee, F.Z.; Lai, J.S.; Huang, C.C.; Tan, Y.C.; Hsieh, H.M.; Yang, Z.X. Application of numerical model for long-term river bed variation. In Proceedings of the 20th Congress of the Asia Pacific Division of the International Association for Hydro Environment Engineering & Research, Colombo, Sri Lanka, 28–31 August 2016. [Google Scholar]
  55. Lee, F.Z.; Sumi, T.; Lai, J.S.; Guo, W.D.; Huang, C.C.; Chang, F.C.; Tan, Y.C. The impacts of water withdraw at Yuanshanyan during sediment venting in Shihmen Reservoir. J. Taiwan Agric. Eng. 2012, 58, 80–94. [Google Scholar]
  56. Lee, F.Z.; Lai, J.S.; Guo, W.D.; Sumi, T. Scouring of replenished sediment through reservoir flood discharge affects suspended sediment concentrations at downstream river water intake. Water 2019, 11, 1998. [Google Scholar] [CrossRef] [Green Version]
Figure 1. The watershed of the Tamsui River basin with the specific structure locations.
Water 14 00479 g001
Figure 2. Sedimentation data of accumulative and annual deposition volumes in Shihmen Reservoir.
Water 14 00479 g002
Figure 3. Longitudinal bed elevation variations against time and the prospective desilting efficiency of different sediment desilting techniques in Shihmen Reservoir.
Water 14 00479 g003
Figure 4. Desilting operations by sediment sluicing: (a) layout of the power plant penstock No. 1 and the modified power plant penstock No. 2; (b) outflow with high sediment concentration sluiced through modified penstock No. 2 and flood releasing from spillways during the first operation in 2013 Typhoon Soulik.
Water 14 00479 g004
Figure 5. Outlet facilities in Shihmen Reservoir: (a) layout of outlet structures and desilting tunnels; (b) plan view of the Amuping desilting tunnel with the settling basin.
Water 14 00479 g005
Figure 6. Classification of reservoir desilting techniques based on CIR (reservoir storage capacity/mean annual runoff inflow) and CSR (reservoir storage capacity/mean annual sediment inflow) indexes.
Water 14 00479 g006
Figure 7. The sediment trapping efficiency (TE) is related to CIR (reservoir storage capacity/mean annual runoff inflow) in Shihmen Reservoir.
Water 14 00479 g007
Figure 8. Prospective storage capacity in Shihmen Reservoir under various desilting techniques for the next fifty years.
Water 14 00479 g008
Figure 9. Reservoir sedimentation affects various water demands with population projection in the next five decades.
Water 14 00479 g009
Figure 10. Comparison of the simulated and measured sediment concentration variations against time at Yuanshan Weir, Chenglin Bridge, Zhongxing Bridge, and Guandu Bridge in flood events during (a) Typhoon Soudelor; (b) Typhoon Dujuan.
Water 14 00479 g010
Figure 11. Simulated sediment concentration variations along the downstream river under the hydrological conditions of Typhoon Aere in various scenarios of desilting plans.
Water 14 00479 g011
Figure 12. Long–term impacts of the downstream river on (a) longitudinal floodwater level variations; (b) riverbed aggregation/degradation variations.
Water 14 00479 g012
Table 1. Measured data with desilting efficiency of major typhoon events in Shihmen Reservoir.
Typhoon EventDate
(dd/mm/yy)
Peak
Discharge
(m3/s)
Inflow Discharge Volume
(106 m3)
Inflow Sediment Volume
(106 m3)
Deposited Sediment Volume
(106 m3)
Total
Desilting Efficiency
(%)
Desilting Efficiency at Modified Power Plant Penstock (%)
Aere23 August 20048594713.87--27.88----
Fungwong26 July 20082040124.472.332.0312.70--
Sinlaku11 September 20083447633.4413.129.6527.00--
Jangmi26 September 20083292230.505.254.3017.50--
Morakot5 August 20091838227.992.392.0513.60--
Saola30 July 20125385492.309.958.4515.10--
Soulik11 July 20135458264.1011.987.7935.006.65
Trami20 August 20132412165.314.172.6237.2014.26
Soudelor6 August 20155634296.393.302.1335.607.16
Dujuan27 September 20153802195.192.451.6532.608.08
Megi25 September 20164268294.854.563.6120.905.73
Publisher’s Note: MDPI stays neutral with regard to jurisdictional claims in published maps and institutional affiliations.

