
Collinear Interaction of Waves and Current in the Presence of Ripple in the U-Tube


Abstract
:1. Introduction
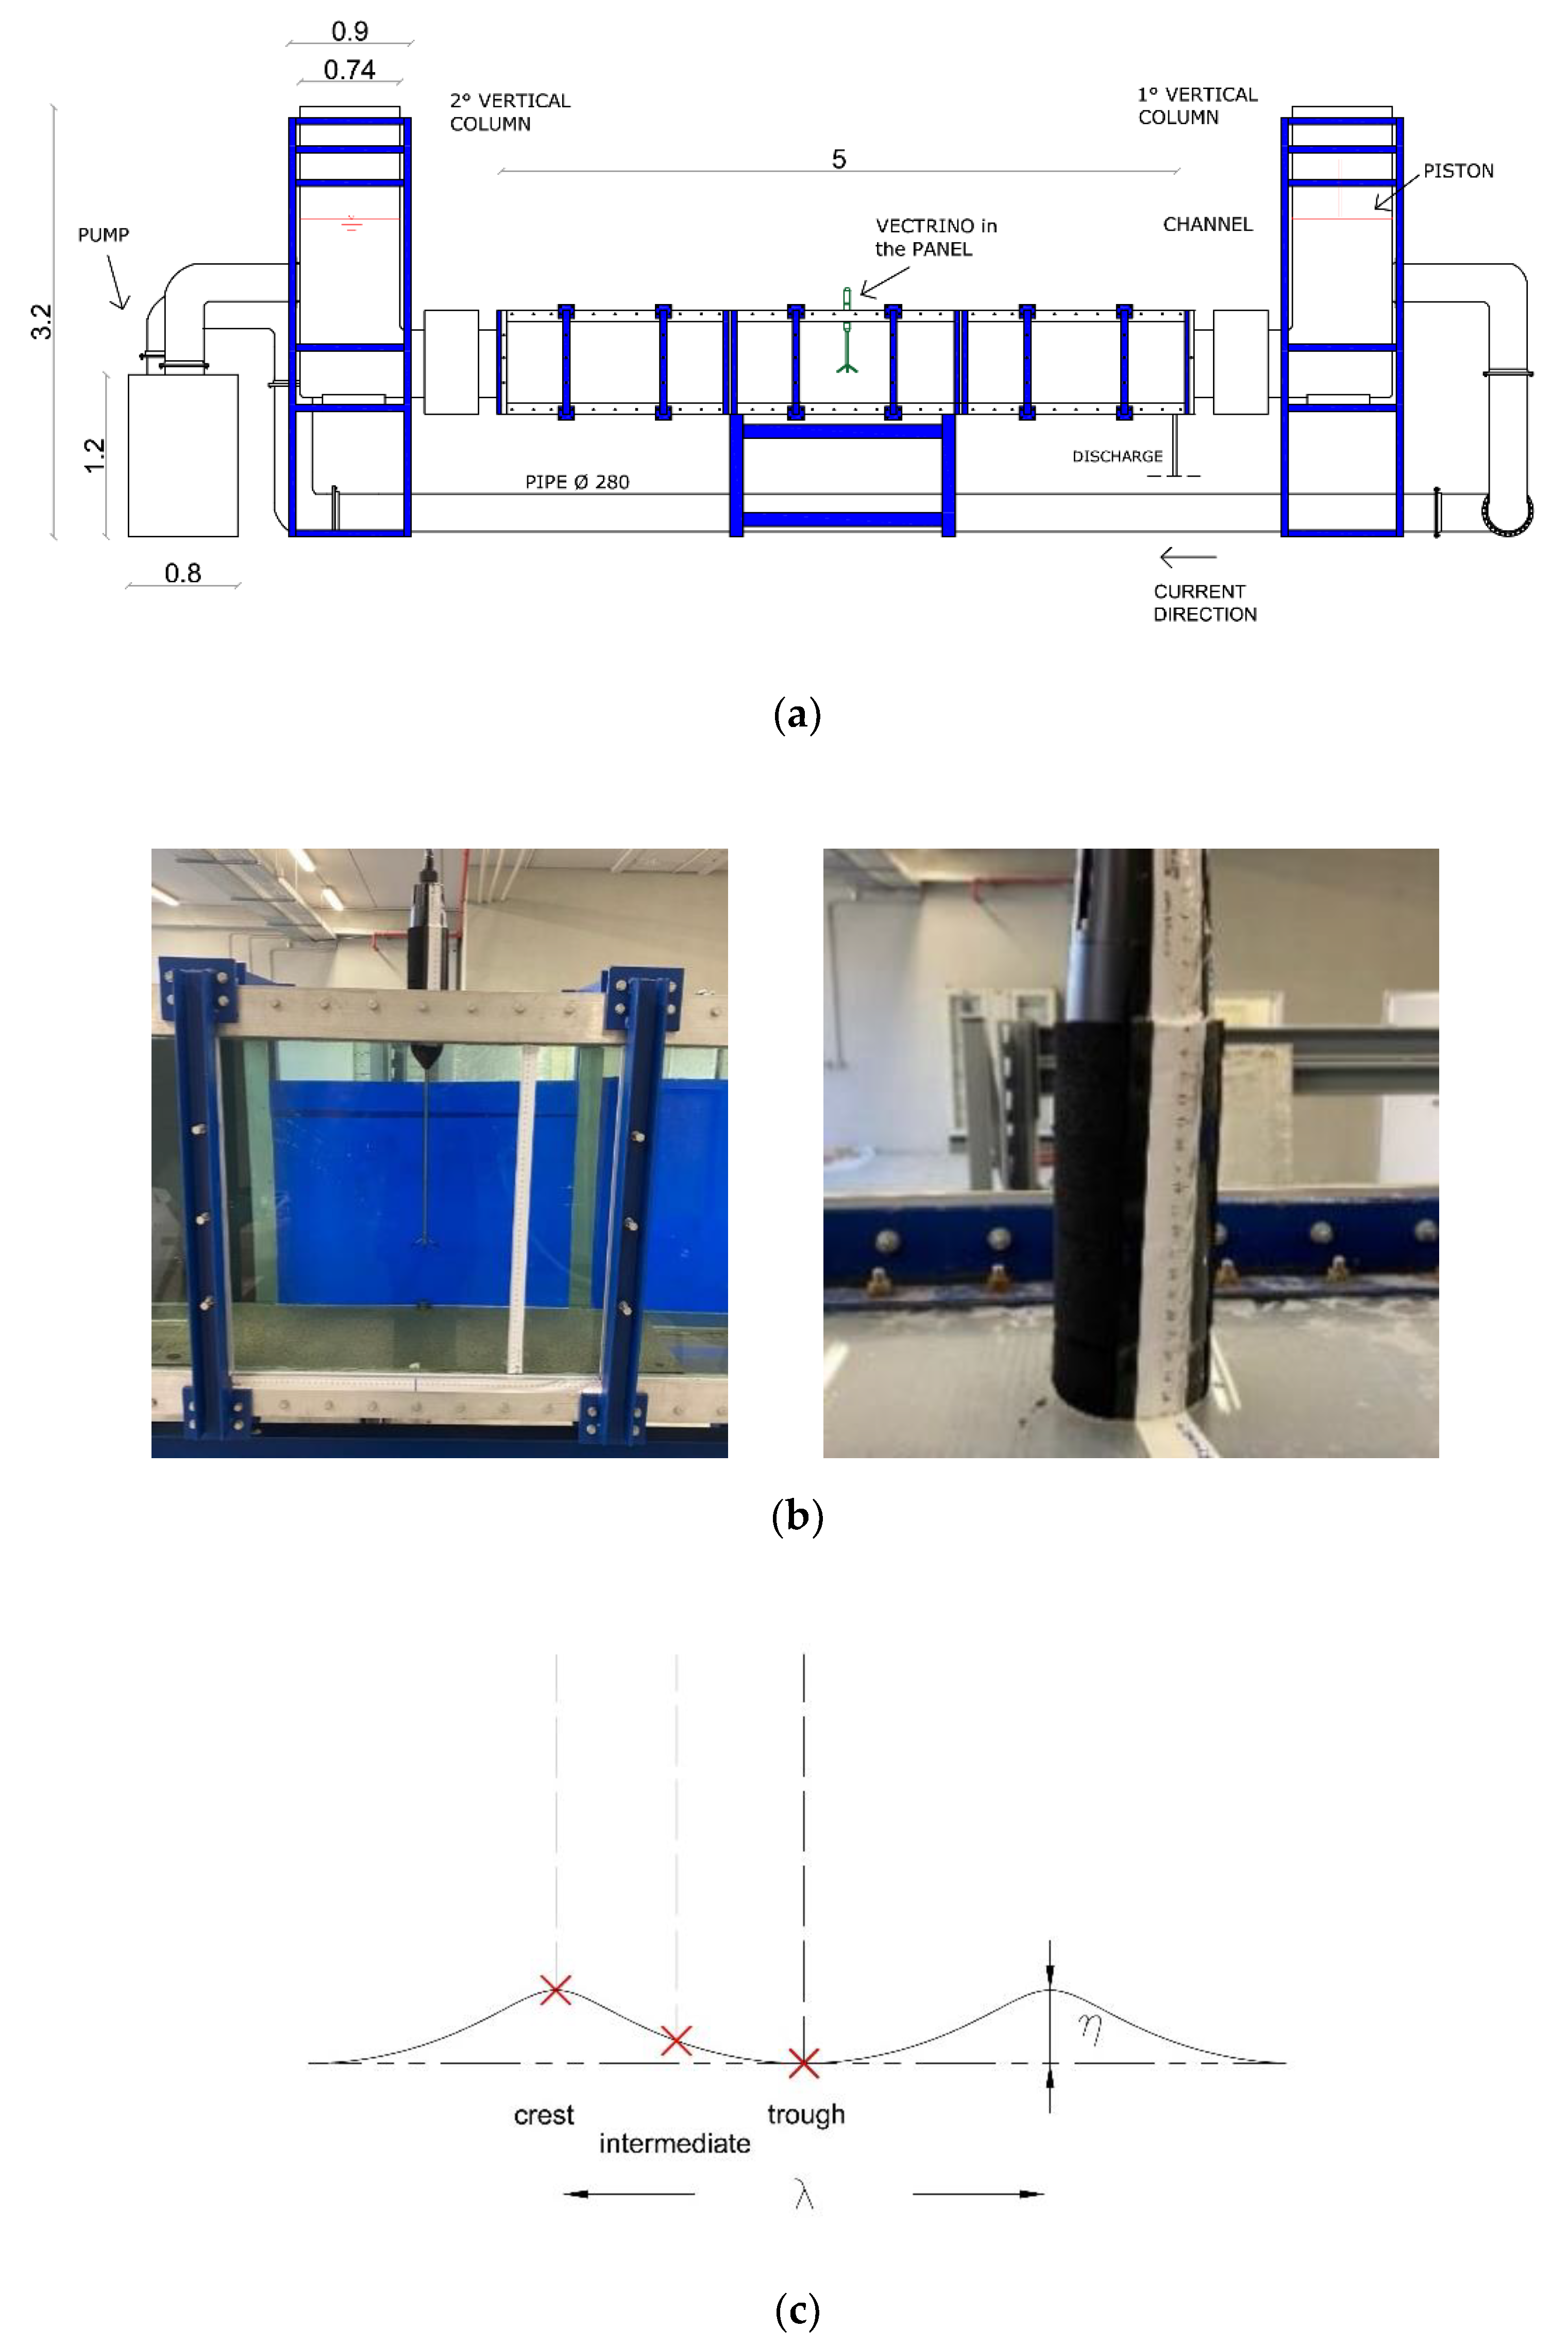
2. Experimental Set-Up
3. Analysis of the Experimental Results
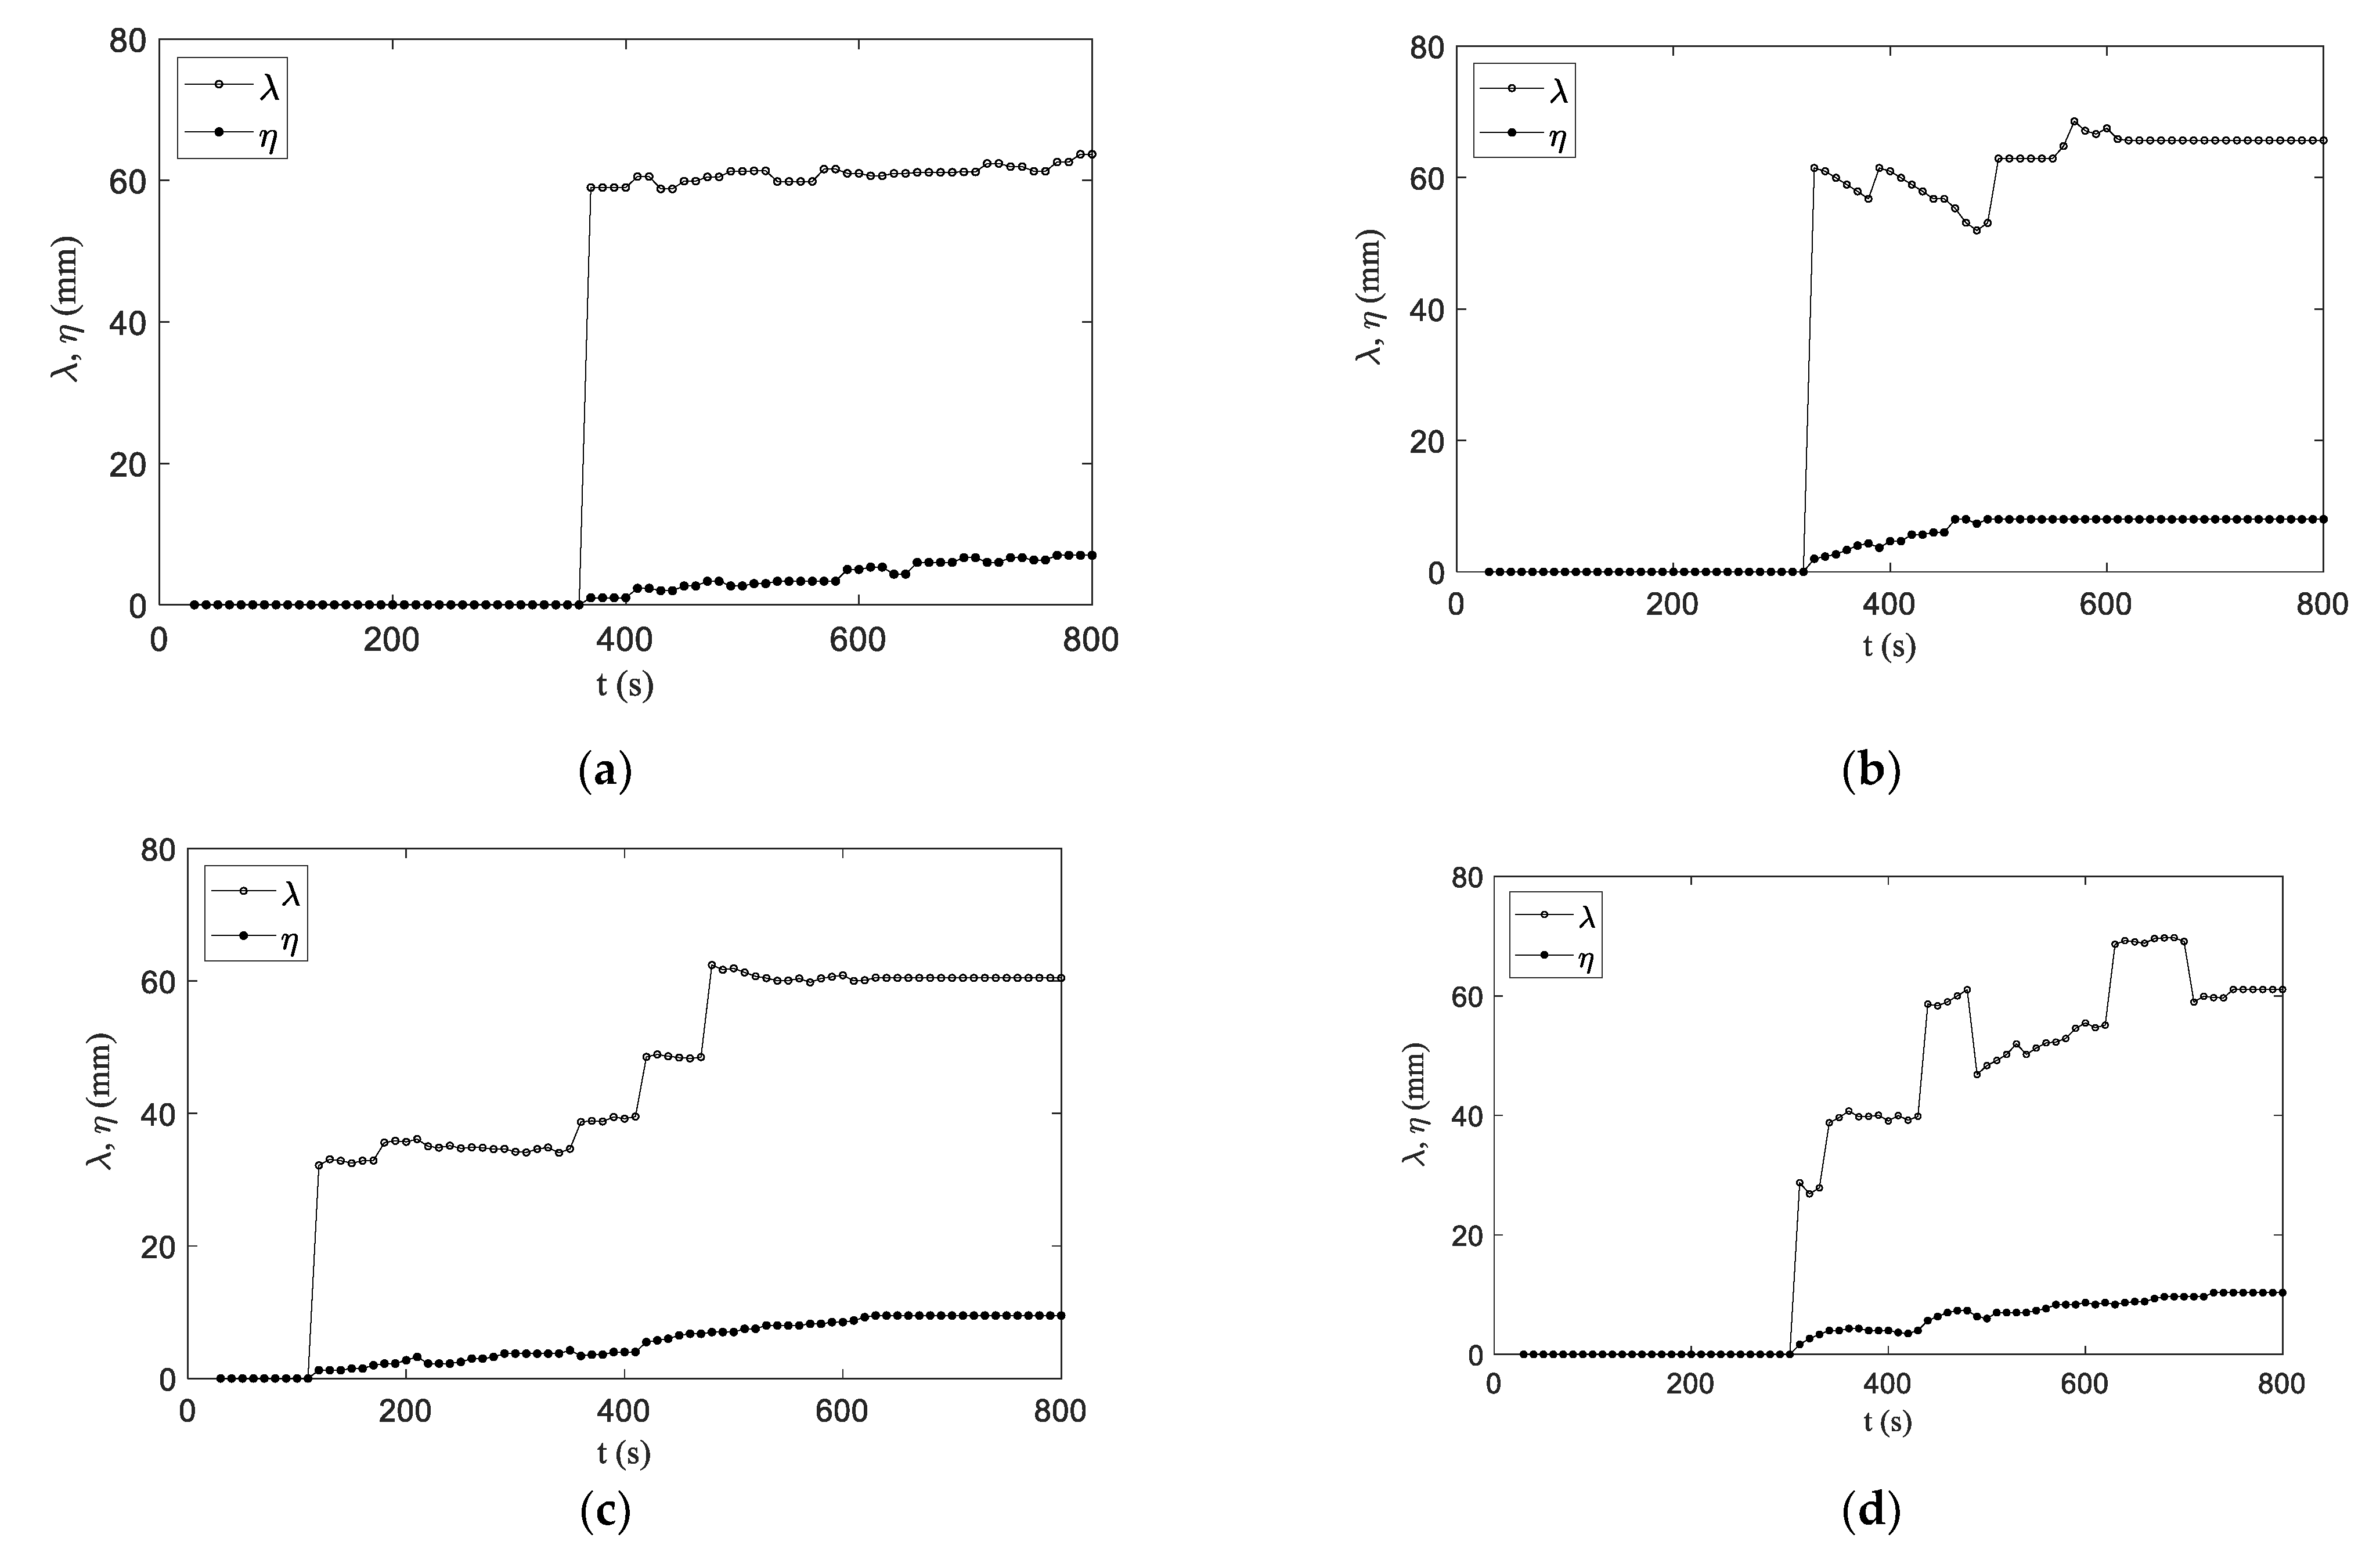
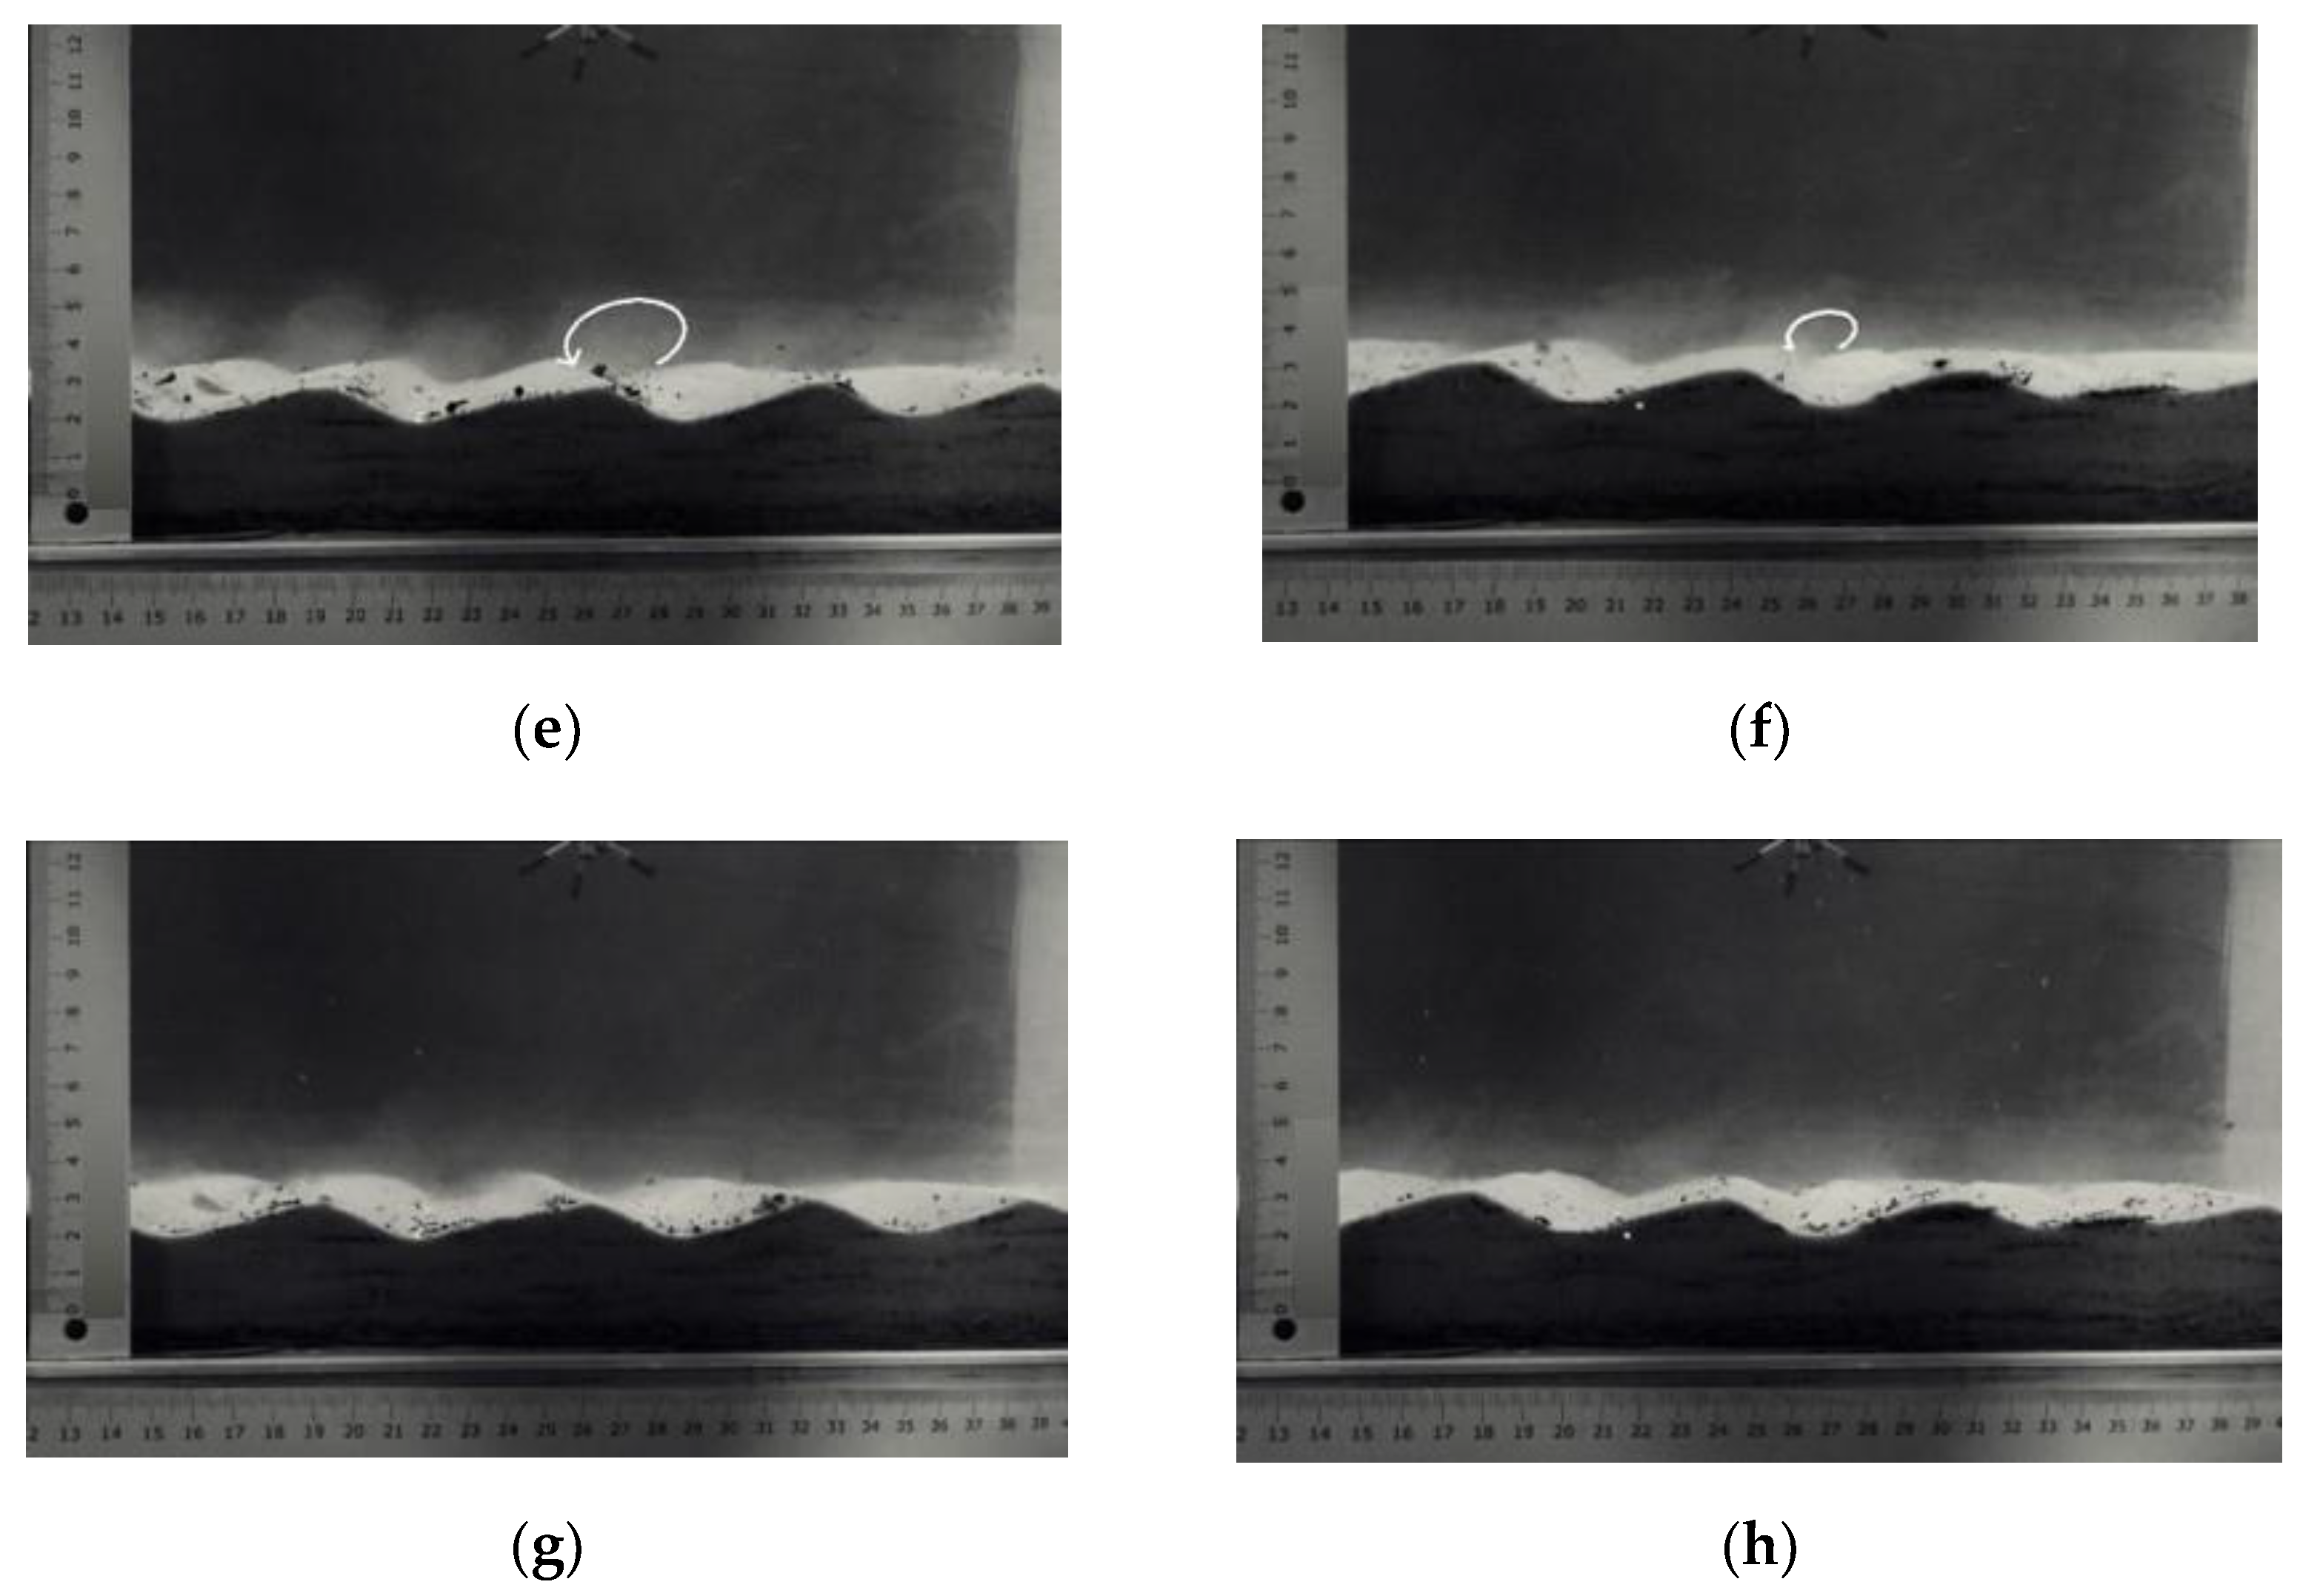
3.1. Movable Bed
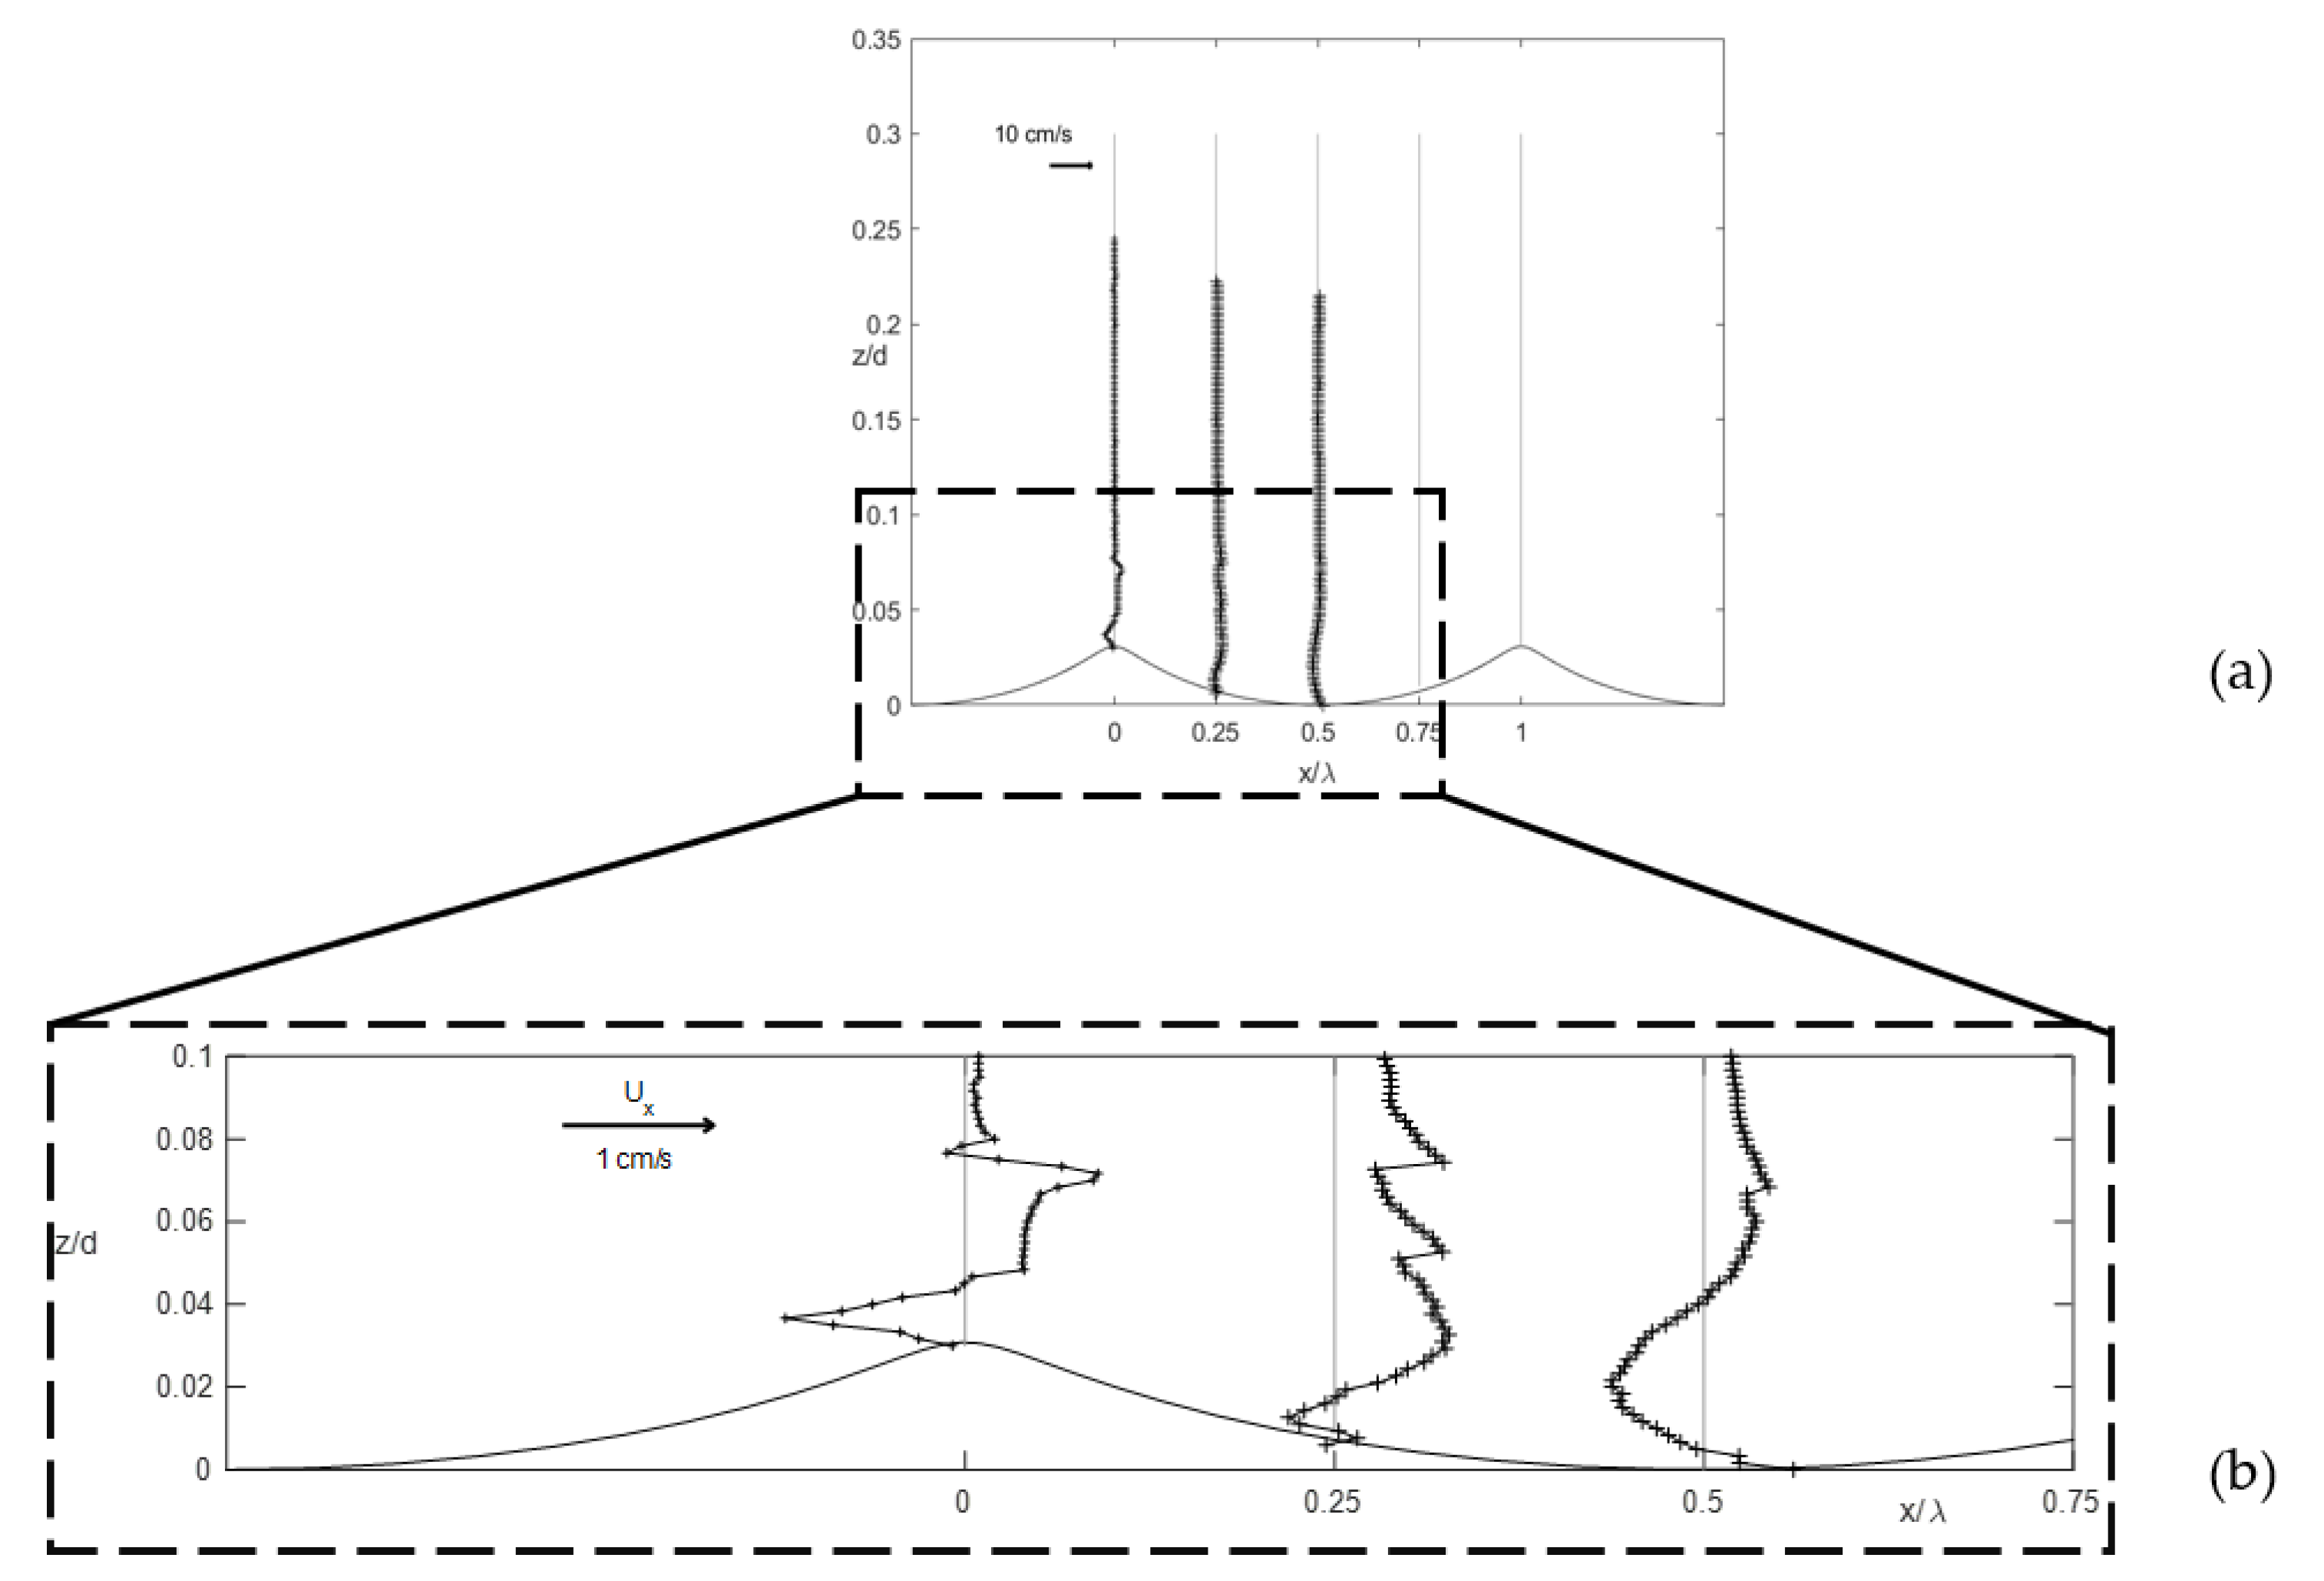
3.2. Fixed Bed
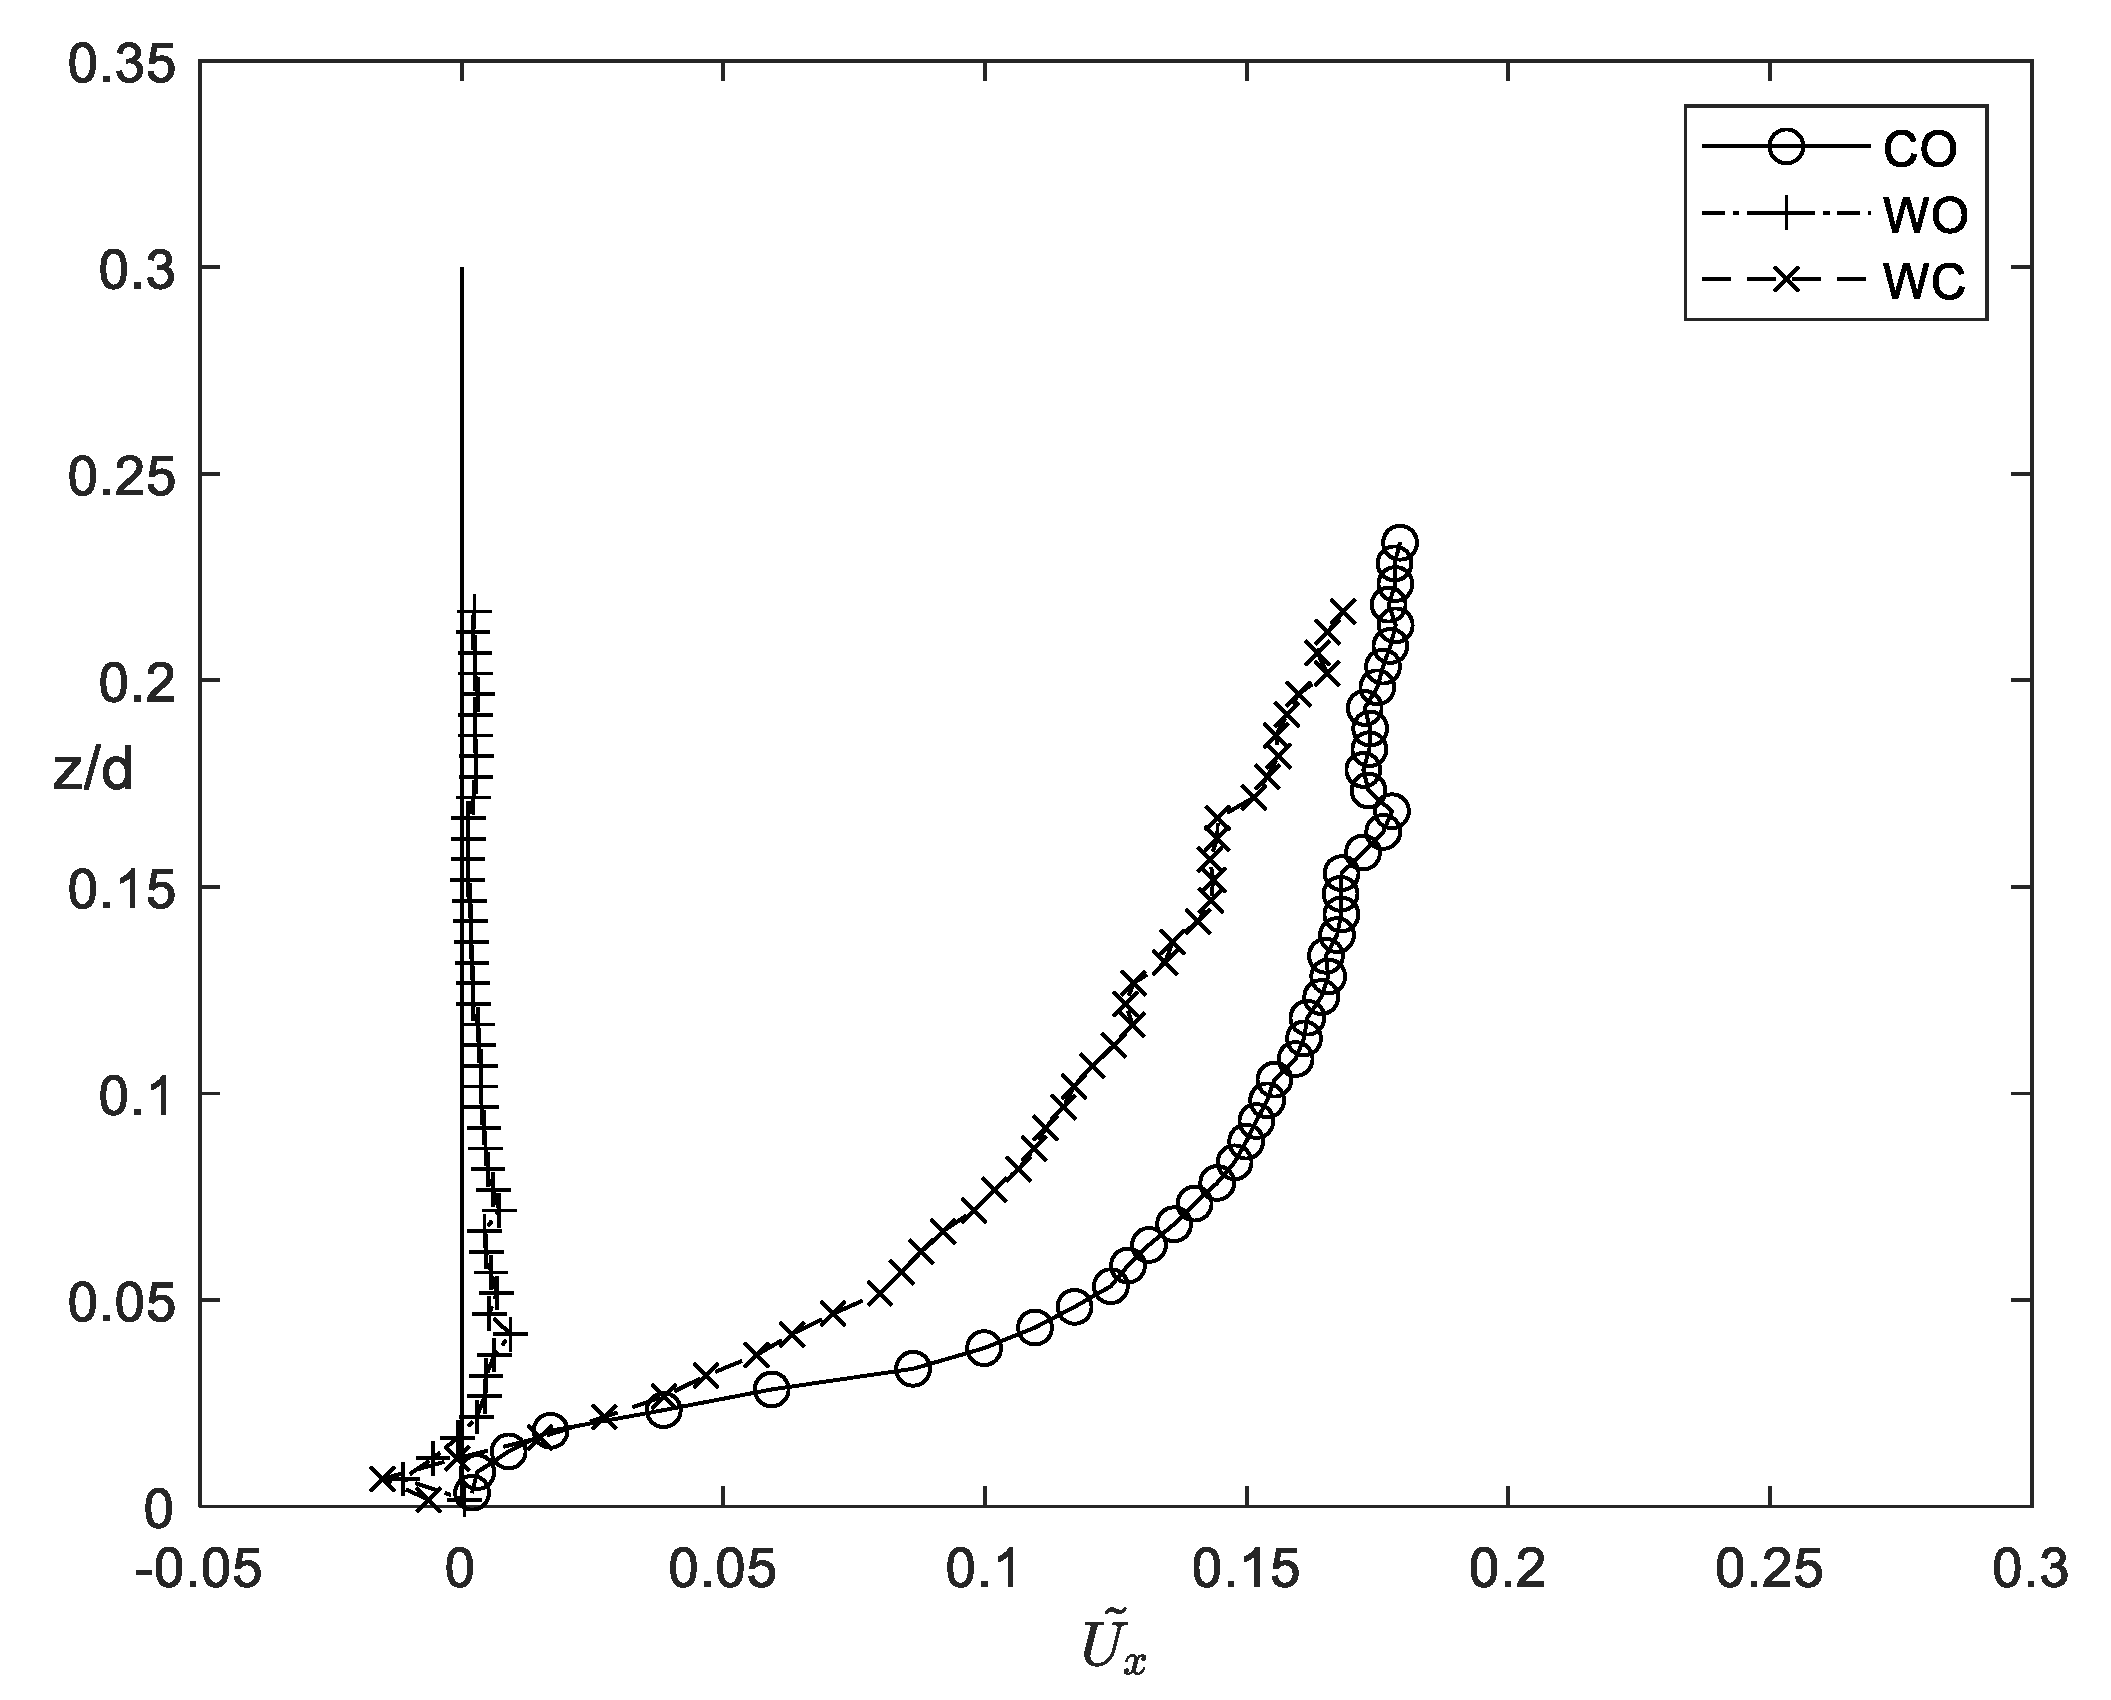
- Time-averaged velocity:
- Space-and-time-averaged velocity:
4. Conclusions
- in the presence of waves and currents, longer times are required for the bedforms to stabilize than in the wave only case;
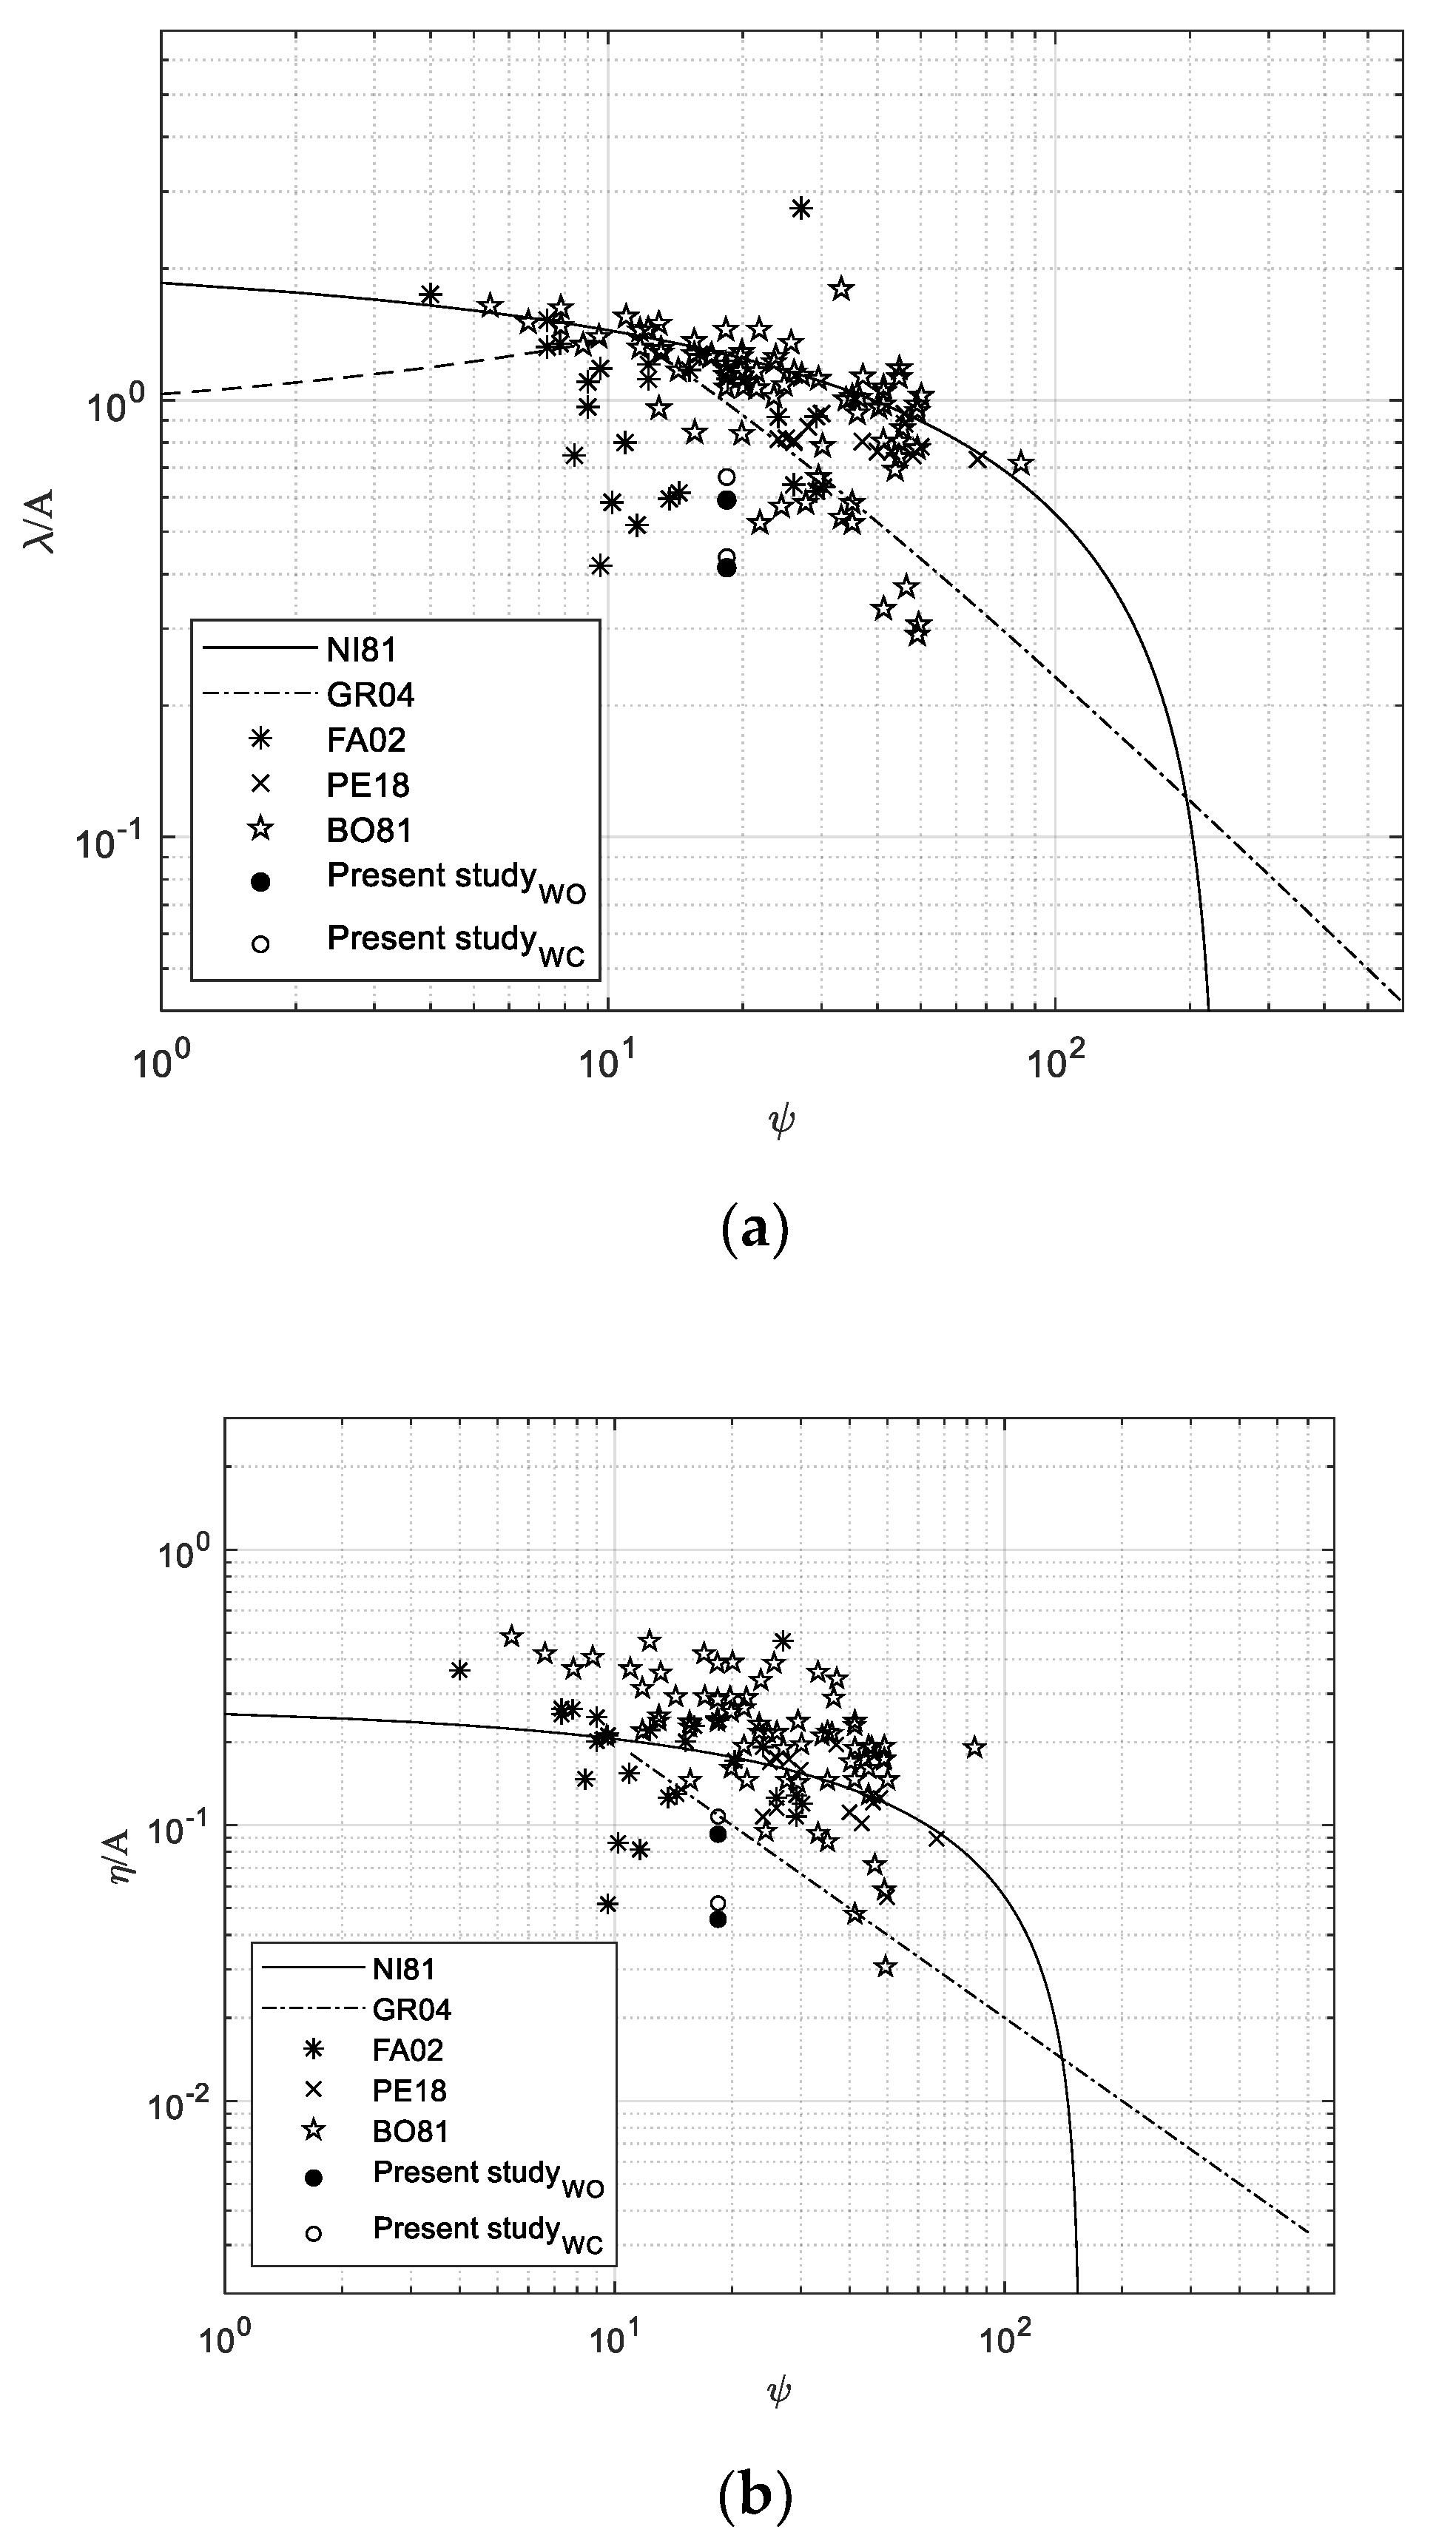
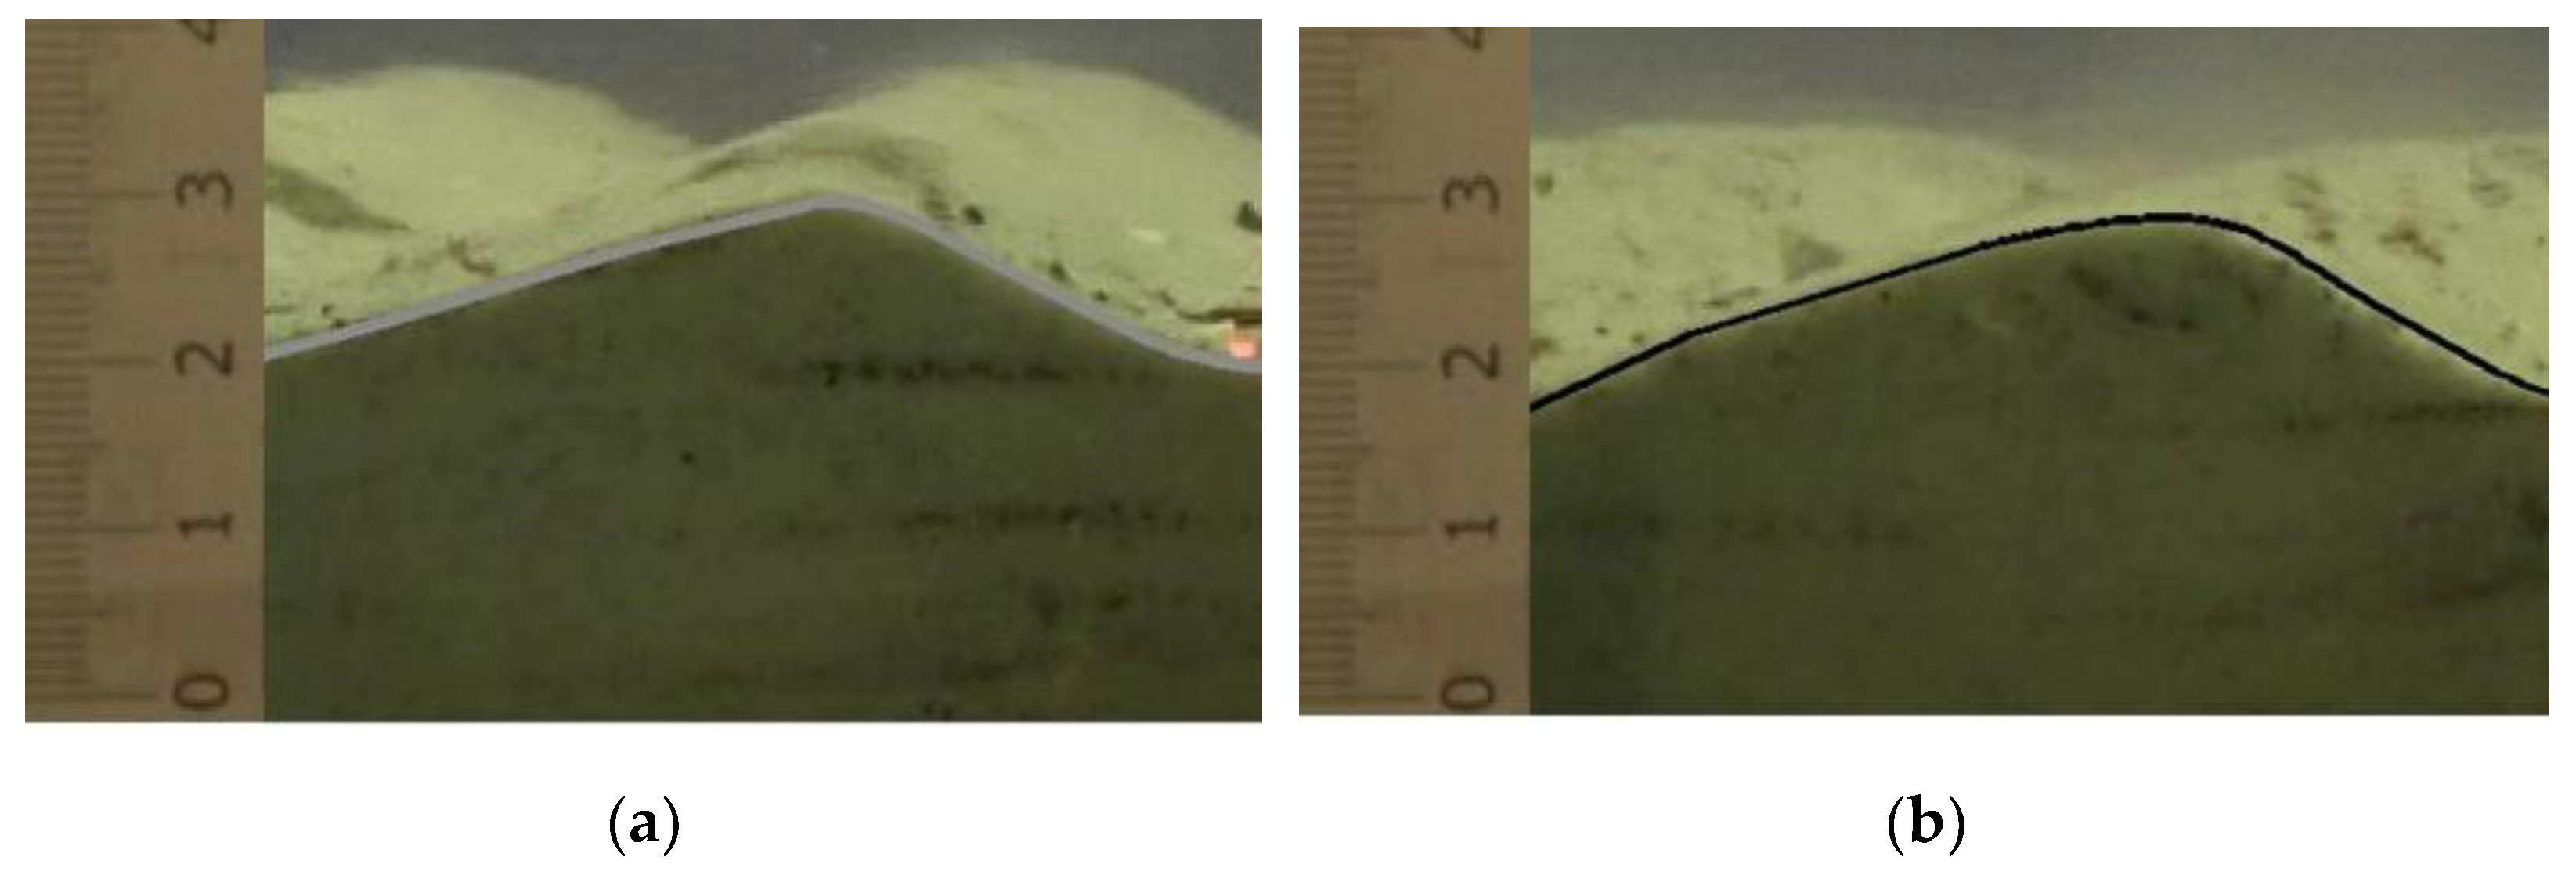
- in the presence of both waves and current, bedform characteristics are similar to the case of wave only, but their longitudinal profile shows more rounded crests and a certain degreed asymmetry;
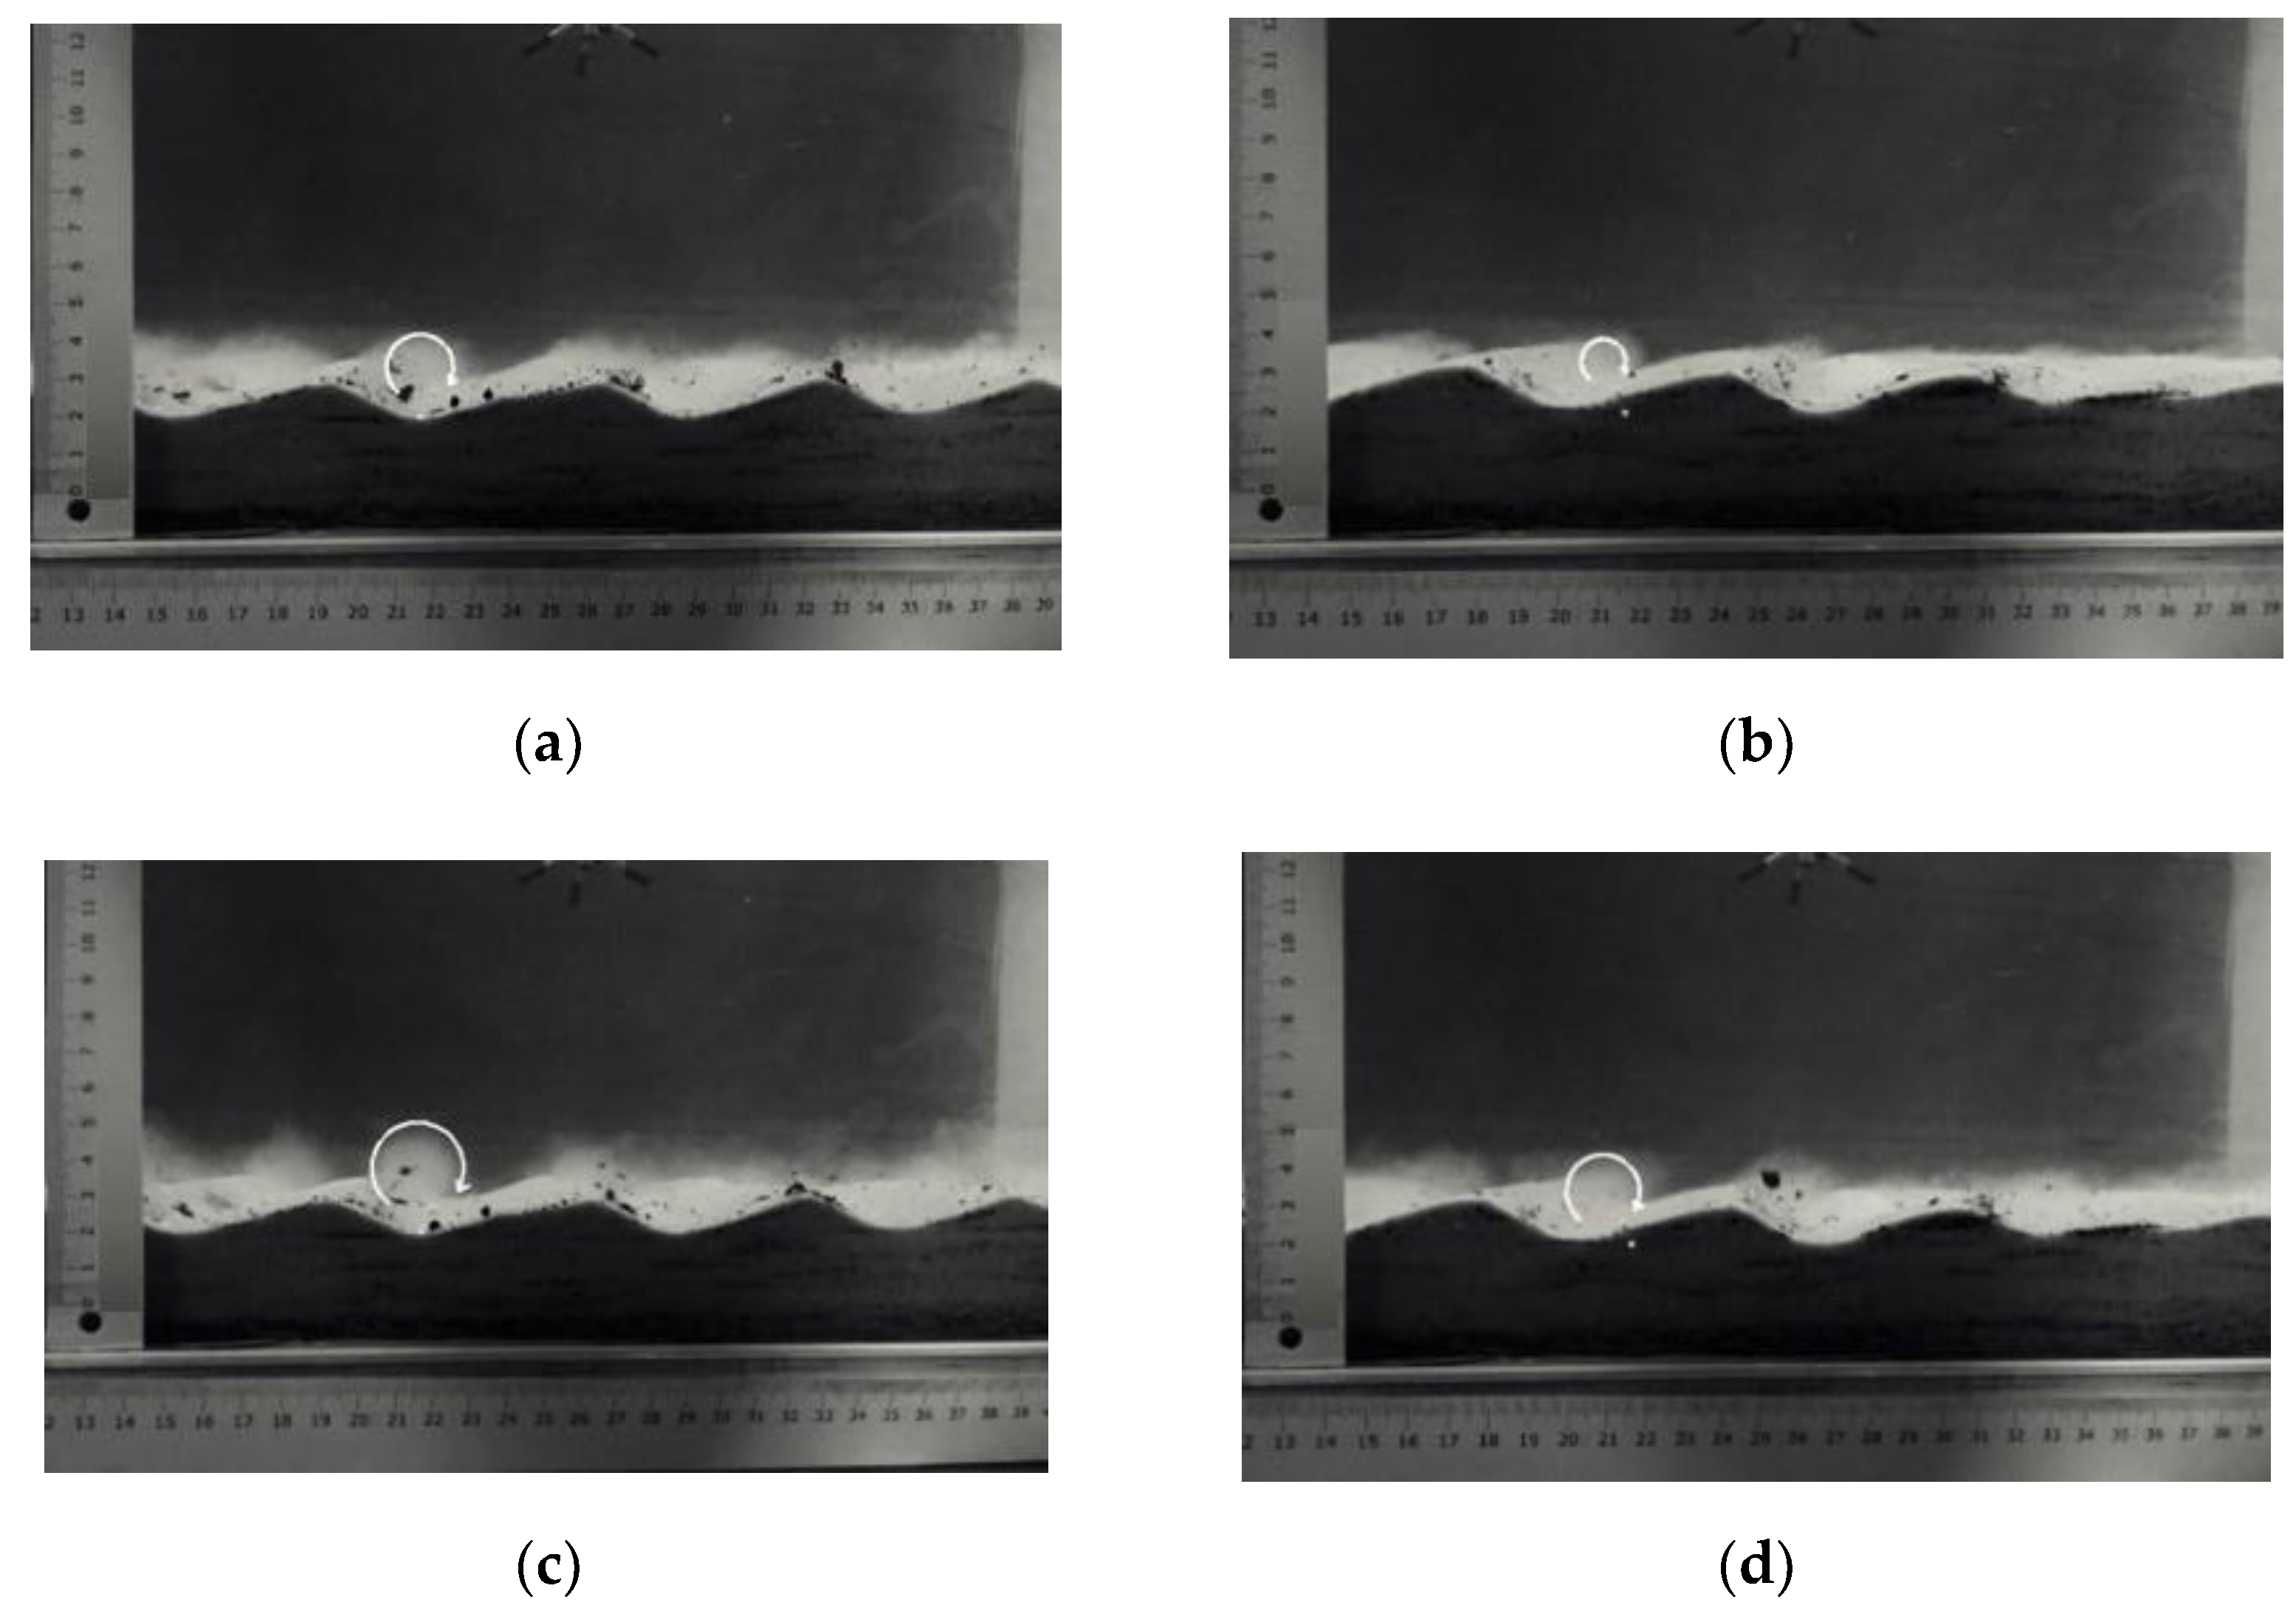
- analyses of evolution of vortex ripples, in the wave only case, showed the formation of a clockwise vortex that reaches the maximum size of 2.5 cm at the 120° phase; in the presence of waves and currents, this vortex reduces by about 30%;
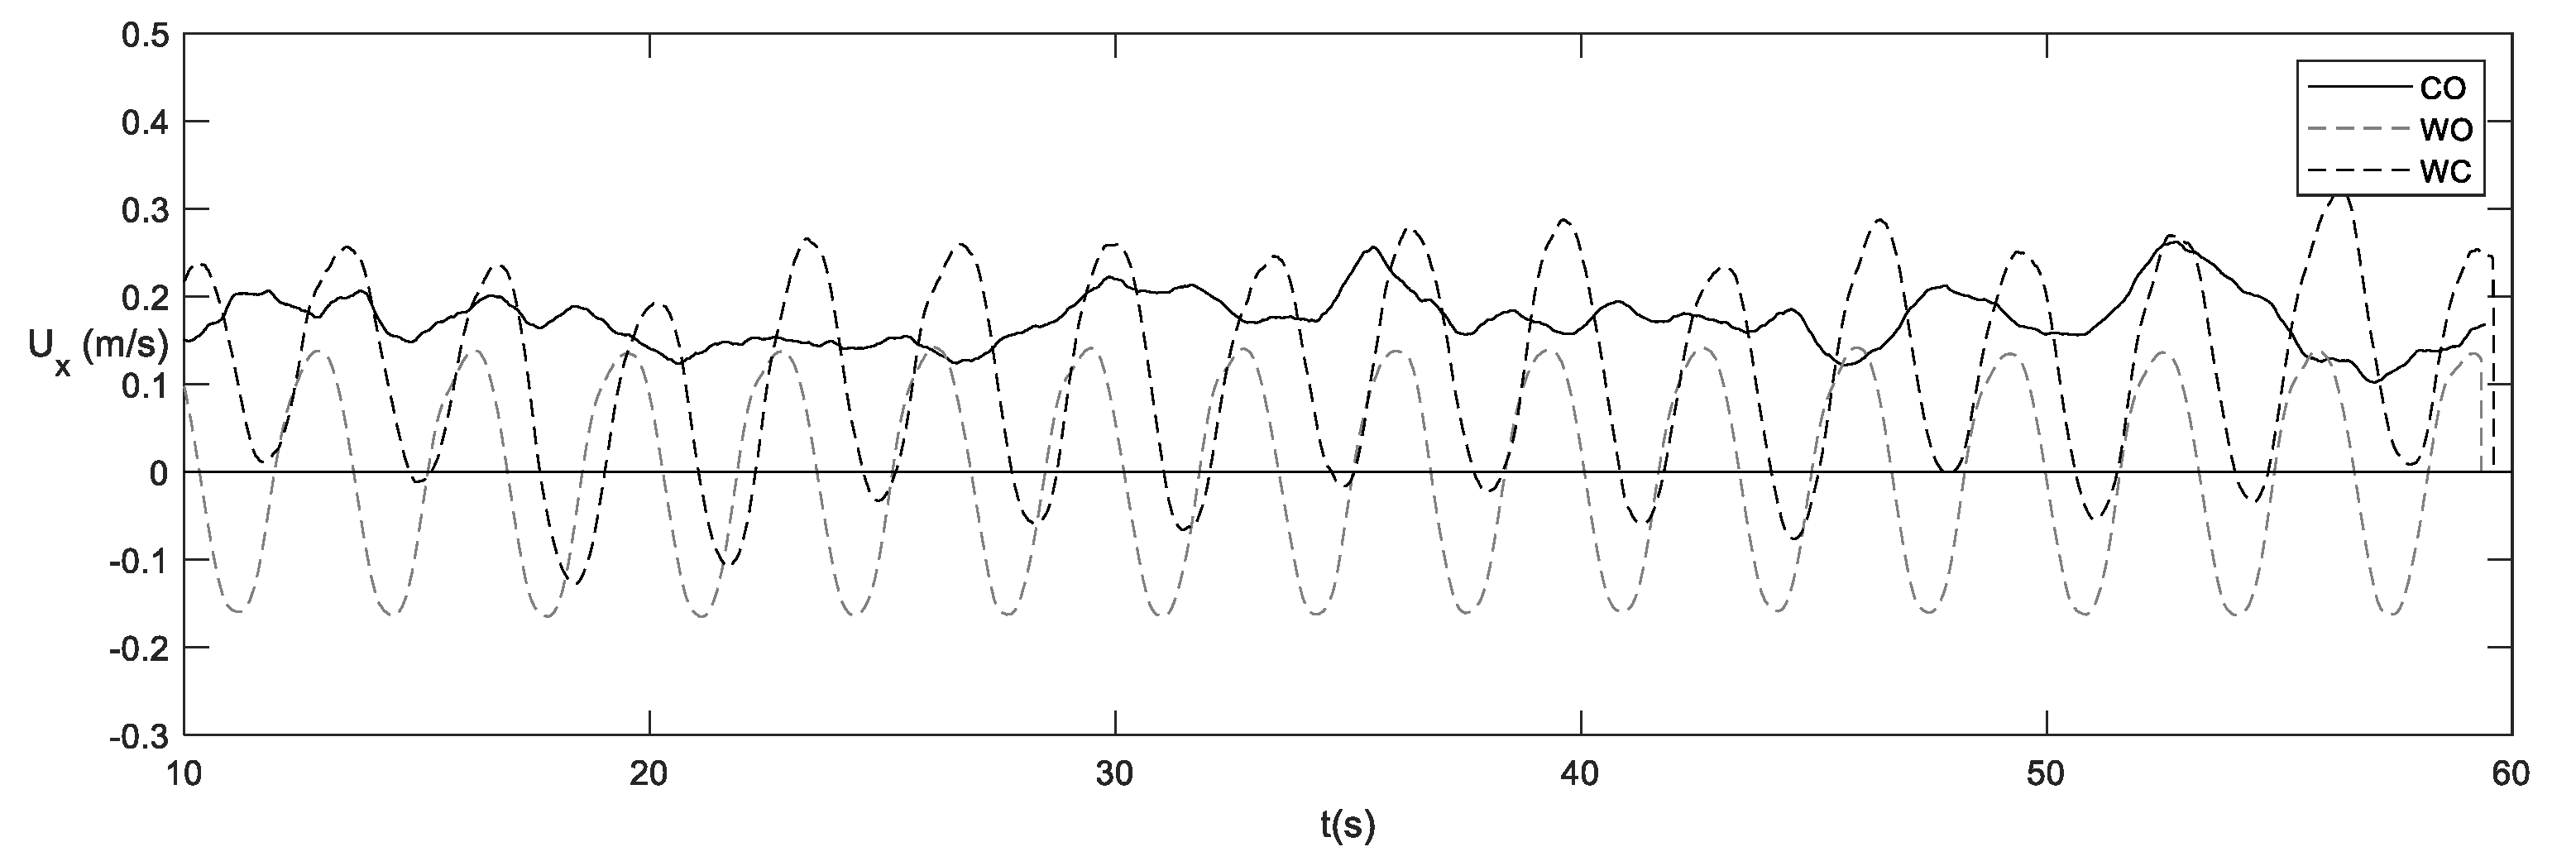
- the velocity in the WC tests is not always positive; therefore, the space- and time-averaged velocity shows a lower value than the current only one. The superposition of the wave on the current reduces the average velocity with respect to the CO case.
Author Contributions
Funding
Institutional Review Board Statement
Informed Consent Statement
Data Availability Statement
Conflicts of Interest
References
- Grant, W.; Madsen, O.S. The continental-shelf bottom boundary layer. Annu. Rev. Fluid Mech. 1986, 18, 265–305. [Google Scholar] [CrossRef]
- Andersen, K.H.; Faraci, C. The wave plus current flow over vortex ripples at an arbitrary angle. Coast. Eng. 2003, 47, 431–441. [Google Scholar] [CrossRef] [Green Version]
- Faraci, C.; Foti, E. Geometry, migration and evolution of small scale bedforms generated by regular and irregular waves. Coast. Eng. 2002, 47, 35–52. [Google Scholar] [CrossRef]
- Tunstall, E.B.; Inman, D.L. Vortex generation by oscillatory flow over rippled surfaces. J. Geophys. Res. 1975, 80, 3475–3484. [Google Scholar] [CrossRef]
- Mathisen, P.P.; Madsen, O.S. Waves and currents over a fixed rippled bed: 1. Bottom roughness experienced by waves in the presence and absence of currents. J. Geophys. Res. 1996, 101, 16533–16542. [Google Scholar] [CrossRef]
- Mathisen, P.P.; Madsen, O.S. Waves and currents over a fixed rippled bed: 2. Bottom and apparent roughness experienced by currents in the presence of waves. J. Geophys. Res. 1996, 101, 16543–16550. [Google Scholar] [CrossRef]
- Mathisen, P.P. Experimental study on the response of fine sediments to wave agitation and associated wave attenuation. Master’s Thesis, Massachusetts Institute of Technology, Cambridge, MA, USA, 1989. [Google Scholar]
- Andersen, K.H. The dynamics of ripples beneath surface waves and topics in shell models of turbulence. Ph.D. Thesis, University of Copenhagen, Copenhagen, Denmark, 1999. [Google Scholar]
- Earnshaw, H.C.; Greated, C.A. Dynamics of Ripple Bed Vortices. Exp. Fluids 1998, 25, 265–275. [Google Scholar] [CrossRef]
- Hara, T.; Mei, C.C. Centrifugal instability of an oscillatory flow over periodic ripples. J. Fluid Mech. 1990, 217, 1–32. [Google Scholar] [CrossRef]
- Scandura, P.; Vittori, G.; Blondeaux, P. Three-dimensional oscillatory flow over steep ripples. J. Fluid Mech. 2000, 412, 355–378. [Google Scholar] [CrossRef]
- Blondeaux, P.; Scandura, P.; Vittori, G. Coherent structures in an oscillatory separated flow: Numerical experiments. J. Fluid Mech. 2004, 518, 215–229. [Google Scholar] [CrossRef]
- Önder, A.; Yuan, J. Turbulent dynamics of sinusoidal oscillatory flow over a wavy bottom. J. Fluid Mech. 2019, 858, 264–314. [Google Scholar] [CrossRef]
- Peruzzi, C.; Vettori, D.; Poggi, D.; Blondeaux, P.; Ridolfi, L.; Manes, C. On the influence of collinear surface waves on turbulence in smooth-bed open-channel flows. J. Fluid Mech. 2021, 924. [Google Scholar] [CrossRef]
- Faraci, C.; Musumeci, R.E.; Marino, M.; Ruggeri, A.; Carlo, L.; Jensen, B.; Foti, E.; Barbaro, G.; Elsaßer, B. Wave- and current-dominated combined orthogonal flows over fixed rough beds. Cont. Shelf Res. 2021, 220, 104403. [Google Scholar] [CrossRef]
- Kemp, P.H.; Simons, R.R. The interaction between waves and a turbulent current: Waves propagating with the current. J. Fluid Mech. 1982, 116, 227–250. [Google Scholar] [CrossRef] [Green Version]
- Inman, D.L.; Bowen, A.J. Flume experiments on sand transport by waves and currents. Coast. Eng. Proc. 1962, 11. [Google Scholar] [CrossRef] [Green Version]
- Bijker, E.W.; van Hijum, E.; Vellinga, P. Sand transport by waves. In Proceedings of the 15th International Conference on Coastal Engineering, Honolulu, Hawaii, 11–17 July 1976. [Google Scholar]
- Aydin, I. Computation and analysis of unsteady turbulent flow on flat bottom and over rigid ripples. PhD Thesis, Tohoku University, Sendai, Japan, 1987. [Google Scholar]
- Fredsøe, J.; Andersen, K.H.; Sumer, B.M. Wave plus current over a ripple-covered bed. Coast. Eng. 1999, 38, 177–221. [Google Scholar] [CrossRef]
- Macvicar, B.J.; Dilling, S.; Lacey, R.W.J.; Hipel, K. A quality analysis of the Vectrino II instrument using a new open-source MATLAB toolbox and 2D ARMA models to detect and replace spikes. In Proceedings of the River Flow 2014—7th International Conference on Fluvial Hydraulics, Lausanne, Switzerland, 3–5 September 2014. [Google Scholar]
- Nielsen, P. Coastal Bottom Boundary Layers and Sediment Transport; World Scientific: Singapore, 1992. [Google Scholar]
- Petrotta, C.; Faraci, C.; Scandura, P.; Foti, E. Experimental investigation on sea ripple evolution over sloping beaches. Ocean Dyn. 2018, 68, 1221–1237. [Google Scholar] [CrossRef]
- Scandura, P.; Faraci, C.; Foti, E. A numerical investigation of acceleration-skewed oscillatory flows. J. Fluid Mech. 2016, 808, 576–613. [Google Scholar] [CrossRef]
- Hsu, T.; Hanes, D. Effects of wave shape on sheet flow sediment transport. J. Geophys. Res. 2004, 109, 15. [Google Scholar] [CrossRef]
- Nielsen, P. Dynamics and geometry of wave-generated ripples. J. Geophys. Res. 1981, 86, 6467–6472. [Google Scholar] [CrossRef]
- Grasmeijer, B.; Kleinhans, M. Observed and predicted bed forms and their effect on suspended sand concentrations. Coast. Eng. 2004, 51, 351–371. [Google Scholar] [CrossRef]
- Bosman, J.J. Bed Behavior and Sand Concentration Under Oscillatory Water Motion; Delft Hydraulics Laboratory: Delft, The Netherlands, 1981. [Google Scholar]
- Ruggeri, A.; Musumeci, R.E.; Faraci, C. Wave-Current Flow and Vorticity Close to a Fixed Rippled Bed. J. Mar. Sci. Eng. 2020, 8, 867. [Google Scholar] [CrossRef]
- Horikawa, K.; Mizutani, S. Oscillatory Flow Behavior in the Vicinity of Ripple Models. In Proceedings of the 23rd International Conference on Coastal Engineering, Venice, Italy, 4–9 October 1992. [Google Scholar]
- Admiraal, D.; Musalem-Jara, R.; García, M.; Niño, Y. Vortex trajectory hysteresis above self-formed vortex ripples. J. Hydraul. Res. 2006, 44, 437–450. [Google Scholar] [CrossRef]
- Scandura, P.; Faraci, C.; Blondeaux, P. Steady Streaming Induced by Asymmetric Oscillatory Flows over a Rippled Bed. J. Mar. Sci. Eng. 2020, 8, 142. [Google Scholar] [CrossRef] [Green Version]
- Faraci, C.; Foti, E.; Musumeci, R.E. Waves plus currents at a right angle: The rippled bed case. J. Geophys. Res. 2008, 113, C07018. [Google Scholar] [CrossRef] [Green Version]


| Run | Type | f (Hz) | A (m) | |
|---|---|---|---|---|
| Movable bed | M1 | CO | - | - |
| M2 | WO | 0.2 | 0.154 | |
| M3 | WO | 0.3 | 0.102 | |
| M4 | WC | 0.2 | 0.154 | |
| M5 | WC | 0.3 | 0.102 | |
| Fixed bed | F1c | CO | - | - |
| F1i | CO | - | - | |
| F1t | CO | - | - | |
| F2c | WO | 0.3 | 0.102 | |
| F2i | WO | 0.3 | 0.102 | |
| F2t | WO | 0.3 | 0.102 | |
| F3c | WC | 0.3 | 0.102 | |
| F3i | WC | 0.3 | 0.102 | |
| F3t | WC | 0.3 | 0.102 |
| Run | Type | η (cm) | λ (cm) | Red | ||
|---|---|---|---|---|---|---|
| M2 | WO | 0.7 | 6.35 | 29,648 | 24 | 18.41 |
| M3 | WO | 0.95 | 6.05 | 19,766 | 24 | 18.41 |
| M4 | WC | 0.8 | 6.56 | 29,648 | 24 | 18.41 |
| M5 | WC | 1.1 | 6.11 | 19,766 | 24 | 18.41 |
Publisher’s Note: MDPI stays neutral with regard to jurisdictional claims in published maps and institutional affiliations. |
© 2022 by the authors. Licensee MDPI, Basel, Switzerland. This article is an open access article distributed under the terms and conditions of the Creative Commons Attribution (CC BY) license (https://creativecommons.org/licenses/by/4.0/).
Share and Cite
Ruggeri, A.; Faraci, C. Collinear Interaction of Waves and Current in the Presence of Ripple in the U-Tube. Water 2022, 14, 470. https://doi.org/10.3390/w14030470
Ruggeri A, Faraci C. Collinear Interaction of Waves and Current in the Presence of Ripple in the U-Tube. Water. 2022; 14(3):470. https://doi.org/10.3390/w14030470
Chicago/Turabian StyleRuggeri, Alessia, and Carla Faraci. 2022. "Collinear Interaction of Waves and Current in the Presence of Ripple in the U-Tube" Water 14, no. 3: 470. https://doi.org/10.3390/w14030470
APA StyleRuggeri, A., & Faraci, C. (2022). Collinear Interaction of Waves and Current in the Presence of Ripple in the U-Tube. Water, 14(3), 470. https://doi.org/10.3390/w14030470