Article

Exploring the Spatio-Temporal Variability of Precipitation over the Medjerda Transboundary Basin in North Africa

1
Materials, Energy Systems Technology and Environment Laboratory, Ghardaia University, Scientific Zone, P.O. Box 455, Ghardaia 47000, Algeria
2
Laboratory of Soil and Hydraulic, Badji Mokhtar Annaba University, P.O. Box 12, Annaba 23000, Algeria
3
Laboratory of Modeling of Geological and Hydrological Systems (GEOMODELE (LR16ES17)), Faculty of Sciences, University of Sfax, P.O. Box 1171, Sfax 3000, Tunisia
4
Disaster Prevention Research Institute (DPRI), Kyoto University, Kyoto 611-0011, Japan
5
HydroSciences Montpellier, University Montpellier, CNRS, IRD, 34000 Montpellier, France
*
Author to whom correspondence should be addressed.
Water 2022, 14(3), 423; https://doi.org/10.3390/w14030423
Submission received: 15 December 2021 / Revised: 22 January 2022 / Accepted: 25 January 2022 / Published: 29 January 2022
(This article belongs to the Section Hydrology)

Abstract

:
Medjerda is a key transboundary watershed in the Maghreb region, crossing from the Algerian mountains through northern Tunisia. Therefore, the analysis of the rainfall regime in this basin is of paramount importance for water resources management and regional economic development, notably concerning agriculture. This study examines the rainfall trends over the Medjerda watershed on multi-temporal scales (monthly, seasonally and annually) with a database of monthly rainfall observed in 60 stations evenly spread over the watershed. After filling gaps and homogenizing data, the Mann–Kendall test for trend detection was applied to rainfall series and the Sen’s slope method was adopted to estimate the trend’s magnitude, interpolated over the sub-catchments, to analyze the spatial distribution of rainfall changes within the watershed. Results showed the absence of significant trends at the annual scale for the entire catchment. However, rainfall redistribution was observed throughout the year, with a notable precipitation reduction during spring and increased winter precipitation, which could impact agriculture and ecosystem functioning. This modification of the rainfall regime implies an adaptation of the management of dams and reservoirs, with a reduced filling capacity during spring in anticipation of the summer dry season.

1. Introduction

The Medjerda Watershed represents one of the essential transboundary basins in North Africa. Shared by two countries (Algeria and Tunisia), the basin plays a significant role in developing regional water resources, notably for water supply and irrigation with several large dams and notably the largest one, the Sidi Salem dam [1]. The watershed accounts for about 80% of Tunisia’s total surface water resources, covering only 17% of its territory. In addition, the food security of the entire country relies on it through the mobilization and maximum control of its water resources. However, the North African region is considered a “prominent regional climate change hotspot” [2,3]. The North African region has received significant attention from researchers because of its vulnerability due to the scarcity of water resources, the strong population growth, and social unrest [4]. In addition to these issues, climatologists project an aggravation of the water situation. Tramblay et al. [5], Lionello and Scarascia [6] project a decrease in mean annual precipitation over the Mediterranean Region of Northern Africa in the mid and late 21st century periods. The water resource assessment carried out by Rajosoa et al. [7] also showed an alarming situation in some sites of the Medjerda watershed for both countries (Algeria and Tunisia).
Several studies were carried out separately, either on the Algerian side [8,9] or on the Tunisian side of the Medjerda Watershed [10,11] or on individual stations [12]. Applying the Mann–Kendall (MK) test [13,14] and Sen’s slope [15] to the precipitation of three catchments located in North-eastern Algeria (Algerian side of Medjerda), Mrad et al. [8] showed a significant decreasing trend of annual rainfall. As for the Tunisian side, examining seasonal trends by the World Bank report [10] showed that only the spring season is concerned with a decreasing trend. Moreover, Bargaoui et al. [11] adopted the MK test to verify that observed seasonal totals are stationary and found no trend for all seasons and basins of Northern Tunisia. These trend analyses were carried out on either side (Tunisian or Algerian) of the basin [16] or with a scarce gauging network, which may affect the representativeness of the analysis. Unlike these previous studies, the present work examines the trend of rainfall considering the spatial and temporal (monthly, seasonally, and annually) aspects of the entire watershed using a newly assembled database of precipitation covering the whole basin. The relatively simple and widely used MK test and the Theil–Sen slope median estimator were judged efficient and reliable for the analysis of the rainfall trend. In order to have an overview of the spatial trend variability over the catchment, an interpolation of Sen’s slope was performed using the kriging method. Furthermore, regional representativity of the MK test results is analyzed by visualizing the geographic situation of stations with a significant trend on the map obtained by the interpolation of Sen’s slopes.
It is crucial to estimate the potential influence of large-scale modes of climate variability to assess the main drivers of rainfall variability (teleconnections). These teleconnection patterns are natural aspects of our atmospheric system and represent a signature of internal atmospheric dynamics [17]. The Mediterranean climate of North Africa is influenced by the North Atlantic Oscillation (NAO) [18]. It is considered one of the most prominent modes of the northern hemisphere climate variability [19,20,21,22]. In addition to the NAO, the Southern Oscillation (SO) is also defined as a global atmospheric oscillation. It represents an east–west movement of air masses between the Pacific and the Indo-Australian areas. Donat et al. [23] found that SO correlates with annual rainfall in the Mediterranean region, which confirm its influence on this area. At the regional scale, Conte et al. [24] suggested the possible existence of the Mediterranean Oscillation (MO) pattern, which is the result of the atmosphere’s dipole behavior in the region situated between the western and eastern Mediterranean. For the upper part of the Medjerda basin, Ouachani et al. [25] indicated a significant association of precipitation anomalies with the SO index. In this study, the two large-scale internal variability indices are used, the NAO and SO, in addition to the regional scale MO. These three indices (NAOi, SOi, and MOi) were used to identify their link with annual, seasonal and monthly rainfall data, notably to assess the potential of the seasonal previsibility of rainfall according to these modes of climate variability.
Analyzing spatial rainfall trends in the Medjerda watershed can provide valuable benefits for the water resources management of this crucial regional basin, particularly the potential regions where water shortages may increase over time. Moreover, this study emphasizes the links between rainfall trends in this basin and large-scale teleconnection patterns. It is worth mentioning that this study is the first analysis of the rainfall variability considering the entire transboundary catchment of the Medjerda.

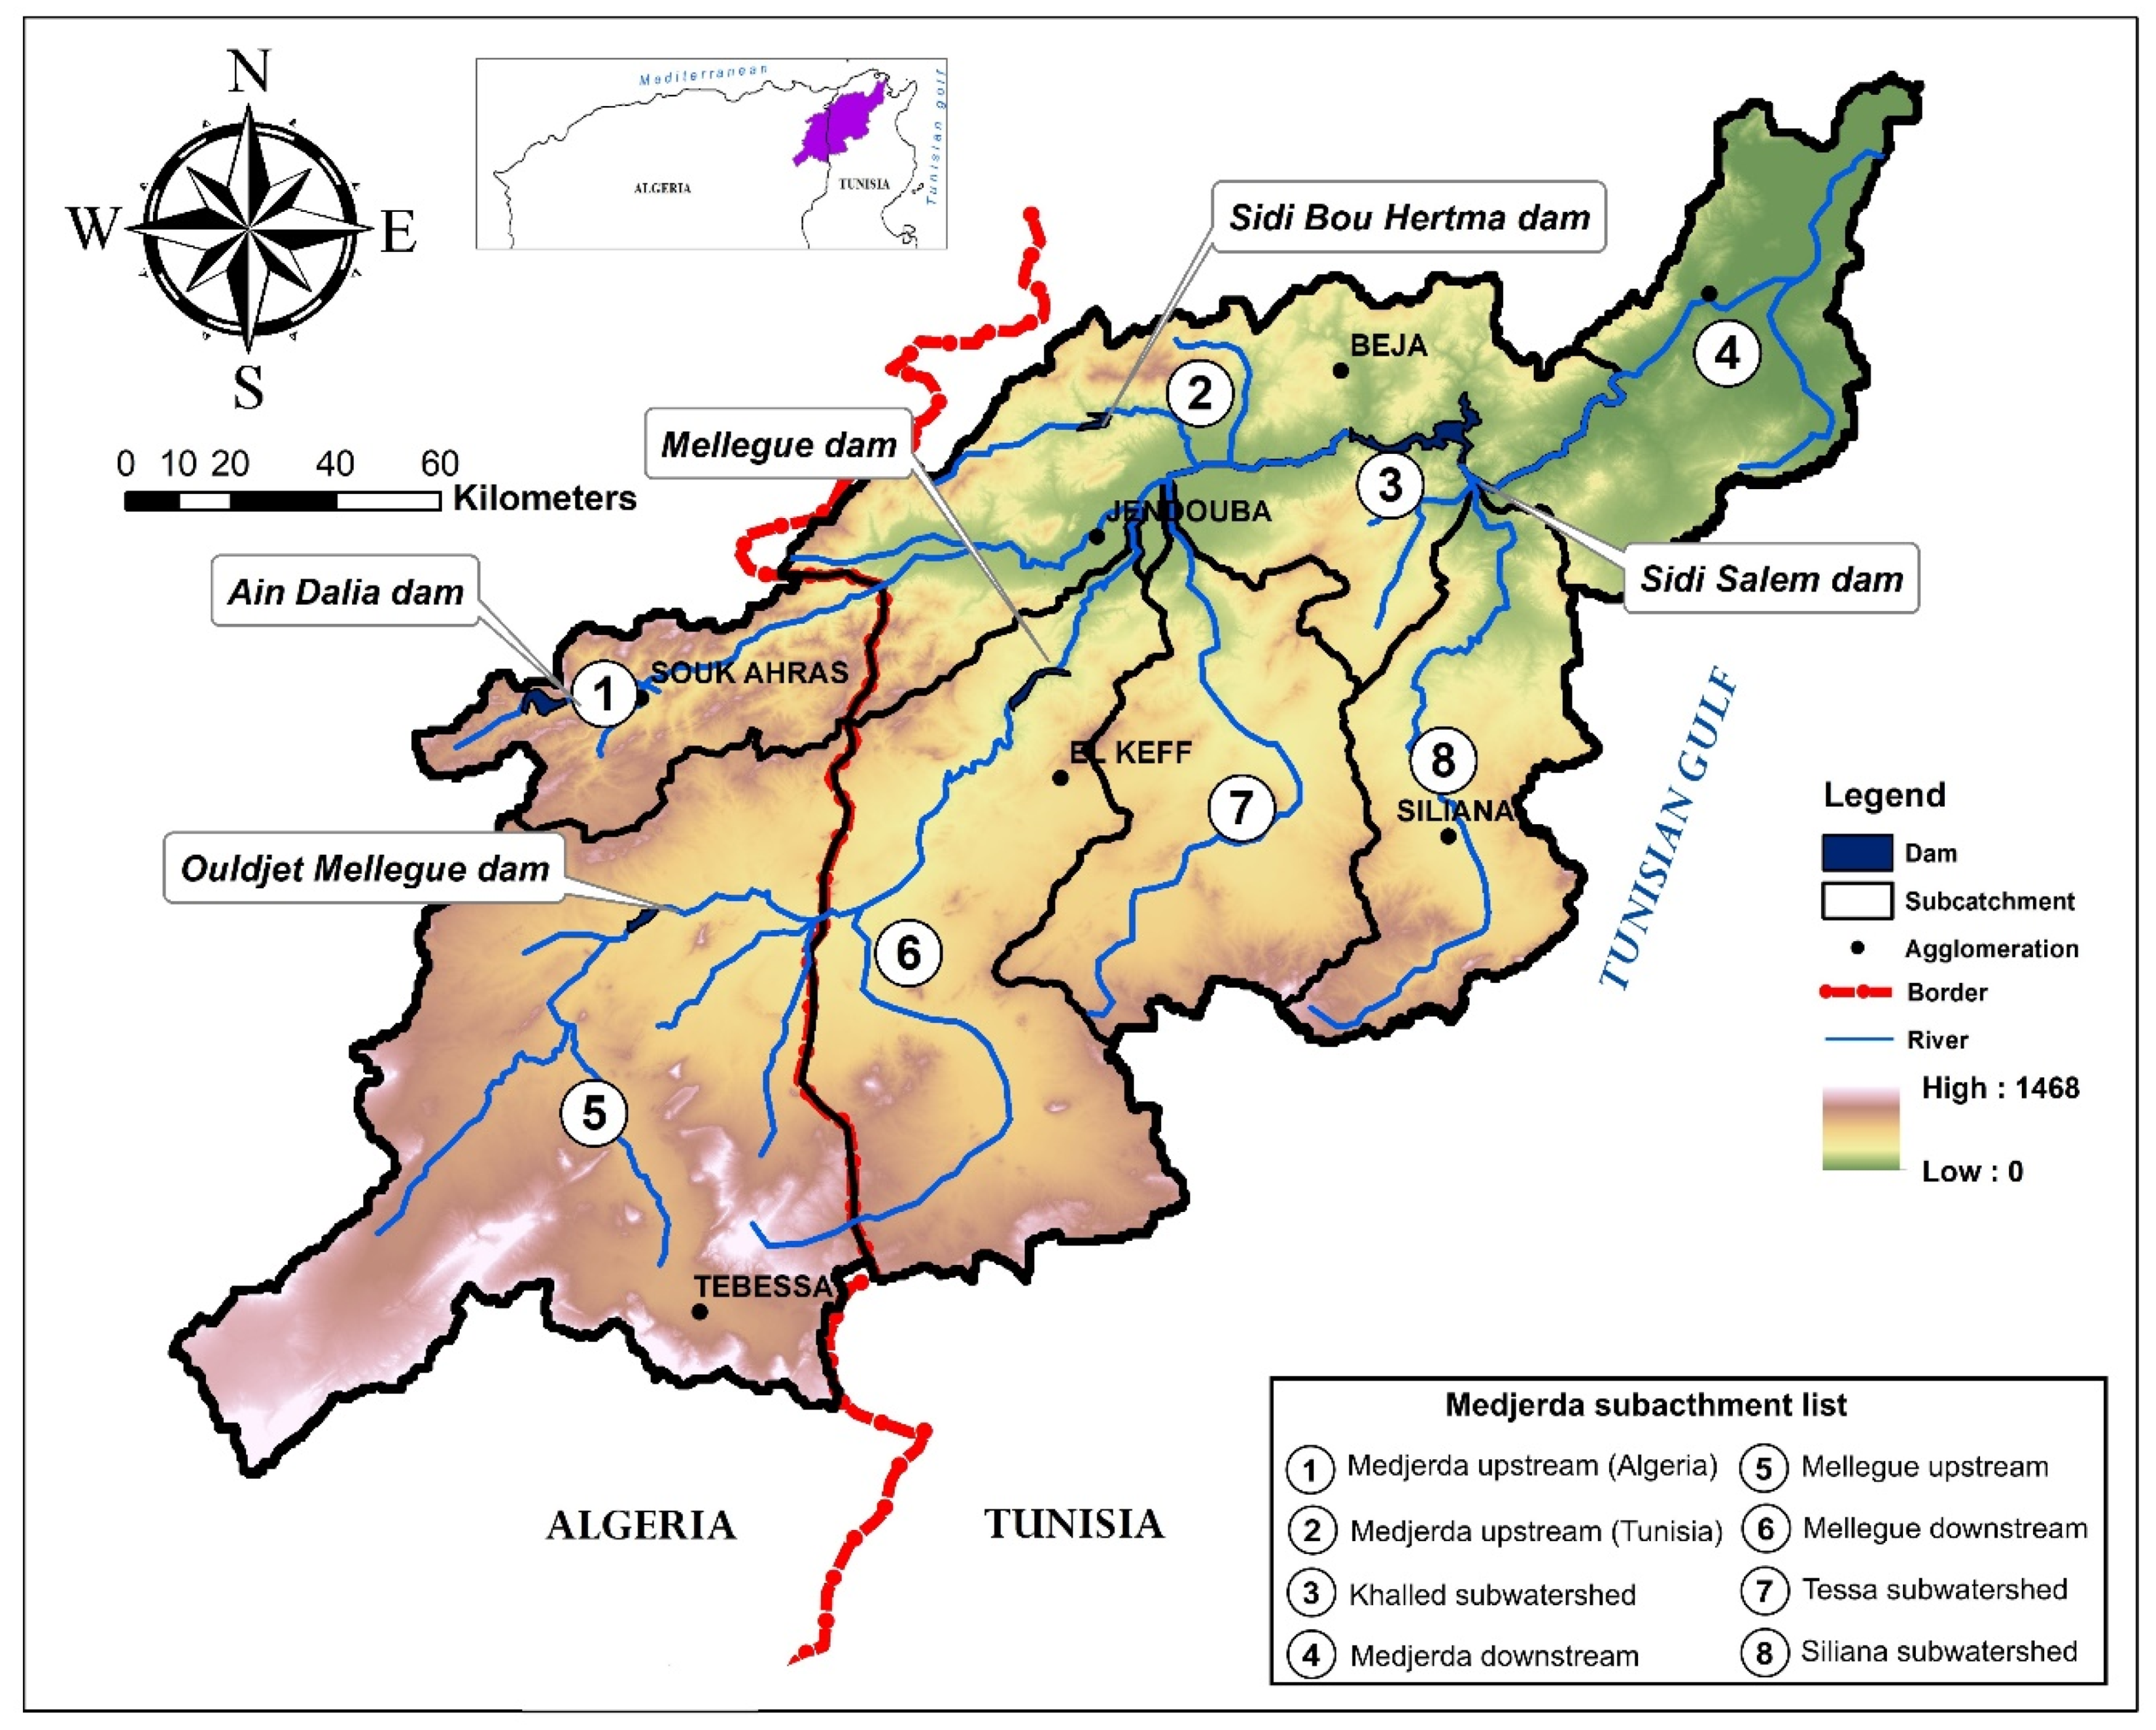
2. Study Area and Data

The study area is the transboundary Medjerda Watershed (Figure 1), located in Algeria and Tunisia. This catchment covers approximately 24,000 km², of which 7700 km² (32%) is in Algeria. The basin spans 35.20–37.15° N and 7.15–10.20° E, is characterized by altitudes varying from 0 to 1468 m and a weak vegetative cover. The major river of the watershed under study, Medjerda, is the only perennial watercourse in Tunisia. It flows from the Atlas Mountains of Eastern Algeria with its most crucial tributary (Mellegue River) to enter the Gulf of Utica in the Mediterranean Sea.
Considered one of the most important watersheds in the Maghreb Region and North Africa, the Medjerda Watershed remains a strategic region for drinking water supply, irrigation, and electricity production. The Algerian government constructed two dams, named Ain Dalia and Mellegue, with 76 and 150 million cubic meters, respectively. The Tunisian government invested more, building three dams (Mellegue, Bou Heurtma, and Sidi Salam dams). The latter is the largest in Tunisia, with an original capacity of 555 million cubic meters. It also supports a 20-megawatt power station. These investments are explained by the fact that the Tunisian side of the Medjerda represents the largest watershed in the country.

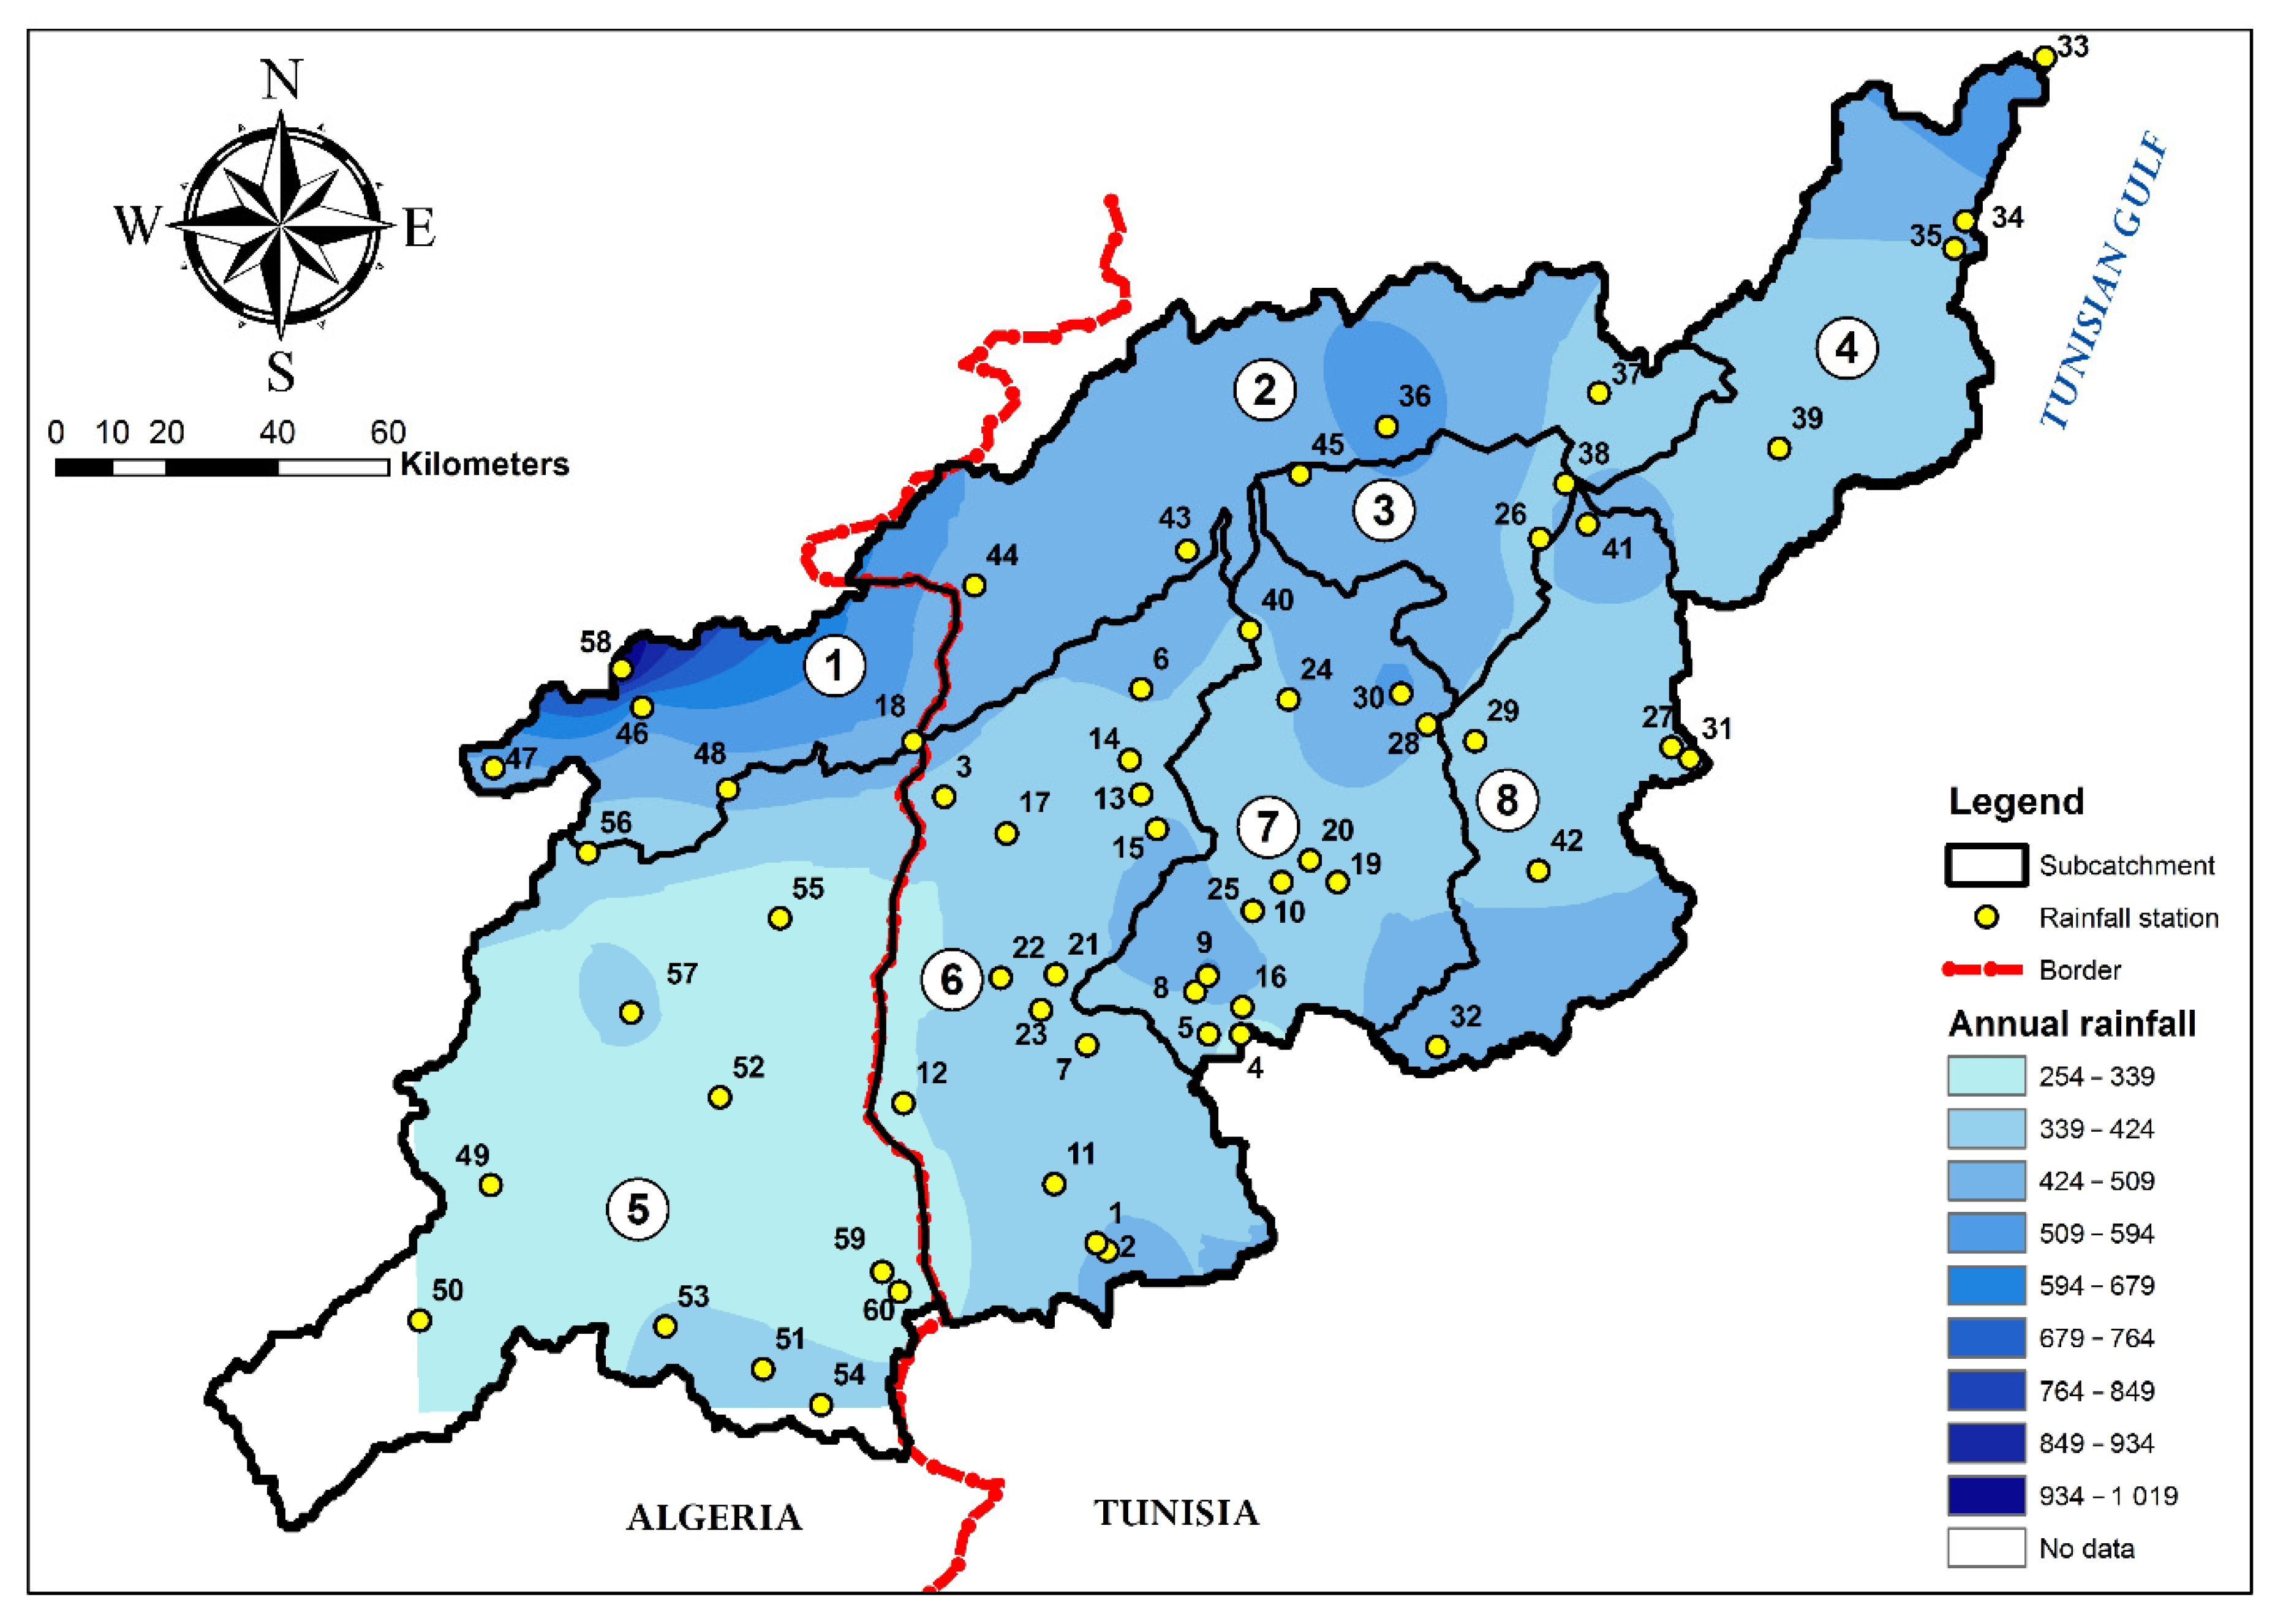
2.1. Rainfall Dataset

This study’s monthly rainfall data were collected from the Algerian National Agency of Hydraulic Resources (ANRH) and the Tunisian hydrological service (DGRE). Sixty rainfall stations (Table 1) were selected for the trend analysis based on the following criteria:
(1)
A length of serial data equals or exceeds thirty years;
(2)
Serial data of the same period;
(3)
Quality of data: a missing data threshold of 15% at each station was fixed.
The Medjerda catchment lies within a sub-humid to Mediterranean humid bio-climatic region. The annual average rainfall in the basin is around 415 mm. The yearly maximum rainfall value (1486 mm) occurred in the North of the catchment (Ain Seynour, Algerian side) in 2002, and a minimum value (49 mm) was registered in Ouanza Station (Algeria) in 1993.

2.2. Large-Scale Climate Indices
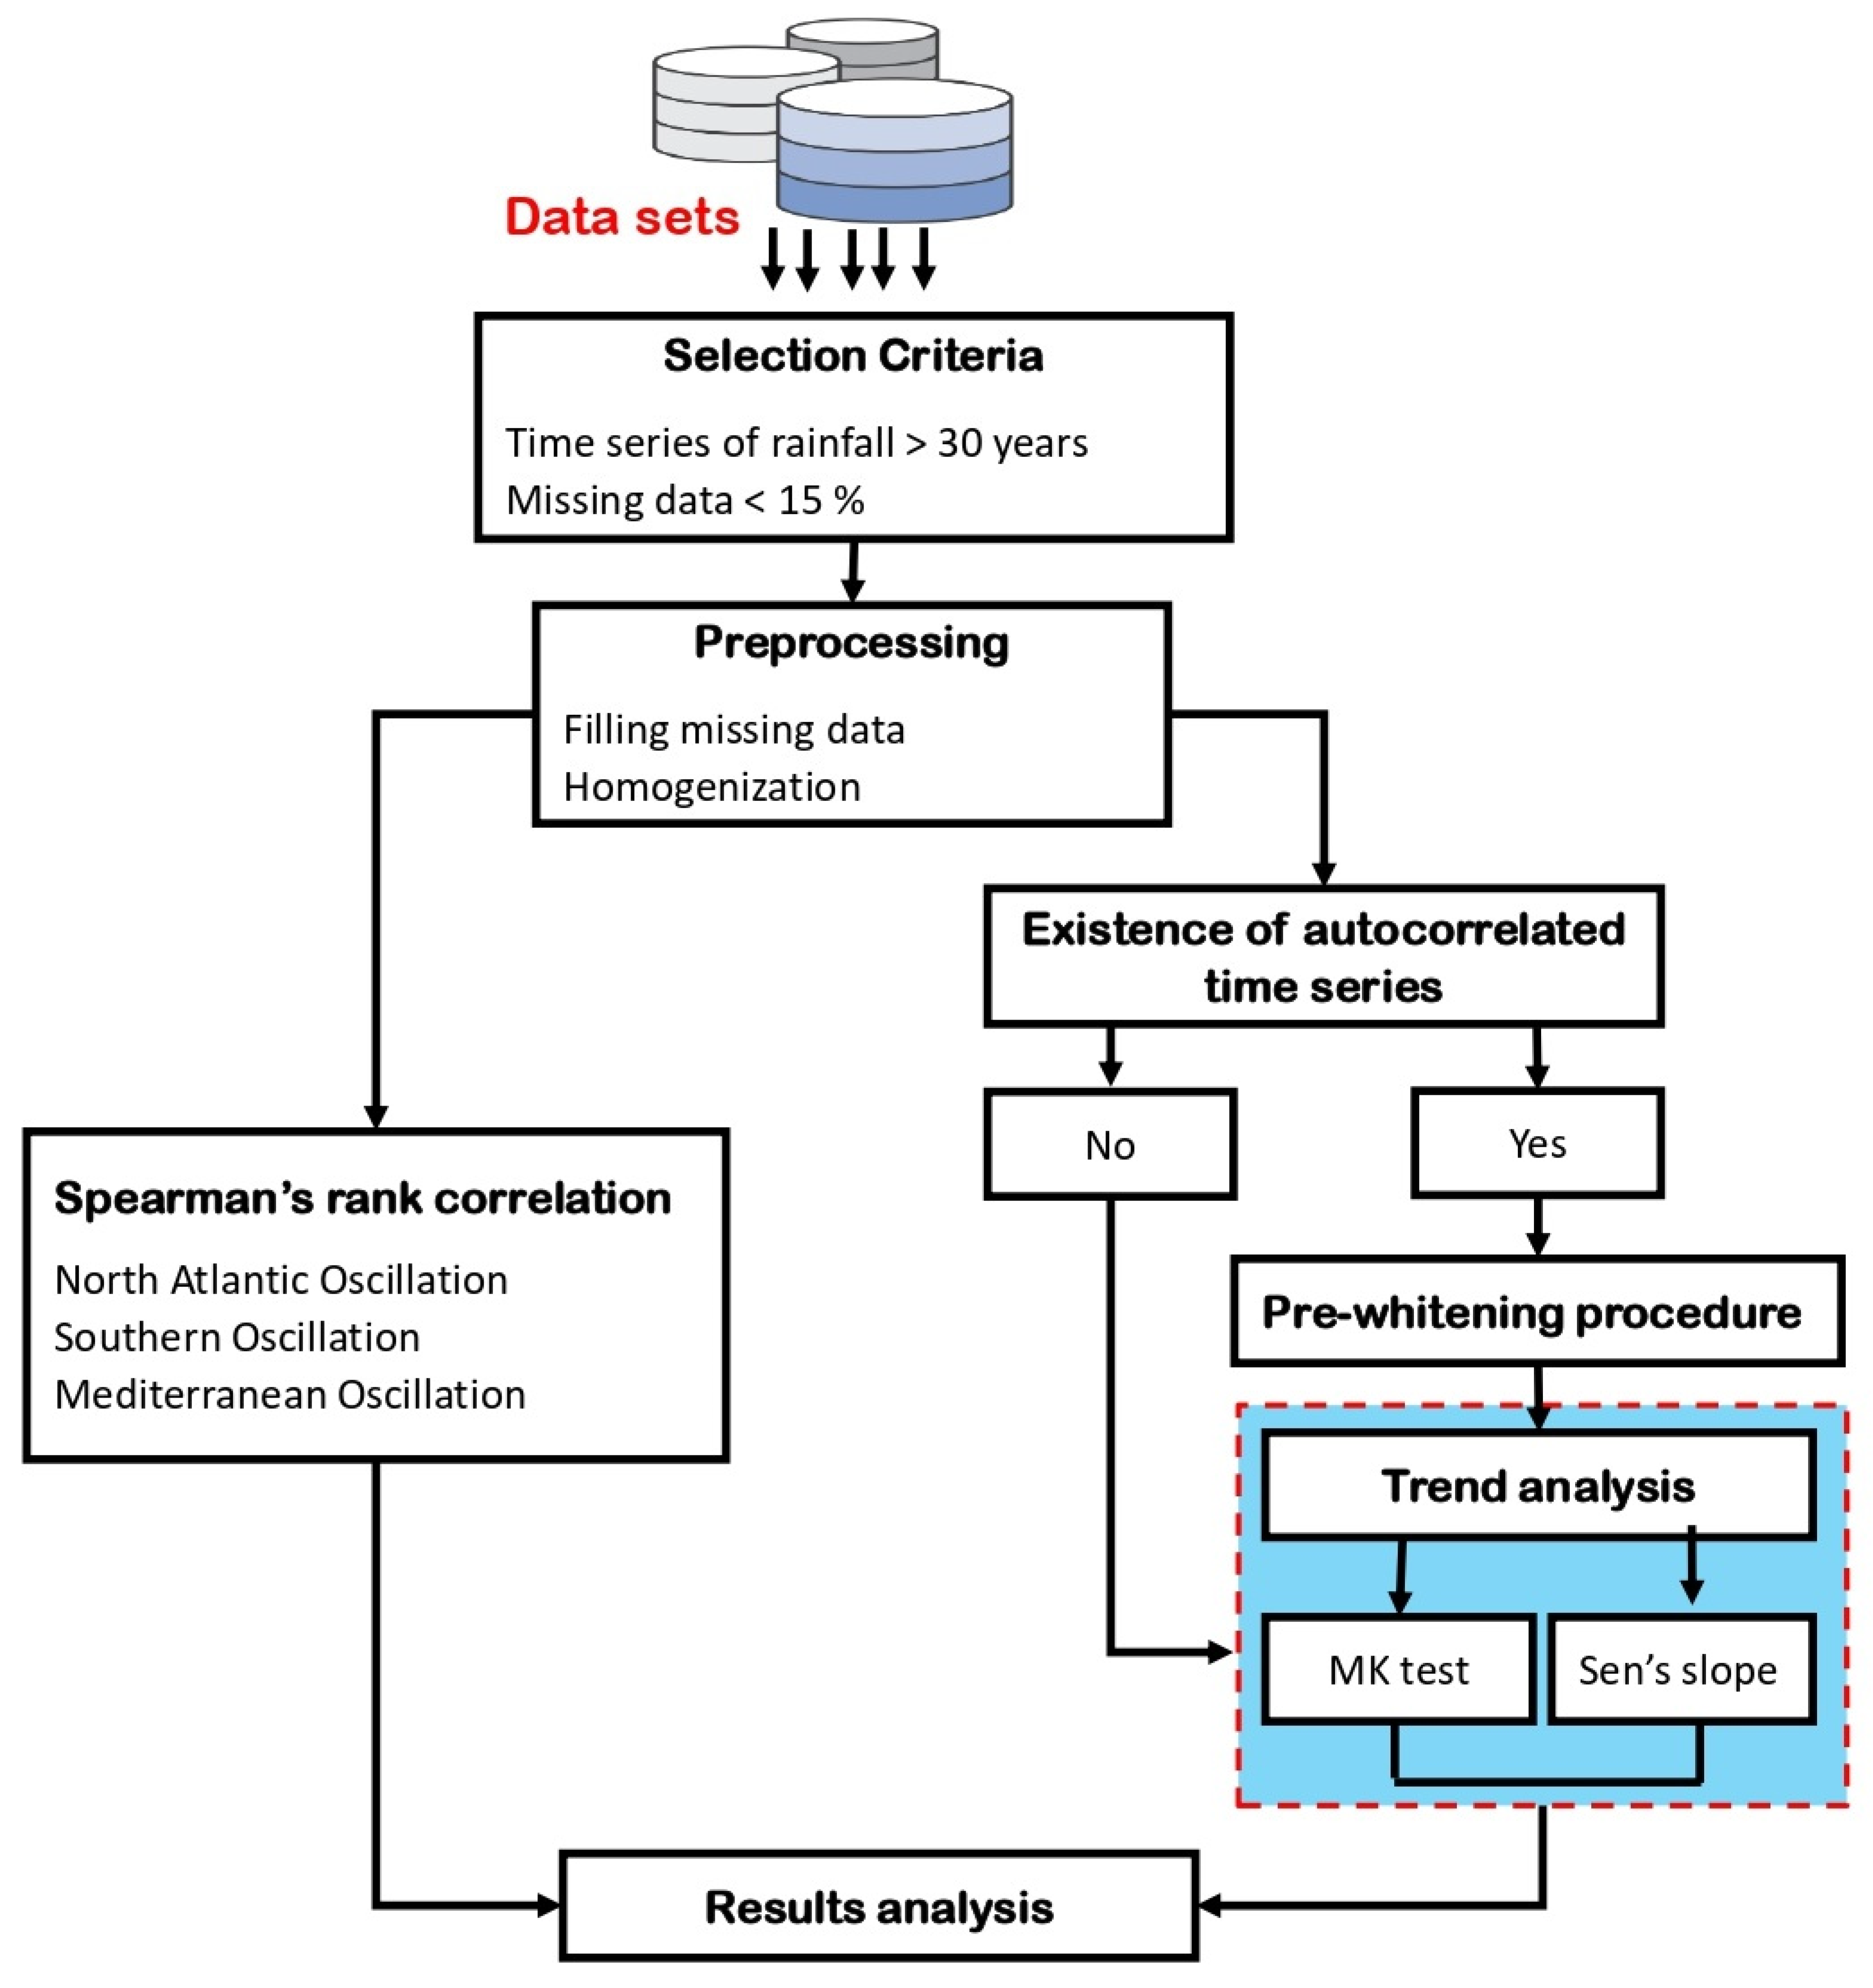
Three indices (NAOi, SOi, and MOi) were used in this study to assess their influences on the rainfall variability of the Medjerda watershed. The North Atlantic Oscillation (NAO) and the Southern Oscillation (SO) represent two large-scale internal variability indices. The NAO is known by mass air displacement between the Arctic and the subtropical Atlantic, and it is one of the most prominent modes of the northern hemisphere climate variability [21]. Its influence on rainfall in the Mediterranean region was confirmed in recent studies [26,27,28]. The strength of the NAO is generally expressed through an index [29,30] measuring the difference between the normalized sea level pressure recorded in the Atlantic at high and low latitudes (Iceland and Portugal in this study). Regarding SO, it represents an east–west movement of air masses between the Pacific and the Indo–Australian areas. It is evaluated between Tahiti and Darwin on the opposite sides of the Pacific Ocean [31].
In addition to these large-scale indices, there are others with a smaller regional scale, such as the Mediterranean Oscillation (MO) index, calculated as the difference of pressure between the western and the eastern parts of the Mediterranean Basin [24]. Several versions of this MOi have been used in the literature. However, the version of Conte et al. [24], who defined MOi index as the normalized 500 hPa geopotential heights’ difference between Algiers (36.4° N, 3.1° E) and Cairo (30.1° N, 31.4° E), was used in this study. This choice is based on the results of Criado-Aldeanueva and Soto-Navarro [32], showing the highest correlation compared to other versions, especially for most winter-averaged variables, revealing more clearly the well-known dipole response of the eastern and western basins (Algiers and Cairo).
Climatic indices values (NAOi, SOi, MOi) were provided from the Climatic Research Unit website (https://crudata.uea.ac.uk/cru/data/pci.htm, accessed on 7 October 2021) of the University of East Anglia.

3. Methodology

In the present study, rainfall trend analysis of the transboundary Medjerda Watershed was performed using the MK test and Theil–Sen’s median slope estimator. Prior to any investigation, homogeneity tests and filling missing data procedures were first considered for the preparation of time series data. These phases were followed by the Trend-Free Pre-Whitening (TFPW) procedure to remove the effect of serial correlation in rainfall time series. Figure 2 describes the steps followed in this study.

3.1. Data Preprocessing

Climate measurements can be influenced by many factors other than those due to the atmosphere. Instruments or environment changes, station relocation, or calculation methods may affect the variation of climatological time series, generating outliers and inhomogeneities. Therefore, data have to be preprocessed (homogenization process) before any climate analysis to avoid misinterpretation of results. The importance of rainfall data homogenization in the Medjerda Basin was confirmed by Abidi et al. [33], who detected several change points on monthly rainfall time series in one of its subwatershed, explaining thereby the presence of inhomogeneities.
Data homogenization was examined by the “Climatol v3.0” R Package developed by Guijarro [34], which is based on the relative homogenization method rather than absolute methods. This choice is explained by the fact that the latter methods, where non-stationarity is checked based on a single climatological series, assume that the climate is stable, which is not realistic. Furthermore, the homogenization procedure is based on the commonly used method of shift detection, the Standard Normal Homogeneity Test (SNHT) [35].
In addition to homogenization procedures, the Climatol package is able to fill missing gaps in data by using a form of orthogonal regression, known as Reduced Major Axis (RMA) [36].
Operations performed by Climatol Package follow the steps given below:
(1)
Calculation of means ( m ) and standard deviations ( s ) of data series;
(2)
Detection of shifts in means (inhomogeneities) through the SNHT on stepped overlapping windows:
(a)
Standardization of series:
x = ( X m X ) / s X
(b)
Estimation of all database series with the RMA
(c)
Undo Standardization and computation of anomaly series (A)
(d)
Filling missing data, standardization of anomalies, and deletion of values more significant than a threshold (outliers).
(e)
Checking for mean change, if that is the case (according to a threshold), the steps above are repeated until the change is minimized.
(f)
Checking for inhomogeneities with the SNHT: if it exists, the series is split at the point of maximum SNHT. Otherwise, continue to the next step.
(g)
Checking for mean change, if that is the case, steps (a) to (f) are repeated;
(3)
Detection of inhomogeneities through the SNHT on the whole series and repetition of steps (a) to (g).
For more details on this package, the reader is referred to the comprehensive guide [37].

3.1.1. Standard Normal Homogeneity Test (SNHT)

This test is used to detect a shift by comparing the mean of a first period with the next one. Let y i ( i = 1 , , n ) denote standardized candidate series of a station to be tested for homogeneity using neighboring station series and q i ( i = 1 , , n ) ratios between these latter and the candidate series.
y i = ( q i m q ) / s q ,
where m q and s q are, respectively, the mean and standard deviation of ratios q i .
Two hypotheses are defined for this test: H 0 and H 1 for null and alternative hypotheses, respectively.
H 0 : y i N ( 0 , 1 )   f o r   i = 1 , , n
H 1 :   { y i N ( μ 1 , 1 ) f o r   i = 1 , ,   v y i N ( μ 2 , 1 ) f o r   i = v + 1 , ,   n .
Hypothesis zero denotes that y i follows a normal distribution, with zero mean value and unit standard deviation, while the alternative hypothesis assumes that the mean value changes from one sequence to another. To test which hypothesis is valid, a statistical test ( T 0 ) is computed:
T 0 = max [ v y ¯ 1 2 + ( n v ) y ¯ 2 2   ,   with   1 v n 1 ,
where:
y ¯ 1 = 1 v 1 v y i
y ¯ 2 = 1 n v i = v + 1 n y i .
The v value corresponds to the year (or the month and year), which is the most probable for a break. In the case of a value of T 0 greater than a certain critical level, the series should be classified as non-homogeneous at a certain level (see Alexandersson [35] for critical levels for the ratio test), that is, the null hypothesis is rejected.

3.1.2. Pre-Whitening Procedure

Yue et al. [38] found that positive serial correlation increases the variance of the MK statistic. c while no real trend exists. This fact has been shown in several climatological, hydrological, statistical studies [39,40,41]. For this purpose, Yue, Pilon, Phinney and Cavadias [30] recommended a Trend-Free Pre-Whitening (TFPW) procedure to remove the lag-one autoregressive [AR(1)] process of auto-correlated time series.
TFPW procedure is processed before applying the MK test for time series with significant serial correlation. This method is described in Yue et al. [38], following these steps:
(1)
Assuming that the slope ( β i ) of a trend differs from zero; sample data are detrended using:
X i = X i β i ,
where X i and X i are respectively, detrended and trended series.
(2)
Performing the lag-1 serial correlation coefficient ( r 1 ) of the detrended series ( X i ) and then removing AR(1) by:
Y i = X i r 1 X i 1 ,
where r 1 is computed using Salas et al. [42] by:
r 1 = 1 n 1 i = 1 n 1 [ X i E ( X i ) ] [ X i + 1 E ( X i ) ] 1 n i = 1 n [ X i E ( X i ) ] 2 ,
with E ( X i ) is the mean of sample data.
(3)
The slope ( β i ) and the residual Y i are combined by:
Y i = Y i + β i .
Using Y i series rather than the first form of sample data ( X i ) avoids false trend detection due to the effect of autocorrelation.

3.2. Trend Analysis

Detecting trends on serial series may be performed by parametric or non-parametric tests. The former may be only used when data of a given variable are normally distributed, which is a non-justified condition in the rainfall data. This explains the interest of researchers working on rainfall trends to use non-parametric methods, where data used must be independent and homogeneous. The commonly used trend methods: the Mann–Kendall test (MK) [13,14] and the Theil–Sen slope estimator [15], were applied to the rainfall series of the Medjerda Basin.

3.2.1. Mann–Kendall Trend Test

The Mann–Kendall Method is a non-parametric test frequently applied in climatological trend analysis. It is used to detect monotonic increasing or decreasing trends. Its formulation as a test for trend detection was developed by Mann [13], followed by the test statistic distribution given by Kendall [14]. The MK test is derived from a rank correlation test, and being a rank-based method, neither outliers nor the actual distribution of data affects this test. The MK test is given as:
S = i = 1 n 1 j = i + 1 n s g n ( x j x i )
s g n ( x j x i ) = ( 1 i f ( x j x i ) > 0 0 i f ( x j x i ) = 0 1 i f ( x j x i ) < 0 )
V ( S ) = 1 18 [ n ( n 1 ) ( 2 n + 5 ) k = 1 q t k ( t k 1 ) ( 2 t k + 5 ) ] ,
where n is the number of data, q is the number of total tied value and t k is the number of values in the kth group.
Z = [ S 1 V ( S )   f o r   S > 0         0             f o r   S = 0 S + 1 V ( S )   f o r   S < 0 ] ,
where increasing and decreasing trends are indicated with positive and negative values of S (alternate hypothesis). The test’s null hypothesis shows that there is no significant trend in the data. It is rejected if the absolute Z statistic is greater than the critical value of the Z statistic ( Z 1 α / 2 ) obtained from the standard normal cumulative distribution tables. Three significance levels ( α   = 0.01, 0.05, 0.1) were adopted in this study.

3.2.2. Theil-Sen’s Slope Estimator

Trend magnitude has been evaluated using Theil–Sen’s median slope estimator ( β ). This method is based on calculating slopes for all the pairs of time series. Finally, the median of these slopes is performed to estimate the trend slope of the entire time series. Theil–Sen’s slope method is not influenced by outliers [43]. It is computed by:
β = M e d i a n ( x j x i j i ) f o r   a l l   i < j ,
where x j and x i are the observations of jth and ith, respectively. Positive and negative values of m indicate an increasing and a decreasing trend, respectively.
Sen’s slope has been widely used in climatological trend analysis [44,45,46,47,48,49,50].

4. Results and Discussion

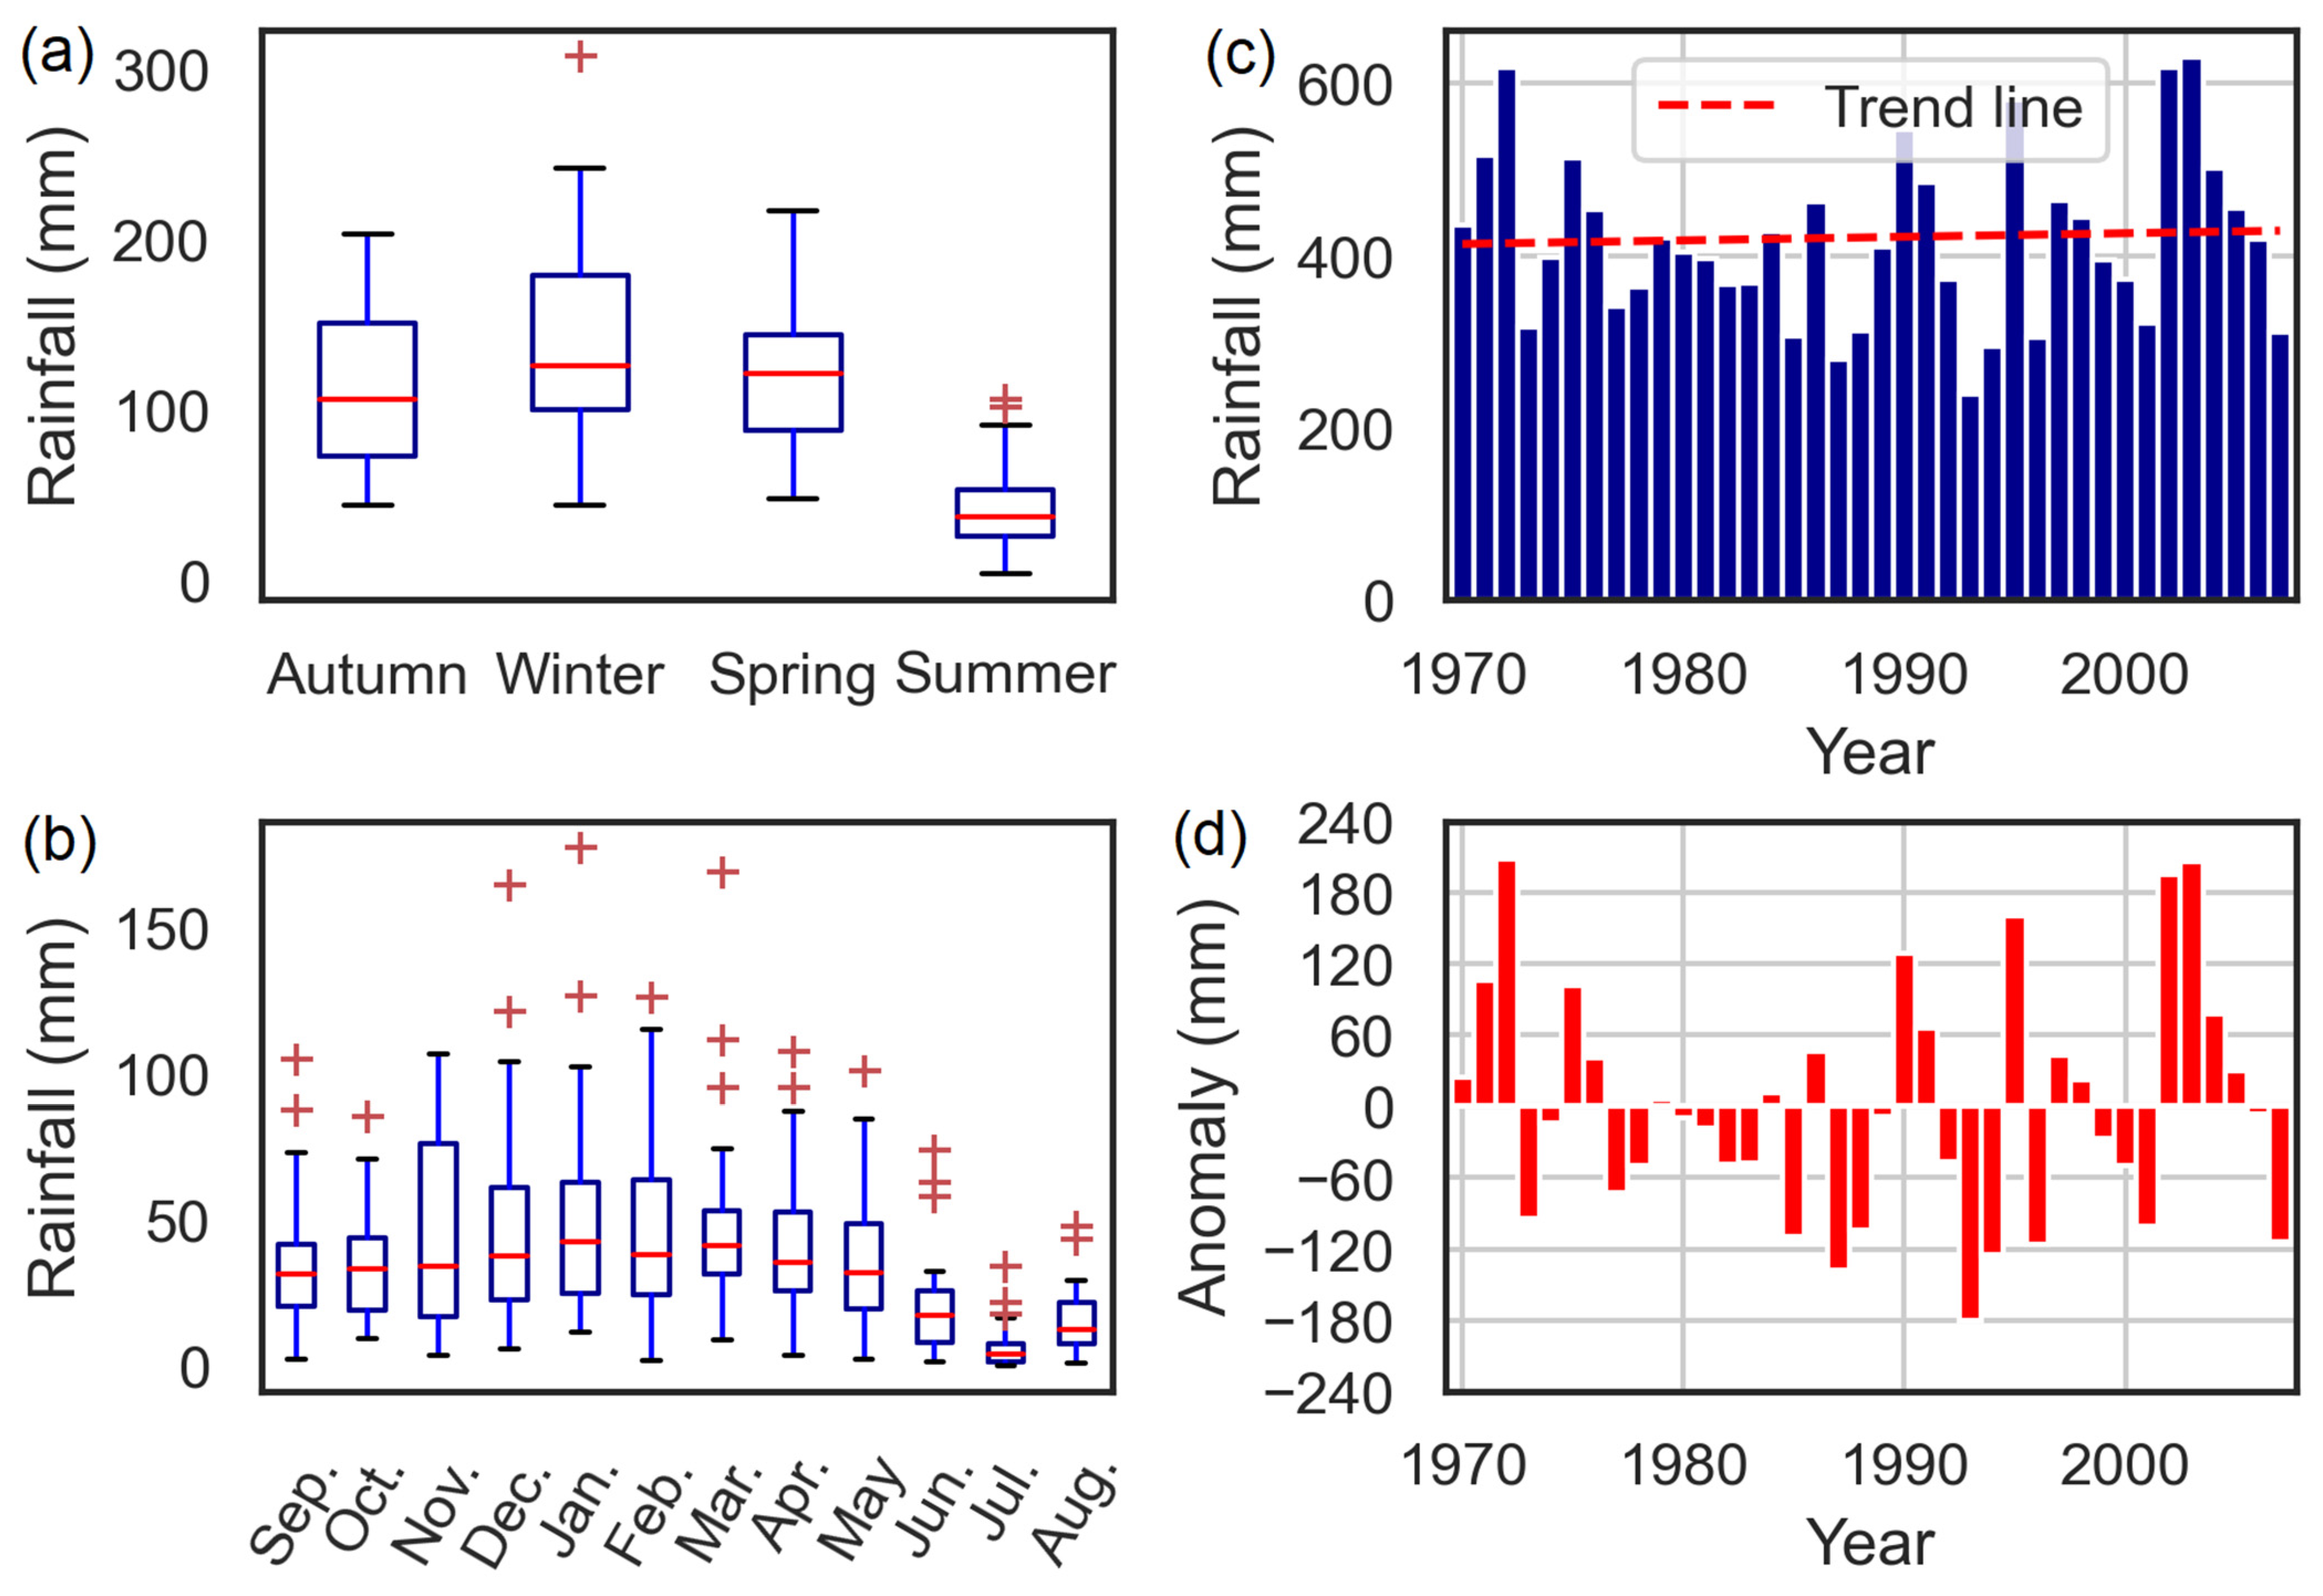
4.1. Analysis of Rainfall Variability

The interannual rainfall (1970–2007) throughout the Medjerda Basin (Figure 3) was obtained by interpolating annual rainfall data using the kriging method. The figure indicates a considerable spatial variability of rainfall over the basin. This map shows an increase of annual rainfall from the South to the North of the watershed with a meager amount of rain (an average of 293 mm per year) upstream of the Mellegue sub-basin (South West Algerian territory). Average annual rainfall over most of the Medjerda Watershed varies from 330 to 500 mm per year. Finally, the most yearly abundant rainfall region (higher than 600 mm per year) is observed in the North West of the study area.
Box plots of seasonal and monthly rainfall (Figure 4a,b) show that the most significant part of the rainfall is observed in the winter season (December, January, and February) while summer is considered as the driest period (June, July, and August). July is usually the driest month when rainfall episodes are infrequent. For the period 1970–2007, mean annual rainfall averaged over all rain gauges (approximate 400 mm per year) showed a very slight increase (Figure 4c). The driest years in the Medjerda watershed were from 1992 to 1994, with the lowest annual rainfall (239 mm) recorded in 1993. On the other hand, the highest annual rainfall over the thirty-seven-year period was 630 mm, registered in 2003.
By visualizing rainfall anomaly (Figure 4d), which is defined as the difference of a variable from its long-term average, we can observe a succession of dry years from 1977 to 1988. This constatation is confirmed by Khedimallah et al. [9] who performed the Pettitt test on annual rainfall in the Algerian side of Medjerda to detect the rupture position, and they found that it occurred in 1976. Additionally, the rainfall anomaly pointed out that rainfall variability at seasonal scale (Figure 5) is dominant in winter (followed by spring), with a maximum value of rainfall depth (307 mm) observed in 2002.
The percentages of stations with positive or negative significant trends (for 90% confidence level) throughout the Medjerda Basin at different temporal scales are shown in Figure 6. On an annual scale, only 3% of the stations show a positive trend, which is relatively low considering the entire watershed. At the seasonal scale, it can be observed that autumn, winter, and summer exhibit positive trends, with similar station percentages (4% to 8%). Accordingly, these trends detected by the MK test are confirmed by the increase of rainfall averages with a higher value of Sen’s slope in winter (6.78 mm/decade). However, the trend direction is reversed in the spring season. The trend of rainfall averages for the spring season represented by Sen’s slope shows a significant decrease.
In the case of the monthly timescale shown in (Figure 6), rainfall tendency is evident and well demonstrated. It shows an increase of precipitation from July to September and from December to January. September and December represent the higher number of stations with significant positive trends (31% and 37% of stations, respectively). From February to April and October, analyzing the rainfall trends showed that most of the stations present a downward trend.
At the annual scale, the Sen’s slope indicates an increase of 4.15 mm/decade, giving an estimated increase of 15.77 mm in the period 1970–2007 (Figure 6). Compared to the average annual, it corresponds to about 4%, which is considered as a small increase. Nevertheless, combined positive and negative trends were detected at seasonal and monthly time scales. These results indicate that the most important rainfall trends concern the rainfall distribution within the year. The declining trend of rainfall in February, March and May might affect the filling of reservoirs at the period preceding the summer season, which consequently perturb the water supply in the dry period. Therefore, this impact should be confirmed by a spatial investigation of the rainfall trends within the watershed.

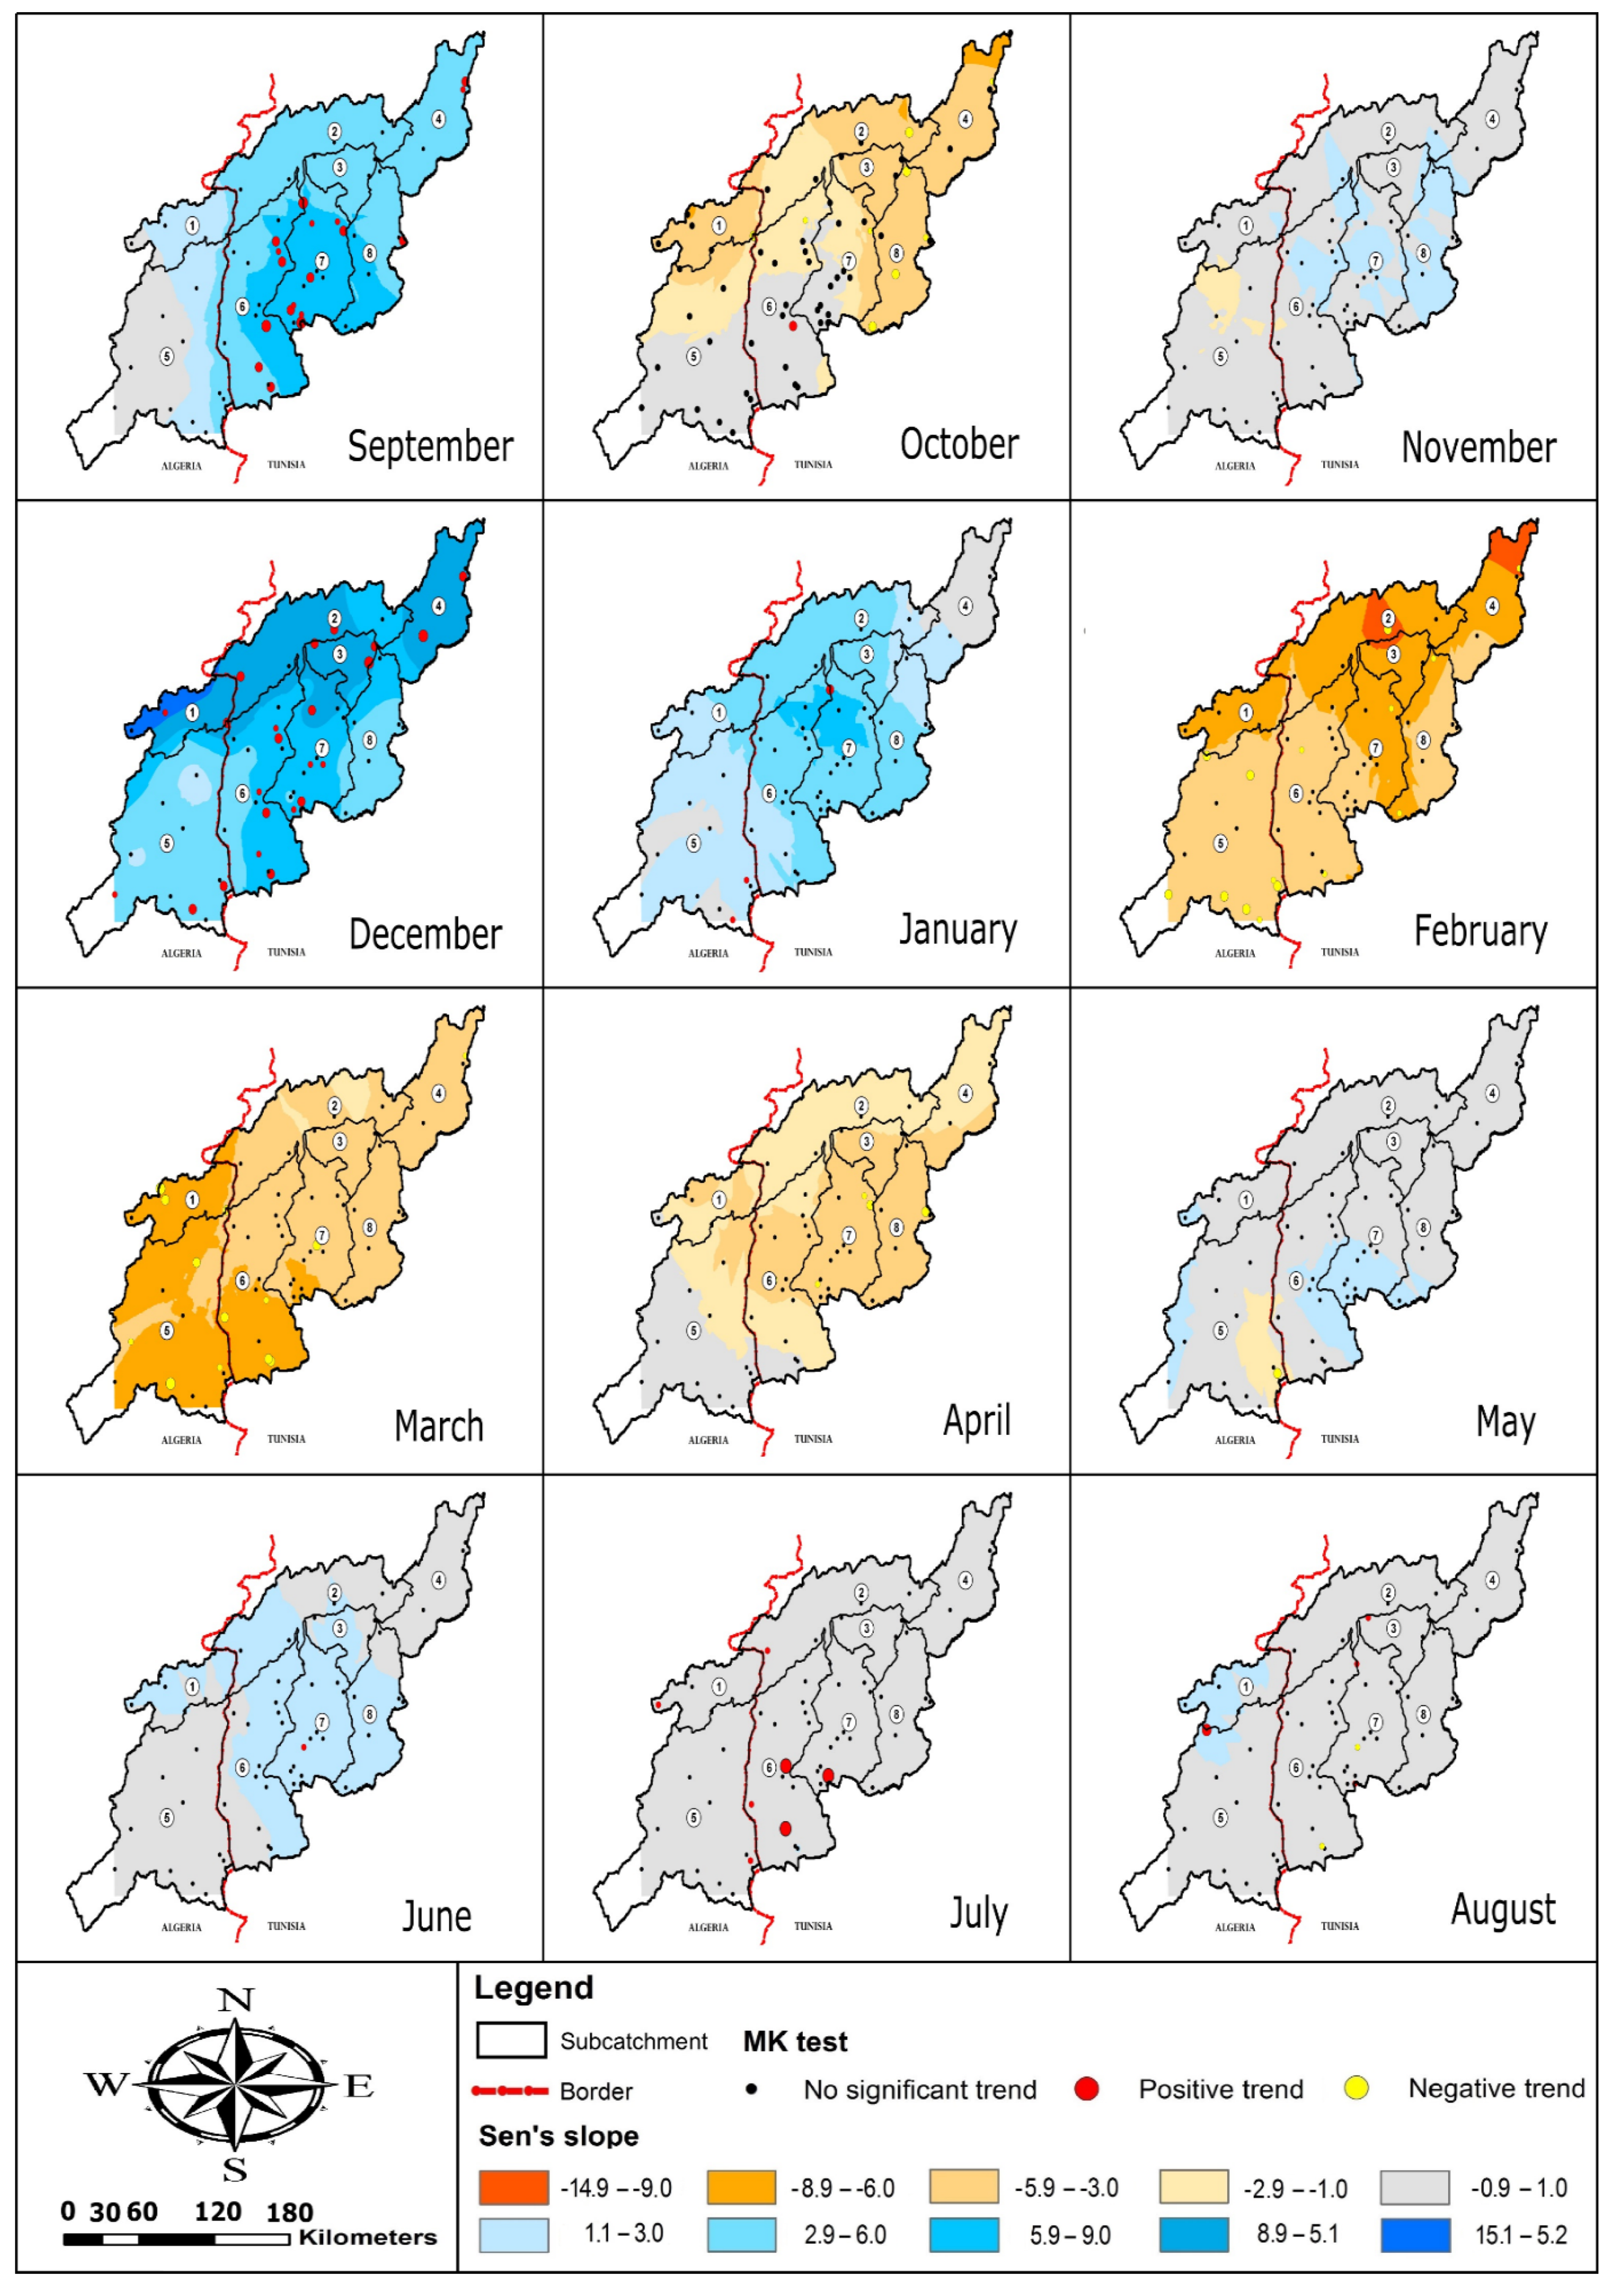
4.2. Spatial Trend Analysis

The spatial variability of Sen’s slope and MK trend results is shown in Figure 7 and Figure 8 for annual, seasonal and monthly time scales. The yearly trend is highly variable over the watershed, with weak (−1 mm/decade) and medium (−8.9 mm/decade) decreasing trends in the downstream (Medjerda downstream subwatershed) and the upstream (Mellegue upstream subwatershed), respectively. Nevertheless, precipitation in the central region (especially Mellegue downstream and Tessa sub-watersheds) increases, as shown by Sen’s slope values going from 2.9 to 25 mm/decade. These variations of rainfall trends in each region suggest the existence of several microclimates or different local influencing factors such as topography.
A positive trend is observed at the seasonal level in almost the entire catchment, with a gradual increase from summer (1.1 to 6 mm/decade) to winter (reaching 15 mm/decade). However, a strong negative trend is observed during the spring season, with Sen’s slope values less than −6 mm/decade in large parts of the basin. Meanwhile, Mellegue upstream sub-catchment trend is lower than other parts of the watershed for the autumn, winter, and especially the spring, where the decreasing trend is severe (between −9 to −14 mm/decade).
The increasing trend observed in September, December and January affects most of the catchment. Nevertheless, Mellegue upstream is the least affected part (1 to 6 mm/decade) compared to the rest of the watershed (6 to 15 mm/decade). Concerning decreasing trends, they are mainly observed from February to March. The Downstream Region (Medjerda, Khalled, and Tessa sub-catchments) is the most affected by this decrease (−9 to −6 mm/decade) for February, while it is the opposite for March. Trends in the other months are insignificant (−3 to 3 mm/decade) for most of the catchment.
In the previous study carried out on the eastern region of Algeria, Mrad et al. [8] found similar patterns of annual and seasonal rainfall in the Algerian side of the watershed. They found a decreasing trend in the upstream of Mellegue subcatchment and an upward trend in the north east of the Medjerda watershed. However, as showed in the Figure 6, no significant trend was found for annual rainfall in the Algerian side. While in other previous studies as Mrad et al. [8] and Khedimallah et al. [9], significant trends were observed in several stations. This fact may be related to different time periods used for the analysis but also the pre-whitening procedure applied in this study, which may reduce on false trends detection. In the Tunisian side of Medjerda, few significant trends were detected in the annual scale, which is in agreement with other studies [51,52,53].
Unlike annual trends, seasonal and monthly trends are generalized over the catchment. As a result, both positive and negative trends share very similar patterns with only slight differences.
By considering the location of the different dams and reservoirs, we observe in February and March that most of stations showing significant decreasing trends are situated upstream, therefore, it confirms the filling of reservoirs issue discussed in the previous section.

4.3. Effect of NAO, SO, and MO on Rainfall Variability

The Spearman’s rank correlation coefficients between the climate indices (NAOi, SOi, and MOi) and rainfall time series (annual, seasonal, and monthly) were computed to identify the possible links at different time scales. This operation was performed for all stations separately.
Table 2 shows the results of the correlation analysis. It displays the percentages of stations having a positive (or a negative) correlation of teleconnection patterns with rainfall series. Moreover, significant trends are shown to check if there is a link between notable trends found by the MK test and the climatic oscillations. For example, 3% of all rainfall series in the autumn season are negatively correlated ( rho > 0.2 ) , with NAOi. These correlations affect 50 % of rainfall series, showing a significant trend.
The obtained results show that the relationship of all indices with rainfall at different temporal scales (annual, seasonal, and monthly) is not strong (rho < 0.5). Furthermore, the correlation of the annual rainfall is very weak (rho < 0.2) for individual stations. However, rainfall seems to have a weak correlation (0.2 < rho < 0.4). The different climate indices influence seasonal rainfall, with 50% of stations showing significant correlations; the NAOi and MOi are related positively to rainfall during the winter season, whereas the SO is linked negatively with autumn rainfall and positively with spring rainfall. It can also be reported that most rainfall stations presenting a significant trend in these seasons are weakly correlated (rho < 0.3) with the climate indices. Regarding the monthly temporal scale, several months are influenced by the climatic indices. Among these months, the number of rainfall stations with significant correlations is high only in September. Most of these stations (>72%) show weak negative correlations with NAOi and MOi.
It is clear from the results in Table 2 that annual rainfall is not affected by the studied teleconnection patterns (NAO, SO, or MO). In addition, their relationships with seasonal and monthly rainfall are not statistically significant. This finding may explain some variability patterns related to the detected trend; however, other factors may be responsible for these changes.

5. Conclusions

Non-significant trends were detected over the whole basin at the annual scale. This is confirmed by a low number of the station showing significant trends at the annual time scale (3%) and a low value of Sen’s slope, calculated over the period (1970–2007). Nevertheless, more rainfall trends are detected (increasing and decreasing) for different seasons (or months). Therefore, the main conclusion is that taking only average values into consideration, there are no significant trends, but more detailed analysis at the sub-annual time scale reveals a redistribution of rainfall within the year with a notable decrease in spring and an increase during winter months. As for the spatial distribution, rainfall trends can be in opposite directions from one sub-catchment to another. For example, the Mellegue sub-catchment, located on the Algerian side, is the most affected by a decreasing trend. This can negatively impact the newly constructed dam (Ouldjet Mellegue dam). On the contrary, the Sidi Salem Dam (Tunisian) is positively affected by an upward trend of rainfall that compensates for the decrease on the Algerian side.
These findings pointed out the importance of analyzing the rainfall variability of the entire watershed, rather than separately in each country. For instance, a large proportion of catchment areas upstream of dams and reservoirs in Tunisia are located in the Algerian side. Therefore, the decreasing trend in the Mellegue upstream (Algeria) may affect the water resources in Tunisia. In addition, the downward significant trends observed at several stations in the same region has a negative effect on the filling of reservoirs during spring, to secure water resources’ availability during the dry summer period.
Teleconnection patterns and their link with the rainfall accumulations from the monthly to the annual time scales were also analyzed in this study. Results showed only weak correlations at the seasonal scale with the different indices. Indeed, the NAOi and MOi have a similar effect on winter rainfall demonstrated by a positive correlation, while SOi is negatively correlated with spring rainfall. These results highlight the small impact of these large-scale circulation oscillations on precipitation and the possible interplays between these large scale patterns with more local to regional atmospheric circulation types.
This analysis of spatio-temporal patterns over the whole Medjerda basin is the first step towards a comprehensive assessment of available surface water resources in this basin. Further research should focus on the river runoff trends in the different sub-basins and their attribution to climate changes and land-use change, and other anthropogenic factors [54]. In addition, the combined effects of future climate scenarios with different management strategies could be analyzed to estimate the resilience of water supply, irrigation, and hydroelectricity production to global changes in the following decades.

Author Contributions

T.B.: Conceptualization, Methodology, Formal Analysis, Data Curation, Writing—Original Draft, H.B.: Conceptualization, Methodology, Writing—Review & Editing, H.A.: Methodology, Data Curation, Writing—Review & Editing, M.S.: Methodology, Writing—Review & Editing, S.A.K.: Methodology, Writing—Review & Editing, Y.T.: Methodology, Writing—Review & Editing. All authors have read and agreed to the published version of the manuscript.

Funding

This work was supported by the PRFU-MESRS Project (Code# A17N01UN230120180001) named Analysis of the potential impact of Climate Change on Rainfall Extreme, Flooding, and Urban Drainage Systems.

Institutional Review Board Statement

Not applicable.

Informed Consent Statement

Not applicable.

Data Availability Statement

Monthly rainfall data are obtainable from the ANRH (Algeria) and the DGRE (Tunisia) on request. Climatic indices values (NAOi, SOi, MOi) were provided from the Climatic Research Unit website (https://crudata.uea.ac.uk/cru/data/pci.htm, accessed on 7 October 2021).

Acknowledgments

The authors would like to acknowledge the ANRH of Algeria and the DGRE of Tunisia for providing an essential database of monthly rainfall for this research. This work was developed with the support of the Directorate-General for Scientific Research and Technological Development DGRSTD (Algeria).

Conflicts of Interest

The authors declare no conflict of interest.

References

  1. Zahar, Y.; Ghorbel, A.; Albergel, J. Impacts of large dams on downstream flow conditions of rivers: Aggradation and reduction of the Medjerda channel capacity downstream of the Sidi Salem dam (Tunisia). J. Hydrol. 2008, 351, 318–330. [Google Scholar] [CrossRef]
  2. Diffenbaugh, N.S.; Giorgi, F. Climate change hotspots in the CMIP5 global climate model ensemble. Clim. Change 2012, 114, 813–822. [Google Scholar] [CrossRef] [PubMed] [Green Version]
  3. Cramer, W.; Guiot, J.; Fader, M.; Garrabou, J.; Gattuso, J.-P.; Iglesias, A.; Lange, M.A.; Lionello, P.; Llasat, M.C.; Paz, S.; et al. Climate change and interconnected risks to sustainable development in the Mediterranean. Nat. Clim. Change 2018, 8, 972–980. [Google Scholar] [CrossRef] [Green Version]
  4. Schilling, J.; Freier, K.P.; Hertig, E.; Scheffran, J. Climate change, vulnerability and adaptation in North Africa with focus on Morocco. Agric. Ecosyst. Environ. 2012, 156, 12–26. [Google Scholar] [CrossRef]
  5. Tramblay, Y.; Jarlan, L.; Hanich, L.; Somot, S. Future Scenarios of Surface Water Resources Availability in North African Dams. Water Resour. Manag. 2018, 32, 1291–1306. [Google Scholar] [CrossRef]
  6. Lionello, P.; Scarascia, L. The relation between climate change in the Mediterranean region and global warming. Reg. Environ. Change 2018, 18, 1481–1493. [Google Scholar] [CrossRef]
  7. Rajosoa, A.S.; Abdelbaki, C.; Mourad, K.A. Water assessment in transboundary river basins: The case of the Medjerda River Basin. Sustain. Water Resour. Manag. 2021, 7, 88. [Google Scholar] [CrossRef]
  8. Mrad, D.; Djebbar, Y.; Hammar, Y. Analysis of trend rainfall:Case of North-Eastern Algeria. J. Water Land Dev. 2017, 36, 1429–7426. [Google Scholar]
  9. Khedimallah, A.; Meddi, M.; Mahé, G. Characterization of the interannual variability of precipitation and runoff in the Cheliff and Medjerda basins (Algeria). J. Earth Syst. Sci. 2020, 129, 134. [Google Scholar] [CrossRef]
  10. Verner, D. Tunisia in a Changing Climate: Assessment and Actions for Increased Resilience and Development; World Bank Publications: Washington, DC, USA, 2013. [Google Scholar]
  11. Bargaoui, Z.; Tramblay, Y.; Lawin, E.A.; Servat, E. Seasonal precipitation variability in regional climate simulations over Northern basins of Tunisia. Int. J. Climatol. 2014, 34, 235–248. [Google Scholar] [CrossRef]
  12. Tramblay, Y.; El Adlouni, S.; Servat, E. Trends and variability in extreme precipitation indices over Maghreb countries. Nat. Hazards Earth Syst. Sci. 2013, 13, 3235–3248. [Google Scholar] [CrossRef] [Green Version]
  13. Mann, H.B. Nonparametric Tests Against Trend. Econometrica 1945, 13, 245–259. [Google Scholar] [CrossRef]
  14. Kendall, M.G. Rank Correlation Methods; Griffin: Oxford, UK, 1948. [Google Scholar]
  15. Sen, P.K. Estimates of the Regression Coefficient Based on Kendall’s Tau. J. Am. Stat. Assoc. 1968, 63, 1379–1389. [Google Scholar] [CrossRef]
  16. Guermazi, E.; Milano, M.; Reynard, E. Performance evaluation of satellite-based rainfall products on hydrological modeling for a transboundary catchment in northwest Africa. Theor. Appl. Climatol. 2019, 138, 1695–1713. [Google Scholar] [CrossRef]
  17. Chandran, A.; Basha, G.; Ouarda, T.B.M.J. Influence of climate oscillations on temperature and precipitation over the United Arab Emirates. Int. J. Climatol. 2016, 36, 225–235. [Google Scholar] [CrossRef]
  18. Hurrell, J.W.; Kushnir, Y.; Visbeck, M. The North Atlantic Oscillation. Science 2001, 291, 603–605. [Google Scholar] [CrossRef] [PubMed] [Green Version]
  19. Walker, G.T.; Bliss, W.E. World weather V. Memories of the royal meteorological. Society 1932, 44, 53–84. [Google Scholar]
  20. Van Loon, H.; Rogers, J.C. 1978: The see-saw in winter temperatures between Greenland and Northern Europe. Part I: General description. Mon. Weather Rev. 1978, 106, 296–310. [Google Scholar] [CrossRef] [Green Version]
  21. Barnston, A.G.; Livezey, R.E. Classification, seasonality and persistence of low-frequency atmospheric circulation patterns. Mon. Weather Rev. 1987, 115, 1083–1126. [Google Scholar] [CrossRef]
  22. Hurrell, J.W.; Kushnir, Y.; Ottersen, G.; Visbeck, M. The North Atlantic Oscillation: Climate Significance and Environmental Impact. Geophys. Monogr. 2003, 1, 279. [Google Scholar]
  23. Donat, M.G.; Peterson, T.C.; Brunet, M.; King, A.D.; Almazroui, M.; Kolli, R.K.; Boucherf, D.; Al-Mulla, A.Y.; Nour, A.Y.; Aly, A.A.; et al. Changes in extreme temperature and precipitation in the Arab region: Long-term trends and variability related to ENSO and NAO. Int. J. Climatol. 2014, 34, 581–592. [Google Scholar] [CrossRef]
  24. Conte, M.; Giuffrida, A.; Tedesco, S. The Mediterranean Oscillation: Impact on Precipitation and Hydrology in Italy. In Proceedings of the Conference on Climate and Water, Helsinki, Finland, 3–6 September 1989; pp. 121–137. [Google Scholar]
  25. Ouachani, R.; Bargaoui, Z.; Ouarda, T. Power of teleconnection patterns on precipitation and streamflow variability of upper Medjerda Basin. Int. J. Climatol. 2013, 33, 58–76. [Google Scholar] [CrossRef]
  26. Partal, T. Wavelet based periodical analysis of the precipitation data of the Mediterranean Region and its relation to atmospheric indices. Model. Earth Syst. Environ. 2018, 4, 1309–1318. [Google Scholar] [CrossRef]
  27. Corona, R.; Montaldo, N.; Albertson, J.D. On the Role of NAO-Driven Interannual Variability in Rainfall Seasonality on Water Resources and Hydrologic Design in a Typical Mediterranean Basin. J. Hydrometeorol. 2018, 19, 485–498. [Google Scholar] [CrossRef]
  28. Mathbout, S.; López-Bustins, J.A.; Roy, D.; Vide, J.M. Relationship between precipitation amounts, precipitation concentration and teleconnection patterns in the Mediterranean basin. In Proceedings of the EGU General Assembly Conference Abstracts, Vienna, Austria, 4–13 April 2018; p. 16317. [Google Scholar]
  29. Hurrell, J.W. Decadal Trends in the North Atlantic Oscillation: Regional Temperatures and Precipitation. Science 1995, 269, 676–679. [Google Scholar] [CrossRef] [PubMed] [Green Version]
  30. Jones, P.D.; Jonsson, T.; Wheeler, D. Extension to the North Atlantic oscillation using early instrumental pressure observations from Gibraltar and south-west Iceland. J. Climatol. J. R. Meteorol. Soc. 1997, 17, 1433–1450. [Google Scholar] [CrossRef]
  31. Ropelewski, C.F.; Jones, P.D. An extension of the Tahiti–Darwin southern oscillation index. Mon. Weather Rev. 1987, 115, 2161–2165. [Google Scholar] [CrossRef] [Green Version]
  32. Criado-Aldeanueva, F.; Soto-Navarro, F.J. The Mediterranean Oscillation Teleconnection Index: Station-Based versus Principal Component Paradigms. Adv. Meteorol. 2013, 2013, 738501. [Google Scholar] [CrossRef] [Green Version]
  33. Abidi, S.; Hajji, O.; Habaieb, H. Study of Rainfall Variations in Tessa Subwatershed of Medjerda River in Tunisia. In Water Resources in Arid Areas: The Way Forward; Abdalla, O., Kacimov, A., Chen, M., Al-Maktoumi, A., Al-Hosni, T., Clark, I., Eds.; Springer International Publishing: Cham, Switzerland, 2017; pp. 59–74. [Google Scholar]
  34. Guijarro, J.A. Climatol: Climate Tools (Series Homogenization and Derived Products). R Package Version 3.1.2. 2019. Available online: https://cran.r-project.org/web/packages/climatol/ (accessed on 28 January 2022).
  35. Alexandersson, H. A homogeneity test applied to precipitation data. J. Climatol. 1986, 6, 661–675. [Google Scholar] [CrossRef]
  36. Leduc, D.J. A comparative analysis of the reduced major axis technique of fitting lines to bivariate data. Can. J. For. Res. 1987, 17, 654–659. [Google Scholar] [CrossRef]
  37. Guijarro, J.A. User’s Guide to Climatol. An R Contributed Package for Homogenization of Climatological Series; Report, State Meteorological Agency; Balearic Islands Office: Illes Balears, Spain, 2011. [Google Scholar]
  38. Yue, S.; Pilon, P.; Phinney, B.; Cavadias, G. The influence of autocorrelation on the ability to detect trend in hydrological series. Hydrol. Processes 2002, 16, 1807–1829. [Google Scholar] [CrossRef]
  39. Bayazit, M. Nonstationarity of Hydrological Records and Recent Trends in Trend Analysis: A State-of-the-art Review. Environ. Process. 2015, 2, 527–542. [Google Scholar] [CrossRef]
  40. Roy, A.; Falk, B.; Fuller, W.A. Testing for Trend in the Presence of Autoregressive Error. J. Am. Stat. Assoc. 2004, 99, 1082–1091. [Google Scholar] [CrossRef]
  41. Wang, X.L.; Swail, V.R. Changes of Extreme Wave Heights in Northern Hemisphere Oceans and Related Atmospheric Circulation Regimes. J. Clim. 2001, 14, 2204–2221. [Google Scholar] [CrossRef]
  42. Salas, J.D.; Delleur, J.W.; Yevjevich, V.; Lane, W.L. Applied Modeling of Hydrologic Time Series; Water Resources Publication: Fort Collins, CO, USA, 1980. [Google Scholar]
  43. Yue, S.; Pilon, P.; Cavadias, G. Power of the Mann–Kendall and Spearman’s rho tests for detecting monotonic trends in hydrological series. J. Hydrol. 2002, 259, 254–271. [Google Scholar] [CrossRef]
  44. Narayanan, P.; Basistha, A.; Sarkar, S.; Kamna, S. Trend analysis and ARIMA modelling of pre-monsoon rainfall data for western India. Comptes Rendus Geosci. 2013, 345, 22–27. [Google Scholar] [CrossRef]
  45. Sayemuzzaman, M.; Jha, M.K. Seasonal and annual precipitation time series trend analysis in North Carolina, United States. Atmos. Res. 2014, 137, 183–194. [Google Scholar] [CrossRef]
  46. Mondal, A.; Khare, D.; Kundu, S. Spatial and temporal analysis of rainfall and temperature trend of India. Theor. Appl. Climatol. 2015, 122, 143–158. [Google Scholar] [CrossRef]
  47. Dawood, M. Spatio-statistical analysis of temperature fluctuation using Mann–Kendall and Sen’s slope approach. Clim. Dyn. 2017, 48, 783–797. [Google Scholar]
  48. Chandniha, S.K.; Meshram, S.G.; Adamowski, J.F.; Meshram, C. Trend analysis of precipitation in Jharkhand State, India. Theor. Appl. Climatol. 2017, 130, 261–274. [Google Scholar] [CrossRef]
  49. Asfaw, A.; Simane, B.; Hassen, A.; Bantider, A. Variability and time series trend analysis of rainfall and temperature in northcentral Ethiopia: A case study in Woleka sub-basin. Weather Clim. Extrem. 2018, 19, 29–41. [Google Scholar] [CrossRef]
  50. Nikzad Tehrani, E.; Sahour, H.; Booij, M.J. Trend analysis of hydro-climatic variables in the north of Iran. Theor. Appl. Climatol. 2019, 136, 85–97. [Google Scholar] [CrossRef]
  51. Gader, K.; Gara, A.; Vanclooster, M.; Khlifi, S.; Slimani, M. Drought assessment in a south Mediterranean transboundary catchment. Hydrol. Sci. J. 2020, 65, 1300–1315. [Google Scholar] [CrossRef]
  52. Chargui, S.; Jaberi, A.; Cudennec, C.; Lachaal, F.; Calvez, R.; Slimani, M. Statistical detection and no-detection of rainfall change trends and breaks in semiarid Tunisia—50+ years over the Merguellil agro-hydro-climatic reference basin. Arab. J. Geosci. 2018, 11, 675. [Google Scholar] [CrossRef]
  53. Feki, H.; Hermassi, T.; Soualhia, N. Characterisation of Mean Monthly Rainfall Variability Over Mellegue Catchment—Tunisia; Springer: Cham, Switzerland, 2018; pp. 793–795. [Google Scholar]
  54. Mokrane, K. Exploring causes of streamflow alteration in the Medjerda river, Algeria. J. Hydrol. 2020, 32, 100750–102020. [Google Scholar] [CrossRef]
Figure 1. Location map of the study basin.
Water 14 00423 g001
Figure 2. Flowchart of the methodology used in this study.
Water 14 00423 g002
Figure 3. Variation of average annual rainfall (1970–2007) over the Medjerda catchment. Numbers in the circles represent the subcatchment ID (same as Figure 1).
Water 14 00423 g003
Figure 4. Rainfall variability represented by box plot at (a) seasonal and (b) monthly scales, and histograms of (c) the average annual rainfall and (d) the annual rainfall anomaly.
Water 14 00423 g004
Figure 5. Annual rainfall (top) and rainfall anomaly (bottom) over the Medjerda watershed at seasonal scale. Dash lines represent trend with Sen’s slopes Temporal trend analysis.
Water 14 00423 g005
Figure 6. Percentage of the station with significant trends (left) and Sen’s slope of rainfall (right) in the Medjerda catchment at different temporal scales (90% confidence level).
Water 14 00423 g006
Figure 7. Spatial distribution of Sen’s slope and MK trend over the Medjerda Watershed at annual, seasonal scales. Red and yellow circles dimensions are related to MK significance level. Box plots represent the Sen’s slope (mm/decade) for each subcatchment.
Water 14 00423 g007
Figure 8. Spatial distribution of Sen’s slope and MK trend over the Medjerda Watershed at annual, seasonal scales. Red and yellow circles dimensions are related to MK significance level.
Water 14 00423 g008
Table 1. Characteristics of the rainfall stations and their corresponding time series.
Station IDStation NameLat.
(° N)
Long.
(° E)
Alt.
(m)
PeriodGaps
(%)
Annual Rainfall (mm)
MinMeanMax
1Tala PF35.588.638891970–20073.73253414658
2Tala SM35.578.6510201970–20070.00299470793
3Ain Kerma 136.168.396011975–20070.51192364634
4Ain S’koum135.858.879901970–20075.48134262431
5Ain Zeligua35.858.828531974–20072.94203399661
6Cite du Mellegue SM36.318.712561970–20070.00259437744
7Jerissa Delegation35.848.626331975–20061.04149344583
8Dehmani Elevage35.918.796521970–20035.15227412714
9Dehmani Municipalite35.938.816221970–20070.00301541874
10Fath Tessa36.058.935321977–20071.08202374696
11Kalaa Khasba35.658.568561974–20071.23188387692
12Kalaat Essenam35.768.326231976–20070.26144336619
13Kef Birh36.178.716201972–20072.78201389647
14Kef Heliopolis36.218.694551973–20070.2458357628
15Kef CMA36.128.734911970–20070.00236436709
16Ksour Ecole35.898.877201976–20070.78266404671
17Oued Mellegue 1336.128.493241970–20070.22126338522
18Sakiet Sidi Youssef SM36.248.348031970–20070.00284496834
19Sers Agricole36.059.035011972–20070.23227407695
20Sers Delegation36.088.985011970–20070.66233401658
21Tajerouine Ain Zouagha35.938.577501976–20071.04169406776
22Tajerouine Ferme d’Etat35.938.485111970–20070.00132368609
23Tajerouine Agricole35.888.546501970–200710.09168386667
24Tessa Sidi Medien36.298.952801974–20071.23266418696
25Zouarine Gare36.028.895711970–20071.10206388671
26Ain Tounga SE36.509.351101976–20070.26216396668
27Ain Guesil36.239.575631970–20071.75164365576
28Ain Tabia36.269.174161970–20072.85244426819
29Akouat Gare36.249.253501970–20070.44189349617
30Krib Ferme Cossem36.309.134471970–20070.22336538843
31Ksar Bou Khris36.229.605101970–20056.25173425711
32Makthar PF35.849.199001970–20070.22255507811
33Porto Farina Ghar El Meleh37.1310.18101970–20070.00311589988
34Cherfech CRGR36.9210.05591970–20070.22232480785
35Sidi Thabet Domaine Haras36.8810.03141973–20070.24173407673
36Beja Inrat36.659.112301970–20070.00289573892
37Beauce Tunisienne36.699.452341970–20020.00209391588
38Mejez El Bab PF36.579.401421970–20070.00191406616
39Montarnaud 136.629.741081975–20073.03142350597
40Sk El Khemis B.S.CFPA36.388.881461973–20035.65204414741
41Testour SM36.529.431121970–20070.22255503811
42Siliana Agricole36.079.354311970–20075.26185405682
43Jantoura36.498.783901970–20000.00298468787
44Gar Dimaou DRE36.448.431951970–20070.00239450745
45Bou Salem DRE36.598.961381970–20070.22245421700
46Souk Ahras36.277.905901970–20073.73170547882
47Khemissa36.207.658451978–20075.83250477844
48Taoura36.178.048501971–20030.7668461861
49Meskiana35.657.658451978–20074.1789253434
50Ain Dhalaa35.477.539531973–200714.79106332562
51Tebessa35.408.128901970–20070.00185355624
52Boukhadra35.758.039001970–20070.00136291514
53Hammamet35.457.958751971–20070.00143348638
54Bekkaria35.368.199201972–20074.63169374628
55Ouenza35.998.135201970–20072.6349273508
56Mdaourouch36.087.828701970–20070.22135351700
57Messloula35.887.886601978–200712.50133362743
58Ain Seynour36.367.878001970–20036.3760210241486
59Ras El Aioun35.548.2810651973–20078.10146301568
60El Kouif35.518.3110151975–20078.0891285503
Lat. and Long. are respectively latitude and longitude in degree.
Table 2. Percentage of stations having positive (+) or negative (−) correlation (rho) with NAOi, SOi and MOi. Numbers between brackets represent percentage of rainfall series presenting a significant trend which are correlated with climatic indices.
Correlation 0.2   <   r h o < 0.2 0.3   <   r h o < 0.3 0.4   <   r h o < 0.4
OscilliationNAOiSOiMOiNAOiSOiMOiNAOi SOiMOi
(+)(−)(+)(−)(+)(−)(+)(−)(+)(−)(+)(−)(+)(−)(+)(−)(+)(−)
Annual7 0 7052002000000000
SeasonalAut.17 3 (50)053045 (50)320508000002
Win.65 (100)0032 (50)57 (100)017 (25)002150000220
Spr.2 763 (50)0315 (17)0213 (17)003002000
Sum.0 13 (40)27 (20)08005 (20)2000020000
MonthlySeptember250 (72)00262 (83)017 (33)00032 (50)03 (11)00013 (28)
October17 (40)5 2 (10)170107 (30)00302000000
November532 087722004820000700
December37 (43)212 (4)005020000000000
January28 (33)0 0763 (67)0200025 (33)0000020
Febuary015 (12)2 (6)13 (12)018 (29)03 (6)2 (6)10 (6)02 (6)000202 (6)
March8 (7)0 12 (20)212 (7)8 (7)003 (7)05 (7)0000000
April065 (80)28 (40)0328 (40)023 (40)80017 (20)000002
May473351052700000500000
June252213205520000000000
July73 (14)52 (57)017 (43)22022 (43)03 (14)0005 (14)000
August212 108040 (60)0550015000005
Publisher’s Note: MDPI stays neutral with regard to jurisdictional claims in published maps and institutional affiliations.

