Article

Field Study of the Road Stormwater Runoff Bioretention System with Combined Soil Filter Media and Soil Moisture Conservation Ropes in North China

1
School of Environment, Tsinghua University, Beijing 100084, China
2
Jiangsu Collaborative Innovation Center of Technology and Material of Water Treatment, Suzhou University of Science and Technology, Suzhou 215009, China
3
Glodon Co., Ltd., Beijing 100193, China
4
Academy of Agricultural Planning and Engineering, MARA, Beijing 100125, China
5
North China Municipal Engineering Design & Research Institute Co., Ltd., Tianjin 300381, China
6
NUS Environmental Research Institute, National University of Singapore, Singapore 117576, Singapore
7
School of Life Sciences & Chemical Technology, Ngee Ann Polytechnic, 535 Clementi Road, Blk 83, Singapore 599489, Singapore
*
Author to whom correspondence should be addressed.
Water 2022, 14(3), 415; https://doi.org/10.3390/w14030415
Submission received: 15 November 2021 / Revised: 14 January 2022 / Accepted: 26 January 2022 / Published: 29 January 2022
(This article belongs to the Special Issue Urban Runoff Control and Sponge City Construction)

Abstract

:
Growing concerns about urban runoff pollution and water scarcity caused by urbanization have prompted the application of bioretention facilities to manage urban stormwater. The purpose of this study was to evaluate the performance of proposed bioretention facilities regarding road runoff pollutant removal and the variation characteristics of the media physicochemical properties and microbial diversity in dry-cold regions. Two types of bioretention facilities were designed and then constructed in Tianjin Eco-city, China, on the basis of combined soil filter media screened by a laboratory-scale test with a modified bioretention facility (MBF) containing soil moisture conservation ropes. Redundancy analysis was performed to evaluate the relationships between the variation in media physicochemical properties and microbial communities. An increase in media moisture could promote an increase in the relative abundance of several dominant microbial communities. In the MBF, the relatively low nitrate-nitrogen (NO3-N) (0.75 mg/L) and total nitrogen (TN) (4.71 mg/L) effluent concentrations, as well as better removal efficiencies for TN and NO3-N in challenge tests, were mainly attributed to the greater relative abundance of Proteobacteria (25.2%) that are involved in the microbial nitrogen transformation process. The MBF also had greater media microbial richness (5253 operational taxonomic units) compared to the conventional bioretention facility and in situ saline soils. The results indicate that stormwater runoff treated by both bioretention facilities has potential use for daily greening and road spraying. The proposed design approach for bioretention facilities is applicable to LID practices and sustainable stormwater management in other urban regions.

1. Introduction

With rapid urbanization, there has been a significant increase in impermeable surface areas such as urban roads and roofs, resulting in an increase in surface runoff and ultimately leading to environmental problems such as runoff pollution and water environment deterioration [1]. Table 1 shows the contamination of rainfall runoff from different types of urban land covers. It can be seen that the runoff indicators of total suspended solids (TSS), chemical oxygen demand (COD), total nitrogen (TN), and total phosphorus (TP) for roads are worse than those for other land cover types. This is mainly due to frequent traffic activities, automobile exhaust emissions, tire wear, and the corrosion of components, which lead to the accumulation of a large number of pollutants such as suspended particulate matter, nutrients, and organic matter on road surfaces. It can also be seen that urban road runoff is characterized by heavy and fluctuating pollution, especially for the indicators of TSS and COD [2,3]. Therefore, the control of road runoff pollution is of great significance to urban runoff pollution control and ecological environmental protection.
Table 1. Comparison of water quality of stormwater runoff from different types of land covers.
Land Cover TypeRegionTSS
(mg/L)
COD
(mg/L)
TN
(mg/L)
TP
(mg/L)
Reference
RoadChina53–1947104–7793.02–18.90.26–2.94[4]
US9–46619–2280/0.1–8.2[5]
Japan6049//[6]
Italy11–28115–377//[7]
Germany18.3–3165///[8]
Grass landChina28214.200.24[9]
RoofChina43524.300.11[10]
Italy0–42///[7]
To address the problem of rainfall-runoff pollution, many countries have proposed concepts and measures such as low impact development (LID), best management practices (BMPs), and green infrastructure [11,12]. Sponge cities, a new paradigm of rainfall-runoff management with LID-BMP techniques as source control measures, have been promoted in China since 2013 [13]. At present, the measures used to deal with rainfall-runoff pollution from urban roads worldwide mainly include bioretention facilities, infiltration ponds, artificial wetlands, grassed swales, vegetated buffer strips, etc. In particular, bioretention facilities can effectively intercept, adsorb, and transform pollutants from rainfall-runoff through interactions between plants, soil filter media, and microorganisms, and they have been widely used in sponge city construction for rainfall-runoff control [14,15].
Due to the involvement of various pollutant removal processes, the water purification performance of bioretention facilities is influenced by many factors, such as the composition of filter media, plant configurations, anaerobic zone settings, hydraulic retention time, temperature, rainfall characteristics, etc. Developing strategies to improve their effectiveness in pollutant removal is still a research hotspot and a challenge [16,17]. Previous studies have attempted to adjust and optimize the structure of bioretention facilities, including by improving the composition and proportions of filter media [18,19,20], plant configurations [21,22], and increased submerged zones [23]. The addition of media with large surface areas and high adsorption capacities, such as zeolite, vermiculite, and biochar, to natural soil can improve the removal efficiency of nitrogen and phosphorus from runoff [24]. Given the economic cost of filter media and the utilization of solid waste resources, several studies have also been conducted to improve the removal efficiency by adding river sediments and water treatment plant sludge, among other activities [25]. In addition, the majority of studies have shown that plants play a role in promoting the removal of runoff pollutants [26,27], but some have found that plants do not significantly improve the removal efficiency, and there are even cases where pollutant removal efficiency deteriorates [28]. The modification of the bioretention facility structure also affects the growth and activity of microorganisms inside the facility. Microorganisms are involved in numerous reactions, such as ammonification, nitrification, denitrification, and phosphorus enrichment, during the pollutant removal process in bioretention facilities, facilitating denitrification and phosphorus removal from runoff. However, the above-mentioned studies were mainly conducted at the laboratory scale, and the outcomes were rarely transferred to on-site bioretention facilities for practical application and further evaluation. Previous field trials also lacked systematic design evaluation of bioretention facilities from physical, chemical, and microbiological perspectives [29]. These barriers will eventually limit the application of the bioretention technique to control stormwater runoff pollution.
In this work, a field study of bioretention facilities was conducted on the basis of preliminary laboratory tests, with an aim to evaluate the performance of the on-site bioretention facility regarding runoff pollutant removal and media variation characteristics from physical, chemical, and microbial perspectives as well as provide references for the optimization and promotion of stormwater runoff bioretention facilities. The composition and proportion of engineered soil filter media obtained from a laboratory-scale test were employed to design the filter media layer. Based on the design of the conventional bioretention facility (CBF), a modified bioretention facility (MBF) was developed by incorporating soil moisture conservation ropes into the filter media layer. Finally, by monitoring and evaluating the stormwater runoff purification efficiency of the bioretention facilities and the variation characteristics of the physicochemical properties and microbial diversity of the filter media, a preliminary analysis of the stormwater purification mechanism of on-site facilities was conducted.

2. Methods

2.1. Study Area

The study area is located on a municipal road in the Sino-Singapore Tianjin Eco-city, Tianjin, China, which has a continental semi-humid monsoon climate with rainy summers and cold and dry winters. The annual average temperature is 12.5 °C, with a maximum temperature of 39.9 °C and a minimum temperature of −18.3 °C. The annual average rainfall is 602.9 mm, mostly (60%) concentrated from July to August.
Figure 1B illustrates the on-site bioretention facilities and the boundary of the catchment area. The bioretention facilities mainly collect runoff from the driveway, sidewalk, and greenbelt areas, with a total catchment area of 1102 m2 (Table 2). Bioretention facilities cover about 10% of the total catchment area. Two different types of bioretention facilities were designed and constructed independently on site. The north side is the CBF, and the south side is the MBF with soil moisture conservation ropes in the filter media layer. The two facilities have the same configuration except for the distinction of having soil moisture conservation ropes.

2.2. Design and Construction of the On-Site Bioretention Facilities

2.2.1. Bioretention Structure and Stormwater Treatment Process

One of the special characteristics of the on-site bioretention facilities is that the soil filter media were screened by a preliminary laboratory-scale test. The optimized media composition was soil, river sand, peat soil, water treatment residual (WTR), vermiculite, and zeolite (Figure 1A) with a mass ratio of 30:24:6:20:10:10 [30]. River sand was used to enhance the infiltration properties of the filter media, and peat soil was used to optimize the media particle gradation for maintaining the water retention and infiltration properties of the filter media [20]. Iron and aluminum metal ions on the surface of WTR can react with dissolved phosphorus in runoff to form phosphate precipitation and result in phosphorus removal [6,31]. Further, WTR was obtained from the local water treatment plant, which reduced the cost of filter media and realized the utilization of solid waste resources. Vermiculite and zeolite are filter media with large surface areas and enhanced adsorption capacity, which can improve the removal efficiency of nitrogen and phosphorus [24]. Table 3 shows the physical properties of the filter media applied in this study.
Another special characteristic of the on-site bioretention facilities is that the soil moisture conservation rope, the performance of which was proved by a laboratory-scale pilot test, was applied to the systematic design of the on-site bioretention system (Figure 1A). The soil moisture conservation rope draws on the concept of moisture conservation in agriculture to maintain the moisture content of the filter media layer [32]. The rope was arranged in a circular pattern in the horizontal direction with a horizontal spacing of 10 cm and a spacing of 20 cm between different horizontal layers. The rope eventually entered the storage tank, and the stored rainwater could flow back through the soil moisture conservation rope into the bioretention facility during the dry period.
The design height of the bioretention facility is 400 mm for the extended retention layer, 550 mm for the soil filter media layer, 100 mm for the sand layer (0.8–1.0 mm particle size), and 200 mm for the gravel layer (5–10 mm particle size) (Figure 1C). The height of the soil filter media layer is greater than the height of 0.4 m used in other studies [33], thus facilitating the growth of plants and the residence time of runoff in the facility and, to a certain extent, facilitating the removal of runoff pollutants.
The rainwater collected in the primary sedimentation tank was divided and evenly distributed to the two bioretention facilities with equal volumes to ensure the same inflow and pollutant loads in both bioretention facilities. The downstream section of the pipe connecting the primary sedimentation tank to the bioretention facility was placed on the side slope of the bioretention facility. The pipe was slotted on the side facing the facility to guarantee uniform inflow distribution along the inlet pipe. The rainwater in the storage tank, which meets relevant standards for water reuse [34,35], can be used for greening and/or road spraying. Otherwise, it is discharged into downstream municipal rainwater networks. The excess rainwater will be discharged directly into municipal rainwater networks through the overflow chamber (Figure 1C). Based on the proposed design, on-site bioretention facilities were constructed from May 2020 to September 2020. The main construction process included the construction of the primary sedimentation tank and storage tanks, site excavation and slope trimming, arrangement of inlet and outlet pipes and plants, etc. The constructed bioretention facilities are shown in Figure 1B.

2.2.2. Monitoring Methods and Equipment

A series of devices were installed around the bioretention facility, including an automatic sampler, flow sensor, rain gauge, and soil temperature and moisture sensor, enabling automatic on-site sampling of inflow and outflow, along with real-time online monitoring of rainfall and the temperature and moisture conditions of the soil filter media. The monitoring period covered a total of nine months from September 2020 to May 2021, spanning from fall to summer in the study area.
The automatic sampler (Beijing Grasp Technology Development Co., Beijing, China) was used to collect 1 L of rainwater samples from the inlet and outlet of the bioretention facility at 5 min intervals. The purpose of collecting rainfall runoff samples every 5 min was to reveal how runoff pollutant concentrations vary over the rainfall period and the severity of runoff pollution compared to water quality standards. Such monitoring will obtain the event mean concentration (EMC), which is often used to analyze the pollutant treatment efficiency of bioretention facilities [36]. It is also expected to provide a reference for the analysis of rainfall-runoff pollution characteristics and the operation and maintenance of facilities. A 5 min interval was determined according to rainfall characteristics and was consistent with those of flow sensors and rainfall monitoring, which contributed to the accuracy of results. Water quality testing indicators for rainwater samples include TSS, COD, TN, ammonia-nitrogen (NH3-N), nitrate-nitrogen (NO3-N), and TP. The standard methods and main instruments used for water quality testing are shown in the Supplementary Materials (Table S1). A flow sensor (Wuhan Newfiber Optics Electron Co., Ltd., Wuhan, China) was used to record the flow rates of inflow and outflow at 5 min intervals. A rainfall gauge (Wuhan Newfiber Optics Electron Co., Ltd., Wuhan, China) was used to monitor the rainfall condition on-site at 5 min intervals. A soil temperature and humidity sensor (Shandong Renke Control Technology Co., Ltd., Jinan, China) was used to monitor the change patterns of temperature and moisture in the filter media layer. The measured moisture refers to the volumetric moisture content (%) of the soil filter media, which was obtained by measuring the soil dielectric constant and analyzing the relationship between the soil dielectric constant and the volumetric moisture content [37]. Monitoring sites for soil temperature and moisture are shown in Figure 2, with the monitoring sensors numbered from 1 to 12.
In addition, the monitoring of the chemical properties and microbial communities of the filter media layer was carried out by manual sampling. The sampling sites (numbered from C111 to C223) were next to the location of the temperature- and moisture-monitoring sites (Figure 2), except that the control group (C001) was sampled from the original on-site saline soil next to the bioretention facility. The chemical properties of the samples were tested using 6 indicators: pH, cation-exchange capacity (CEC), organic matter (OM), soil total nitrogen (STN), soil total phosphorus (STP), and total salt content (TSC). The standard methods and main instruments used for testing media chemical properties are shown in the Supplementary Materials (Table S2). The microbial diversity of the filter media was examined using the samples collected. Sampling was performed in November 2020, March 2021, and June 2021, and 19 samples, including 18 bioretention facility filter media samples and 1 control on-site saline soil sample, were obtained. High-throughput sequencing was performed on these samples. The data were analyzed on the free online Majorbio Cloud Platform (www.majorbio.com accessed on 25 August 2021). The accession number of these DNA sequences is PRJNA773235. In order to avoid differences in the microbial biomass of each sample, the sample sequences were extracted equally by the minimum number of sequences, and the standardized data were obtained for subsequent statistical analysis. Dilution curves based on the Sobs index on the operational taxonomic unit (OTU) level were used to evaluate the reliability of the amount of sequencing data depending on whether the curves had reached a plateau. The Sobs index reflects the observed richness of the microbial community [38] and was calculated by counting the number of observed OTUs in each sample sequence. The OTU is a common basic unit used in numerical taxonomy to count the number of microorganisms. The effects of environmental factors on the abundance and composition of the microbial community were quantified based on the redundancy analysis (RDA) method. RDA is considered a principal component analysis with instrumental environmental factors, which can reflect relationships between the distribution of microorganisms and relevant environmental factors [39,40].

2.2.3. Challenge Tests

A challenge test, which involves the dosing of synthetic stormwater runoff into the bioretention facilities in controlled conditions, was conducted in September and October 2021. Challenge tests are the most widely accepted method to confirm the removal contribution of a treatment system [29]. The target influent pollutant concentration was based on 8 storm events in Tianjin between March and May 2019 (Table 4). The event volume was used to determine the amount of synthetic stormwater that would be dosed into the bioretention facilities. In this study, the amount of water added per challenge test was around 3 m3 for each bioretention facility (approximately 0.4 times the pore volume). Based on this volume, the bioretention facilities took roughly 3 h until the last drop of water was observed to exit the bioretention facilities. During the challenge test, water from an adjacent canal was pumped into a mixing tank, and prepared chemicals were mixed using an electric mixer. The mixed-dosed water was then released to the bioretention facilities. For sampling, three inflow samples were taken from the outlet hose of the mixing tank. For the outflow samples, time-based sampling every 5 min was conducted using the autosamplers on-site. Once the water samples were collected, they were stored in an icebox before delivery to the laboratory for water quality testing.

3. Results and Discussion

3.1. Stormwater Purification Performance

The performance of the on-site bioretention facility in removing runoff pollutants during the rainfall periods was evaluated. During a rainfall event in September 2020 (Figure 3a), the cumulative rainfall at the site was 30.5 mm, with a maximum rain intensity of 28.5 mm/30 min and an antecedent dry period of 21 days. The water quality of the collected samples of road rainfall runoff was evaluated on the basis of the Environmental Quality Standards for Surface Water [2], the Reuse of Urban Recycling Water-Water Quality Standard for Urban Miscellaneous Use [35], and Engineering Technical Code for Rain Utilization in Building and Sub-district [34] (Figure 3b–g). The results indicated that the concentrations of COD, TN, NH3-N, and NO3-N showed decreasing trends to varying extents, while TP and TSS showed fluctuating upward trends. This is attributed to the rainfall patterns and associated influent flow processes. The standard for surface water quality evaluation imposes higher requirements on the quality of collected water [2]. Based on the influent flow hydrograph (Figure 3a), the EMC of influent CODCr was 36 mg/L, which belongs to Class V (≤40 mg/L) of surface water quality [2]. The EMC of TP was 0.28 mg/L, which belongs to Class IV (≤0.3 mg/L). The EMCs of TN and NH3-N were 5.59 and 2.90 mg/L, respectively, both exceeding Class V of surface water quality (≤2 mg/L), although NH3-N met the standard for non-potable water reuse [35]. The EMC of NO3-N was 1.41 mg/L. The EMC of SS was 498 mg/L, which far exceeds the standard for rainwater reuse [34].
The road stormwater runoff was treated through the combination of physical, chemical, and microbial processes in the bioretention facilities, and the effluent was eventually collected in the storage tank. In the storage tank of the CBF, 6 mg/L TSS, 22 mg/L CODCr, 0.11 mg/L TP, 5.25 mg/L TN, 0.13 mg/L NH3-N, and 3.86 mg/L NO3-N were detected. The water quality of the collected water generally showed satisfactory improvement compared to that of the influent, where TSS was reduced by around 98.8%. Indicators of CODCr, TP, TN, and NH3-N were also reduced, with CODCr reaching Class IV (≤30 mg/L), TP reaching Class III (≤0.2 mg/L), and NH3-N reaching Class I (≤0.15 mg/L). Due to the lack of a denitrification environment in the filter media layer, TN was less likely to be removed and still exceeded Class V [2]. This also resulted in an increase in NO3-N in the collected water. Previous studies have also shown that there is uncertainty in TN and NO3-N removal, which could be improved by designing an anaerobic zone at the bottom of the bioretention facility and/or adding extra carbon sources [41,42,43]. According to these indicators, the effluent meets the standards for the usage of rainwater and non-potable water (TSS ≤ 10 mg/L, CODCr ≤ 30 mg/L, NH3-N ≤ 15 mg/L) [34,35] and hence has the potential for water resources reuse, such as daily greening, road spraying, and ornamental water supply.
In the storage tank in the MBF, 8 mg/L TSS, 42 mg/L CODCr, 0.07 mg/L TP, 4.71 mg/L TN, 3.09 mg/L NH3-N, and 0.75 mg/L NO3-N were detected. The results indicated that TSS was significantly reduced by 98.4%, and TP, TN, and NO3-N were also reduced. In contrast, the CODCr and NH3-N of the effluent were higher than those of the influent, which both exceed Class V (≤40 mg/L). Compared with the CBF, the higher CODCr and NH3-N in the MBF were mainly attributed to the high soil moisture content, which reduced the degradation rate of organic matter and impeded nitrification reactions. This eventually led to a reduction in the removal rate of NH3-N, and the results were consistent with the previous laboratory-scale pilot test [32]. These indicators show that the effluent from the MBF meets the standards for the usage of rainwater and non-potable water (TSS ≤ 10 mg/L, NH3-N ≤ 15 mg/L) [34,35] and hence has the potential for water resources reuse.

3.2. Challenge Test Results of Bioretention Facilities

The water quality results of the challenge test are compiled and tabulated in Table 5. In the challenge test, TSS, TP, and CODCr had an effective average removal efficiency of 62.4%, 66.3%, and 78.2%, respectively, for the MBF and 64.4%, 70.3%, and 78.9%, respectively, for the CBF. The removal performance of these three water quality parameters was similar between the two bioretention facilities, and this was due to the similar composition of the filter media. Previous literature studies also concluded that amendments in the filter media such as WTR and zeolite can help to remove TP and CODCr from the runoff [29,44]. For TN and nitrogen species, the MBF had an average removal efficiency of 59.4%, 70.6%, and −68.6% for TN, NH3-N, and NO3-N, respectively, while the CBF had an average removal efficiency of 55.1%, 75.3%, and −140.2%, respectively. Nitrate was not removed effectively, and thus, the majority of the TN removal may be due to the decrease in ammonia nitrogen by the nitrification process or plant uptake and particulate organic nitrogen by sedimentation or filtration processes. As reported by Lopez-Ponnada et al. [16], the removal of NO3-N can be highly variable, ranging from −630% to 46%.

3.3. Change Patterns of Media Moisture and Temperature

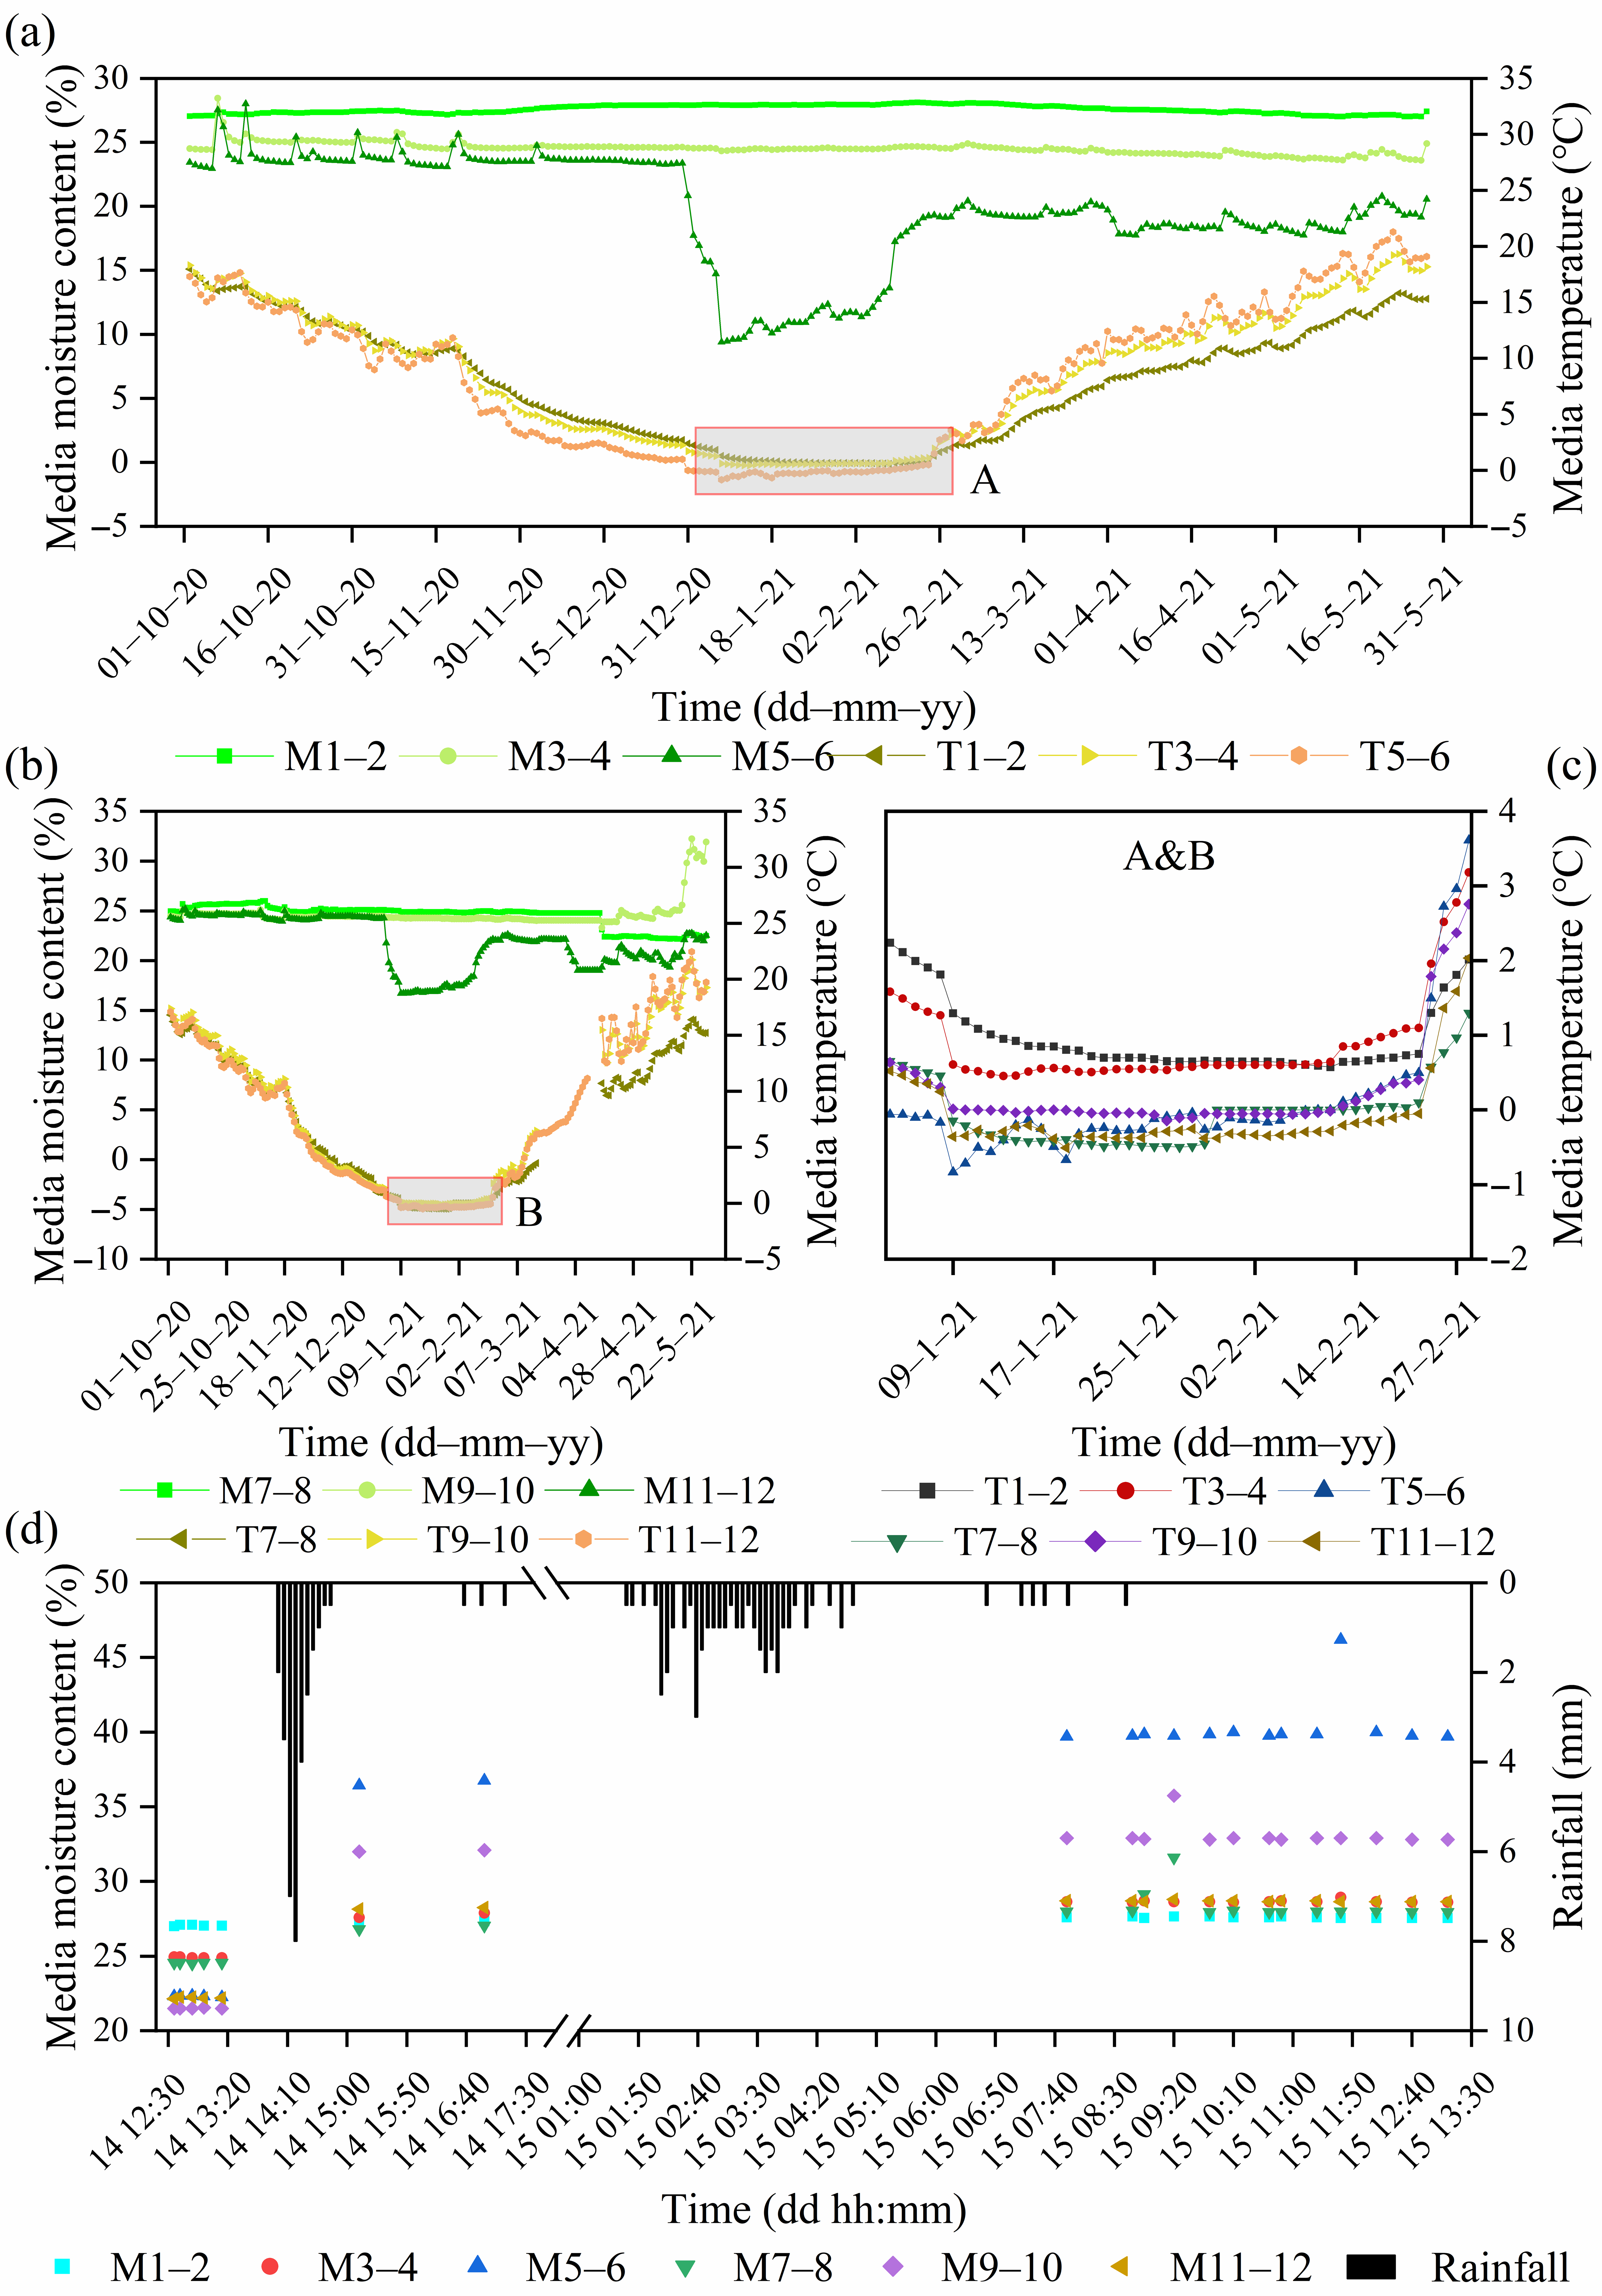
Figure 4 illustrates the spatiotemporal changes in the media temperature and moisture of the bioretention facilities. The numbers M1-2 and T1-2 represent the average values of moisture contents and temperature for soil temperature and moisture sensors No. 1 and No. 2 (Figure 2), respectively, and the same scheme applies to the other numbers. For the MBF, the soil moisture content of the upper layer was significantly influenced by external climatic conditions during the monitoring period. With the decrease in external temperature from October to January, the soil temperature gradually decreased to below 0 °C, and the moisture content decreased from 23% to around 9.5% (Figure 4a). The relatively significant moisture decline was mainly related to significant changes in the soil dielectric constant accompanied by changes in soil structure (e.g., water freezing). Afterward, the soil temperature gradually increased, and the moisture content recovered to around 18% by the end of May. In contrast, the moisture contents in the middle and bottom layers (M3-4 and M1-2) were maintained at about 24.5% and 28%, respectively, during the monitoring period. The media moisture content of the upper layer of the CBF was less affected by external climatic conditions (Figure 4b). It was close to that of the MBF at around 24% when the soil temperature was above 0 °C and dropped to a minimum of around 16.5% when the soil temperature reached below 0 °C. The moisture content of the middle layer was close to that of the MBF, while the bottom layer was about 2–3% lower than the MBF.
In terms of media temperature, the bottom and middle temperatures were at similar levels for both types of bioretention facilities in the autumn, but by winter, the CBF was about 0.5–1.0 °C cooler than the MBF. Further, the MBF was able to recover to similar levels more rapidly than the CBF during the spring and summer periods (Figure 4c). The results suggest that the MBF is more conducive to the maintenance and restoration of the media temperature under cold climate conditions.
The variation in media moisture content with precipitation was analyzed for the rainfall event during September 2020, as shown in Figure 4d. The results indicated that during the dry period, the moisture content of the upper layer of the MBF was similar to that of the CBF at about 22%, while the moisture content of the middle and bottom layers of the MBF was 2–3% higher than that of the CBF on average. During the rainy period, the upper layer water content of the MBF was significantly higher, rising to 40–46%, while it only rose to about 29% for the CBF. The results indicated that the media moisture content of the MBF could be maintained at a high level under dry climate conditions.

3.4. Change Patterns of the Media Chemical Properties

Figure 5 illustrates the change patterns of media chemical properties since the early stage (T0) of the bioretention facilities. T1, T2, and T3 represent the sampling times in November 2020, March 2021, and June 2021, respectively. It is assumed that the chemical properties of the control group remained constant over the study period. At the initial stage, the media pH value was 7.83 and the TSC was 4.26 g/kg, indicative of an alkaline media with intense salinization in the study area (Figure 5a,b). Such a medium will affect the nitrification reaction of microorganisms and reduce the effectiveness of phosphorus content for plant growth. By the end of the study period, the media pH and TSC were reduced by 2.7% and 63.3%, respectively, to a neutral alkaline media with moderate salinization. This indicated that the internal microenvironment of the filter media changed in a direction favorable for plant growth and microbial activities. The increase in media CEC indicated that bioretention facilities were capable of creating a relatively stable medium environment for plant growth and soil microbial activities. This can also be concluded from the changes in OM, which was much higher than that of the on-site saline soil. There was a slight increase in STN from the initial stage, while the STP gradually decreased to a level close to that of the control group, indicating that there is less risk of nitrogen and phosphorus leaching with stormwater runoff in the soil filter media layer.

3.5. Characteristics of the Media Microbial Diversity

3.5.1. Distribution of Microbial Communities

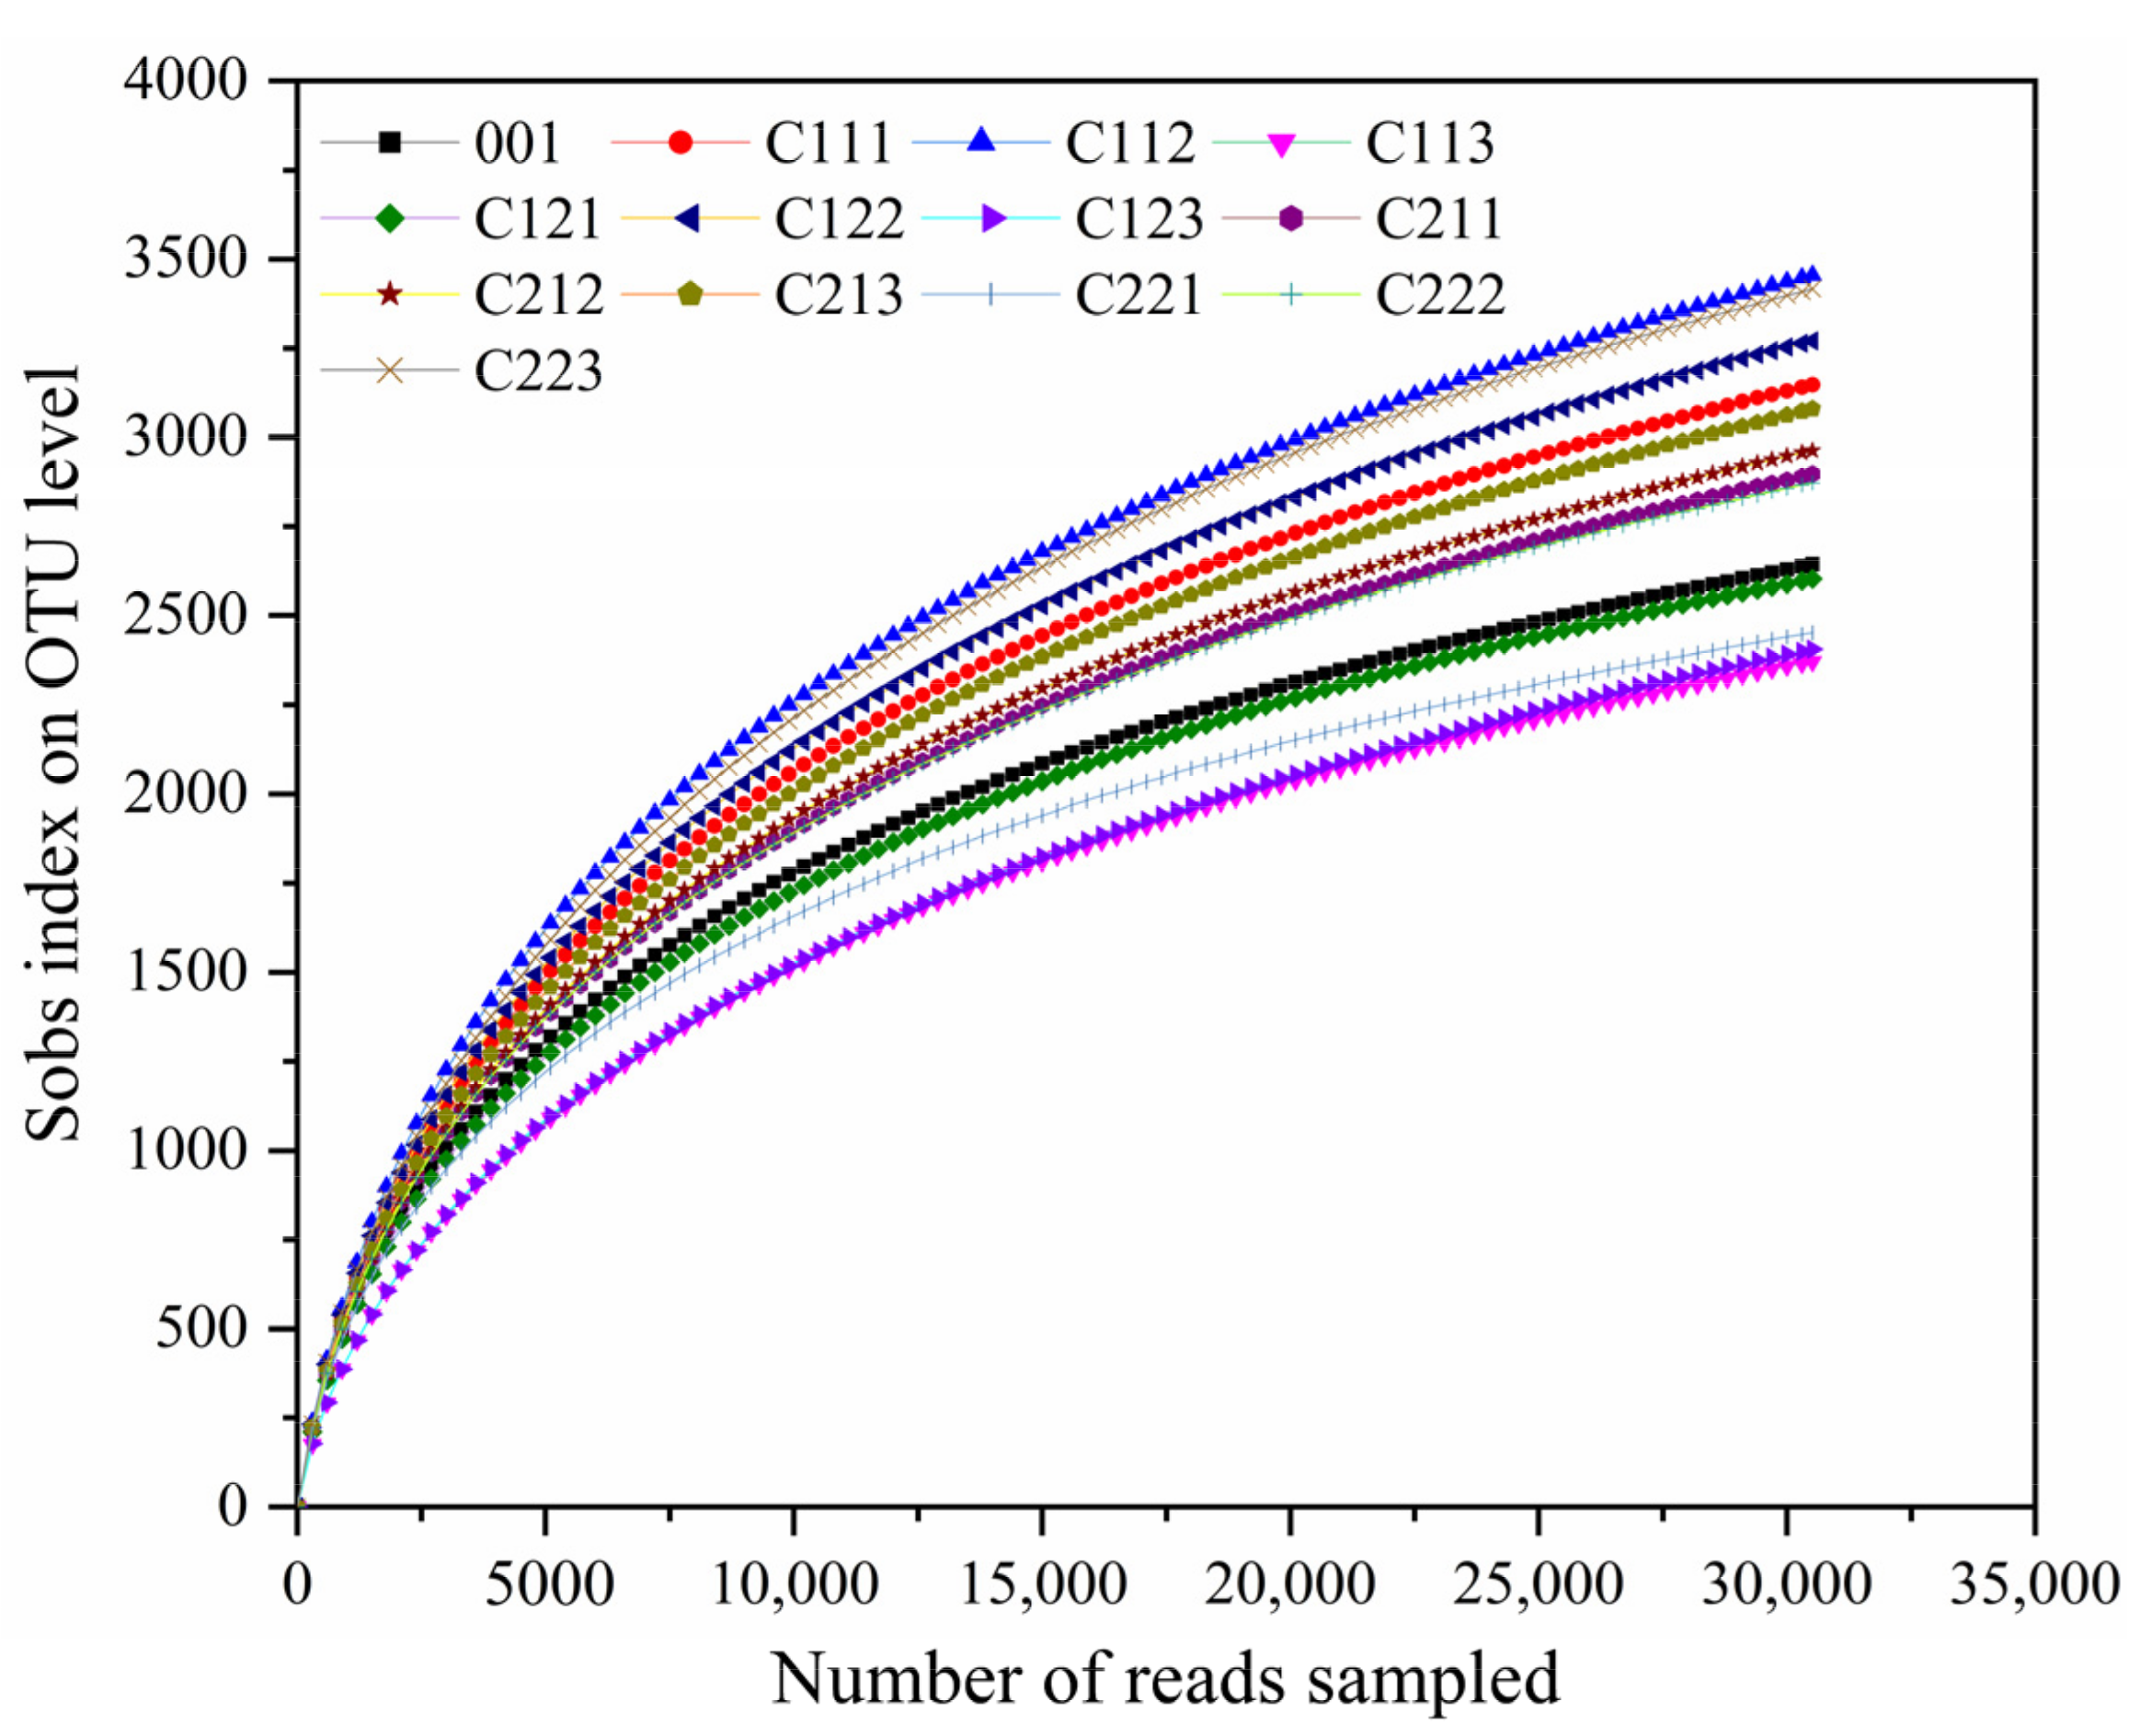
The number of valid sequences of each sample was 24,183, and there were 51 phyla, 135 orders, 278 orders, 529 families, 1106 genera, 2286 species, and 6796 OTUs. Figure 6 shows the dilution curves of each sample based on the Sobs index at the OTU level. The results indicated that most of the microorganisms in the soil filter media had been analyzed, and the results could realistically reflect the microbial community composition of the study area.
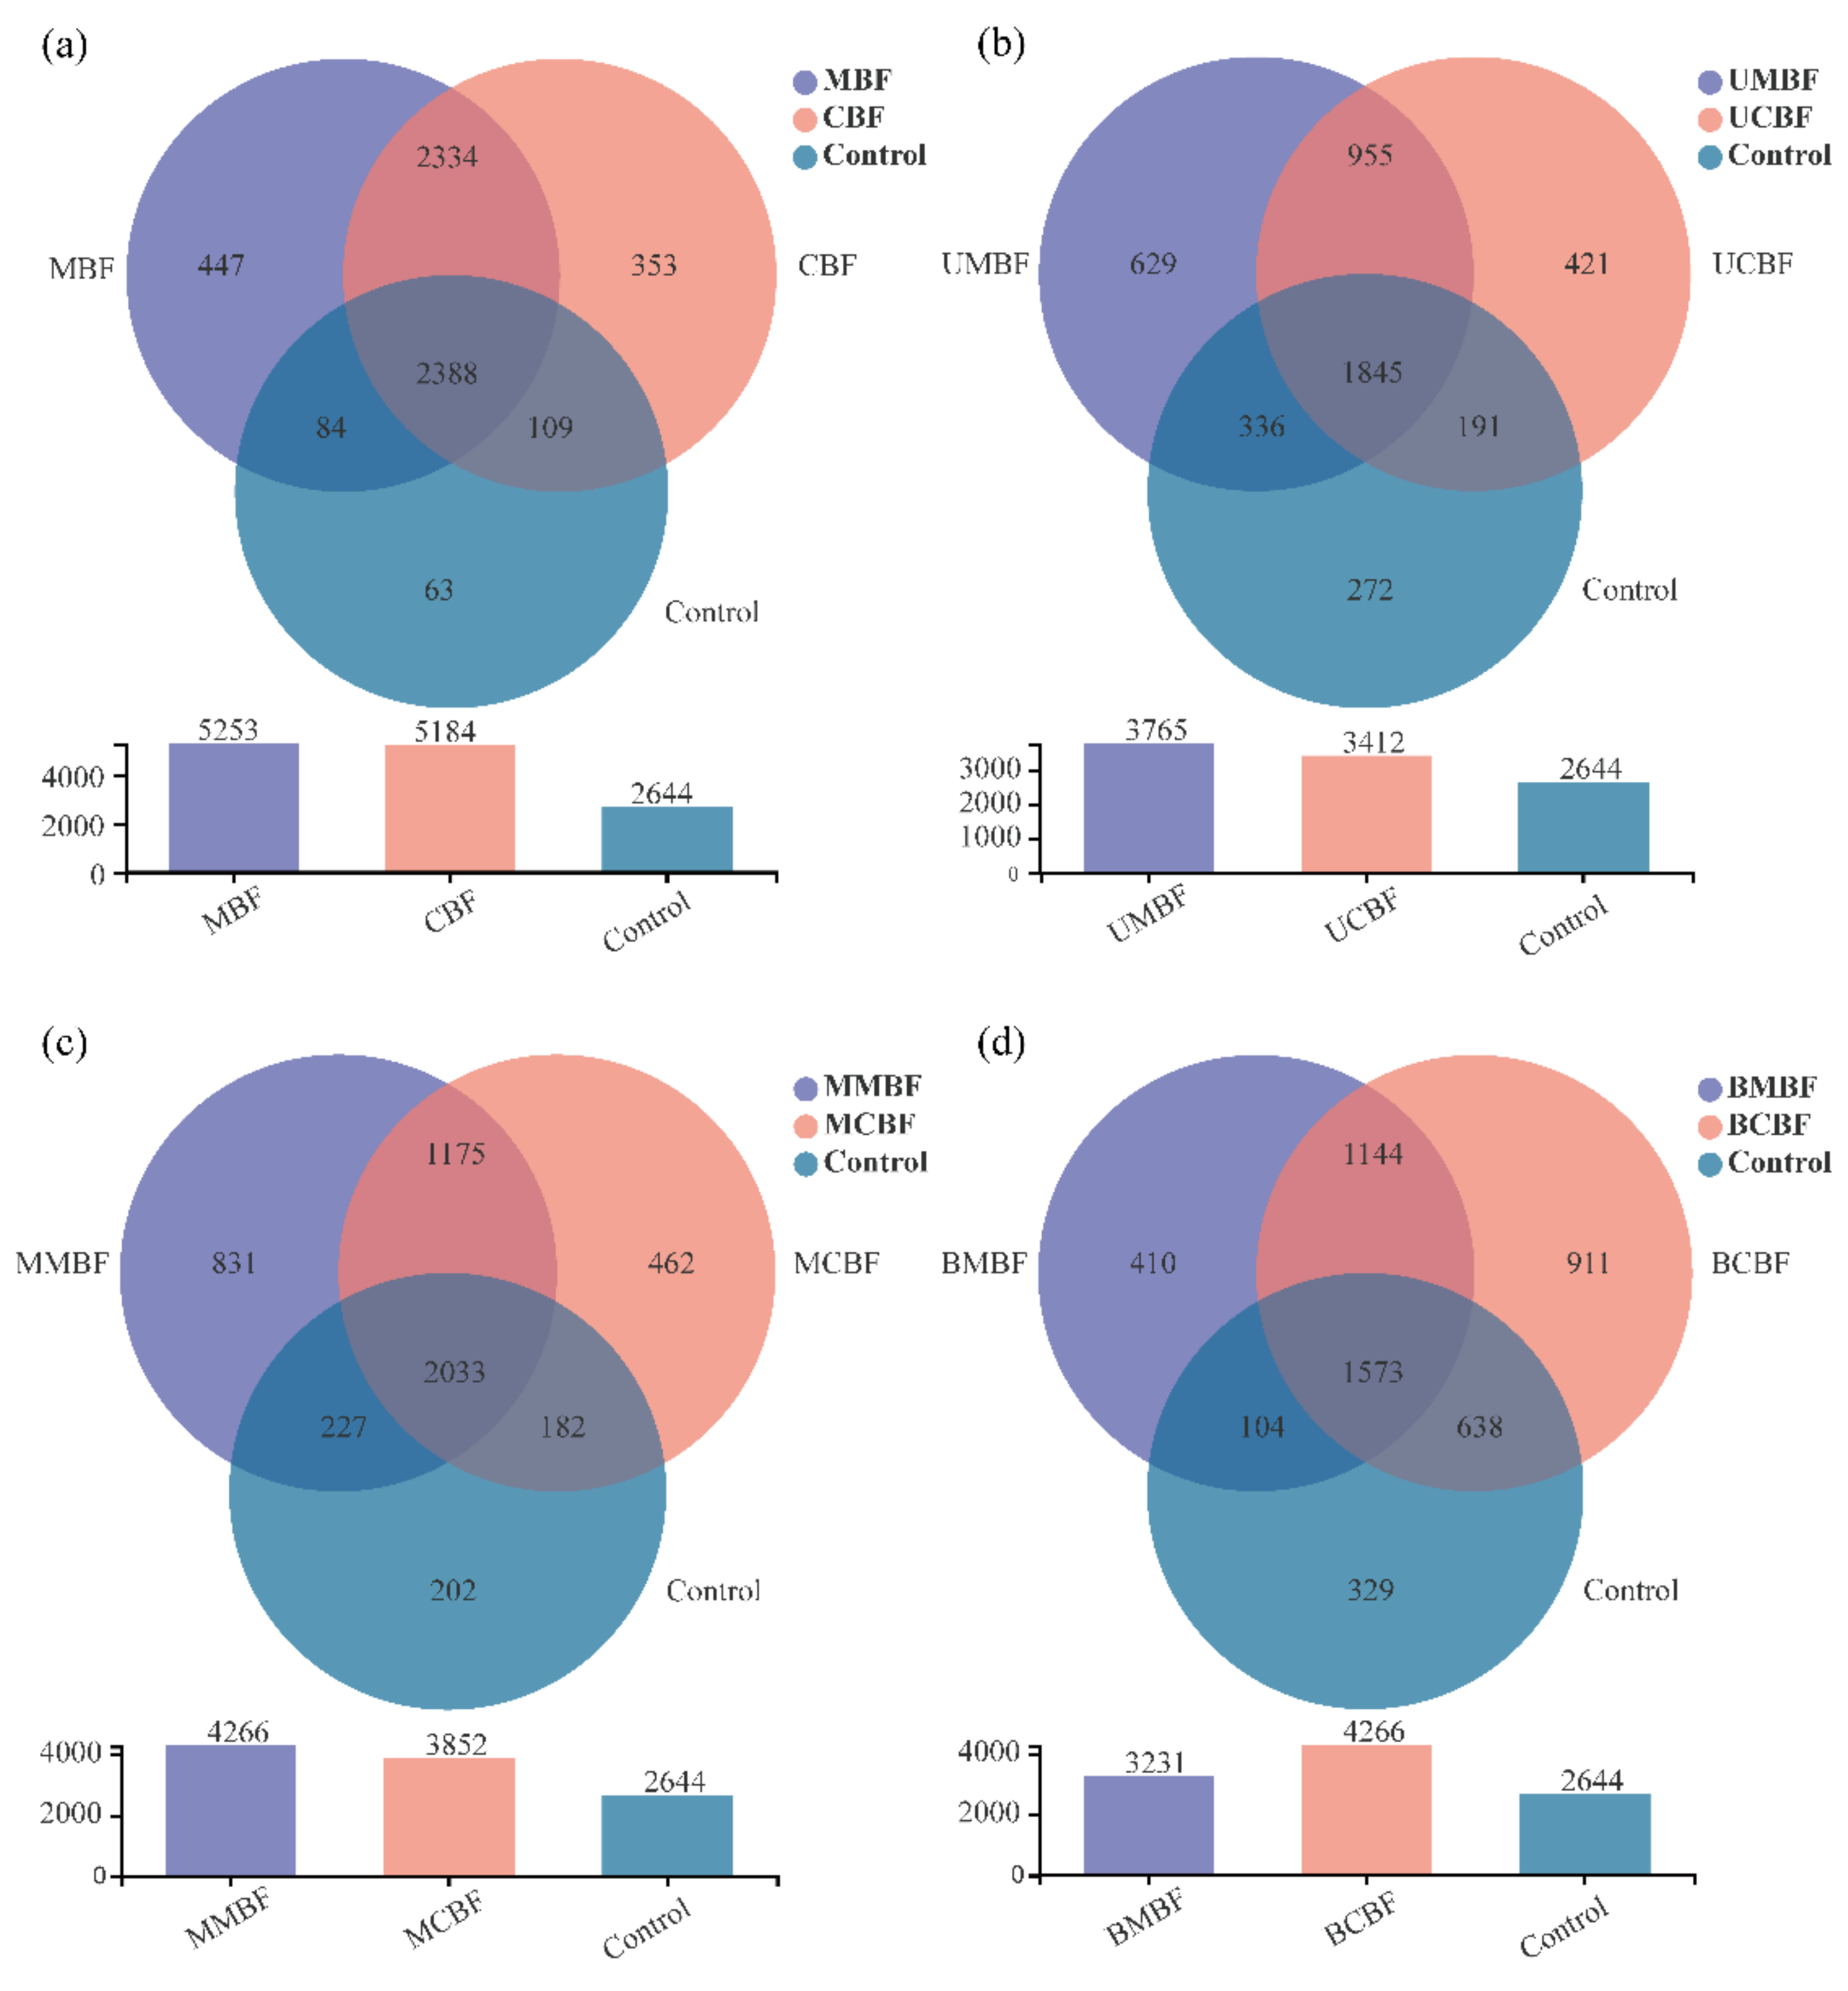
A Venn diagram was used to visually capture the number of shared and unique OTUs in the soil filter media (Figure 7a). The results indicated that the MBF and the CBF had 5253 and 5184 OTUs, respectively, with 4722 OTUs appearing in both facilities. The soil filter media of both facilities had many more species than the on-site saline soil (control). There were 447, 353, and 63 OTUs unique to the MBF, CBF, and control, respectively, accounting for 8.5%, 6.8%, and 2.4% of their total OTUs, respectively. These data indicated that the bioretention facility filter media significantly enhanced the species diversity of soil microorganisms. At the same time, the MBF had more OTUs and more unique OTUs than the CBF, indicating that the soil moisture conservation ropes could increase the microbial diversity in the filter media layer of the bioretention facility.
The microbial diversity of different vertical layers of the bioretention facility was analyzed (Figure 7b–d). The results indicated that all vertical layers of the bioretention facility had more OTUs than the control saline soil. The number of OTUs was higher in the upper layer (UMBF) and middle layer (MMBF) of the MBF than in the upper (UCBF) and middle (MCBF) layers of the CBF, but it was the opposite in the bottom layer. The bottom layer (BCBF) of the CBF had the highest number of OTUs and more unique OTUs (21.3%) than the other layers, while the bottom layer (BMBF) of the MBF had the lowest number of OTUs and fewer unique OTUs (12.7%). The results suggest that there are differences in the composition and distribution characteristics of OTUs in the vertical direction of bioretention facilities. This is mainly due to the difference in physical properties such as media moisture and temperature in the vertical direction.

3.5.2. Composition of Microbial Communities

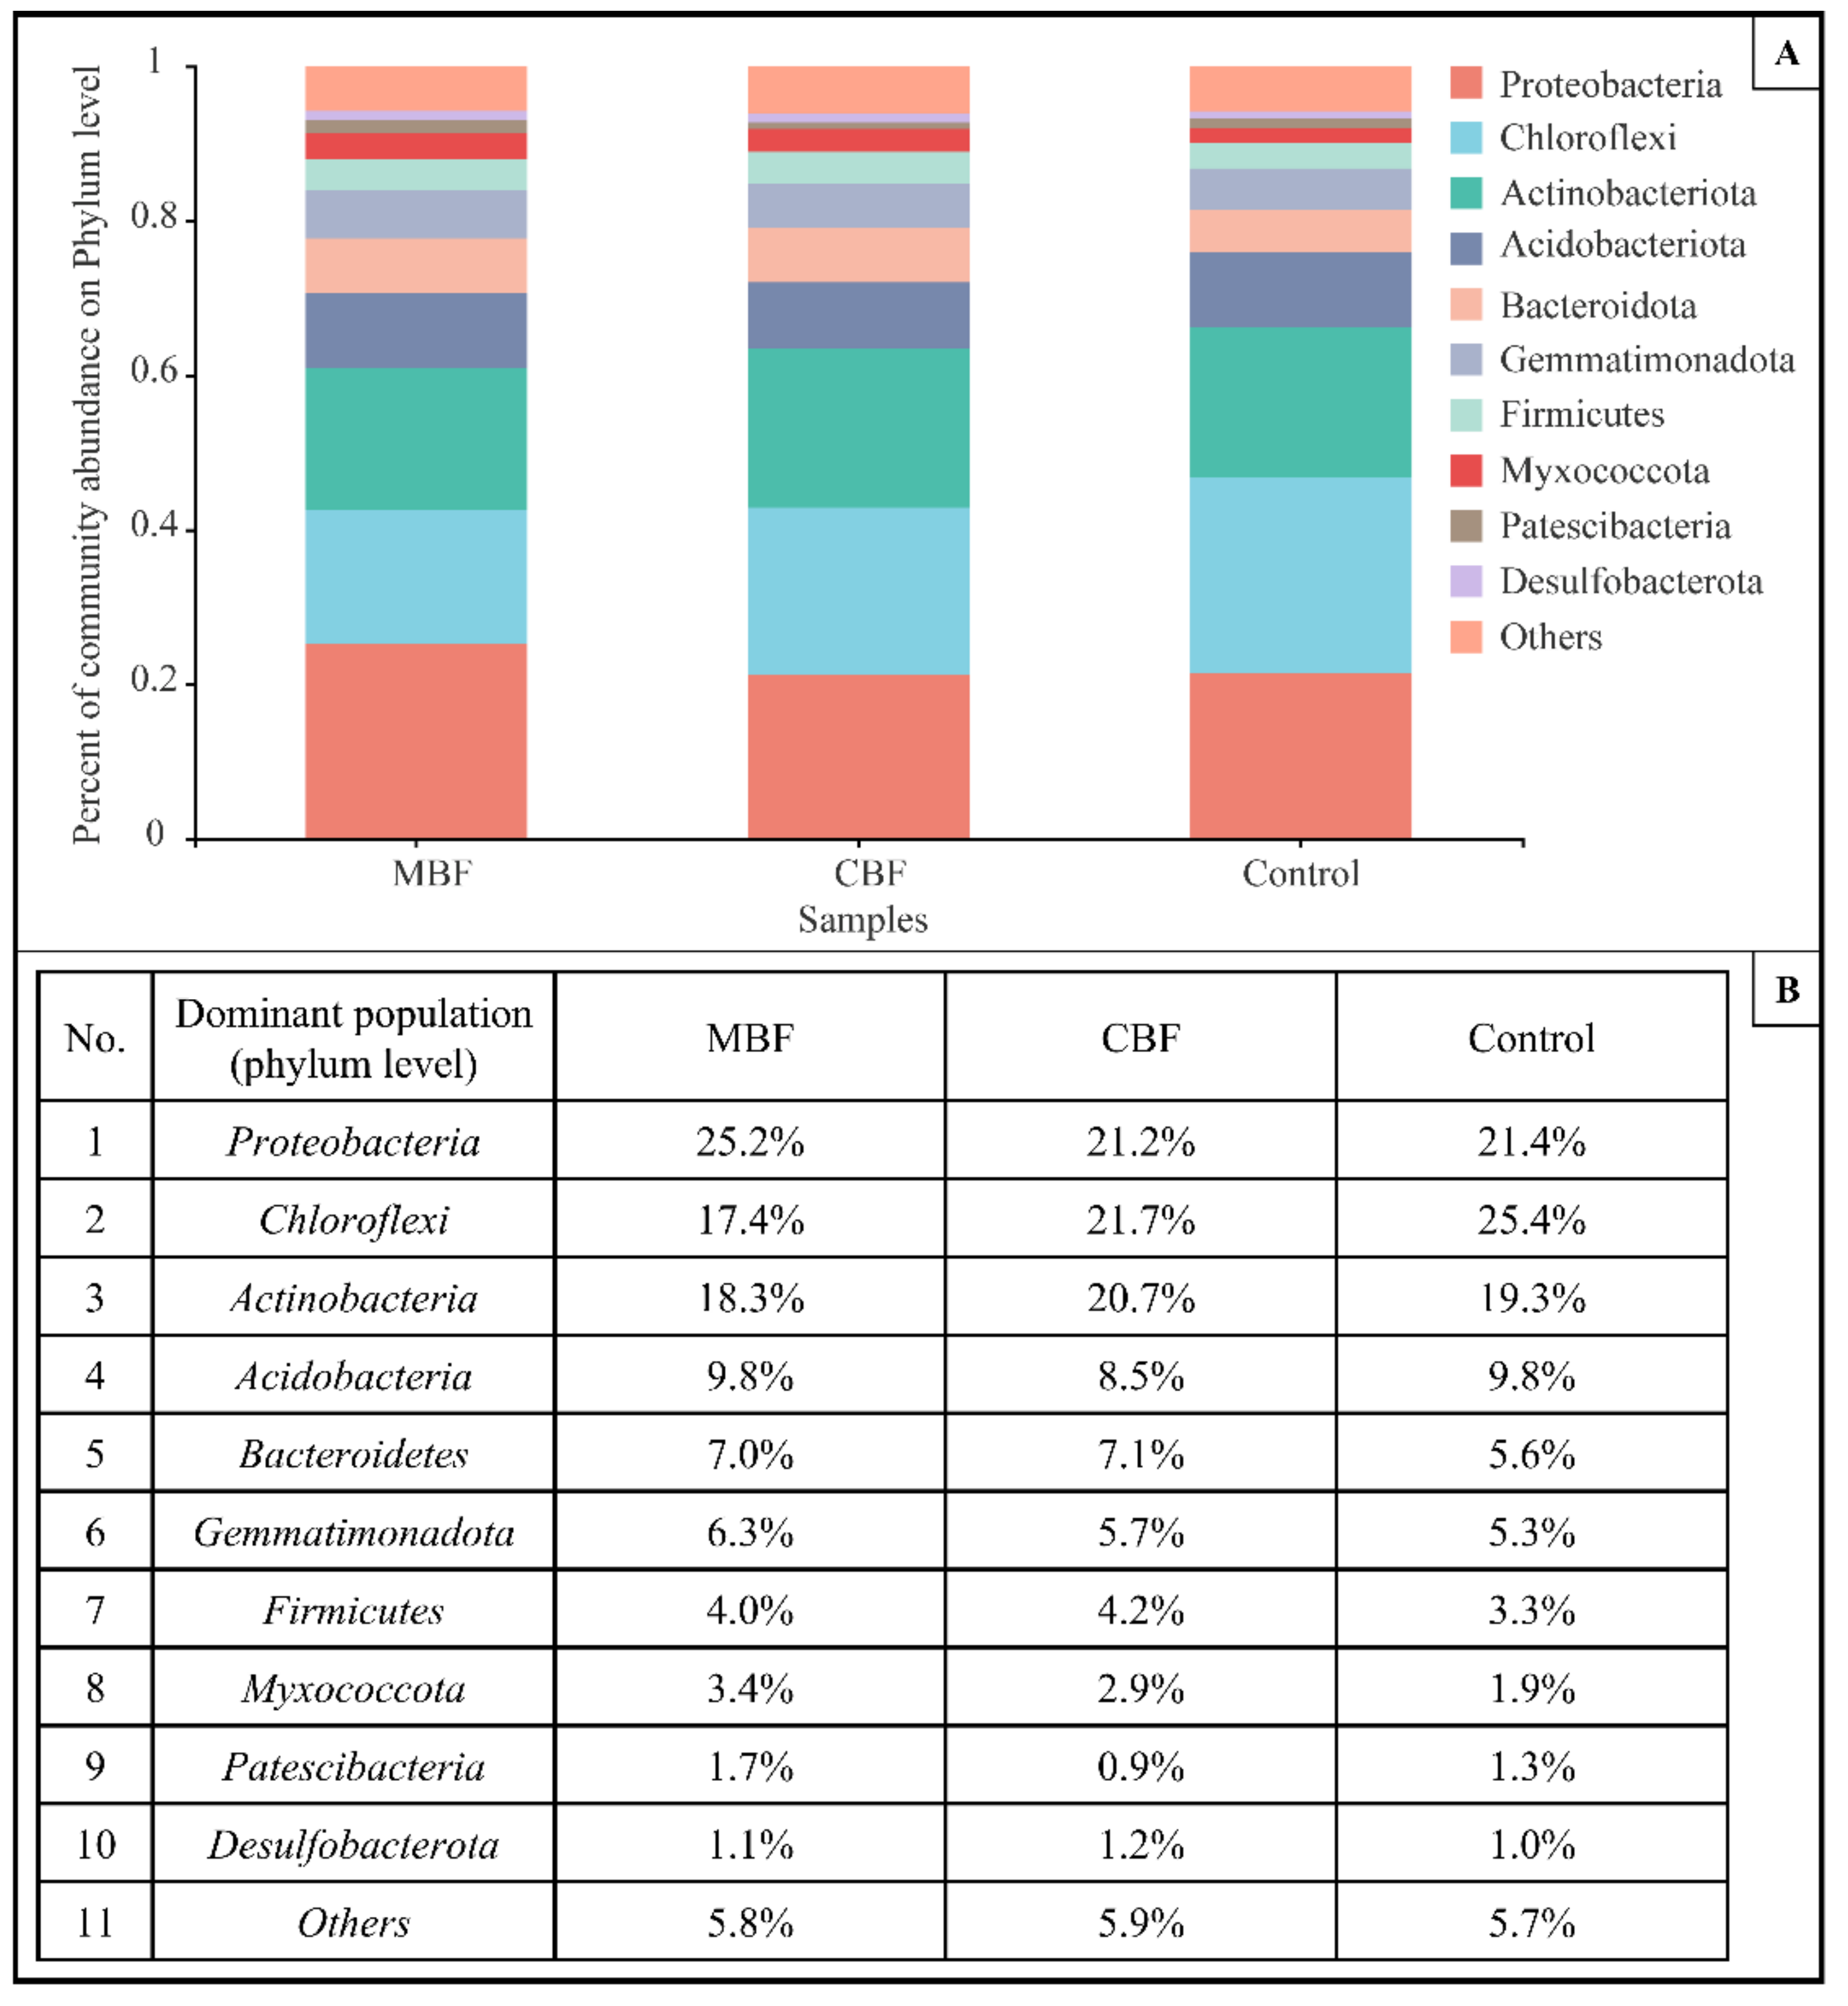
There were 10 major phyla in the study area (Figure 8), namely, Proteobacteria, Chloroflexi, Actinobacteria, Acidobacteria, Bacteroidetes, Gemmatimonadota, Firmicutes, Myxococcota, Patescibacteria, and Desulfobacterota. Proteobacteria was the dominant phylum in the MBF, accounting for 25.2% of the microbial community. It has been demonstrated that Proteobacteria make a major contribution to nitrogen removal, and microorganisms in this phylum are often involved in nitrogen fixation, nitrification, and denitrification processes [45]. In contrast, the most dominant phylum in the CBF was Chloroflexi, with a relative abundance of 21.7% in the microbial community, slightly higher than the second most abundant Proteobacteria (21.2%), and Actinobacteria (20.7%) ranked third. Chloroflexi are often involved in the process of microbial denitrification for nitrogen removal [46] and also have a relatively high capacity for biological phosphorus removal [47]. A large number of Actinobacteria genera are present in simultaneous denitrification and phosphorus removal systems [48]. The most dominant phylum in the control saline soils was Chloroflexi, which accounted for 25.4% of the microbial community.
Acidobacteria were relatively abundant in the MBF, CBF, and control group (Figure 8), with relative abundances ranging from 8.5% to 9.8%, and are often involved in the denitrification reactions [49]. In addition, the relative abundance of Bacteroidota was also relatively high, ranging from 5.6% to 7.1%. Microorganisms belonging to this phylum mostly obtain energy through the degradation of COD and are involved in the process of nitrogen and phosphorus removal [48]. Gemmatimonadota was also one of the dominant phyla, with a relative abundance ranging from 5.3% to 6.3%, followed by Firmicutes (3.3–4.2%), Myxococcota (1.9–3.4%), Patescibacteria (0.9–1.7%), and Desulfobacterota (0.9–1.2%). Microorganisms belonging to the phylum Firmicutes can participate in denitrification processes under anaerobic conditions [50]. The results indicated that there were differences in the composition of the microbial community between the MBF and CBF, mainly for Proteobacteria and Chloroflexi. Proteobacteria was the most metabolically active microbial population in bioretention facilities, which is consistent with the findings of other related studies [38,51].

3.6. Redundancy Analysis of Environmental Factors and Microbial Communities

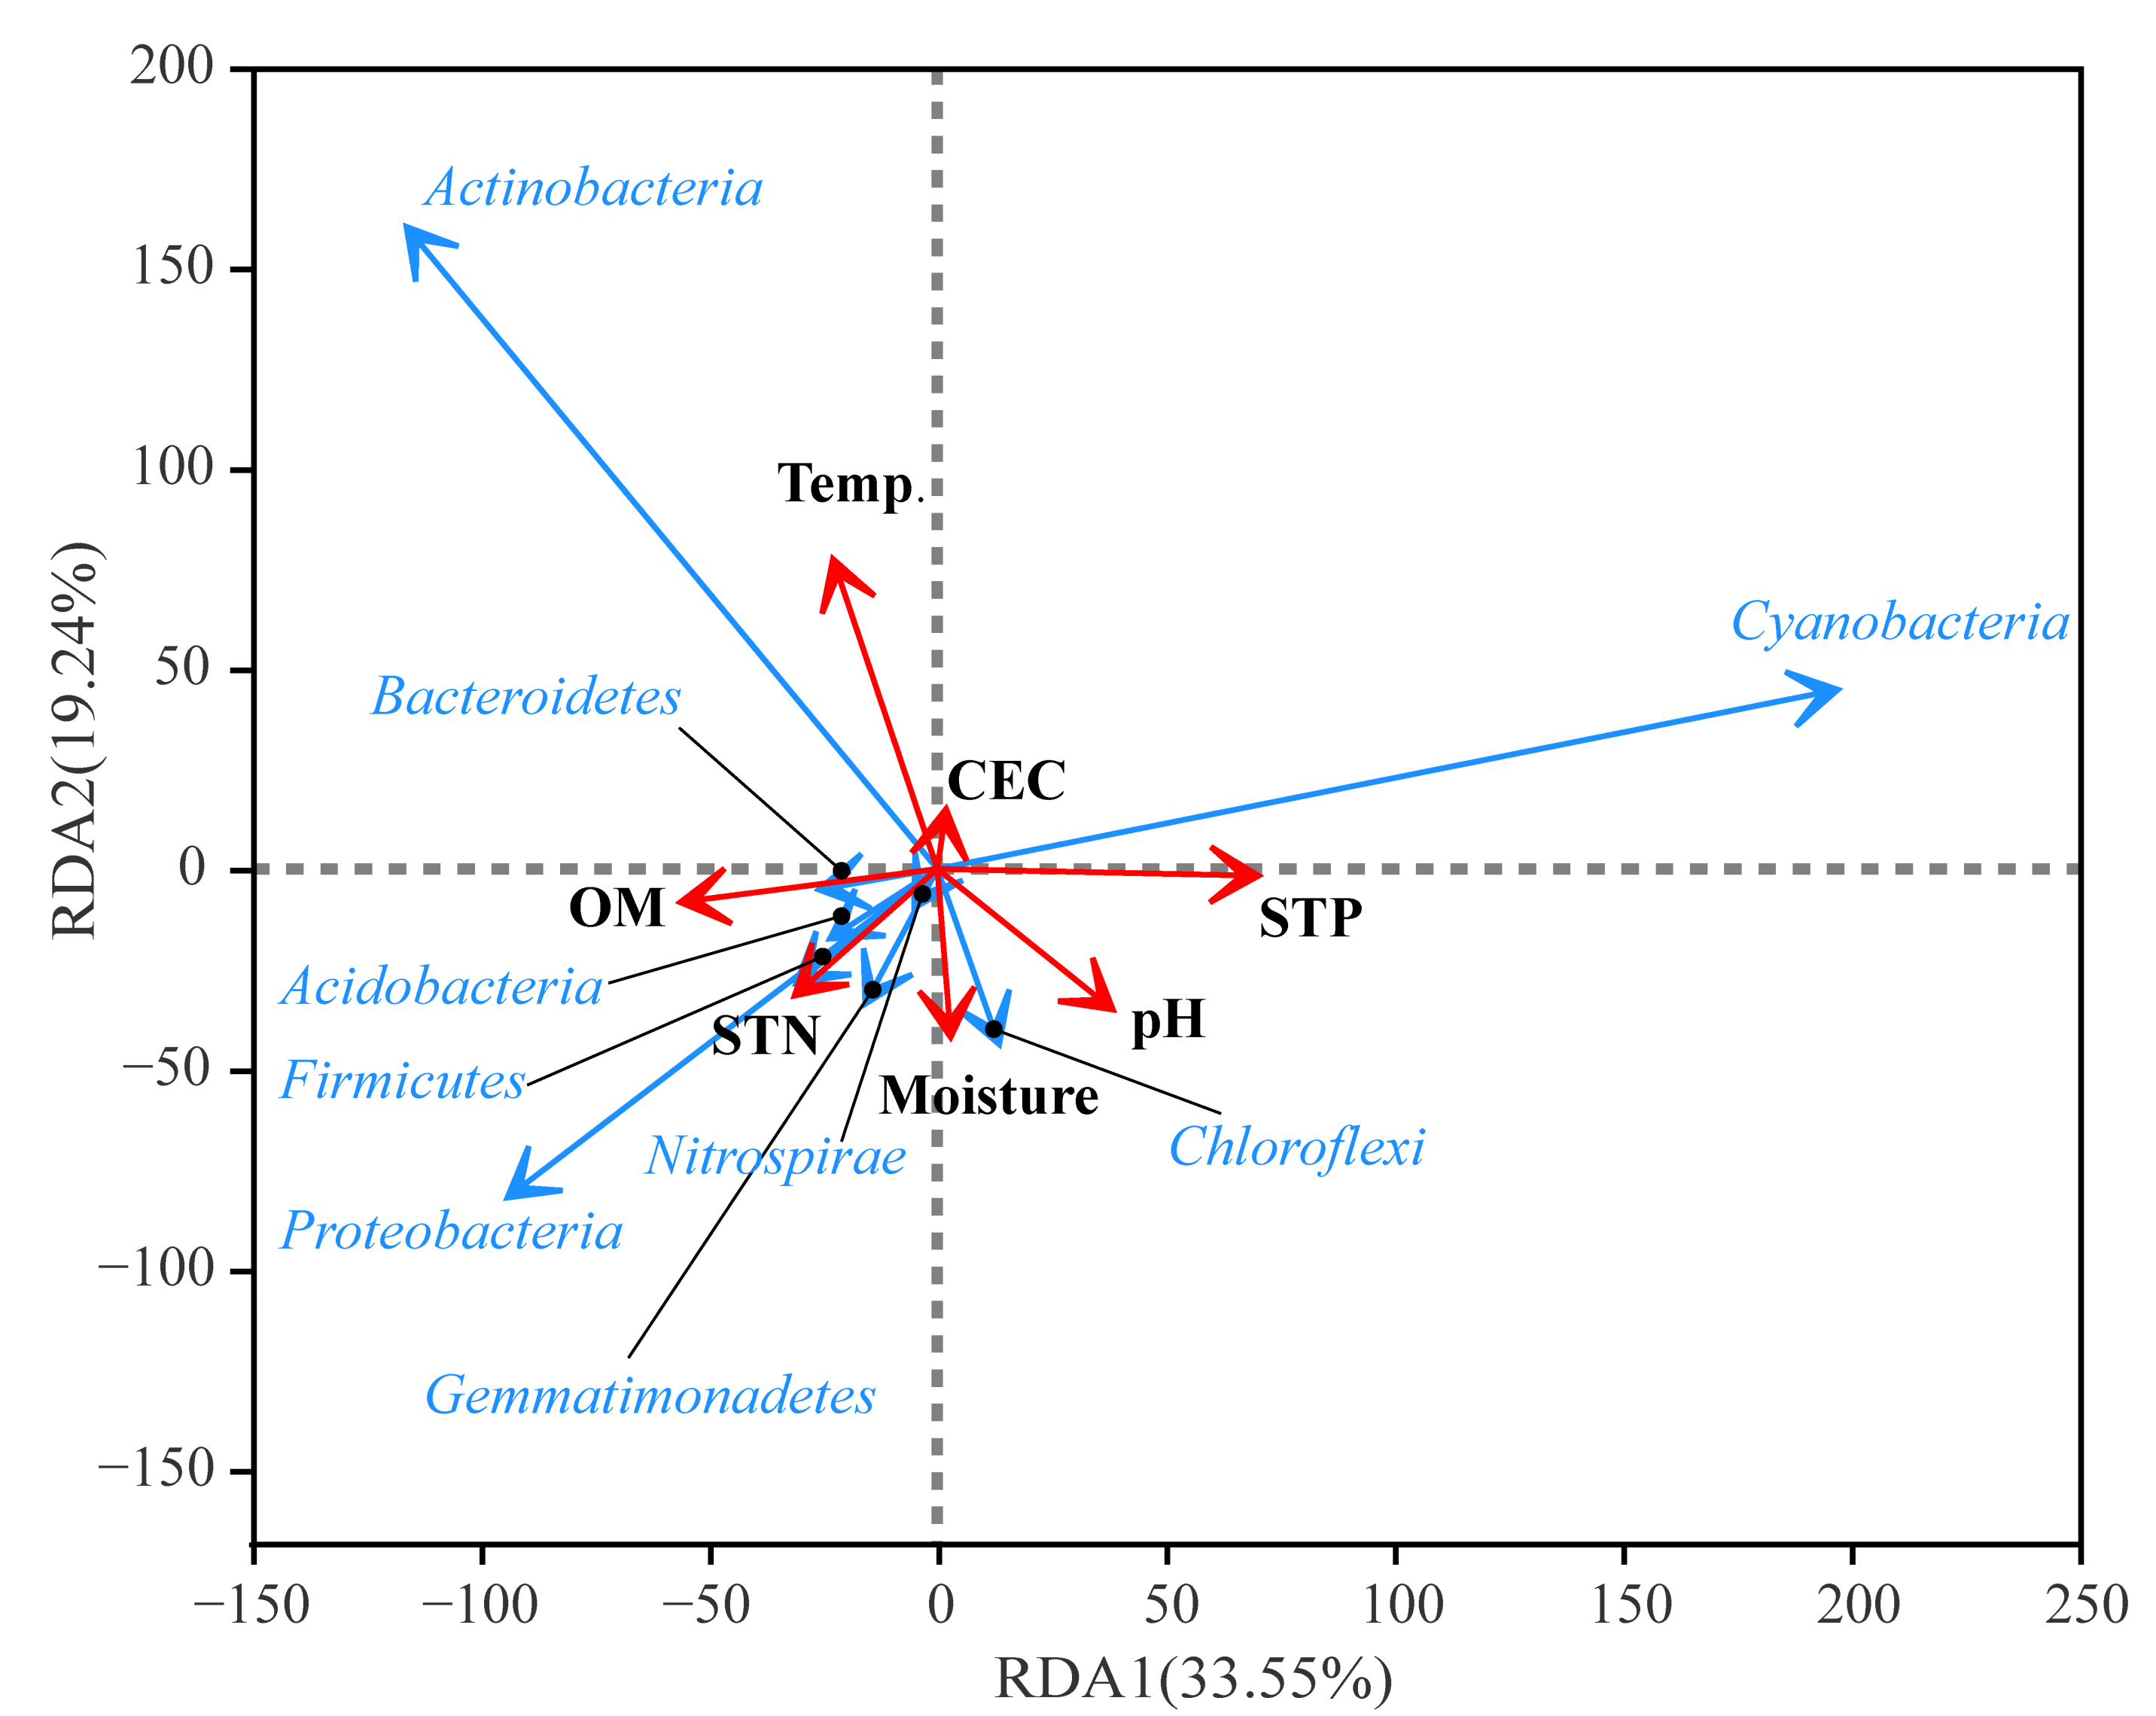
The relationship between environmental factors and the relative abundance of microbial communities was quantified, as shown in Figure 9. Microbial communities are illustrated by blue arrows, and red arrows represent environmental factors. The length of the environmental factor arrows reflects how much of the variation in the relative abundance of microbial communities can be explained by variation in environmental factors. The angle between the arrows represents positive and negative correlations, where an acute angle represents a positive correlation, an obtuse angle represents a negative correlation, and a right angle represents no correlation. The results indicated that the first axis explained 33.6% of the relationship, and the second axis explained 19.2%, amounting to around 53%, which can reliably reflect the relationship between environmental factors and microbial communities. The extent to which environmental factors explained the relative abundance of microbial communities in descending order was media temperature > STP > OM > pH > STN > moisture > CEC.
Media temperature was negatively correlated with Chloroflexi; i.e., the relative abundance of Chloroflexi increased with decreasing media temperature. The temperature was also negatively correlated with Gemmatimonadota, Proteobacteria, Firmicutes, and Nitrospirae, whereas positive correlations were found with Actinobacteria. As seen in Section 3.3, the difference in temperature between the MBF and CBF was relatively small in comparison with the difference between the vertical layers of the bioretention facilities. Hence, the variation in temperature mainly contributed to the differences in the relative abundance of microorganisms between layers. STP was positively correlated with Cyanobacteria, while it was negatively correlated with Bacteroidetes, Proteobacteria, Acidobacteria, and Firmicutes. OM was positively correlated with all microbial communities except Chloroflexi and Cyanobacteria. pH was negatively correlated with Actinobacteria and positively correlated with Chloroflexi and Gemmatimonadota. STN was positively correlated with Proteobacteria, Acidobacteria, Bacteroidetes, and Gemmatimonadota; i.e., the relative abundance of these microbial communities increased with STN. Media moisture was positively correlated with the relative abundance of Chloroflexi, Gemmatimonadota, Proteobacteria, Nitrospirae, Firmicutes, and Acidobacteria, which agrees with the findings of previous studies [39]. Nitrospira in the phylum Nitrospirae can facilitate the nitrification reaction [52]. The minimal extent of explanation of the CEC may be related to its decreased variation in the study area.

3.7. Preliminary Analysis of Stormwater Purification Mechanisms

The media configuration and internal microenvironment of bioretention facilities are key factors affecting the effectiveness of runoff pollution control [53]. The difference between the two types of bioretention facilities was the arrangement of the soil filter media layer with soil moisture conservation ropes in the MBF. The RDA indicated that the relative abundance of Chloroflexi, Proteobacteria, Nitrospirae, Firmicutes, and Acidobacteria, which participate in the denitrification process, could be increased with the media moisture. This suggested that the MBF facilitated the increase in the relative abundance of nitrogen removal microbial communities, promoting the removal of nitrogen from stormwater runoff. Moreover, from the Venn diagram, it can be seen that the MBF had a greater abundance of OTUs. The aggregated results indicated that the MBF had a larger number of microbial communities involved in nitrogen removal. Comparing the collected water in the storage tanks of the bioretention facilities and the results from the challenge tests, the MBF had better removal efficiency for TN and NO3-N than the CBF. The poor efficiency of NH3-N removal of the MBF was correlated with the larger moisture content of the filter media.
In addition, the RDA also reflected the relationship between microbial communities. For example, Proteobacteria and Firmicutes were positively correlated since the arrow angle between them is close to 0°, which is in line with the literature [54]. That is, these bacterial communities can coexist in bioretention facilities and hence promote the process of microbial nitrogen fixation, nitrification, and denitrification. In contrast, the RDA indicated that the increase in media moisture could reduce the relative abundance of Actinobacteria, a microbial community widely observed in simultaneous nitrogen and phosphorus removal systems. That is, to some extent, the increase in the media moisture resulted in higher CODCr and TP in the effluent of the MBF in comparison with that of the CBF.

4. Conclusions

The proposed bioretention facilities in this study contribute to the control of road stormwater runoff pollution and have the potential to realize the utilization of rainwater resources in the process of developing an eco-city. A field study on the basis of preliminary laboratory tests was implemented in Tianjin Eco-city, and the performance of the bioretention facilities with respect to stormwater runoff purification and variation characteristics of the media physicochemical properties and microbial diversity were evaluated. The significant wet-dry variation and temperature changes in north China affected the internal microenvironment of bioretention facilities. With the implementation of soil moisture conservation ropes in the MBF, the media moisture could remain at a higher level (2–3% higher than the bottom layer of the CBF), and the media temperature could be maintained (0.5–1.0 °C higher than the CBF in winter) and recovered immediately during dry-cold periods. Such a soil microenvironment with relatively high moisture content and small temperature variations created by the MBF is conducive to the viability of the soil microbial communities. This resulted in greater abundance (5253 OTUs) of microbial communities and more unique OTUs (447) in the MBF, as well as a greater relative abundance of Proteobacteria (25.2%) that are involved in microbial nitrogen transformation processes. This also indicated that the MBF had a larger number of Proteobacteria and other coexisting nitrogen removal microorganisms and were thus more efficient in nitrogen removal.
The combined soil filter media of on-site bioretention facilities are characterized by the localization of media and the recycling of solid wastes. In addition, the design of soil moisture conservation ropes helps to reduce the maintenance costs of bioretention facilities in dry-cold regions. These characteristics are conducive to providing favorable economic benefits and, at the same time, facilitate the application of facilities in other urban regions. Future research will concentrate on improving the synergistic treatment of runoff pollutants, e.g., by planting robust plants and extending the hydraulic retention time of runoff. Long-term monitoring is also needed to better evaluate and optimize the effectiveness of bioretention facilities for sponge city construction.

Supplementary Materials

Supplementary materials to this article can be found in the file “Supplementary Material”. The following are available online at https://www.mdpi.com/article/10.3390/w14030415/s1. Table S1: The standard methods and main instruments used for water quality testing; Table S2: The standard methods and main instruments used for media chemical property testing.

Author Contributions

Conceptualization, Q.L., H.J., and J.H.; formal analysis, Q.L., H.G. (Hongkai Guo), F.Y.L., and T.H.N.; investigation, G.Z., H.G. (Huiling Guo), and S.L.O.; methodology, Q.L., H.G. (Hongkai Guo), and Y.Z.; project administration, H.J. and J.H.; supervision, H.J. and J.H.; writing—original draft, Q.L., Y.Z., and J.H.; writing—review and editing, H.J. and J.H. All authors have read and agreed to the published version of the manuscript.

Funding

This work was supported by the National Nature Science Foundation of China (Grant No. 52070112 and No. 41890823). This work was funded by the Ministry of National Development, Singapore.

Institutional Review Board Statement

Not applicable.

Informed Consent Statement

Not applicable.

Data Availability Statement

The data presented in this study is available on request from the corresponding author.

Conflicts of Interest

The authors declare no conflict of interest.

References

  1. Jacobson, C. Identification and quantification of the hydrological impacts of imperviousness in urban catchments: A review. J. Environ. Manag. 2011, 92, 1438–1448. [Google Scholar] [CrossRef] [PubMed]
  2. SEPA. Environmental Quality Standards for Surface Water (GB3838-2002); State Environmental Protection Administration of the People’s Republic of China: Beijing, China, 2002. (In Chinese) [Google Scholar]
  3. SEPA. Discharge Standard of Pollutants for Municipal Wastewater Treatment Plant (GB18918-2002); State Environmental Protec-tion Administration of the People’s Republic of China: Beijing, China, 2002. (In Chinese) [Google Scholar]
  4. Zhang, N.; Zhao, L.; Li, T.; Jin, Z. Characteristics of pollution and monitoring of water quality in Tianjin. Ecol. Environ. Sci. 2009, 19, 2127–2131. (In Chinese) [Google Scholar]
  5. Han, Y.; Lau, S.L.; Kayhanian, M.; Stenstrom, M.K. Characteristics of highway stormwater runoff. Water Environ. Res. 2006, 78, 2377–2388. [Google Scholar] [CrossRef] [PubMed]
  6. Tanaka, Y.; Matsuda, T.; Shimizu, Y.; Matsui, S.; Lee, B.C. A new installation for treatment of road runoff: Up-flow filtration by porous polypropylene media. Water Sci. Technol. 2005, 52, 225–232. [Google Scholar] [CrossRef]
  7. Gnecco, I.; Berretta, C.; Lanza, L.G.; La Barbera, P. Storm water pollution in the urban environment of Genoa, Italy. Atmos. Res. 2005, 77, 60–73. [Google Scholar] [CrossRef]
  8. Helmreich, B.; Hilliges, R.; Schriewer, A.; Horn, H. Runoff pollutants of a highly trafficked urban road--correlation analysis and seasonal influences. Chemosphere 2010, 80, 991–997. [Google Scholar] [CrossRef]
  9. Xie, J.; Hu, Z.; Xu, T.; Han, H.; Yin, D. Water quality characteristics of rainfall runoff in Hefei City. China Environ. Sci. 2012, 32, 1018–1025. (In Chinese) [Google Scholar]
  10. Wang, S.; He, Q.; Ai, H.; Wang, Z.; Zhang, Q. Pollutant concentrations and pollution loads in stormwater runoff from different land uses in Chongqing. J. Environ. Sci. 2013, 25, 502–510. [Google Scholar] [CrossRef]
  11. Davis, A. Green Engineering Principles Promote Low-impact Development. Environ. Sci. Technol. 2005, 39, 338A–344A. [Google Scholar] [CrossRef] [Green Version]
  12. Jia, H.; Yao, H.; Tang, Y.; Yu, S.L.; Field, R. LID-BMPs planning for urban runoff control and the case study in China. J. Environ. Manag. 2015, 149, 65–76. [Google Scholar] [CrossRef]
  13. Jia, H.; Wang, Z.; Zhen, X.; Clar, M.; Yu, S.L. China’ s sponge city construction: A discussion on technical approaches. Front. Environ. Sci. Eng. 2017, 11, 18. [Google Scholar] [CrossRef]
  14. Li, Q.; Wang, F.; Yu, Y.; Huang, Z.; Li, M.; Guan, Y. Comprehensive performance evaluation of LID practices for the sponge city construction: A case study in Guangxi, China. J. Environ. Manag. 2019, 231, 10–20. [Google Scholar] [CrossRef] [PubMed]
  15. Jia, H.; Yao, H.; Tang, Y.; Yu, S.L.; Zhen, J.X.; Lu, Y. Development of a multi-criteria index ranking system for urban runoff best management practices (BMPs) selection. Environ. Monit. Assess 2013, 185, 7915–7933. [Google Scholar] [CrossRef] [PubMed]
  16. Lopez-Ponnada, E.V.; Lynn, T.J.; Ergas, S.J.; Mihelcic, J.R. Long-term field performance of a conventional and modified bioretention system for removing dissolved nitrogen species in stormwater runoff. Water Res. 2020, 170, 115336. [Google Scholar] [CrossRef] [PubMed]
  17. Li, L.; Davis, A.P. Urban stormwater runoff nitrogen composition and fate in bioretention systems. Environ. Sci. Technol. 2014, 48, 3403–3410. [Google Scholar] [CrossRef] [PubMed]
  18. Palmer, E.T.; Poor, C.J.; Hinman, C.; Stark, J.D. Nitrate and phosphate removal through enhanced bioretention media: Mesocosm study. Water Environ. Res. 2013, 85, 823–832. [Google Scholar] [CrossRef] [PubMed]
  19. Xiong, J.; Ren, S.; He, Y.; Wang, X.C.; Bai, X.; Wang, J.; Dzakpasu, M. Bioretention cell incorporating Fe-biochar and saturated zones for enhanced stormwater runoff treatment. Chemosphere 2019, 237, 124424. [Google Scholar] [CrossRef]
  20. Singh, R.; Zhao, F.; Ji, Q.; Saravanan, J.; Fu, D. Design and Performance Characterization of Roadside Bioretention Systems. Sustainability 2019, 11, 2040. [Google Scholar] [CrossRef] [Green Version]
  21. Muerdter, C.; Özkök, E.; Li, L.; Davis, A.P. Vegetation and Media Characteristics of an Effective Bioretention Cell. J. Sustain. Water Built Environ. 2016, 2, 04015008. [Google Scholar] [CrossRef]
  22. Bratieres, K.; Fletcher, T.D.; Deletic, A.; Zinger, Y. Nutrient and sediment removal by stormwater biofilters: A large-scale design optimisation study. Water Res. 2008, 42, 3930–3940. [Google Scholar] [CrossRef]
  23. Wu, J.; Cao, X.; Zhao, J.; Dai, Y.; Cui, N.; Li, Z.; Cheng, S. Performance of biofilter with a saturated zone for urban stormwater runoff pollution control: Influence of vegetation type and saturation time. Ecol. Eng. 2017, 105, 355–361. [Google Scholar] [CrossRef]
  24. Ashoori, N.; Teixido, M.; Spahr, S.; LeFevre, G.H.; Sedlak, D.L.; Luthy, R.G. Evaluation of pilot-scale biochar-amended woodchip bioreactors to remove nitrate, metals, and trace organic contaminants from urban stormwater runoff. Water Res. 2019, 154, 1–11. [Google Scholar] [CrossRef] [PubMed]
  25. O’Neill, S.W.; Davis, A.P. Water Treatment Residual as a Bioretention Amendment for Phosphorus. II: Long-Term Column Studies. J. Environ. Eng. 2012, 138, 328–336. [Google Scholar] [CrossRef]
  26. Glaister, B.J.; Fletcher, T.D.; Cook, P.L.; Hatt, B.E. Co-optimisation of phosphorus and nitrogen removal in stormwater biofil-ters: The role of filter media, vegetation and saturated zone. Water Sci. Technol. 2014, 69, 1961–1969. [Google Scholar] [CrossRef]
  27. Turk, R.P.; Kraus, H.T.; Hunt, W.F.; Carmen, N.B.; Bilderback, T.E. Nutrient Sequestration by Vegetation in Bioretention Cells Receiving High Nutrient Loads. J. Environ. Eng. 2017, 143, 06016009. [Google Scholar] [CrossRef]
  28. Liu, J.; Sample, D.J.; Owen, J.S.; Li, J.; Evanylo, G. Assessment of selected bioretention blends for nutrient retention using mesocosm experiments. J. Environ. Qual. 2014, 43, 1754–1763. [Google Scholar] [CrossRef]
  29. Lim, F.Y.; Neo, T.H.; Guo, H.; Goh, S.Z.; Ong, S.L.; Hu, J.; Lee, B.C.Y.; Ong, G.S.; Liou, C.X. Pilot and Field Studies of Modular Bioretention Tree System with Talipariti tiliaceum and Engineered Soil Filter Media in the Tropics. Water 2021, 13, 817. [Google Scholar] [CrossRef]
  30. Zhao, Y.; Li, Q.; Chen, Z.; Zhou, G.; Jia, H. Optimization of bioretention facility media for municipal road runoff pollution control based on multi-objective evaluation. Water Resour. Prot. 2021, 37, 96–101. (In Chinese) [Google Scholar]
  31. Xu, D.; Lee, L.Y.; Lim, F.Y.; Lyu, Z.; Zhu, H.; Ong, S.L.; Hu, J. Water treatment residual: A critical review of its applications on pollutant removal from stormwater runoff and future perspectives. J. Environ. Manag. 2020, 259, 109649. [Google Scholar] [CrossRef]
  32. Guo, H.; Zhou, G.; Zhao, Y.; Zhan, J.; Li, Q.; Jia, H. Experimental study on soil moisture conservation and nitrogen removal of the modified bioretention facility. Water Wastewater Eng. 2021, 47, 66–71. (In Chinese) [Google Scholar]
  33. Goh, H.W.; Lem, K.S.; Azizan, N.A.; Chang, C.K.; Talei, A.; Leow, C.S.; Zakaria, N.A. A review of bioretention components and nutrient removal under different climates-future directions for tropics. Environ. Sci. Pollut. Res. 2019, 26, 14904–14919. [Google Scholar] [CrossRef] [PubMed]
  34. MOHURD. Engineering Technical Code for Rain Utilization in Building and Sub-District (GB50400-2016); Ministry of Housing and Urban-Rural Development of the People’s Republic of China: Beijing, China, 2016. (In Chinese)
  35. SAMR. Reuse of Urban Recycling Water-Water Quality Standard for Urban Miscellaneous Use (GB/T 18920-2020); State Administration for Market Regulation of the People’s Republic of China: Beijing, China, 2020. (In Chinese) [Google Scholar]
  36. Sungji, K.; Jiwon, L.; Kyungik, G. Inflow and outflow event mean concentration analysis of contaminants in bioretention facilities for non-point pollution management. Ecol. Eng. 2020, 147, 105757. [Google Scholar] [CrossRef]
  37. Cao, Q.; Song, X.; Wu, H.; Gao, L.; Liu, F.; Yang, S.; Zhang, G. Mapping the response of volumetric soil water content to an intense rainfall event at the field scale using GPR. J. Hydrol. 2020, 583, 124605. [Google Scholar] [CrossRef]
  38. Zuo, X.; Guo, Z.; Wu, X.; Yu, J. Diversity and metabolism effects of microorganisms in bioretention systems with sand, soil and fly ash. Sci. Total Environ. 2019, 676, 447–454. [Google Scholar] [CrossRef] [PubMed]
  39. Yu, W.; Lawrence, N.C.; Sooksa-nguan, T.; Smith, S.D.; Tenesaca, C.; Howe, A.C.; Hall, S.J. Microbial linkages to soil biogeochemical processes in a poorly drained agricultural ecosystem. Soil Biol. Biochem. 2021, 156, 108228. [Google Scholar] [CrossRef]
  40. Li, Y.; Yang, Y.; Zhang, J.; Zhang, Z.; Li, J. Experimental Study on the Effect of the Physicochemical Properties of Contaminated Fillers in Bioretention System on Microbial Community Structure. Water Air Soil Pollut. 2021, 232, 1–16. [Google Scholar] [CrossRef]
  41. Collins, K.A.; Lawrence, T.J.; Stander, E.K.; Jontos, R.J.; Kaushal, S.S.; Newcomer, T.A.; Grimm, N.B.; Cole Ekberg, M.L. Opportunities and challenges for managing nitrogen in urban stormwater: A review and synthesis. Ecol. Eng. 2010, 36, 1507–1519. [Google Scholar] [CrossRef]
  42. Davis, A.P.; Hunt, W.F.; Traver, R.G.; Clar, M. Bioretention Technology: Overview of Current Practice and Future Needs. J. Environ. Eng. 2009, 135, 109–117. [Google Scholar] [CrossRef]
  43. Hunt, W.F.; Smith, J.T.; Jadlocki, S.J.; Hathaway, J.M.; Eubanks, P.R. Pollutant removal and peak flow mitigation by a bioretention cell in urban Charlotte, NC. J. Environ. Eng. -Asce 2008, 134, 403–408. [Google Scholar] [CrossRef]
  44. Qiu, F.; Zhao, S.; Zhao, D.; Wang, J.; Fu, K. Enhanced nutrient removal in bioretention systems modified with water treatment residuals and internal water storage zone. Environ. Sci. Water Res. Technol. 2019, 5, 993–1003. [Google Scholar] [CrossRef]
  45. Wagner, M.; Loy, A. Bacterial community composition and function in sewage treatment systems. Curr. Opin. Biotechnol. 2002, 13, 218–227. [Google Scholar] [CrossRef]
  46. Xing, W.; Li, D.; Li, J.; Hu, Q.; Deng, S. Nitrate removal and microbial analysis by combined micro-electrolysis and autotrophic denitrification. Bioresour. Technol. 2016, 211, 240–247. [Google Scholar] [CrossRef] [PubMed]
  47. Kragelund, C.; Levantesi, C.; Borger, A.; Thelen, K.; Eikelboom, D.; Tandoi, V.; Kong, Y.; van der Waarde, J.; Krooneman, J.; Rossetti, S.; et al. Identity, abundance and ecophysiology of filamentous Chloroflexi species present in activated sludge treatment plants. FEMS Microbiol. Ecol. 2007, 59, 671–682. [Google Scholar] [CrossRef] [PubMed] [Green Version]
  48. Waller, L.J.; Evanylo, G.K.; Krometis, L.H.; Strickland, M.S.; Wynn-Thompson, T.; Badgley, B.D. Engineered and Environmental Controls of Microbial Denitrification in Established Bioretention Cells. Environ. Sci. Technol. 2018, 52, 5358–5366. [Google Scholar] [CrossRef] [PubMed]
  49. Li, M.; Wei, D.; Zhang, Z.; Fan, D.; Du, B.; Zeng, H.; Li, D.; Zhang, J. Enhancing 2,6-dichlorophenol degradation and nitrate removal in the nano-zero-valent iron (nZVI) solid-phase denitrification system. Chemosphere 2021, 287, 132249. [Google Scholar] [CrossRef] [PubMed]
  50. Wang, H.; He, Q.; Chen, D.; Wei, L.; Zou, Z.; Zhou, J.; Yang, K.; Zhang, H. Microbial community in a hydrogenotrophic denitrification reactor based on pyrosequencing. Appl. Microbiol. Biotechnol. 2015, 99, 10829–10837. [Google Scholar] [CrossRef] [PubMed]
  51. Hong, J.; Geronimo, F.K.; Choi, H.; Kim, L.H. Impacts of nonpoint source pollutants on microbial community in rain gardens. Chemosphere 2018, 209, 20–27. [Google Scholar] [CrossRef]
  52. Daims, H.; Lebedeva, E.V.; Pjevac, P.; Han, P.; Herbold, C.; Albertsen, M.; Jehmlich, N.; Palatinszky, M.; Vierheilig, J.; Bulaev, A.; et al. Complete nitrification by Nitrospira bacteria. Nature 2015, 528, 504–509. [Google Scholar] [CrossRef]
  53. You, Z.; Zhang, L.; Pan, S.Y.; Chiang, P.C.; Pei, S.; Zhang, S. Performance evaluation of modified bioretention systems with alkaline solid wastes for enhanced nutrient removal from stormwater runoff. Water Res. 2019, 161, 61–73. [Google Scholar] [CrossRef]
  54. Zhao, X.; Huang, J.; Lu, J.; Sun, Y. Study on the influence of soil microbial community on the long-term heavy metal pollution of different land use types and depth layers in mine. Ecotoxicol. Environ. Saf. 2019, 170, 218–226. [Google Scholar] [CrossRef]
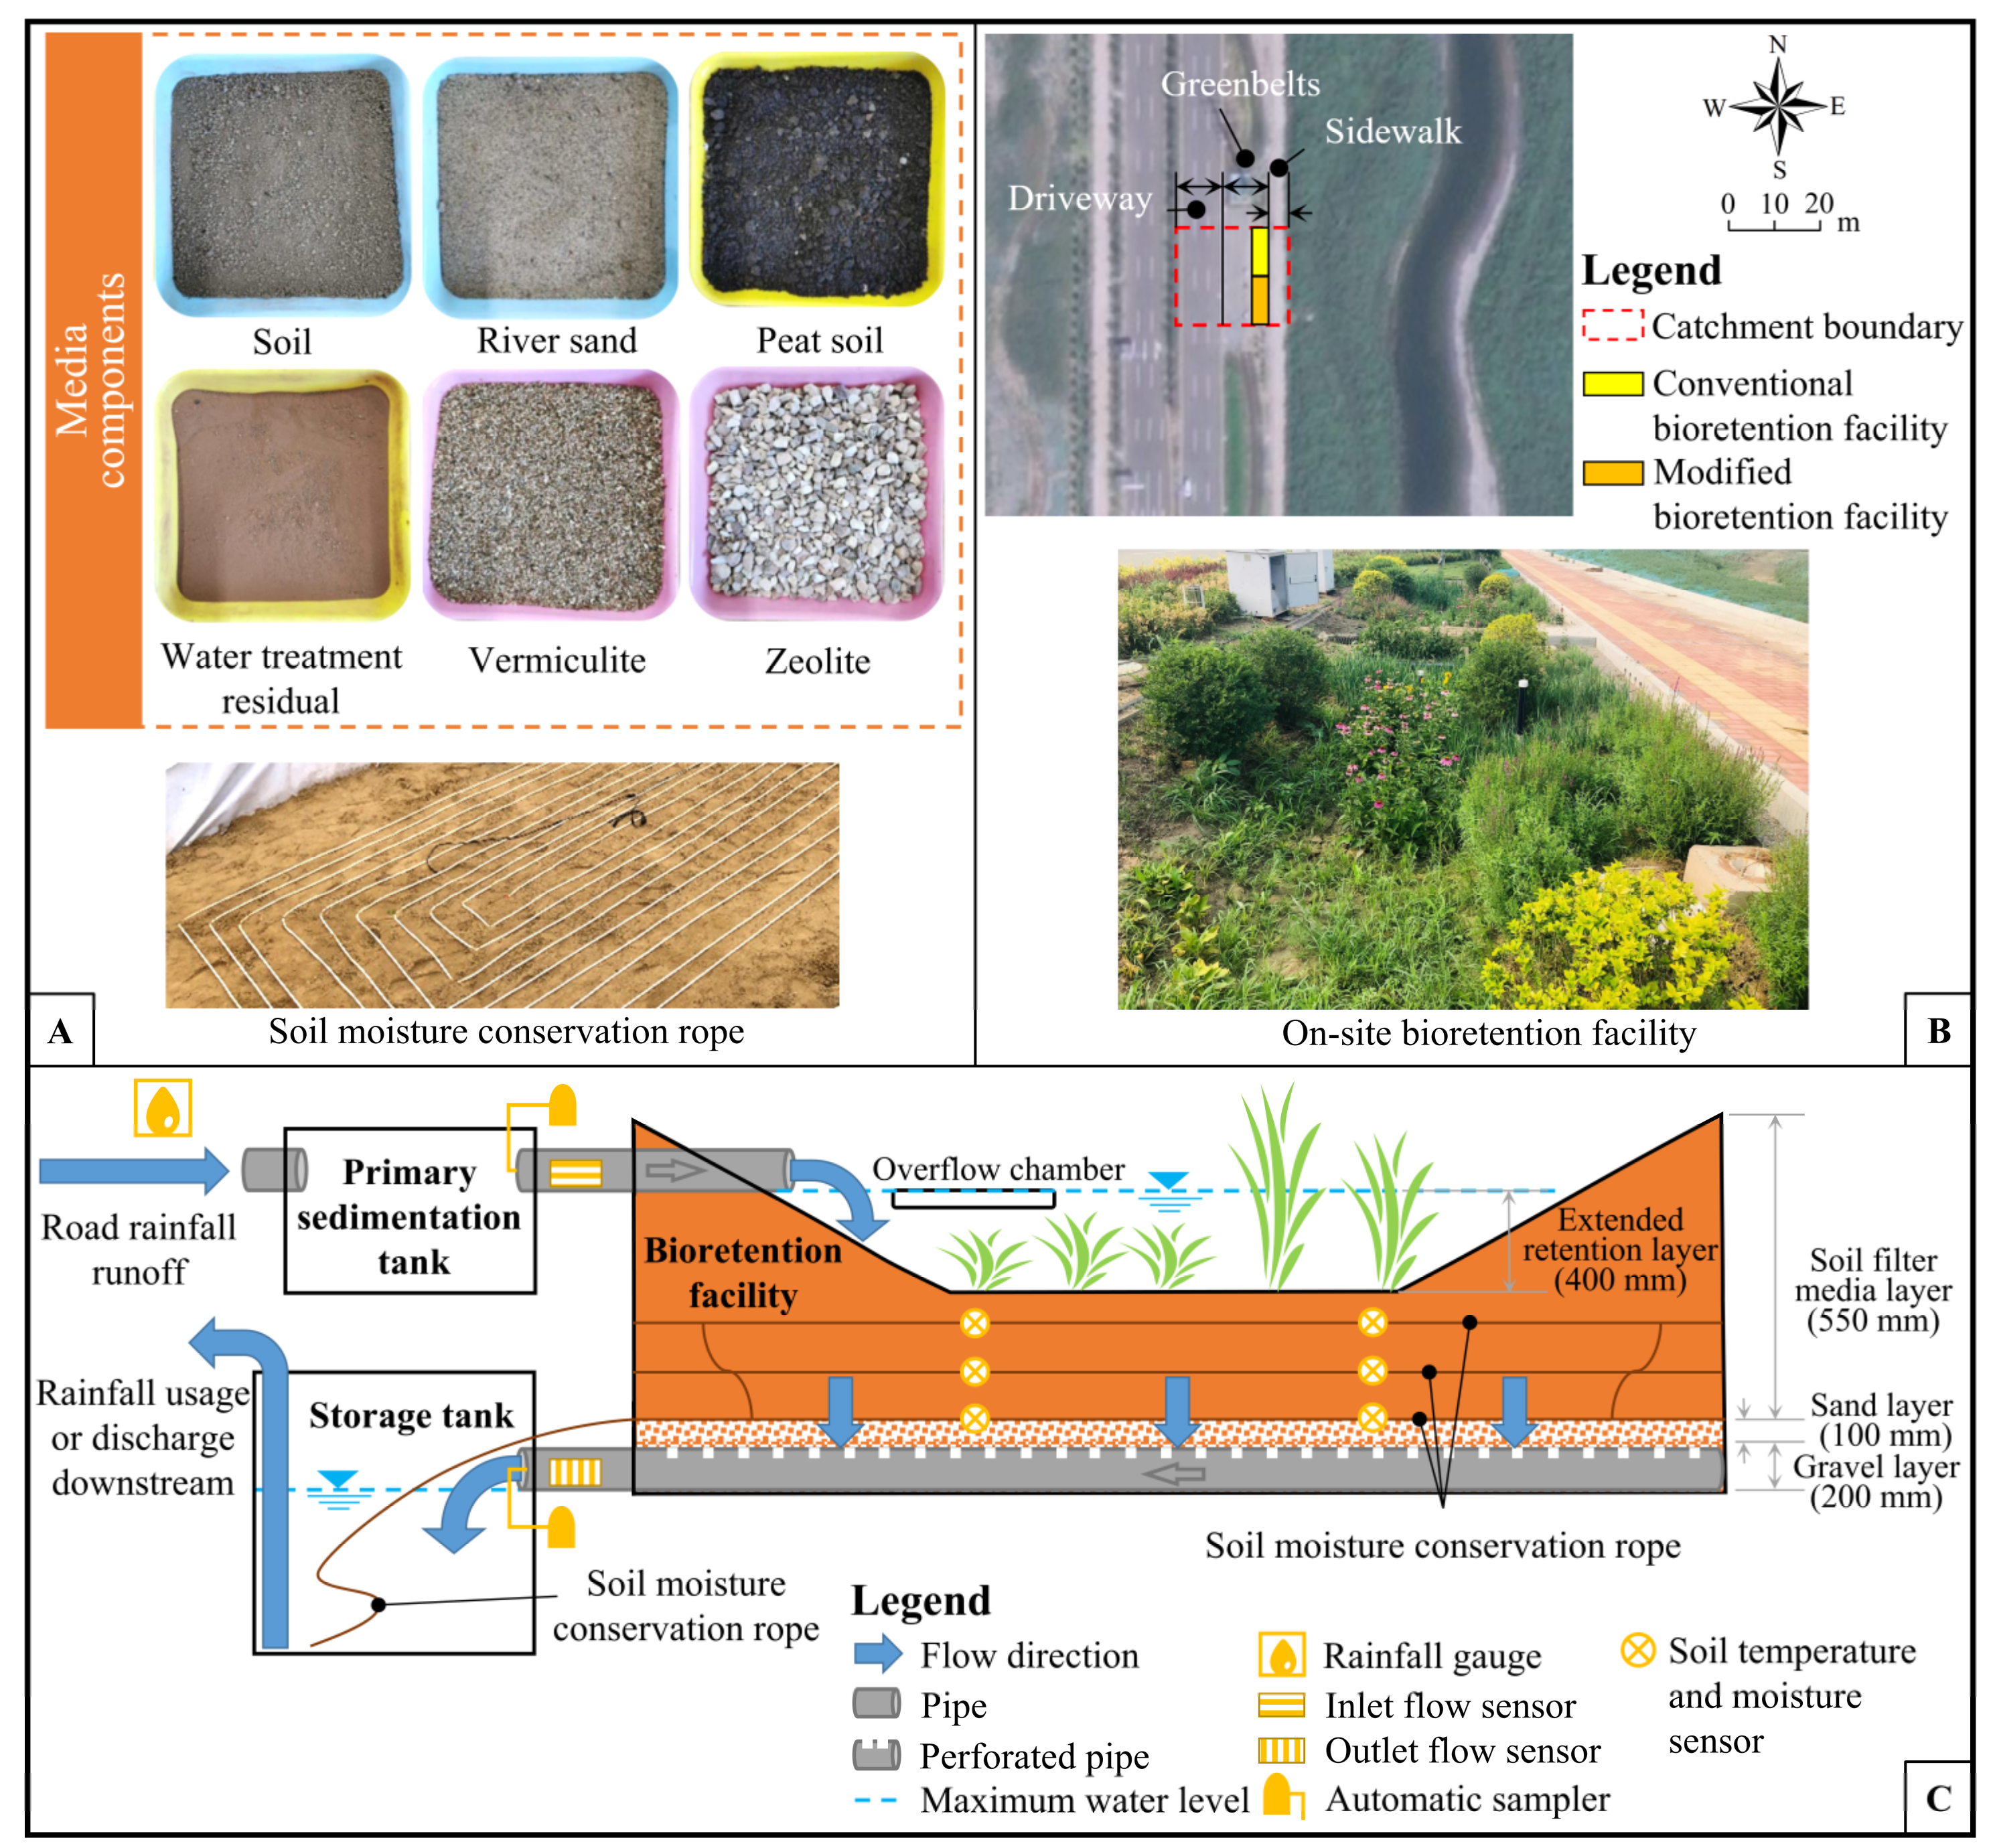
Figure 1. Composition of the combined soil filter media and soil moisture conservation ropes in the field (A), constructed bioretention facilities and catchment areas (B), and schematic diagram of bioretention facilities and stormwater runoff treatment process (C).
Water 14 00415 g001
Figure 2. Schematic location and serial number of sampling and monitoring sites.
Water 14 00415 g002
Figure 3. Rainfall and influent flow hydrographs (a) and change patterns of inflow water quality (bg) (dashed lines are classification thresholds for relevant water quality standards).
Water 14 00415 g003
Figure 4. Temporal change patterns of media moisture and temperature of the modified bioretention facility (a) and the conventional bioretention facility (b), comparison of temperature in winter between facilities (c), and variation in media moisture content with precipitation of the facilities (d) (the letter M represents media moisture and the letter T represents media temperature).
Water 14 00415 g004
Figure 5. Change patterns of media chemical properties: (a) pH, (b) TSC (total salt content), (c) CEC (cation-exchange capacity), (d) OM (organic matter), (e) STN (soil total nitrogen), and (f) STP (soil total phosphorus) (the dotted line represents the value of the control group and the letter T represents the sampling time).
Water 14 00415 g005
Figure 6. Dilution curves of each sample based on Sobs index at the OTU level.
Water 14 00415 g006
Figure 7. Venn diagram of OTUs for the modified bioretention facility (MBF), the conventional bioretention facility (CBF) and control group (a), and Venn diagram of OTUs for the upper layer (UMBF, UCBF), middle layer (MMBF, MCBF), and bottom layer (BMBF, BCBF) of the MBF and the CBF, respectively (b–d).
Water 14 00415 g007
Figure 8. Histogram of the composition and relative abundance of dominant microbial communities in the bioretention facilities and control group at the phylum level (A) and the summary statement (B).
Water 14 00415 g008
Figure 9. Redundancy analysis of environmental factors and microbial community at the phylum level.
Water 14 00415 g009
Table 2. Areas of different land covers in the study area.
ItemArea (m2)
Bioretention facility110
Driveway456
Sidewalk190
Greenbelts346
Total1102
Table 3. Physical properties of the bioretention soil filter media.
Media TypeParticle Size (mm)Dry Density (kg/m3)Porosity (%)
Natural soil<0.51.1552.2
River sand0.06–0.51.2039.5
Peat soil1–50.6154.6
Vermiculite0.5–10.3365.5
Zeolite5–100.9351.8
Water treatment residual<0.010.6525.5
Table 4. Target influent pollutant concentration in challenge test.
Water Quality ParameterTargeted Influent Pollutant Concentration
TSS150 mg/L
TP1 mg/L
TN6 mg/L
NH3-N2 mg/L
CODCr100 mg/L
Table 5. Water quality results of challenge test.
Water Quality ParameterInfluent (mg/L)Effluent EMC (mg/L)Removal Efficiency (%)
MBFCBFMBFCBF
TSS59522421262.4%64.4%
TN8.703.533.9159.4%55.1%
NH3-N2.310.680.5770.6%75.3%
NO3-N1.021.722.45−68.6%−140.2%
TP1.010.340.3066.3%70.3%
CODCr422928978.2%78.9%
Publisher’s Note: MDPI stays neutral with regard to jurisdictional claims in published maps and institutional affiliations.