Article

Sea Level Rise Impact on Compound Coastal River Flood Risk in Klaipėda City (Baltic Coast, Lithuania)

by
Erika Čepienė
1,2,*,
Lina Dailidytė
3,
Edvinas Stonevičius
4 and
Inga Dailidienė
1,5
1
Marine Research Institute, Klaipėda University, LT-92294 Klaipėda, Lithuania
2
Department of Business Adminsitration, Klaipėda State University of Applied Sciences, LT-91274 Klaipėda, Lithuania
3
Hnit Baltic, LT-03127 Vilnius, Lithuania
4
Institute of Geoscience, Vilnius University, LT-03101 Vilnius, Lithuania
5
Health Research and Innovation Science Center, Klaipėda University, LT-92294 Klaipėda, Lithuania
*
Author to whom correspondence should be addressed.
Water 2022, 14(3), 414; https://doi.org/10.3390/w14030414
Submission received: 9 December 2021 / Revised: 15 January 2022 / Accepted: 26 January 2022 / Published: 29 January 2022
(This article belongs to the Topic Natural Hazards and Disaster Risks Reduction)

Abstract

:
Due to climate change, extreme floods are projected to increase in the 21st century in Europe. As a result, flood risk and flood-related losses might increase. It is therefore essential to simulate potential floods not only relying on historical but also future projecting data. Such simulations can provide necessary information for the development of flood protection measures and spatial planning. This paper analyzes the risk of compound flooding in the Danė River under different river discharge and Klaipėda Strait water level probabilities. Additionally, we examine how a water level rise of 1 m in the Klaipėda Strait could impact Danė River floods in Klaipėda city. Flood extent was estimated with the Hydrologic Engineering Center’s River Analysis System (HEC-RAS) and visualized with ArcGIS Pro. Research results show that a rise in the water level in the Klaipėda Strait has a greater impact on the central part of Klaipėda city, while that of the maximum discharge rates of the river affected the northern upstream part of the analyzed river section. A sea level rise of 1 m could lead to an increase in areas affected by Danė floods by up to three times. Floods can cause significant damage to the infrastructure of Klaipėda port city, urbanized territories in the city center, and residential areas in the northern part of the city. Our results confirm that, in the long run, sea level rise will significantly impact the urban areas of the Klaipėda city situated near the Baltic Sea coast.

1. Introduction

Flood hazards and accurate economic risk assessments for the 21st century should not be limited to past floods or monitoring. To develop an accurate future flood risk assessment, it is necessary to assess all factors related to flood hazards in the context of climate change. The vulnerability of coastal river reaches is growing due to the increasing number of extreme hydrometeorological events caused by climate change [1,2,3,4,5]. Thus, the assessment of compound flooding with respect to climate change scenarios in coastal river reaches has become more relevant.
Scientists are increasing their focus on different types of floods and their causes in specific areas. The collision of physical oceanographic, hydrological, and meteorological factors can cause compound floods [5]. Compound floods are one example of a combination of compound weather and climate events caused by many climatic factors or hazards [6]. It is important to determine the influence of different components on the hydrometeorological event. Lack of consideration for all factors that can contribute to the occurrence of compound flooding may result in hazards being underestimated [7]. A compound flood can occur when two hydrometeorological events take place at the same time or with offset times but maintaining joint probability. In coastal river reaches, compound flooding occurs when high river discharge coincides with the sea level of a storm surge. During this combination, either the river flow becomes blocked or a back wave is formed; in both cases, in the lower reaches, water level rises and increases the risk of a flood [3,4]. Individual components can be non-extreme, but their general interdependency can cause extreme situations [8]. In order to determine the anthropogenic effects on different characteristics on compound floods, these flood types require a systematic approach [6,9]. Compound floods are common in coastal areas, but it is difficult to analyze them on a large scale; therefore, it is recommended to analyze such type of floods on a local scale [10], because topography elements and flood protection factors must be included in the analysis [11]. At the regional scale, smaller rivers are insignificant, but such rivers can cause a considerable risk at the local scale. All studies at the regional European scale cover data only from major river stations and are included in a database [12] that contains data on historical floods in Europe since 1870. Akmena–Danė River floods are significant for Klaipėda city and local people, and they are expected to increase both in size and frequency by the end of the 21st century.
Due to rising mean temperature in winter and decreasing snow cover in the major river basins of the Baltic countries, the flow is predicted to decline [13,14]. However, smaller local rivers are usually affected by a large amount of precipitation. Therefore, such results of studies show the necessity of research on smaller local rivers. The probability of compound flooding from precipitation and storm surges in the Baltic Sea is projected to increase [11]. Increases in flood events in Baltic countries was also confirmed by flood change analyses at the regional European scale based on global warming scenarios if global temperature rise by 1.5, 2, and 3 °C [15]. It was concluded that hydrological changes are affected by the level of warming, but that there are still uncertainties about the magnitude and location of the changes [16]. These uncertainties lead to inconsistencies in flood risk forecasts; therefore, in order to reduce flood risk, it is recommended to focus on mapping current and future risks and vulnerable hotspots and to improve them [17].
The hydrological regime of Lithuanian rivers is mainly changed by winters that are becoming warmer, shorter, and less snowy; thus, winter flow increases, while in spring, summer, and autumn, flow trends in rivers have been declining significantly over the past 50 years [18]. The hydrological regime is also affected by heavy rainfall (more than 30 mm per day), and in western Lithuania, the main source of river water is precipitation [19]. The number of heavy rainfalls, with more than 20 and 30 mm of rain per day, is projected to increase in the 21st century according the CCLM (COSMO—climate limited-area model) [20]. Flash floods of small Lithuanian rivers are affected by extreme meteorological phenomena such as dangerous heavy rain falls (rainfall 50–80 mm in 12 h or less) or catastrophic rainfall (more than 80 mm in 12 h or less) [21]. They are most common in Lithuania due to the sliding and undulating cold fronts or strong convection inside the air mass [22]. The average precipitation until 2035 may increase by 1.6–4.0% annually, while the highest amounts are predicted in western Lithuania [23]. The main changes in annual precipitation and evaporation will occur in the following period, with an increase in evaporation of 41.1% and an increase in precipitation of 15.1% [24]. Spring floods are expected to decrease in the future, but rain-induced floods will be more frequent [25]. Extremely heavy rains were the cause of devastating floods in the summer of 2010 in Central and Eastern Europe [26] and in Western Europe in the summer of 2021 [27].
In cities that are vulnerable to sea level rise, the flood hazard assessment should not consist of a single river or sea flood hazard assessment but should include both [28]. Long-term changes in sea level are caused by climate change, changes in water temperature, melting of glaciers, tectonic movements of the Earth, changes in ocean circulation, accumulation of sediments, and other factors [29,30,31]. Due to the rising air and water temperatures, the number of days with ice cover on the Baltic Sea coast decreases, which means that with different synoptic barrier structures and stronger winds, water can rise freely on the seacoast. Perennial changes in wind direction affect the fluctuations in the Baltic Sea water level [32]. Increased perennial southwesterly winds and stronger westerly winds lead to higher water levels on the southeast coast of the Baltic Sea [25,33,34]. Short-term sudden rises in water level in the Klaipėda Strait is typical during the cold season due to the long-term prevailing solid westerly winds (more than 17 m·s−1) or raging hurricane winds (more than 32.7 m·s−1). Such winds are characteristic of emerging cyclones between southern Scandinavia and northwestern Russia where the study territory was located.
Changes in the water level in the Baltic Sea are affected by several composite factors: atmospheric dynamics, rising global eustatic water level (thermal expansion), inflows waters from rivers and the North Sea, and glacial isostatic uplift of the Scandinavian continent and the slow sinking of the old European continental plate. In contrast to tide-dominated basins, extreme sea levels in the Baltic Sea are mainly due to wind [35]. While long-term sea level changes are caused by glacial isostatic adjustment of tectonic movements [36,37]. Historical glacial isostatic adjustment at Scandinavian land uplift was perceived at the coast as a drop-in raise sea level. Sea level change was one of the main criteria that help indicate land crust movement. Land uplift is stronger in the northern Baltic Sea, attaining rates close to 10 mm year−1, whereas in southern Baltic Sea it is close to equilibrium with some areas sinking by about 1 mm year−1 [35]. The same resource states that analysis of tide gauge measurements corrected the vertical land movements and indicate that Baltic Sea level may have risen during the 21st century at rates of around 1.5 mm year−1, which are close to the rate of global sea level rise. Still, the water level is not evenly distributed throughout the sea, and sea level does not rise in a globally uniform manner. The Baltic Sea is a sufficiently closed continental sea that is highly dependent on the inflow of river waters and atmospheric circulation.
The rise in water levels in the Klaipėda Strait, which connects the Baltic Sea and the Curonian Lagoon, is a direct cause of changes in the water level of the Danė River. The Danė River valley is one of the priority flood risk areas. The following conclusions are presented [34,38] from the available data based on past floods. The Akmena–Danė River, which flows into the Curonian Lagoon, is the closest to the Baltic Sea coast, and its mouth is located in the old town of Klaipėda city. Due to the seaport, infrastructure is located along the coast of the Curonian Lagoon, and the Danė River divides the city into its northern and southern parts. There are terrain depressions in the urban area that can be easily flooded when sea levels rise. The shore areas of the Danė and Smeltė rivers are distinguished as the most sensitive to floods in Klaipėda [39]. The risk of floods is higher in the western part of Lithuania due to the threat posed by the Baltic Sea. Floods in estuaries lead to extremely high water levels, which pose a greater threat to urbanized areas situated close to shores [40]. A flash flood regime characterizes western Lithuania’s rivers and significantly impacts the fluctuations in water levels in the Curonian Lagoon [41]. Fluctuations in the water level of rivers flowing into the Curonian Lagoon are also determined by changes in the water level of the Baltic Sea and the Curonian Lagoon. With prevailing cyclonic circulation and a west wind direction [42], wave floods often also form from the side of the Baltic Sea and Curonian Lagoon. Due to the rising seawater level and lower river flow, according to 21st century climate change scenario (RCP8.5 scenario), it is likely that the inflow of Baltic Sea water through the Klaipėda Strait into the Curonian Lagoon will increase from 8.0 to 11.0 km3 in the near future [24].
According to the long-term water level data of Klaipėda Strait (1898–2002), the water level on the Lithuanian coast has risen by approximately 14 cm in the meantime [43]. From 1961 to 2008, the water level in the Curonian Lagoon rose by 18 cm [44]. The sudden jump in the rise was evident in the 1980s and 1990s. Since 1960, the average water level has been rising at a rate of approximately 3.0 mm year−1 [42]. Since 1898, the water level in the Klaipėda Strait has risen by approximately 14.7 cm; in the Curonian Lagoon, the average water level is likely to rise by 27–63 cm [42]. The increased sea level variation of the southeast Baltic Sea can be explained partly by global sea level rise but also by changes in atmospheric circulation [42].
It is predicted that in the 21st century, the average water level in the eastern part of the Baltic Sea (including the Lithuanian coast) coast during winter may increase from 40 to 100 cm [45]. The projected winter mean sea level changes for 2071 to 2100 are generally larger than the biases of the control simulations [45], and a projected sea level rise for 2090–2099 relative to 1990–1999 could reach from 50 to 100 cm [35]. Due to the change in climate, in the cold period of the year, the transport of western air masses prevails more often, the duration of storms and stronger winds increases [46], a result of which is that the water level in the Curonian Lagoon has been rising by 3 mm year−1 since the 1960s [44]. More frequent and more intense hydrometeorological extreme events are also predicted. The floods of the Nemunas River are also significant for this area—as a result, the flood level can rise to 217 cm [47]. Therefore, this study aimed to assess the impact of sea level rise on the risk of compound floods of the Danė River in the territory of Klaipėda city. For assessment, we used the probabilities of the water level of the Klaipėda Strait and the discharge of the Danė River, where the Baltic Sea level rose by 1 m due to climate change. The assessment of the sea level rise impact on the future compound flood risk of the Danė River is helpful for flood risk mitigation in Klaipėda city, the adoption and application of infrastructure solutions, and the identification of the necessary flood protection measures.

2. Materials and Methods

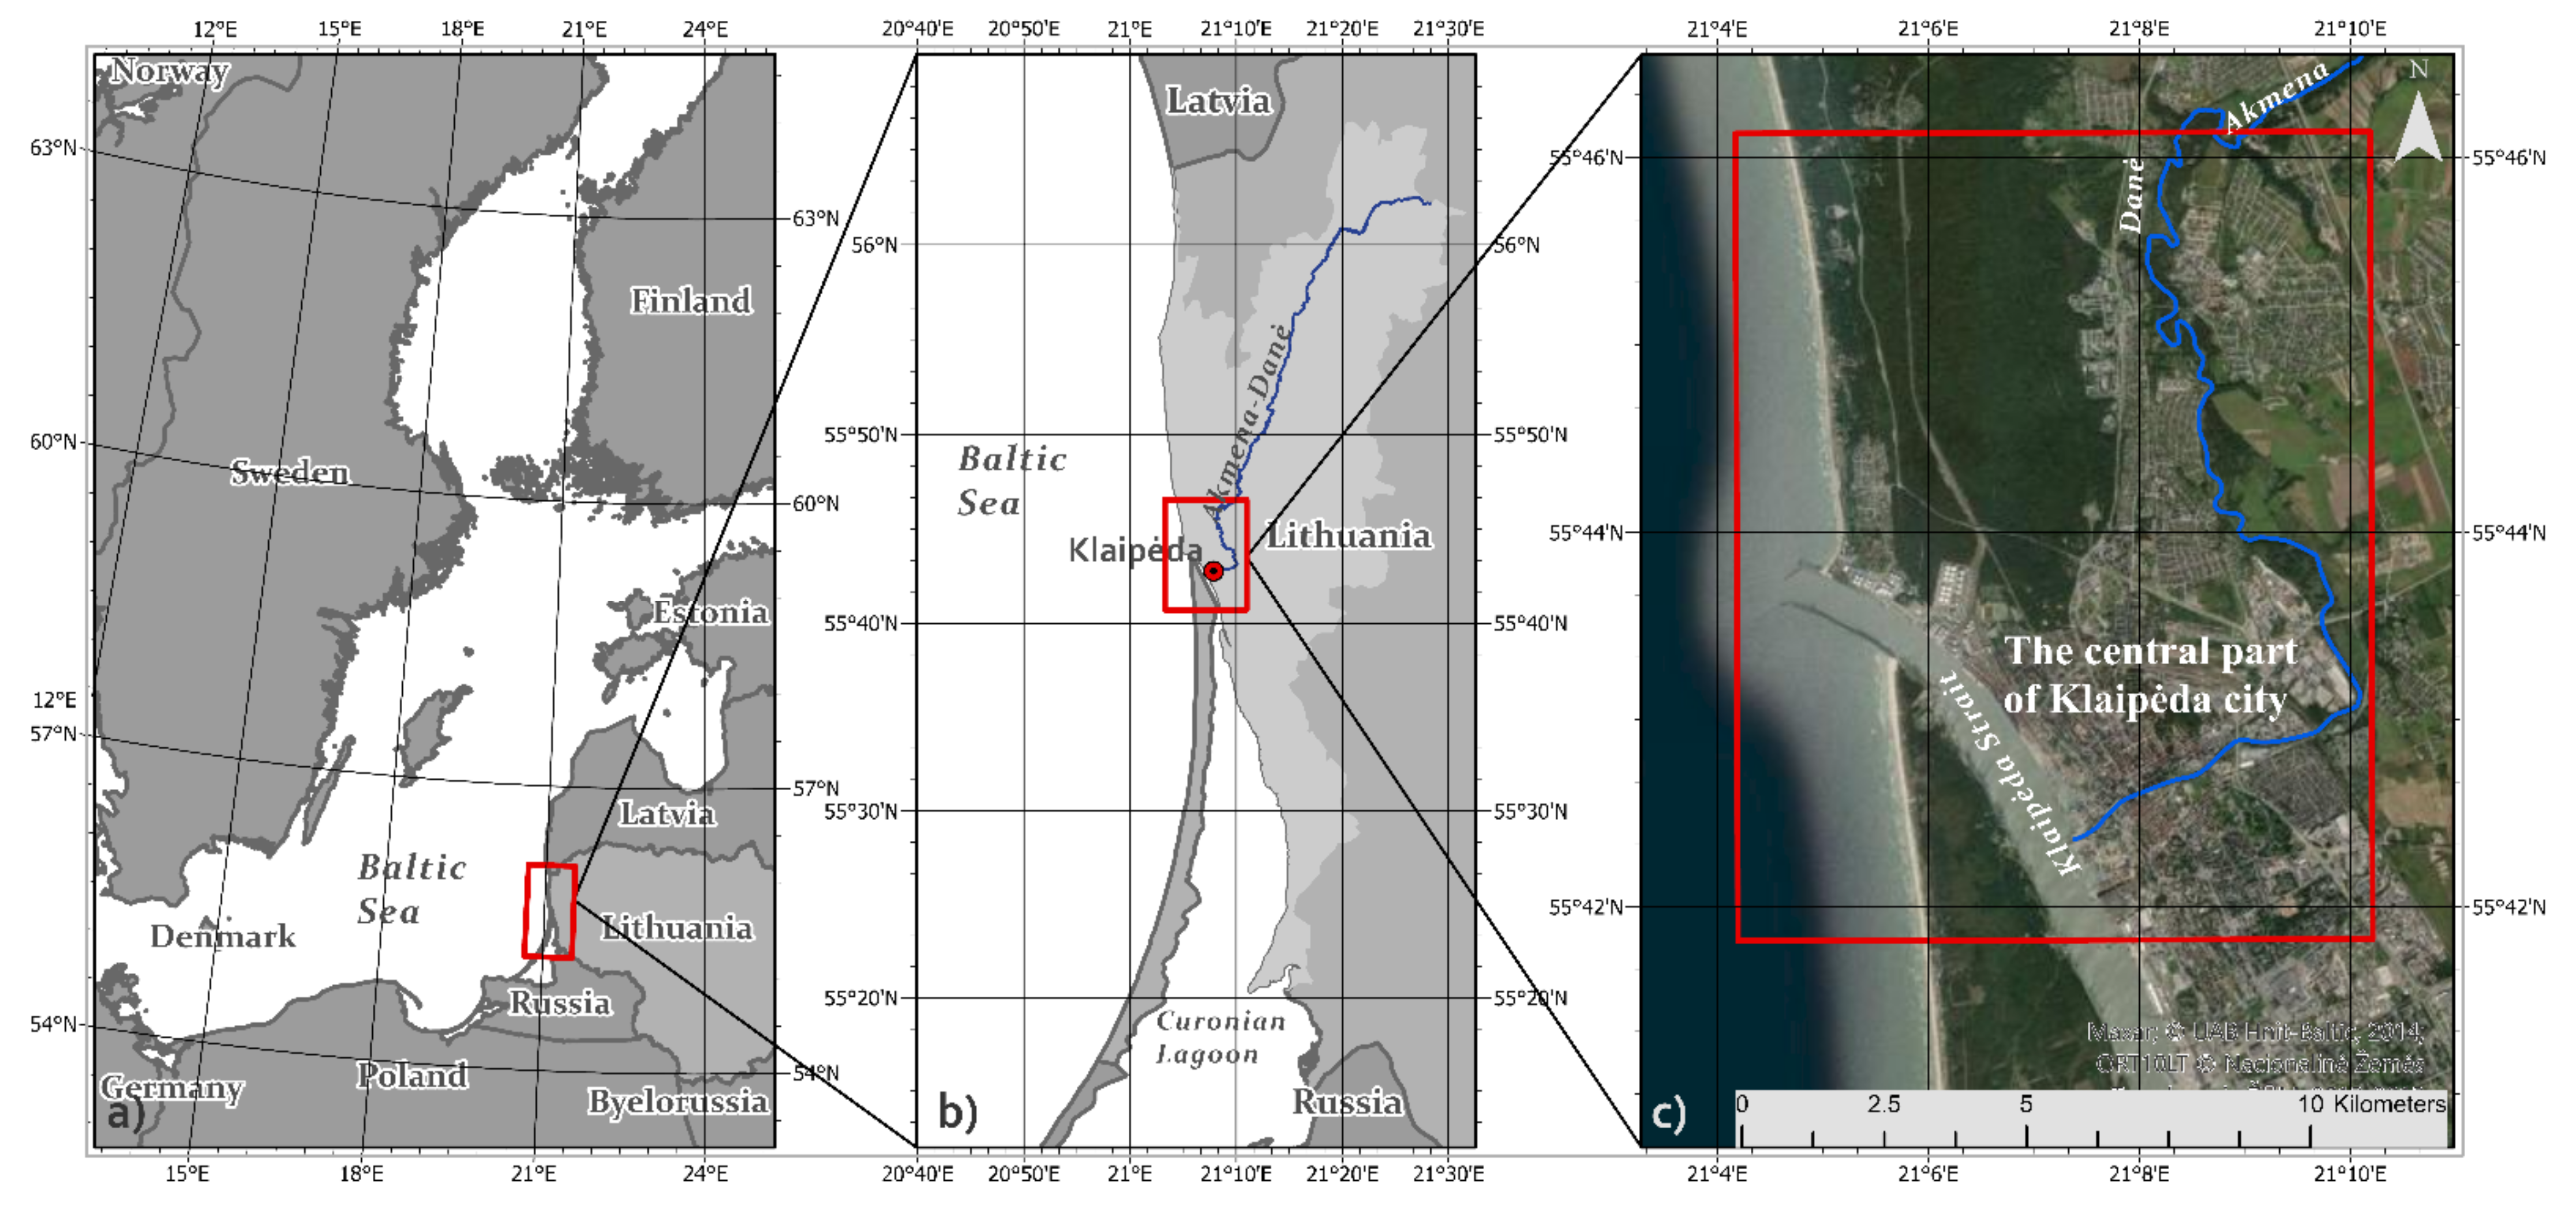
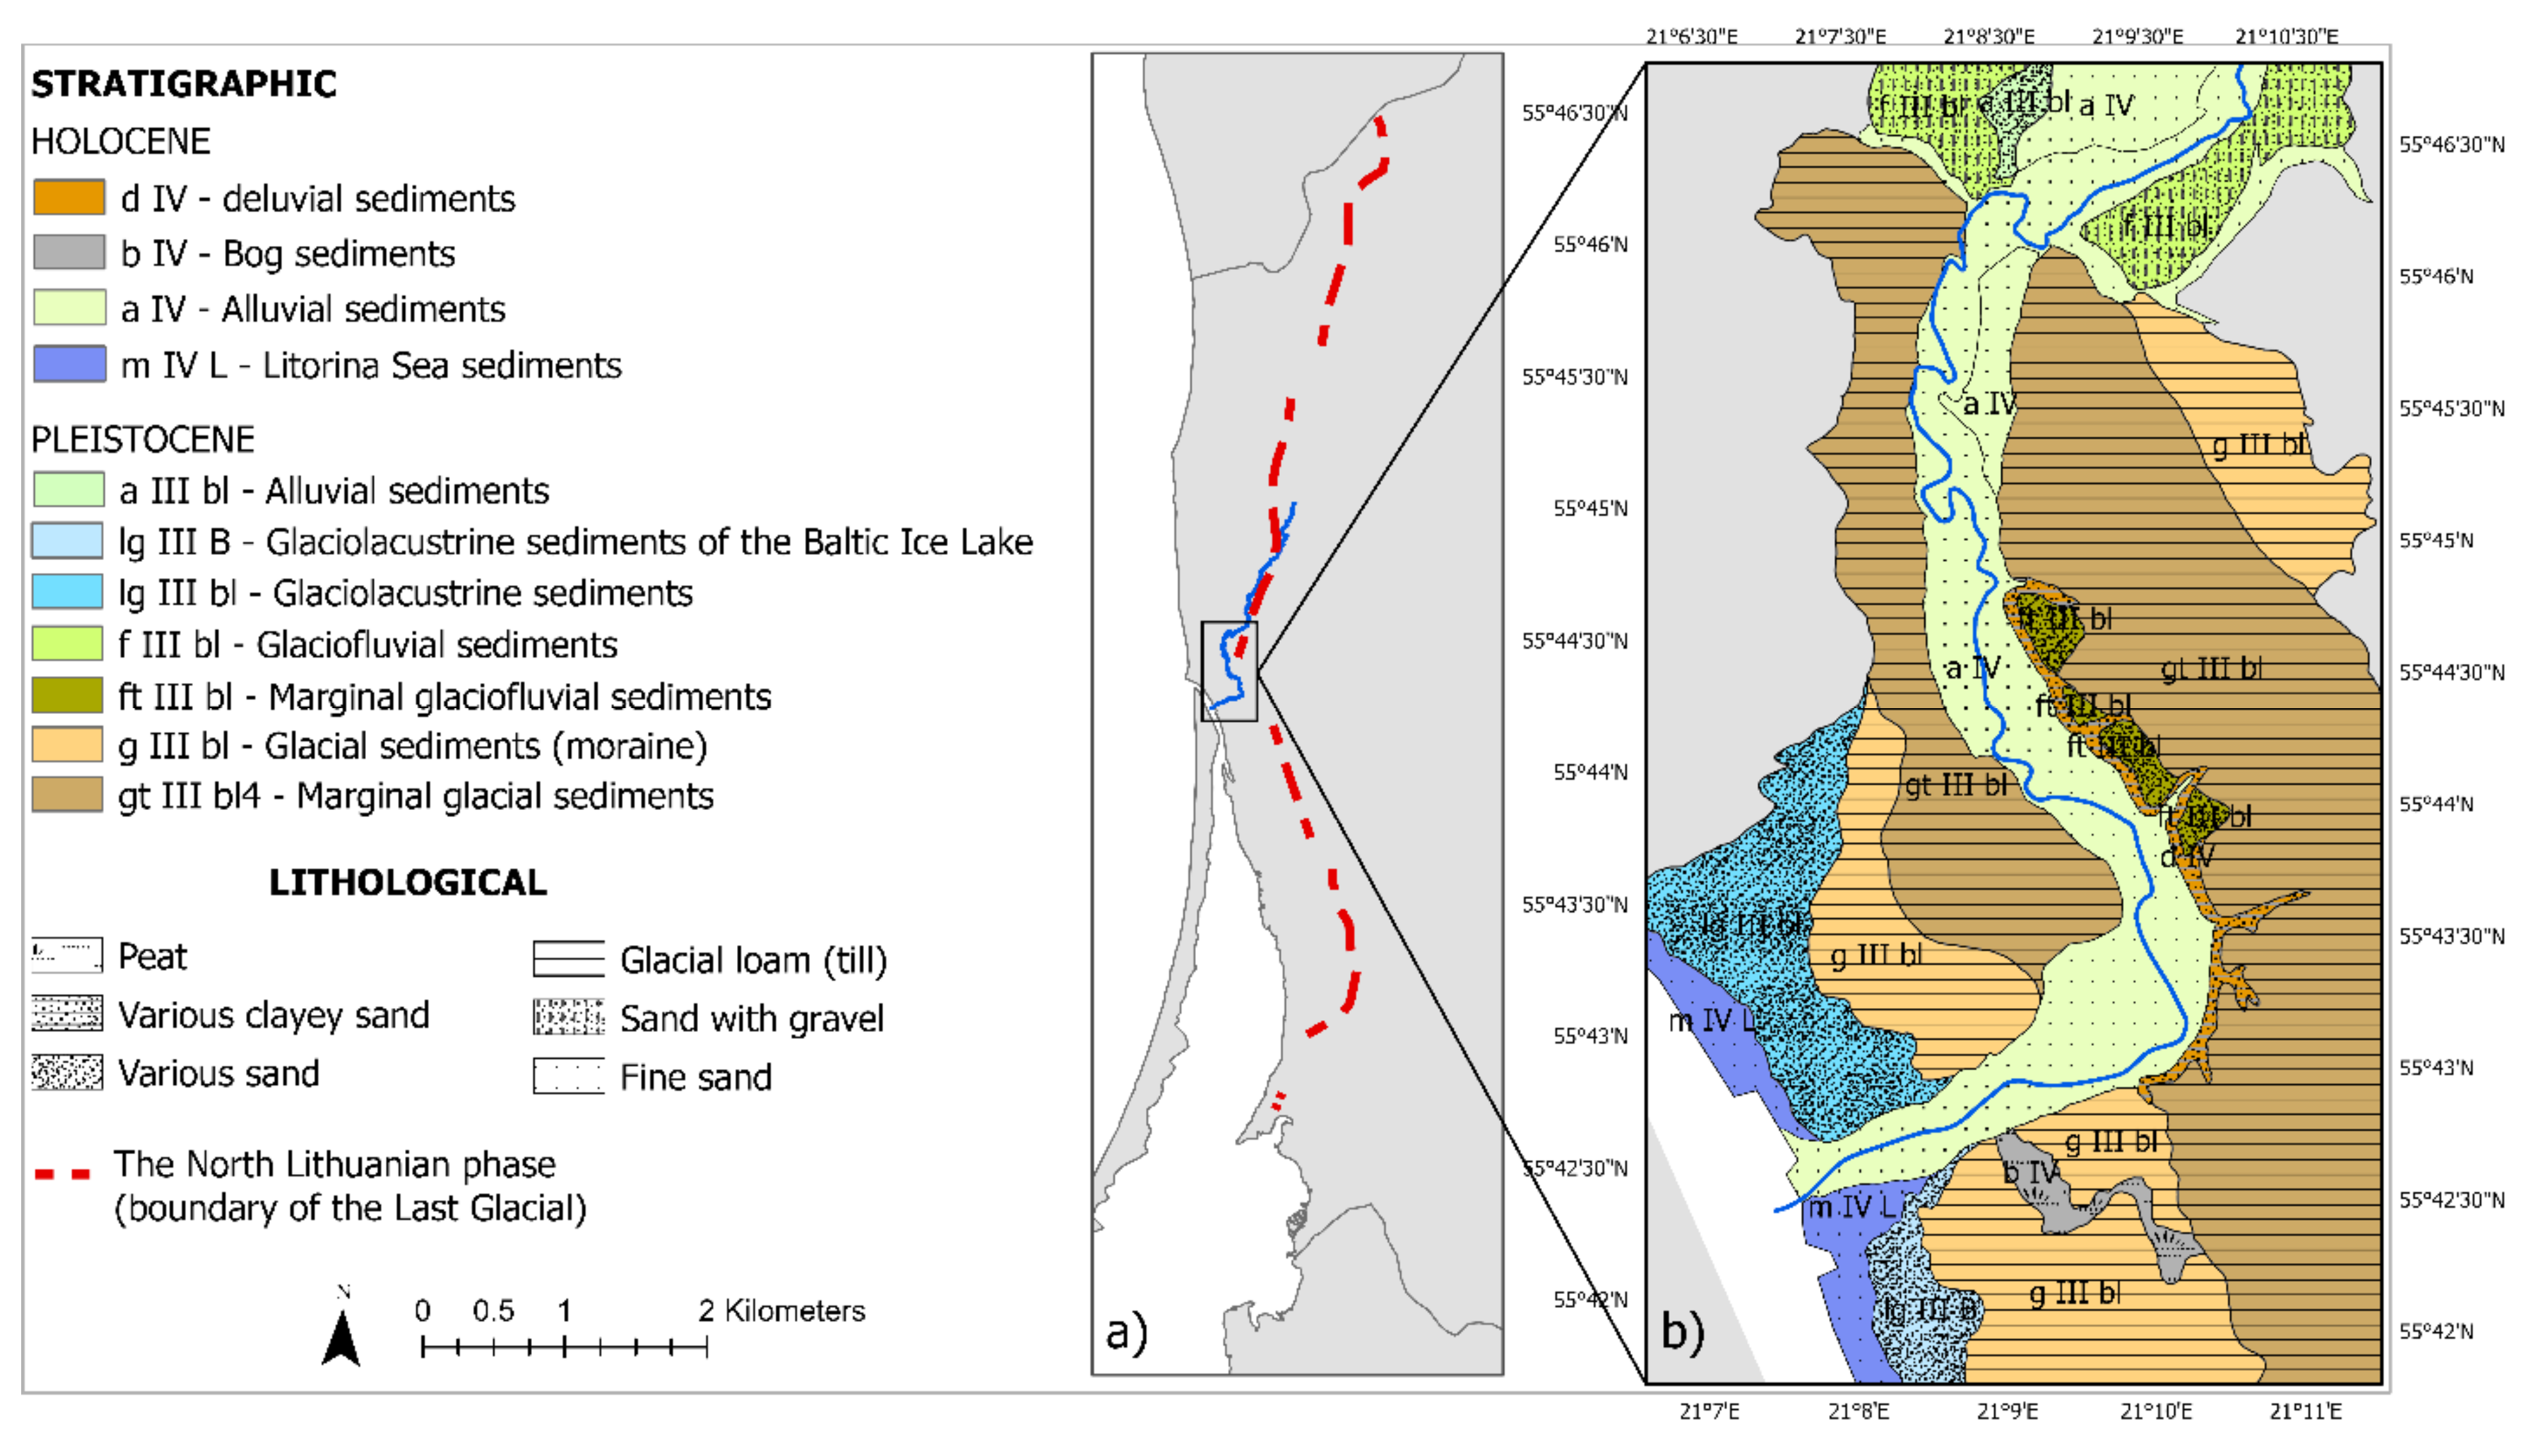
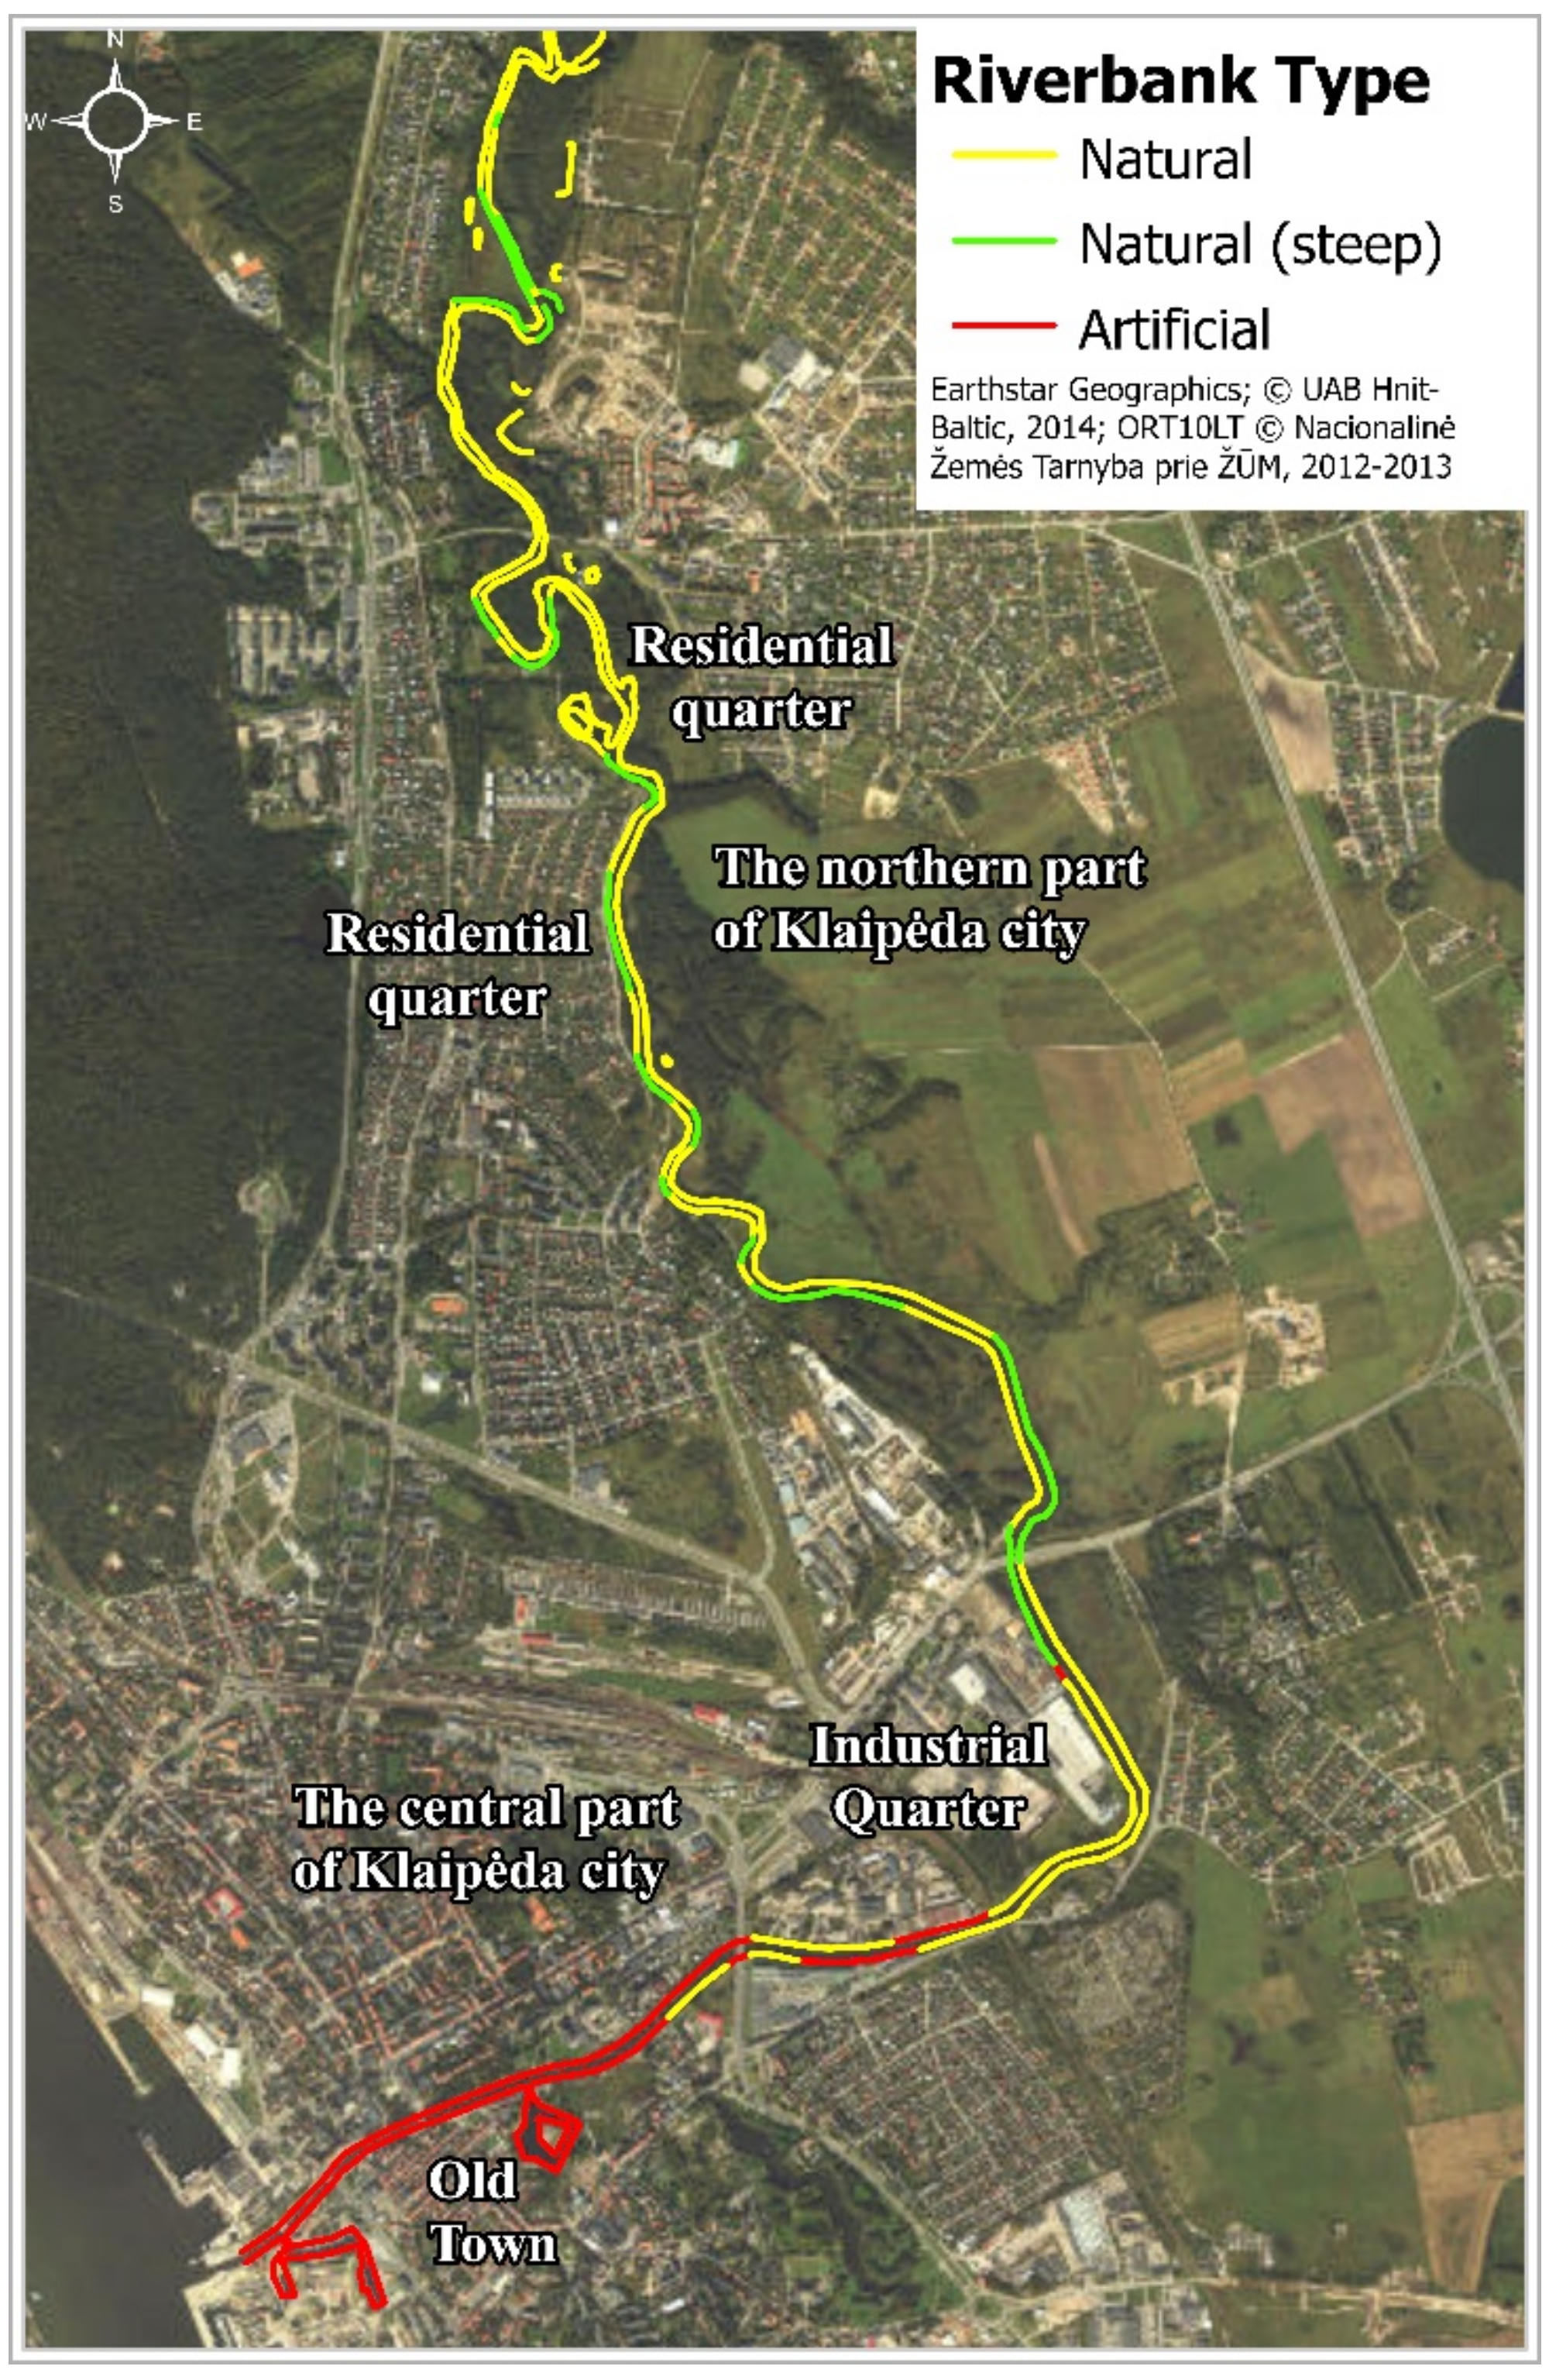
2.1. Study Area Description

A flood risk assessment of the Danė River is relevant, as the river flows through the city of Klaipėda, where the Lithuanian seaport, production, and farm infrastructure, and residential areas are located. Extreme situations during storms form when the Danė River discharge increases due to heavy rainfall, and the water levels in the Baltic Sea and the Curonian Lagoon rise due to the presence of wind floods—water rushes along the riverbanks that flood the city’s streets. Flood risk maps help to assess the extent of inundated areas and the social or economic damage that may be caused to the city of Klaipėda and its surroundings.
The Akmena–Danė River flows into the Klaipėda Strait, which connects the Curonian Lagoon with the Baltic Sea (Figure 1). From the source to Klaipėda city, the river is called Akmena, further to the Curonian Lagoon–Danė (formerly named Dangė, and renamed only in the 1970s). The human economic activities affected by the lower reaches of the Danė River are significant due to the long-running intensive shipping, navigation, dredging, and berth reinforcement. The basin of the Akmena–Danė River covers 580.2 km2 [48] and is between the rivers Sventoji and Minija. The length of the river is 64 km [49], and it is one of the longest rivers belonging to the Lithuanian marine coastal river basin. In the lower reaches, the Danė River spreads up to 40–50 m, the depth is approximately 1–3 m, and in the mouth, it is up to 7 m deep. In the mouth of the Akmena–Danė River, the average annual discharge is approximately 7.6 m3/s, the annual runoff is 0.24 km3, and approximately 700–800 mm of precipitation falls into the basin [48]. The Akmena–Danė River water regime and extreme floods are affected by human activities and climate change.
In the upper and middle reaches, the river flows in an erosive valley rich in boulders. This is why it is called Akmena (in Lithuanian—a stone). The average slope of the river is 0.88‰ (cm km−1), and downstream (20 km from the mouth) it decreases to 0.08‰. Therefore, flooding of the Curonian Lagoon is often observed in Klaipėda. The width of the river in the studied territory of Klaipėda is 50–70 m. The valley is filled with fine sand (Figure 2), and the width is approximately 600 m (ranging from 340 to 1640 m). The river flows within the landscape formed during the Baltic Stage of the Last Glacial. The glacial loam (till), fine sand, and various clayey sand are common for surficial deposits in the coastal lowland [49]. The Akmena–Danė River in the territory of Klaipėda, before flowing into the Curonian Lagoon, cuts glacial sediments of the Last Glacial, glaciolacustrine sediments of the Baltic Ice Lake, and marine sediments of the Littorina Sea (Figure 2). The Akmena–Danė rivers were formed during the deglaciation phase of the Late Glacial and the beginning of the Holocene. Groundwater is at a depth of 1–3 m below the surface in the river valley and at a depth of 3–5 m in the surrounding areas [49].
When assessing the risk of compound floods for the city of Klaipėda, the riverbanks located in the city by the river are considered (Figure 3). When constructing or reconstructing river embankments, it is important to take into account their height and to assess the possible maximum level of flooding. The artificial embankment reduces the risk of flooding to the city, and the collapsing shores increases them. The Danė River flood impact on Klaipėda was analyzed, taking into account two different territories: the central and northern parts of Klaipėda city. In the central part of the city is located the Old Town district, the area near the Old Town and the Industrial Quarter. In the northern part of the city, along the river, there are quarters of private residential houses. Most of the residential houses and infrastructure in these areas are located in the lower terraces of the Danė River near the floodplain. In the northern part of the Klaipėda city, the bank of the river is natural; therefore, they do not have protective shoreline fortifications that protect them from higher flooding of the river. The Industrial Quarter is also situated where embankments are natural. Therefore, these territories are sensitive to river floods during spring, when there is the highest probability for compound flooding and flood risk situations. In the central part of Klaipėda city, most of the riverbanks are artificial, but the compound flood probability is higher.
The risk of flooding in the city also depends on the depth of the river and the speed of the water flow. In the central part of Klaipėda city, the riverbed was artificially straightened and deepened allowing navigation and recreation; therefore, higher water flow velocities are formed here. The riverbed in the northern part is shallower than in the city center. The northern part of the city is more sensitive to increasing Danė River discharge, which results in floods in the Danė valley. The water would spill the most here, because the river meanders in this place the most and, here, the river speeds are low—up to 0.5 m·s−1. Therefore, heavy rains could lead to a faster rise in the water level of the Danė River. The terrain has a significant impact on the spread of flood water. In the northern part of the city, there is a sudden rise in the terrain behind the Danė valley and, therefore, only the valley is flooded. The height of the terrain at the mouth of the river is low. There is an increasing risk of tidal waves in the city center as the water rises and the height of the artificial riverbank is exceeded.

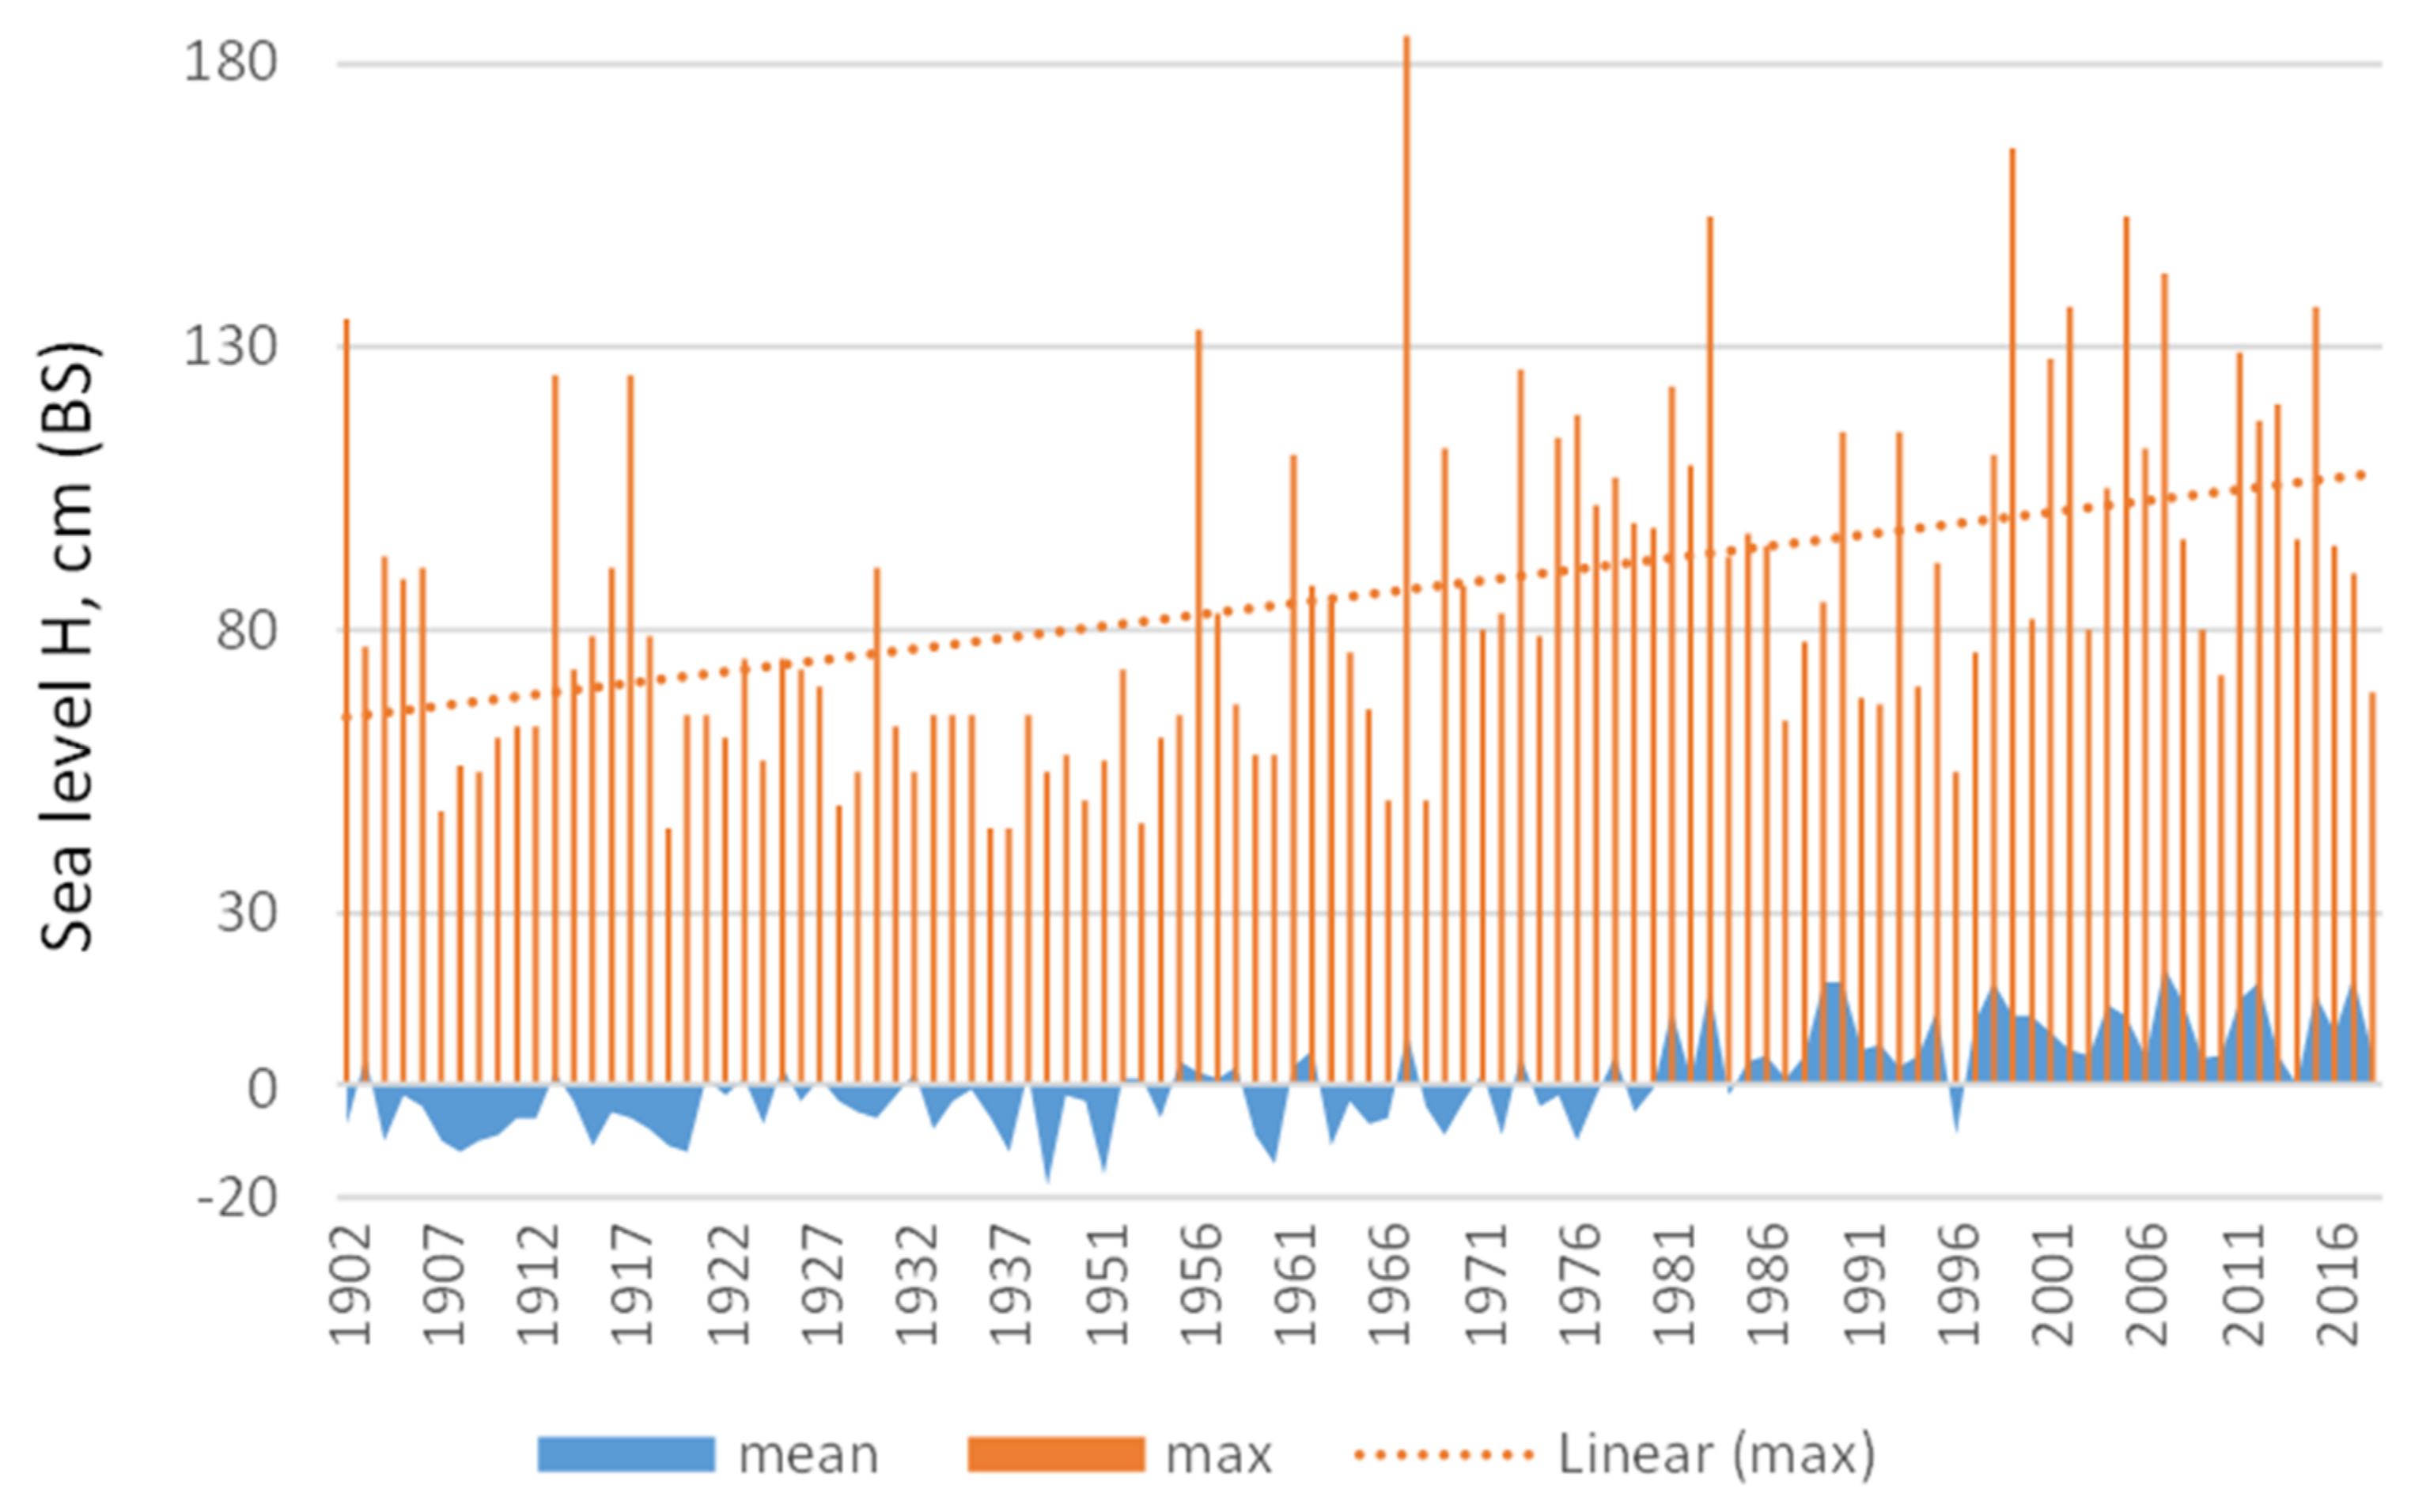
2.2. Sea Level Rise at the Klaipėda Strait

The long-term effects of sea level change due to ongoing climate change are being felt on the southeast coast of the Baltic Sea and in the Curonian Lagoon. Water level data from the Klaipėda Strait Hydrographic Station in 1902–2018 were used to determine long-term changes in water level. Regression coefficients for mean and maximum water levels were calculated using linear trends. The rise in water level over the same period of 30 years was compared. The rising trends of the water level helped to confirm the predictions [35,50] that the water level in the Klaipėda Strait may rise by approximately 1 m by the end of the 21st century. Water level data were obtained from the Environmental Protection Department of the Ministry of Environment of the Republic of Lithuania, which carries out state monitoring of surface waters.

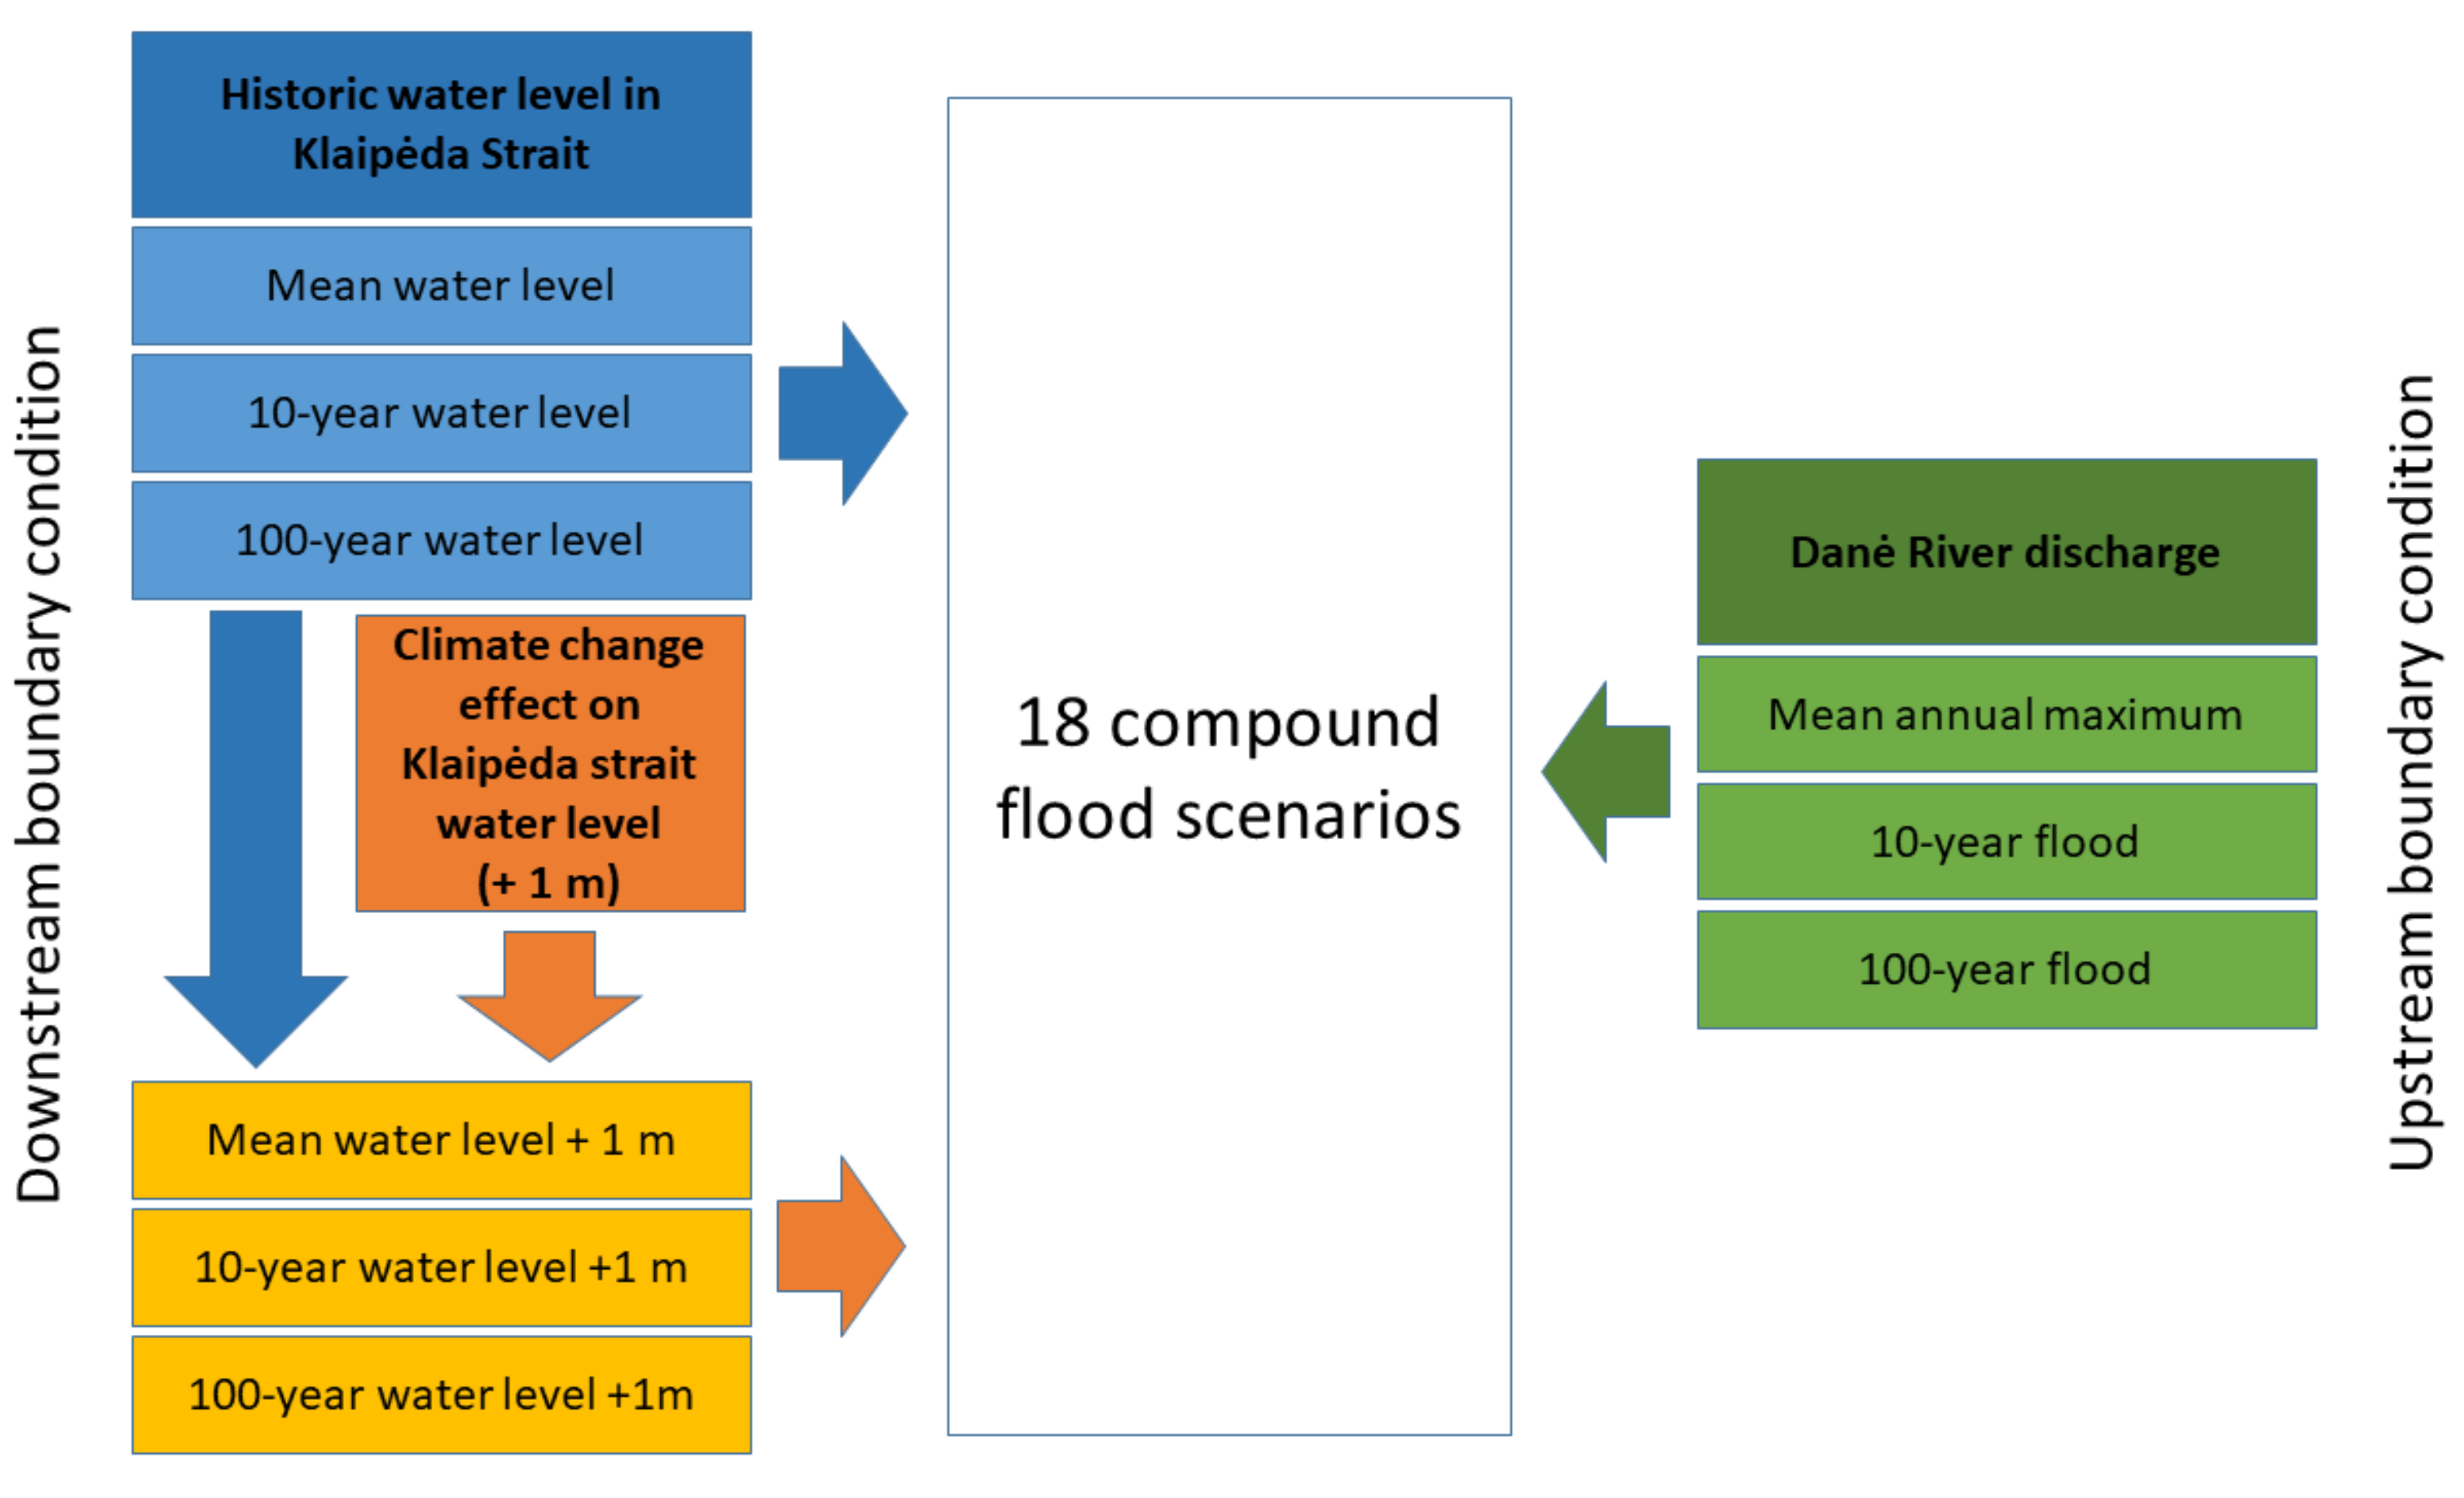
2.3. Development of Flood Scenarios

We created eighteen compound flood scenarios (Figure 4) in the study area combining Danė River discharge with the water level in the Klaipėda Strait and climate change effect on Baltic Sea water level rise: nine scenarios with historical water levels in the Klaipėda Strait and nine scenarios if the water level rose 1 m due to climate change.
For the scenarios, we used hazard data calculated during the EU Floods Directive’s implementation [34,47]. The mean historical water level in the Klaipėda Strait is 0 m in the Baltic Sea height system (BS), the 10% probability (10-year water level) water level was 1.4 m (above BS); the 1% probability (100-year water level) water level was 2 m (above BS) [47]. A 10% water level probability in Curonian Lagoon is caused by severe storms in the Baltic Sea and the inflow of seawater into the lagoon, and this is the high probability that water levels can occur, on average, 1 time in 10 years. A 1% water level in the Curonian Lagoon probability is equal to 2 m according to the Baltic Sea level elevation system, which occurs in extreme situations when a strong storm forms in the Baltic Sea, westerly winds prevail at the mouth of the Danė River, and heavy rainfall fall occurs. Then, the water of the Danė River cannot flow into the lagoon and can rise even higher. This is a low probability water level that can occur, on average, 1 time in 100 years.
We made the hypothesis that due to climate change, the mean sea water level in this southeastern part of the Baltic Sea, including in Curonian Lagoon, would rise by 1 m (Figure 2). After the addition of 1 m, the mean, 10%, and 1% probability water levels were, respectively, 1.0, 2.4, and 3.0 m.
A Klaipėda Strait water level rise of 1 m is likely only from a long-term perspective of the 21st century. Based on climate change scenarios, approximately a 1 m higher mean sea level is close to the high-end scenario simulation results at the end of the 21st century [51,52]. Global climate models project that the rise in GMSL during the 21st century (i.e., in 2100 relative to the period 1995–2014) will likely (66% confidence) be in the range of 0.28–0.55 m for a very low emissions scenario (SSP1–1.9), 0.44–0.76 m for an intermediate emissions scenario (SSP2–4.5), and 0.63–1.02 m for a very high emissions scenario (SSP5–8.5) [52]. Estimates for global mean sea level rise in the 21st century are 61–110 cm according to a very high emissions scenario (RCP8.5) [53,54].
The mean annual maximum discharge of the Danė River is 59 m3/s, a 10% probability (10-year flood) flood peak discharge of is 110 m3/s, and a 1% probability (100-year flood) flood peak discharge of is 156 m3/s [34]. We made an assumption that river discharge in the future will remain the same as in the past. This assumption might not reflect the baseline real hazard changes, but we used it to highlight the effect of sea level rise on compound flood risk.

2.4. Model Approach

We employed the well-known and widely used HEC-RAS 5.0.4 (Hydrological Centers River Analysis System) hydraulic model to create compound flood maps for each scenario. For each scenario, the combination of Danė River discharge and water level in the Klaipėda Strait was used as the upper and downstream boundary conditions in the model. We used the 2D version of HEC-RAS to more accurately estimate inundated areas in the wide valley of the Danė River’s lower reaches.
The HEC-RAS 2D is an unsteady model; thus, we continuously increased river discharge in the upper cross-section of the model over a period of 14 days from 10 m·s−1 to the particular scenario discharge and kept it constant at this value until the flooded area reached its maximum extent. The model was created using a Danė River valley digital terrain model, which was created using Lidar technology for implementation of the EU Floods Directive and provided by the Lithuanian Environmental Protection Agency [55]. The grid size of the digital surface model of the river valley was 1 × 1 m, the root mean square error of the vertical position was not more than 0.15 m, and the point density was approximately 6–7 per 1 m2.
Flood risk maps of the inundated areas of the Danė River were prepared using spatial analysis methods and ArcGIS Pro 2.9.0. software to assess the possible negative impacts related to floods on the city of Klaipėda, its environment, residential areas, and buildings. Risk maps of short-term fluctuations in the water level of the Danė River (with and without the impacts of climate change) and the georeferenced base cadastral spatial data set were used for flood risk assessment. Cadastre data and information are collected and stored by the state using the Lithuanian coordinate system, LKS-94, and in the Lithuanian state altitude system, LAS07. According to the attribute information of this cadastre and the descriptions of the values of the attribute fields, the layers of areas, streets, and buildings were selected using the Select Features tool, and they were processed, separated, or combined to obtain new layers for flood risk analysis in Klaipėda.

3. Results

The Baltic Sea level is connected with the continuous effect of external and internal forces related to wind stress, atmospheric pressure, and water density changes or water balance constituents. When the perturbing forces stop, the masses of water return to equilibrium [56,57]; however, climate change affects the conditions of stability. For a long time, climate change has had a significant impact on water level changes on the southeast coast of the Baltic Sea and sea–lagoon water transitions zone conditions. Recently, the component of water balance, which consists of the inflow of seawater into the Curonian Lagoon, has been increasing [24,58]. The Baltic Sea’s average and extreme sea level rise could create conditions for seawater inflow into the lagoon more frequently.
The impact of the Klaipėda Strait’s (Figure 1) short-term sea level changes on the water level variation of the Danė River is particularly significant, as the inflow from the strait affects the river estuary and the lower reaches. According to existing water level data on the Klaipėda Strait (1902–2018), three extreme water level and one catastrophic water level events in the Klaipėda State seaport water area were identified. All cases were related to mighty storms in the Baltic Sea that lasted for approximately 1–3 days. The highest water level rise was recorded on 17 November 1967 and 4 December 1999, when accordingly, storm and wind surges exceeded catastrophic water levels (reaching 186 and 165 cm above sea level in the Baltic altitude system). Empirical calculations showed that in the Klaipėda Strait, the rise of the water level above 110 cm is expected 2.16 times in 10 years, and a rise of 140 cm is expected 0.52 times in 10 years. Moreover, a rise above 160 cm is likely 0.21 times in 10 years (approximately once in 50 years) [32]. Due to the rains that started in September 2017, the Akmena–Danė River valley was flooded, and the elevated water level lasted for 127 days [25]. At the end of the century, daily rainfall is projected to increase the most for the seaside and Žemaičių Highlands [20,39,59]; therefore, such floods are likely to increase in the future.
The water level in Klaipėda Strait has changed and increased during the whole (1902–2018) observation period, increasing by 21 cm (Figure 5). Comparing the regression coefficients of the linear trends of the water level change, we see that the rate of change in the water level intensifies: (a) 1902–2018: 0.18 mm year−1, R2 = 0.44; (b) 1902–2000: 0.17 mm year−1, R2 = 0.31; and (c) 1961–2000: 0.40 mm year−1, R2 = 0.32. In the period from 1961 to 2000, the water level rose by approximately 16 cm. From 1902 to 2018, higher than normal water levels prevailed in the Klaipėda Strait. The increase in mean sea level contributed to a fraction of the total loss due to marine-induced hazards in the river’s mouth, reaching extreme meteorological and hydrological conditions.
With the mean water level of the Curonian Lagoon and rising spring floods or flash floods, the water in Klaipėda will spill only in the area where there is no artificial riverbank, at the turn of the riverbed to the north (Figure 6). Higher floods in the Danė valley would occur at a mean water level in the Klaipėda Strait and with the intensification of the Danė River discharge (10-year flood). There would be more areas inundated during the 10-year or 100-year water level with mean annual maximum discharge. The city center is more vulnerable during events when there is a 100-year water level. Flood risk in the central part of Klaipėda city increases with the rising water level of the Curonian Lagoon and in Klaipėda Old Town and the Industrial Quarter when the water level rises during stronger storms (with a 10-year flood). River flow speeds of up to 3 m·s−1 are formed, as the riverbed in the central part of Klaipėda is equipped with an artificial embankment, straightened, and deepened for navigation. Wind-driven floods often form at the mouth of the Danė, especially during storms with western and southwestern winds prevailing when water from the Baltic Sea is pushed through the Klaipėda Strait into the Curonian Lagoon. Due to the westerly winds on the southeast coast of the sea, a wind-driven flood is also formed, so the water of the strait floods the mouth of the Danė and forms an affluent into the river. Water cannot flow freely and floods Klaipėda Old Town.
The research shows that the central part of Klaipėda city is especially sensitive to changes in water levels of the Curonian Lagoon, and the northern part is sensitive to the Danė River’s discharge rates. In Klaipėda city, the greatest hazard of compound floods would occur if the water level increased by 1 m due to the climate change impact. The maps (Figure 7) represent three river discharge probabilities (the same as in Figure 6) at each water level of the Klaipėda Strait affected by climate change, where the mean water level is 1 m, 10-year water level is 2.4, and 100-year water level is 3 m. If the water of Klaipėda Strait were to rise by 1 m due to the effect of climate, a large part of the Old Town, the Port Quay, and industrial areas would be flooded in the central part of the city. The rising water level of the Klaipėda Strait during storms due to the wind and more rainfall would raise the water level of the Danė River faster; then, large areas of the city with all the infrastructure would be inundated. According to the analyzed scenarios, it can be seen (Figure 7) that if the water level in the Klaipėda Strait rises more than 2 m (10-year water level), water would flow into the river valley. If the water level in the Klaipėda Strait rises 1 m, the likelihood of an extreme situation (corresponding to a 100-year water level) due to wind gusts into the Danė River, wind-driven floods of stronger storms, or hurricanes may increase.
At the mean annual maximum Danė River discharge, the floods of the Danė River without climate change impact are dangerous to residential quarters in the northern part of the city (Figure 8). Klaipėda Strait water level rise increases the risk to southern parts of the city. Modeled scenarios with mean annual maximum Danė River discharge and climate change impact showed flood risk increment to southern part, especially when windstorm sea surge dominates (10-year or 100-year water level). Floods would be dangerous to the center of Klaipėda city if the water level of the Klaipėda Strait rises. If the water level at Klaipėda Strait reaches a 10-year and 100-year water level, the city center would be at high risk of flooding. The most affected areas of the town would be the Old Town, the northern Cape, the cruise ship terminal, Danė Square, and the Industrial Quarter and the factories therein. The rise in flood surges would also cause damage to a couple of residential quarters in the northern part of Klaipėda city.
In order to assess the risk of floods in the city of Klaipėda, it is important to identify inundated different types of areas by storm surges. Therefore, in the analysis of flood risk in the city, two groups of territories were analyzed: built-up areas and undeveloped areas. The group of built-up areas also includes industrial areas, stadiums, and power substations exposed to flood risk areas. Non-built-up areas include meadows and pastures, ponds, swamps, forests, trees, arable land, and unused land.
Table 1 shows the affected area by the different compound flood scenarios. Under the current conditions, a recurring water level in the strait every 10 years when the Danė River discharge is at the mean annual maximum would affect 1,403,513 m2 (more than 150,000 m2 of built-up area), which is almost 1.5% of the city’s area. Due to climate change, if the water level rises by 1 m, the recurring water level every 10 years when the Danė River discharge is at the mean annual maximum would affect areas of 2,412,144 m2 (more than 710,000 m2 of built-up area), almost 2.5% of the city area (Table 2). If the Danė River’s 10-year discharge occurs at the same time as the 10-year Klaipėda Strait water level, almost be 2% of the city would be flood affected. During the same situation with the climate change effect, flood-affected areas would increase by 0.7%. During the 100-year Danė River discharge and 10-year Klaipėda Strait water level, 2.3% of the city area would be affected without the climate change effect, and with the climate change effect, 2.7%. During this compound flood scenario, flood-affected built-up areas would increase from 0.5% to 0.8%. The situation could become more dangerous if the water level in the Klaipėda Strait reached the 100-year level. In this water level scenario, flood-affected areas of the city would increase from 2% during the mean annual maximum Danė River discharge to almost 3% during a 100-year flood discharge without the climate change effect. During the 100-year Klaipėda Strait water level and with the three Danė River discharge combined effect scenarios, 3.1%, 3.2%, and 3.5% of the city area would be affected by compound floods with climate change impact.
Observations of the Klaipėda Strait water level confirmed that the long-term southeast Baltic Sea level is rising due to climate change. However, the short-term rise in the water level in the Klaipėda Strait is also affected by the extreme prevailing wind, which causes sea storm surges. In this case, we can see that during extreme storms and climate change, the river water could flood the city territory up to three times more than during extreme situations without climate change. Areas affected by floods among the same scenarios without and with climate change showed how areas were vulnerable to climate change. With climate change impact, inundated areas increase more when the 10-year water level occurs at the same time as the mean annual maximum Danė River discharge (Table 3). Fewer differences among inundated areas prevail during the mean Klaipėda Strait water level at all discharges, while inundated built-up areas increase when the Klaipėda Strait water level increases. In such cases, we can see that built-up areas are more vulnerable during extreme hydrometeorological situations. Built-up areas require important attention and mitigation actions because inundation of these areas can cause major economic losses.
The growing area of floods poses an increasing threat to the property of the population. Table 4 shows the number of flooded buildings according to different compound flood scenarios. Without the impact of climate change, from 60 to almost 700 buildings could be inundated according to different compound flood scenarios. From 84 to 940 buildings could be affected by compound floods according to different scenarios with climate change impact. This means that with the trend of rising water levels in the Klaipėda Strait, appropriate measures must already be taken to adapt to possible floods and reduce potential damage.
The Danė River flows through the city center of Klaipėda and is crossed by several significant streets and bridges, which allows for transport and residents to go to the northern or southern parts of the city. During floods, the streets of the lower area can be affected by flood and disrupt traffic. The highest risk of flooding is for trails in the recreational area of the Danė River and roads in residential areas. However, the greatest hazard arises when the main roads connecting individual parts of the city are affected by floods. The whole town is at risk of traffic disruption in the event of flooding of important streets with connections to bridges.
Under different compound flood scenarios, in addition to the effects of climate change, between 8 and almost 32 km of roads in all categories could be flooded (Table 5). During compound floods with climate change impact, between almost 9 and 43 km of roads would be flooded.

4. Discussion

This research confirmed that extreme hydrometeorological conditions may lead to larger floods in coastal river reaches in the 21st century. They lead to compound floods caused not only by higher rainfall, increased river run-off, and the strong wind causing coast sea flooding, but also by rising global water levels affected by climate change.
The research obtained in this work confirms previous research by European and Baltic scientists that devastating coastal flooding and associated phenomena are economically extremely damaging, and they have a distinctive regional or local character [60,61]. River deltas, beaches, estuaries, and lagoons are considered particularly vulnerable to the adverse effects of climate change, which should be studied at the regional/local scale [62].
These results have implications for local planners, because urban development and seaport reconstructions in the Klaipėda city seaport are now taking place in many coastal areas susceptible to flooding. Coastal flooding is a severe problem for low-lying urban areas near the Danė River mouth. An increase in mean sea level contributes as a component of the high extreme water level and, at the same time, forms part of a fraction of the total loss due to marine-induced hazards in the mouth of the river’s reaches during extreme meteorological and hydrological conditions.
The formation of floods in the lower reaches of the Danė River is determined by the rising water level of the Baltic Sea in the Klaipėda Strait due to climate change, stronger west winds forming the seawater affluent, and the discharge intensity of the Danė River. In the lower reaches of the Danė River, the flood risk assessment is relevant because the Danė River flows through the third-largest city in Lithuania, where the seaport is located. The Port of Klaipėda is an important economic center and is connected to the Baltic Sea by the water area adapted for technological navigation, the Klaipėda Strait, where intensive water exchange of the Curonian Lagoon with the Baltic Sea takes place. To ensure optimal seaport exploitation, a plausible assessment of port operations in light of the effects of climate change is necessary, because port disruptions have a significant impact on the local, regional, and global economy due to the strategic role of ports in the supply chain [63].
It is necessary to consider climate change and the probable higher maximum floods of the Danė River when planning the development and protection of Klaipėda city infrastructure. There are residential areas in the northern part of Klaipėda along the Danė River, the Old Town is in the city center, while production and industrial areas are in the city center. During storms, when heavy rainfall falls, and the water level in the Baltic Sea and the Curonian Lagoon rises due to wind floods, extreme situations form: water runs over the riverbanks and floods the city streets. Flood risk maps allow for the identification of flood-sensitive areas, assessment of potential economic and social damage during floods, and management of the situation in these areas by selecting appropriate protection measures. However, flood risk maps are based on past floods, and the climate change factor is ignored. Long-term measures can be taken to mitigate and adapt to climate change, avoiding greater economic and social losses in the future by combining the potential consequences of climate change with probable flood risk data. According to the RCP4.5 scenario, if the average level of the Baltic Sea rises by 34–37 cm, Lithuania would suffer a loss of EUR 0.2 billion and 42,000 thousand inhabitants would be affected, or according to the RCP8.5 scenario, Lithuania would suffer EUR 0.4 billion and 63,000 thousand people would be affected if the average level rises from 58 to 172 cm [64].
According to scenarios for future global climate change [25,45,61,65], the related risks may be radically amplified in the 21st century. Coastal flooding is an example of marine-induced hazards for near-coast communities [60]. A challenge of the EU’s Marine Strategy Framework Directive [66] is to ensure comparable status assessments for good environmental status in the European seas. It is recommended that these effects be better understood, researched, and managed in all regional seas and especially in urban coastal areas where most of the human population lives.
The importance of climate change adaptation is accepted worldwide, highlighting the lack of preparedness for managing today’s emergencies. Areas that are already affected by climate change must be redeveloped in order to reduce economic and social vulnerability. The new EU Strategy for Adaptation to Climate Change [67] emphasizes the need to consider climate change considerations and the perspective of future risks when planning urban spatial development. In view of this, the construction of buildings near water bodies should be suspended. However, in the general plan of Klaipėda city municipality [68] until 2030, to reduce the migration of the city population to suburban areas, part of the planned new residential construction development territories falls into potentially sensitive flood areas. Even without the impact of climate change, these territories fall in areas that can be flooded. There will be an inevitable increase in economic losses in the future if these general plan solutions are implemented. Currently, built-up territories need to be redeveloped to mitigate their vulnerability. However, if these places are to be developed as residential areas, in the future their redevelopment will become more complex.
Due to climate change, the 10% probability of a rise in the water level of the Curonian Lagoon would be similar to the potential damage to the city caused by an extreme (1% probability) increase in the water level these days. Flood risk due to sea level rise will cause significant economic damage to these areas. Adapting to climate change is a long process that requires complex actions and measures. It is necessary to have a long-lasting strategy to avoid economic losses and social impact. The actions planned by the municipality to stop population migration to the suburbs conflict with measures to adapt to climate change. Without respect to climate change forecasts, economic losses will increase in the future and it will be more difficult to develop flood risk areas urgently.

5. Conclusions

River modeling is a suitable tool for assessing flood risk, monitoring variability, and predicting future factors using different scenarios. The scenarios developed with the HEC-RAS model illustrated the water levels of the Akmena–Danė River with different probabilities. In addition, climate change scenarios were developed showing how a 1 m rise in the water level in the Curonian Lagoon would affect the floods of the Danė River in Klaipėda.
The floods of the Akmena–Danė River flowing in the center of Klaipėda can be dangerous to the city due to the changing climate and increasing sea floodplain. Scenarios of the Klaipėda Strait water level and the discharge of the largest spring floods with the help of various hydrodynamic models help to create cartographic maps and assess the maximum flood risk for the city of Klaipėda and its inhabitants. The results of this work, assessing short-term scenarios for water levels and long-term impacts of climate change on the Danė River, could be used to make a variety of urban infrastructure decisions, assess flood damage, and provide flood defenses.
Flood risk nowadays can occur when Danė River discharge reaches a 10-year or 100-year flood. Flood risk increases during compound events when the water level in the Klaipėda Strait reaches 10-year and 100-year levels at the same time as increased Danė River discharges, even when the discharge is the mean annual maximum.
Due to climate change, 10-year flood damage would be similar to the damage of current 100-year floods. The rising long-term water level in the Klaipėda Strait increases the possibility of a rise in the maximum water level to 3 m. Such an increase corresponds to a 100-year flood and can occur more often.
The storm surge of the Baltic Sea and the rise of the water level in the Klaipėda Strait have a greater impact on the central part of Klaipėda city, and the maximum discharge rates of the river on the northern part. If the water level increases as predicted by the end of century, there would be more inundated areas. In the city center, the Old Town, the northern Cape, the cruise ship terminal, Danė Square as well as the Industrial Quarter and factories therein would be in danger. In the northern part of the city, the rise in flood waves would cause problems for residential districts.
Long-term climate change scenarios need to be considered to reduce the impact of climate change and adapt to ongoing processes. Taking flood risk due to climate change into account in the development of urban infrastructure and the reorganization of areas that are in a potential extreme flood area would help to avoid future economic and social losses.
The main theses of this study:
  • Compound floods risks and hazards in coastal Klaipėda city are influenced by external Danė River floods, wind-caused sea storm surge, and are due to the climate change effect on the sea level rise in the SE part of the Baltic Sea;
  • An integrated approach is needed to assess flood risks and hazards for the evaluation of compound flooding, as when considering together the average rise of the SE Baltic Sea and Curonian Lagoon caused by climate change, its maximum forecast is possible according to the climate change process as well as the extreme Akmena–Danė River floods in the mouth of the river, located in the city of Klaipėda;
  • The rising long-term water level in the Klaipėda Strait increases the possibility of a rise in the maximum water level to 3 m. Such an increase corresponds to a 100-year flood and could become more frequent;
  • The construction of residential houses in the inundated areas near the Danė River should be suspended in Klaipėda (according to 10-year and 100-year probabilities).

Author Contributions

Conceptualization, E.Č.; methodology, L.D. and E.S.; software, L.D. and E.Č.; validation, E.S. and L.D.; investigation, E.Č. and L.D.; writing—original draft preparation, E.Č. and L.D.; writing—review and editing, E.S. and I.D.; visualization, E.Č.; supervision, I.D. and E.S. All authors have read and agreed to the published version of the manuscript.

Funding

This research was partially corresponded to scientific activities carried out by COST CA17109: “Understanding and Modeling Compound Climate and Weather Events” and COST CA19109: “European Network for Mediterranean Cyclones in Weather and Climate”.

Institutional Review Board Statement

Not applicable.

Informed Consent Statement

Not applicable.

Data Availability Statement

The data presented in this study are available on request from the corresponding author.

Acknowledgments

The authors are grateful to the Lithuanian Hydrometeorological Service under the Ministry of Environment for hydrometeorological and sea level data.

Conflicts of Interest

The authors declare no conflict of interest.

References

  1. Ghanbari, M.; Arabi, M.; Kao, S.; Obeysekera, J.; Sweet, W. Climate Change and Changes in Compound Coastal-Riverine Flooding Hazard Along the U.S. Coasts. Earth’s Future 2021, 9. [Google Scholar] [CrossRef]
  2. Bermúdez, M.; Farfán, J.F.; Willems, P.; Cea, L. Assessing the Effects of Climate Change on Compound Flooding in Coastal River Areas. Water Resour. Res. 2021, 57. [Google Scholar] [CrossRef]
  3. Khanam, M.; Sofia, G.; Koukoula, M.; Lazin, R.; Nikolopoulos, E.I.; Shen, X.; Anagnostou, E.N. Impact of compound flood event on coastal critical infrastructures considering current and future climate. Nat. Hazards Earth Syst. Sci. 2021, 21, 587–605. [Google Scholar] [CrossRef]
  4. Hsiao, S.-C.; Chiang, W.-S.; Jang, J.-H.; Wu, H.-L.; Lu, W.-S.; Chen, W.-B.; Wu, Y.-T. Flood risk influenced by the compound effect of storm surge and rainfall under climate change for low-lying coastal areas. Sci. Total Environ. 2020, 764, 144439. [Google Scholar] [CrossRef]
  5. Couasnon, A.; Eilander, D.; Muis, S.; Veldkamp, T.I.E.; Haigh, I.D.; Wahl, T.; Winsemius, H.C.; Ward, P.J. Measuring compound flood potential from river discharge and storm surge extremes at the global scale. Nat. Hazards Earth Syst. Sci. 2020, 20, 489–504. [Google Scholar] [CrossRef] [Green Version]
  6. Zscheischler, J.; Martius, O.; Westra, S.; Bevacqua, E.; Raymond, C.; Horton, R.M.; van den Hurk, B.; AghaKouchak, A.; Jézéquel, A.; Mahecha, M.D.; et al. A typology of compound weather and climate events. Nat. Rev. Earth Environ. 2020, 1, 333–347. [Google Scholar] [CrossRef]
  7. Wu, W.; Westra, S.; Leonard, M. Estimating the probability of compound floods in estuarine regions. Hydrol. Earth Syst. Sci. 2021, 25, 2821–2841. [Google Scholar] [CrossRef]
  8. Bevacqua, E.; Maraun, D.; Haff, I.H.; Widmann, M.; Vrac, M. Multivariate statistical modelling of compound events via pair-copula constructions: Analysis of floods in Ravenna (Italy). Hydrol. Earth Syst. Sci. 2017, 21, 2701–2723. [Google Scholar] [CrossRef] [Green Version]
  9. Kumbier, K.; Carvalho, R.C.; Vafeidis, A.T.; Woodroffe, C.D. Investigating compound flooding in an estuary using hydrodynamic modelling: A case study from the Shoalhaven River, Australia. Nat. Hazards Earth Syst. Sci. 2018, 18, 463–477. [Google Scholar] [CrossRef] [Green Version]
  10. Paprotny, D.; Vousdoukas, M.I.; Morales-Nápoles, O.; Jonkman, S.N.; Feyen, L. Compound flood potential in Europe. Hydrology Earth Syst. Sci. Discuss. 2018, 1–34. [Google Scholar] [CrossRef] [Green Version]
  11. Bevacqua, E.; Maraun, D.; Vousdoukas, M.I.; Voukouvalas, E.; Vrac, M.; Mentaschi, L.; Widmann, M. Higher probability of compound flooding from precipitation and storm surge in Europe under anthropogenic climate change. Sci. Adv. 2019, 5, eaaw5531. [Google Scholar] [CrossRef] [PubMed] [Green Version]
  12. Paprotny, D.; Morales-Nápoles, O.; Jonkman, S.N. HANZE: A pan-European database of exposure to natural hazards and damaging historical floods since 1870. Earth Syst. Sci. Data 2018, 10, 565–581. [Google Scholar] [CrossRef] [Green Version]
  13. Blöschl, G.; Hall, J.; Viglione, A.; Perdigão, R.A.; Parajka, J.; Merz, B.; Lun, D.; Arheimer, B.; Aronica, G.T.; Bilibashi, A.; et al. Changing climate both increases and decreases European river floods. Nature 2019, 573, 108–111. [Google Scholar] [CrossRef]
  14. Blöschl, G.; Hall, J.; Parajka, J.; Perdigão, R.A.P.; Merz, B.; Arheimer, B.; Aronica, G.T.; Bilibashi, A.; Bonacci, O.; Borga, M.; et al. Changing climate shifts timing of European floods. Science 2017, 357, 588–590. [Google Scholar] [CrossRef] [Green Version]
  15. Thober, S.; Kumar, R.; Wanders, N.; Marx, A.; Pan, M.; Rakovec, O.; Samaniego, L.; Sheffield, J.; Wood, E.F.; Zink, M. Multi-model ensemble projections of European river floods and high flows at 1.5, 2, and 3 degrees global warming. Environ. Res. Lett. 2018, 13, 014003. [Google Scholar] [CrossRef]
  16. Donnelly, C.; Greuell, W.; Andersson, J.; Gerten, D.; Pisacane, G.; Roudier, P.; Ludwig, F. Impacts of climate change on European hydrology at 1.5, 2 and 3 degrees mean global warming above preindustrial level. Clim. Change 2017, 143, 13–26. [Google Scholar] [CrossRef] [Green Version]
  17. Kundzewicz, Z.W.; Krysanova, V.; Dankers, R.; Hirabayashi, Y.; Kanae, S.; Hattermann, F.F.; Huang, S.; Milly, P.C.D.; Stoffel, M.; Driessen, P.; et al. Differences in flood hazard projections in Europe – their causes and consequences for decision making. Hydrol. Sci. J. 2017, 62, 1–14. [Google Scholar] [CrossRef] [Green Version]
  18. Stonevičius, E.; Valiuškevičius, G.; Rimkus, E.; Kažys, J. Climate induced changes of Lithuanian rivers runoff in 1960–2009. Water Resour. 2014, 41, 592–603. [Google Scholar] [CrossRef]
  19. Šarauskienė, D.; Akstinas, V.; Kriaučiūnienė, J.; Jakimavičius, D.; Bukantis, A.; Kažys, J.; Pliuraitė, V. Projection of Lithuanian river runoff, temperature and their extremes under climate change. Hydrol. Res. 2018, 49, 344–362. [Google Scholar] [CrossRef]
  20. Rimkus, E.; Kažys, J.; Bukantis, A. Gausių kritulių Lietuvoje prognozė XXI amžiui pagal regioninį CCLM modelį (Forecast of heavy rainfall in Lithuania for the 21st century according to the regional CCLM model). Geografija 2009, 45, 122–130. [Google Scholar]
  21. On the approval of the list of criteria for extreme events. Resolution of the Government of the Republic of Lithuania: 9 March 2006 No. 29-1004. Lietuvos Respublikos Vyriausybės Nutarimas dėl Ekstremaliųjų įvykių Kriterijų Sąrašo Patvirtinimo 2006m. Kovo 9 d. Nr. 29-1004. Available online: https://e-seimas.lrs.lt/portal/legalAct/lt/TAD/TAIS.271723/asr (accessed on 5 May 2021).
  22. Rimkus, E.; Kažys, J.; Bukantis, A.; Krotovas, A. Temporal variation of extreme precipitation events in Lithuania. Oceanologia 2011, 53, 259–277. [Google Scholar] [CrossRef] [Green Version]
  23. Keršytė, D.; Rimkus, E.; Kažys, J. Klimato rodiklių scenarijai Lietuvos teritorijoje XXI a [Scenarios of climate indicators in the territory of Lithuania in the 21st century]. Geol. Geogr. 2015, 1. [Google Scholar] [CrossRef]
  24. Jakimavičius, D.; Kriaučiūnienė, J.; Šarauskienė, D. Impact of climate change on the Curonian Lagoon water balance components, salinity and water temperature in the 21st century. Oceanologia 2018, 60, 378–389. [Google Scholar] [CrossRef]
  25. Update of the Preliminary Flood Risk Assessment 2011-2018. Environmental Protection Agency. Preliminaraus Potvynių Rizikos Vertinimo Atnaujinimas 2011—2018 m. Aplinkos Apsaugos Agentūra. Available online: https://vanduo.old.gamta.lt/files/Preliminary_flood_risk_assessment_2011_2018.pdf (accessed on 5 May 2021).
  26. Romanescu, G.; Stoleriu, C.C. Exceptional floods in the Prut basin, Romania, in the context of heavy rains in the summer of 2010. Nat. Hazards Earth Syst. Sci. 2017, 17, 381–396. [Google Scholar] [CrossRef] [Green Version]
  27. Kreienkamp, F.; Philip, S.Y.; Tradowsky, J.S.; Kew, S.F.; Lorenz, P.; Arrighi, J.; Belleflamme, A.; Bettmann, T.; Caluwaerts, S.; Chan, S.C.; et al. Rapid Attribution of Heavy Rainfall Events Leading to the Severe Flooding in Western Europe During July 2021. Available online: http://hdl.handle.net/1854/LU-8732135 (accessed on 9 September 2021).
  28. Moftakhari, H.R.; Salvadori, G.; AghaKouchak, A.; Sanders, B.; Matthew, R.A. Compounding effects of sea level rise and fluvial flooding. Proc. Natl. Acad. Sci. USA 2017, 114, 9785–9790. [Google Scholar] [CrossRef] [Green Version]
  29. Allen, M.R.; Dube, O.P.; Solecki, W.; Aragón-Durand, F.; Cramer, W.; Humphreys, S.; Kainuma, M.; Kala, J.; Mahowald, N.; Mulugetta, Y.; et al. Framing and Context. In Global Warming of 1.5 °C. An IPCC Special Report on the Impacts of Global Warming of 1.5 °C Above Pre-Industrial Levels and Related Global Greenhouse Gas Emission Pathways, in the Context of Strengthening the Global Response to the Threat of Climate Change, Sustainable Development, and Efforts to Eradicate Poverty; 2018; Available online: https://www.ipcc.ch/sr15/chapter/chapter-1/ (accessed on 9 September 2021).
  30. IPCC Summary for Policymakers. Climate Change and Land: An IPCC Special Report on Climate Change, Desertification, Land Degradation, Sustainable Land Management, Food Security, and Greenhouse Gas Fluxes in Terrestrial Ecosystems. 2019. Available online: https://www.ipcc.ch/srccl/chapter/summary-for-policymakers/ (accessed on 9 September 2021).
  31. WMO. Provisional Report: The State of the Global Climate 2020. Available online: https://public.wmo.int/en/our-mandate/climate/wmo-statement-state-of-global-climate (accessed on 17 August 2021).
  32. Omstedt, A.; Elken, J.; Lehmann, A.; Leppäranta, M.; Meier HE, M.; Myrberg, K.; Rutgersson, A. Progress in physical oceanography of the Baltic Sea during the 2003–2014 period. Prog. Oceanogr. 2014, 128, 139–171. [Google Scholar] [CrossRef]
  33. Gräwe, U.; Klingbeil, K.; Kelln, J.; Dangendorf, S. Decomposing Mean Sea Level Rise in a Semi-Enclosed Basin, the Baltic Sea. J. Clim. 2019, 32, 3089–3108. [Google Scholar] [CrossRef]
  34. Approval of the Preliminary Flood Risk Assessment Report. Order of the Minister of the Environment of the Republic of Lithuania: 11 January 2012 No. D1-23. Lietuvos Respublikos Aplinkos Ministro Įsakymas dėl Preliminaraus Potvynių Rizikos Vertinimo Ataskaitos Patvirtinimo 2012m. Sausio 11 d. Nr. D1-23. Available online: https://e-seimas.lrs.lt/portal/legalAct/lt/TAD/TAIS.417035?jfwid=q86m1vvfu (accessed on 17 May 2021).
  35. BACC II Author Team. Second Assessment of Climate Change for the Baltic Sea Basin; Springer: Cham, Swizerland, 2015; ISBN 978-3-31-916005-4. [Google Scholar]
  36. Richter, A.; Groh, A.; Dietrich, R. Geodetic observation of sea-level change and crustal deformation in the Baltic Sea region. Phys. Chem. Earth Parts A/B/C 2012, 53–54, 43–53. [Google Scholar] [CrossRef]
  37. Poutanen, M.; Steffen, H. Land uplift at Kvarken Archipelago/high coast UNESCO World Heritage area. Geophysica 2015, 50, 49–64. [Google Scholar]
  38. On the Approval of the Program for the Development of the Water Sector for 2017–2023; Resolution of the Government of the Republic of Lithuania: 1 Februrary 2017 No. 88. Lietuvos Respublikos Vyriausybės Nutarimas dėl Vandenų Srities Plėtros 2017-2023 Metų Programos Patvirtinimo 2017m. Vasario 1 d. Nr. 88. Available online: https://e-seimas.lrs.lt/portal/legalAct/lt/TAD/4606c421eea211e6be918a531b2126ab?jfwid=-wd7z6lfxo (accessed on 25 May 2021).
  39. Stonevičius, E.; Valiuškevičius, G.; Rimkus, E.; Kažys, J. Potvynių Smeltėje Poveikio Švelninimo Ir Adapatacijos Prie Jų Galimybės Atsižvelgiant Į Numatomus Klimato Pokyčius (Possibilities Of Mitigation And Adaptation To The Effects Of Floods In Smelte Taking Into Account The Expected Climate Change); Vilnius University: Vilnius, Lithuania, 2010. [Google Scholar] [CrossRef]
  40. Dubra, V.; Abromas, J. Flood risk and planning of recreational territories in the Akmena-Danė River Basin Of Western Lithuania/Potvynių rizika ir rekreacinių teritorijų planavimas Vakarų Lietuvos Akmenos–Danės Upės Baseine. J. Arch. Urban. 2012, 36, 99–106. [Google Scholar] [CrossRef]
  41. Jakimavičius, D.; Kovalenkovienė, M. Long-term water balance of the Curonian Lagoon in the context of anthropogenic factors and climate change. Baltica 2010, 23, 33–46. [Google Scholar]
  42. Dailidienė, I.; Davulienė, L.; Kelpšaitė, L.; Razinkovas, A. Analysis of the Climate Change in Lithuanian Coastal Areas of the Baltic Sea. J. Coast. Res. 2012, 282, 557–569. [Google Scholar] [CrossRef]
  43. Dailidienė, I.; Davulienė, L.; Tilickis, B.; Stankevičius, A.; Myrberg, K. Sea level variability at the Lithuanian coast of the Baltic Sea. Boreal Environ. Res. 2006, 11, 109–121. [Google Scholar]
  44. Dailidienė, I.; Baudler, H.; Chubarenko, B.; Navrotskaya, S. Long term water level and surface temperature changes in the lagoons of the southern and eastern Baltic. Oceanologia 2011, 53, 293–308. [Google Scholar] [CrossRef] [Green Version]
  45. Meier, H.; Broman, B.; Kjellström, E. Simulated sea level in past and future climates of the Baltic Sea. Clim. Res. 2004, 27, 59–75. [Google Scholar] [CrossRef]
  46. Wolski, T.; Wiśniewski, B. Characteristics and Long-Term Variability of Occurrences of Storm Surges in the Baltic Sea. Atmosphere 2021, 12, 1679. [Google Scholar] [CrossRef]
  47. Implementation of the Floods Directive. Environmental Protection Agency 2018. Potvynių Direktyvos įgyvendinimas. Aplinkos Apsaugos Agentūra. Available online: https://vanduo.old.gamta.lt/cms/index?rubricId=6d87deab-3ecc-412a-9b66-7fd6361f26ba (accessed on 28 April 2021).
  48. Kilkus, K.; Stonevičius, E. Lietuvos Vandenų Geografija (Geography Of Lithuanian Waters); Vilnius University: Vilnius, Lithuania, 2011. [Google Scholar]
  49. Lietuvos Nacionalinis Atlasas (Lithuanian National Atlas). Nacionalinė Žemės Tarnyba Prie Žemės Ūkio Ministerijos [National Land Service under the Ministry of Agriculture]: Vilnius, Lithuania, 2014; ISBN 9786094204050.
  50. Meier, H.E.M.; Kniebusch, M.; Dieterich, C.; Gröger, M.; Zorita, E.; Elmgren, R.; Myrberg, K.; Ahola, M.; Bartosova, A.; Bonsdorff, E.; et al. Climate Change in the Baltic Sea Region: A Summary. Earth Syst. Dynam. Discuss. 2021. [preprint] In review. [Google Scholar] [CrossRef]
  51. Stocker, T.F.; Qin, D.; Plattner, G.K.; Alexander, L.V.; Allen, S.K.; Bindoff, N.L.; Bréon, F.M.; Church, J.A.; Cubasch, U.; Emori, S.; et al. Technical summary. In Climate Change 2013: The Physical Science Basis. Contribution Of Working Group I to the Fifth Assessment Report of the Intergovernmental Panel on Climate Change; Cambridge University Press: Cambridge, UK.
  52. IPCC 2021: Summary for Policymakers. In Climate Change 2021: The Physical Science Basis Contribution of Working Group I to the Sixth Assessment Report of the Intergovernmental Panel on Climate Change; Masson-Delmotte, V.; Zhai, P.A.; Pirani, S.L.; Connors, C.; Péan, S.; Berger, N.; Caud, Y.; Chen, L.; Goldfarb, M.I.; Gomis, M.; et al. (Eds.) Cambridge University Press; in press.
  53. Climate Change in the Baltic Sea. 2021 Fact Sheet. Baltic Sea Environment Proceedings no. 180. HELCOM/Baltic Earth 2021; Helsinki Commission – HELCOM: Helsinki, Finland.
  54. IPCC 2019: Technical Summary. In IPCC Special Report on the Ocean and Cryosphere in a Changing Climate; Pörtner, H.-O.; Roberts, D.C.; Masson-Delmotte, V.; Zhai, P.; Tignor, M.; Poloczanska, E.; Mintenbeck, K.; Alegría, A.; Nicolai, M.; Okem, A. (Eds.) In press; Available online: https://www.ipcc.ch/site/assets/uploads/sites/3/2019/12/SROCC_FullReport_FINAL.pdf (accessed on 9 September 2021).
  55. Environmental Protection Agency under the Ministry of Environment. 2014. River Valley Digital Terrain Model. Retrieved From Spatial Information Portal of Lithuania. Available online: https://www.geoportal.lt/metadata-catalog/catalog/search/resource/details.page?uuid=%7BB66494B9-7495-8344-D0F0-8C4857014F76%7D (accessed on 9 September 2021).
  56. Leppäranta, M.; Myrberg, K. Physical Oceanography of the Baltic Sea; Springer: Berlin/Heidelberg, Germany, 2009; ISBN 978-3-540-79703-6. [Google Scholar]
  57. Zakharchuk, E.A.; Tikhonova, N.; Zakharova, E.; Kouraev, A.V. Spatiotemporal structure of Baltic free sea level oscillations in barotropic and baroclinic conditions from hydrodynamic modelling. Ocean Sci. 2021, 17, 543–559. [Google Scholar] [CrossRef]
  58. Jakimavičius, D.; Kriauciuniene, J. The climate change impact on the water balance of the Curonian Lagoon. Water Resour. 2013, 40, 120–132. [Google Scholar] [CrossRef]
  59. Arustienė, J.; Bukantis, A.; Damušytė, A.; Jarmalavičius, D.; Kažys, J.; Kriukaitė, J.; Ramanauskienė, V.; Rimkus, E.; Stonevičius, E.; Valiuškevičius, G.; et al. Klimato Kaita Klaipėdos Mieste Ir Rajone: Poveikis, Kaina Ir Prisitaikymas (Climate Change In Klaipeda City And District: Impact, Price And Adaptation); Vilnius University: Vilnius, Lithuania, 2012. [Google Scholar]
  60. Soomere, T.; Pindsoo, K. Spatial variability in the trends in extreme storm surges and weekly-scale high water levels in the eastern Baltic Sea. Cont. Shelf Res. 2016, 115, 53–64. [Google Scholar] [CrossRef]
  61. Weisse, R.; Bellafiore, D.; Menendez, M.; Méndez, F.; Nicholls, R.J.; Umgiesser, G.; Willems, P. Changing extreme sea levels along European coasts. Coast. Eng. 2013, 87, 4–14. [Google Scholar] [CrossRef] [Green Version]
  62. Torresan, S.; Critto, A.; Rizzi, J.; Marcomini, A. Assessment of coastal vulnerability to climate change hazards at the regional scale: The case study of the North Adriatic Sea. Nat. Hazards Earth Syst. Sci. 2012, 12, 2347–2368. [Google Scholar] [CrossRef]
  63. Camus, P.; Tomás, A.; Díaz-Hernández, G.; Rodríguez, B.; Izaguirre, C.; Losada, I. Probabilistic assessment of port operation downtimes under climate change. Coast. Eng. 2019, 147, 12–24. [Google Scholar] [CrossRef]
  64. Vousdoukas, M.I.; Mentaschi, L.; Hinkel, J.; Ward, P.J.; Mongelli, I.; Ciscar, J.-C.; Feyen, L. Economic motivation for raising coastal flood defenses in Europe. Nat. Commun. 2020, 11, 2119. [Google Scholar] [CrossRef] [PubMed]
  65. Suursaar, Ü.; Jaagus, J.; Tõnisson, H. How to quantify long-term changes in coastal sea storminess? Estuarine Coast. Shelf Sci. 2015, 156, 31–41. [Google Scholar] [CrossRef]
  66. EU. Directive 2008/56/EC of the European Parliament and of the Council of 17 June 2008 Establishing a Framework for Community Action in the Field of Marine Environmental Policy (Marine Strategy Framework Directive) (Official Journal of the European Union, 2008). Available online: https://eur-lex.europa.eu/legal-content/EN/TXT/HTML/?uri=CELEX:52020DC0259&from=EN (accessed on 13 June 2021).
  67. EU. Communication from the Commission to the European Parliament, the Council, the European Economic and Socal Committee and the Committee of the Regions. Forging a Climate-Resilient Europe—The New EU Strategy on Adaptation to Climate Change. Off. J. Eur. Union 2021. Available online: https://eur-lex.europa.eu/legal-content/EN/TXT/?uri=COM:2021:82:FIN (accessed on 16 August 2021).
  68. General Plan of Klaipėda City municipality. Solutions. Explanatory Note. Administration Of Klaipėda City Municipality 2019. Klaipėdos Miesto Savivaldybės Bendrasis Planas. Sprendiniai. Aiškinamasis Raštas. Klaipėdos Miesto Savivaldybės Adminis-Tracija 2019. Available online: https://www.klaipeda.lt/data/public/uploads/2021/03/klaipedos-bp-aiskinamasis-rastas-2021-03-09.pdf (accessed on 15 April 2021).
Figure 1. The study area: southeastern part (SE) of the Baltic Sea (a); the Klaipėda Strait, which connects the Curonian Lagoon with the SE Baltic Sea and the Akmena–Danė River (b); Klaipėda city (c).
Water 14 00414 g001
Figure 2. Boundary of the Last Glacial (a); Quaternary-type sediment of the Danė River shore area (b) [49].
Water 14 00414 g002
Figure 3. Danė River riverbank types in the central and northern parts of Klaipėda city.
Water 14 00414 g003
Figure 4. Components of the compound Akmena–Danė River flood scenarios in Klaipėda city.
Water 14 00414 g004
Figure 5. Mean and maximal sea level change (cm, in the BS—Baltic Sea height altitude system) in the Klaipėda Strait, 1902–2018 (maximum water level rise trend, R2 = 0.13).
Water 14 00414 g005
Figure 6. Inundated areas according to three river discharge probabilities (i.e., mean annual maximum, 10-year flood, and 100-year flood) at each water level of the Klaipėda Strait, where the mean water level is 0 m, the 10-year water level is 1.4 m, and the 100-year water level is 2 m.
Water 14 00414 g006
Figure 7. Inundated areas with climate change impact according to three river discharge probabilities (i.e., mean annual maximum, 10-year flood, and 100-year flood) at each water level of the Klaipėda Strait, where the mean water level is 1 m, 10-year water level is 2.4 m, and the 100-year water level is 3 m.
Water 14 00414 g007
Figure 8. Inundated areas with and without climate change impact according to Klaipėda Strait water level scenarios when the Danė River discharge is at the mean annual maximum (59 m3/s).
Water 14 00414 g008
Table 1. Inundated built-up and non-built-up areas (m2) and their share (%) of the total Klaipėda city area according to different compound flood scenarios without climate change impact.
Danė River Discharge ProbabilitiesMean Water Level (0 m)10-Year Water Level (1.4 m)100-Year Water Level (2 m)
Built-Up Areas (m2) and Their Share of the City (%)Non-Built-Up Areas (m2) and Their Share of the City (%)Built-Up Areas (m2) and Their Share of the City (%)Non-Built-Up Areas (m2) and Their Share of the City (%)Built-Up Areas (m2) and Their Share of the City (%)Non-Built-Up Areas (m2) and Their Share of the City (%)
Mean annual maximum (59 m3/s)59,050 m2
0.06%
778,876 m2
0.79%
150,266 m2
0.15%
1,253,247 m2
1.28%
460,798 m2
0.47%
1,545,648 m2
1.58%
10-year flood (110 m3/s)120,542 m2
0.12%
1,177,366 m2
1.20%
270,219 m2
0.28%
1,554,002 m2
1.59%
564,255 m2
0.57%
1,728,977 m2
1.76%
100-year flood (156 m3/s)172,234 m2
0.18%
1,348,307 m2
1.38%
457,800 m2
0.48%
1,771,515 m2
1.81%
746,531 m2
0.76%
1,920,754 m2
1.96%
Table 2. Inundated built-up and non-built-up areas (m2) and their share (%) of the total Klaipėda city area according to different compound flood scenarios with climate change impact.
Danė River Discharge ProbabilitiesMean Water Level (1 m)10-Year Water Level (2.4 m)100-Year Water Level (3 m)
Built-Up Areas (m2) and Their Share of the City (%)Non-Built-Up Areas (m2) and Their Share of the City (%) Built-Up Areas (m2) and Their Share of the City (%)Non-Built-Up Areas (m2) and Their Share of the City (%)Built-Up Areas (m2) and Their Share of the City (%)Non-Built-Up Areas (m2) and Their Share of the City (%)
Mean annual maximum (59 m3/s)72,144 m2
0.07%
859,115 m2
0.88%
713,795 m2
0.72%
1,698,349 m2
1.73%
1,155,293 m2
1.18%
1,890,011 m2
1.93%
10-year flood (110 m3/s)185,284 m2
0.19%
1,351,505 m2
1.38%
754,491 m2
0.77%
1,742,911 m2
1.78%
1,207,262 m2
1.23%
1,950,005 m2
1.99%
100-year flood (156 m3/s)277,191 m2
0.28%
1,599,240 m2
1.63%
798,927 m2
0.82%
1,794,667 m2
1.84%
1,369,597 m2
1.40%
2,080,402 m2
2.12%
Table 3. Difference between inundated built-up and non-built-up areas (m2) and their share of the city (%) scenarios without and with climate change.
Danė River Discharge ProbabilitiesMean Water Level 10-Year Water Level 100-Year Water Level
Built-Up Areas (m2) and Their Share of the City (%)Non-Built-Up Areas (m2) and Their Share of the City (%) Built-Up Areas (m2) and Their Share of the City (%)Non-Built-Up Areas (m2) and Their Share of the City (%)Built-Up Areas (m2) and Their Share of the City (%)Non-Built-Up Areas (m2) and Their Share of the City (%)
Mean annual maximum (59 m3/s)1309 m2
0.01%
80,239 m2
0.08%
563,529 m2
0.58%
445,102 m2
1.45%
694,495 m2
0.71%
344,363 m2
0.35%
10-year flood (110 m3/s)64,742 m2
0.07%
174,139 m2
0.18%
484,272 m2
0.49%
188,909 m2
0.19%
643,007 m2
0.66%
221,028 m2
0.23%
100-year flood (156 m3/s)104,957 m2
0.11%
250,933 m2
0.25%
341,127 m2
0.35%
23,152 m2
0.02%
623,066 m2
0.64%
159,648 m2
0.16%
Table 4. The number of buildings in the area lower than the flood water level according to different compound flood scenarios.
Without Climate Change ImpactWith Climate Change Impact
Mean Water Level (0)10-Year Water Level (1.4 m)100-Year Water Level (2 m)Mean Water Level (1 m)10-Year Water Level (2.4 m)100-Year Water Level (3 m)
Mean annual maximum river discharge (59 m3/s)6017835985549767
10-year flood river discharge (10 m3/s)144327491244573858
100-year flood river discharge (156 m3/s)209533668400616940
Table 5. Length of potentially affected roads according to different compound flood scenarios.
Without Climate Change ImpactWith Climate Change Impact
Mean Water Level (0)10-Year Water Level (1.4 m)100-Year Water Level (2 m)Mean Water Level (1 m)10-Year Water Level (2.4 m)100-Year Water Level (3 m)
Mean annual maximum river discharge (59 m3/s)800813,88025,576898931,26237,225
10-year flood river discharge (10 m3/s)10,05216,42927,51511,30831,77239,789
100-year flood river discharge (156 m3/s)10,62124,53031,96815,81132,14642,753
Publisher’s Note: MDPI stays neutral with regard to jurisdictional claims in published maps and institutional affiliations.

