1. Introduction
Karst rocks are among the most important aquifer formations in the world [
1,
2,
3,
4]. Approximately half of the Croatian territory is part of the Dinaric karst region, which is characterized by very deep karstification that is predefined by tectonics and a differentiated dissolution of carbonate rocks [
5]. It is difficult to represent this type of karst terrain in numerical models; hence, other methods should be employed, the combination of which can increase the quality of the interpretation. The coastal and island aquifers involve further complexity due to the possibility of seawater intrusions [
6]. As a consequence of Holocene changes in the global seawater level, the base of karstification in the Adriatic islands was much lower than it would have been according to the present sea level [
7,
8]. This means that aquifers can exist in much deeper zones, but it also enables seawater intrusion into the karst underground via much deeper karst conduits and joints within the rock mass.
Hydrogeological research into coastal aquifers all over the Mediterranean region show a wide variety of geological settings and hydrogeological issues [
9]. Additionally, due to climate changes, overexploitation, and pollution, they are being explored in several studies [
10,
11,
12,
13,
14].
The main problem concerning water supply from karst aquifers on islands is the high possibility of seawater intrusion, and only a few Croatian islands have secured a water supply from their own sources [
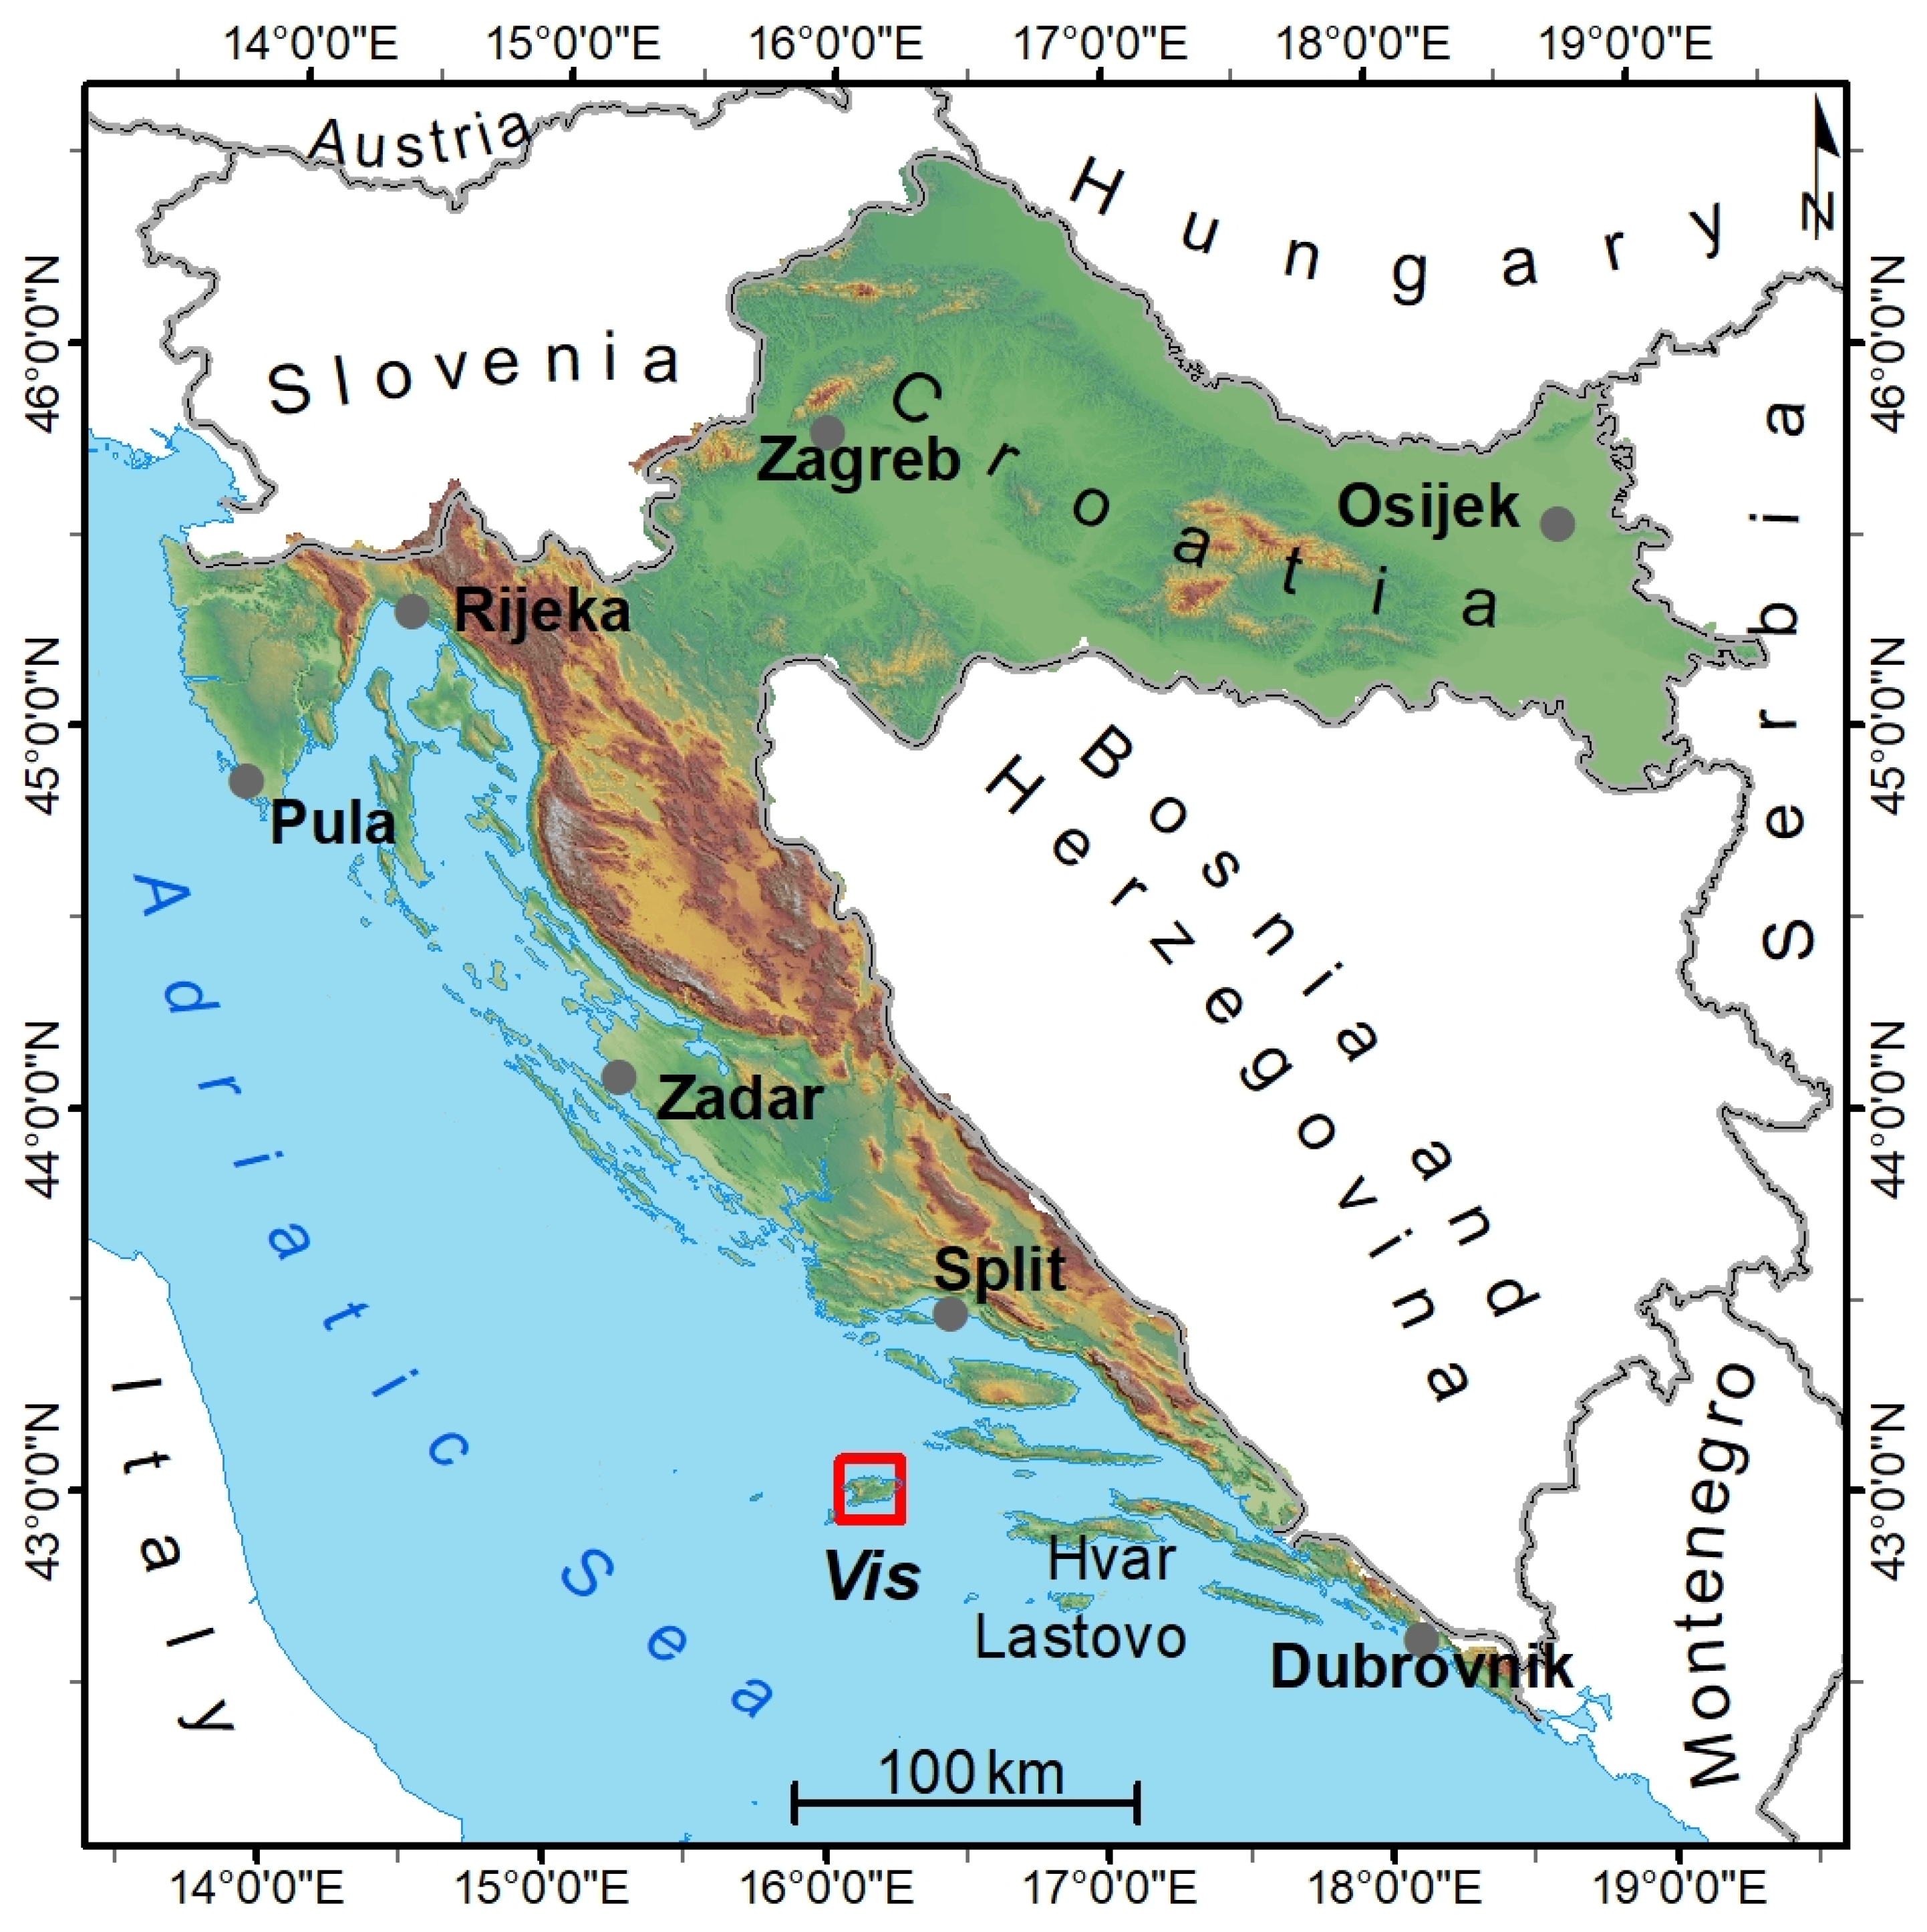
15]. Importantly, the majority of populated Croatian islands have a public water supply. Some have water pipelines connected to the mainland that serve either as the only source of public water supply or as a backup solution in the event of aquifer salinization. However, Vis Island is not connected to the mainland due to its remote position (
Figure 1), and instead relies exclusively on its own water resources. In fact, Vis is fortunate in having probably one of the best water supplies originating from an island aquifer.
The main goals of the present research of Vis Island are to: (1) determine the discharge from wells and springs and hence the groundwater dynamics; (2) to delineate sanitary protection zones (SPZ); and (3) to suggest possible locations for drilling additional observation and extraction wells in the future.
2. Physical Setting (Geography, Morphology, Geology, and Hydrogeology)
Vis Island is situated in the central part of the Croatian Adriatic coast (
Figure 1).
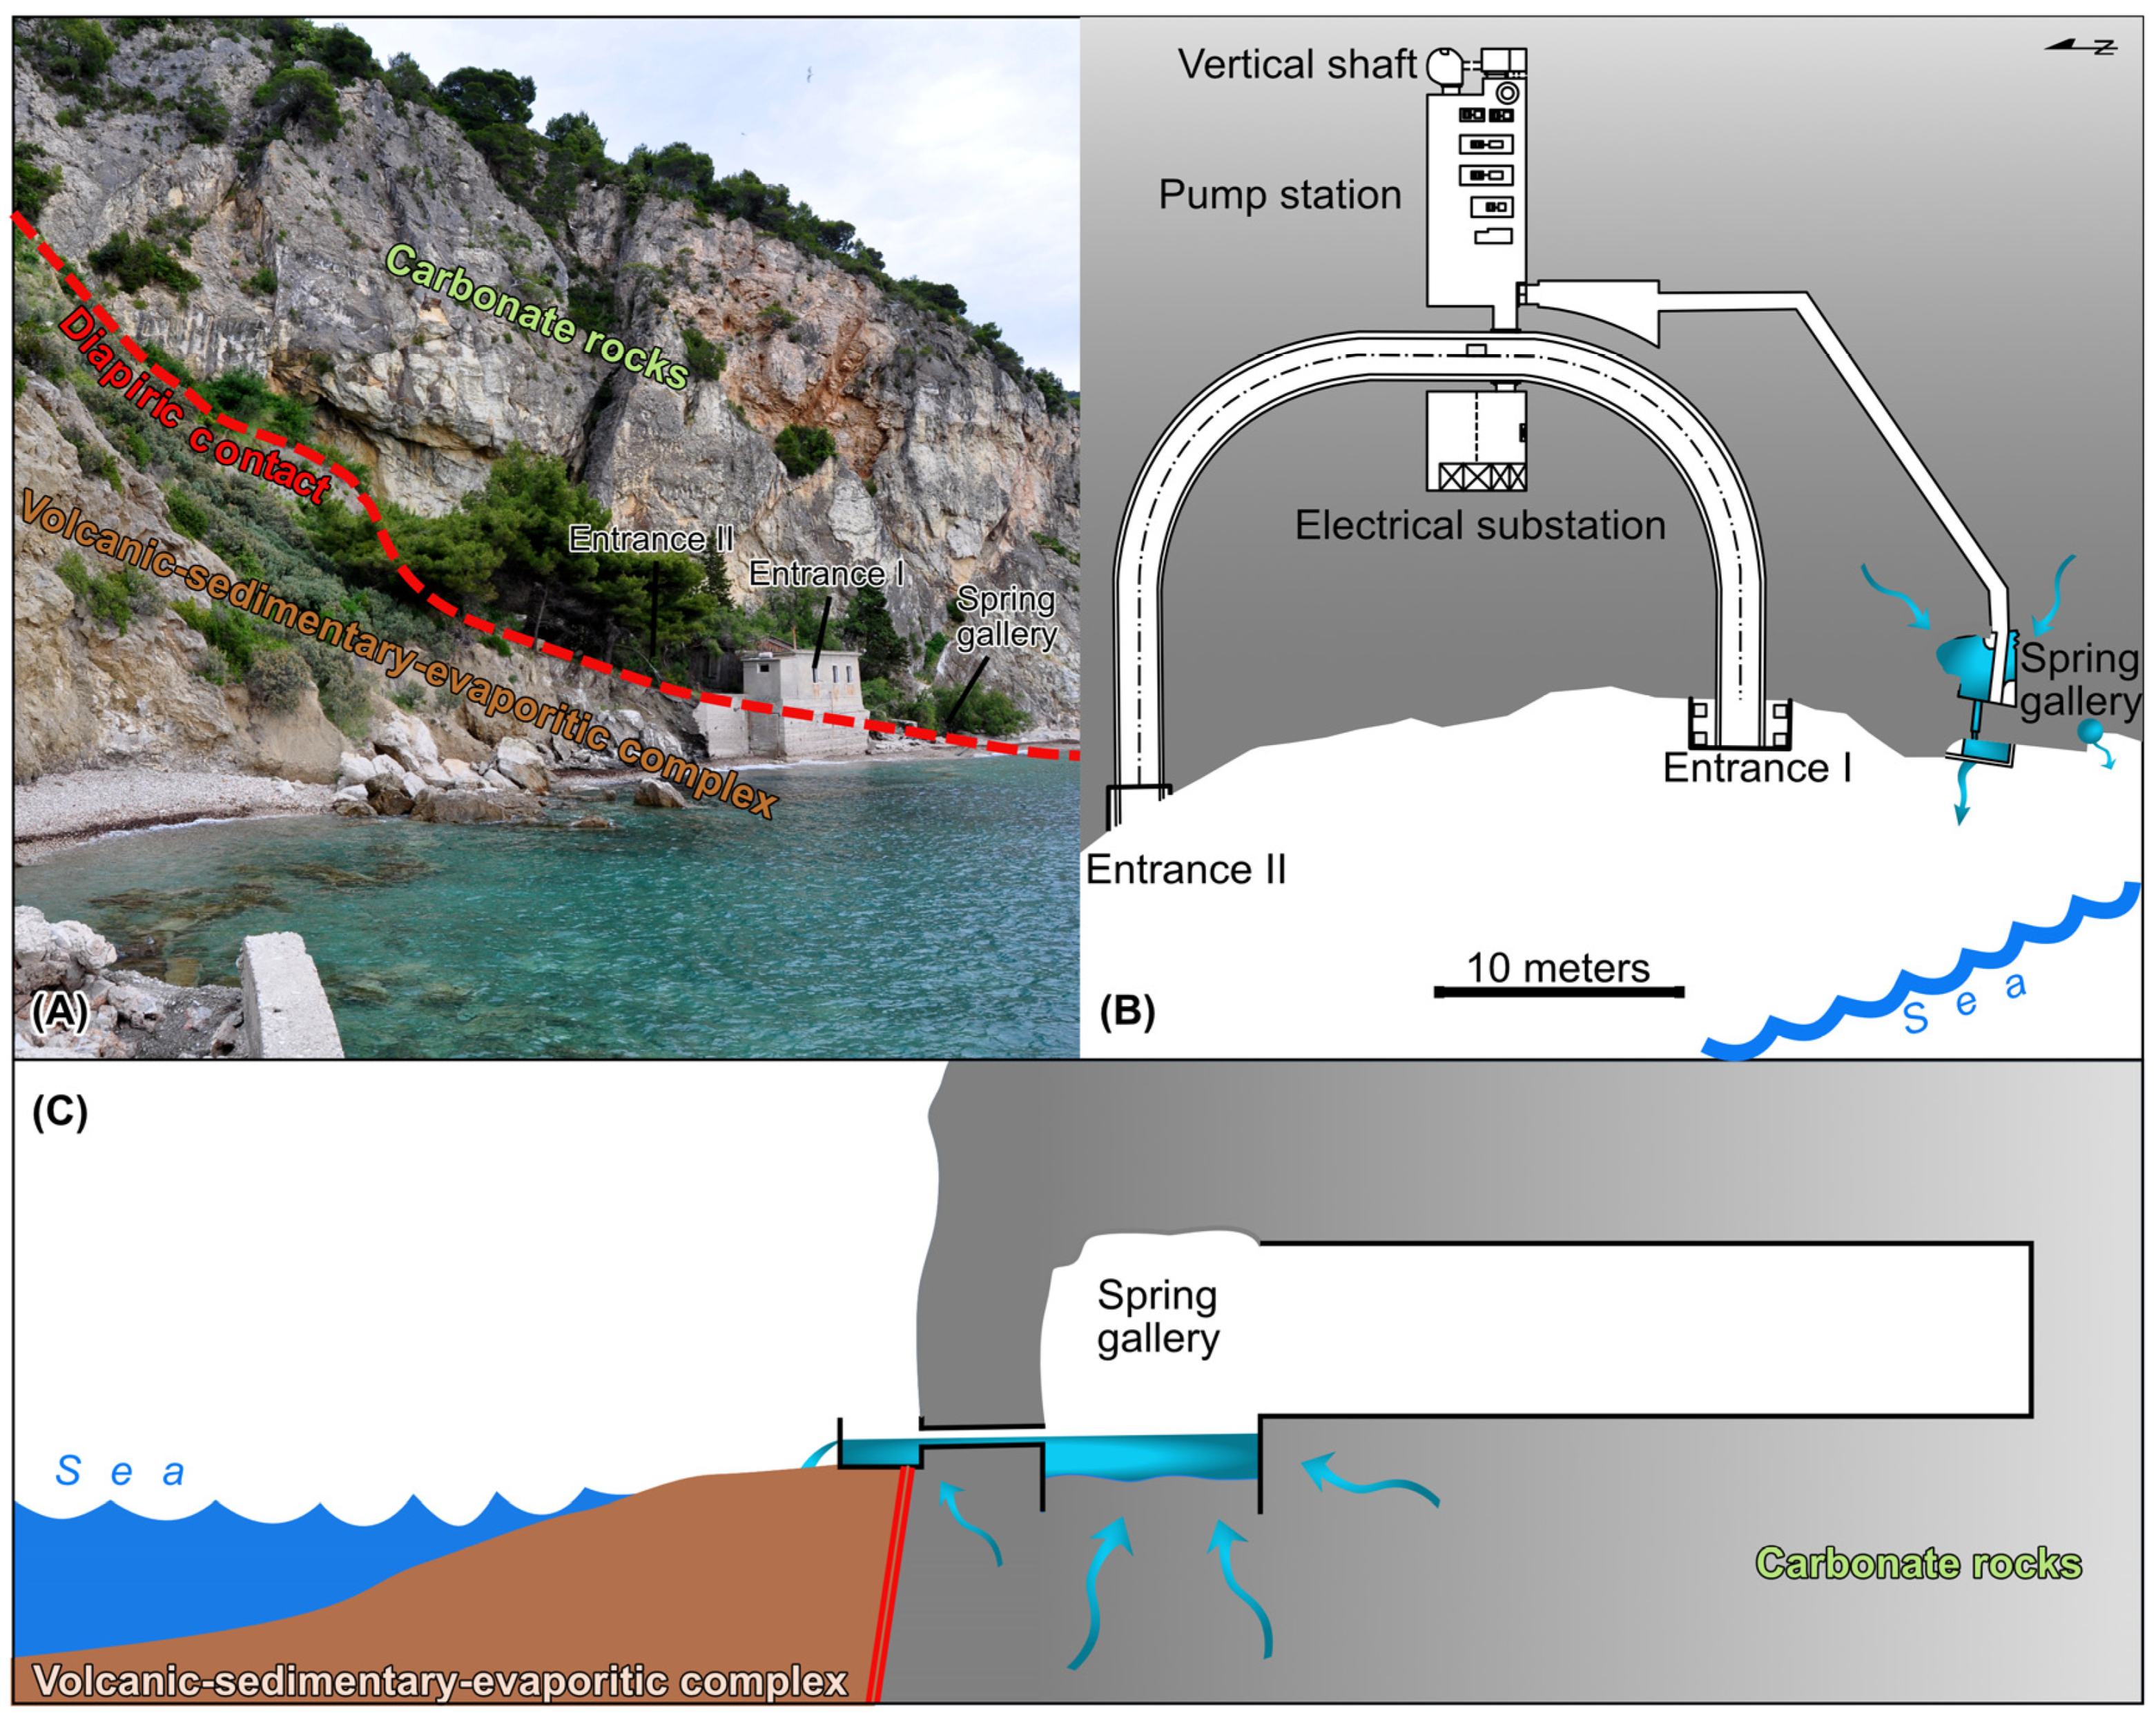
Its distance from the city of Split on the mainland is 55 km. The largest settlements on the island are Vis and Komiža, which are connected to the public water supply along with all other populated settlements. The water supply system includes drilled wells in Korita and a coastal karst spring Pizdica. A borehole has also been drilled near Komiža (well K-1) and is being prepared for inclusion in the water supply system. Other analyzed features were either small springs (Kamenice), boreholes (Velo žalo, VP-1, VP-2, DP-1) with a low yield, or pit (dug) wells (Dragevode, Gusarica). The intake structure of the spring extraction site in Pizdica was excavated into carbonate rock by mining in the 1950s (
Figure 2) in order to supply water (minimum capacity of 3.3 L/s) to the army/navy in case of nuclear warfare.
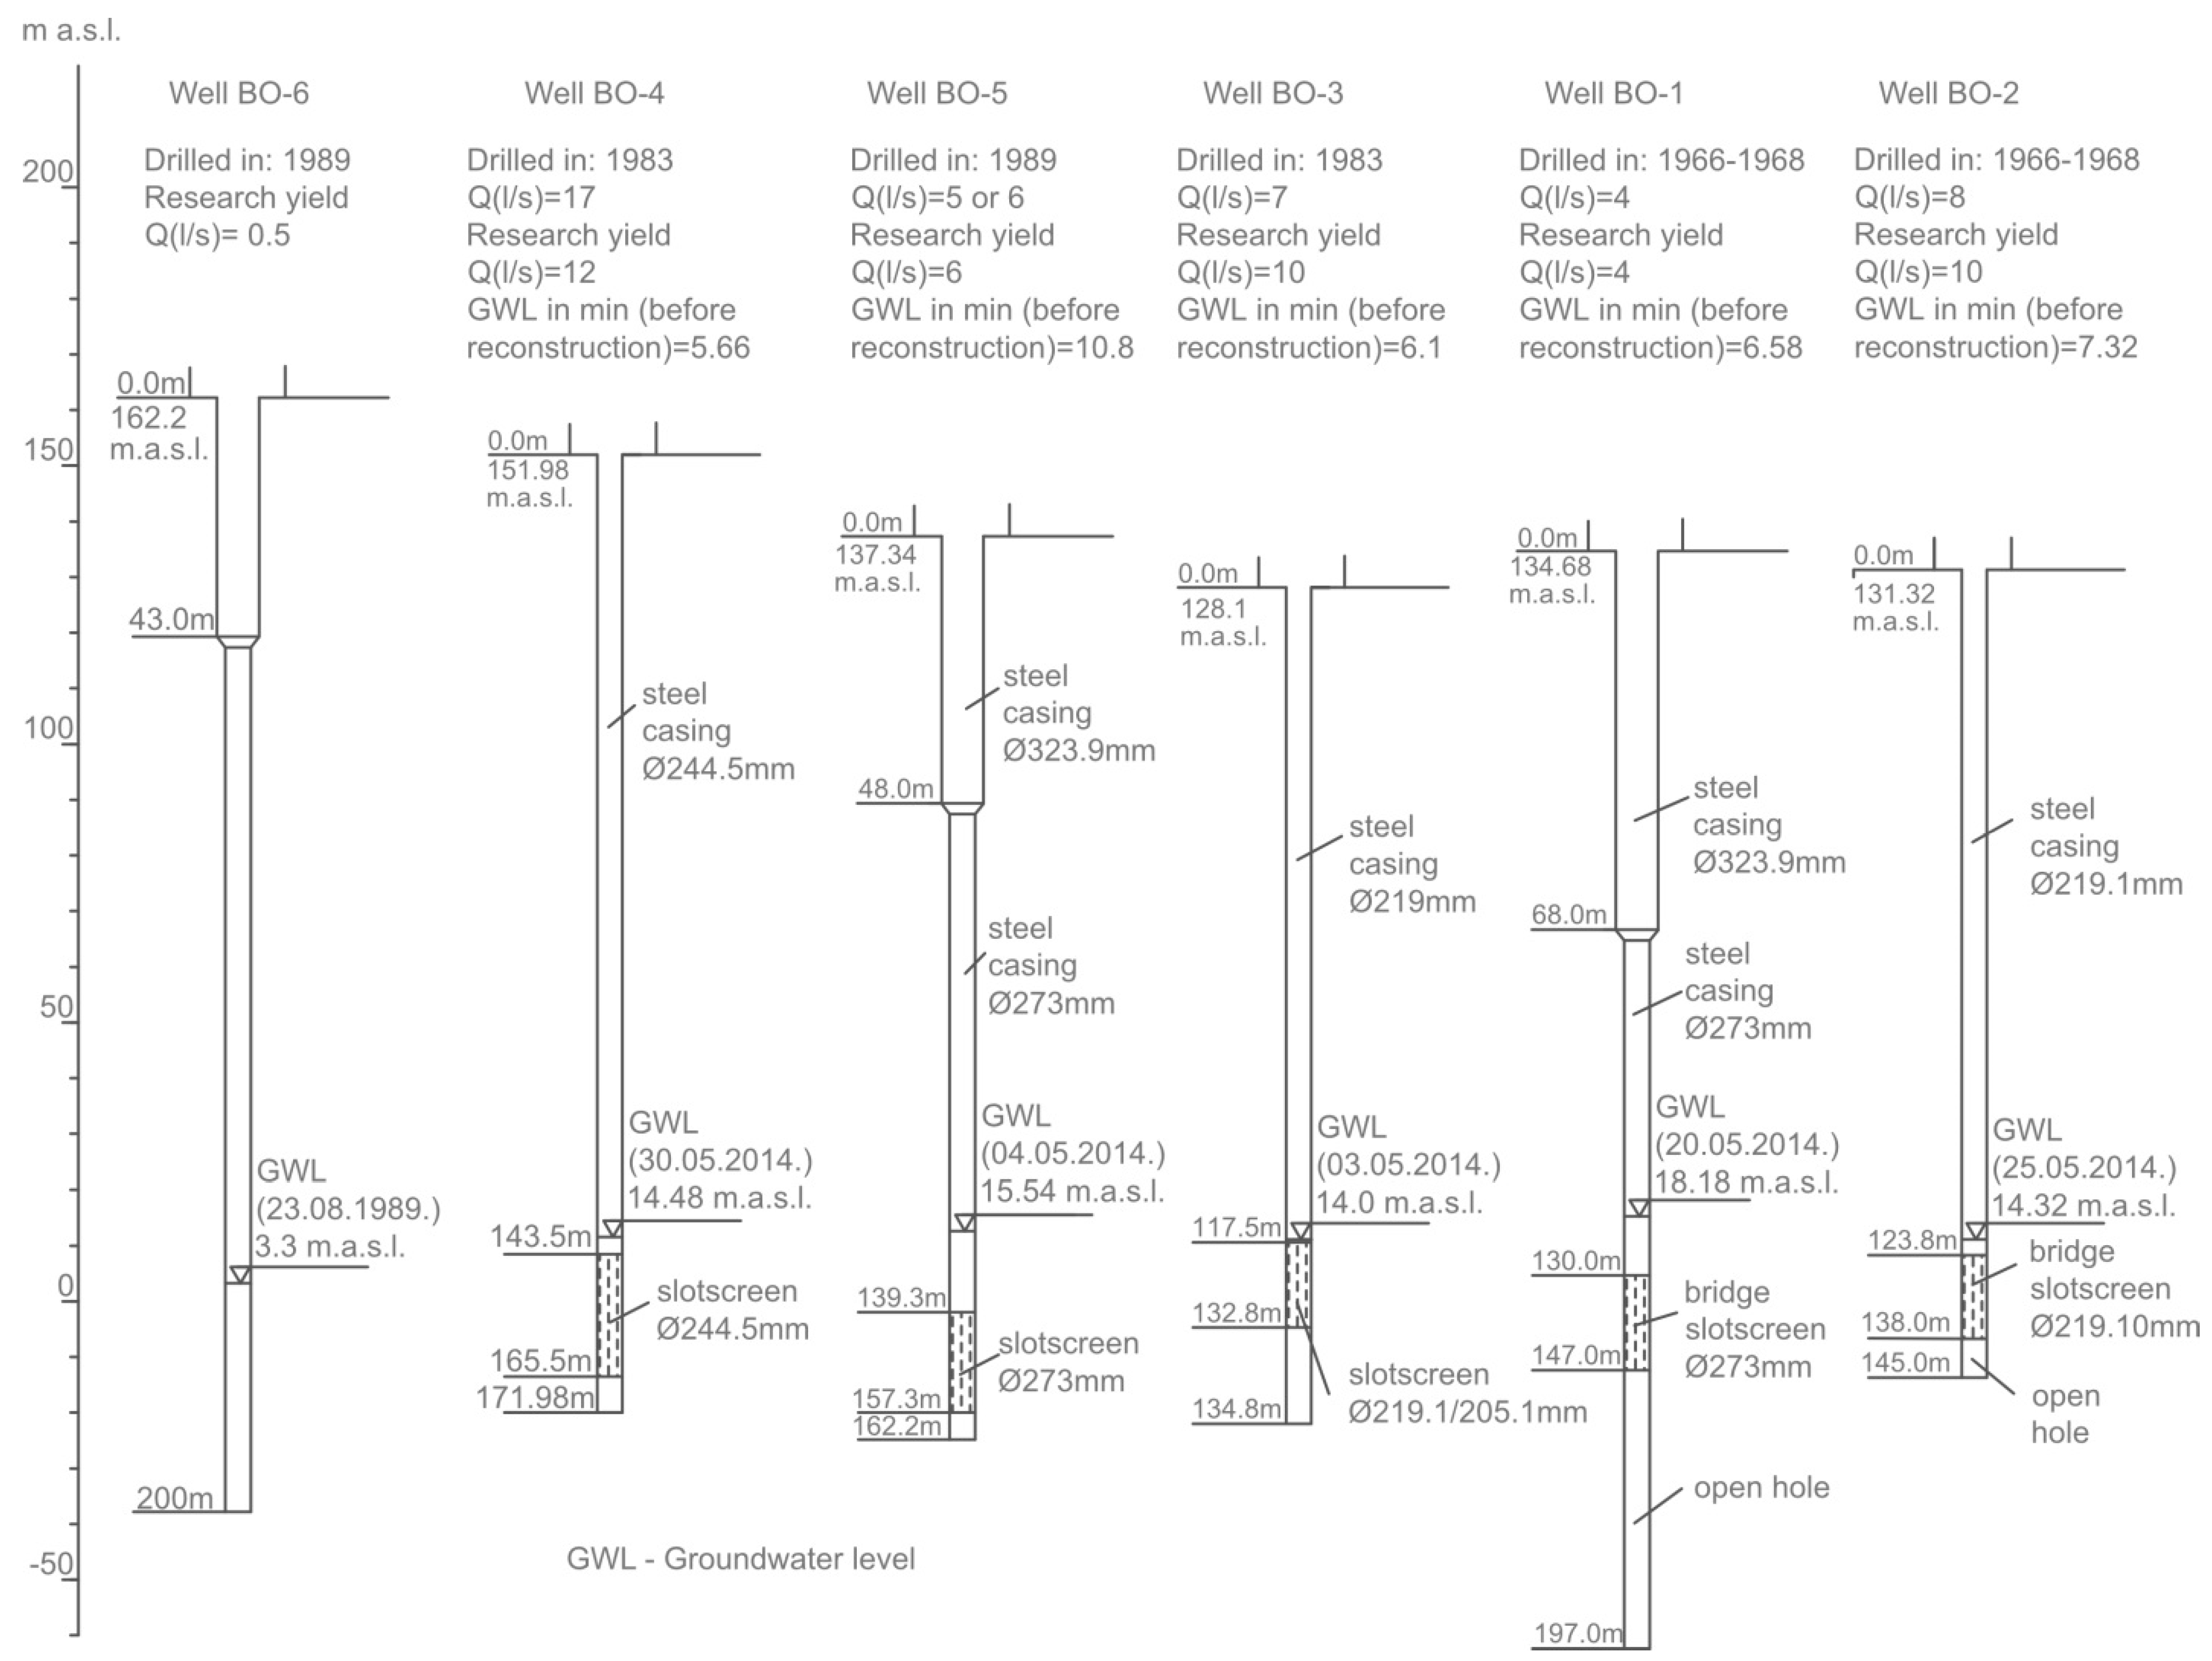
The Korita pumping site includes a total of six wells, five of which are in use. The total designed pumping yield was 27 L/s, which was increased to 40 L/s after research and optimization. Water has been supplied from these wells since the late 1960s, when the first wells were drilled after bulk investigations that involved geological, hydrogeological, and geophysical (geoelectrical sounding) research, as well as test drilling, pumping tests, and hydrochemical interpretations (
Figure 3). Terzić [
16] lists the numerous unpublished technical reports, which exist from that time.
The current pumping rates for public water supply approach their limit (approximately 40 L/s) during the summer, when there is practically no groundwater recharge and water demand is at its maximum due to tourism and agriculture. To further develop the touristic potential of the island, new water sources should be ensured. An increase in available irrigation water for agricultural land could also be of significant use, especially for famous vineyards and olive groves. With the exception of the mentioned supply sites, there are some smaller springs and
vruljas (submerged springs) on the island. The most important of these are a few springs in Komiža Bay and one strong periodical
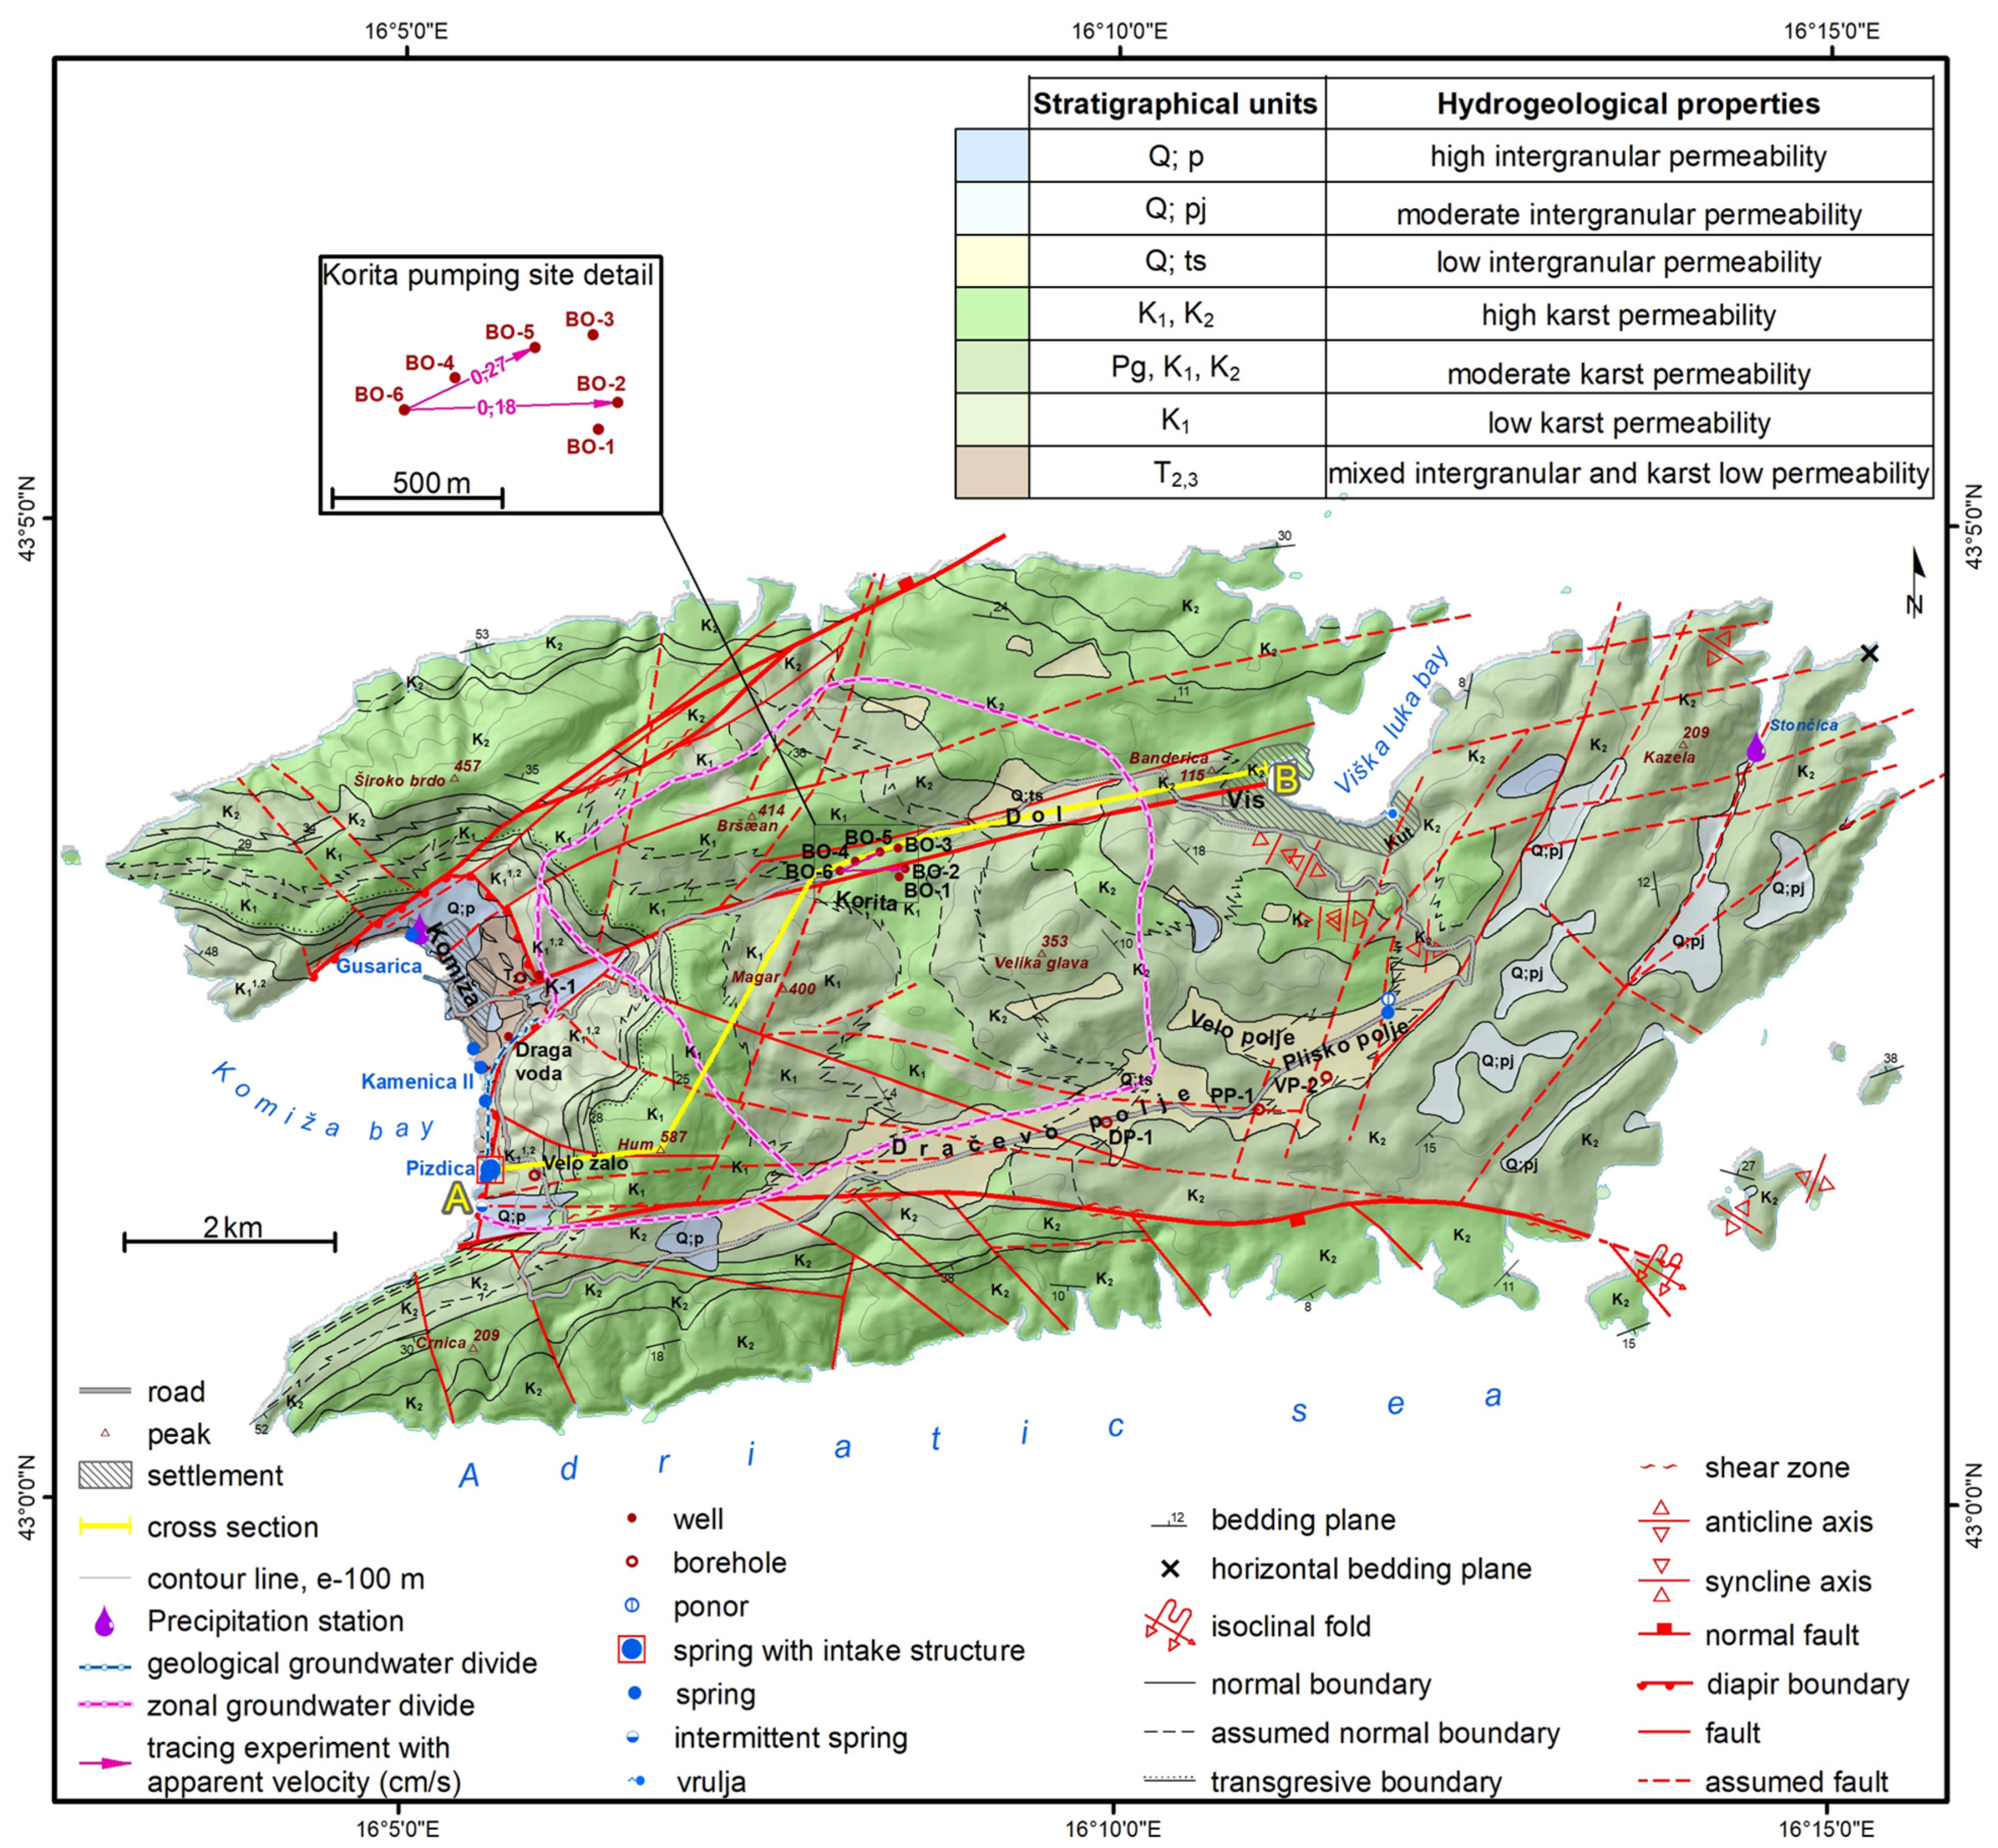
vrulja zone in Kut, which is part of the Vis settlement (
Figure 4). There are also a few boreholes in karst poljes (large flat plains in karst, usually covered by Quaternary sediment); however, due to a relatively low yield, these have never been put to public water supply use.
The features described above make the island of Vis an extraordinary terrain for research regarding (i) the seawater–freshwater relationship in the karstified underground, and (ii) sustainable karst island aquifer management.
With an area of 89.7 km
2 and a coast length of 84.9 km, Vis is the ninth largest Adriatic island [
17]. The topographic relief is comprised of three hilly chains separated by two valleys. The northern valley is relatively narrow and tectonically predisposed, and is the location of the island’s most important water supply source: the Korita pumping site. The southern valley is wider and consists of well-developed karst poljes, where the maximum thickness of Quaternary sediments has been determined to be at least 45 m [
18]. The highest peak on the island is Hum (587 m above sea level (a.s.l.)), which is close to Komiža in the western part of the island. The geological structures and relief strike in a west–east direction (the so-called Hvar strike), which differs from that of the majority of the Dinaric karst, as these usually strike in a northwest–southeast direction (termed the Dinaric strike) (
Figure 4).
The climate of the research area can be classified as: (i) group: temperate/mesothermal (C), (ii) type: Mediterranean climate (Cs), and (iii) subtype: Mediterranean climate with dry and hot summers (i.e., an olive climate, Csa) [
20]. The annual precipitation is relatively low, with a highly seasonal distribution, whereby the majority of rainfall occurs during the cold part of the year. Many climatologists, therefore, tend to consider this climate to be sub-humid when taking into account the ratio between the amount of water required for potential evapotranspiration and the water available from precipitation [
20,
21]. The average annual precipitation is 600–700 mm in the coastal areas, 700–800 mm in the inner island area, and 800–900 mm in the highest hills in the western part of the island. The average annual air temperature varies between 16 and 17 °C in the coastal area, 14 and 16 °C in the inner island area, and between 13 and 14 °C in the highest hills in the western part of the island. Air temperatures are highest during July and August and lowest in January [
22]. In a newer study [
23], there was a bulk analysis of climate variations on Komiža station, which is representative of the island of Vis (neglecting differences within the island, as no other stations were analyzed). The absolute minimum and maximum annual air temperatures were −1.12 °C and 35.01 °C, respectively, and the mean annual air temperature was 16.71 °C, while the average annual precipitation for the station was 792 mm.
The geological framework of the Croatian Dinaric karst region has been described in numerous published papers; however, the geological evolution of the region is still a matter of debate and fundamental research [
24,
25,
26,
27,
28]. The lithological composition of the rocks on Vis Island is summarized in the new geological map of the island [
19]. Karst poljes were added from older geological maps [
18,
29,
30], as well as some other features that are important for the local hydrogeological map (
Figure 4). The rocks on the island have been grouped into five hydrogeological members [
16]:
Almost impervious rocks are those of the volcanic–sedimentary–evaporitic (VSE) complex of Komiža Bay (known as Komiža diapir), which is dated as Middle to Late Triassic (T
22 to T
31) according to recent research [
19,
31,
32]. Several lithostratigraphic formations and members were schematized together to develop a hydrogeological map. The lithological compositions of single formations within this complex vary, and contain andesites, siltites, tuffites, marls, dolomites, gypsum, dolomitic-gypsum breccia (
Figure 5c), and volcanic agglomerates (
Figure 5d). Collectively, they function as a hydrogeological barrier; hence, only a small amount of groundwater flows towards the coastal springs in the beach regions of Komiža Bay via highly fractured and superficially weathered zones.
Low permeability carbonate rocks are mostly well-bedded dolomites of the Lower Cretaceous period (K
1). These rocks are spatially connected to the VSE complex as a narrow zone and mostly reinforce their barrier function. Still, these dolomites are fractured and even karstified to a certain extent, and groundwater can flow through significant fracture and fault zones; for example, the Pizdica spring occurs at one of these (
Figure 4). The contact with the VSE complex is diapiric (practically a fault).
Moderate permeability carbonate rocks are the most important hydrogeological unit, as they are permeable enough to allow groundwater infiltration, accumulation, and flow, but are not too permeable to allow the excessive penetration of seawater into the island’s aquifer. Due to the presence of dolomitic and dolomitized rock mass, and its characteristic weathering into sand-like sediment, this material fills in most of the karst and fracture voids within this rock mass [
16], thereby reducing its permeability. This hydrogeological member consists of several formations and members. Lithologically, these are laminated and bedded limestones with dolomitic beds/interbeds, bedded dolomites, and even some dolomitic breccias in some places. Stratigraphically, they are of the Cretaceous age (K
1, K
2; from Barremian to Cenomanian).
High permeability carbonate rocks are highly karstified (mostly Upper) Cretaceous limestones (K
1, K
2) situated in two coastal belts: one in the north and one in the south of the island, although some exist in a few belts in the central part of the island. The high permeability and wide spatial distribution of the coastal belts make them completely worthless from the perspective of fresh groundwater. Their position next to the sea results in the over-salinization of groundwater that either flows from the central part of the island or infiltrates directly into them. High permeability limestone rocks in the central part of the island (
Figure 5a,b) form the most important part of its aquifer, which is perfectly situated and protected from significant seawater intrusion, either by the VSE barrier or the surrounding dolomitic rocks. The lithological composition varies from thin- to thick-bedded limestones that are rarely laminated.
Quaternary deposits encompass several types of rocks and soils that have variable hydrogeological roles. Terra rossa (ts) is spread all over the island as a thin and discontinuous cover, and as a thicker layer mixed with rock fragments in karst poljes (
Figure 5e). These deposits decrease infiltration, and in the thickest parts in the poljes, they act as a local hydrogeological barrier. Aeolian sands (pj) are present in a few eastern karst poljes and colluvial sediments (p) in Komiža Bay. These deposits do not have hydrogeological importance in the context of water supply.
Aside from the diapiric structure, there are three main fault zones on the island [
19], which basically run subparallel to the structural axis of the island. They are probably secondary faults connected to the so-called Vis fault, which is situated off the island’s southern shore [
25]. The Korita pumping site is located in the Komiža–Vis fault zone; karst poljes have developed as a belt along the southern fault zone, and even the Pizdica spring occurs exactly at the intersection of the latter fault zone and the diapiric structure (
Figure 2A and
Figure 4). Within the rock mass and between the main fault zones, there are several lower-order faults, as well as joints and fractures of the local structural setting. All of these tectonic features enable the infiltration of rainwater and the gradual karstification of the rock mass.
Except for one strong
vrulja in the town of Vis (in the locality of Kut) and a few springs in Komiža Bay, there are no notable springs or
vruljas along the majority of the coastline. Most of the groundwater discharge is diffuse and occurs through a network of joints and cracks in highly karstified limestones of the Upper Cretaceous, which comprise the northern and southern coasts. The groundwater outflow in these regions is therefore mostly hidden from observation. These limestones are highly permeable, and seawater penetration in their zone is practically complete, such that fresh groundwater mixes with seawater in the two narrow coastal belts. A simple water balance calculation was performed by Terzić [
16], but included the following issues: (1) there are unknown boundary conditions in the mixing zone; (2) it was impossible to observe the outflow in the major part of the coastline, except in concentrated zones, including wells, springs, and
vruljas; (3) the average annual infiltration (all over the island) was estimated to be 40% of the precipitation, based on similar karst regions and rock types, and was calculated using the simple Turc’s expression [
33]. The outflow was calculated for known sources, such as the Korita wells and Pizdica spring, and was estimated for observable springs and
vruljas. After half a century of pumping, this situation is considered to be “natural” and balanced over the longer term, such that the outflow and inflow should be equal on average. Even though the precipitation on Vis Island is quite low, Terzić [
16] concluded that >99% of infiltrated water flows out at diffuse discharge zones along the coastline, whereas <1% is extracted for water supply.
The seasonal variation of the groundwater level (GWL) (minimum in August and September, maximum in January) in operational wells (by neglecting the effects of pumping as the natural state can no longer be established) is a little over 4 m. Aquifer recharge usually starts in October after the lowest annual levels, and continues mostly until March. In the receding limbs of GWL curves, there are some outlier peaks in reaction to rapid recharge after heavy rainfall [
16]. Infiltration in the close vicinity of operational wells is very fast, especially through highly permeable limestones. Hydrochemical analyses of groundwater samples taken from the wells in Korita have proven that these wells extract water from the same karst aquifer. This aquifer is very heterogeneous, and consists of voids of different scales that are interconnected by fractures, cracks, and even karst conduits (
Figure 5a,b). Similar examples have been recorded in comparable environments [
34,
35,
36,
37,
38,
39,
40,
41,
42,
43,
44,
45,
46,
47,
48].
3. Materials and Methods
In addition to the methods described in detail below, the following general geological and hydrogeological methods were also used in this research: (1) the reinterpretations of existing small-scale maps (1:50,000 and 1:100,000), with special attention given to aerial image interpretations in order to delineate karst poljes; (2) analyzing large scale (1:5000) geological and hydrogeological maps of the immediate hinterlands of wells and springs; (3) interpretation of existing GWL data (provided by the water supply company); (4) common interpretation of all results, including GIS (geographic information system) visualization. In combination with geological mapping at different scales, hydraulic parameters were calculated using the relatively simple Thiem’s equation [
49], while the tracer test provided a better insight into groundwater velocities and dynamics, and hydrochemical data were a very useful tool for determining groundwater facies and tracking the extent/direction of salinization.
Due to the high, locally extreme heterogeneity and anisotropy of Dinaric karst aquifers, numerical modeling
sensu stricto is hardly applicable. Still, hydraulic conductivity can be calculated, with a clear notation of the limitations. The method for this calculation depends primarily on the scale of the research [
50,
51]. For this study, at a local to sublocal scale, pumping test data interpretation using Thiem’s expression [
49] was chosen. However, the achieved hydraulic conductivity value should be considered to be within an order of magnitude (higher precision would not be appropriate for this parameter). Some hydraulic laws should be applied in karstic terrains, whereby many experiences from different karst regions have yielded similar results [
2,
35,
36,
41,
42,
51,
52,
53]. The methods for calculations should be chosen with respect to local terrain characteristics and, more importantly, the scale of research. For the karst aquifer on Vis Island, hydraulic conductivity values were calculated for the successive set of stationary states. Thiem’s equation was applied based on data from pumping tests undertaken in the 1960s, 1970s, and 1980s, when the wells were being constructed [
16].
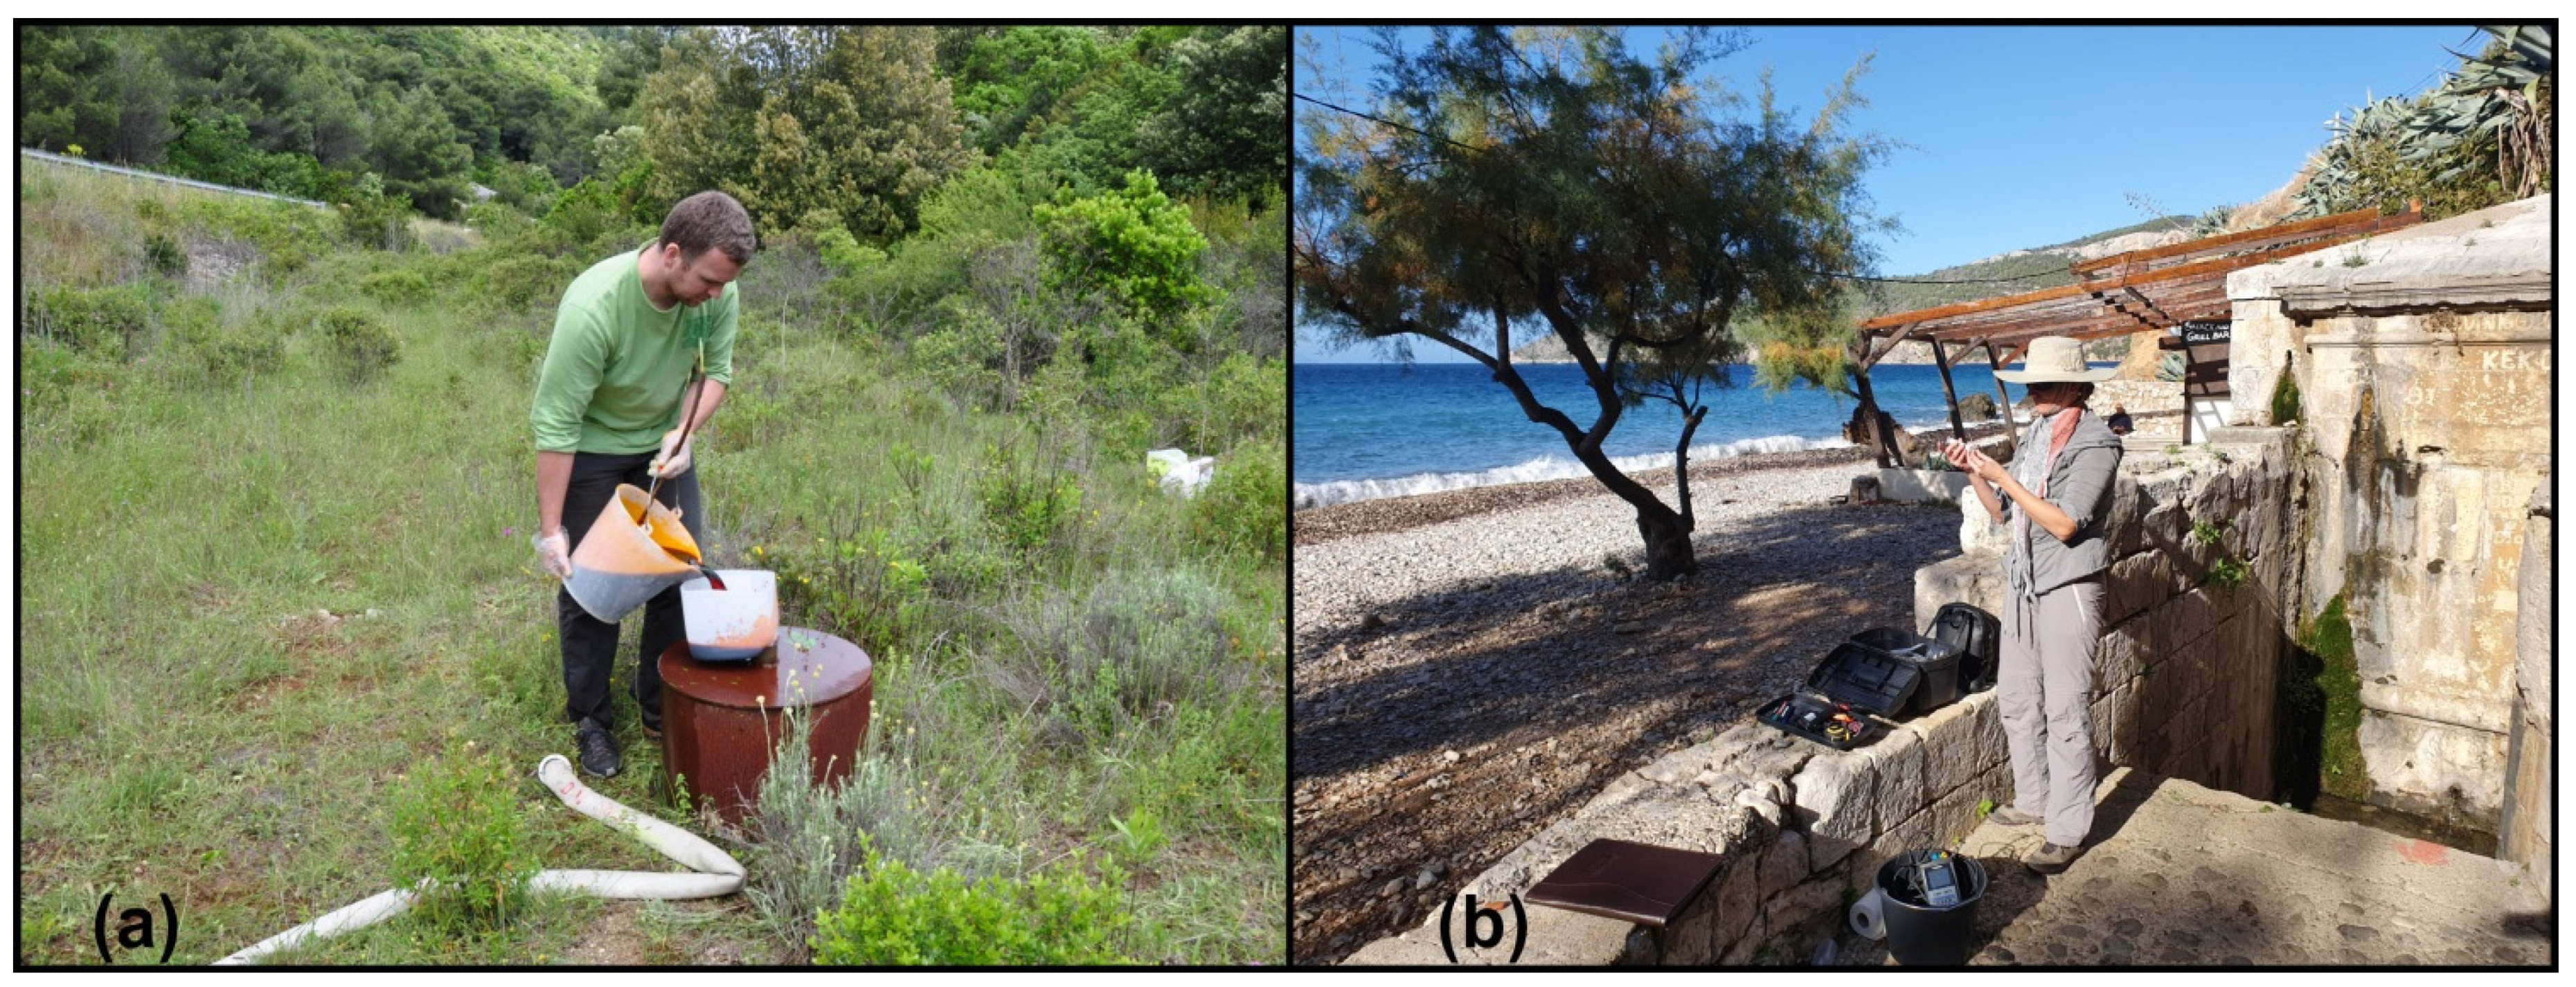
A tracer test was performed with two basic purposes: (1) to obtain accurate data of the groundwater velocity in order to delineate SPZs, and (2) to delineate the groundwater divide between the Korita and Pizdica catchment areas. As no appropriate natural landform for dye injection exists in the research area, a borehole in Korita was used (well BO-6), which is situated westwards from the other wells and has never been operational. Sodium–fluorescein was used as a tracer (
Figure 6a), which was monitored in situ at two sites (Pizdica and well BO-2) using GGUN-FL loggers (detection limit 0.025 µg/L). From these sites and two other locations (well BO-5 and Kamenice spring), samples were collected for laboratory analyses of tracer concentrations, which used a spectrofluorometer LS-55 (PerkinElmer) (detection limit 0.002 µg/L). The tracer test is the most commonly used tool for the delineation of catchment areas in karst terrains [
51,
54,
55,
56] because topographic and hydrogeological groundwater divides rarely correspond.
After collecting blank samples, the tracer test commenced by injecting a dye (0.4 kg of Na–fluorescein) on 22 May 2012, with 10 m3 of water added to wash out the injection point and ensure that dye reached the aquifer. The general idea was to imitate the natural flow conditions as much as possible. There was considerable rainfall on the day of the tracer test. This ensured a slightly higher groundwater gradient and the imitation of natural conditions after heavy rainfall, which was, in fact, helpful for delineating the SPZs.
Groundwater and spring water samples for hydrochemical analyses were collected during two campaigns by previous researchers (
Figure 6b): (1) during winter 1999 and (2) during summer 2000 [
16,
38]. From each location, one sample was taken at the hydrological minimum (in 2000) with respect to GWL, and one close to the maximum (in 1999). The electrical conductivity (EC), pH, and temperature (T) were measured in situ using a HACH probe (CO 150 Conductivity meter). The concentrations of chloride, sulfate, and bicarbonate anions were measured in the Croatian Geological Survey’s laboratory with a spectrophotometer DL/2010 (HACH). Cations and metals were analyzed using ion chromatography plasma–mass spectrometry (ICP–MS) using laser ablation at high resolution at ACTLABS in Ancaster, ON, Canada. For the period 2010–2012, chloride concentration data were obtained from the water supply company, and the analyses were performed by the Croatian Institute of Public Health in Split.
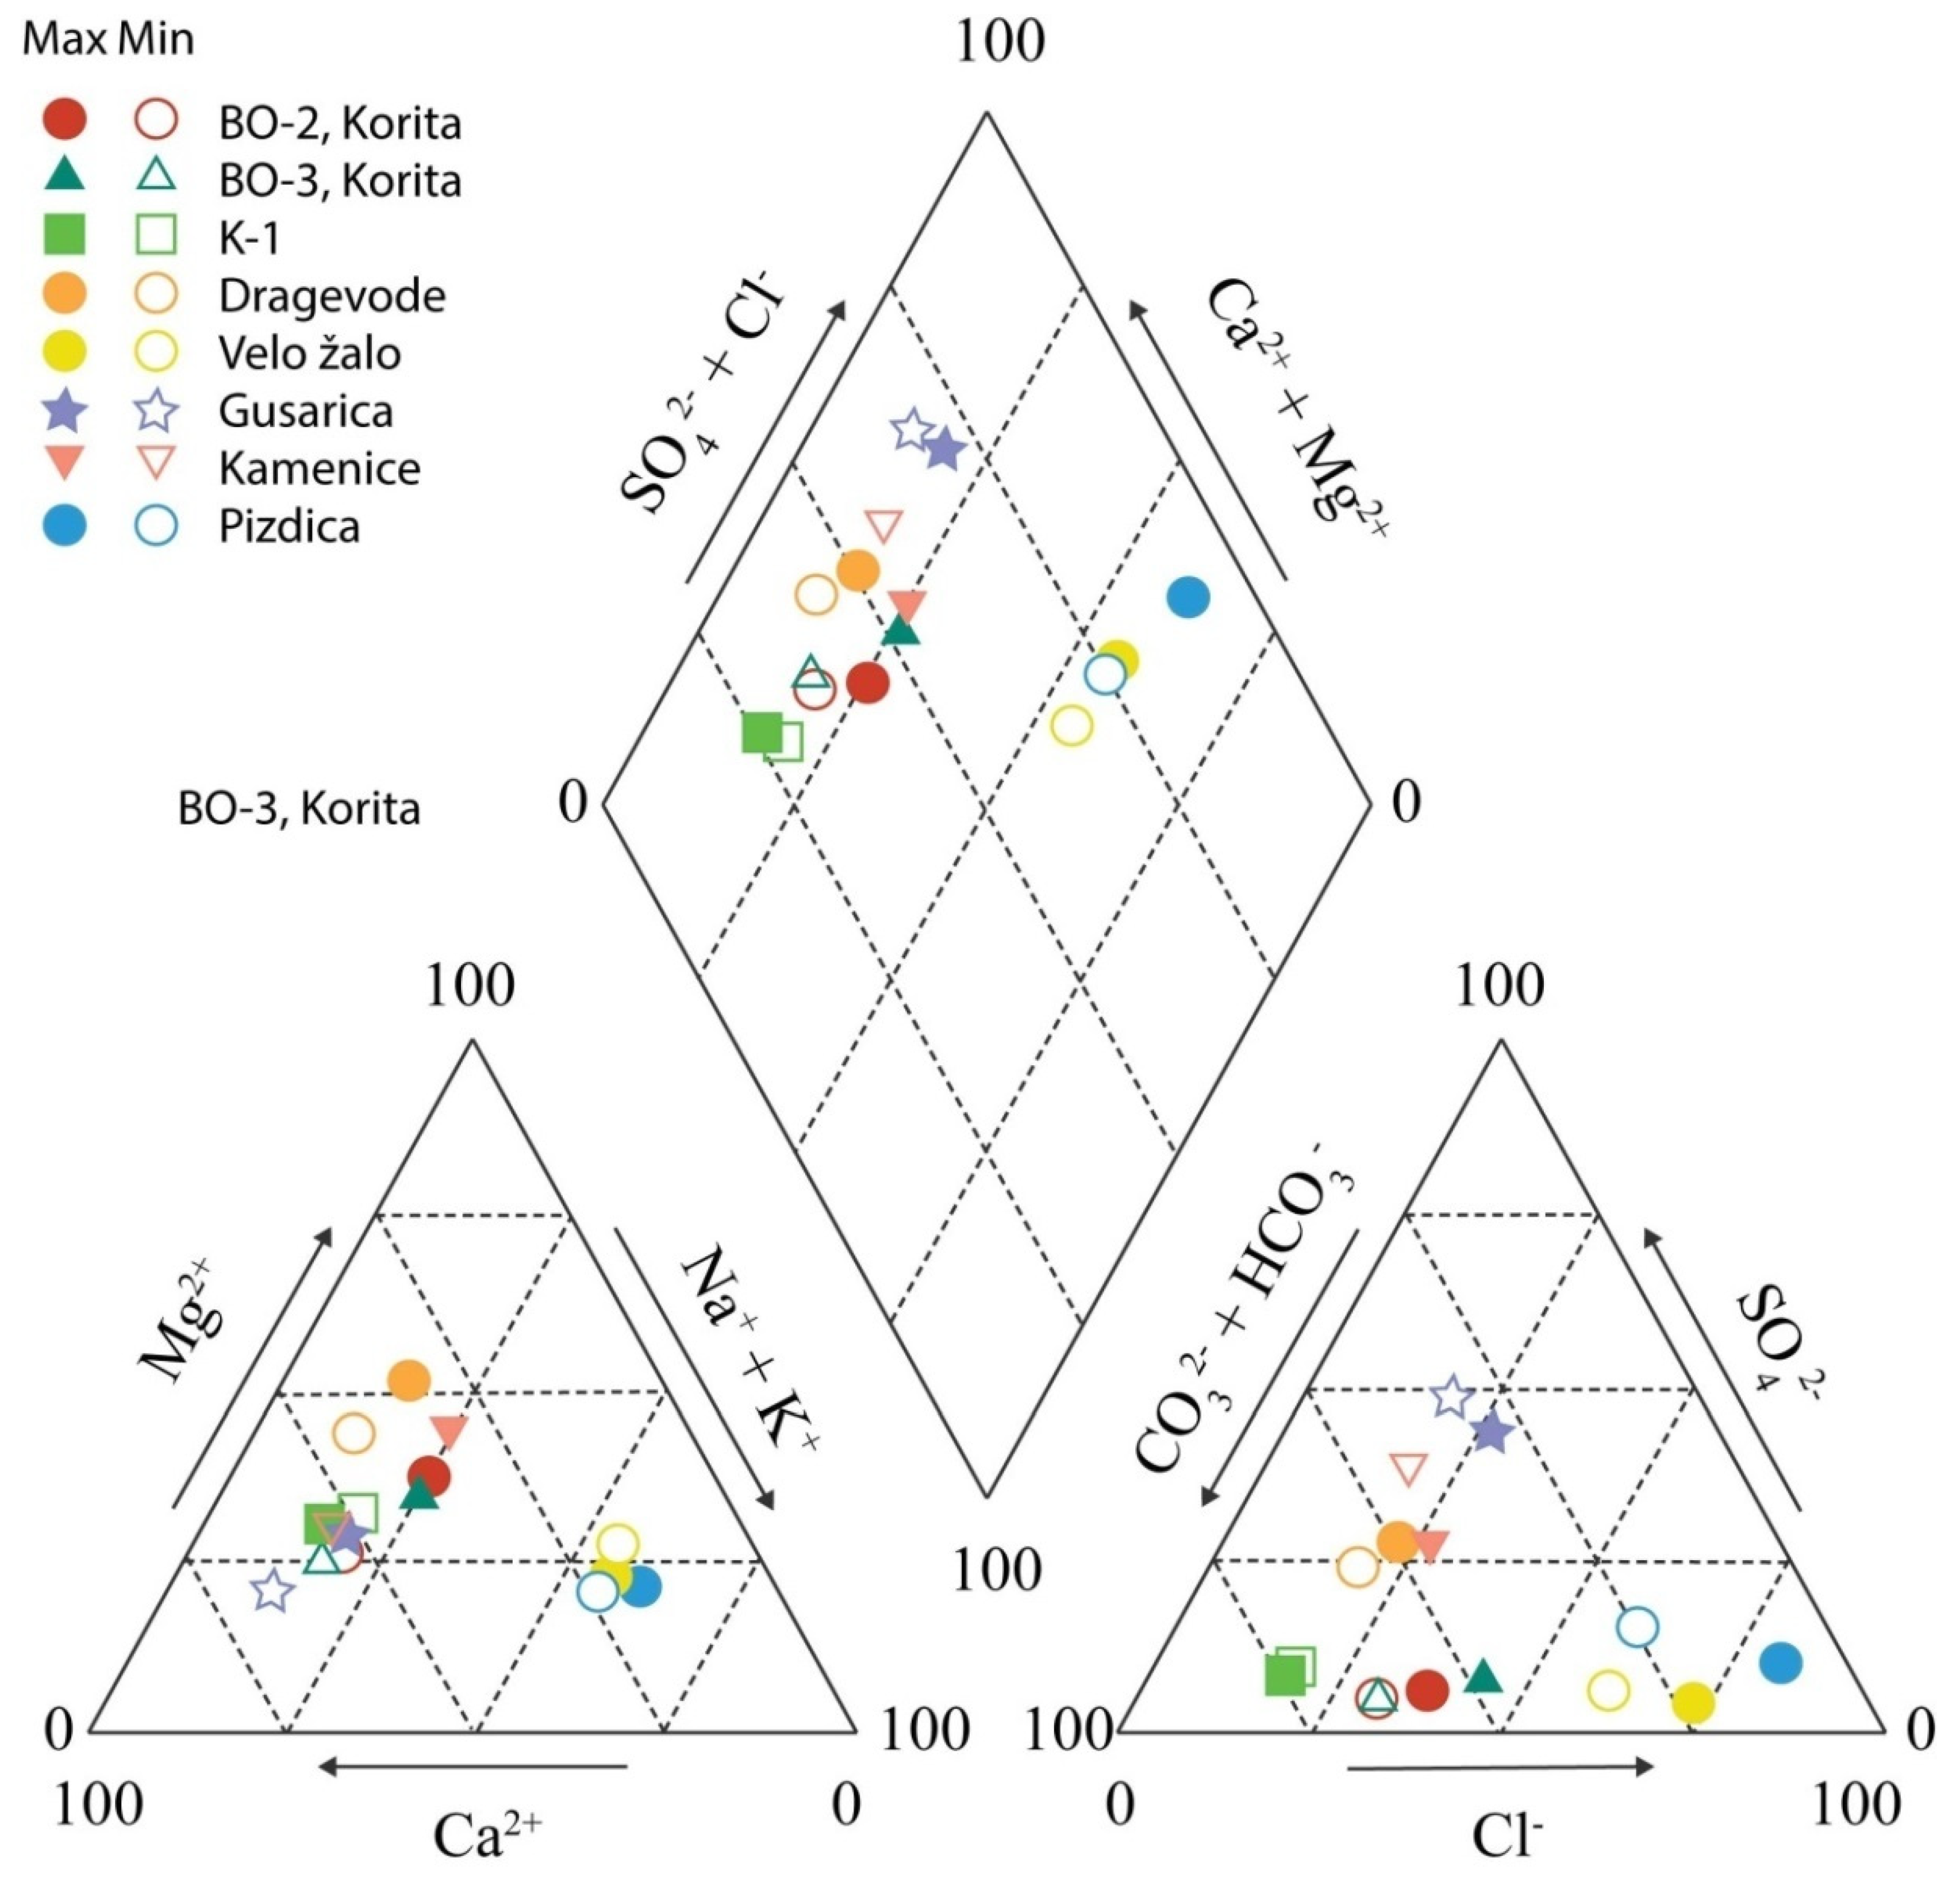
Hydrochemical facies were determined based on the results of two water sampling campaigns using a Piper diagram [
57,
58]. Basic ion composition, and especially the EC value and chloride anion concentrations, are important tools for mixing zone estimations in such aquifers [
59] (although not the only one, e.g.,
18O or trace elements could be used as well). The seawater percentage (
fsea) was calculated based on the conservative mixing method described in detail in Appelo and Postma [
60]. The basic formula of the calculation is given by Equation (1), and finally in Equation (2):
where
mi is the concentration of ion “
i” in mmol/L,
fsea is the seawater percentage in the mixture, and subscripts “
mix”, “
sea”, and “
fresh” represent mixture, seawater, and freshwater, respectively.
After including known values and simplifications, the final formula for calculating the seawater percentage is [
16,
60]:
where
fsea is the seawater percentage and
mCl−,sample is the concentration of
Cl− ion in the sample.
It is important to note that a Cl−sea of 602 mmol/L represents the value for average seawater salinity of 38‰. The simplification also presumes that, in rainfall, the concentration of Cl− can be considered to be zero. The resulting fsea, or the seawater fraction, comprises both the underground penetration of the seawater wedge, and the amount of previously sprayed particles all over the island’s surface, which are washed out during the infiltration of the rainwater. Both values originate from seawater, and no other sources were found, or could be presumed, for this aquifer. These values are considered to be close to reality, although resulting from several presumptions, and are therefore taken as rough estimations.
4. Results
4.1. Groundwater Flow: Hydraulic Conductivity and Tracer Test
The results of the hydraulic conductivity calculations obtained by Terzić [
16] (
Table 1) agreed with the existing values cited in eminent publications for limestones and dolomites [
57]. Since the pumping tests were carried out from the 1960s to 1980s, without the calculation of hydraulic parameters, only these values could be calculated using Thiem’s equation (Equation (3)):
where
s* represents the equivalent drawdown (as an approximation, it can be considered to be a total drawdown in phreatic karst aquifers),
Q is the pumping rate,
T is the transmissivity, and
Ro and
rz are the assumed radius of the well influence and the radial distance from the pumping well, respectively. Since these last two values are within the logarithm, they can be approximated, because the error is limited to an order of magnitude in the result.
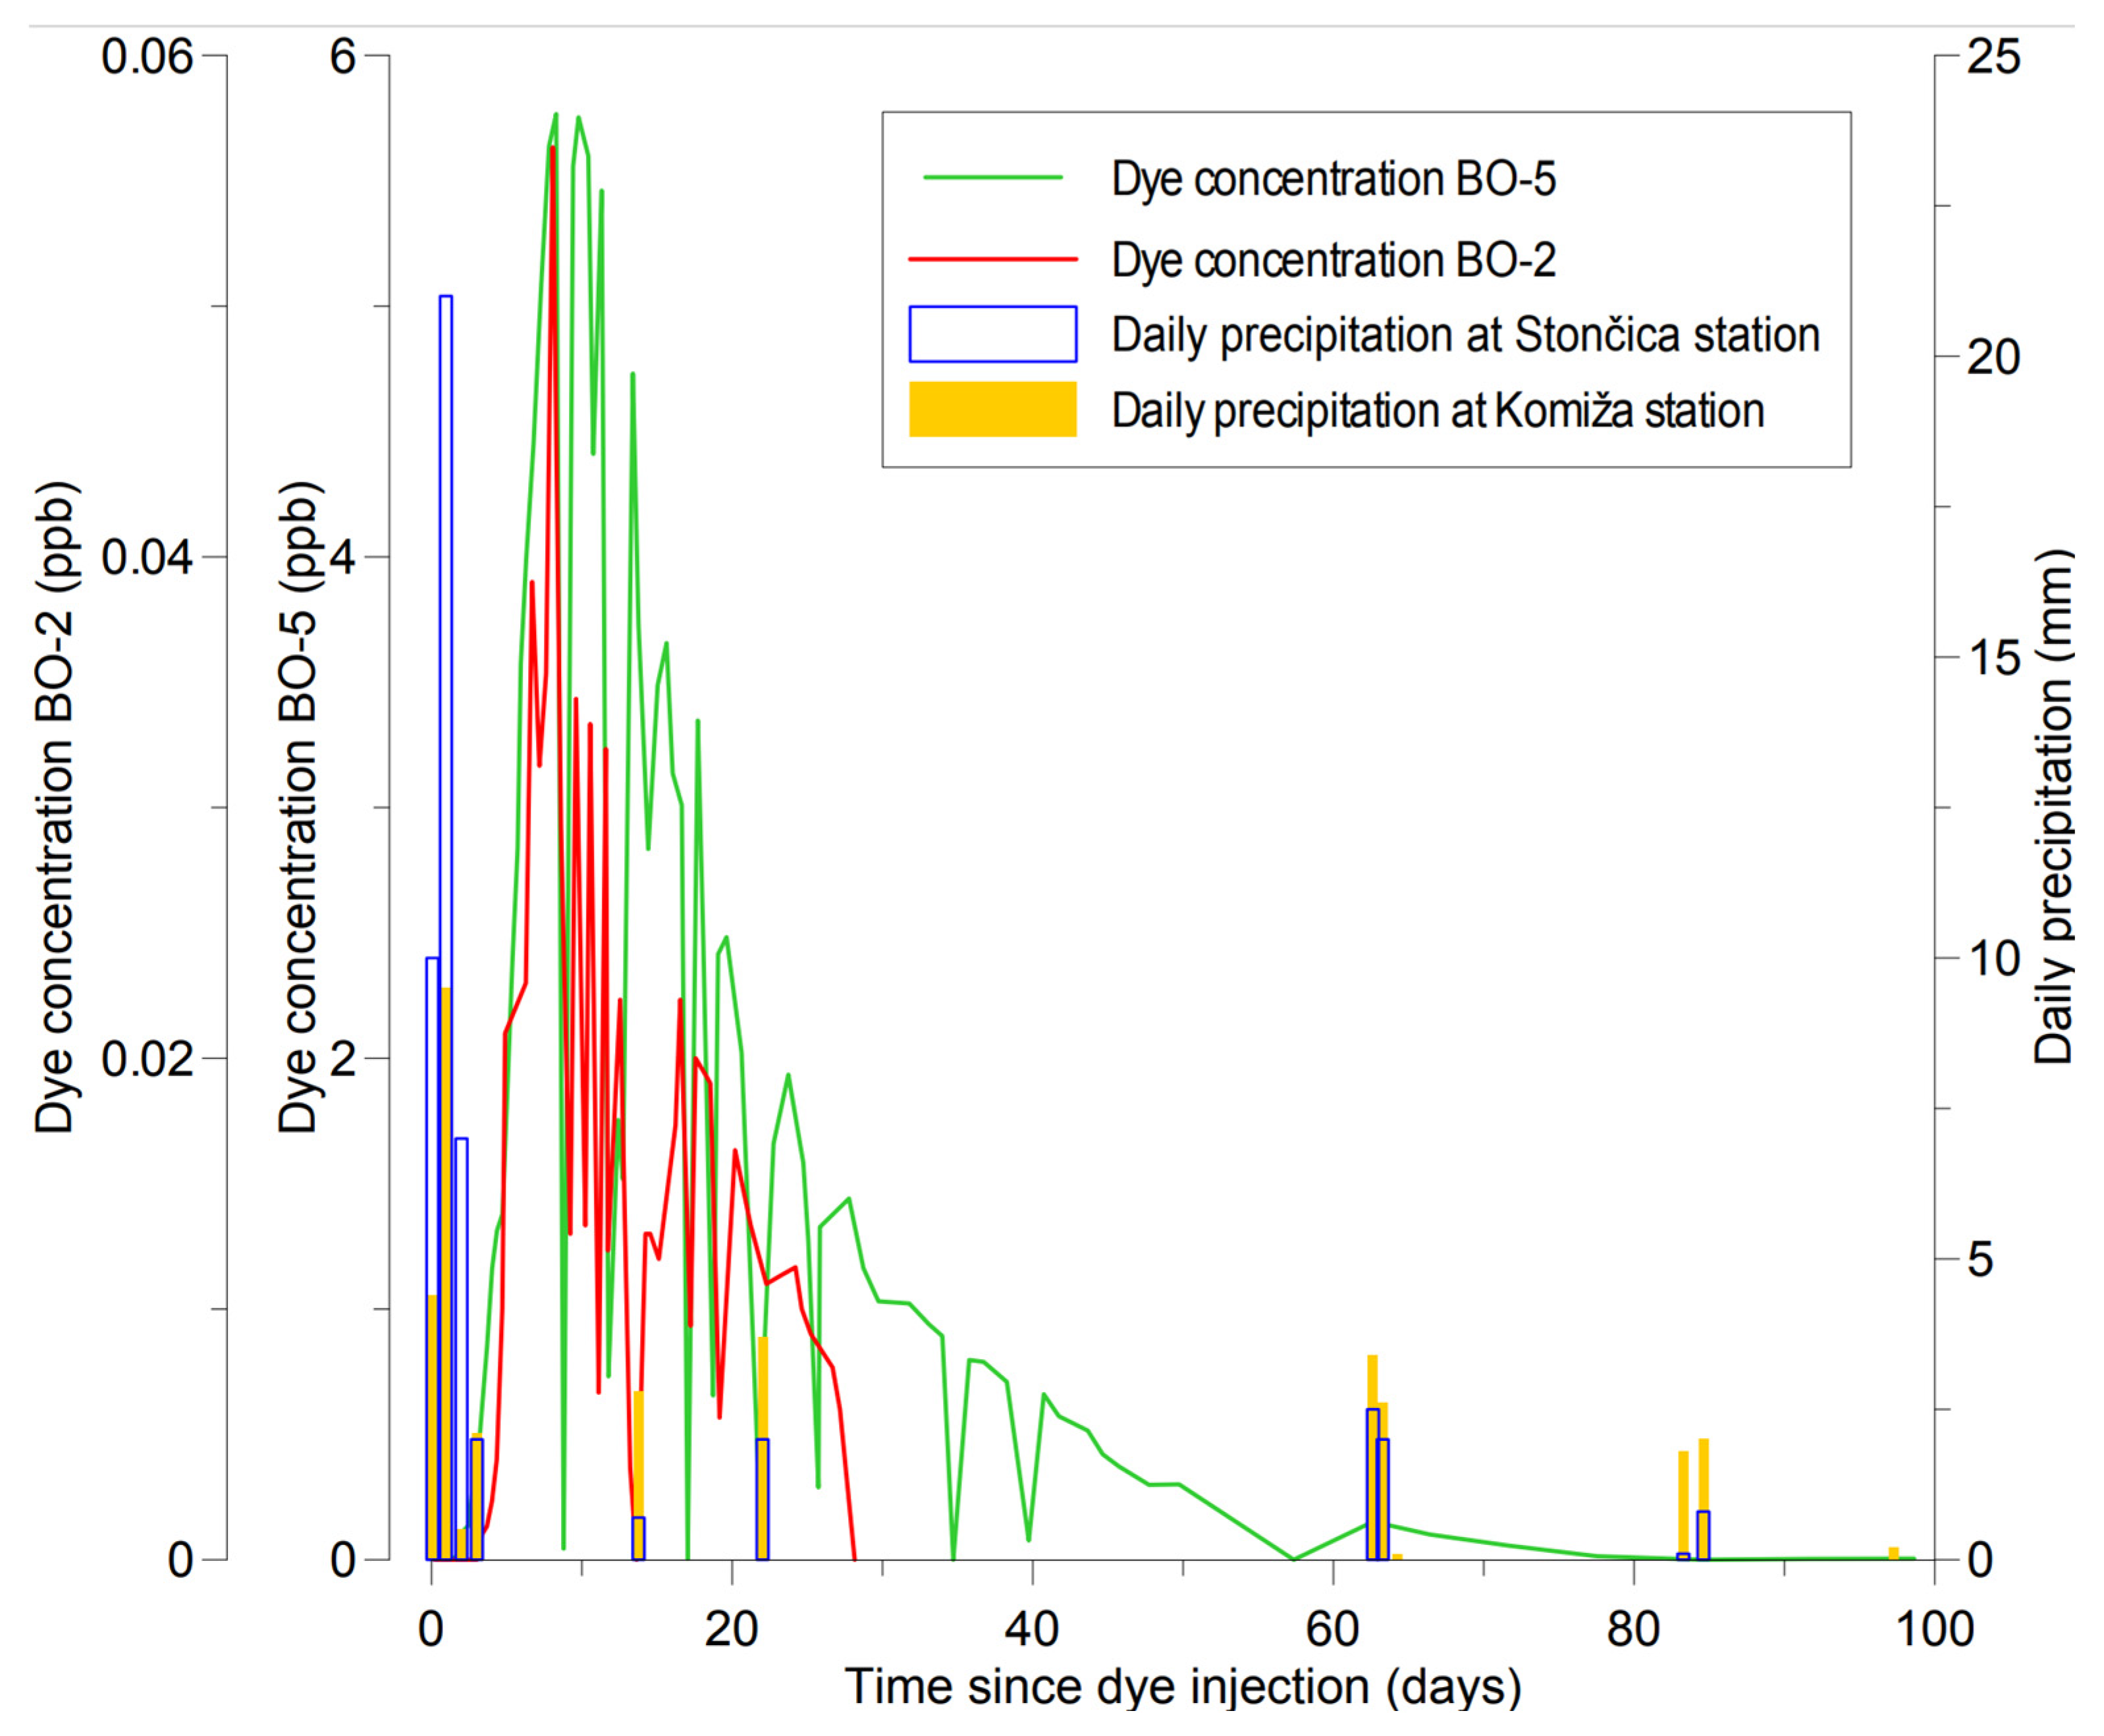
Measured daily rainfall in the vicinity of the dye injection point was 88 mm, which is extremely high for the research area and was significantly higher than that at the Komiža and Stončica meteorological stations (4.4 mm and 10 mm, respectively) managed by the Croatian Meteorological and Hydrological Service. Therefore, the groundwater gradients in the Korita catchment were higher than usual, representing naturally high GWL conditions, which was a favorable situation for obtaining good data for determining groundwater velocities. Ordinarily, groundwater gradients on the island are very low, and it would have taken much longer to record the arrival, peak, and disappearance of the tracer.
The dye was recorded in two observed wells in Korita (BO-2 and BO-5;
Table 2). Wells BO-1 and BO-2 were pumped during the first ten days of the test, and BO-5 was pumped only shortly during the groundwater sampling. At the Pizdica and Kamenice springs, no tracer was detected within two months of sampling.
The dye tracer results from the in situ measurements and those from the laboratory analyses were in complete accordance with well BO-2 during the time that the field logger was in place (i.e., the first few days of sampling).
Figure 7 presents curves based on the laboratory analyses for the entire sampling period for both of the monitored wells at the Korita pumping site. Precipitation data taken from two climatological stations are also plotted. As mentioned, no dye was identified during the entire monitoring period at other monitored localities (Pizdica and Kamenice springs).
Heavy rain at the beginning of the tracer test raised the hydraulic gradient, which increased the tracer velocity through the aquifer. The main tracer direction was towards well BO-5, which had a maximum tracer concentration of two magnitudes greater than the well BO-2. The pumping of the wells was constant only during the first ten days of the tracer test. After that, wells were pumped periodically according to the water supply needs, so the tracer concentration curves reflect that. Despite these disturbances, the tracer concentration curves exhibit a typical shape for karstic aquifers, but with an atypically long duration. The tracer was still present in well BO-5, distanced only 426 m from the injection site, after nearly 100 days.
4.2. Hydrochemical Properties
The two sampling campaigns in 1999 and 2000 provided a good insight into the hydrochemical properties of the aquifer (
Table 3). The corresponding Piper diagram (
Figure 8) illustrates the hydrochemical facies of the analyzed water samples. The data on GWLs during these campaigns were measured manually and represented monthly average levels during pumping. For other features, levels were not being measured at that time, while for some they were estimated.
For the majority of water samples, no dominant type could be determined in either season. This is congruent with the composite structural fabric of the island, which comprises different rock types and structures that cause variable seawater intrusion into the island’s aquifer. Moreover, seasonal effects can cause a differentiated dissolution of carbonate, sulfate, and silicate rock minerals, thus leading to slight changes in hydrochemical facies.
The hydrochemical situation was unequivocal at two sampling locations. Water from the Pizdica coastal spring belonged to the Na–Cl facies in both hydrological seasons due to its proximity to the sea. The spring water at Pizdica is part of a mixing (transition) zone between fresh groundwater and seawater, and is similar to that at the Velo žalo borehole, which is situated in the immediate hinterland of the spring. Although this is clearly a discharge zone, it is also a region where the mixing zone is moved further inland due to the narrow extent of the VSE barrier of the Komiža diapir (
Figure 4).
Apart from these two cases, there were only three more instances for which the dominant hydrochemical facies could be defined: (i) at borehole K-1, which showed a clear Ca–HCO3-type water during both hydrological conditions, and (ii) at boreholes BO-2 and BO-3 during the minimum GWL. The coastal spring at Gusarica, which is located in the part of Komiža where the VSE complex is wider, displayed Ca-mixed-type water in both seasons, but with a tendency towards a Ca–SO4 type due to the dissolution of gypsum and anhydrite. The effect was more pronounced during the hydrological minimum, when it could also be observed, to a lesser extent, at the Kamenice spring. Higher concentrations of sulfate ions in the water of the springs at Pizdica, and much more at Gusarica and Kamenice, suggest the high influence of sulfate rocks from VSE complex dissolution. As stated, only gypsum and anhydrite rocks are present in the evaporitic sequence, and no halite was ever recorded. It means that chloride anions originate from seawater, either as a result of underground penetration, or as particles sprayed by wind and accumulated on the island’s surface during the dry season, and washed out by rain.
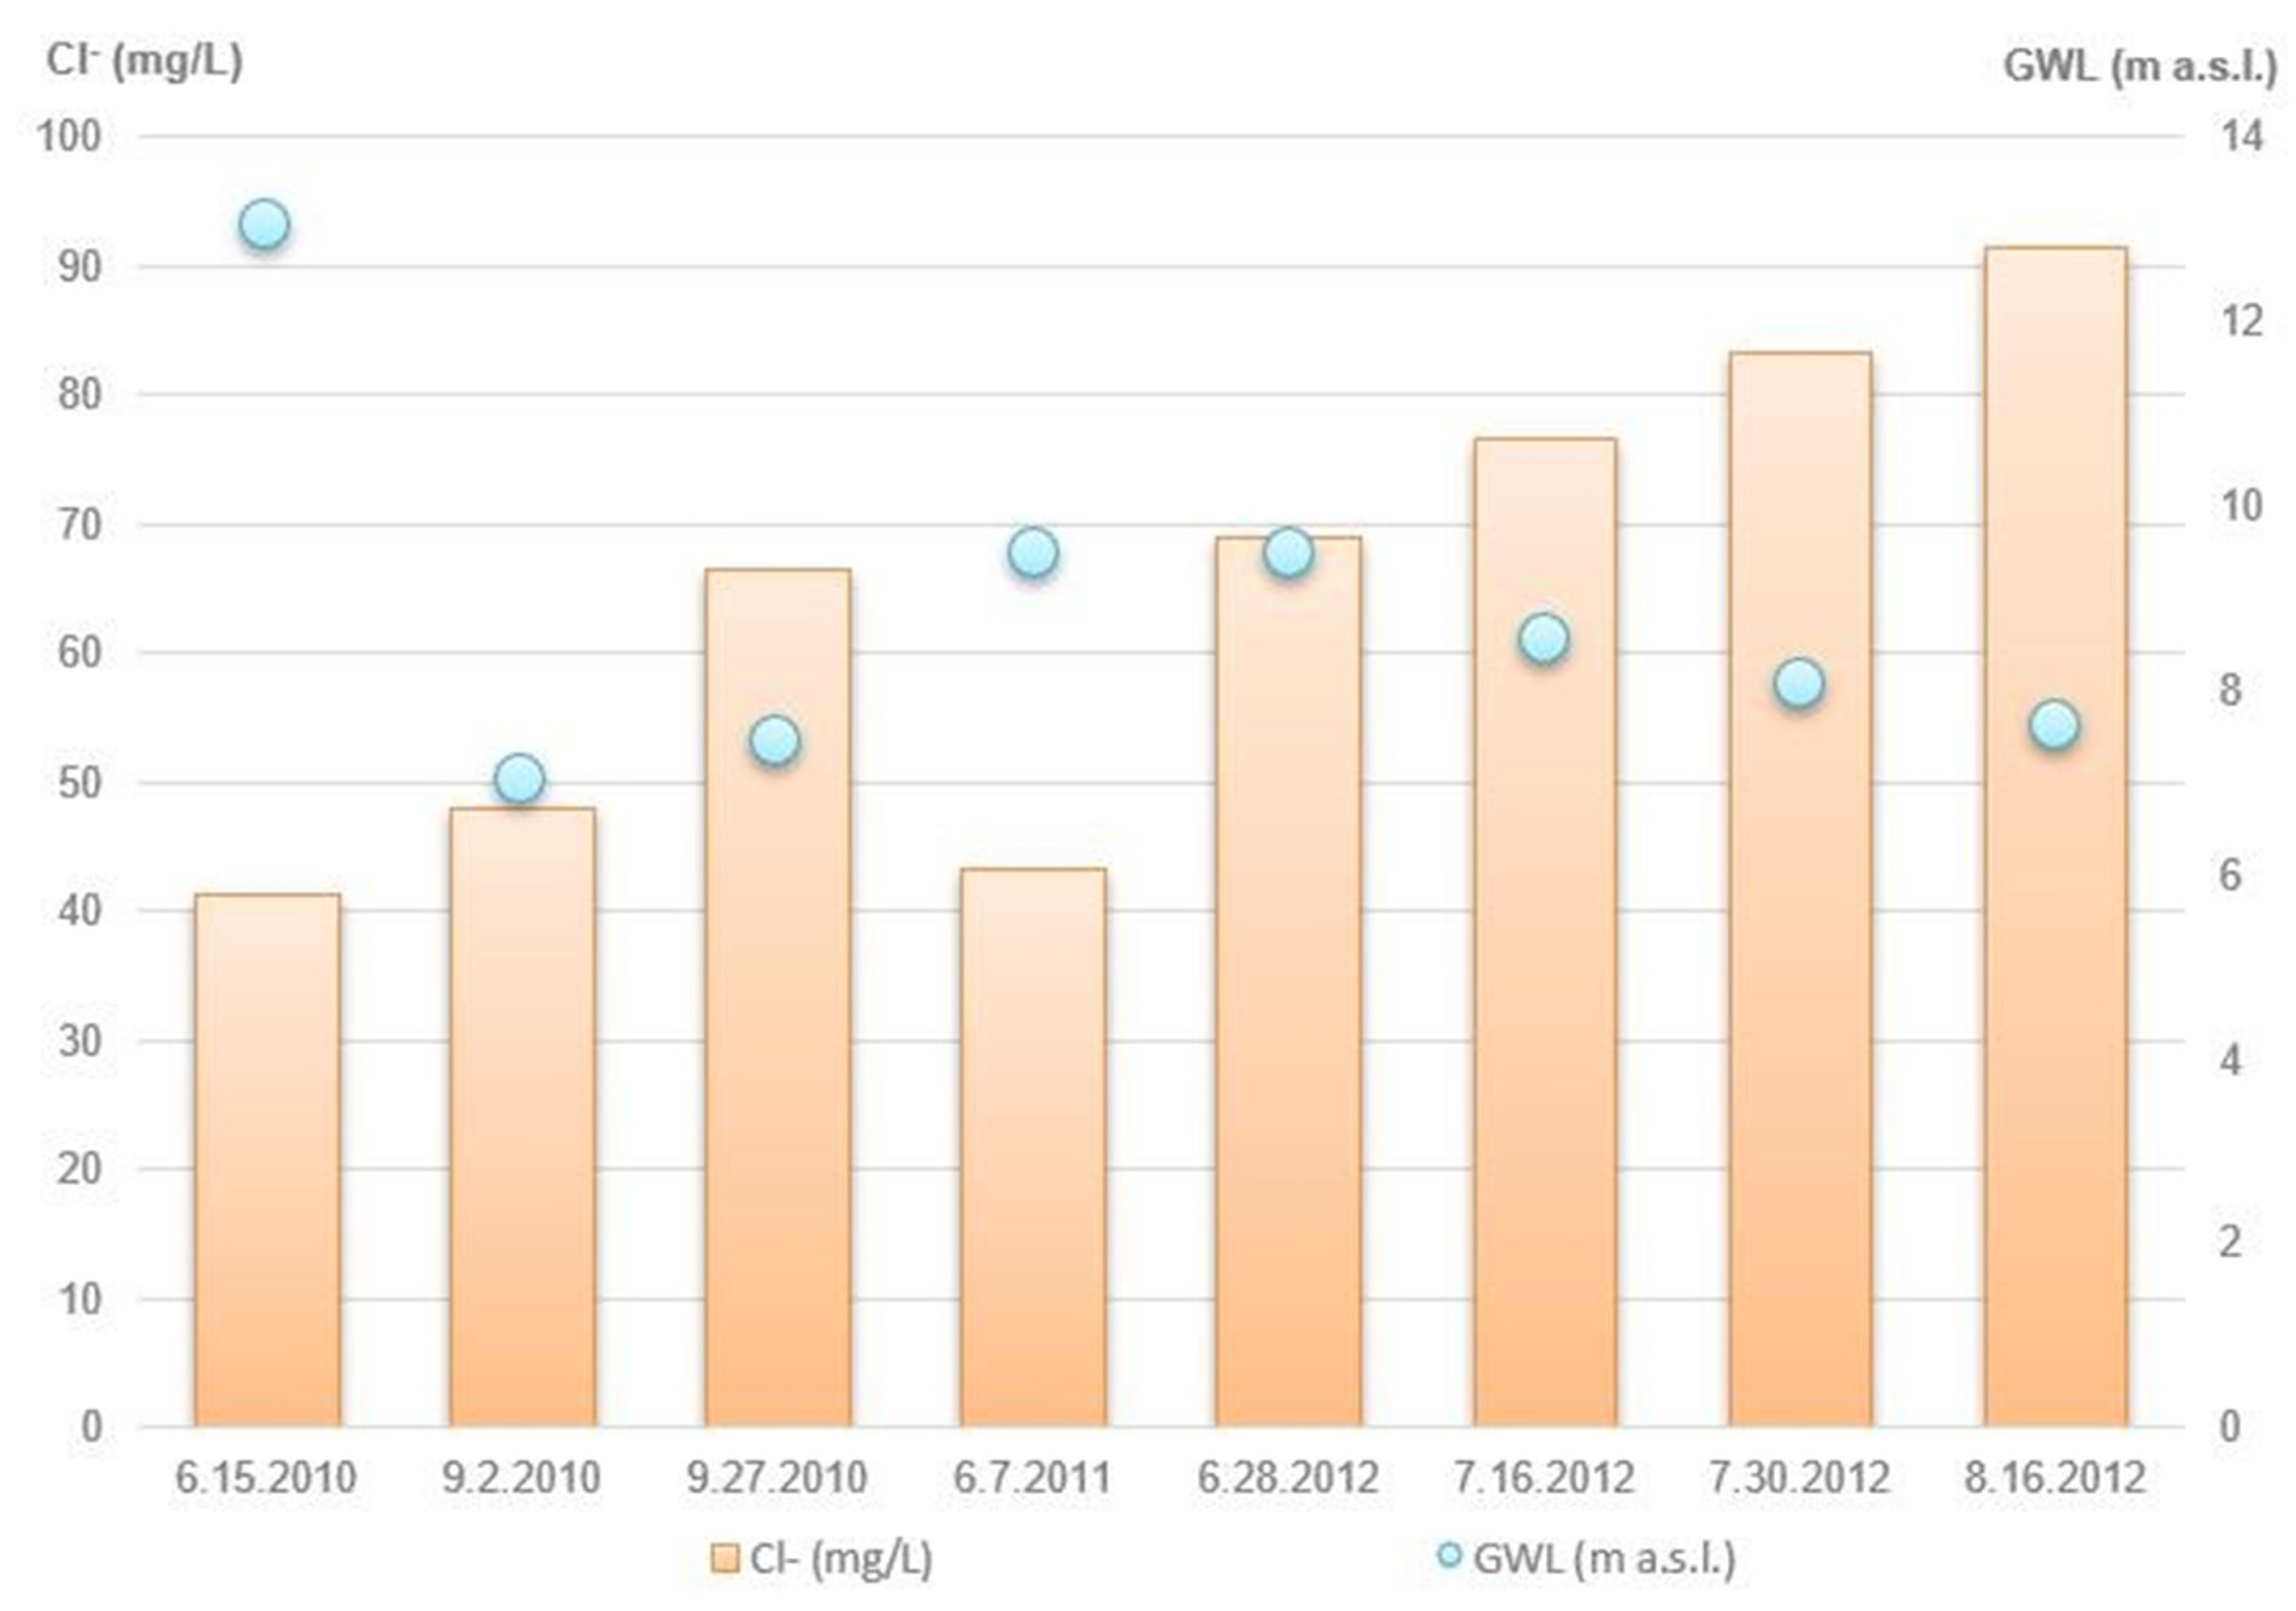
Newer data for chloride concentrations, from occasional measurements at the Korita wells during 2010–2012, were slightly higher than those during 1999–2000 (
Figure 9). Although the measured concentrations were still significantly below the maximum allowed concentration for drinking water, the trend is definitely negative from the water supply perspective. It is also indicative that, during the higher GWLs, chloride concentrations were lower, and vice versa. However, it should be emphasized that the pumping rates in the Korita wells increased by ~30–40% between 1999–2000 and 2010–2012, and that both datasets are far too short to draw any general conclusions.
The
fsea was calculated using the chloride anion as a conservative (nonreactive) constituent of the mixture, as described in
Section 3. The results are presented in
Table 4.
5. Discussion
The establishment of SPZs for the protection of karst catchments differs from one case study to another [
61]. The Dinaric karst differs from region to region and can be distinguished into many sub-types [
62]. Island aquifers definitely differ from the aquifers in continental Dinaric mountainous areas; hence, the research approach in this study was adjusted accordingly. In Croatian karst terrains, four protection zones can be defined [
63,
64,
65] based on two criteria: (1) the groundwater apparent velocity, and (2) the time required for water to reach the extraction site from the infiltration point. The first zone is the water extraction site itself, which must be fenced. The second zone is connected via the main drainage and preferential flow paths. The third zone covers the area surrounding the preferential flow paths, as well as highly karstified and permeable rock mass with an established connection to these zones. The fourth zone spreads to peripheral parts of the catchment and terrain formed by a low permeable rock mass. In most cases in Dinaric karst, the fourth zone covers an entire catchment area, as is the case in the present study. This model of karst groundwater protection was established in the 1990s [
63,
66]. Due to these adopted principles, groundwater tracer tests represent the most important method for delineating SPZs in Dinaric karst areas where the apparent groundwater velocity data are very important. If there are no karst features suitable for tracer tests (e.g., ponors, open discontinuities, caves, or pits) within the boundaries of the investigated terrain, then boreholes should be used, as was the case for this study.
On a regional scale, the carbonate aquifer on Vis Island can be considered to be a more or less continuous medium, with a gradual transition between several hydraulically different types of rock mass (
Table 1). Therefore, even though this is a karst aquifer, the hydrogeological rules described by Darcy’s law can be assumed to obtain an approximation (within an order of magnitude). In areas with poorly developed Quaternary deposits (outside of the karst poljes), the calculated mean hydraulic conductivity (K) varied from 1.1 × 10
−5 m/s near borehole K-1 (Komiža) to 3.6 × 10
−5 m/s in Korita (i.e., the range was within the same order of magnitude). In the karstic rock mass beneath karst poljes, karst features and tectonic joints are infilled by secondary material, which causes a decrease in the mean K to 5 × 10
−6 m/s (
Table 1). This corroborates the existence of the presumed barrier and groundwater divide in this area, where K values are an order of magnitude lower than those near Korita, and GWLs are the highest.
The reinterpretation of old pumping test data suggested that an impermeable layer can be presumed to be at the depth of a few tens of meters below sea level (b.s.l). Even though karstification occurred below the current seawater level, and even below what would be presumed to be the seawater level below the island’s GWL according to the Ghyben–Herzberg law [
67,
68], the interpretation indicated that the permeability and K decrease with depth would become almost negligible a few tens of meters below sea level. Although there are karst features below this zone, such as stagnant conditions or a very slow groundwater flux, and the presence of dolomitic or dolomitized rocks, both resulted in the infilling of karstic and tectonic voids following the weathering of dolomite to the sandy–fine-grained material [
16]. This process was noted in all areas, but to the greatest extent in the karstified rock mass below karst poljes, where terra rossa provides additional fine-grained material for infilling. All interpretations pointed to the fact that in this aquifer, flow through the rock mass prevails, which is atypical of karst conduit flow. The pumping test results allowed the differentiation of three different rock mass types (
Table 1): (1) highly “infilled” rock mass below karst poljes, (2) mostly dolomitic zones, and (3) karstified limestones, i.e., karst aquifer sensu stricto. It was also noted that the K values gradually decreased with drawdown, which further supports the previously described phenomenon of infilled joints in the rock mass. The pumping test results indicated that the karst poljes, along with the karstic rock mass below them, act as a barrier to groundwater flow; hence, they also protect the central island karst aquifer from southward seawater intrusion. The geology of the western boundary is clear and is represented by the VSE complex barrier. The existence of these barriers to seawater intrusion from the two sides is a geological precondition for the formation of such a high-quality aquifer on this relatively small karstic island [
16]. For example, a similar pumping site in a karst polje in the central region of another remote island in southern Croatia, Lastovo, constantly yields brackish water; thus, a desalination plant had to be installed [
15,
69].
The results of the tracer test revealed apparent groundwater velocities of 0.18 cm/s (well BO-2) and 0.27 cm/s (well BO-5) (
Figure 4 and
Figure 7;
Table 2). Well BO-5 is situated in the tectonic valley in line with the dye-injection well (BO-6). Well BO-2 is a little outside of that line, which suggests that the groundwater velocity in the direction parallel to the main groundwater flow paths is the highest, whereas it is much lower perpendicular to the main flow paths (
Figure 4, detail). This indicates a certain heterogeneity and, in particular, hydraulic anisotropy, which is typical for the Dinaric karst. As the central island karst aquifer is open to seawater intrusion from the north and the east (as mentioned, barriers exist from the western and southern sides), this emphasized anisotropy means that the eastern salinization direction is more dangerous due to a higher K in that direction (
Figure 10).
The tracer test also provided new insights regarding the delineation of catchments in the vicinity of the Korita wells and the Pizdica spring. During the first few weeks of sampling, samples were also taken from the BO-6 well to check the dye dispersion. The dye tracer was present at a high concentration and decreased slowly, thus implying that dispersion was very slow, and that groundwater flow predominantly occurred in rock mass fractures and joints, and not via karst conduits [
70]. This supports the assumption of the first phase of research, when the K calculations for the Korita wells suggested the presence of this type of aquifer, whereby karst voids and conduits are not mutually connected and do not act as typical Dinaric karst aquifers. The dye concentration curve (
Figure 7) exhibits a local minimum that could either refer to (1) corrupted samples, (2) periodic heavy rainfall with fast infiltration components, or (3) an irregular pumping regime (which is most probable). Only during the first ten days following the dye injection did we arrange with the water supply company to use the two most distant wells (BO-1 and BO-2) continuously with a steady pumping rate. The dye was observed to have spread in a cloud-like manner all over the aquifer from injection well BO-6, whereby the groundwater flow was generally eastwards, following the main faults in the structural setting. Therefore, the presumption is that the apparent groundwater velocity in the main flow direction (approximately from west to east-northeast) is 0.27 cm/s (towards well BO-5). The velocity towards well BO-2 was 0.18 cm/s, which is a combination of the main direction velocity (0.27 cm/s) and a much lower velocity perpendicular to the main fault/groundwater flow direction. High precipitation at the tracer test beginning has highly disturbed the groundwater gradient between the BO-6 and pumped wells. According to rough data obtained from the water supply company, the gradient was approximately 0.004 at the beginning of the tracer test, but due to significant rainfall and infiltration in the next few days, levels were rising in the whole aquifer, including the two pumped wells. The natural groundwater gradient in this part of the aquifer is directed from the highest hills (Hum and others, close to Komiža Bay) towards the town of Vis (i.e., from west to east-northeast); however, it is ordinarily quite low and was highly disrupted by heavy rainfall during the first days of the tracer test. By neglecting the irregularities that are attributed to the pumping regime variations after the first 10 days, and/or possibly a human error, the curves in
Figure 7 are quite regular and too elongated for typical karst aquifers. These facts suggest that there are no interconnected karst conduits and that most of the groundwater flow occurs within the rock mass. Accordingly, the tracer test validated the conclusions drawn from the reinterpretation of the old pumping test results in this area.
The fact that the dye injected into the BO-6 well did not appear at any of the monitored localities on the western coast of the island (Pizdica and Kamenice springs) proves that there is no groundwater flow from Korita toward the west. This means that the catchments of Korita and Pizdica are divided, and are not a single catchment, as previously hypothesized [
16,
38].
Another important aspect to consider is the amount of dye that was injected into the aquifer (i.e., only 0.4 kg). The maximum concentration of dye that reached the water supply wells was 5.77 μg/L, which is just below the level of visual detection. This optimal result was achieved owing to a detailed preparation that considered (i) the hydrological analyses and parameter calculations from previous research, (ii) the point of dye injection, and (iii) hydrometeorological forecasts. Had the dye been injected in a larger quantity, it would certainly have crossed the visual threshold, and water in the water supply system would have remained colored for a quite long time (as can be supposed from the elongated curves in
Figure 7). Consequently, this situation was avoided given the timing being prior to the summer vacation season when the majority of tourists visit the island.
The hydrochemical data presented in
Table 3 and
Figure 8 suggest that the main direction of freshwater–seawater mixing is from the Pizdica spring towards the east. This direction is connected to some of the most important fault zones, but is fortunately localized in the southwestern area that is unprotected by the VSE complex barrier. The hydrochemical data fully corroborate the definition of the Korita and Pizdica catchment areas that were delineated on the basis of the tracer test and geological setting. For a more detailed analysis of the groundwater recharge and water circulation in the catchment area of other coastal springs in Komiža Bay, it would be necessary to undertake another tracer test and continuous hydrochemical monitoring. Although the data described here indicate the existence of a third catchment, which would include the springs at Gusarica and Kamenice and the well at Dragevode, the data can only be considered representative for a specific minimum and maximum because no hydrochemical data were available for comparison.
In the central part of the island (i.e., Korita), water salinization was not recorded before the increase in pumping quantities during 2003–2007, while there are some indicators that suggest it has happened subsequently. Before the pumping rates increased (from 27 L/s up to 40 L/s), very low chloride concentrations in the Korita wells were considered to be a consequence of the tiny particles of seawater sprayed all over the island’s surface by winds, which were then washed away during the rainy season to be infiltrated into the underlying aquifer. There are indications (
Figure 9) that after 2007, a slight increase in the chloride concertation occurred during the dry season; however, this hypothesis would need to be explored more thoroughly once appropriate datasets are obtained.
Overall, it seems that mixing between freshwater and seawater is very limited during all seasons at all localities on Vis Island (
Table 4). Two sets of samples showed significantly higher
fsea, namely, those from the spring at Pizdica and the borehole at Velo žalo, which is in accordance with their Na–Cl hydrochemical facies. These results also support the conclusions regarding the occurrence of seawater intrusion as a wedge under the discharge zone near Pizdica, as well as the hypothesis that chlorides in the samples from Korita mostly originate from wind-blown seawater spray that is washed out by rainwater. The possibility of a wedge-like seawater intrusion towards Korita (probably from the east, as hypothetically shown in
Figure 10) represents a subject for further study. The phenomenon of additional chlorides from seawater spray can also be present in Velo žalo and Pizdica, which would explain why values are higher during the rainy season than in the summer. It could be a consequence of the fact that their (common) catchment is very steep below the island’s highest peak, Hum, and oriented toward the predominant winds. This should also be more thoroughly studied in the future.
6. Conclusions
Based on previous and new data, a revised conceptual hydrogeological model of the groundwater system on Vis Island was conceived, as presented in the map and cross-section views in
Figure 4 and
Figure 10. Practically no data for seawater intrusion in the Korita region (especially before 2007) corroborate the presumption of watertight (or very low permeability) deeper zones of rock mass at a few tens of meters below sea level. Quaternary sea-level changes in excess of 100 m caused much deeper karstification than would be expected according to the current sea level. On the other hand, there have been relatively low gradients and groundwater velocities during the last 5000 years, during which Vis has been an island (before that it was part of the mainland) [
7,
8]. These facts, combined with the lithological composition of dolomites that prevail in some parts of the inland area, have caused the infilling of tectonic and karst features, either by fine-grained material (dolomitic sandy material mixed with terra rossa) or by the calcification of voids.
The findings of this study collectively indicate that there is no freshwater lens on Vis Island, but rather a real karstic aquifer due to its favorable geological predispositions. Seawater penetrates the aquifer and forms a wedge under the freshwater, with the wedge length differing depending on the direction. The most significant zone of seawater intrusion is recorded on the western coast of the island, and is connected to the intersection area of a strong fault zone and the diapiric structure. Fortunately for the water supply, this intrusion is localized due to the barrier function of the VSE complex. According to all the available data, the wells in Korita may be at risk of seawater intrusion, mostly from the east or north. This wedge is quite irregular and penetrates the island much deeper in the main tectonic directions (i.e., main fault damage zones). On the other hand, if there is also a significant flux of fresh groundwater through these fault zones, then it is possible that the freshwater pressure maintains a balance with the seawater wedge. This presumption suggests that an early warning system for the Korita extraction site should be placed between Korita and the town of Vis (possibly also north of Korita), and its installation should be preceded by additional geophysical research, e.g., electrical tomography [
71]. Such a system would be more than advisable given the increasing irregularity in the precipitation regime, which is similar to globally observed climate change trends and their reflection on the Adriatic region [
23,
72]. Water balance calculations performed by Terzić [
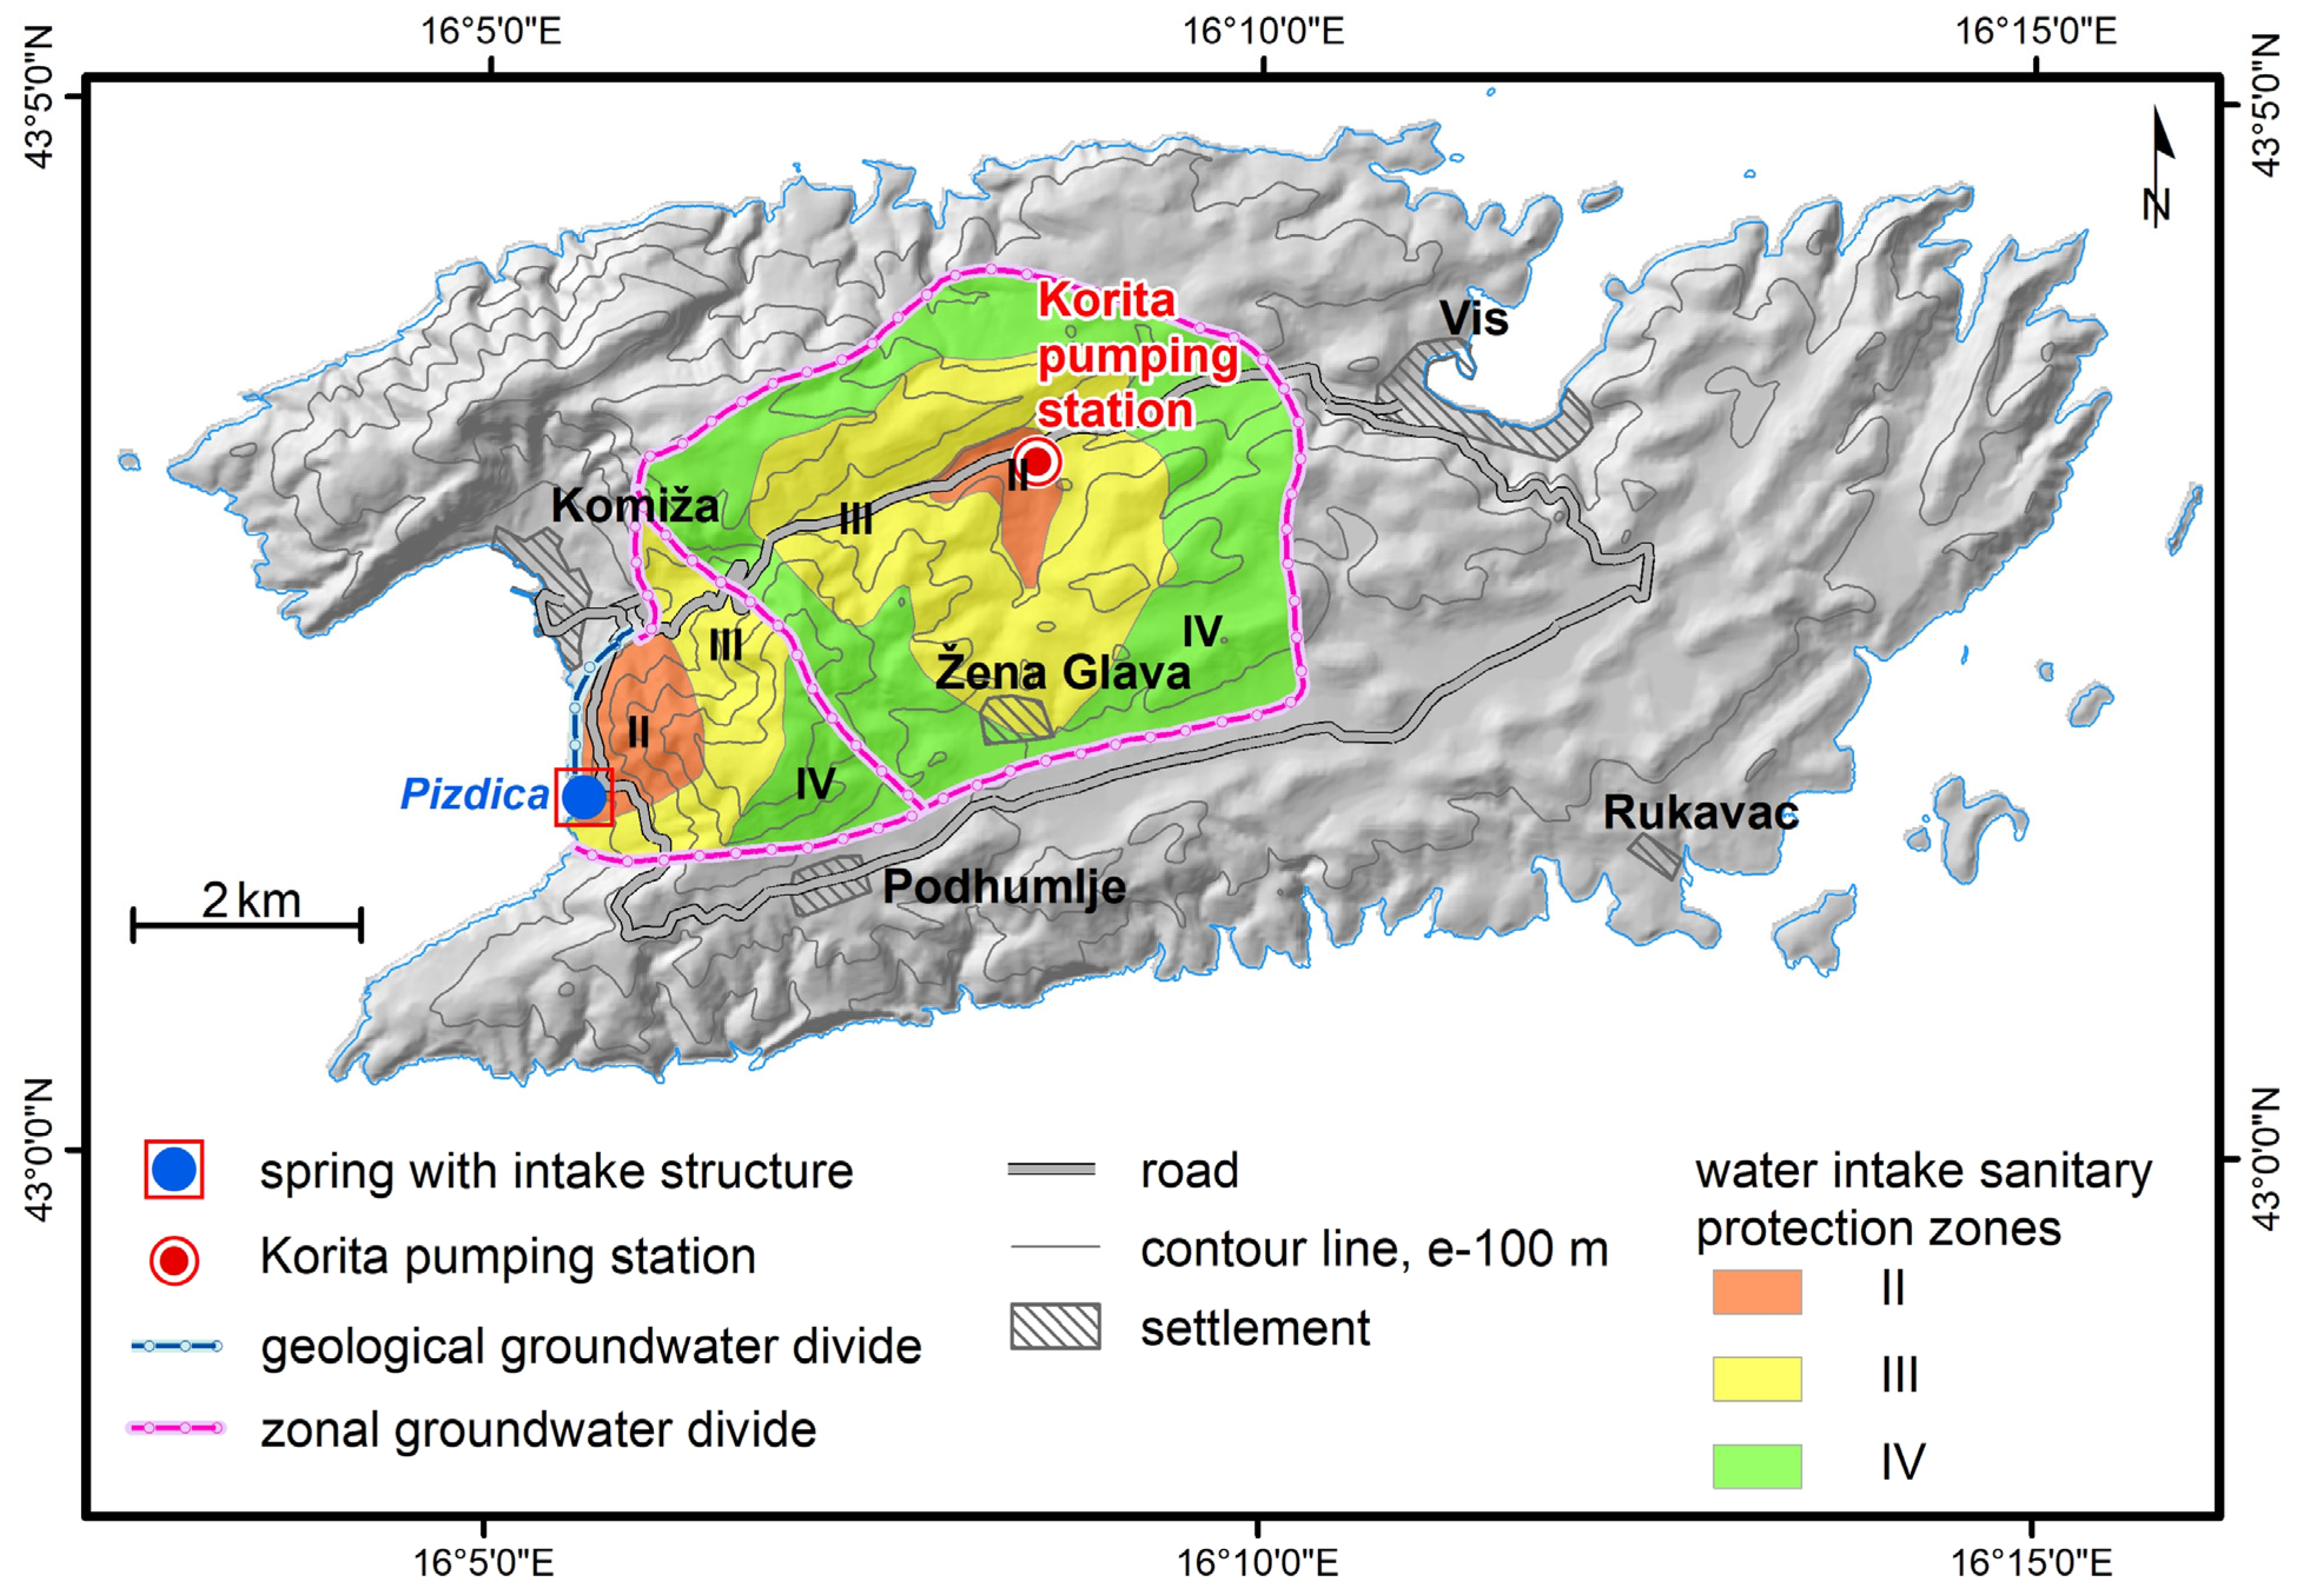
16] suggested that < 1% of the annually infiltrated water discharges from all registered spring localities and zones, whereas > 99% of the total discharge occurs via diffuse outflow zones in the northern and southern coast. These zones are composed of highly permeable limestones that extend in narrow coastal zones. Therefore, seawater forms a wedge underneath the freshwater aquifer; however, it does not spread under the entire island as a result of the relatively impervious base zone a few tens of meters below sea level. All of these facts support the assumption that additional groundwater quantities could be extracted, either by further increasing the pumping rates at Korita, or with the more long-term sustainable option of drilling new wells in a few prospective zones after further hydrogeological and geophysical investigations. This study also proposed SPZs for the public water supply system of Vis island, which encompassed the entire catchments of the Korita pumping site and Pizdica spring (
Figure 11). These SPZs were subsequently approved by the local authorities, such that the protective measures are being implemented, which is of vital importance as the island currently has no alternative water supply option.
Previous research hypothesized the existence of a single catchment area for Korita and Pizdica [
16,
38], whereby the presumed groundwater flow was from the central aquifer and the area around Korita towards Pizdica (except for the area influenced by the radius of the wells). On the other hand, the research and analyses in the present study, including the tracer test, provided an improved insight into the system and divided it into two catchments that are separated by a zonal groundwater divide (
Figure 4 and
Figure 10). Moreover, the findings demonstrated that the main flow direction from Korita is eastwards, whereas it was previously considered to be towards Pizdica in the west. These findings have a paramount impact on the understanding of the hydrogeological relationships on Vis Island, as well as strong implications for the protection of local water supply sources through SPZs. More detailed studies using hydrochemical and geophysical methods could lead to the delineation, and possibly utilization, of other separated catchments, which we have only postulated here on the basis of the geological and structural settings and basic hydrochemical data.
The groundwater resources of Vis Island are a very interesting research topic for karst hydrogeologists, and currently represent the only source of water supply for the island. Several questions remain unanswered following this study, and further research should aim to perform continuous monitoring using data loggers and regular sampling for hydrochemical analyses. In addition, monitoring and/or early warning system boreholes should be established to protect against seawater intrusion after further bulk hydrogeological and geophysical investigations.
