Article

Spatiotemporal Evolution of Bed Configurations in Mixed Bedrock-Alluvial in Uniformly Curved Channels

by
Mamy Rija Andriamboavonjy
*,
Tomoya Terakado
and
Norihiro Izumi
Division of Field Engineering for the Environment, Graduate School of Engineering, Hokkaido University, Sapporo 060-8628, Japan
*
Author to whom correspondence should be addressed.
Water 2022, 14(3), 397; https://doi.org/10.3390/w14030397
Submission received: 7 December 2021 / Revised: 21 January 2022 / Accepted: 23 January 2022 / Published: 28 January 2022
(This article belongs to the Special Issue Research on Hydraulics and River Dynamics)

Abstract

:
River courses are rarely straight. Rather, they tend to be meandering. Incision meandering is one of the most common types of meandering discussed in river engineering. The availability of abrasive tools, coverage thickness, appropriate flow velocity, channel geometry, and flow level play a role in the natural phenomenon of bedrock incisions. Any minor change in those parameters, whether internal or external, can significantly impact the bedrock incision. The purpose of this study is to experimentally investigate the bedrock incision under sediment bedload transport along curved channels by varying flow speed with the other parameters kept constant. In this study, a bedrock incision was simulated in an annular flume. Two cases were considered, each with different rotation speeds of the cover lid, using plaster as the bedrock and sediment incision tools. In both cases, sediment motion was the bedload transport. It was found that the sediment deposited along the inner wall differed according to the rotation speed. A uniform transverse slope was found for a rotation speed of 48 RPM and moving bedforms were found for a rotation speed of 40 RPM. The bedrock incision resulted in the formation of the inner channel along the centerline of the flume, which grew more quickly toward the inner wall under the bedforms than under the uniform transverse slope. These findings suggest that the type of bedform has a more significant impact on bedrock incisions than rotation speed.

1. Introduction

Natural mechanisms for river path changes include alluvial and incision meandering. The former is mainly the result of bank erosion on an alluvial plain, while the latter occurs when a bedrock incision occurs [1]. The floodplains of meandering rivers are usually well-vegetated and rich in fine sediment. The combination of vegetation and fine sediment slows down the erosion and the lateral expansion of the river [2], with a positive impact on the aquaculture of the river system [3]. However, discussions on river incisions tend to be limited to their contribution to the landscape evolution [4,5]. Bedrock incisions were first discussed from an engineering perspective at the end of the nineteenth century, with arguments about their dynamics at the time [6,7]. Incision is commonly active on the bedrock, and it plays an essential role in landscape evolution.
The main parameters influencing bedrock incisions, according to previous studies, are sediment distribution, channel width, and flow fluctuation [8]. Sklar and Dietrich [9] suggested that bedrock incisions occur at the optimal bed coverage and shear stress. On the other hand, Zhang et al. [
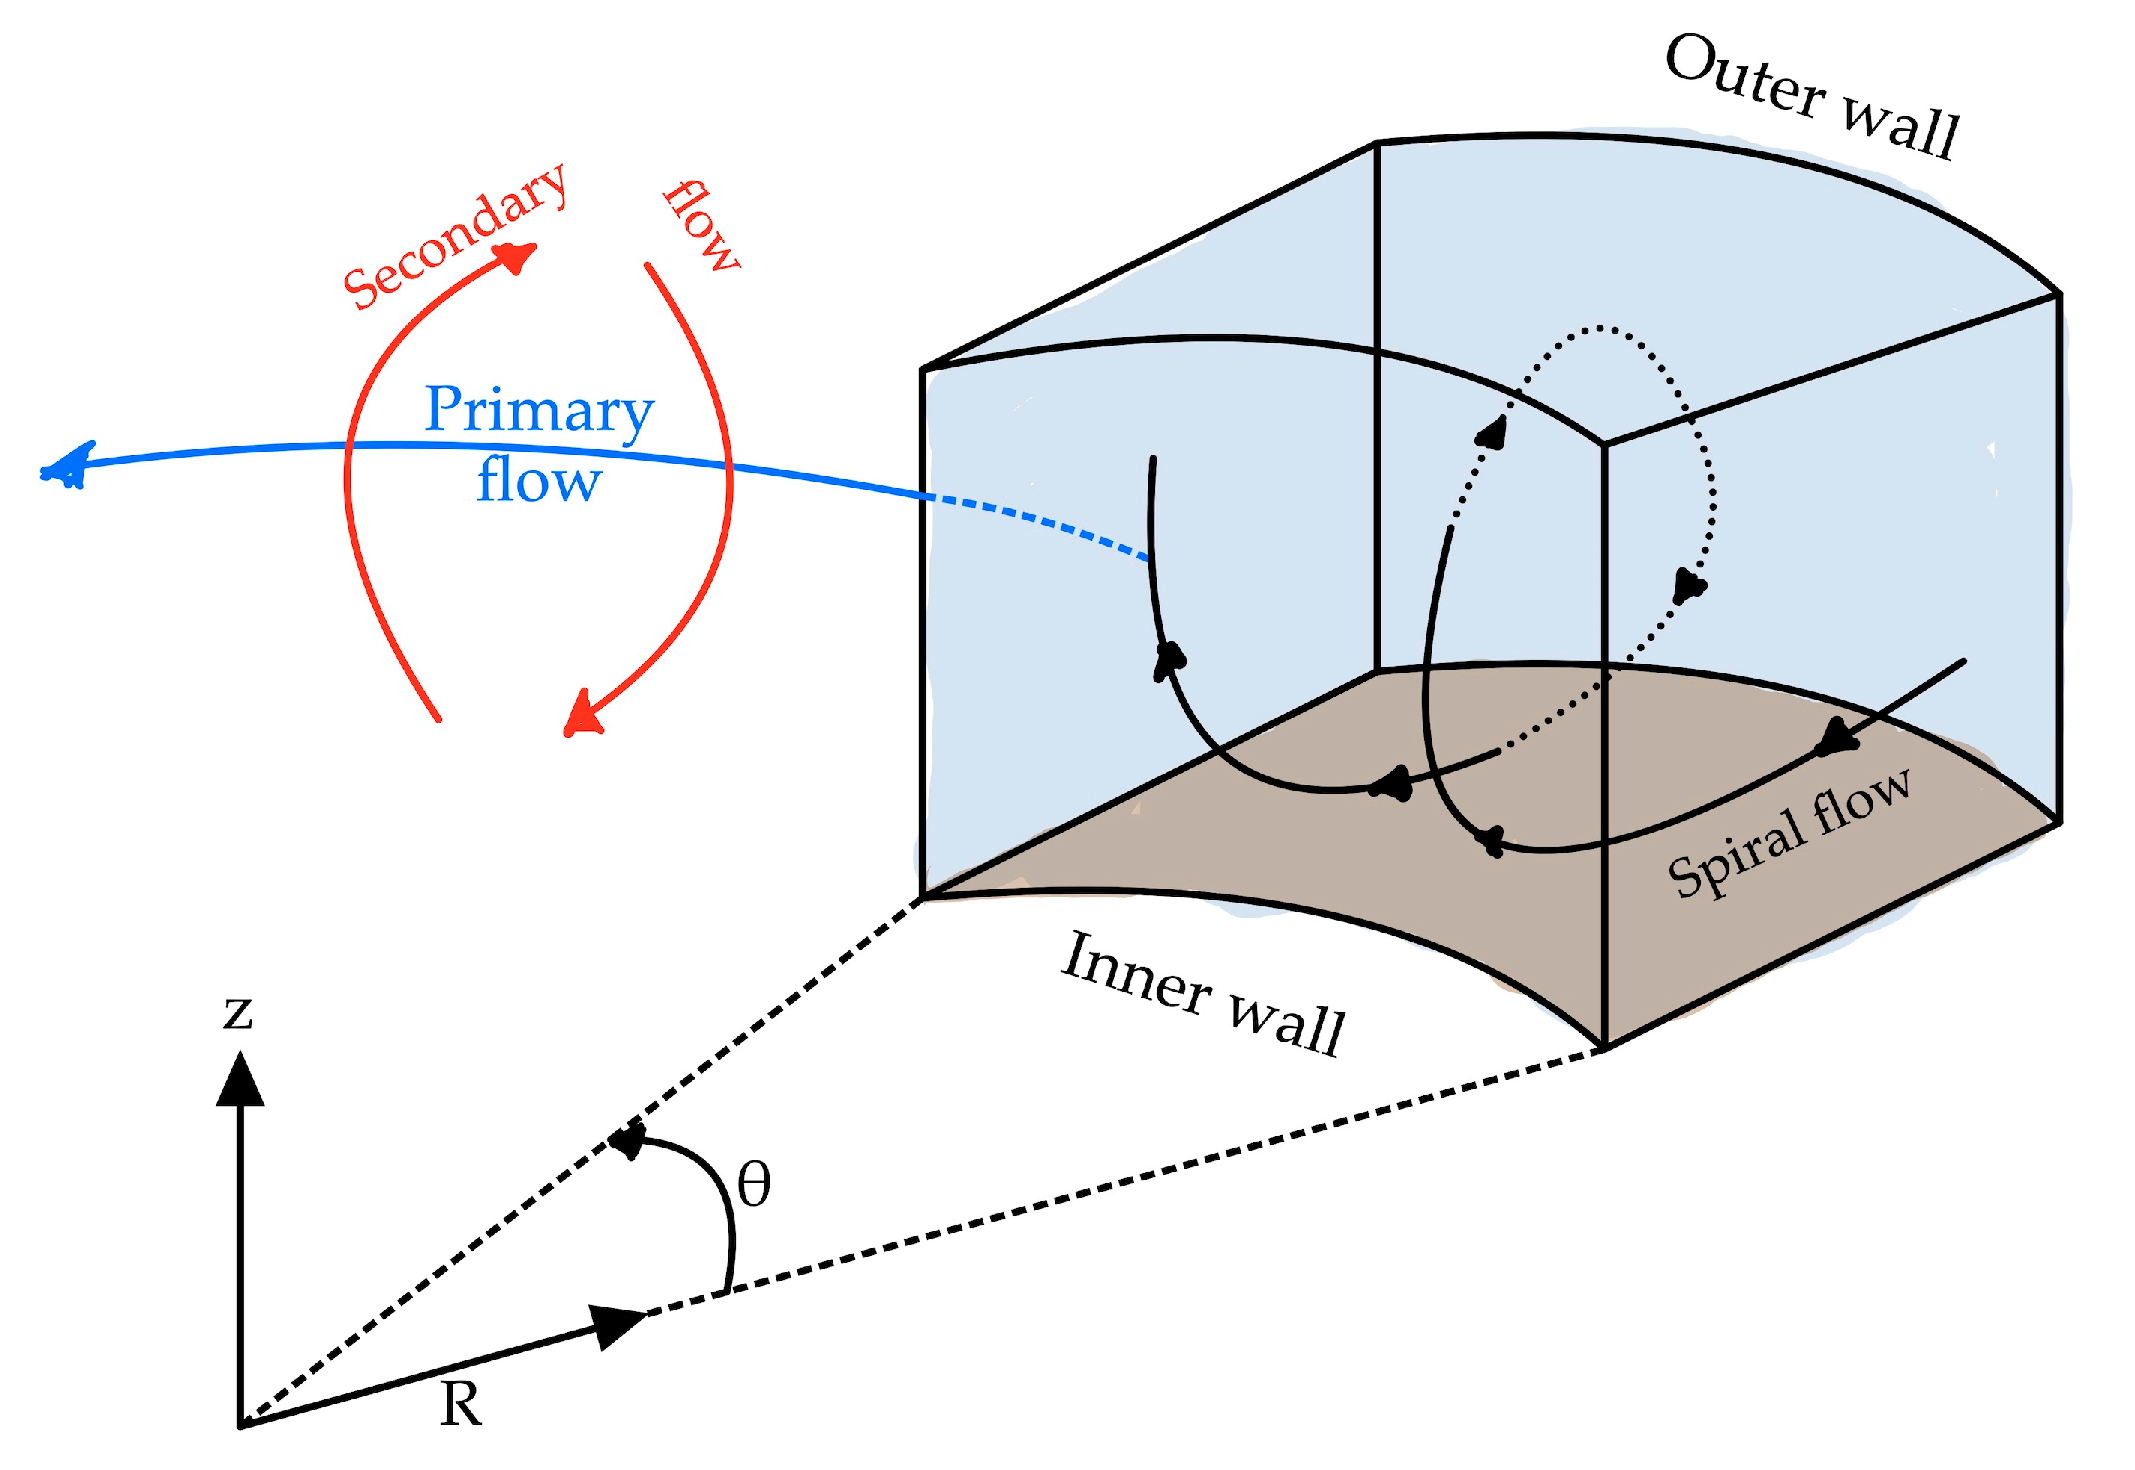
10] proposed a model considering the local bed state by integrating the bed cover fraction and the ratio of alluvial thickness to bedrock macro-roughness. These two models assume that the bedload transport of the sediment and the sediment grain saltation on the bedrock is the origin of the incision. While these interpretations are widely accepted, few studies have examined the factors that influence bedrock incisions in curved channels. The generation of spiral flow, as seen in Figure 1, and the redistribution of bed shear stress are the main features of flow dynamics in curved channels (e.g., [11]). They are found to impact the shape of the bed topography pattern in a movable-bed channel [12,13,14].
In earlier studies on the effect on the hydrodynamics of curved channels, an annular flume has been widely adopted in laboratory experiments. An annular flume has been shown to allow a continuous spiral flow to be generated similar to that in curved channels during the necessary timespan (e.g., [15,16,17,18,19]). Also, to control the spiral flow, the rotation of the cover lid of the annular flume is varied, and the other parameters are maintained at constant values (water depth and sediment amount, and caliber), e.g., [10,16,17].
In an annular flume, the flow velocity components (tangential and radial) and the bed shear stress increase with the top lid rotation speed (e.g., [16,18]). The tangential flow velocity increases from the inner wall towards the outer wall. Simultaneously, this spiral flow drags the sediment towards the inner bank and forms the transverse slope (e.g., [20,21,22,23]). The radial flow velocity has been shown to vary by between 20 and 50% of the tangential flow velocity near the bed [18]. When the spiral flow varies in space and time, the bed topography also fluctuates (e.g., [16,24,25,26]). It has also been reported that any variation of the channel morphology, bed state, and flow dynamics significantly affect the spiral flow characteristics (e.g., [10,16]). On the other hand, it has also been reported that the bed shear stress rises from the inner wall to the outer wall, except at the regions near the walls: right after the beginning of the cover lid rotation, the minimal second flow criteria are met, and the sediment is deposited along the inner wall, forming a uniform transverse slope which gradually turns into regular deposition patterns (e.g., [12,16,24,26]). Taguchi et al. [27,28] discovered a limited incised area experimentally and concluded that the erosion mainly occurs under the moderately covered bed, namely at the base of the transverse slope. They also suggested the alternance of the covered and exposed bed status as one more reason for the erosion. Their results were obtained with a constant cover lid rotation speed of 40 RPM, and mortar simulated the bedrock. It should be noted, however, that the erosion reported by Taguchi et al. [28] was likely only a small part of the erosion inside the annular flume. No analysis of the advanced state of the erosions that they found was included in their study.
In this investigation, we explore bedrock incisions experimentally along uniformly curved channels in the annular flume in a manner similar to that used by Taguchi et al. [27,28]. In our study, however, we use the plaster model of the bedrock for simulation purposes and we use different rotation speeds of the cover lid. The objectives of this investigation are to determine the precise locations of the occurrence of incisions along the uniformly curved channel, and the mechanism of the erosion in terms of space and in time and how that affects the sediment deposition patterns.

2. Materials and Methods

We conducted two experiments with different cover lid rotation speeds: 40 RPM and 48 RPM, which will be referred to as Case 1 and Case 2, respectively, in this paper.

2.1. Annular Flume

We conducted the experiments in an annular flume made of plexiglass, as seen in Figure 2. Figure 3 shows the schematic diagram of the annular flume. It has a rectangular cross-section with a width B = 100 mm, and a maximum depth Hmax = 180 mm, and a radius at the centerline of Rc = 450 mm. We adjusted the cover lid to have h = 50 mm of the water column. The rotation of the cover lid, placed on the water column, permitted the flow to generate inside the flume.

2.2. Bed Materials

We used plaster, a mixture of gypsum and water, as bedrock. We used the HS-650® gypsum provided by Noritake Co., Ltd., Nagoya, Japan. [29]. After the mixing process, the plaster was poured into the flume and was left for 12 h, then the excess water was pumped out, and the plaster was left to cure for 24 h. The amount of plaster used in our studies was such that it reached a thickness d = 60 mm. Plaster was used because it is easier and faster to prepare than mortar [27,28,30,31]. In addition, plaster has a lower resistance against erosion [32]. For Case 1 and Case 2, the plaster mixtures were 1:2 and 1:2.5 by weight of gypsum and water, respectively. It means that the bedrock in Case 2 was slightly softer than in Case 1. Regardless, the bedrock preparation was identical for both cases.
As sediment, 2.5 kg of sand was used. It is a natural sand (No. 5® provided by Tohoku Keisya Co., Ltd.) and it has a diameter D50 = 0.45 mm with a density of ρs = 2.61 g/cm3. Its grain-size distribution curve is presented in Figure A1, Appendix A [33]. The sand was painted red to contrast the bedrock with the sediment [27,28]. The sediment was dispersed on the bed surface before each start, as uniformly as possible. Water was then poured carefully into the flume to avoid the possibility of sediment disruption and any damage to the bed surface due to the water jet. For these reasons, the pouring flow was kept as low as possible, and the water was passed through a small-screen sponge. In our experiments, the water depth was 50 mm, and any excess water was removed for safety reasons.

2.3. Experimental Conditions and Data Acquisition

As previously stated, two experimental cases were conducted. In Case 1, the rotation speed was 40 RPM of top lid rotation, and in Case 2, it was 48 RPM. The studies by Taguchi et al. [27,28] were used as a guide for the speed in Case 1, and in Case 2 the aim was simply to investigate the higher rotation speed effects on the erosion. The amount of sediment remained constant throughout the experiments, and the sediment transport was kept to bedload transport, which was checked visually at the start of each experiment.
We ran the experiments within specified timesteps (Table 1). After each timestep, the bed surface topography was surveyed twice: first, the bed surface with the sediment coverage (WS) was surveyed, and then the bed surface without the sediment coverage (NS) was done.
We used laser scanning to measure the topography of the bed surface. However, the scanning equipment was different for the two cases: Case 1 used a Keyence CMOS Multi-Function Analog Laser Sensor, whereas Case 2 used an Artec EVA 3D scanner. The Sensor head IL-300 was utilized with the Keyence CMOS Multi-Function Analog Laser Sensor and was placed above the bed surface at a distance of 300 mm to provide the optimal precision of 0.5 mm [34]. Similar to the studies of Taguchi et al. [27,28], the bed surface was surveyed circumferentially at every 50 mm from the inner wall side. The 3D scanner Artec EVA of Artec 3D was operated at a 500–600 mm distance from the bed surface to provide better resolution. It has a resolution of up to 0.2 mm [35]. Contrary to the Keyence IL 300 Laser Sensor, the bed surface and the flume were surveyed and provided complete and continuous topography data.

2.4. Data Processing and Calculation

The measured data were in (x, y, z) format, representing the relative bed elevation of the bed surface in the cartesian coordinates system. It is then changed into a curvilinear coordinates system (s, n, z) for visual convenience. The tangential and radial coordinates (s, n) are respectively defined by the following:
n = R − Rc,
s = Rc × θ
where Rc is the radius at the centerline of the flume, which is 450 mm, R = x 2 + y 2 is the radius, and θ = tan−1(y/x). Hence, s = [0, 900] π mm; and n = [–50, 50] mm. The negative values of n indicate the half side near the inner wall of the annular flume. In contrast, the positive ones represent the half near the outer wall, and 0 is the flume centerline. Note that −50 is located on the inner wall side, and 50 is located on the outer wall.

2.4.1. Transverse Slope

We generated cross-section profiles for each timestep from the bed surface topographical map. We measured the width and the depth of the inner channel along those sections, denoted as Be and He, respectively (Figure 4). Photos of the bed surface are presented in Figure 5. We also retrieved the profile data from the 18 transverse sections equidistant by 50 π mm (Figure 6). The average erosion rate (Em) is obtained by dividing the difference between the sequential bed surface and the original bed surface by the duration.

2.4.2. Sweep Width

The sweep width, denoted as W, was defined as the bedrock surface area inside which the transverse slope base undulates (Figure 4). This sweep width is also retrieved from these cross-section profiles. It is defined by the difference between the minimum and maximum radial coordinates of the transverse slope base on the bedrock surface.

2.4.3. Fraction of Exposed Bed

The fraction of the exposed bed, denoted as Po, was calculated by analyzing the topographical map of the bed surface. First, we generated the sediment thickness maps. Then the spatial analysis tools implemented in ArcGIS [36] were used to delineate and calculate the areas of the exposed bed (Ao) and the sediment coverage (Ac) (Figure 4). To differentiate the sediment coverage to the exposed bed, we applied a criteria value of 0.5 mm on the sediment thickness map, which is the diameter of the grain. Values below 0.5 mm were considered to represent the exposed bed, and higher values were considered sediment coverage. The following formula can be used to describe Po, according to the study of Sklar and Dietrich [9]:
Po = Ao/(Ao + Ac)

3. Results

The sediment deposition patterns with the corresponding transverse slope profiles and the evolution of the bedrock incision were determined for Case 1 and Case 2. Figure 5 shows two photos of the resultant bed configurations for Case 1. The sediment bed coverage constituting the bedforms (red-colored) was deposited along the inner wall, and the exposed bed (white-colored) along the vicinity of the outer wall could be observed (Figure 5, left). The bed incision resulted in the formation of an inner channel along the centerline of the flume. Moreover, light and linear scours were also noticed on the exposed bedrock (Figure 5, right).
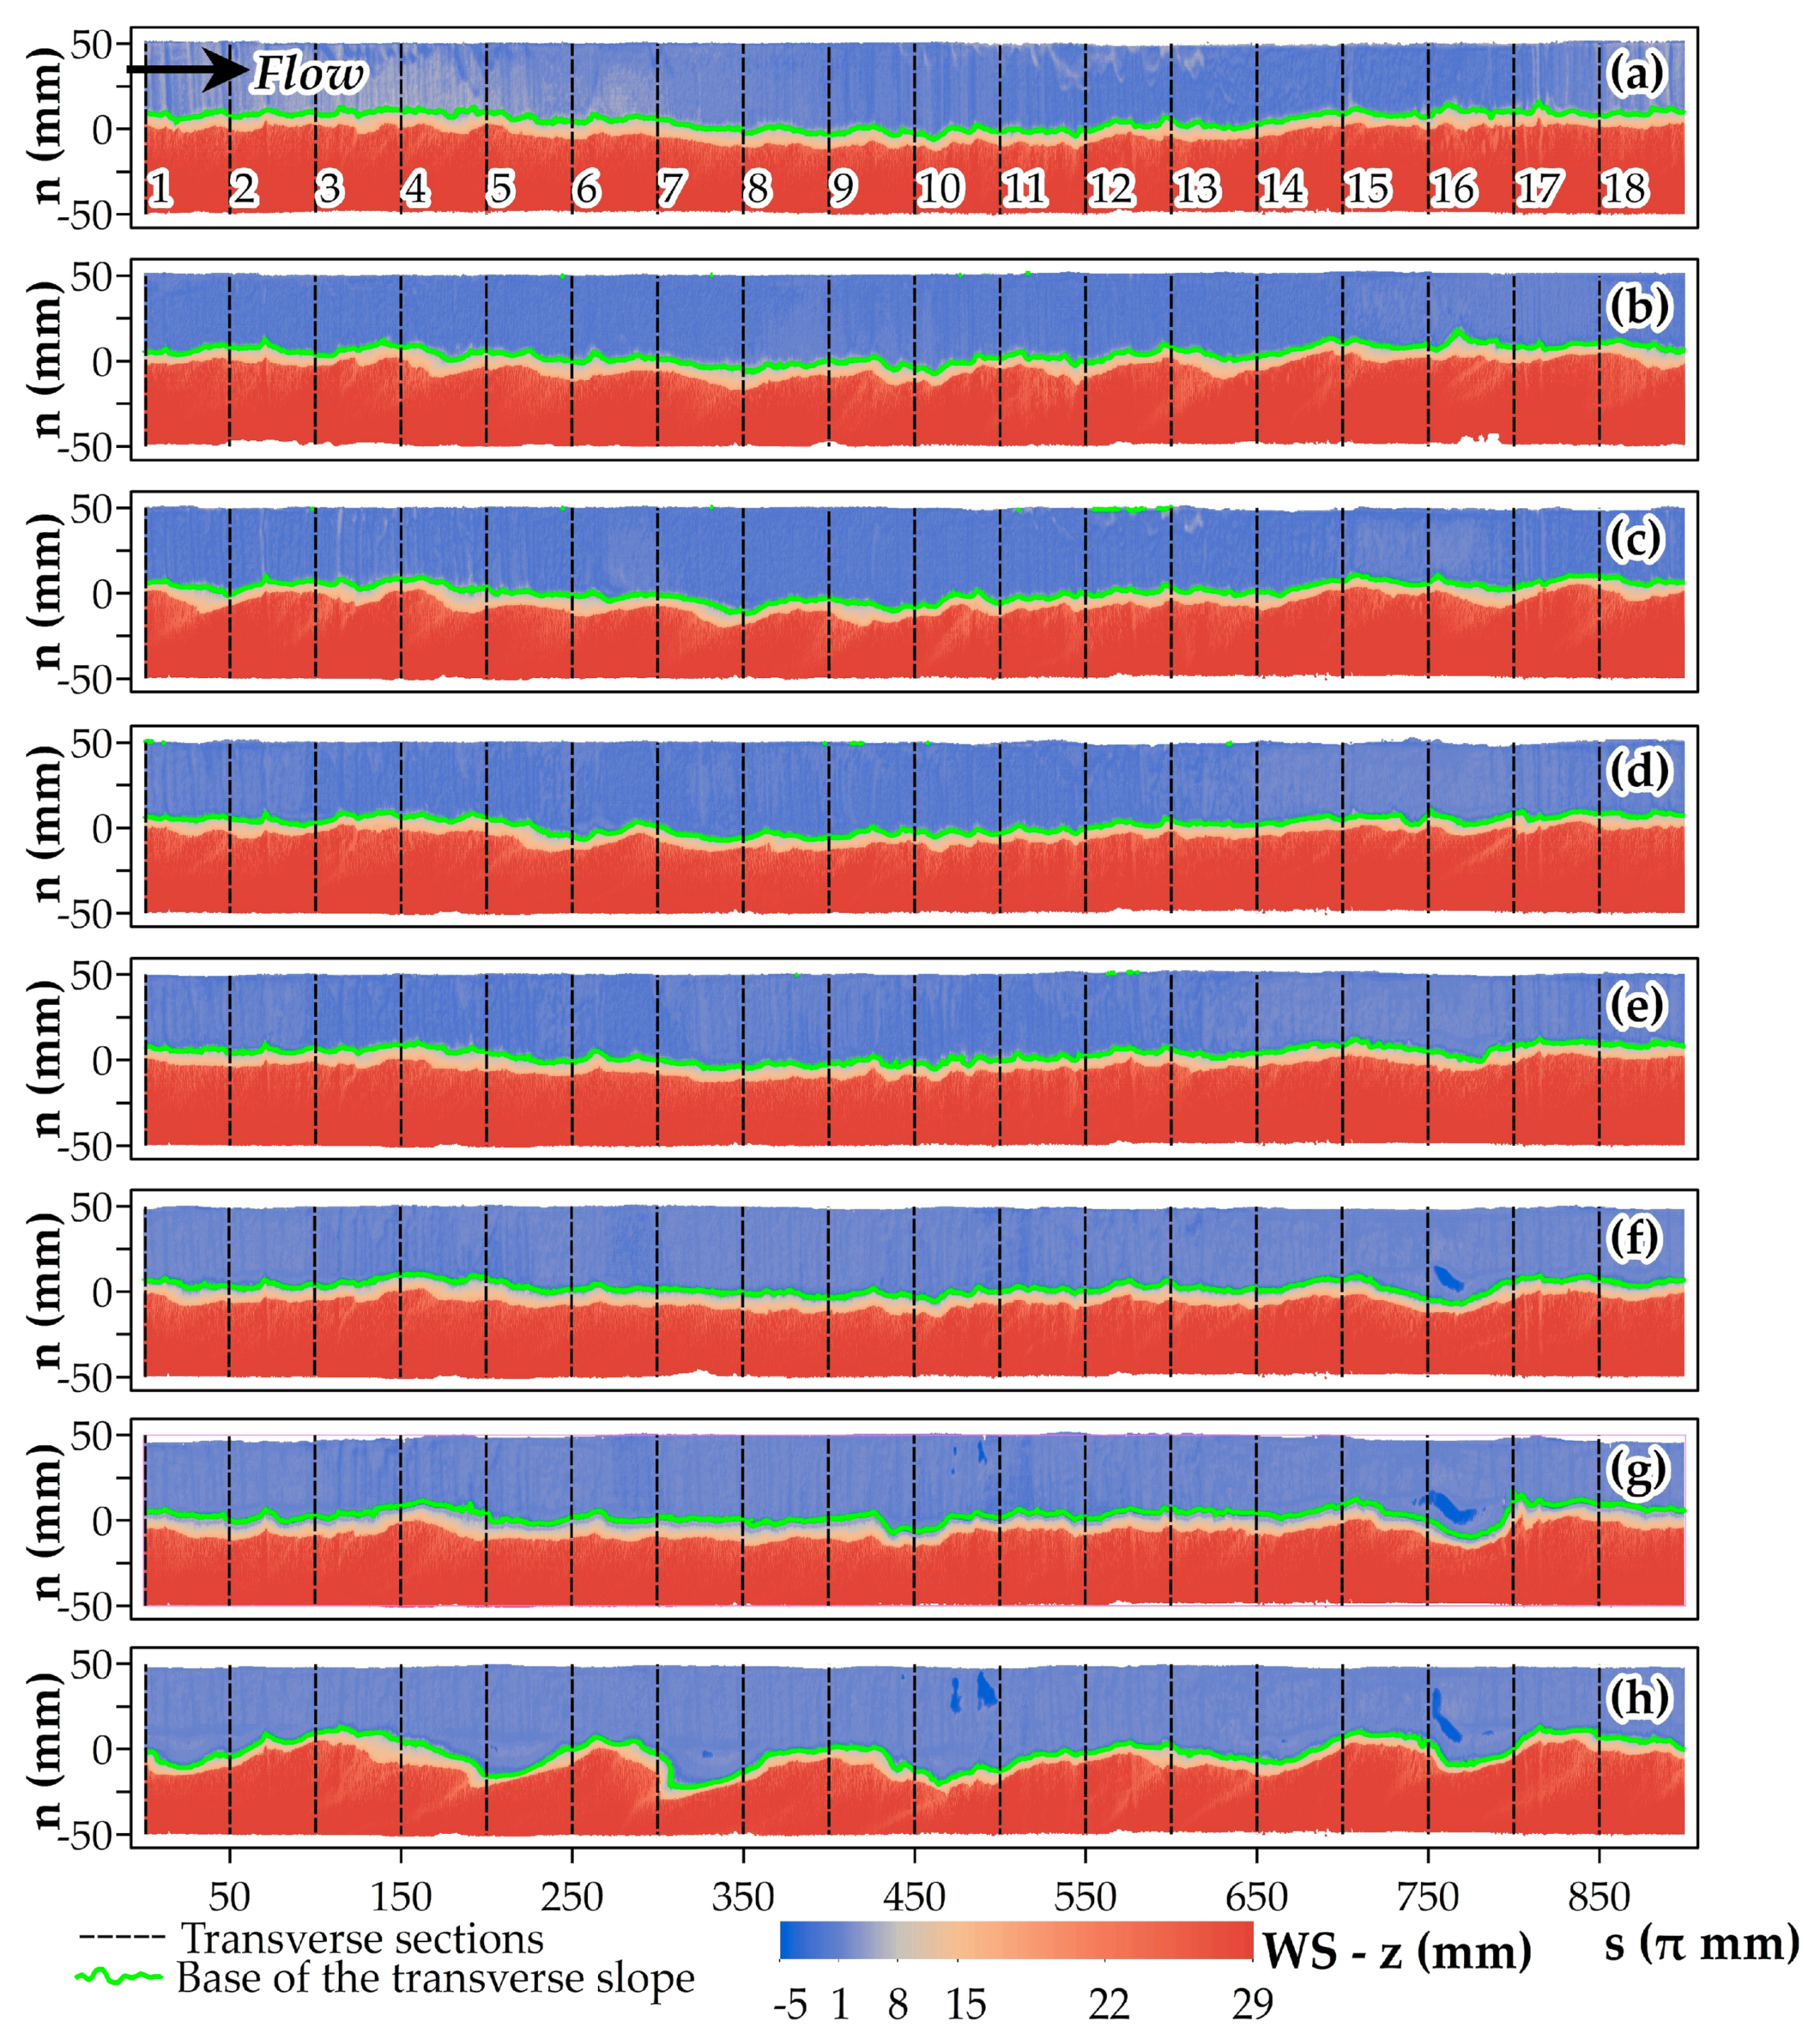
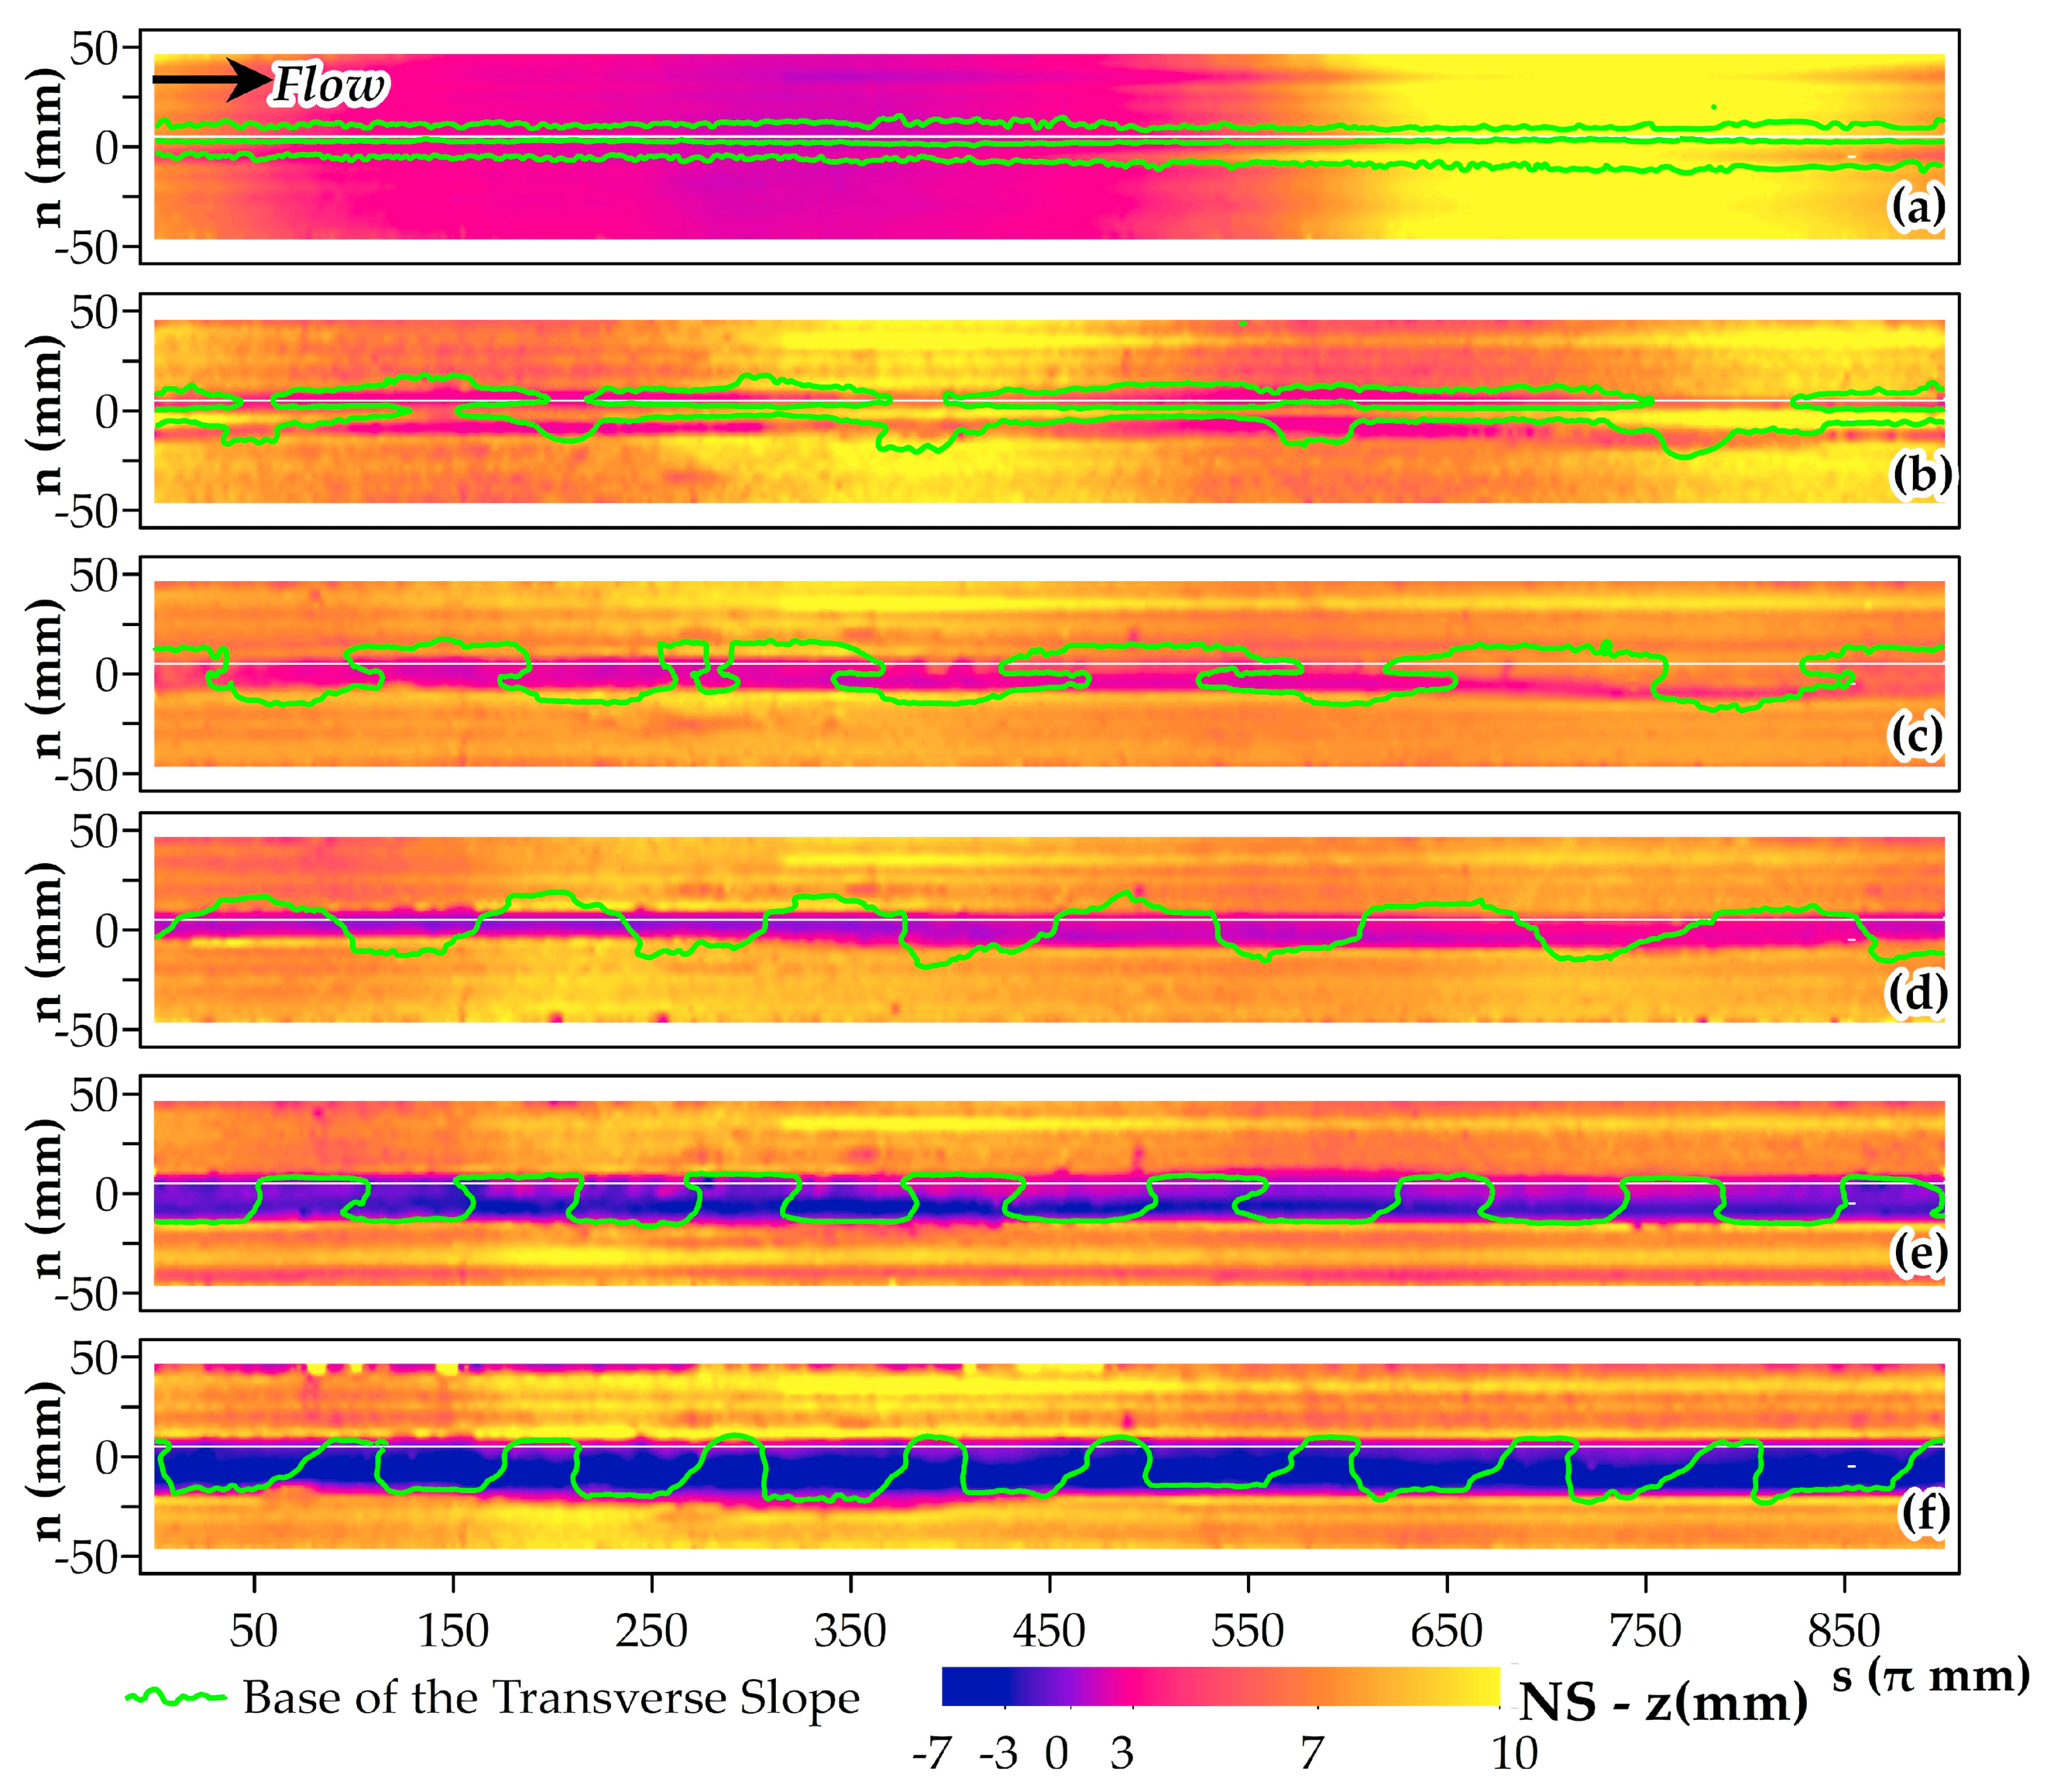
Figure 6 shows the plan views of the bed topography for both cases, the sediment deposition patterns, and the bedrock surface erosion. The WS represents the bed surface with the sediment (Figure 6a–g), whereas NS indicates the bed surface after removing the sediment coverage. (Figure 6h–n) The timesteps 1, 4, and 6 are displayed to show the temporal evolution of the bed configurations. Timestep 8 of Case 2 is also presented here, indicating the result after slowing the rotation speed to 40 RPM (Figure 6g for WS and Figure 6h for NS). The plan view over the whole series of timesteps can be found in Appendix B and Appendix C (Figure A2, Figure A3, Figure A4 and Figure A5).

3.1. Sediment Deposition Patterns

The sediment transport inside the flume started soon after the experiment began. Initially, the sediment was dragged toward the inner wall due to the spiral flow and formed a uniform transverse slope along the inner wall. The uniform transverse slope was observed in Case 1 (Figure 6a), as well as in Case 2 (Figure 6d). It was found that the sediment generally covered half the flume width.
Gradually, the uniform transverse slope turned into migrating bedforms, depending on the in-flume conditions. For instance, the bedforms were observed throughout Case 1, their wavenumber increased, and their shape changed with time (Figure 6b,c). In Case 2, there was little evidence of bedforms and the sediment deposition along the inner wall side looked like a uniform transverse slope (Figure 6e,f). At the timesteps 2 and 3, twelve bedforms were observed (Table 1). There were also six bedforms at timestep 8, when the rotation speed was lowered to 40 RPM (Figure 6g).

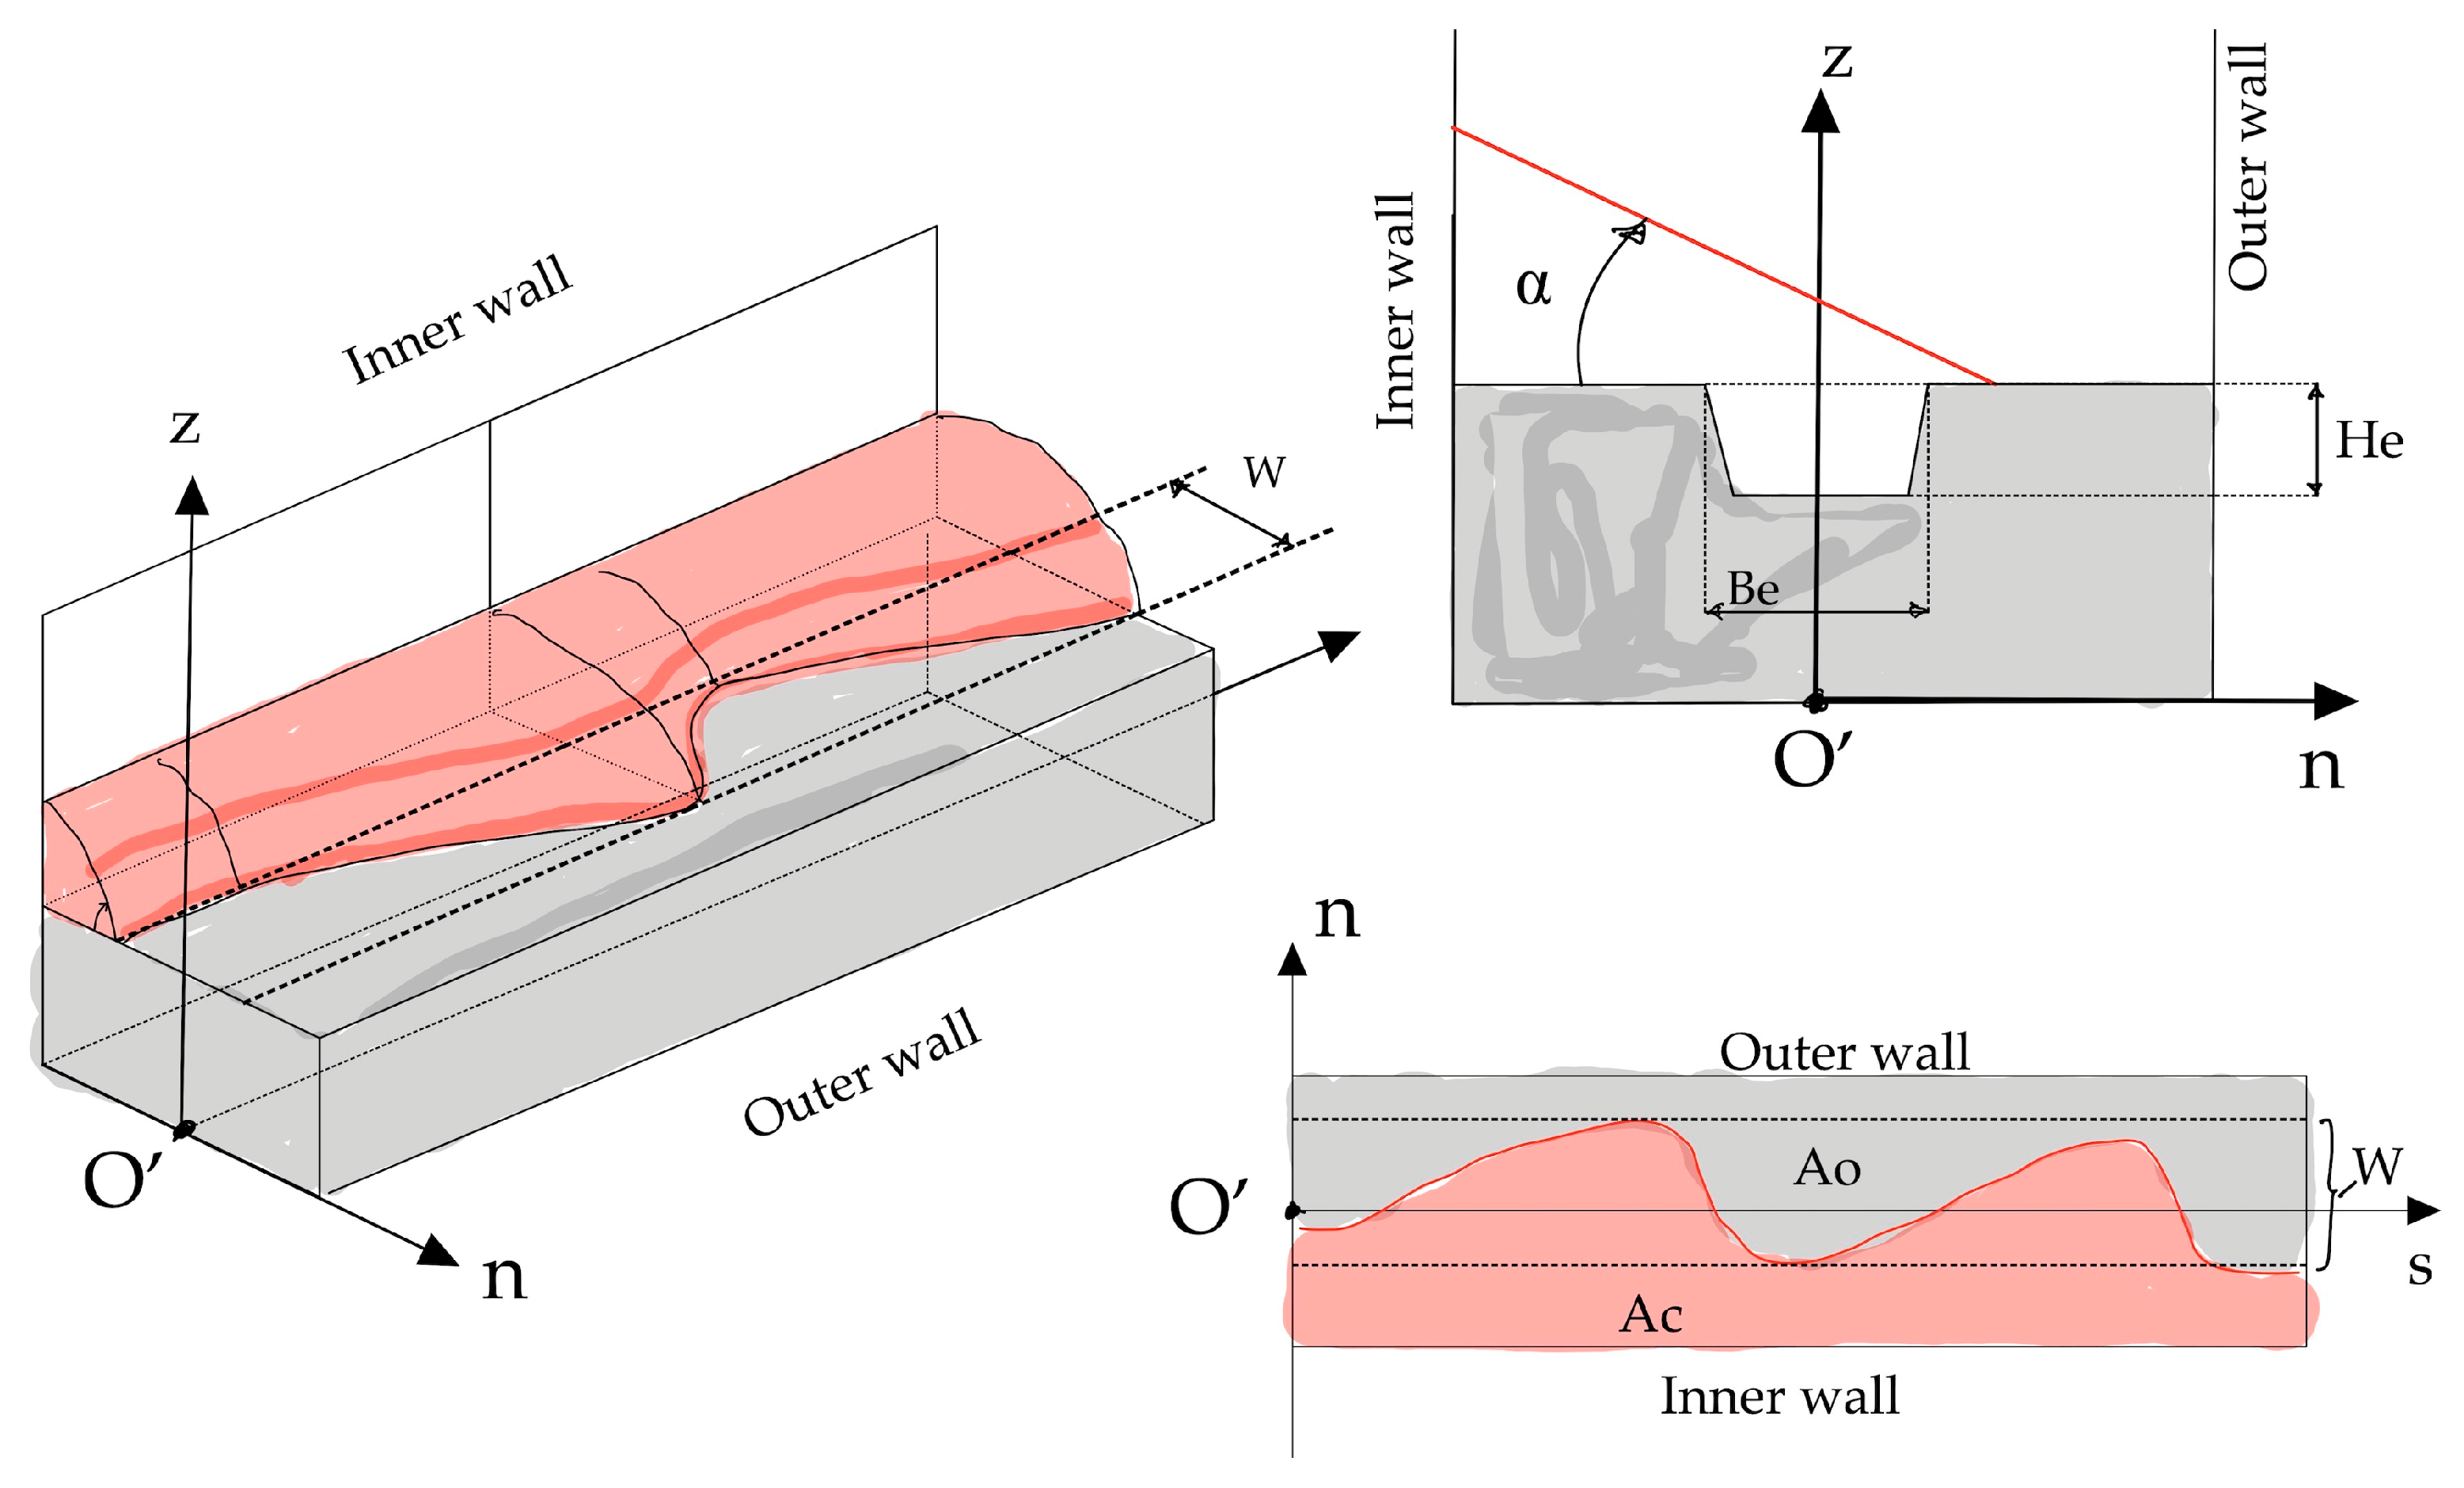
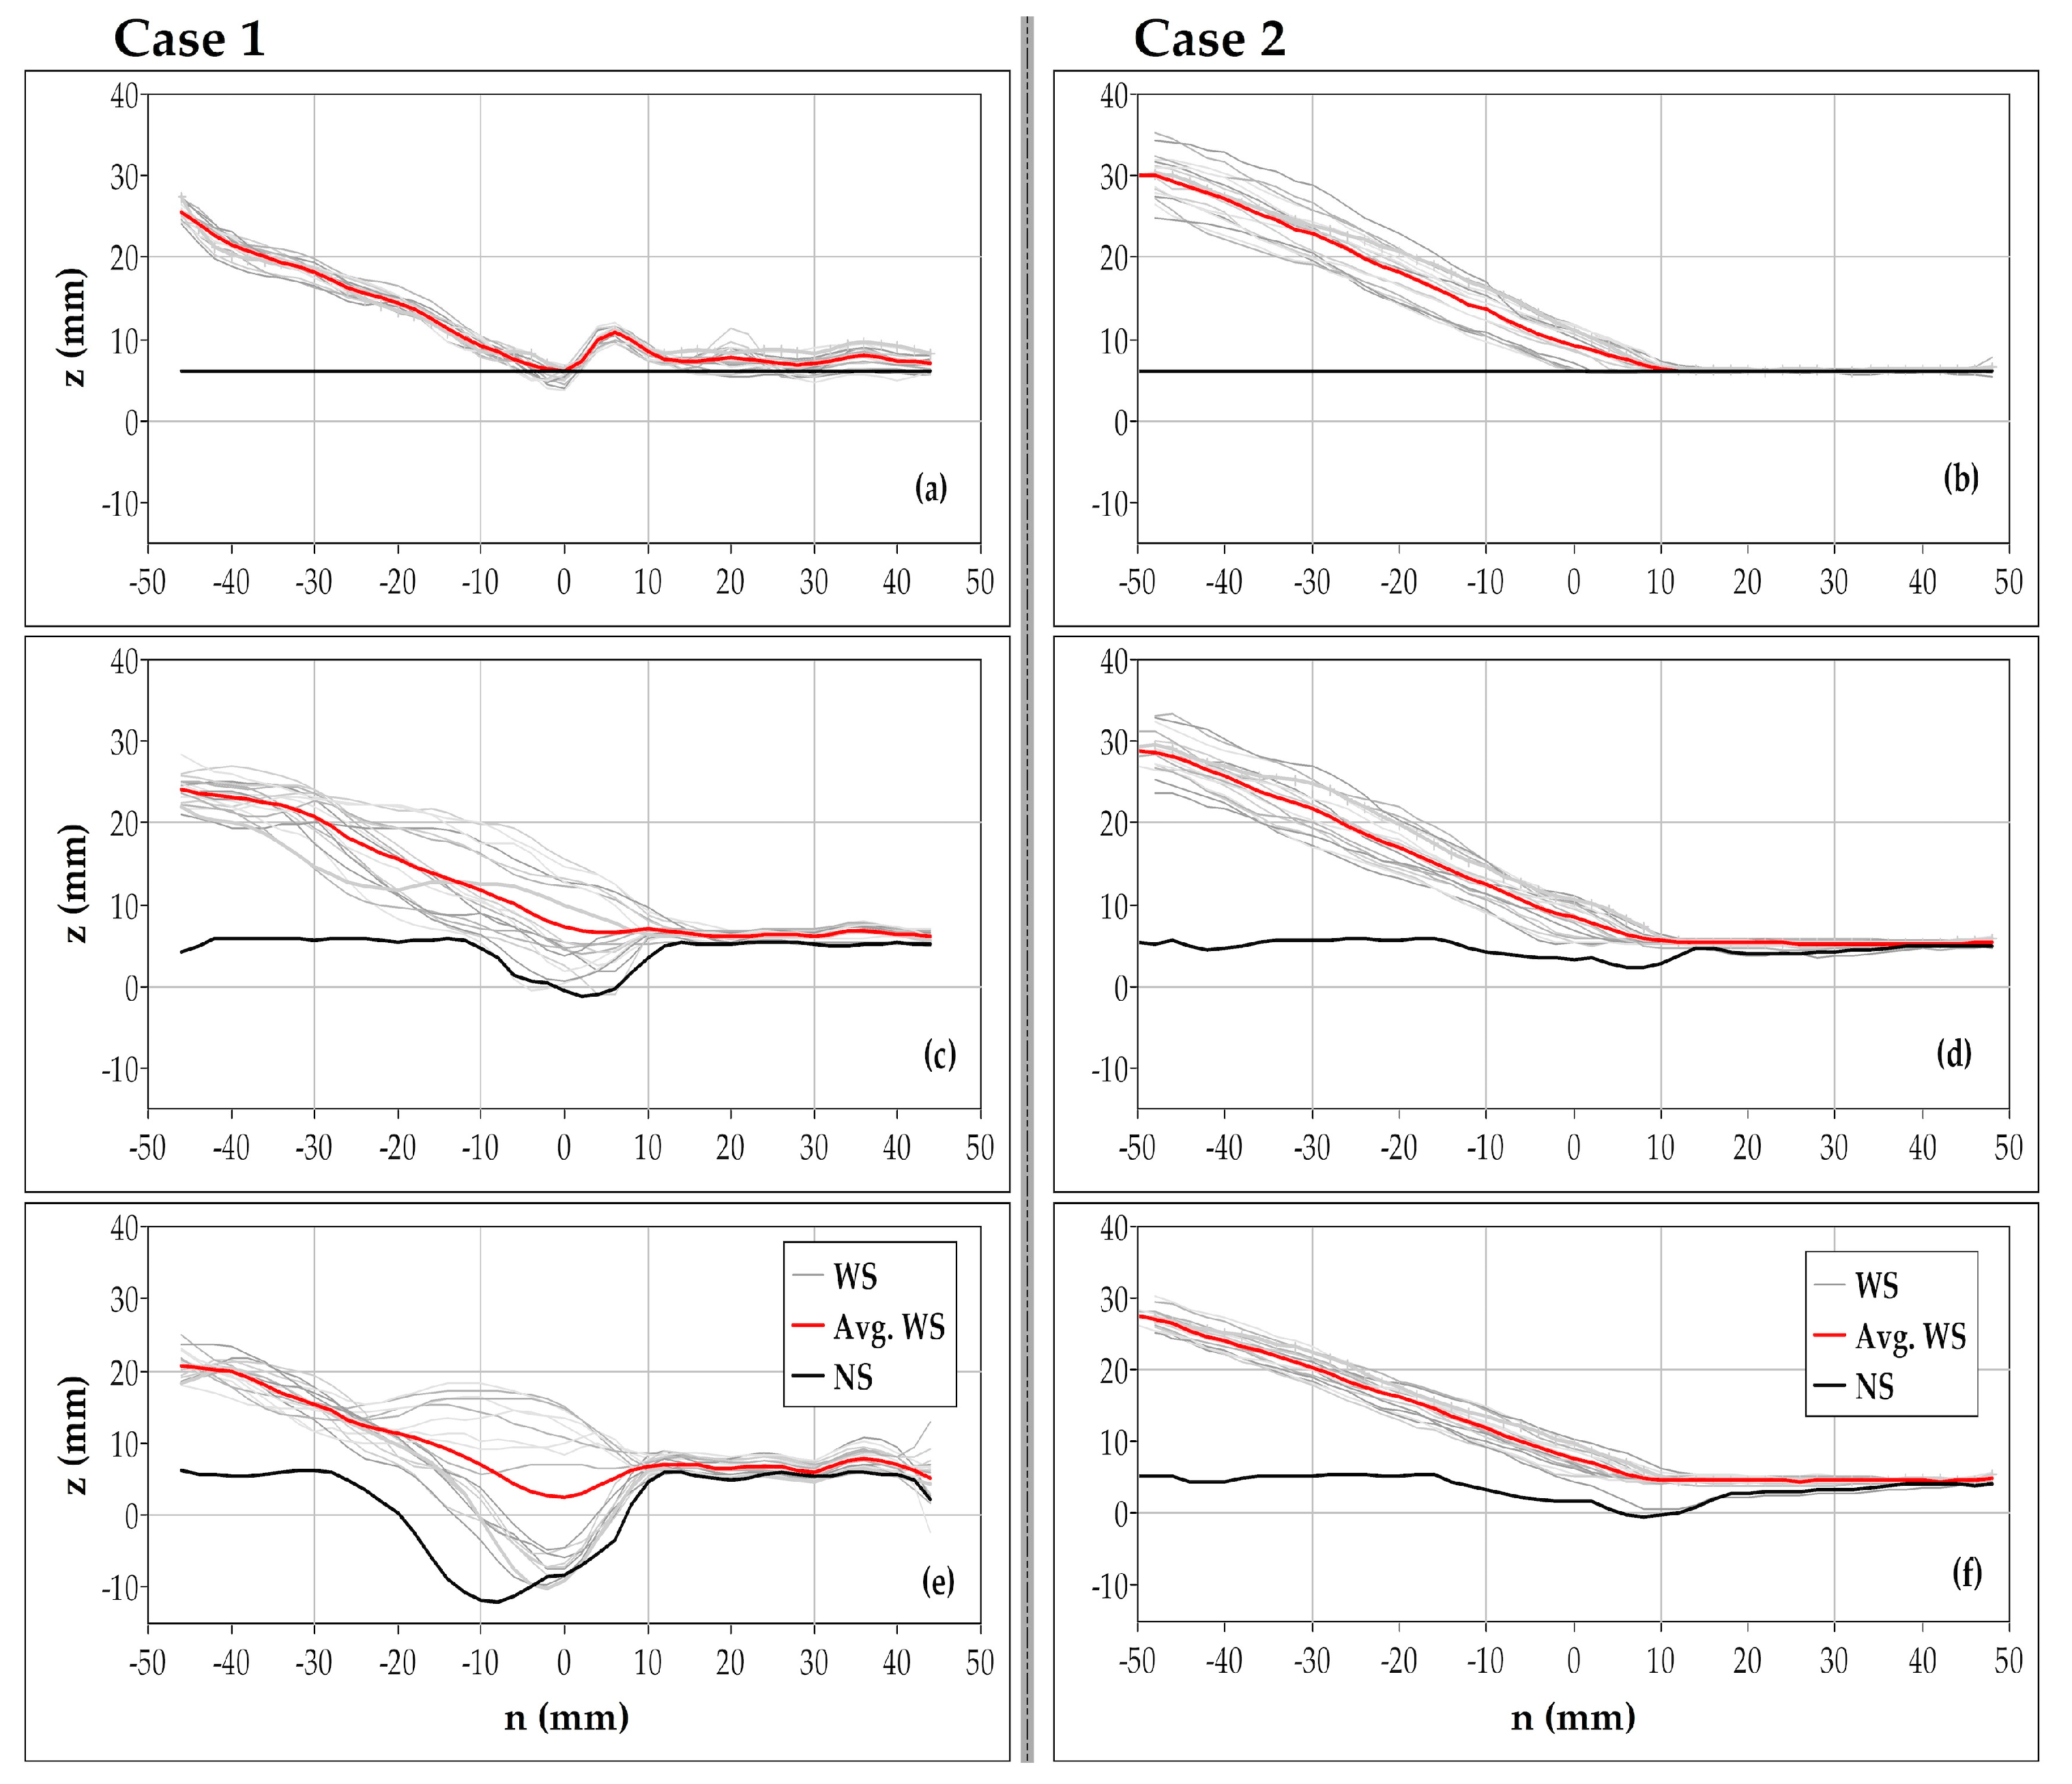
3.2. Transverse Slopes and Sweep Width

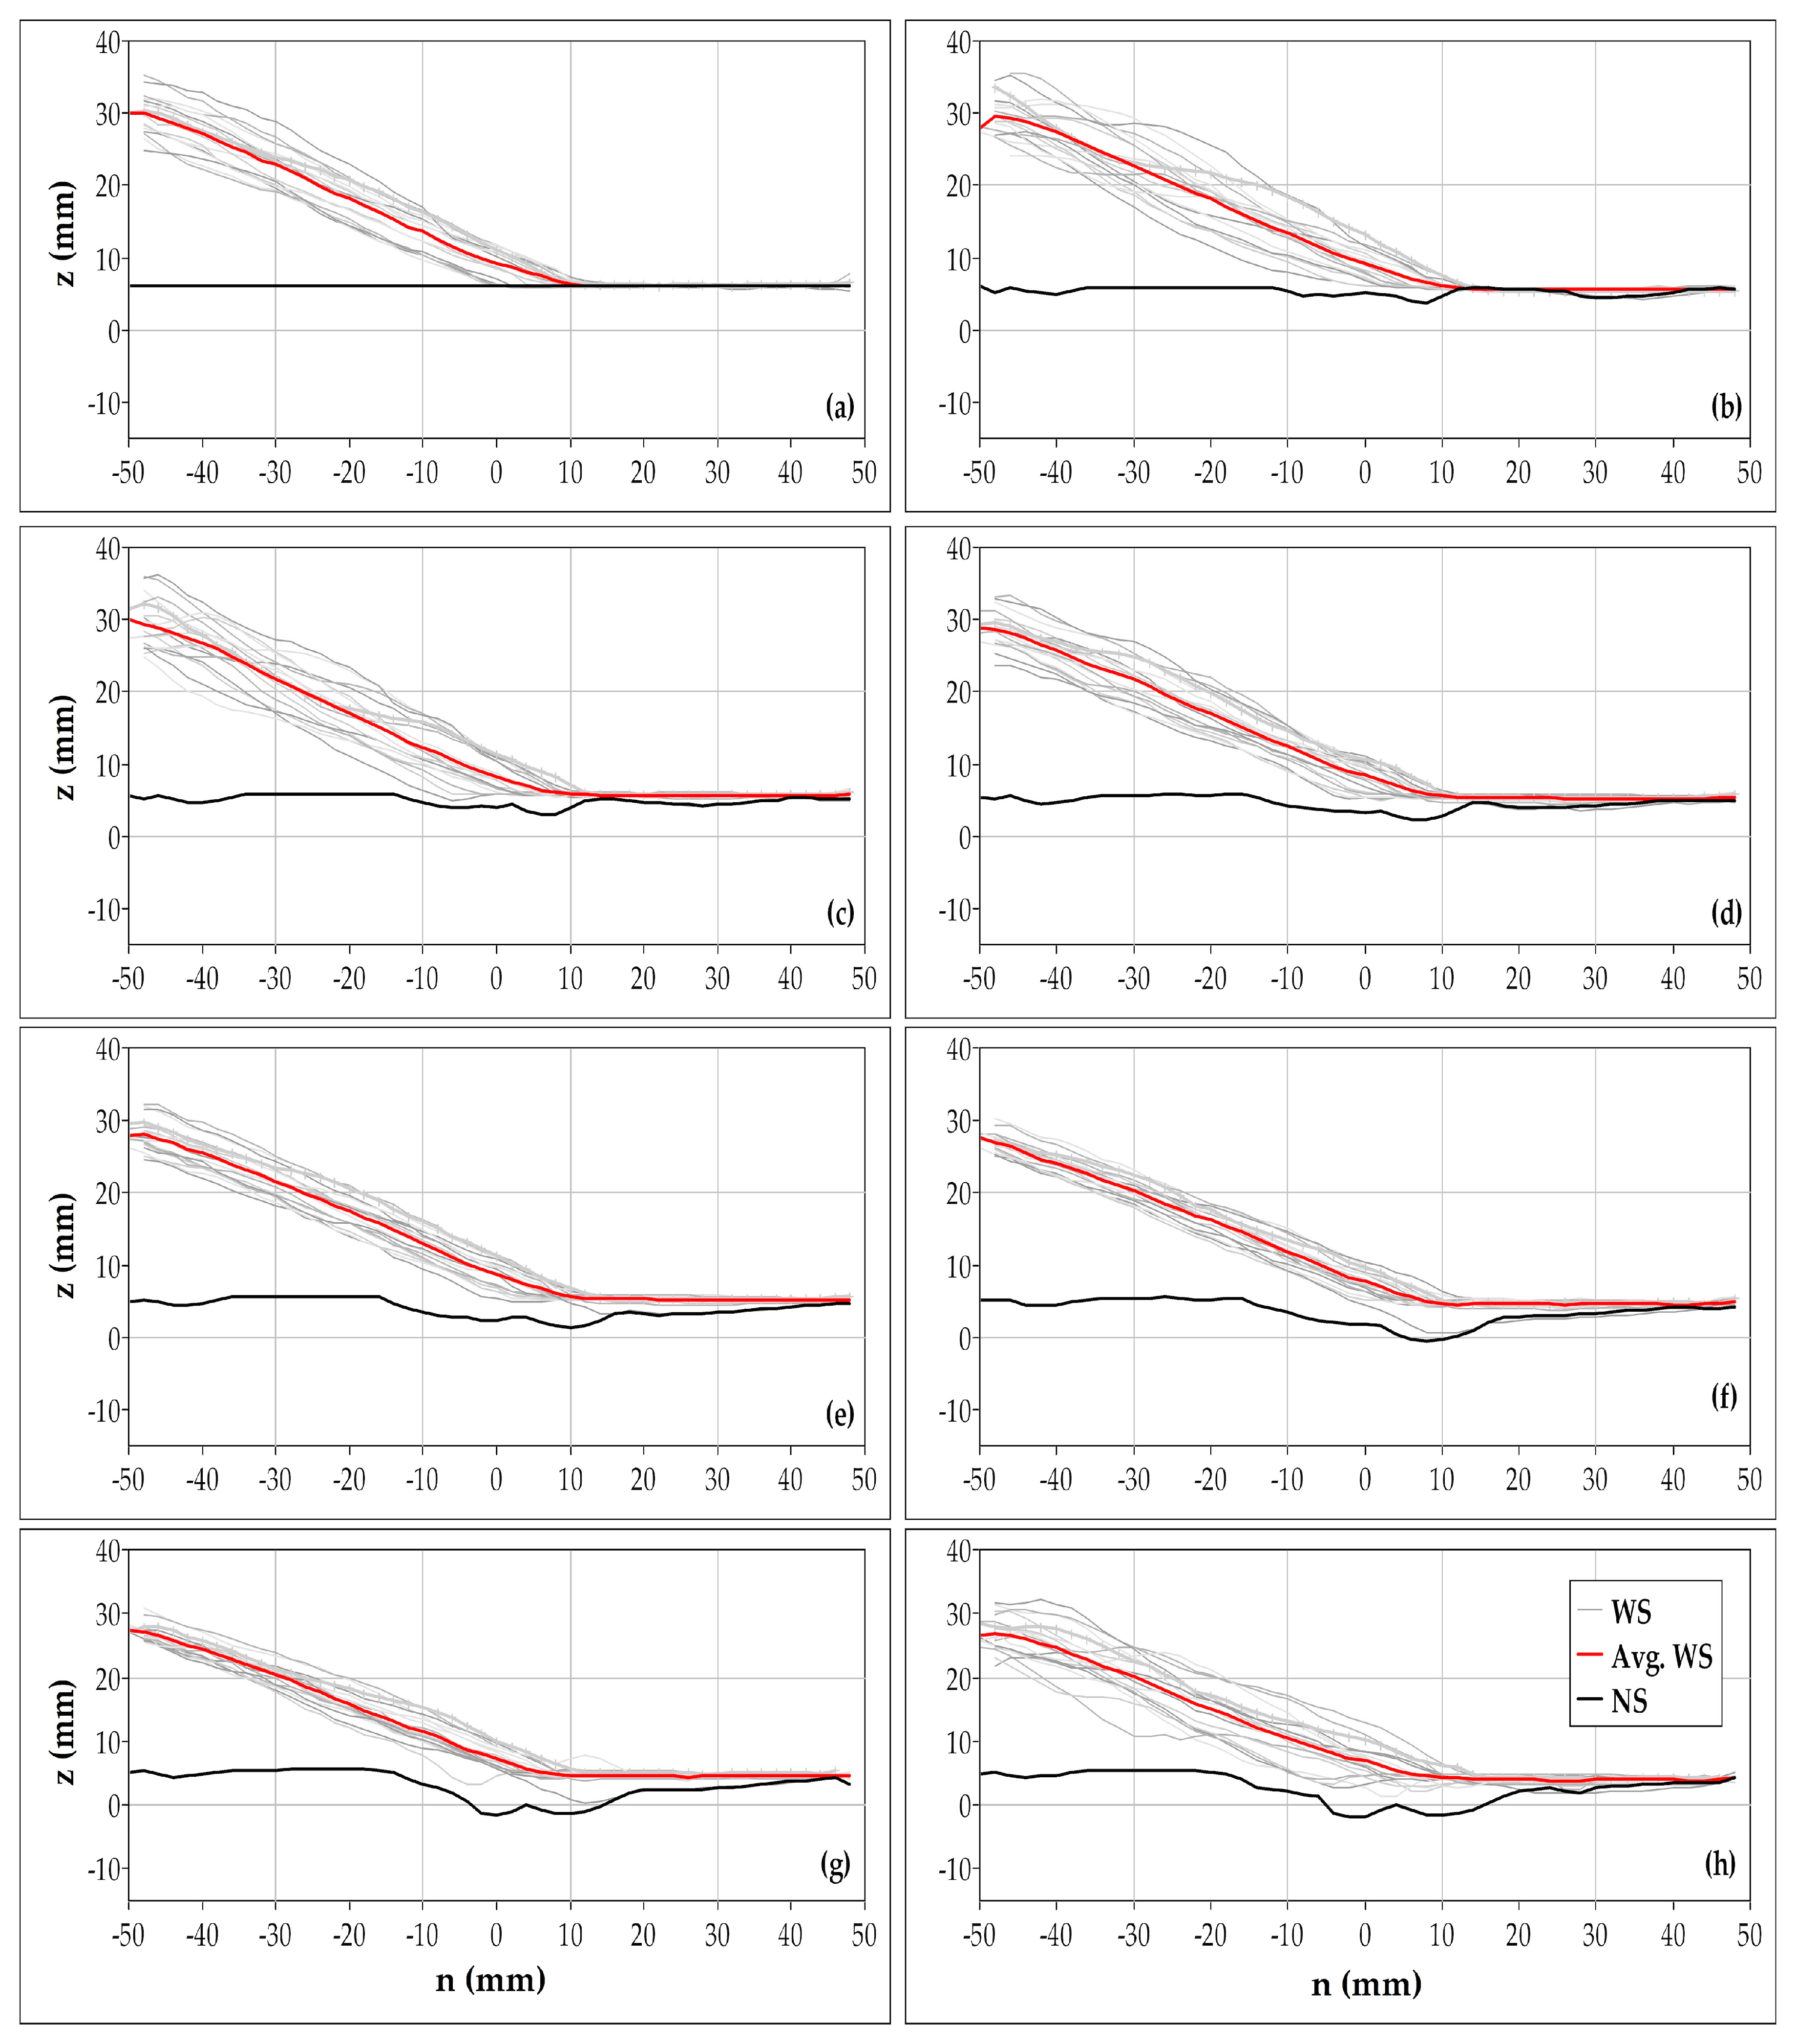
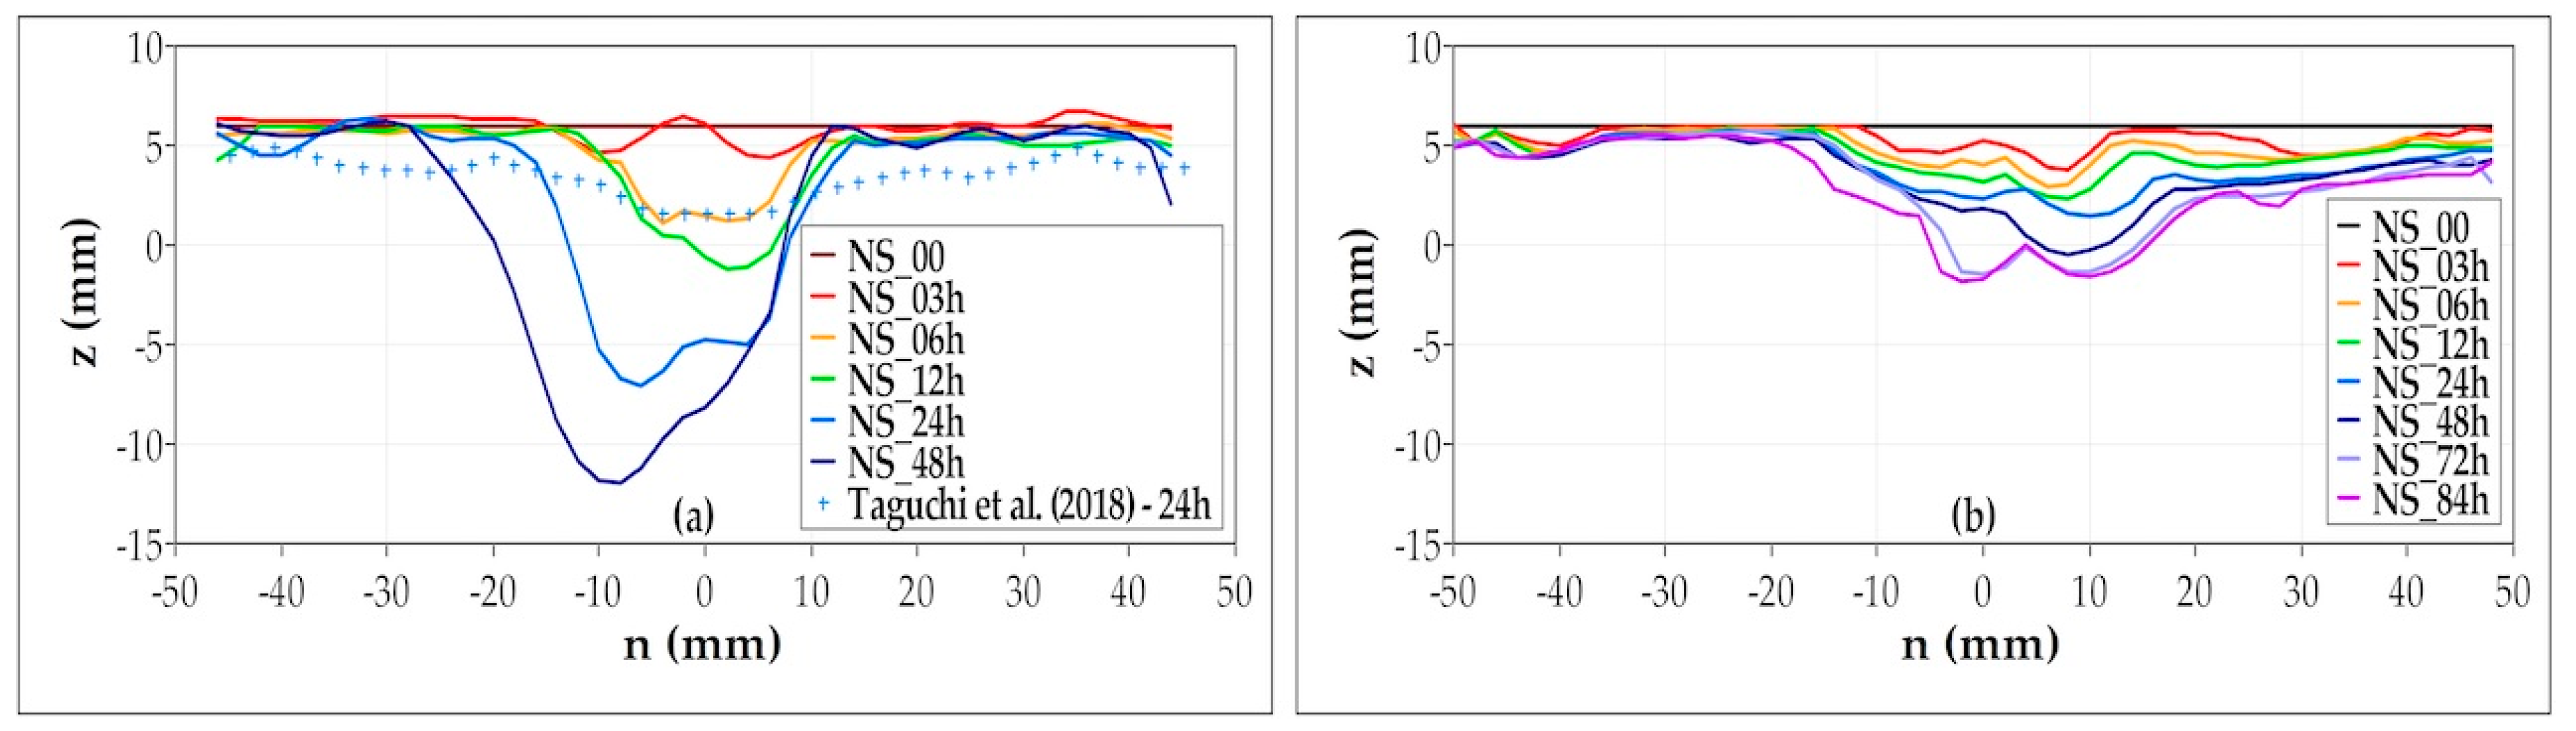
Figure 7 shows the transverse slope profiles of the sediment coverage, which were presented in Figure 6. The transverse slope profiles over the whole series of timesteps can be found in Appendix D (Figure A6 and Figure A7). We measured the transverse slope angle (α) and the transverse slope base sweep width (W). These are reported in Table 1.
For both cases, the average transverse slope is similar, at between 23 and 24 degrees (Figure 7). In Case 2, less variation was found for the transverse slope angle α, between 20 and 27 degrees, except at timesteps 2, 3, and 8, where the fluctuation of the angle α became significant, namely between 12 and 38 degrees (Figure A7b,c,h). In contrast, in Case 1, the variation of the angle α was significant, from 8 to 61 degrees (Figure 7, right and Figure A6.
In addition, with the formation of the bedforms, the sweep width (W) became wider. As seen in Figure 5, Case 1 showed well-formed bedforms (long wavelength), and W became wider than 25 mm (Table 1). In contrast, when the bedforms were poorly formed (short wavelength) or remained as a quasi-uniform transverse slope as in Case 2, W became narrower, at less than 25 mm (Figure 6d–f, Table 1).

3.3. Fraction of Exposed Bed (Po) and Average Erosion Rate (Em)

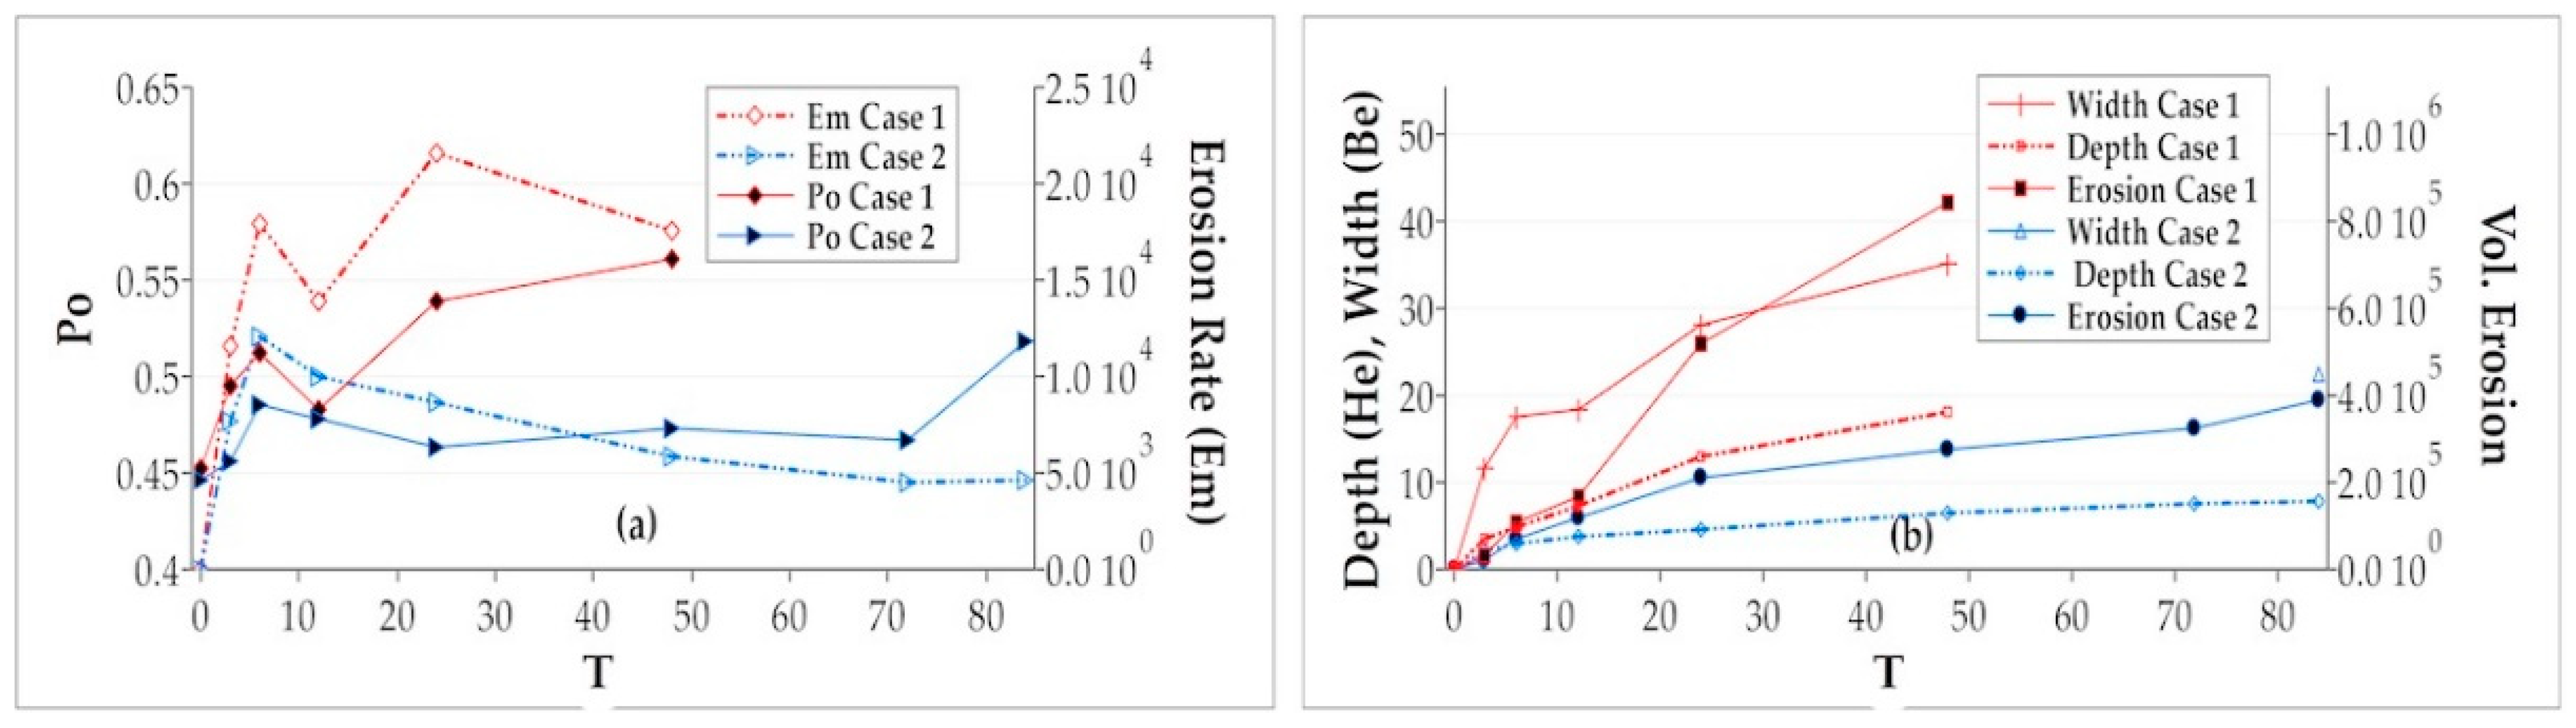
Figure 8a illustrates the plots of the fraction of exposed bed (Po) and the average erosion rate (Em) over time, revealing a close link between the two. A rise in Po was accompanied by a rise in Em.
In both Case 1 and Case 2, around 45% of the bed surface is exposed at first. Then, until T = 6 h, Em and Po grew and achieved local maxima. Following that, Em and Po in Case 1 increased, reaching 1.78 × 103 mm3/h and 56%, respectively, by the end of the experiment T = 48 h. In contrast, in Case 2, Em and Po decreased and stabilized at 4.8 × 103 mm3/h and 47%, respectively. Particularly in Case 2, Po increased and reached 52%, leading to a slight increase of Em by the end of the experiment when the rotation speed was reduced to 40 RPM.

3.4. Bedrock Erosion

As was explained, the water and sediment depth in Case 1 and Case 2 was identical, and the only difference was the cover lid rotation speed, at 40 RPM in Case 1 and 48 RPM in Case 2. This made it possible to investigate the effect of rotation speed on abrasion erosion on the bedrock surface by comparing the two cases.
First, the erosion in Case 2 was less than half that of Case 1. In fact, at the end of timestep 6, the total volume of erosion in Case 1 was 800,000 mm3, whereas it was only 300,000 mm3 in Case 2 (Figure 8b). In general, the erosion graphs grew quickly from the start until T = 6 h, and gradually increased afterward. However, a sudden rise in the erosion appeared at T = 24 h in Case 1, and at T = 84 h in Case 2.
Second, the lateral expansion of the inner channel was faster than the vertical expansion. The increase in width (Be) was more significant than the increase in depth (He) throughout the experiments in both cases. At the end of the experiments, Be was 35 and 22 mm in Cases 1 and 2, respectively, while He was 18 and 8 mm, respectively (Figure 8b).
The plan views of the bedrock surfaces are displayed in Figure 6, and the corresponding profile sections are presented in Figure 7 as NS. Growth in the inner channel, considered primary erosion, was observed along the boundary between the bed coverage and the exposed bed, inside the sweep width (W) area. This boundary is indicated by the light-green curve in Figure 6.
Finally, Case 1 had clearly obtained a much more advanced stage of inner channel compared to Case 2. The bedrock was vertically incised first, then downcut toward the inner wall (Figure 9a). The vertical incision was observed until T = 12 h in Case 1, while in Case 2 (Figure 9b), it was observed until T = 84 h. In Case 1, the incision toward the inner wall was clearly visible from T = 12 h.

4. Discussion

The results reveal the mechanism involved at the onset of the erosion. Also, the spatiotemporal evolution of the inner channel and the sediment deposition pattern found during the experiments allow us to determine how erosion evolves in space and time.

4.1. The Location of Erosion

The formation of the inner channel was along the boundary between the bed coverage with sediment and the exposed bedrock. This boundary is located around the channel centerline. Furthermore, if looking into the transverse slope, this boundary was at the base of the transverse slope, where the sediment coverage is relatively thin. A close observation of the incision of the bedrock surface at the end of timestep 2 reveals that the bedrock was downcut vertically (Figure 7).
While it was not possible to accurately determine the thickness of sediment coverage under which the bed incision occurs, we could graphically estimate that it required about 10 mm in the experimental conditions employed in this study, or approximately 20 times the sediment grain size. It should be noted, however, that this estimation was deduced from the transverse slope at the end of each timestep, meaning that it was at its angle of repose. This suggests that the thickness of the deposit was less than 10 mm in our study.
Under that thickness, the sediment grains can saltate, hit, and wear the bedrock surface. When the coverage exceeds that boundary, no erosion occurs because the motion of the sediment grains cannot reach the bed surface and can be considered a fully covered bed. According to previous researchers, that boundary is the place of “tradeoff between the availability of abrasive tools and the partial alluviation of the bedrock” [9] or the toe of the alluvial bedforms [12] or the portion moderately covered with sediment [27,28]. In sum, the base of the transverse slope would be the only place where the sediment grains may collide with the bedrock surface [30].
Increased cover lid rotation speed, on the other hand, had no effect on location of erosion occurrence. That is, the boundary between the sediment coverage and the exposed bed was positioned at the same place across the flume width on both Case 1 and Case 2. This can likely be attributed to the mean transverse slope and the amount of sediment used, since they specify the position of the boundary between the sediment coverage and the exposed bed, as well as the location of the incision. This is consistent with Engelund’s findings [21] that the mean transverse slope was almost independent of the top lid rotational speed as long as the sediment grains flowed as bedload. Taguchi et al. [28] also obtained similar results to the current study with the same amount and caliber of sediment. From these results it can be concluded that the border between the sediment-covered bed and the exposed bedrock where erosion occurs is essentially the same regardless of how fast the cover lid rotates.
We also observed linear scours on the exposed bed surface even though erosion should not have happened on the exposed bed based on the abrasion models. These scours, we believe, were the consequence of interaction between sediment grains and flow directly on the bedrock surface, with the fine structure of the gypsum powder in the plaster allowing this interaction engraved on the bed surface (Figure 5, right). If this is the case, these linear scours should be investigated further for a greater understanding of flow dynamics at the bedrock-fluid interface.

4.2. Spatiotemporal Evolution of the Bedrock Incision and the Inner Channel

4.2.1. The Bedrock Incision

It was found that the rate and spatial extension of the bedrock incision are inversely proportional to the cover lid rotation speed. That is, a faster rotation speed is associated with less erosion. This is due to the sediment deposition patterns imposed by the flow conditions. With a higher rotation speed (48 RPM in Case 2), uniform transverse slope formed, and the incision occurred only along its base. With a slower rotation speed (40 RPM in Case 1), migrating bedforms formed, leading to an increase in the bed area subjected to erosion, which can be attributed to the undulations of the bedform boundary (Figure 6 and Figure 7). Also, when reducing the rotation speed from 48 to 40 RPM (Case 2, timestep 8), the bedforms reappeared (Figure 6g), resulting in a greater erosion rate at the end of the experiment in Case 2 (Figure 8a).
The bedforms vary with rotation speed because the speed influences the secondary flow (e.g., [16,24]), and with time as the bedforms fluctuate and stabilize at a “mature” stage (e.g., [21,24,26]).
In addition, when the undulating bedforms are formed, their migration allows for the alternation of “covered” and “exposed” bedrock surfaces, a phenomenon known as runaway alluviation [37]. This runaway alluviation combined with the saltation of the sediment grains and the undulation of the boundary explains the higher erosion in Case 1 than in Case 2. In the latter, no runaway alluviation was observed. Our results provided one quantitative example of runaway alluviation to add to the results obtained in previous studies (e.g., [8,20,21,31]).

4.2.2. The Inner Channel

Initially, the incision vertically downcut the bedrock, slightly shifting toward the outer wall (Figure 9). This vertical incision occurred at the center of the sweep width (W), or right under the boundary of sediment coverage and the exposed bed, because this location had a high probability and high frequency of erosion. This high probability of erosion was due to the primary conditions of incision and high frequency due to its position inside the sweep width.
The advanced state of the incision shows that it gradually downcut towards the inner wall (Figure 9a). This shift resulted from the alternating lateral shift toward the inner wall and the downward incision on the bedrock surface. Because no extra sediment was supplied, the bedrock near the outside wall was left exposed. Because the sediment was only available along the inner wall side due to the spiral flow, it is evident that the conditions for maximum incision also move towards the inner wall. As a matter of fact, the height of the bedform gradually decreased with the growth of the inner wall, suggesting that the incision would erode the bedrock along the inner channel at some point.
This incision toward the inner wall is consistent with the results reported by Fernández et al. [12] using a meandering channel of highly fixed sinuosity in the absence of sediment supply. Shepherd [31] also discovered similar findings in his experiment along the manually excavated sinuous channel and reported that the erosion went toward the inside of the bend until the gradient and the velocity dropped, allowing the sediment to deposit, and thereafter the erosion process inverted toward the outer wall.
However, this was not reported by Taguchi et al. [27,28] in their experiment. This may be explained by the geometry of the inner channel. In this study, the simulated bedrock, made of plaster, provided faster erosion. For instance, at T = 24 h, the inner channel size was larger in plaster than in mortar (Figure 9a). The flow dynamics combined with this growth of the inner channel and the sediment transport inside the flume likely explain the actual result.
In our study, there was no sediment supply, and the rotation speed was maintained at a constant so that the erosion would continue toward the inner wall. However, further investigation is required to determine the progress of the inner channel.

4.3. Deposition Pattern

Along uniformly curved channels, the bedforms depend on the rotation speed, time, and development of the inner channel resulting from the bedrock incision.
First, the averaged transverse slope angle for both cases was similar, at about 23 degrees, throughout the timesteps (Figure 7). This averaged angle represents the angle of the mean bedforms and was found to be independent of the rotation speed in case of sediment bedload transport [24]. However, the difference in the slope angles in Case 1 and Case 2 may be related to the timing of the measurements and the rotation speed. The slightly higher transverse slope angle and height in Case 2 than those in Case 1 can likely be attributed to the faster rotation speed of Case 2 [24]. However, we should keep in mind that because these measurements were made after the experiments were stopped, the obtained values may be underestimated.
Second, while the secondary flow increases when the rotation speed is high, the spiral flow wavelength, as well as the wavelength of the bedforms decreases. Case 2, at 48 RPM, for example, had poorly formed bedforms that were hardly discernible (Figure 6). When the rotation speed was increased, Engelund [21] discovered a similar result, and attributed it to the reformation of the uniform transverse slope. Inversely, with a slower rotation speed, the secondary flow decreases, and the effects of the spiral flow on the bedforms could be well observed, as we could witness the well-formed bedforms in Case 1 at 40 RPM. After timestep 2, for example, there were 5 and 12 bedforms in Case 1 and Case 2, respectively. This is consistent with the results reported by Baar et al. [24] and Kikkawa et al. [23] when observing the effect of the variation of the secondary flow intensity on the bed morphology.
Third, the number of bedforms increases with the growth of the inner channel. When the rotation was lowered from 48 to 40 RPM, as in Case 2 timestep 8, the bedforms reappeared, with a total of 6 bedforms (Figure 6g). However, for the same 12 h of experimentation in timestep 4 in Case 1, there were 8 bedforms (Table 1). This discrepancy could be attributed to the difference in the dimension of the inner channel, which is more significant in Case 1 than in Case 2 (Figure 9). A larger inner channel was associated with an increase in the number of bedforms from 5 to 9, as seen in Case 1 (Figure 6).
Finally, another feature revealed by the experimental results is the reformation of the uniform transverse slope over a longer experiment run, as indicated in Case 2 (Figure 6). The bedforms gradually faded away as the rotation speed increased, restoring the uniform transverse slope. The gradual convergence of the sediment surface towards the uniform transverse slope can be seen in the section profiles (Figure 7). However, these results do not agree with the results reported by Engelund [21] and Taguchi et al. [27]. They claimed that the number of bedforms first increased and then decreased in number as the experiment progressed. In Engelund’s experiment, the erosion was not part of the study, whereas in Taguchi et al.’s experiment, the erosion was not significant compared to the erosion observed. Most likely, the development of the inner channel was the reason for this discrepancy (Case 1). While it remains unclear, it appears that the growth of the inner channel adds to the complexity of the flow dynamics. On the other hand, this discrepancy can also be the outcome of the bedforms splitting and merging processes in Case 2, leading to an equilibrium state at a mature stage of the experiment. This is a topic for further investigation.

5. Conclusions

Erosion by incision of the bedrock along uniformly curved channels was successfully simulated using the annular flume. Our study covered two experimental cases with different rotation speeds but the same sediment and water depth. The rotation speeds significantly impacted the sediment deposition and transport. The bed configurations measurements revealed the formation of the uniform transverse slope and bedforms, and an inner channel formed in the bedrock as the result of the incision. The sediment deposition was found along the inner wall, whereas the bedrock incision occurred around the centerline. Their evolution with time and space was found to be closely dependent.
The findings of this study reveal that while rotation speed does not significantly impact the transverse slope angle, it does condition the formation of bedforms. The initial uniform transverse slope gradually turns into bedforms. At 40 RPM, they are well formed, whereas at 48 RPM, the bedforms are poorly formed. In addition, it is possible that the bedforms would turn back into uniform transverse slope if the experiment had been continued for a longer period of time, which would have allowed the bedforms to split and to merge sufficiently.
The bedrock incision occurs mainly at the base of the transverse slope, and the growth of the inner channel depends on whether the bed deposition pattern constitutes uniform transverse slope or bedforms. The base of the transverse slope or the boundary of the exposed bed and the sediment coverage appear to be linear under the uniform transverse slope and undulating inside the sweep width when the bedforms form. The erosion is minimal when the transverse slope is uniform along the flume, leading to a vertical, shallow, and narrow channel. In contrast, the erosion is significant when there are bedforms: the spatiotemporal variation of the bedforms conditions the development of the inner channel. When there is no sediment supply, the inner channel progresses towards its convex side, leaving the concave side and the bedrock surface near the outer wall of the flume intact. The findings of this study reveal the need to focus our future research efforts on the sediment transport and deposition within the annular flume, and the effects of the inner channel on the flow dynamics and the sediment transport and deposition in an annular flume, as well as the translation of the findings to natural rivers.

Author Contributions

Conceptualization, M.R.A. and N.I.; methodology, M.R.A.; software, M.R.A. and N.I.; investigation, M.R.A. and T.T.; data curation, M.R.A. and T.T.; writing—original draft preparation, M.R.A.; writing—review and editing, M.R.A. and N.I.; visualization, M.R.A. and T.T.; supervision, N.I. All authors have read and agreed to the published version of the manuscript.

Funding

This research received no external funding.

Institutional Review Board Statement

Not applicable.

Informed Consent Statement

Not applicable.

Data Availability Statement

The data presented in this study are available on request from the corresponding author.

Acknowledgments

We would like to thank to the River and Watershed Engineering Laboratory for the experimentation.

Conflicts of Interest

The authors declare that they have no conflicts of interest.

Appendix A

Figure A1. Grain—size distribution curve of the sand No.5® used during the experiments [33].
Water 14 00397 g0a1

Appendix B

Plan views of the bed configurations—sediment deposition patterns are presented in this appendix. The horizontal and vertical axes represent (s, n) the tangential and radial, respectively. The radial coordinate n = −50 indicates the inner wall side, whereas n = 50 indicates the outer wall one. The green curves indicate the boundary between the exposed bed and the sediment coverage, and the dashed lines represent the cross-sections for the profile data for all 18 cross-sections.
Figure A2. Plan views of the bed configurations—sediment deposition patterns, Case 1 (40 RPM) for all the timesteps: (a) timestep 1 (T = 5 min), (b) timestep 2 (T = 3 h), (c) Timestep 3 (T = 6 h), (d) timestep 4 (T = 12 h), (e) timestep 5 (T = 24 h), and (f) timestep 6 (T = 48 h).
Water 14 00397 g0a2
Figure A3. Plan views of the bed configurations—sediment deposition patterns, Case 2 (48 RPM) for all the timesteps: (a) timestep 1 (T = 5 min), (b) timestep 2 (T = 3 h), (c) timestep 3 (T = 6 h), (d) timestep 4 (T = 12 h), (e) timestep 5 (T = 24 h), (f) timestep 6 (T = 48 h), and (g) timestep 7 (T = 72 h); (h) timestep 8 (T = 84 h) but with 40 RPM.
Water 14 00397 g0a3

Appendix C

Plan views of the bed configurations—The bedrock surfaces are displayed in this appendix. The horizontal and vertical axes represent (s, n) the tangential and radial, respectively. The radial coordinate n = −50 indicates the inner wall side, whereas n = 50 indicates the outer wall one. The green curves indicate the boundary between the exposed bed and the sediment coverage.
Figure A4. Plan views of the bed configurations—Bedrock surface, Case 1 (40 RPM) for all the timesteps: (a) timestep 1 (T = 5 min), (b) timestep 2 (T = 3 h), (c) timestep 3 (T = 6 h), (d) timestep 4 (T = 12 h), (e) timestep 5 (T = 24 h), and (f) timestep 6 (T = 48 h).
Water 14 00397 g0a4
Figure A5. Plan views of the bed configurations—Bedrock surface, Case 2 (48 RPM) for all the timesteps: (a) timestep 1 (T = 5 min), (b) timestep 2 (T = 3 h), (c) timestep 3 (T = 6 h), (d) timestep 4 (T = 12 h), (e) timestep 5 (T = 24 h), (f) timestep 6 (T = 48 h), and (g) timestep 7 (T = 72 h); (h) timestep 8 (T = 84 h) but with 40 RPM.
Water 14 00397 g0a5

Appendix D

Transverse profile sections obtained for each timestep are plotted in this appendix. The horizontal and vertical axes represent (n, z) the radial and vertical coordinates, respectively. The radial coordinate n = −50 indicates the inner wall side, whereas n = 50 indicates the outer wall side. The black curves represent the average profile of the bedrock surface (NS), the red-colored curves are the average of the 18 profiles of the sediment coverage (WS, gray color).
Figure A6. Transverse profile sections obtained for each timestep, Case 1 (40 RPM): (a) timestep 1 (T = 5 min), (b) timestep 2 (T = 3 h), (c) timestep 3 (T = 6 h), (d) timestep 4 (T = 12 h), (e) timestep 5 (T = 24 h), and (f) timestep 6 (T = 48 h).
Water 14 00397 g0a6
Figure A7. Transverse profile sections obtained for each timestep, Case 2 (48 RPM): (a) timestep 1 (T = 5 min), (b) timestep 2 (T = 3 h), (c) timestep 3 (T = 6 h), (d) timestep 4 (T = 12 h), (e) timestep 5 (T = 24 h), (f) timestep 6 (T = 48 h), and (g) timestep 7 (T = 72 h); (h) timestep 8 (T = 84 h) but with 40 RPM.
Water 14 00397 g0a7

References

  1. Kirkby, M. Alluvial and Non-Alluvial Meanders Author(s). R. Geogr. Soc 1972, 4, 284–288. [Google Scholar]
  2. Parker, G. River meanders in a tray. Nature 1998, 395, 111–112. [Google Scholar] [CrossRef]
  3. Nakano, D.; Nakamura, F. The significance of meandering channel morphology on the diversity and abundance of macroinvertebrates in a lowland river in Japan. Aquat. Conserv. Mar. Freshw. Ecosyst. 2008, 18, 780–798. [Google Scholar] [CrossRef]
  4. Wohl, E.; Bledsoe, B.P.; Jacobson, R.B.; Poff, N.L.; Rathburn, S.L.; Walters, D.M.; Wilcox, A.C. The natural sediment regime in rivers: Broadening the foundation for ecosystem management. Bioscience 2015, 65, 358–371. [Google Scholar] [CrossRef] [Green Version]
  5. Gallen, S.F.; Pazzaglia, F.J.; Wegmann, K.W.; Pederson, J.L.; Gardner, T.W. The dynamic reference frame of rivers and apparent transience in incision rates. Geology 2015, 43, 623–626. [Google Scholar] [CrossRef]
  6. Davis, W.M.; Harvard, C. The topographic maps of the United States. Science 1893, 21, 225–226. [Google Scholar] [CrossRef] [PubMed] [Green Version]
  7. Winslow, A.; Office of the, G.S. The Osage River and its meanders. Science 1893, 31–32. [Google Scholar] [CrossRef] [Green Version]
  8. Whipple, K.X.; DiBiase, R.A.; Crosby, B.T. Bedrock Rivers; Elsevier Ltd.: Amsterdam, The Netherlands, 2013; Volume 9, ISBN 9780080885223. [Google Scholar]
  9. Sklar, L.S.; Dietrich, W.E. A mechanistic model for river incision into bedrock by saltating bed load. Water Resour. Res. 2004, 40. [Google Scholar] [CrossRef]
  10. Zhang, L.; Parker, G.; Stark, C.P.; Inoue, T.; Viparelli, E.; Fu, X.; Izumi, N. Macro-Roughness model of bedrock-alluvial river morphodynamics. Earth Surf. Dyn. 2015, 3, 113–138. [Google Scholar] [CrossRef] [Green Version]
  11. Thomson, J.; Thomson, W. On the origin of windings of rivers in alluvial plains, with remarks on the flow of water round bends in pipes. Proc. R. Soc. Lond. 1877, 25, 5–8. [Google Scholar] [CrossRef] [Green Version]
  12. Fernández, R.; Parker, G.; Stark, C.P. Experiments on patterns of alluvial cover and bedrock erosion in a meandering channel. Earth Surf. Dyn. 2019, 7, 949–968. [Google Scholar] [CrossRef] [Green Version]
  13. Ippen, A.T.; Drinker, P.A. Boundary Shear Stresses in Curved Trapezoidal Channels. J. Hydraul. Div. 1962, 88, 143–180. [Google Scholar] [CrossRef]
  14. Yen, B.-C. Characteristics of Subcritical Flow in a Meandering Channel; The University of Iowa: Iowa City, IA, USA, 1965. [Google Scholar]
  15. Graham, D.I.; James, P.W.; Jones, T.E.R.; Davies, J.M.; Delo, E.A. Measurement and Prediction of Surface Shear Stress in Annular Flume. J. Hydraul. Eng. 1992, 118, 1270–1286. [Google Scholar] [CrossRef]
  16. Krishnappan, B.G. Rotating circular flume. J. Hydraul. Eng. 1993, 119, 758–767. [Google Scholar] [CrossRef]
  17. Krishnappan, B.G.; Stone, M.; Granger, S.J.; Upadhayay, H.R.; Tang, Q.; Zhang, Y.; Collins, A.L. Experimental investigation of erosion characteristics of fine-grained cohesive sediments. Water 2020, 12, 1511. [Google Scholar] [CrossRef]
  18. Sheng, Y.P. Consideration of Flow in Rotating Annuil for Sediment Erosion and Deposition Studies. J. Coast. Res. 1989, SPI 5, 207–216. [Google Scholar]
  19. Yang, Z.; Baptista, A.; Darland, J. Numerical modeling of flow characteristics in a rotating annular flume. Dyn. Atmos. Ocean. 2000, 31, 271–294. [Google Scholar] [CrossRef]
  20. Desaulniers, G.; Frenette, M. Contributions to the Study of Erosion and Deposition Mechanisms in River Bends. In Sedimentation, Symposium to Honor Prof. H. A. Einstein; Hsieh Wen Shen 1972; pp. 10.1–10.19. Available online: https://www.oieau.org/eaudoc/system/files/documents/39/196460/196460_doc.pdf (accessed on 12 June 2021).
  21. Engelund, F. Instability of flow in a curved alluvial channel. J. Fluid Mech. 1975, 72, 145–160. [Google Scholar] [CrossRef]
  22. Ikeda, S. On secondary flow and dynamic equilibrium of transverse bed profile in alluvial curved open channel. Proc. JSCE 1974, 1974, 55–65. [Google Scholar] [CrossRef]
  23. Kikkawa, H.; Ikeda, S.; Akira, K. Variation of bed profile with time in curved channel. Proc. Jpn. Soc. Civ. Eng. 1976, 65–75. [Google Scholar] [CrossRef] [Green Version]
  24. Baar, A.W.; de Smit, J.; Uijttewaal, W.S.J.; Kleinhans, M.G. Sediment Transport of Fine Sand to Fine Gravel on Transverse Bed Slopes in Rotating Annular Flume Experiments. Water Resour. Res. 2018, 54, 19–45. [Google Scholar] [CrossRef]
  25. Booij, R. Measurments of the Flow Field in a Rotating Annular Flume, Report No. 94-2; TU Delft: Delft, The Netherlands, 1994; Available online: https://repository.tudelft.nl/islandora/object/uuid%3A431193bc-8cfb-46ce-81fd-5034941b0769 (accessed on 12 June 2021).
  26. Fukuda, M.K.; Lick, W. The Entrainment of Cohesive Sediments in Freshwater. J. Geophys. Res. 1980, 85, 2813–2824. [Google Scholar] [CrossRef]
  27. Taguchi, S.; Ozawa, H.; De Lima, A.C.; Izumi, N. Experimental study on bedrock incision and bed configuration in annular flume flow. J. JSCE Hydraul. Eng. 2017, 73, I_847–I_852. [Google Scholar] [CrossRef] [Green Version]
  28. Taguchi, S.; Kobayashi, S.; De Lima, A.C.; Izumi, N. Experimental study on mixed bedrock-alluvial bed erosion in annular flume flow. J. JSCE Hydraul. Eng. 2018, 74, I_1039–I_1044. [Google Scholar] [CrossRef]
  29. NORITAKE Co., Ltd. Noritake Products—Catalog Lineup. Available online: https://www.noritake.co.jp/eng/products/support/detail/11/ (accessed on 3 January 2022).
  30. Johnson, J.P.; Whipple, K.X. Feedbacks between erosion and sediment transport in experimental bedrock channels. Earth Surf. Process. Landf. 2007, 32, 1048–1062. [Google Scholar] [CrossRef]
  31. Shepherd, R.G. Incised River Meanders: Evolution in Simulated Bedrock. Am. Assoc. Adv. Sci. 1972, 178, 409–411. [Google Scholar] [CrossRef]
  32. Karni, J.; Karni, E. Gypsum in construction: Origin and properties. Mater. Struct. 1995, 28, 92–100. [Google Scholar] [CrossRef]
  33. Tohoku Keisya Co., Ltd. Tohoku Silica Sand Co. Available online: http://www.tohoku-keisya.co.jp/ (accessed on 3 January 2022).
  34. Keyence Corporation CMOS Multi-Function Analog Laser Sensor IL Series—Instruction Manual. Available online: https://www.keyence.com/products/measure/laser-1d/il/downloads/?mode=ma&modelId=PM_235300 (accessed on 21 June 2021).
  35. 3D Artec Artec 3D EVA. Available online: https://www.artec3d.com/portable-3d-scanners/artec-eva-v2 (accessed on 12 June 2021).
  36. Allen, D.W. GIS Tutorial 2: Spatial Analysis Workbook; Esri Press: Redlands, CA, USA, 2016; ISBN 9781589484535. [Google Scholar]
  37. Demeter, G.; Sklar, L.; Davis, J. The Influence of Variable Sediment Supply and Bed Roughness on the Spatial Distribution of Incision in a Laboratory Bedrock Channel. AGU Fall Meet. Abstr. 2005, 86. Available online: https://www.researchgate.net/publication/253214892_The_influence_of_variable_sediment_supply_and_bed_roughness_on_the_spatial_distribution_of_incision_in_a_laboratory_bedrock_channel (accessed on 12 June 2021).
Figure 1. Schematic diagram of the spiral flow along curved channels as the combination of the primary and the secondary flow, which corresponds to tangential and radial flow in an annular flume.
Water 14 00397 g001
Figure 2. Photo of the annular flume with the white plaster. The flume is made of plexiglass, the cover lid of metal for better stability, and the plate in contact on the water surface is also made of plexiglass.
Water 14 00397 g002
Figure 3. Schematic diagram of the cross section of the annular flume and the original bed configuration inside the flume channel. (a) electrical motor, (b) cover lid, (c) lever for the cover lid plate to obtain the desired water depth, (d) flume channel, (e) 50 mm of water depth, (f) 2.5 kg of sediment, (g) 6 cm of plaster, a mixture of gypsum powder and water.
Water 14 00397 g003
Figure 4. Schematic diagrams of the bed configurations and parameters definition. The sediment coverage is colored in red; the bedrock is gray (left). The corresponding plan and section views are on the upper right and bottom right, respectively.
Water 14 00397 g004
Figure 5. Photos of the bed configuration inside the flume—top view—Case 1 at the end of timestep 6. The white-colored area represents the exposed bed, the reddish part is the sediment coverage (left). The inner channel is visible after removing the sediment coverage, and linear scouring is visible under magnification (right).
Water 14 00397 g005
Figure 6. Plan views of the bed configurations at the timesteps 1 (T = 5 min), 4 (T = 12 h), and 6 (T = 48 h). The horizontal and vertical axes represent (n, s) the radial and tangential coordinates, respectively. The radial coordinates n = −50 and 50 indicate the inner and outer wall sides, respectively. (ac), and (df) represent the sediment deposition patterns in Case 1 and Case 2, respectively. (hj), and (km) represent the evolution of the inner channel, the bedrock incision result in Case 1 and Case 2, respectively. (g,n) represent the bed configurations at the timestep 8 in Case 2, after lowering the rotation speed to 40 RPM. The green curves indicate the boundary between the exposed bed and the sediment coverage, and the dashed lines represent the transverse sections for the profiles data for all 18 cross-sections.
Water 14 00397 g006
Figure 7. Transverse profile sections—Case 1 (left) and Case 2 (right). The horizontal and vertical axes represent the radial and vertical coordinates, respectively. The average of the bedrock surface profiles (NS, black color), the 18 profiles of the sediment coverage (WS, gray color), and their average (Avg. WS, red color) are indicated from top to bottom, at timesteps 1 (T = 0 h), 4 (T = 6 h), and 6 (T = 48 h) (a,c,e) for Case 1, and (b,d,f) for Case 2).
Water 14 00397 g007
Figure 8. (a) Graphs of the mean erosion rate (Em, dashed lines, mm3/h) and the fraction of exposed bed (Po, solid line) for Case 1 (in red) and Case 2 (in blue). The horizontal axis is the cumulative time T (h); the vertical axes represent Po on the left and Em on the right; (b) Temporal evolution of the erosion for Case 1 (red) and Case 2 (blue) over cumulative time T (h). The vertical axis on the left represents the depth (He) and the width (Be) of the inner channel (mm), and the right axis represents the volume of erosion (mm3/h).
Water 14 00397 g008
Figure 9. Circumferentially averaged bedrock surface profiles evolution with the cumulative time T, Case 1 (a) and Case 2 (b). The radial and vertical coordinates (n, z) are represented by the horizontal and vertical axes, as shown in Figure 7. The centerline of the flume is represented by n = 0, with negative values on the half side near the inner wall and positive values on the outer wall side. The measured mortar bedrock surface level by Taguchi et al. [28] at T = 24 h are plotted as blue crosses.
Water 14 00397 g009
Table 1. Experimental conditions and resultant bed formation.
Timestep t  1T 2Speed 3 α  4W 5Bedforms, Number of Wavelengths (k)
Case 111/1204023–2426Uniform transform slope
233408–37415 bedforms
3364016–28345 bedforms
46124015–38376 bedforms
512244015–61248 bedforms
624484018–55339 bedforms
Case 211/1204820–3020Uniform transform slope
2334812–332412 bedforms
3364815–312212 bedforms
46124821–2617Uniform transform slope
512244820–2617Uniform transform slope
624484820–2217Uniform transform slope
724724820–2718Uniform transform slope
812844012–38346 bedforms
1 t : the timestep’s duration, in hours (h); 2 T: the cumulative time, in hours (h); 3 Speed: the annular flume top lid rotation speed, in rounds per minute (RPM); 4 α : the transverse slope angle, in degrees (°); 5 W: the transverse slope base sweep width, in millimeters (mm).
Publisher’s Note: MDPI stays neutral with regard to jurisdictional claims in published maps and institutional affiliations.

