Article

Comparison of the Efficiency of Deammonification under Different DO Concentrations in a Laboratory-Scale Sequencing Batch Reactor

by
Hussein Ezzi Al-Hazmi
1,*,
Zhixuan Yin
2,
Dominika Grubba
1,
Joanna Barbara Majtacz
1 and
Jacek Mąkinia
1
1
Faculty of Civil and Environmental Engineering, Gdansk University of Technology, Narutowicza Street 11/12, 80-233 Gdansk, Poland
2
School of Environmental and Municipal Engineering, Qingdao University of Technology, 11 Fushun Road, Qingdao 266033, China
*
Author to whom correspondence should be addressed.
Water 2022, 14(3), 368; https://doi.org/10.3390/w14030368
Submission received: 20 December 2021 / Revised: 21 January 2022 / Accepted: 24 January 2022 / Published: 26 January 2022
(This article belongs to the Special Issue Advanced Optimization of Wastewater Treatment Processes)

Abstract

:
The efficiency of deammonification depends on the cooperation of ammonium oxidizing bacteria and archaea (AOB/AOA), anaerobic ammonium oxidizing bacteria (AnAOB) and the effective suppression of nitrite oxidizing bacteria (NOB) that compete with AnAOB for nitrite (NO2-N). One of the effective NOB suppression strategies is intermittent aeration. However, it is important to have a good understanding of the optimum dissolved oxygen (DO) value in the aeration period and optimize the non-aeration time used during the reaction phase. This study comprised the investigation of the effect of different DO set points (0.4, 0.7, 1.0 and 1.5 mg O2/L) under the same aeration length off/on (12/3 min). Moreover, three different intermittent aeration modes (9/3, 6/3, 3/3) under the same DO set point (0.7 mg O2/L) were more investigated. The experiment was conducted for 6 months (180 days) in a laboratory-scale sequencing batch reactor (SBR) with a working volume of 10 L. The results indicated that a high N removal efficiency was achieved 74% at the DO set point = 0.7 mg O2/L during aeration strategy off/on (6/3 min) due to the low nitrate production rate (NPR) 0.9 mg N/g VSS/h and high ammonium utilization rate (AUR) 13 mg N/g VSS/h (NPR/AUR = 0.06). Mathematical modeling results confirmed that the feasible DO set point 0.7 and intermittent aeration mode off/on (6/3 min) were especially suitable for the optimal balance between the NOB suppression and keeping high activities of AOB and anammox in the system.

1. Introduction

The deammonification process has received a special attention as a promising energy-efficient technology for nitrogen removal. Deammonification is a process combining two processes, including partial nitritation and anammox (PN/A). In the first step, ammonium nitrogen (NH4-N) is converted to nitrite nitrogen (NO2-N) by ammonia oxidizing bacteria (AOB) and ammonia oxidizing archaea (AOA) under aerobic conditions. In the second step, the remaining NH4-N (as an electron donor) and the produced NO2-N (as an electron acceptor) are converted to nitrogen gas (N2) by anaerobic ammonia oxidizing bacteria (AnAOB) under anoxic conditions [1,2].
The efficiency of deammonification is dependent on the cooperation of AOB/AOA and AnAOB and the effective suppression of nitrite oxidizing bacteria (NOB) that compete with AnAOB for NO2-N. This inhibition is a major challenge when applying this technology to sidestream or mainstream deammonification [3].
Thus, the successful deammonification process requires setting the appropriate conditions that inhibit NOB [4]. Many studies based on the treatment of NH4-N-rich wastewater have identified several critical operational parameters for inhibition of nitratation, such as temperature, nitrogen load rate (NLR), free ammonia (FA), free nitrous acid (FNA) and low dissolved oxygen (DO) [5,6,7]. In fact, only DO can be controlled in a typical municipal wastewater treatment plant using three approaches: traditional DO control with a value in the range 0.5–1.5 mg/L, intermittent aeration and a variable DO setting depending on the level of NH4-N removal and the ratio of nitrate nitrogen (NO3-N) produced to NH4-N removed [4,8,9].
Lackner et al. [10] provided optimal DO concentrations for the deammonification process in the range of 0.3–1.5 mg O2/L. High DO concentrations could inhibit the activity of AnAOB or promote the growth of NOB, and thus, numerous deammonification reactors have been operated at low DO concentrations [11,12]. Cao et al. [13] reported that 75% of NO2-N accumulation was gained in a full-scale PN/A process in Singapore at DO concentrations of 1.4–1.8 mg O2/L. The DO concentration affects partial nitritation as nitrifying microorganisms have different DO affinities (AOA > AOB > NOB) [14]. On the other hand, AnAOB are very sensitive to DO and can only survive when the oxygen partial pressure is lower than 5%. Once the oxygen partial pressure over 18% oxygen saturation, the biological activity of AnAOB is inhibited, but this inhibition may be reversible after a decrease in the DO concentration [15,16].
The DO should be controlled to avoid reversible or even irreversible inhibition. It has been noted that the concentration below 0.5 mg/L is required for AOB to compete with NOB and allow the growth of AnAOB in a biofilm reactor [17,18]. Such low concentrations have been widely used to treat both NH4-N-rich and -poor wastewater [10,19,20,21] because of the lower DO affinity of AOB compared to NOB [20]. NOB was effectively suppressed in laboratory and pilot studies with a DO in the range of 0.17–0.6 mg O2/L [17,22,23]. On the other hand, in several studies, a low DO did not effectively suppress NOB [24,25], which indicates inconclusive results of the effect of a low DO on NOB inhibition.
It is hypothesized that only the combination of a low DO concentration strategy and intermittent aeration produces the intended effects in NOB suppression. Regmi et al. [26] explained that intermittent aeration could promote NOB selection due to the delay of NOB in adapting to aerobic conditions after the non-aeration period compared to AOB. Al-Hazmi et al. [1,27] observed that reduction of the aerobic cycle length during intermittent aeration followed by an anoxic mixing period succeeded in inhibiting the activity of NOB organisms and reduced N2O production. Thus, it could be contributing to a significant reduction in the greenhouse effect [28,29]. On the other hand, also extending the non-aeration phase allows AnAOB to increase their activity by increasing the time required for multiplication. Thus, it is possible to act in two ways depending on the condition of the process—(1) reduce the aeration time and (2) extend the non-aeration time, affecting both the frequency (F) and ratio (R) between the non-aerated and aerated phase durations.
Due to the wide and contrasting aeration system used in deammonification—for the DO value, the aeration pattern (continuous, intermittent) as well as the length of the aeration and non-aeration phases—the impact of these three factors requires further observation and research at the same time. The use of anammox granular biomass in the deammonification process has a positive effect on the process, because the structure of granules isolates the bacteria from oxygen, preventing further inhibition [30].
Therefore, in our research, we used a sequencing batch reactor (SBR) with a granular sludge to check the influence of the aeration strategy on the efficiency of the deammonification process. The aim of the research was to indicate the optimal DO concentration and the time of the non-aeration phase with a constant aeration time (3 min) in the deammonification process. A mathematical model was used to identify the main changes under different DO concentrations and the time of the non-aeration phase.

2. Materials and Methods

2.1. Origin of the Inoculum Biomass and Laboratory Set-Up

The experiment was conducted for 7 months (180 days) in a laboratory-scale SBR with a working volume of 10 L (Figure 1). The reactor was inoculated with biomass from a full-scale sidestream deammonification system in Plettenberg (Germany) and fed with a synthetic medium [31]. The system was maintained at a constant temperature set point of 30 ± 1 °C, the space between the inner-outer tube formed a water jacket. To adjust the temperature in the water jacket with an accuracy of (±0.1 °C), a water bath of Julabo F32 (Germany) was used. The air flow and circulating water conduits inside the reactor were made of stainless steel. Emptying the reactors took place through opening two manual ball valves of the diameter of 20 mm. Each reactor was provided with a stirrer RZR 2041 type (Heidolph, Germany) with a variable speed. The meters serviced probes for pH (Endress + Hauser EH CPS 471D-7211, Basel, Switzerland) and DO (Endress + Hauser COS22D-10P3/O, Basel, Switzerland). The pH was controlled in the range of 7.3–7.9 by adding 1.0 M NaOH. The reactor was operated in cyclic modes (24 h), including feeding (30 min, 4 L of the working volume), reaction (23 h), sedimentation (2 min) and decantation (28 min, 4 L of the working volume).

2.2. Experimental Procedure

During the SBR operation, the experiments were carried out in four phases. In the I phase, the intermittent aeration off/on (12/3 min), using different DO set points (0.35, 0.7, 1.0 and 1.5 mg O2/L), with the TN load in the range of 192–243 mg N/g VSS/d, was performed over 31 d. In the II phase, the TN load increased to 312–350 mg N/g VSS/d over 56 d and the intermittent aeration off/on changed (9/3 min), with a DO set point of 0.7 mg O2/L. During the III phase, the intermittent aeration off/on reduced to 6 min with the same DO set point (0.7 mg O2/L) over 42 d. In the IV phase, the non-aerated phase decreased to 3 min with the same DO set point (0.7 mg O2/L) over 41 d.
In batch tests, four scenarios (1–4) of the different DO set points (0.4, 0.7, 1.0 and 1.5 mg O2/L) were investigated under the same aeration length (12 min off/3 min on), and three scenarios (5–7) of the different intermittent aeration modes (9/3, 6/3 and 3/3) were investigated with the same DO set point (0.7 mg O2/L). The operational parameters during those experiments are shown in Table 1.

2.3. Analytical Methods

During each batch experiment, a mixed liquor sample was withdrawn every 24 h depending on the length of the cycle and immediately filtered through disposable glass microfiber filters MFV-3 (47 mm diameter), Sartorius, Germany. The inorganic N forms (NH4-N, NO3-N and NO2-N) in the filtered samples were analyzed using cuvette tests in DR3900 Benchtop Spectrophotometer (Hach Lange GmbH, Berlin, Germany).
The metagenomic analysis was performed to investigate the composition and adaptive structural changes of the deammonification biomass. The inoculum and acclimated biomass samples were collected at the beginning and end of the experimental period. The experimental scenarios were carried out with the biomass concentration = 2000–4000 mg VSS/L.
The biomass specific ammonium utilization rate (AUR) and NO3-N production rate (NPR) were determined based on the maximum slope of NH4-N consumption and NO3-N production in the reaction phase divided by the MVSS concentration, respectively.
The AUR was calculated from the formula:
AUR = Slope   ( S NH 4 N , t ) t · X   mg   N   ( gVSS / h )
The NPR was calculated from the formula:
NPR = Slope   ( S NO 3 N , t ) t · X   mg   N   ( gVSS / h )
where SNH4-N—concentration of NH4-N (mg N/L), SNO3-N—concentration of NO3-N (mg N/L), Δt—difference between the end time and the initial time of the measurement (h) and X—biomass concentration, g VSS/L.

2.4. Organization of the Simulation Study

As shown in Figure S1, the conceptual model developed in this study includes biochemical processes occurring under anaerobic/anoxic conditions (aeration off) and aerobic conditions (aeration on). Under aerobic conditions, NH4-N was sequentially oxidized to NO3-N via NO2-N by AOB and NOB. Under anaerobic/anoxic conditions, NO3-N was reduced to N2 via NO2-N by heterotrophic denitrifying bacteria (HDB). Therefore, the model was structured by using four distinct microbial populations in the reactor depending on their functions: AOB, NOB, HDB and AnAOB.
The model was developed using the “Model Developer” in the GPS-X 7.0 software (Hydromantis, Hamilton, Canada) following the IWA matrix notation system used for the Activated Sludge Model No.1 (ASM1) with most of the kinetic expressions presented as first-order or Monod-type equations. The definitions of the state variables, the matrix and kinetic equations of the proposed model are presented in Tables S1–S3, showing the stoichiometric relationships between the different components and the process rate equations.
Then, the layout of the reactor was built, consisting of an SBR and a time controller by which the aeration frequency and DO concentration could be adjusted and controlled (Figure S2). With the developed model and reactor layout, wastewater characterization and operational data were specified in the GPS-X software. Then, the parameters and variables were assigned based on literature reports (Tables S4 and S5). Sensitivity analysis of the model parameters was carried out to identify parameters to be adjusted during calibration (Tables S6 and S7). The differences between observed and simulated results were minimized by adjusting the model parameters based on their sensitivity.

3. Results

3.1. Influence of DO on the Deammonification Process

As shown in Figure 2A1, when the DO set point was 0.4 mg O2/L (scenario 1), the NH4-N concentration decreased from 348 to 36.9 mg N/L in 23 h, which resulted in an AUR of 5.6 mg N/g VSS/h. The concentration of NO3-N increased from 66.5 to 97.9 mg N/L at the same time, which resulted in the NPR value of 0.6 mg N/g VSS/h. The NPR/AUR ratio was 0.11 and the TN removal efficiency was 68%.
As shown in Figure 2B1, when the DO set point increased from 0.4 to 0.7 mg O2/L (scenario 2), the AUR increased to 6.6 mg N/g VSS/h, because the NH4-N concentration decreased from 361 to 1.3 mg N/L in 23 h. The NO3-N concentration then increased from 55.2 to 90.5 mg N/L in 23 h, which resulted in the NPR value of 0.6 mg N/g VSS/h. The NPR/AUR ratio decreased slightly from 0.11 to 0.09 and the TN removal efficiency increased from 68 to 78%.
As shown in Figure 2C1, when the DO set point increased to 1.0 mg O2/L (scenario 3), the NH4-N concentration decreased from 358 to 0.08 mg N/L in 21 h, which resulted in reaching an AUR value of 7.0 mg N/g VSS/h. The NO3-N concentration increased then from 51.2 to 98.6 mg N/L, which resulted in the NPR value of 0.9 mg N/g VSS/h. The NPR/AUR ratio increased to 0.13 and the TN removal efficiency slightly decreased from 78 to 76%.
As shown in Figure 2D1, when the DO set point increased to 1.5 mg O2/L (scenario 4), the NH4-N concentration decreased from 356 to 0.12 mg N/L in 19 h, resulting in the AUR value of 7.8 mg N/g VSS/h. The NO3-N concentration then increased from 57.4 to 112 mg N/L and resulted in an NPR of 1.2 mg N/g VSS/h. Subsequently, the NPR/AUR ratio increased to 0.16, whereas the TN removal efficiency decreased from 76 to 73%.
The dashed lines in Figure 2 show the simulation results, which are comparable to the measured data.
The most important performance indicators, i.e., the AUR, NPR and NPR/AUR ratios and TN removal efficiency, are summarized in Table 2.
At each aeration mode in all scenarios, the DO concentration was maintained stable at 0.4, 0.7, 1 and 1.5 mg O2/L during the aeration phase (partial nitritation process). Then, a sharp decrease in the DO concentration nearly to 0 mg O2/L was observed in the non-aerated phase (anammox process). The pH first decreased during the aerobic phase due to the consumption of alkalinity by AOB and then increased during the non-aerated phase because of the anammox activity.
With the NH4-N loading rate of 0.4 g N/L/d and intermittent aeration frequency fixed off/on (12/3 min), the maximum TN removal efficiency could reach up to 78%. The minimum NPR/AUR ratio was 0.09 and the nitrogen removal rate reached 0.23 g N/L/d at a DO set point of 0.7 mg O2/L.
Additionally, Figure S3 show the variation in the simulated growth rates of the different microorganisms at the DO set point of (A) 0.4 mg O2/L, (B) 0.7 mg O2/L, (C) 1.0 mg O2/L and (D) 1.5 mg O2/L at the same intermittent aeration mode off/on (12/3 min) conditions.

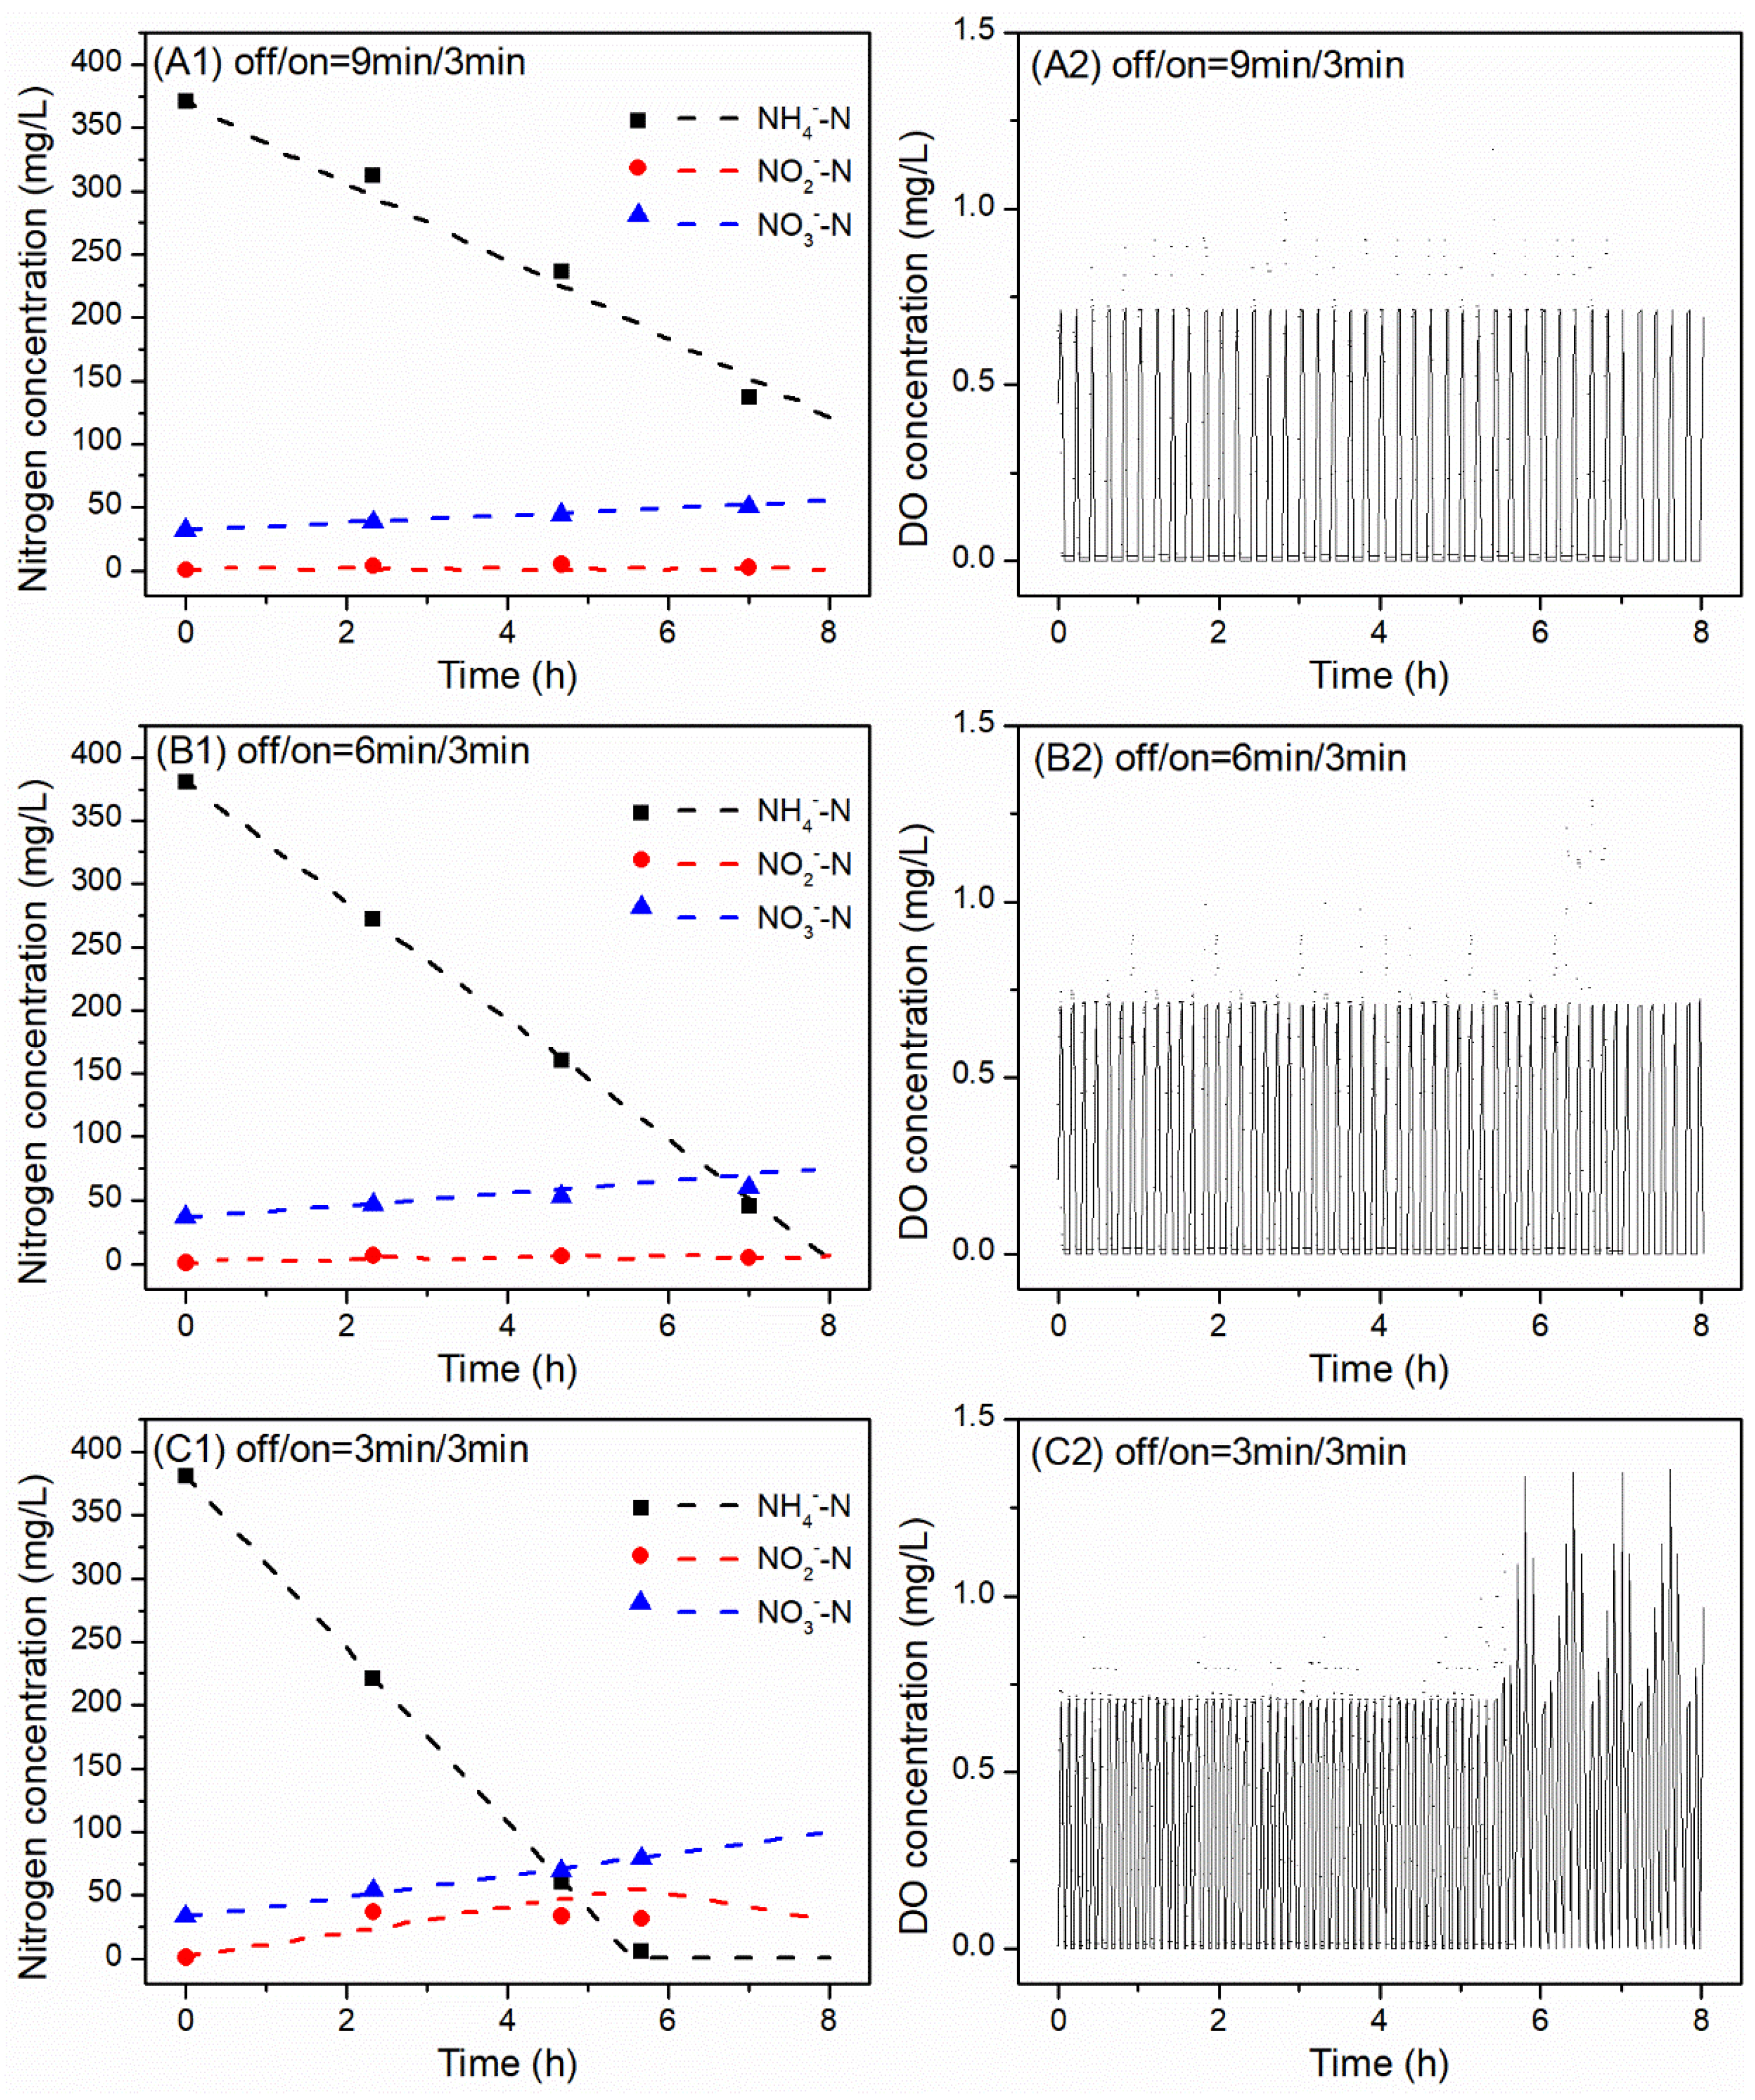
3.2. Influence of Aeration Mode (Off/On) Frequencies on the Deammonification Process

As shown in Figure 3A1, when the aeration mode changed to off/on (9/3 min—scenario 5), the NH4-N concentration decreased from 371 to 137 mg N/L in 7 h, resulting in an AUR value of 9 mg N/g VSS/h. At the same time, the concentration of NO3-N increased from 32.2 to 50.4 mg N/L, which resulted in the NPR of 0.7 mg N/g VSS/h. The NPR/AUR ratio increased to 0.08. Moreover, the TN removal efficiency reached 53% and the NO2-N concentration was stable at around 4 mg N/L.
When the aeration mode changed to off/on (6/3 min—scenario 6), the NH4-N concentration decreased from 381 to 44.9 mg N/L in 7 h, resulting in an AUR of 13 mg N/g VSS/h. The NO3-N concentration then increased from 37 to 60.4 mg N/L, which resulted in an NPR of 0.9 mg N/g VSS/h. The NPR/AUR ratio decreased to 0.07. The TN removal efficiencies increased to 74% and the NO2-N concentrations decreased to 6.5 mg N/L after 2.33 h of the cycle (Figure 3B1).
As shown in Figure 3C1, when the aeration mode fixed as off/on (3/3 min—scenario 7), the NH4-N concentration decreased from 381 to 5.9 mg N/L in 5.67 h, which made the AUR equal 18.1 mg N/g VSS/h. At the same time, the concentration of NO3-N increased from 33.6 to 79 mg N/L, which made the NPR = 2.1 mg N/g VSS/h. The NPR/AUR ratio reached the maximum value of 0.09 and the TN removal efficiency increased to 72%. In contrast, the NO2-N concentrations reached the maximum value of 37 after 2.33 h of the cycle.
The dashed lines in Figure 3 shows the simulation results, which are comparable to the measured data.
The most important performance indicators, i.e., the AUR, NPR and NPR/AUR ratios and TN removal efficiency, are summarized in Table 3.
Additionally, Figure S4 show the variation in the simulated growth rates of the different microorganisms with the intermittent aeration mode off/on of (A) 9/3 min, (B) 3/3 min, (C) 3/3 min at the same DO set point of 0.7 mg O2/L (S4).

3.3. Long-Term Results

The SBR was operated with different aeration modes, DO set points during aeration mode on and full cycle times during different phases of the long-term experiment (Figure 4A). The developed model was used to simulate the long-term experimental data of the SBR effluent and the biomass concentration in the SBR (Figure 4 and Figure 5). The results showed that the model fitted the long-term effluent data of the SBR very accurately. In the first 20 days of the I phase, under the specified conditions, the effluent NH4-N concentration gradually decreased from 631 mg/L to almost zero and the NO3-N concentration increased from the initial 30 mg N/L to about 100 mg N/L without any accumulation of NO2-N. During this period, AOB and AnAOB grew in the same trend, while the NOB concentration decreased to a relatively low level, making AOB and AnAOB the dominant microorganisms. It should also be noted that the multiplication of HDB in the first several days was observed. However, after the residual organics was expended, without carbon sources supplied in the influent, the HDB in the SBR disappeared.
Between Day 23 and Day 27, batch tests with different DO set points during the aeration mode on were conducted (see Section 3.1). The change of the DO set points led to a slight fluctuation of the effluent concentrations and simulated biomass concentrations. The maximum TN removal efficiency during I phase was 79%, the AUR was 9.2 mg N/g VSS/h and the NPR was 0.9 mg N/g VSS/h.
Since Day 31, even though the time of aeration off was adjusted from 12 min to 9 min, the change of the full cycle time from 24 h to 12 h made the time not enough for the biological reaction to be completed. As a consequence, the model simulated NH4-N concentration increased sharply in the first few days of the II phase. At the same time, lower NO2-N consumption and NO3-N production could be predicted, resulting in an increase in the NO2-N concentration and a decrease in the NO3-N concentration. The same phenomena could also be seen in the first few days of the III phase, when the full cycle time was reduced from 12 h to 8 h.
The shift from the I phase to the II phase also affected the amounts of different microorganisms. As the effluent was discharged more frequently, the biomass was washed out, leading to the sudden reduction in the biomass concentration, regardless of the microorganism species. In the course of the experiment, the accumulation of AOB and AnAOB could be observed, and the effluent NH4-N concentration decreased in two weeks and stayed stable hereafter. In addition, the prolonged aeration time facilitated the growth of NOB in the beginning of the II phase, while at this time, NOB still competed over AnAOB for the same substrate (NO2-N). The TN removal efficiency in II phase ranged from 66 to 79%, and the AUR ranged from 10–12.4 mg N/g VSS/h, while the NPR remained stable at 1.0 mg N/g VSS/h.
Moreover, the aeration mode influenced the biomass composition significantly. During the stable operation period of the II phase, the simulated ratio of AOB/AnAOB maintained at approximately 0.63, while it increased to more than 0.73 with a longer aeration time in the III phase. In the III phase, the TN removal efficiency was 63–75%, while the AUR ranged from 9.0 to 10.5 mg N/g VSS/h and the NPR was 0.9 mg N/g VSS/h.
In the IV phase, the non-aeration time was adjusted to 3 min, which was the same as that of the aeration time. In the first two weeks of the IV phase, with a higher oxygen supply, NH4-N could be completely consumed by AOB or AnAOB, accompanied by the accumulation of NO2-N. However, during this period, the gradual decrease in the simulated AnAOB concentration was observed, while an increase in the NOB concentration could be predicted. When the aeration strategy was just regulated back to the same condition in the III phase (since day 158), less NH4-N could be utilized, leaving more residual NH4-N in the SBR effluent along with the elevated NO2-N accumulation. As the simulated biomass composition recovered to the same level in the III phase, the effluent NH4-N descended gradually. The TN removal efficiency in IV phase decreased to 45%, and when the non-aeration phase returned to 6 min, the TN removal efficiency increased to 81%.

4. Discussion

4.1. Influence of DO Concentration on the Process of Partial Nitritation (First Stage of Deammonification—Aerobic)

It is known that a high concentration of NH3-N (5–40 g N/m3) and a low concentration of DO (<0.13 mg O2/L) are the factors responsible for the suppression of NOB, especially Nitrobacter sp. [32]. In this study, when the aeration mode was set to off/on (12/3 min), lower DO concentrations (0.4–0.7 vs. 1.0–1.5 mg O2/L) suppressed NOB (NPR = 0.6 vs. 0.9–1.2 mg N/g VSS/h). On the other hand, high concentrations of DO (1–1.5 mg O2/L) favor AOB and NOB with NO3-N build-up.
The NOB activity must be effectively suppressed without reducing the AOB activity. The oxygen saturation constants of AOB and NOB are 0.2–0.4 mg/L and 1.2–1.5 mg/L, respectively, and AOB have a stronger affinity for DO than NOB at a lower DO concentration [33].
The results showed that the NOB were efficiently suppressed without adversely affecting the AOB and AnAOB activity, when using an appropriate intermittent aeration frequency at low DO settings. In contrast, higher DO set points indirectly promoted full nitrification, and its use in the deammonification process was less promising.
Miao et al. [12], similarly to our research, proposed two strategies to prevent NO3-N accumulation. The first was to limit the DO concentration to 0.17 mg/L. Under such conditions, however, the NOB enrichment took place, as evidenced by the increase in the number of copies of the Nitrospira gene from 2.61 × 10⁸ to 1.67 × 10¹⁰ copies/g of sediment in the first 105 days. In contrast, the Nitrobacter population accounted for less than 0.5% of Nitrospira. This supports the theory that high DO concentrations can provide a competitive advantage for AOB over Nitrobacter, while low DO levels are beneficial for Nitrospira. For this reason, the DO control alone as a method of NOB suppression is not effective and it cannot simultaneously eliminate both Nitrospira and Nitrobacter, which are present in the deammonification process [14].

4.2. Effect of the DO Concentration on the Anammox Process (Second Stage of Deammonification—Anoxic)

When the aeration mode was set to off/on (12/3 min), lower DO concentrations (0.4–0.7 vs. 1.0–1.5 mg O2/L) favored the AnAOB activity. On the other hand, a high DO concentration (1–1.5 mg O2/L) inhibited the activity of AnAOB. It was shown that 0.28 mg O2/L was the threshold DO for inhibition of AnAOB [34]. Other authors reported that the AnAOB activity decreased significantly at DO > 0.46 mg O2/L, and at DO > 1 mg O2/L, the activity was significantly inhibited [35]. In our research, the optimal DO value was found at 0.7 mg O2/L, which differs significantly from the above studies.
AnAOB are strictly anaerobic microorganisms that are inhibited by DO [13]. AnAOB inhibition by low DO concentrations was found to be reversible but irreversible at higher concentrations, as observed in the deammonification process [16]. Most of the known AnAOBs belong to Planctomycetes [36], whose population depends on the DO value. In the studies by Zuo et al. [37], it first decreased from 2.35% to 1.38% due to the high DO concentration, and then increased to 4.25% when the DO decreased.
Low DO levels also make AnAOB much more competitive, as a decreased DO concentration results in a decrease in the NOB activity and reduces its potential AnAOB inhibition [38]. Moreover, Corbalá-Robles et al. [39] found that the main factor reducing nitrogen removal during the deammonification process was inhibition of the anammox conversion rate by a high DO concentration of 1–2 mg O2/L. Moreover, Cao et al. [13] reported that 75% of NO2-N accumulation was obtained in the full-scale PN/A process in Singapore at DO concentrations of 1.4–1.8 mg O2/L.

4.3. Influence of the Aeration Strategy on the Partial Nitritation Process (First Stage of Deammonification—Aerobic)

The NOB activity can be suppressed by selecting the appropriate aeration strategies. It has already been confirmed many times that periodic aeration is more effective in suppressing NOB compared to the continuous mode [12,23,40,41,42,43]. The use of intermittent aeration can not only reduce energy consumption but also increase NOB inhibition and avoid NO3-N accumulation [44].
In addition, a higher frequency of aeration may have more benefits for AOB compared to NOB [45]. Reducing the aerobic cycle length or increasing the anaerobic cycle length can effectively inhibit the NOB activity [12]. The activity of AOB and NOB under anaerobic conditions is inhibited, and after re-entering the aeration phase after prolonged “starvation”, AOB has a stronger reproductive capacity. On the other hand, NOB cannot reach the earlier activity level immediately, which effectively favors the implementation of partial nitritation [37].
The second strategy to prevent NO3-N accumulation proposed by Miao et al. [12] was to use intermittent aeration with 7-min aeration and 21-min non-aeration periods at a DO concentration of 0.5 mg O2/L. That strategy increased the efficiency of TN removal by inhibiting NOB and prevented NO3-N accumulation. The Nitrospira gene copy number was 1.97 × 10⁹ copies/g dry pellet, indicating that NOB was not completely washed out from the reactor, but its activity was inhibited by intermittent aeration.

4.4. Effect of the Aeration Strategy on the Anammox Process (Second Stage of Deammonification—Anoxic)

With a strategy using alternating phases of aeration and no aeration, inhibition of AnAOB by oxygen can be mitigated by phases without aeration. When NO2-N accumulates in the first nitrification step, the aeration is turned off and the reactor goes into the non-aerated phase, allowing for the use of NO2-N by AnAOB. This approach was used by Ma et al. [23] in their research and the non-aerated time was doubled to enhance the anammox reaction. This reduced the NO2-N concentration and prevented its accumulation.

4.5. Effect of DO Concentrations and Aeration Strategies on the Deammonification Efficiency

At the fixed intermittent aeration frequency in all the scenarios (1–4), the AUR and NPR values increased with the increasing DO in the range of 0.4–1.5 mg O2/L. Both trends can be well described by linear functions as shown in Figure 6. When the NH4-N concentration has always been well above the half-saturation constant of NH4-N, the Monod term for ammonia remained constant, so the AUR depended essentially on the DO consumption. At low DO concentrations (<0.7 mg O2/L), AOB did not produce enough NO2-N for AnAOB. When too much oxygen was supplied (>0.7 mg O2/L), NOB outcompeted AOB, causing the NPR/AUR ratio to increase. The deammonification efficiency improved as the DO increased from 0.4 to 0.7 mg O2/L, and worsened as the DO set point increased from 0.7 to 1.5 mg O2/L. The minimum ratio of NPR/AUR was found at the level of DO = 0.7 mg O2/L. This highlights the overall maximum deammonification efficiency at that DO concentration (0.7 mg O2/L).
A DO concentration of 0.7 mg O2/L was effective in suppressing NOB compared to AOB, leading to a higher AnAOB activity and avoiding NO3-N accumulation. In this way, it was possible to consider the efficiency and economy of nitrogen removal in the deammonification process. Since high DO concentrations can inhibit the AnAOB activity or stimulate the NOB growth, many deammonification studies have been performed at low DO concentrations [12,34,40,41,46].
Similar to our study, Yang et al. [47] found that the deammonification efficiency increased when the DO set point increased from 0.25 to 0.76 mg O2/L and worsened at a DO greater than 1.15 mg O2/L in a one-stage pilot deammonification SBR.
In other studies, it is worth noting that DO as low as 0.19 mg O2/L allowed to obtain satisfactory results in terms of the effectiveness of NH4-N removal (92.2%) [39]. Yang et al. [34] achieved the NH4-N removal efficiency at the level of 81.5% when DO = 0.18–0.2 mg O2/L. At DO in the range of 0.24–0.28 mg O2/L, the removal efficiency was 88.2%. Further increasing the DO level to 0.28–0.35 mg O2/L resulted in a decrease in the efficiency to 85.9% (Table 4). However, on the other hand, high NH4-N removal efficiencies (83–90%) can be obtained even with high DO ranging from 0.8–1.2 mg O2/L [48,49].
In our study, the most favorable intermittent aeration strategy with DO = 0.7 mg O2/L was obtained at the off/on times of 6 min/3 min with the TN removal efficiency of 74%. This strategy resulted in more favorable conditions for AnAOB than NOB (NPR/AUR = 0.07), with a relatively high NO3-N production (NPR = 0.9 mg N/g VSS/h) compensated by high NH4-N removal (AUR = 13 mg N/g VSS/h). Reducing the non-aerated time to 3 min increased the activity of NOB (NPR = 2.1 mg N/g VSS/h) and reduced the efficiency of TN removal. Table 4 illustrates the effect of different aeration strategies on the deammonification efficiency in terms of NH4-N removal.
Yang et al. [40] obtained a much higher efficiency of NH4-N removal with intermittent aeration compared to continuous aeration (74% vs. 92.2%) (Table 4). Similarly, Pereira et al. [50] reported the lowest NH4-N removal efficiencies during continuous aeration (57%), while the efficiencies reached 70% when intermittent aeration was applied. Continuous aeration can result in NH4-N removal efficiency as low as 5%, while intermittent aeration shows a minimum of 72% in the same study [49]. It is, therefore, worth considering intermittent aeration to increase the NH4-N removal efficiency.
The authors also propose different times without aeration and aeration during intermittent aeration (Table 4). In our study, the optimal ratio was 2 (off/on = 6/3 min) and was confirmed by other studies. Pereira et al. [50] achieved the highest process efficiency when the time of non-aeration was twice as long as the time with aeration (30/15 min). The same off/on ratio was maintained by Sobotka et al. [49] with an intermittent aeration mode off/on (18/9 min). However, there are studies where the aeration time was seven times longer than that without aeration (105 min/15 min), where the NH4-N removal efficiency was high (81.5–92.2%) [34,40].
The results showed that the appropriate frequency of the intermittent aeration cycle can improve AOB and AnAOB competition by effectively activating NOB suppression.

5. Conclusions

The DO set point and the intermittent aeration mode are important parameters that affect the deammonification process rate and efficiency of the nitrogen removal. An optimal DO of 0.7 mg O2/L with an appropriate intermittent aeration mode off/on condition (6/3 min) ensured a high-efficiency of deammonification performance in a granular SBR. Under these conditions, the AUR of 13 mg N/g VSS/h, NPR of 0.9 mg N/g VSS/h and TN removal efficiency of 74% were achieved. The NOBs were effectively suppressed, with no NO2-N and NO3-N accumulation due to the appropriate conditions for both AOB and AnAOB. Model predictions confirmed the experimental data.

Supplementary Materials

The following supporting information can be downloaded at: https://www.mdpi.com/article/10.3390/w14030368/s1, Figure S1: The conceptual model for nitrogen transformation under aeration off/on conditions; Figure S2: The initial microorganisms’ composition and their predicted value after the batch test under different scenarios; Figure S3: The variation in the simulated growth rates of different microorganisms with different DO set points, i.e., (A) 0.4 mg O2/L, (B) 0.7 mg O2/L, (C) 1.0 mg O2/L and (D) 1.5 mg O2/L, at the same intermittent aeration mode off/on (12/3 min) conditions; Figure S4: The variation in the simulated growth rates of different microorganisms with different intermittent aeration mode off/on, i.e., (A) 9 min/3 min, (B) 6 min/3 min and (C) 3 min/3 min, at the same DO set point of 0.7 mg O2/L; Table S1: Definition of the state variables of the proposed model; Table S2: The matrix of the proposed model; Table S3: The Kinetic equations of the proposed model; Table S4: Stoichiometric parameters and conversion factors; Table S5: Kinetic parameters and their values (* value at T = 20 °C); Table S6: Sensitivity coefficients calculated for the adjusted stoichiometric parameters; Table S7: Sensitivity coefficients calculated for the adjusted kinetic parameters.

Author Contributions

Conceptualization, H.E.A.-H.; methodology, H.E.A.-H., J.B.M. and Z.Y.; validation, Z.Y. and J.M.; formal analysis, H.E.A.-H. and D.G.; investigation, H.E.A.-H., D.G., Z.Y. and J.B.M.; writing—original draft preparation, H.E.A.-H., D.G., Z.Y. and J.B.M.; writing—review and editing, J.M.; visualization, D.G. and J.B.M.; supervision, J.M. All authors have read and agreed to the published version of the manuscript.

Funding

Not applicable.

Institutional Review Board Statement

Not applicable.

Informed Consent Statement

Not applicable.

Data Availability Statement

Not applicable.

Acknowledgments

We are extremely grateful and appreciative of all the MDPI editorial staff who made a contribution to the editorial process for their kind cooperation and committed engagement.

Conflicts of Interest

The authors declare no conflict of interest.

References

  1. Al-Hazmi, H.; Lu, X.; Majtacz, J.; Kowal, P.; Xie, L.; Makinia, J. Optimization of the Aeration Strategies in a Deammonification Sequencing Batch Reactor for Efficient Nitrogen Removal and Mitigation of N2O Production. Environ. Sci. Technol 2021, 55, 1218–1230. [Google Scholar] [CrossRef] [PubMed]
  2. Al-Hazmi, H.; Lu, X.; Grubba, D.; Majtacz, J.; Kowal, P.; Mąkinia, J. Achieving Efficient and Stable Deammonification at LowTemperatures—Experimental and Modeling Studies. Energies 2021, 14, 3961. [Google Scholar] [CrossRef]
  3. Agrawal, S.; Seuntjens, D.; De Cocker, P.; Lackner, S.; Vlaeminck, S.E. Success of mainstream partial nitritation/anammox demands integration of engineering, microbiome and modeling insights. Curr. Opin. Biotechnol. 2018, 50, 214–221. [Google Scholar] [CrossRef]
  4. Xie, B.; Jin, C.; Parker, W.J. Impact of mixing intensity on dissolved oxygen halfvelocity constants in a sidestream deammonification environment. Water Qual. Res. J. Can. 2020, 55, 145–154. [Google Scholar] [CrossRef]
  5. Yu, H.; Tian, Z.; Zuo, J.; Song, Y. Enhanced nitrite accumulation under mainstream conditions by a combination of free ammonia-based sludge treatment and low dissolved oxygen: Reactor performance and microbiome analysis. RSC Adv. 2020, 10, 2049–2059. [Google Scholar] [CrossRef] [Green Version]
  6. Ma, Y.; Peng, Y.; Wang, S.; Yuan, Z.; Wang, X. Achieving nitrogen removal via nitrite in a pilot-scale continuous pre-denitrification plant. Water Res. 2009, 43, 563–572. [Google Scholar] [CrossRef] [PubMed]
  7. Hellinga, C.; Schellen, A.A.J.C.; Mulder, J.W.; Van Loosdrecht, M.C.M.; Heijnen, J.J. The SHARON process: An innovative method for nitrogen removal from ammonium-rich waste water. Water Sci. Technol. 1998, 37, 135–142. [Google Scholar] [CrossRef]
  8. Schraa, O.; Rosenthal, A.; Wade, M.J.; Rieger, L.; Miletić, I.; Alex, J. Assessment of aeration control strategies for biofilm-based partial nitritation/anammox systems. Water Sci. Technol. 2020, 81, 1757–1765. [Google Scholar] [CrossRef] [Green Version]
  9. Lackner, S.; Thoma, K.; Gilbert, E.M.; Gander, W.; Schreff, D.; Horn, H. Start-up of a full-scale deammonification SBR-treating effluent from digested sludge dewatering. Water Sci. Technol. 2015, 71, 553–559. [Google Scholar] [CrossRef]
  10. Lackner, S.; Gilbert, E.M.; Vlaeminck, S.E.; Joss, A.; Horn, H.; van Loosdrecht, M.C.M. Full-scale partial nitritation/anammox experiences—An application survey. Water Res. 2014, 55, 292–303. [Google Scholar] [CrossRef]
  11. Persson, F.; Sultana, R.; Suarez, M.; Hermansson, M.; Plaza, E.; Wilén, B.M. Structure and composition of biofilm communities in a moving bed biofilm reactor for nitritation-anammox at low temperatures. Bioresour. Technol. 2014, 154, 267–273. [Google Scholar] [CrossRef] [PubMed]
  12. Miao, Y.; Zhang, L.; Yang, Y.; Peng, Y.; Li, B.; Wang, S.; Zhang, Q. Start-up of single-stage partial nitrification-anammox process treating low-strength swage and its restoration from nitrate accumulation. Bioresour. Technol. 2016, 218, 771–779. [Google Scholar] [CrossRef] [PubMed]
  13. Cao, Y.S.; Kwok, B.H.; Yong, W.H.; Chua, S.C.; Wah, Y.L.; Yahya, A.G. The mainstream autotrophic nitrogen removal in the largest full scale activated sludge process in Singapore: Process analysis. In Proceedings of the WEF/IWA Nutrient Removal and Recovery 2013: Trends in Resource Recovery and Use, Vancouver, BC, Canada, 28–31 July 2013. [Google Scholar]
  14. Feng, Y.; Lu, X.; Al-Hazmi, H.; Mąkinia, J. An overview of the strategies for the deammonification process start-up and recovery after accidental operational failures. Rev. Environ. Sci. Biotechnol. 2017, 16, 541–568. [Google Scholar] [CrossRef]
  15. Egli, K.; Fanger, U.; Alvarez, P.; Siegrist, H. Enrichment and characterization of an anammox bacterium from a rotating biological contactor treating ammonium-rich leachate. Arch. Microbiol. 2001, 175, 198–207. [Google Scholar] [CrossRef] [PubMed]
  16. Yin, Z.; Santos, C.E.D.D.; Vilaplana, J.G.; Sobotka, D.; Czerwionka, K.; Damianovic, M.H.R.Z.; Xie, L.; Jesus, F.; Morales, F.; Makinia, J. Importance of the combined effects of dissolved oxygen and pH on optimization of nitrogen removal in anammox-enriched granular sludge. Process. Biochem. 2016, 51, 1274–1282. [Google Scholar] [CrossRef]
  17. Laureni, M.; Falås, P.; Robin, O.; Wick, A.; Weissbrodt, D.G.; Nielsen, J.L.; Ternes, T.A.; Morgenroth, E.; Joss, A. Mainstream partial nitritation and anammox: Long-term process stability and effluent quality at low temperatures. Water Res. 2016, 101, 628–639. [Google Scholar] [CrossRef] [Green Version]
  18. Isanta, E.; Reino, C.; Carrera, J.; Pérez, J. Stable partial nitritation for low-strength wastewater at low temperature in an aerobic granular reactor. Water Res. 2015, 80, 149–158. [Google Scholar] [CrossRef] [Green Version]
  19. Fernández, I.; Dosta, J.; Fajardo, C.; Campos, J.L.; Mosquera-Corral, A.; Méndez, R. Short- and long-term effects of ammonium and nitrite on the anammox process. J. Environ. Manag. 2012, 95, 170–174. [Google Scholar] [CrossRef]
  20. Blackburne, R.; Yuan, Z.; Keller, J. Partial nitrification to nitrite using low dissolved oxygen concentration as the main selection factor. Biodegradation 2008, 19, 303–312. [Google Scholar] [CrossRef]
  21. Fernandes, H.; Jungles, M.K.; Hoffmann, H.; Antonio, R.V.; Costa, R.H.R. Full-scale sequencing batch reactor (SBR) for domestic wastewater: Performance and diversity of microbial communities. Bioresour. Technol. 2013, 132, 262–268. [Google Scholar] [CrossRef] [Green Version]
  22. Li, X.; Sun, S.; Badgley, B.D.; Sung, S.; Zhang, H.; He, Z. Nitrogen removal by granular nitritation-anammox in an upflow membrane-aerated biofilm reactor. Water Res. 2016, 94, 23–31. [Google Scholar] [CrossRef] [PubMed] [Green Version]
  23. Ma, B.; Bao, P.; Wei, Y.; Zhu, G.; Yuan, Z.; Peng, Y. Suppressing nitrite-oxidizing bacteria growth to achieve nitrogen removal from domestic wastewater via anammox using intermittent aeration with low dissolved oxygen. Sci. Rep. 2015, 5, 13048. [Google Scholar] [CrossRef] [PubMed]
  24. Gilbert, E.M.; Agrawal, S.; Karst, S.M.; Horn, H.; Nielsen, P.H.; Lackner, S. Low temperature partial nitritation/anammox in a moving bed biofilm reactor treating low strength wastewater. Environ. Sci. Technol. 2014, 48, 8784–8792. [Google Scholar] [CrossRef]
  25. Wett, B.; Omari, A.; Podmirseg, S.M.; Han, M.; Akintayo, O.; Gómez Brandón, M.; Murthy, S.; Bott, C.; Hell, M.; Takacs, I.; et al. Going for mainstream deammonification from bench to full scale for maximized resource efficiency. Water Sci. Technol. 2013, 68, 283–289. [Google Scholar] [CrossRef] [PubMed]
  26. Regmi, P.; Miller, M.W.; Holgate, B.; Bunce, R.; Park, H.; Chandran, K.; Wett, B.; Murthy, S.; Bott, C.B. Control of aeration, aerobic SRT and COD input for mainstream nitritation/denitritation. Water Res. 2014, 57, 162–171. [Google Scholar] [CrossRef]
  27. Al-Hazmi, H.; Grubba, D.; Majtacz, J.; Kowal, P.; Makinia, J. Evaluation of Partial Nitritation/Anammox (PN/A) Process Performance and Microorganisms Community Composition under Different C/N Ratio. Water 2019, 11, 2270. [Google Scholar] [CrossRef] [Green Version]
  28. Pereira, T.D.S.; Dos Santos, C.E.D.; Lu, X.; Al-Hazmi, H.E.; Majtacz, J.; Pires, E.C.; Makinia, J. Effect of operating conditions on N2O production in an anammox sequencing batch reactor containing granular sludge. Water Sci. Technol. 2019, 80, 37–47. [Google Scholar] [CrossRef]
  29. Lu, X.; Pereira, T.D.S.; Al-Hazmi, H.E.; Majtacz, J.; Zhou, Q.; Xie, L.; Makinia, J. Model-Based Evaluation of N2O Production Pathways in the Anammox-Enriched Granular Sludge Cultivated in a Sequencing Batch Reactor. Environ. Sci. Technol. 2018, 52, 2800–2809. [Google Scholar] [CrossRef]
  30. Salmistraro, M.; Fernández, I.; Dosta, J.; Plaza, E.; Mata, J. Mainstream deammonification: Preliminary experience employing granular AOB-enriched biomass at low DO values. Water Air Soil Pollut. 2017, 228, 178. [Google Scholar] [CrossRef]
  31. Dapena-Mora, A.; Arrojo, B.; Campos, J.L.; Mosquera-Corral, A.; Méndez, R. Improvement of the settling properties of Anammox sludge in an SBR. J. Chem. Technol. Biotechnol. 2004, 79, 1417–1420. [Google Scholar] [CrossRef]
  32. Wang, X.; Gao, D. In-situ restoration of one-stage partial nitritation-anammox process deteriorated by nitrate build-up via elevated substrate levels. Sci. Rep. 2016, 6, 37500. [Google Scholar] [CrossRef] [PubMed] [Green Version]
  33. Laanbroek, H.J.; Gerards, S. Competition for limiting amounts of oxygen between nitrosomonas europaea and nitrobacter winogradskyi grown in mixed continuous cultures. Arch. Microbiol. 1993, 159, 453–459. [Google Scholar] [CrossRef]
  34. Yang, S.; Xu, S.; Boiocchi, R.; Mohammed, A.; Li, X.; Ashbolt, N.J.; Liu, Y. Long-term continuous partial nitritation-anammox reactor aeration optimization at different nitrogen loading rates for the treatment of ammonium rich digestate lagoon supernatant. Process. Biochem. 2020, 99, 139–146. [Google Scholar] [CrossRef]
  35. Zhang, Y.; Han, H.; Wang, W.; Wang, X.; Wang, Y. Impact of dissolved oxygen on autotrophic nitrogen removals of the granular sludge in a CANON process. Zhongguo Huanjing Kexue/China Environ. Sci. 2017, 37, 4501–4510. [Google Scholar]
  36. Gonzalez-Martinez, A.; Osorio, F.; Morillo, J.A.; Rodriguez-Sanchez, A.; Gonzalez-Lopez, J.; Abbas, B.A.; van Loosdrecht, M.C.M. Comparison of bacterial diversity in full scale anammox bioreactors operated under different conditions. Biotechnol. Prog. 2015, 31, 1464–1472. [Google Scholar] [CrossRef]
  37. Zuo, F.; Sui, Q.; Zheng, R.; Ren, J.; Wei, Y. In situ startup of a full-scale combined partial nitritation and anammox process treating swine digestate by regulation of nitrite and dissolved oxygen. Bioresour. Technol. 2020, 315, 123837. [Google Scholar] [CrossRef]
  38. Malovanyy, A.; Yang, J.; Trela, J.; Plaza, E. Combination of upflow anaerobic sludge blanket (UASB) reactor and partial nitritation/anammox moving bed biofilm reactor (MBBR) for municipal wastewater treatment. Bioresour. Technol. 2015, 180, 144–153. [Google Scholar] [CrossRef]
  39. Corbalá-Robles, L.; Picioreanu, C.; van Loosdrecht, M.C.M.; Pérez, J. Analysing the effects of the aeration pattern and residual ammonium concentration in a partial nitritation-anammox process. Environ. Technol. 2015, 3330, 1–22. [Google Scholar] [CrossRef]
  40. Yang, S.; Xu, S.; Zhou, Y.; Mohammed, A.; Ashbolt, N.J.; Liu, Y. The importance of integrated fixed film activated sludge reactor and intermittent aeration in nitritation-anammox systems: Understanding reactor optimization for lagoon supernatant treatment. Int. Biodeterior. Biodegrad. 2020, 149, 104938. [Google Scholar] [CrossRef]
  41. Miao, Y.; Zhang, L.; Li, B.; Zhang, Q.; Wang, S.; Peng, Y. Enhancing ammonium oxidizing bacteria activity was key to single-stage partial nitrification-anammox system treating low-strength sewage under intermittent aeration condition. Bioresour. Technol. 2017, 231, 36–44. [Google Scholar] [CrossRef]
  42. Yang, J.; Trela, J.; Zubrowska-Sudol, M.; Plaza, E. Intermittent aeration in one-stage partial nitritation/anammox process. Ecol. Eng. 2015, 75, 413–420. [Google Scholar] [CrossRef]
  43. Li, H.; Zhou, S.; Huang, G.; Xu, B. Partial nitritation of landfill leachate with varying influent composition under intermittent aeration conditions. Process. Saf. Environ. Prot. 2013, 91, 285–294. [Google Scholar] [CrossRef]
  44. Jardin, N.; Hennerkes, J. Full-scale experience with the deammonification process to treat high strength sludge water—A case study. Water Sci. Technol. 2012, 65, 447–455. [Google Scholar] [CrossRef] [PubMed]
  45. Han, M.; De Clippeleir, H.; Al-Omari, A.; Wett, B.; Vlaeminck, S.E.; Bott, C.; Murthy, S. Impact of carbon to nitrogen ratio and aeration regime on mainstream deammonification. Water Sci. Technol. 2016, 74, 375–384. [Google Scholar] [CrossRef] [Green Version]
  46. Zheng, Z.; Li, J.; Ma, J.; Du, J.; Bian, W.; Li, Y.; Zhang, Y.; Zhao, B. Nitrogen removal via simultaneous partial nitrification, anammox and denitrification (SNAD) process under high DO condition. Biodegradation 2016, 27, 195–208. [Google Scholar] [CrossRef]
  47. Yang, Y.; Zhang, L.; Han, X.; Zhang, S.; Li, B.; Peng, Y. Determine the operational boundary of a pilot-scale single-stage partial nitritation/anammox system with granular sludge. Water Sci. Technol. 2016, 73, 2085–2092. [Google Scholar] [CrossRef]
  48. Miao, Y.; Peng, Y.; Zhang, L.; Li, B.; Li, X.; Wu, L.; Wang, S. Partial nitrification-anammox (PNA) treating sewage with intermittent aeration mode: Effect of influent C/N ratios. Chem. Eng. J. 2018, 334, 664–672. [Google Scholar] [CrossRef]
  49. Sobotka, D.; Czerwionka, K.; Makinia, J. The effects of different aeration modes on ammonia removal from sludge digester liquors in the nitritation-anammox process. Water Sci. Technol. 2015, 71, 986–995. [Google Scholar] [CrossRef] [Green Version]
  50. Pereira, A.D.; Fernandes, L.D.A.; Castro, H.M.C.; Leal, C.D.; Carvalho, B.G.P.; Dias, M.F.; Nascimento, A.M.A.; Chernicharo, C.A.D.L.; Araújo, J.C.D. Nitrogen removal from food waste digestate using partial nitritation-anammox process: Effect of different aeration strategies on performance and microbial community dynamics. J. Environ. Manag. 2019, 251, 109562. [Google Scholar] [CrossRef]
  51. Chini, A.; Kunz, A.; Viancelli, A.; Scussiato, L.A.; Dias, J.R.; Jacinto, I.C. Recirculation and aeration effects on deammonification activity. Water Air Soil Pollut. 2016, 227, 681–691. [Google Scholar] [CrossRef]
  52. Ge, S.; Peng, Y.; Qiu, S.; Zhu, A.; Ren, N. Complete nitrogen removal from municipal wastewater via partial nitrification by appropriately alternating anoxic/aerobic conditions in a continuous plug-flow step feed process. Water Res. 2014, 55, 95–105. [Google Scholar] [CrossRef] [PubMed]
Figure 1. Schematic diagram of the laboratory-scale SBR for granular deammonification.
Water 14 00368 g001
Figure 2. Measured and predicted results of the batch experiments with different DO set points (scenarios 1–4), i.e., (A1,A2) 0.4 mg O2/L, (B1,B2) 0.7 mg O2/L, (C1,C2) 1.0 mg O2/L and (D1,D2) 1.5 mg O2/L, at the same intermittent aeration mode off/on (12/3 min) and pH controlled at 7.6 ± 0.3.
Water 14 00368 g002
Figure 3. Measured and predicted results of the batch experiments with different intermittent aeration mode off/on (scenarios 5–7), i.e., (A1,A2) 9 min/3 min, (B1,B2) 6 min/3 min and (C1,C2) 3 min/3 min, at the same DO set point of 0.7 mg O2/L and pH controlled at 7.6 ± 0.3.
Water 14 00368 g003
Figure 4. (A) The SBR operation strategies in different phases of the long-term experiment and (B) the experimental data and model simulated result of the SBR effluent in different phases.
Water 14 00368 g004
Figure 5. Predicted biomass concentrations in the SBR in the course of the long-term experiment: (A) AOB, (B) NOB, (C) AnAOB and (D) HDB.
Water 14 00368 g005
Figure 6. Effects of the DO concentrations under the intermittent aeration frequency off/on (12/4 min) on the AUR, NPR and NPR/AUR ratios in lab-scale SBR deammonification systems.
Water 14 00368 g006
Table 1. The operational parameters for the SBR under different DO set points.
ParametersUnitsExperimental Scenarios
I PHASEII PHASEIII PHASEIV PHASE
1234567
DO set pointmg O2/L0.40.71.01.50.7
Aeration mode (off/on)min12/39/36/33/3
Off/on ratio (R)-4321
Aeration frequency1/h456.6710
Influent NH4-N concentrationmg N/L900 ± 100
TN loading ratemg N/g VSS/d108–185
Initial NH4-N concentration in the reactormg N/L400 ± 30
MLVSSmg VSS/L2000–4000
pH-7.6 ± 0.3
Temperature°C30 ± 1
Table 2. Summary of the most important deammonification performance indicators with different DO set points.
ScenarioIntermittent Aeration
(off/on)
DO Set-PointAURNPRNPR/AUR RatioTN Removal Efficiency
minmg O2/Lmg N/g VSS/hmg N/g VSS/h-%
112/30.45.60.60.1168
212/30.76.60.60.0978
312/31.07.00.90.1376
412/31.57.81.20.1673
Table 3. Summary of the most important deammonification performance indicators, with a shorter aeration length and high frequency.
ScenarioIntermittent Aeration ModesDO Set-PointAURNPRNPR/AURTN Removal Efficiency
off/on minmg O2/Lmg N/g VSS/hmg N/g VSS/h %
59/30.790.70.0853
66/30.7130.90.0774
73/30.718.12.10.1272
Table 4. Strategies of aeration in the deammonification process and their NH4-N removal efficiencies.
ReactorAeration ModeOffOnRDONH4-N Removal EfficiencyReference
minmin mg O2/L%
CSTRintermittent151050.140.18–0.281.5[34]
0.22–0.2487.2
0.24–0.2888.2
0.28–0.3585.9
CSTRcontinuous---0.1865[40]
continuous---0.1856
continuous---0.1874
intermittent151050.140.1991.8
intermittent151050.140.1992.2
SBRintermittent15450.336.0163[50]
intermittent151510.0661
intermittent301520.0870
intermittent451530.1857
continuous---3.7457
intermittent451530.0365
intermittent451530.0546
intermittent301520.0462
SBRintermittent2182.630.8–1.283.4[48]
SBRcontinuous---0.1–0.370–90[41]
intermittent2182.630.4–0.650–95
intermittent2182.630.4–0.650–100
EGSBintermittent151510.5–0.926.2–45.4[51]
SBRintermittent21730.08–0.1761–83[12]
SBRintermittent1892172–89[49]
continuous189215–90
SBRintermittent303010.2–0.330–95[23]
SBRintermittent201020.3–299[52]
SBRintermittent1882.250.295[44]
Publisher’s Note: MDPI stays neutral with regard to jurisdictional claims in published maps and institutional affiliations.

