Article

Applications of Computational and Statistical Models for Optimizing the Electrochemical Removal of Cephalexin Antibiotic from Water

by
Maliheh Arab
1,
Mahdieh Ghiyasi Faramarz
2 and
Khalid Hashim
3,*
1
Department of Civil Engineering, Ferdowsi University of Mashhad, Mashhad 9177948974, Iran
2
Department of Building, Civil and Environmental Engineering, Concordia University, Montréal, QC H3G 1M8, Canada
3
Built Environment and Sustainable Technologies (BEST) Research Institute, Liverpool John Moores University, Liverpool L3 3AF, UK
*
Author to whom correspondence should be addressed.
Water 2022, 14(3), 344; https://doi.org/10.3390/w14030344
Submission received: 13 December 2021 / Revised: 13 January 2022 / Accepted: 19 January 2022 / Published: 24 January 2022

Abstract

:
One of the most serious effects of micropollutants in the environment is biological magnification, which causes adverse effects on humans and the ecosystem. Among all of the micro-pollutants, antibiotics are commonly present in the aquatic environment due to their wide use in treating or preventing various diseases and infections for humans, plants, and animals. Therefore, an aluminum-based electrocoagulation unit has been used in this study to remove cephalexin antibiotics, as a model of the antibiotics, from water. Computational and statistical models were used to optimize the effects of key parameters on the electrochemical removal of cephalexin, including the initial cephalexin concentration (15–55 mg/L), initial pH (3–11), electrolysis time (20–40 min), and electrode type (insulated and non-insulated). The response surface methodology-central composite design (RSM-CCD) was used to investigate the dependency of the studied variables, while the artificial neural network (ANN) and adaptive neuro-fuzzy inference system (ANFIS) methods were applied for predicting the experimental training data. The results showed that the best experimental and predicted removals of cephalexin (CEX) were 88.21% and 93.87%, respectively, which were obtained at a pH of 6.14 and electrolysis time of 34.26 min. The results also showed that the ANFIS model predicts and interprets the experimental results better than the ANN and RSM-CCD models. Sensitivity analysis using the Garson method showed the comparative significance of the variables as follows: pH (30%) > electrode type (27%) > initial CEX concentration (24%) > electrolysis time (19%).

1. Introduction

Diverse micro-pollutants entered the environment by disposing improperly of various ‘industries’ wastewater, including textiles, plastics, paper, pharmaceutical and health care products, detergents, etc. Among all of these micro-pollutants, pharmaceutical substances have been recognized as an essential issue due to their widespread usage for humans, animals, and plants and their high potential to reach water sources. In addition, the prolonged remaining of some pharmaceutical substances in the environment cause bacterial resistance because of their non-biodegradability characteristics. Consequently, this can be transmitted to humans and can manifest in diseases. Antibiotics are among the most widely used pharmaceuticals that destroy bacteria or reduce their growth rate [1]. These micro-pollutants are considered significant since antibiotics consumption represents about 15% of the total pharmaceutical consumption [2]. Cephalexin (CEX) is one of the cephalosporin antibiotics with antimicrobial properties, and it is used to treat a variety of diseases caused by gram-negative and gram-positive organisms, including various infectious diseases [3]. Therefore, the CEX antibiotics consumption is usually high, and its amount is higher in pharmaceutical effluents [4]. The constant entrance of CEX into water resources and the environment will create environmental issues and problems for humans. Accordingly, removing antibiotics, including CEX, from contaminated aqueous media is essential to maintaining water quality and protecting human health.
As conventional wastewater treatment methods cannot remove this type of contaminant, various advanced methods have been investigated for the removal of micropollutants, such as photocatalytic decomposition, advanced oxidation, nanofiltration, adsorption, ozonation and biofilms, biological filters, and reverse osmosis [5,6,7]. However, recent studies suggest new solutions for this problem. Nanomaterials were efficiently used as adsorbents to remove CEX from water [8,9]; for example Leili, et al. [10] demonstrated that a nano-zero-valent iron made from an extract of nettle and thyme was able to absorb 1667 and 1428 mg.g−1, respectively, demonstrating the success of nano for the removal of CEX from water for the adsorption of CEX. Additionally, some efficient adsorbents were used to remove CEX. For example, Shirani, et al. [11] used activated biochar to adsorb CEX and diclofenac from water and demonstrated that the activated biochar can adsorb 392.94 and 724.54 mg/g of diclofenac and CEX, respectively. However, nanomaterials and efficient adsorbents are still expensive, especially in developing countries [12]. Hence, the need for more sustainable and environmentally friendly methods has resulted in a consideration of electrochemical treatment processes, such as electrocoagulation (EC), to remove many types of antibiotic contaminants in wastewater. Electrocoagulation is a process that involves the destabilization of contaminants in wastewater by applying low current density [13,14]. The treatment process would begin with the dissolution of aluminum ions (Al3+) at the anode using aluminum electrodes, which is followed by the production of H2 and OH- ions at the cathode. This causes electrochemical reactions in both areas of the electrode, which are necessary to eliminate any external matter in the water. Finally, contaminants are extracted by flotation or sedimentation [15]. The electrocoagulation technique is included several advantages such as relatively low sludge production, reduced risk of secondary contamination, flexibility and short treatment time, and with this method there is no need for chemicals. This process has been used to remove COD in various industries, such as paper and pulp effluents [16,17], the sugar industry [18], and car wash wastewater [19]. In addition, this involved some disadvantages, including the necessity to replace the sacrificial electrodes; and that the residual sludge contains large concentrations of iron and aluminum depending on the electrode material, and thus could potentially require an expensive treatment process because it could consume a lot of energy. Therefore, in order to find a more economical and efficient process, it is necessary to model and optimize the electrocoagulation process. This could be achieved by using computational tools that make it possible to evaluate the operational parameters of the process [20]. Several studies have been performed for statistical optimization and modeling the electrochemical process to minimize the cost and required time for efficient wastewater treatment [21,22]. The working conditions could be designed by performing modeling, and subsequently, the experiments are performed in a way in which the cost of the treatment process is reduced [23]. RSM is semi-experimental modeling, which is commonly used to optimize variables. RSM would help model and design the experiments and evaluate the effect of operational parameters and their relationship to determine the optimal values of the electrocoagulation process [24,25]. Determination of the effective parameters is difficult due to the complexity of the reactions in the EC, since it leads to uncertainty in the design and measurement of the reactors. A reliable model for any wastewater treatment plant should provide a tool to predict its performance and to control process performance. Such a tool can minimize operating costs and ensure performance stability. Predicting operational parameters using conventional experimental techniques is also time-consuming, which limits their implementation [26]. Machine learning (ML) algorithms are beneficial in process controlling, which presents high levels of desirability. These methods could be used in wastewater treatment due to their ability in approximating complex functions. Few studies have investigated the simulation and modeling of electrochemical parameters by ML methods [27,28,29]. Some authors have suggested that the utilization of ML algorithms is a promising method to investigate the performance of electrochemical treatment of water and wastewater [30,31]. For example, da Silva Ribeiro et al. [32] have used an artificial neural network (ANN) to model experimental data of boron removal from aqueous solutions by electrocoagulation. Khan et al. [33] have applied the central composite based on response surface method (RSM) to investigate the dependency of the studied variables on the removal of synozol red dye using the electrocoagulation technique and artificial neural network training (ANN), which was trained to estimate the experimental data. Morales-Rivera et al. [20] have used response surface and artificial neural networks models to optimize the process of cold meat wastewater treatment. In this context, this study aims to optimize the electrocoagulation process for CEX removal by optimizing the effective parameters using the response surface method (RSM) with the central composite design (CCD). The best responses were examined using ANOVA analysis. In addition, the prediction of the removal efficiency (using artificial neural network (ANN) and adaptive neuro-fuzzy inference system (ANFIS) models) is within the aim of this study.

2. Materials and Methods

2.1. Reagents

In this study, the CEX antibiotic with the C16H17N3O4S·H2O formula (Merck, Darmstadt, Germany) has been used to prepare synthetic effluent. The initial pH of the solutions was adjusted using NaOH (Merck, Darmstadt, Germany) or H2SO4 (Merck, Darmstadt, Germany). NaCl (Merck, Darmstadt, Germany) has been used to adjust the current density, and HCl (Merck, Darmstadt, Germany) has been utilized to wash the formed metal oxides on the effective surface of the electrodes.

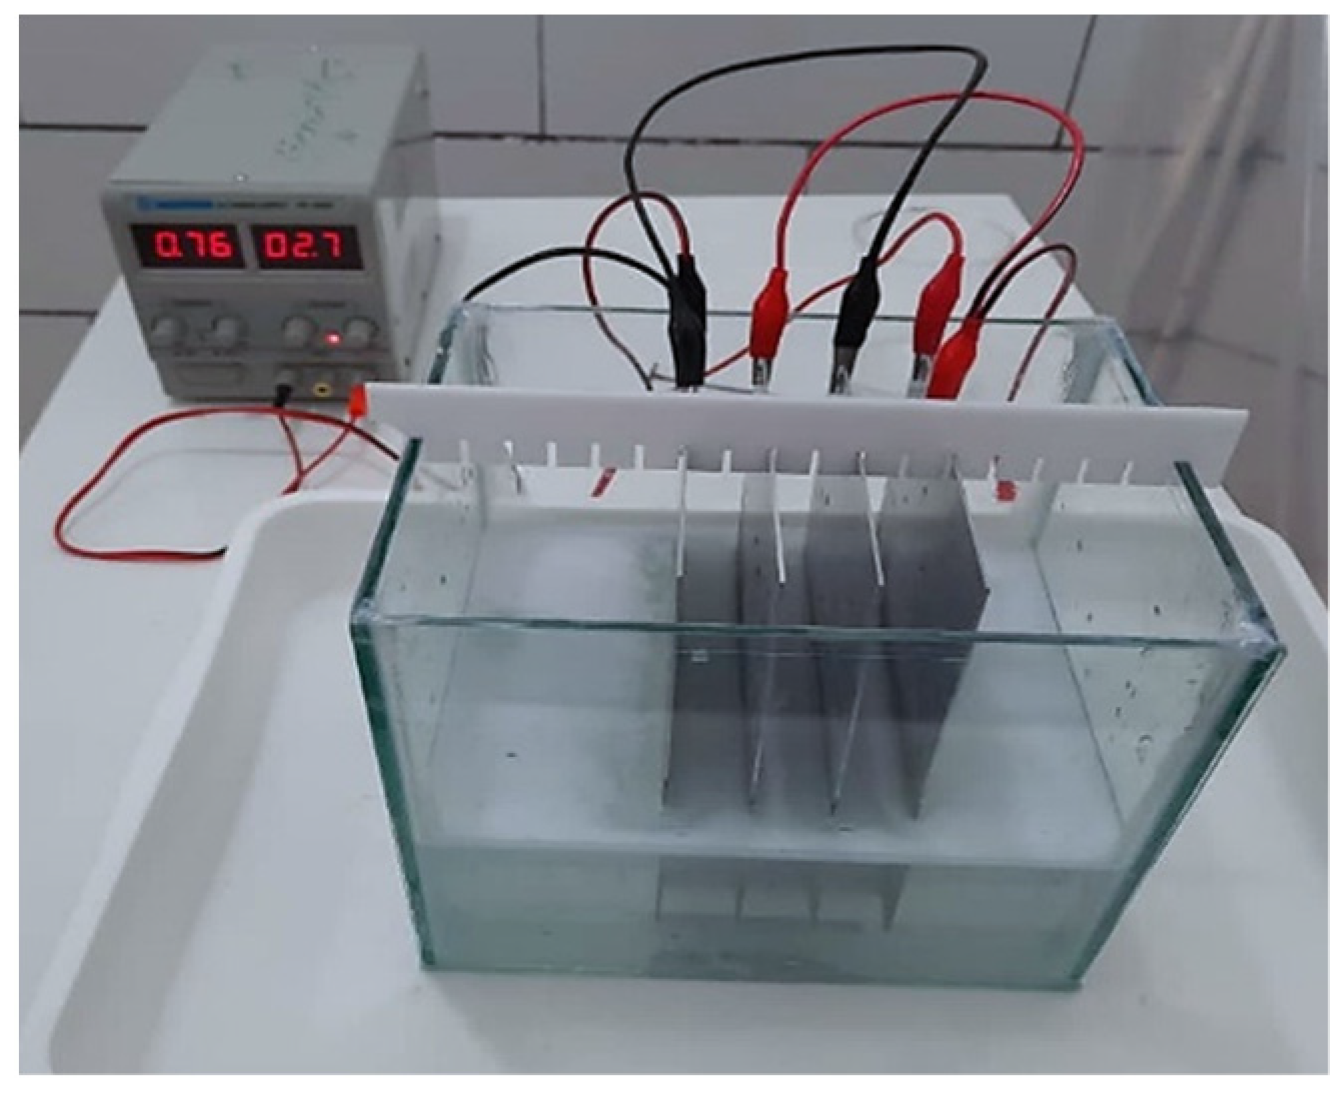
2.2. Electrocoagulation Reactor

The pilot unit that was used in this study consisted of a bench-scale reactor made of plexiglass with an effective volume of 3 L. In addition, four aluminum electrodes with dimensions of 140 mm × 80 mm and an effective surface of 56 cm2 were used as electrodes with the parallel and monopolar arrangement (Figure 1). The electrodes were connected to a digital DC supply. The adsorption and removal rate of CEX was measured with a UV-VIS spectrophotometer (PerkinElmer-550 SE) at a wavelength of 262 nm. The removal efficiency for each experiment was calculated using the following equation:
R ( % ) = ( C i C f ) C i × 100
where Ci and Cf represent the initial and remaining CEX concentrations (mg/L), respectively.

2.3. Research Roadmap

The present study is divided into four steps, including (i) experimental design and data collection, (ii) statistical analysis and optimization, (iii) data mining and training a machine for anticipation of removal rate, and (iv) determining the most effective parameter in prediction.
In the first stage, the CCD model was applied to design the experiments by considering four independent parameters to achieve the dependent parameter, which is the response. The removal efficiency was obtained according to designed experiments by Expert Design software, and these results were used in statistical modeling and AI algorithms.
In the statistical analysis and modeling step, various models, including linear, quadratic, 2FI, and quartic, etc., were used to model the CEX removal by CCD. The quadratic model was used in the present study. The model coefficients were evaluated after modeling; therefore, four criteria were used: model significance, model accuracy test, determination of R2 and Radj2 coefficients, and residual analysis. Then, the significance of the model was analyzed based on the F-value and p-value. Next, investigation of the diagnostic data was accomplished before performing graphical analysis and examining the interaction of the parameters to evaluate effective responses. Initially, the diagnostic investigation was based on model residues and would show the outliers in the response data. After performing the statistical analysis, the proposed model was presented as a quadratic equation in terms of the actual and coded parameters. Finally, the model for CEX removal was optimized based on the desirability function. In this regard, the optimization conditions for the variables and response were considered in the range and the maximum state.
In the modeling step, ANN and ANFIS models were used to predict the CEX removal efficiency from the aqueous solution. Therefore, a multi-layer feed-forward using an ML algorithm was trained to improve the ANN model for forecasting. Finally, sensitivity analysis was performed to verify the importance of the considered variables in the proposed models by the three mentioned methods.

2.4. Optimization and Modeling the Experiments Using the Machine Learning Model

2.4.1. Experimental Design and Optimization

The response surface model based on CCD was used to design and optimize the experiments. In this regard, four independent parameters, including (a) CEX initial concentration (15–55 mg/L), (b) electrolysis time (20–40 min), (c) initial pH (3–11), and (d) type of electrode was considered to achieve the dependent parameter. The range of the operating parameters using the CCD method is presented in Table 1.
The number of tests in the CCD method is calculated according to the following equation (Equation (2)). A total of 80 tests were proposed based on this equation and by repeating the experiments twice.
N = 2 K + 2 K + C 0
where K is the number of parameters, 2K central experiments, 2K axial experiments, and C0 center points.

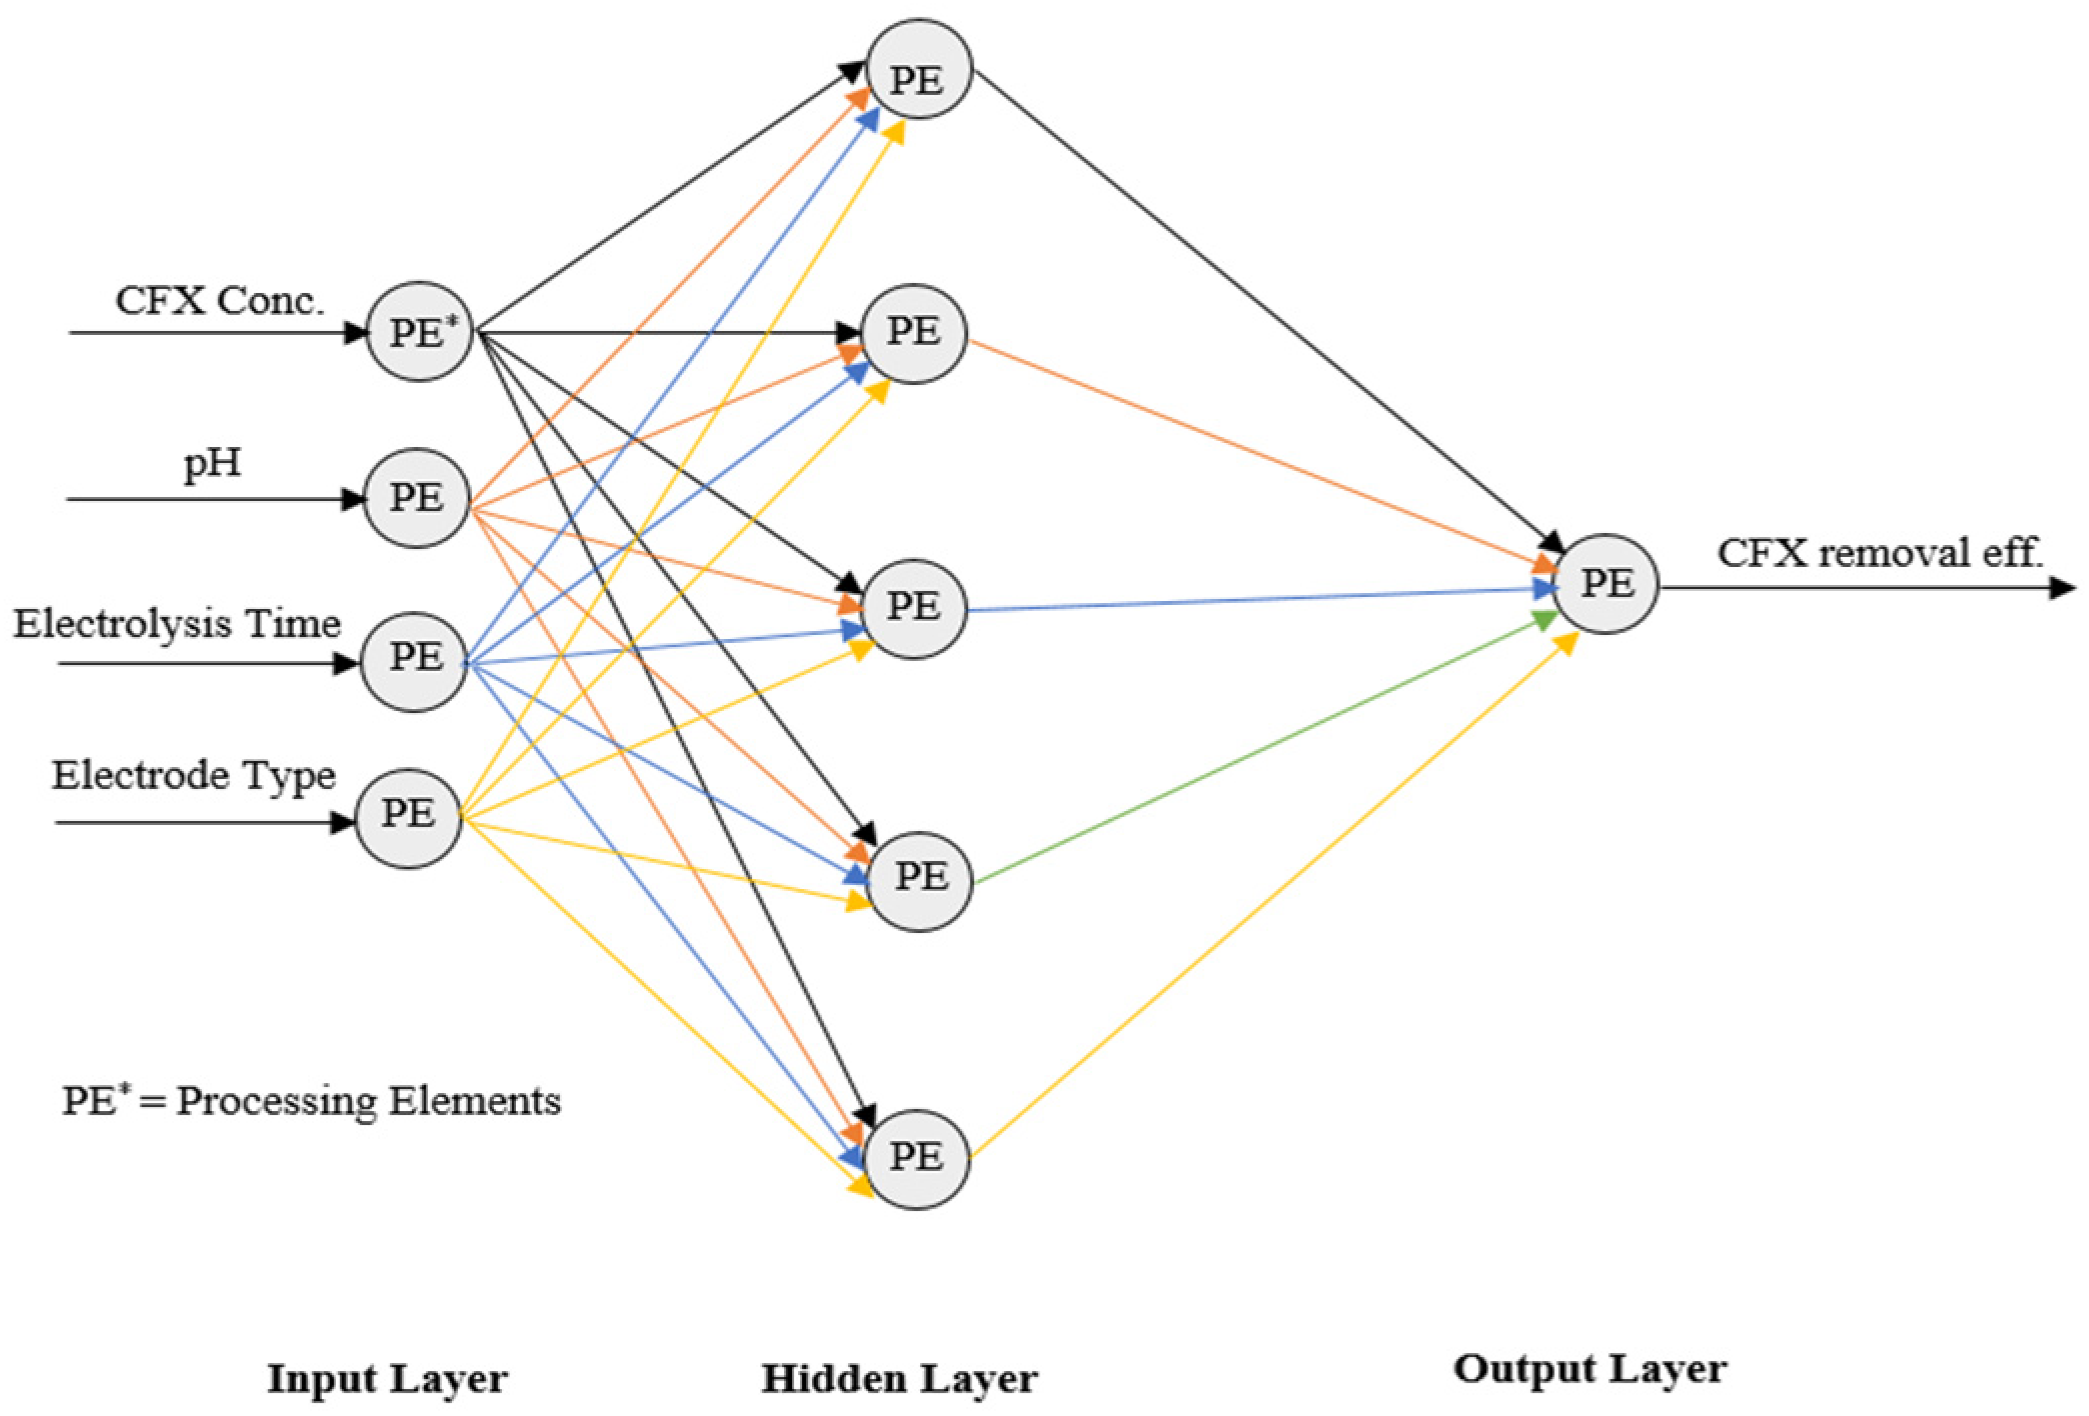
2.4.2. Modeling an Artificial Neural Network
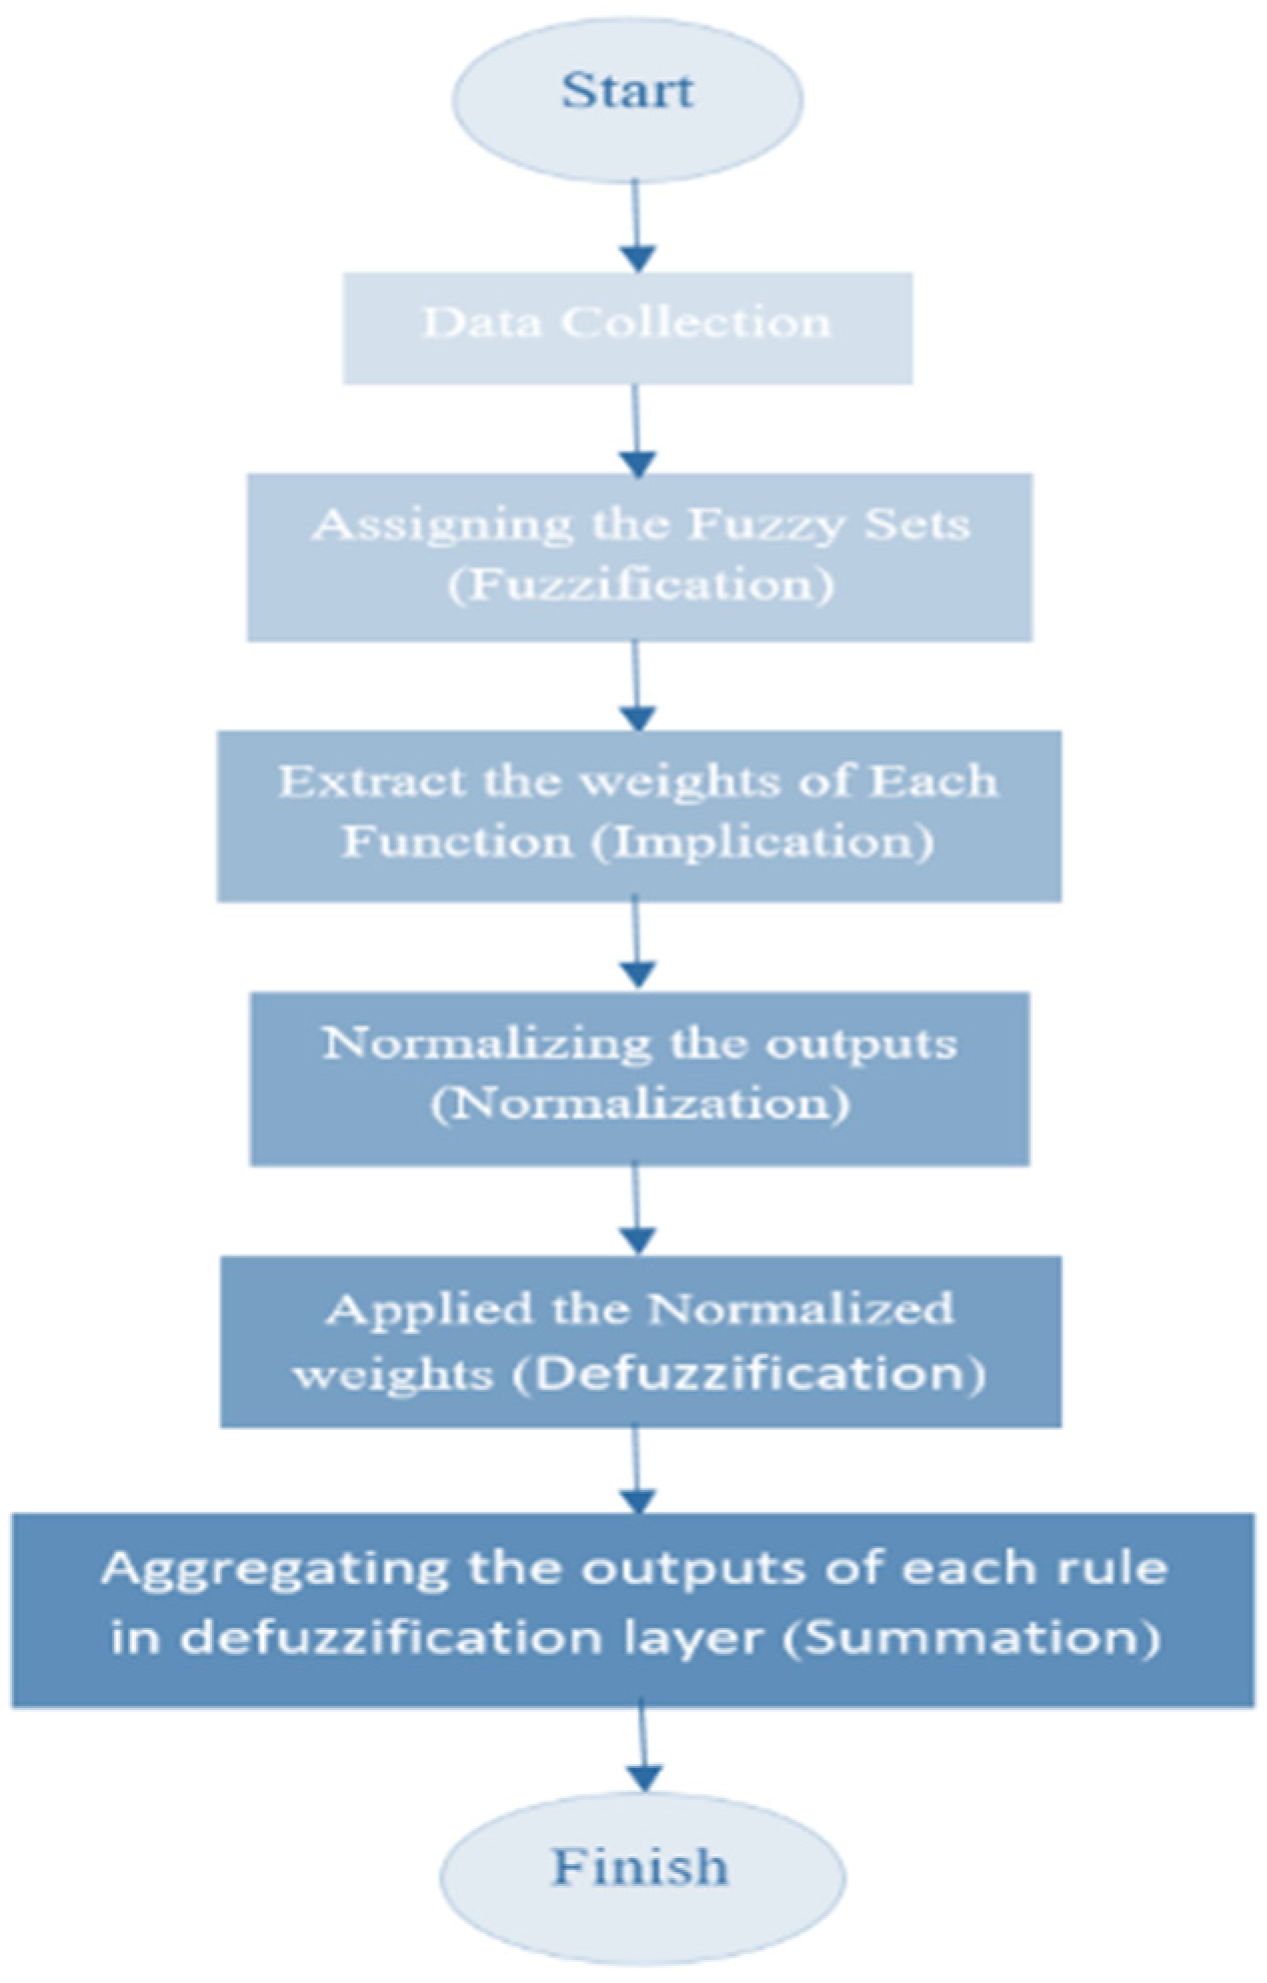
An artificial neural network (ANN) is a mathematical or computational model that simulates the biology of the human brain. ANN predicts the unmeasured values of the target parameters using the correlation between the measured parameters and the target parameters. The structure of a general ANN consists of an input layer, a hidden layer, and an output layer. Each layer has corresponding units (neurons or nodes) and weight connections. The connections could be feed-forward or feed-backwards. Each unit would receive its total weighted inputs and would transmit the result through a nonlinear activation function (transfer function). The activation function would operate on the total weight of the layer inputs. One of the most widely used transfer functions is the sigmoid (logistic) function. Finally, the transfer function would operate based on the weight of the layer inputs, as given in Equation (3) [21].
Y = f   ( i w i x i + b )
where xi is the ith input data, wi is the weight of the ith value, and b is the bias of this neuron. The outputs are fed through the network to optimize the weight between the layers. The optimization is achieved by minimizing the errors in the training or learning phase. The training step is consisted of learning the mathematical relationship between the input variables and the corresponding outputs. In order to reduce the discrepancy between the predicted and the observed values, the ANN would change the weighted bonds. This process is repeated many times in the training cycles until achieving a certain level of accuracy. A multi-layer perceptron network is illustrated in Figure 2 [31,34].
MATLAB 13b, an artificial intelligence software, was used in the ANN studies. A sigmoid transfer (TANSIG) function with the Levenberg Marquardt training algorithm was used for adjusting the ANN network. To develop the ANN architecture, 80 trials of wastewater treatment containing CEX by EC were used and assigned to the following subgroups randomly: 70% training (56 trials), 15% validation (12 trials) and 15% experiments (12 trials). The number of input neurons was defined by input variables, including initial CEX concentration, initial pH, electrolysis time, and electrode type. The output variable was the removal efficiency obtained after treatment of the aqueous solution by EC. The number of hidden layers and the number of neurons in these layers were determined by trial and error. Various nodes were used to define the optimum number of hidden nodes (i.e., 5–20). The accuracy of the developed models was evaluated using statistical parameters, which are presented in Table 2.

2.4.3. ANFIS

The adaptive neuro-fuzzy inference system technique is a data learning technique that uses fuzzy logic, which could transform given inputs into the desired output. The flowchart of the ANFIS model is depicted in Figure 3, which consists of five major steps. MATLAB 13b software is utilized in this research to monitor and predict the electrocoagulation process for CEX removal. Firstly, functions are applied to obtain fuzzy clusters from input values. Secondly, by multiplying the membership values, the weights are calculated. Thirdly, the normalized value is evaluated for each rule. In the following stage, the rules’ weighted values are calculated in each node of the layer. Finally, by the aggregation of non-fuzzy data, which was obtained in the previous step, the ANFIS outputs are obtained.

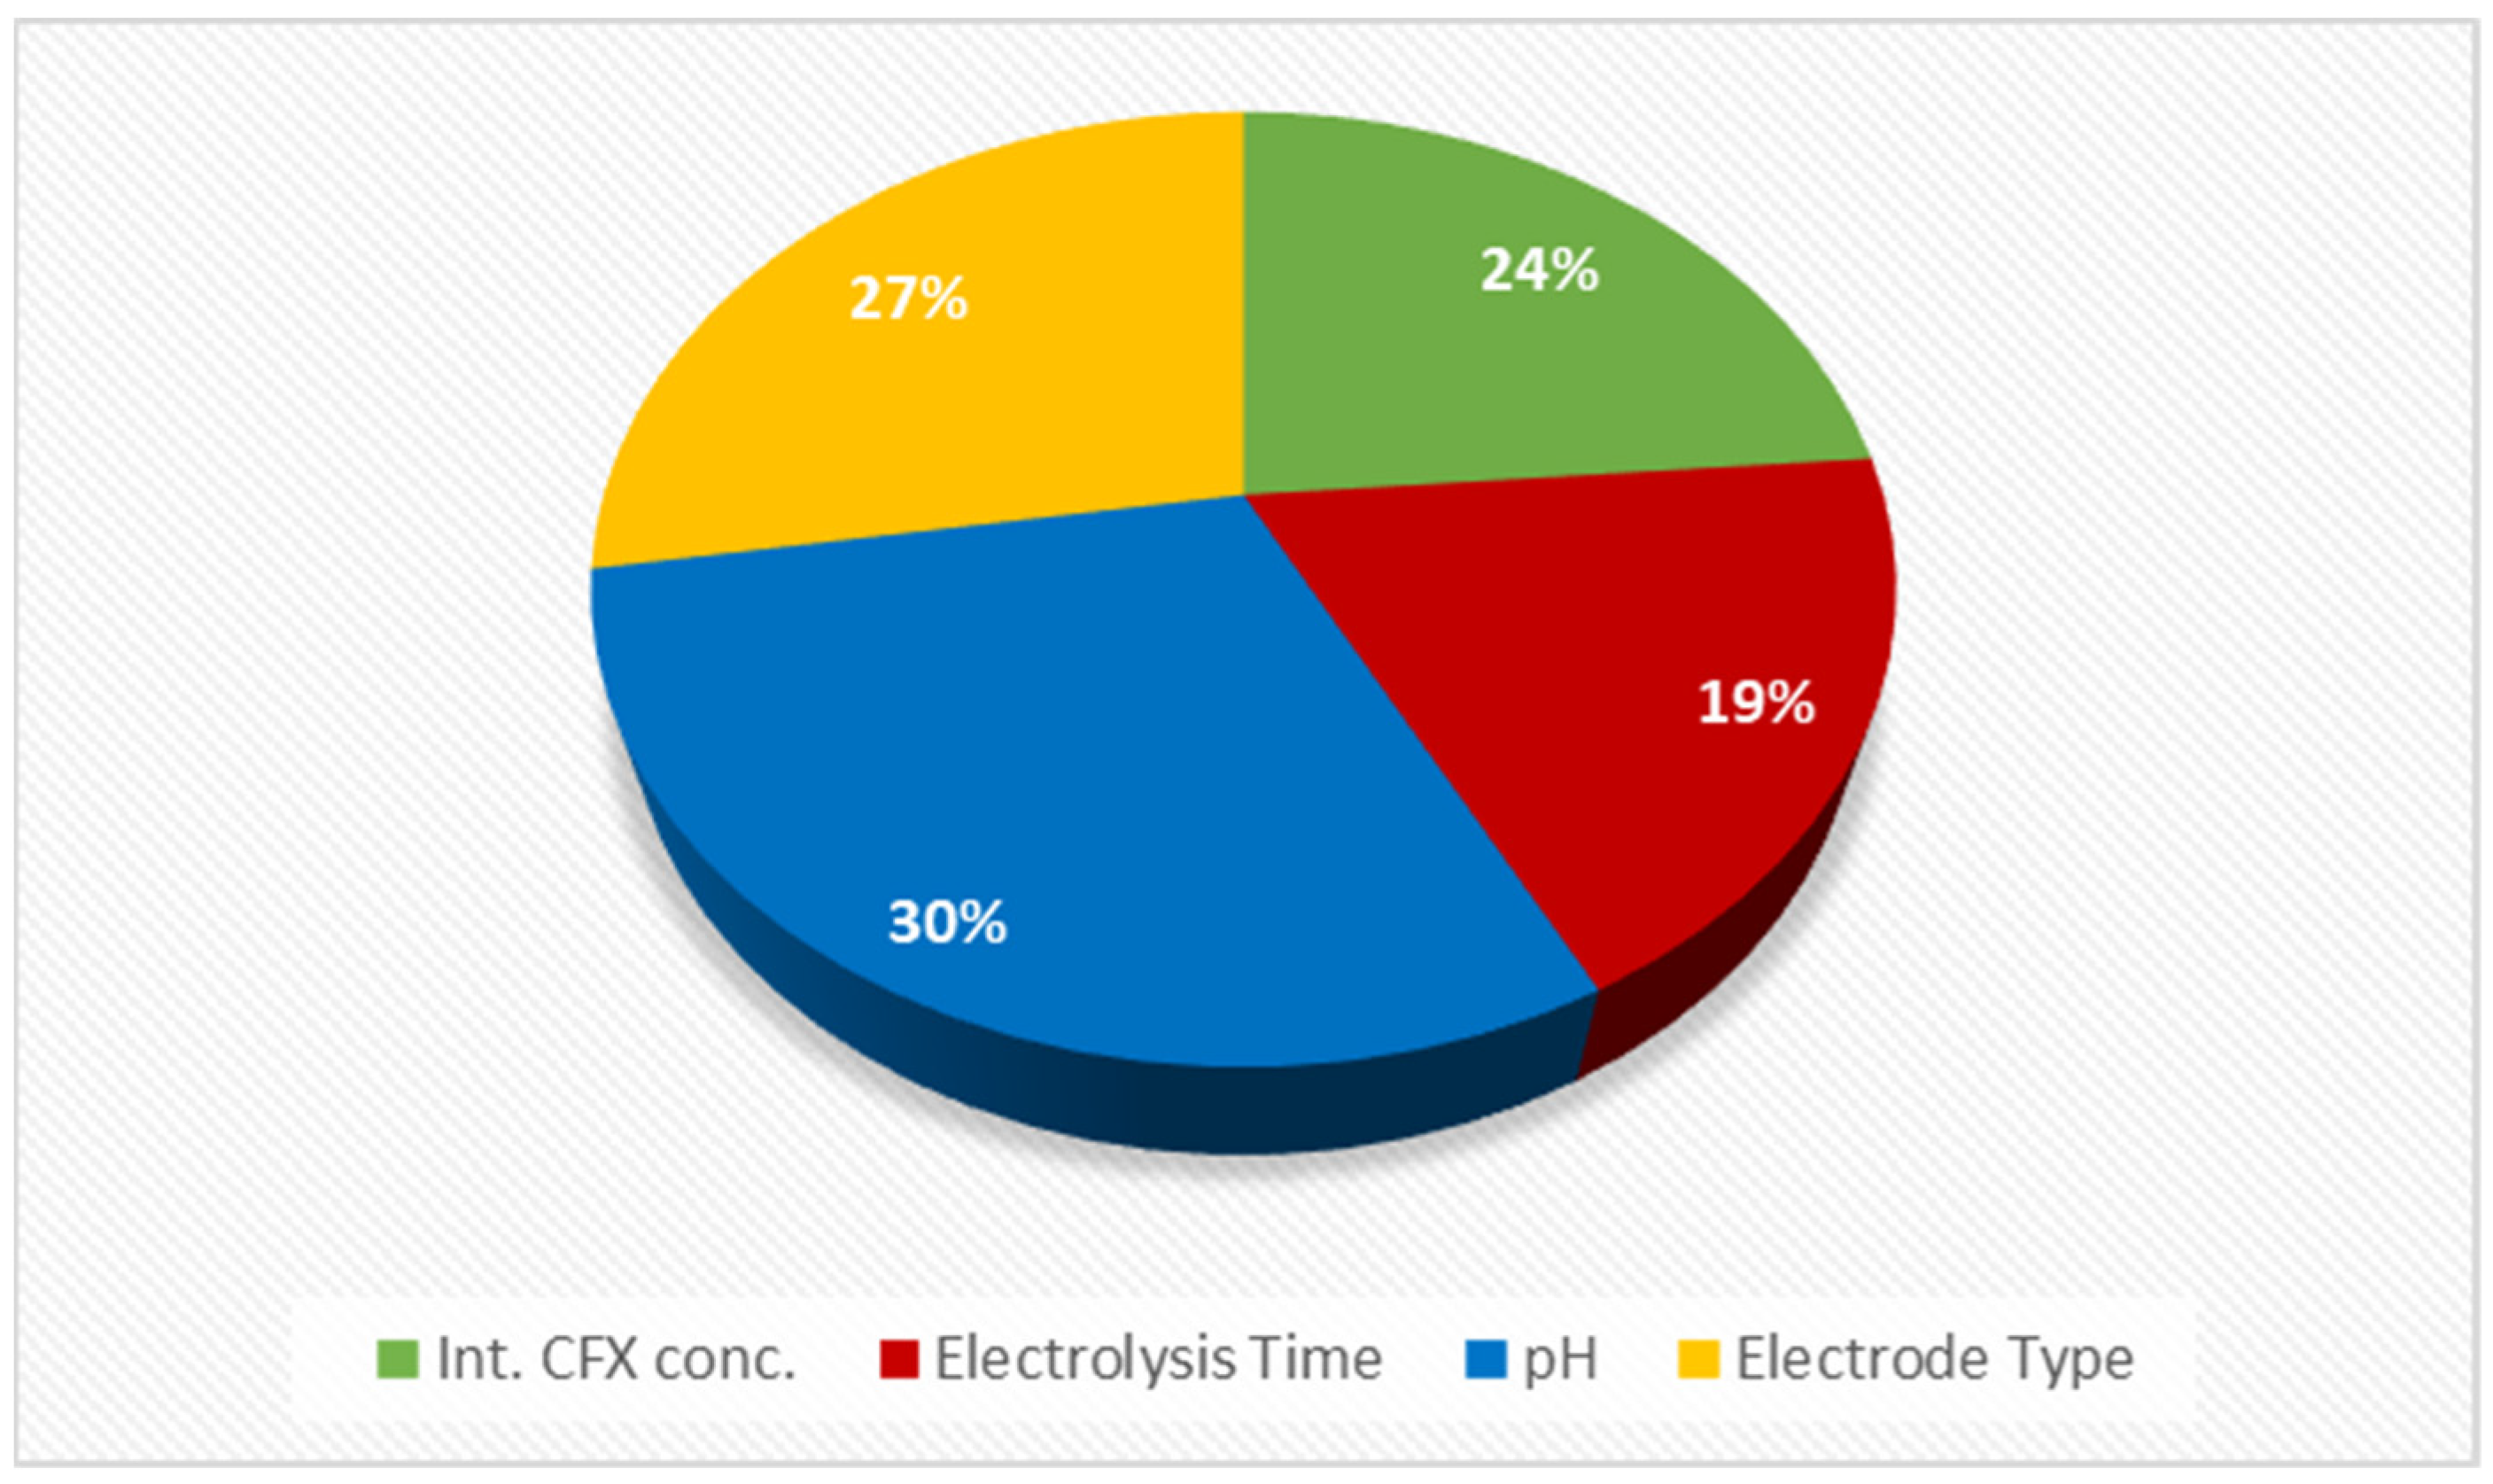
2.4.4. Sensitivity Analysis

The Garson method was applied for the sensitivity analysis of ANN modeling according to the following equation (Equation (4)) [35] to estimate the comparative significance of the influential parameter on the CEX removal process.
I j = m = 1 M { ( | W jm h | / n = 1 N h | W nm h | ) × | W m O | } k = 1 N [ m = 1 M { ( | W km h | / n = 1 N i | W nm h | ) × | W m O | } ]  
where Ij is the value of the jth variables, Nh and Ni are the figure of neurons in the input and hidden layer, respectively, and W’s are the link weights, k, m, and n represent input, hidden, and output neurons, correspondingly.
The main steps for determining the relative importance of input variables are as follows:
  • Formation of a matrix containing the input-hidden and hidden-output neurons’ weight.
  • Calculation of the effect of input neurons on the network output through each of the hidden neurons (AH1I1). Therefore, at first, it is necessary to determine the hidden-input layers’ weight (WH1I1) and the output-hidden layers’ weight (WO1H1) (Equation (5)).
    A H 1 I 1 = W H 1 I 1 × W O 1 H 1
  • Calculation of the relative effect of each input neurons on the output signal for latent neurons (RH1I1) and determination of the total R for the input neurons (SI1)
    R H 1 I 1 = | A H 1 I 1 | / (   | A H 1 I 1 | + | A H 1 I 2 | )
    S I 1 = R H 1 I 1 + R H 2 I 1 + R H 3 I 1
  • Calculation of the relative importance of each input variables (II1)
    I I 1 = S I 1 / ( S I 1 + S I 2 ) × 100

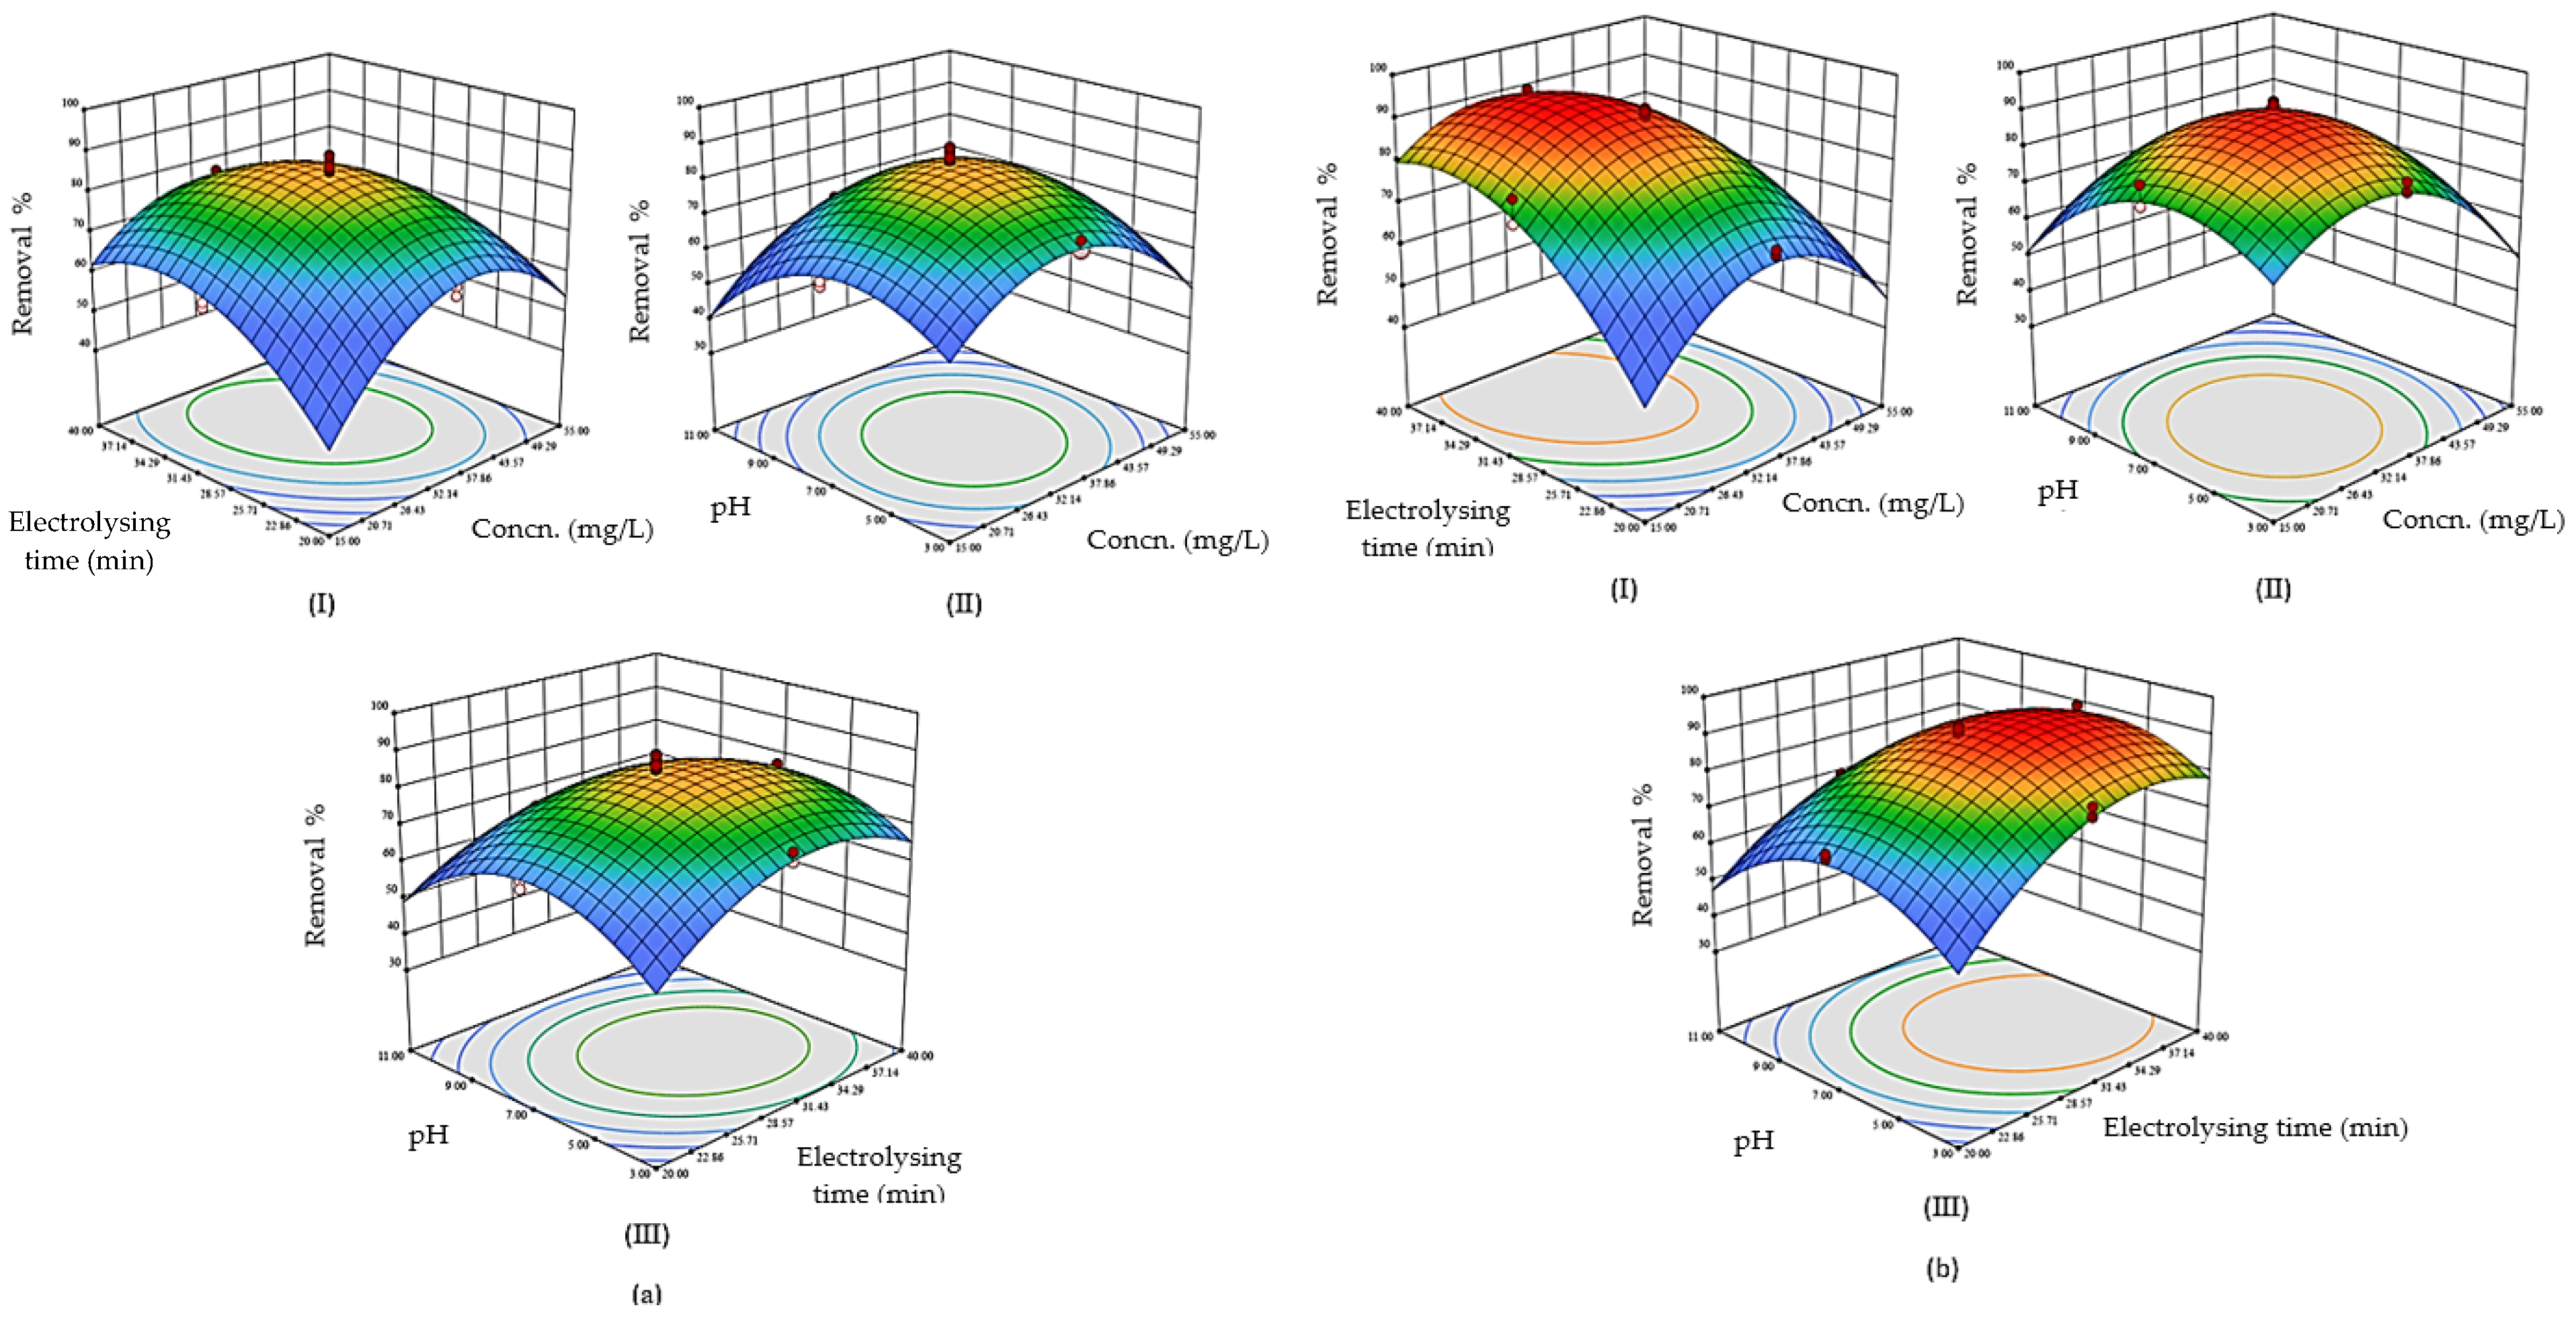
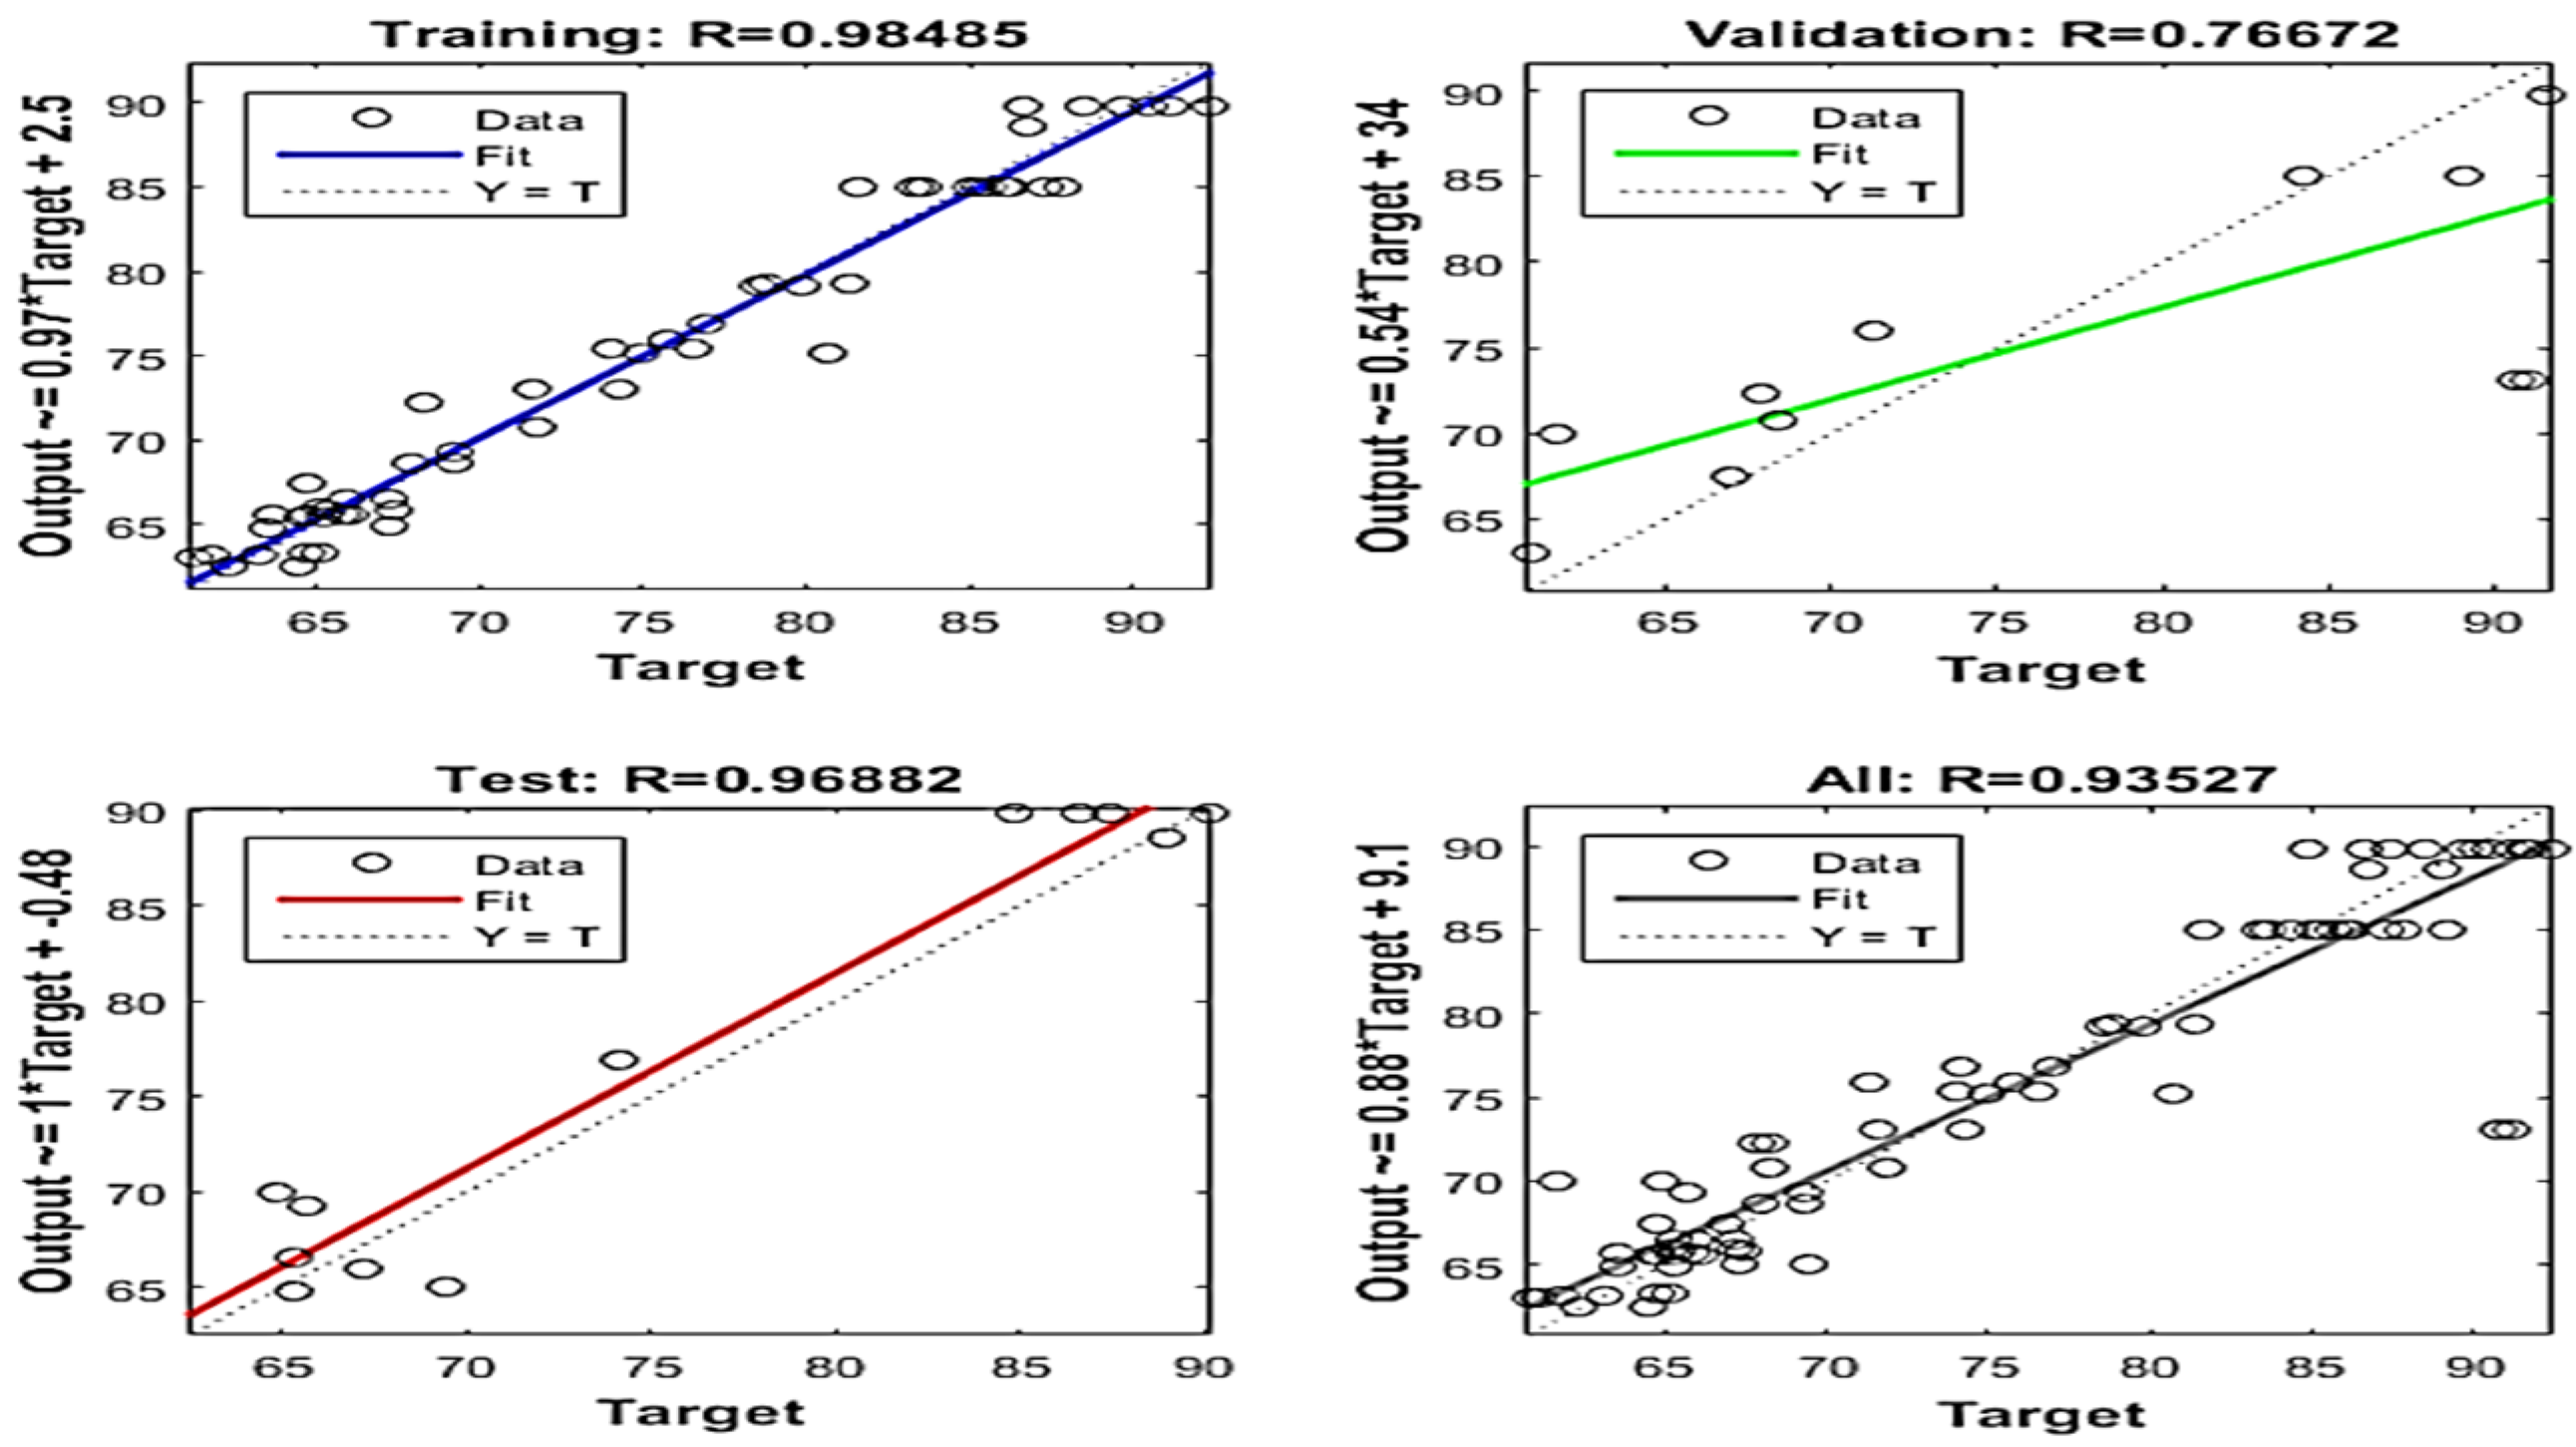
3. Results and Discussion

The experimental results were analyzed using Design Expert 12 software. The approximate function of CEX removal percentage by the electrocoagulation process in both cases using non-insulated and insulated electrodes are presented in Equations (9) and (10). To simplify the form of the equations below, init. CEX conc., electrolysis time and pH were coded as Z1, Z2 and Z3, respectively.
R %   ( Non insulated   Electrodes ) = 195.085 + 4.239 × Z 1 + 10.149 × Z 2 + 14.633 × Z 3 0.033 × Z 1 × Z 2 + 0.036   Z 1 × Z 3 0.076 × Z 2 × Z 3 0.049 0.134 × Z 2 2 1.056 × Z 3 2
R %   ( Insulated   Electrodes ) = 197.523 + 3.932 × Z 1 + 10.773 × Z 2 + 14.633 × Z 3 0.033 × Z 1 × Z 2 + 0.036 × Z 1 × Z 3 0.076 × Z 2 × Z 3 0.049 × Z 1 2 0.134 × Z 2 2 1.056 × Z 3 2
The ANOVA results obtained from the quadratic model are presented in Table 3. The model F-value of 147.27 indicates the significance of the model. Additionally, a “Prob > F” value of less than 0.05 implies the model terms are significant. In this case, A, B, C, D, AB, AC, AD, BC, and BD are the significant model terms. The “Lack of Fit F-value” of 1.69 indicates that the lack of fit is not significant relative to the pure error. The regression factors (adjusted R2 and R2) are 0.9635 and 0.9569, respectively, and the predicted R2 is in good affiliation with the adjusted R2 since the divergence is less than 0.2.
The removal efficiency of the experimental and predicted trials by the RSM model indicated that the removal efficiency for 80 experiments is well predicted, which agrees with the experimental removal efficiencies. The maximum predicted error in the removal efficiency was 2%, indicating the model’s acceptability in predicting the CEX removal efficiency. To investigate the effect of each on the obtained response with the model, the graphs were obtained based on the polynomial function of the model. Figure 4 proves the direct relationship between the CEX removal efficiency as a function of initial CEX concentration, electrolysis time, initial pH and electrode type. This figure shows the three-dimensional interactions of the parameters for two states of (a) uninsulated electrodes and (b) insulated electrodes. The electrolysis time factor is the most effective in both cases because it has changed with a steeper slope. The intensity of pH changes is higher than the initial concentration, which means that the pH is more effective than the initial concentration.
The interaction of initial CEX concentration and electrolysis time is shown in Figure 4(aI,bI), and as can be seen, the electrolysis time has a greater effect on the CEX removal process than the initial CEX concentration. The removal rate increases by increasing the electrolysis time at each of the initial CEX concentrations. However, the removal efficiency peaked by increasing the initial CEX concentration from 15 to 35 mg/L and the electrolysis time by 30 min.
As presented in Figure 4, the removal efficiency is higher using an insulated electrode. In this regard, Elazzouzi et al. (2018) have conducted a study on municipal wastewater treatment and have attributed the increment to the fact that insulated electrodes help to regulate the iso-potential, which leads to a more uniform distribution of current density. It also has shown that insulating the edges of the electrodes would increase the number of Al3+ ion particles and thus would trap a large amount of contaminants in the growing flocks [35]. Figure 4(aII,bII) illustrates the effect of initial CEX concentration and initial pH. The highest removal efficiency occurred at initial CEX concentrations of about 35 mg/L and natural pH (about 7). However, the CEX removal rate was decreased by increasing the initial CEX concentration to 55 mg/L and pH above 7. Although this phenomenon is also observed at lower concentrations (15 mg/L) and lower pH than 7, higher removal efficiency is observed compared to alkaline conditions. The electrolysis time and pH interaction are presented in Figure 4(aIII,bIII). Based on the results, the electrolysis time had a greater effect on CEX removal than pH. As shown in Figure 4, the highest amount of CEX removal occurs at the electrolysis time of about 31 min, and the pH is in the natural range. The variation in the CEX removal is more considerable at the acidic pH than the alkaline. In addition, the CEX removal rate is increased with the increase of electrolysis time in both acidic and alkaline pH. Additionally, Figure 4 shows the CEX removal is peaked at an electrolysis time of about 30 min. Moreover, the removal rate is increased slightly with the increasing electrolysis time at low and high pH ranges, and it does not change significantly after reaching a certain removal rate.
Regarding the effect of the electrode type and initial CEX concentration on the removal rate, it was noticed that the highest removal rate is observed for the two types of electrodes at a concentration of about 35 mg/L. However, the removal efficiency is higher when using insulated electrodes. In both types of electrodes, by increasing the concentration, the removal efficiency is increased and then decreased with a further increment of the initial concentration. The obtained results proved the effect of electrode type and electrolysis time on the response, where an increase in the removal efficiency is observed by increasing the electrolysis time from 20 to about 30 min for both electrodes. However, for more than 30 min, the removal increment is insignificant, and this removal rate is higher in the insulated electrode than in the non-insulated electrode. Additionally, it was noticed that the removal rate increases slightly by increasing the pH to the natural range using both types of electrodes, but increasing the pH to 11 would reduce the removal, and the removal efficiency is higher by means of the insulated electrode. This could be attributed to the formation of more hydroxyl radicals from the surface of the insulated electrode preventing electrons from escaping from the sharp sides of the electrodes.
Model equations were solved, maximizing CEX removal while the effective factors were considered in their range. Predicted optimization was obtained at the initial CEX concentration of 30.16 mg/L, electrolysis time of 34.62 min, and pH of 6.14 using insulated electrodes with 93.87% CEX removal efficiency, and the removal efficiency of 88.21% was obtained by conducting an experiment under this situation. In addition, using non-insulated electrodes, the proposed optimal conditions were the initial CEX concentration of 34.26 mg/L, electrolysis time of 31.75 min and pH of 6.43, which led to a predicted and experimental CEX removal efficiency of 85.26% and 73.81%, respectively.
The experimental data presented in Table 2 include four factors: initial CEX concentration, electrolysis time, initial pH and electrode type as input data and removal efficiency of experiments were used as output in ANN modeling using MATLAB-13 software, and a one and two-layer feed-forward model was developed. Input and target datasets are randomly divided into three subsets: training (70%), validation (15%) and test (15%). In this network, the Levenberg-Marquartd (Trainlm) algorithm was used for training the neural network due to its applicability for small and medium-size networks [36]. In order to avoid overfitting and to ensure good generalization in the model, the validation set is used to access the network convergence. The test set is used as a proxy for hidden data and, finally, the prediction results on the test set were presented. The hyperbolic tangent (TANSIG) function transferred data from the input to the hidden layer. For data training, the linear activation functions (Purelin) is employed for input and output layers, and the rectified linear unit (ReLU) is used for hidden layers as the activation functions. The optimum number of neurons in the hidden layer was estimated by trial and error with 5–20 neurons, and the statistical coefficients were determined based on the presented relationships in Table 2 (see Table 4).
Finally, the results showed that to predict the removal rate based on the maximum coefficient R2 and the minimum MSE using 11 neurons with one hidden layer, utilizing 13 neurons with two hidden layers proved to have the best performance. Comparing these two optimal conditions shows that these coefficients do not have a considerable discrepancy, but using one hidden layer is recommended because of the more desirable R2 and MSE values. Eleven neurons in the hidden layer were selected for the final model to limit the model capacity for better generalization capabilities.
It was noticed that the performance gradient (for the training process) was 0.017522. The gradient will be very small as the training performance reaches the minimum value (the training will terminate if the gradient is less than 1 × 10⁻⁷). The number of validation checks, which indicates the number of successful iterations that the validation performance could not reduce, was 100. The training will stop if the number of validation checks reaches 100.
The results showed that the best validation performance was 65.1332 at Epoch 157. After Epoch 157, the MSE of training gradually decreased with increasing iteration numbers. In addition, after Epoch 157, the error on the validation set usually starts to rise, which indicates that the network starts to over-fit the data. The test curve has increased slightly with the rising validation curve, indicating that the validation and test curves are very similar.
To optimize the network performance, the adjustable network parameters, such as weights and biases, were set out, which are presented in Table 5.
Figure 5 demonstrates the correlation between network outputs and network targets. The dashed line shows the perfect result, for example, outputs = targets, while the solid line represents the best fit linear regression. The training plot proves good fitness as the R-value is higher than 0.98. The validation and test plots show that the R-values are 0.76 and 0.96, respectively, indicating that some data points have poor fits.
A Sugeno structure was built with a fuzzy toolbox in MATLAB 13b to create the ANFIS model. It consists of five layers, including fuzzification, implication, normalization, aggregation, and defuzzification layers. At the final stage, the estimated value is presented.
It was noticed that the electrolysis time had the most effect on the removal response in both situations of electrode types with high slope variations.
The Garson method was used to evaluate the significance of operating parameters on the electrocoagulation process in the CEX removal. Therefore, their comparative values were estimated by this method. According to the results presented in Figure 6, the effect of individual parameters is as follows: pH > initial concentration > electrolysis time > electrode type. Different types of oxidants with different oxidizing powers might be produced at a specific pH, which means that the pH factor is more important than other variables.
Additionally, as reported in Figure 7, the ANFIS model was able to estimate the CEX removal with a 0.99 regression coefficient, which is an acceptable accuracy. As shown in Figure 7A,B,C the experimental observations and predictions by ANFIS, RSM, and ANN are compatible. The evaluation of models is completed with respect to the correlation coefficients (R2), the mean square error (MSE), and root mean squares error (RMSE). Although in the range of 80 data points, three models provided reliable estimates for CEX antibiotic removal, the ANFIS model had a more accurate prediction than the RSM and ANN with a better R2 value, which shows the precision of the model in CEX removal estimation.
The sensitivity analysis of individual parameters and their interaction effects were evaluated based on the Pareto analysis, Garson method, and dual interaction for RSM, ANN and ANFIS, respectively. The relative importance of the individual parameters obtained by ANN is comparable to that of RSM and ANFIS. Moreover, the order of importance for the individual parameters for the RSM model is electrolysis time > electrode type > pH > initial concentration, for the ANN model is pH > initial concentration > electrolysis time > electrode type, and for ANFIS model is electrolysis time > initial concentration > and pH.
Some investigations have utilized the ML algorithms for the projection of the removal percentage in the electrocoagulation process. Taheri et al. (2015) have evaluated the performance of GA and ANN in modeling the acid azo dye removal through the electrocoagulation process [37]. The outcomes of the mentioned study have illustrated that these models were able to present a reliable estimation with high levels of credibility, which is in agreement with the results of this research. Nasr et al. (2015) have investigated the validity of the ANFIS model in the projection of efficiency of electrocoagulation in greywater treatment [38]. The outputs of applying the above algorithm in their prediction model have expressed that there was a correlation coefficient between the experimental and predicted values, which is compatible with the outcomes of the present study. Maleki et al. (2014) have estimated the performances of ANN in modeling the removal of color [39]. The results of that research have demonstrated that ANN has provided a precise model in anticipating color removal. This is in alignment with the outcomes of this research.

4. Conclusions

In this study, experiments were performed to simulate (using RSM, ANN and ANFIS) the electrocoagulation process for removing the CEX antibiotic from synthetic wastewater using aluminum electrodes.
The outcomes of this study demonstrated that the RSM model is excellent in explaining the interaction of the parameters. Additionally, it was noticed that the three models, RSM, ANN and ANFIS, were able to predict the experimental results well; however, the ANFIS model showed the best performance with R2 of 0.9921. Generally, the main conclusions of this study could be summarized as follows:
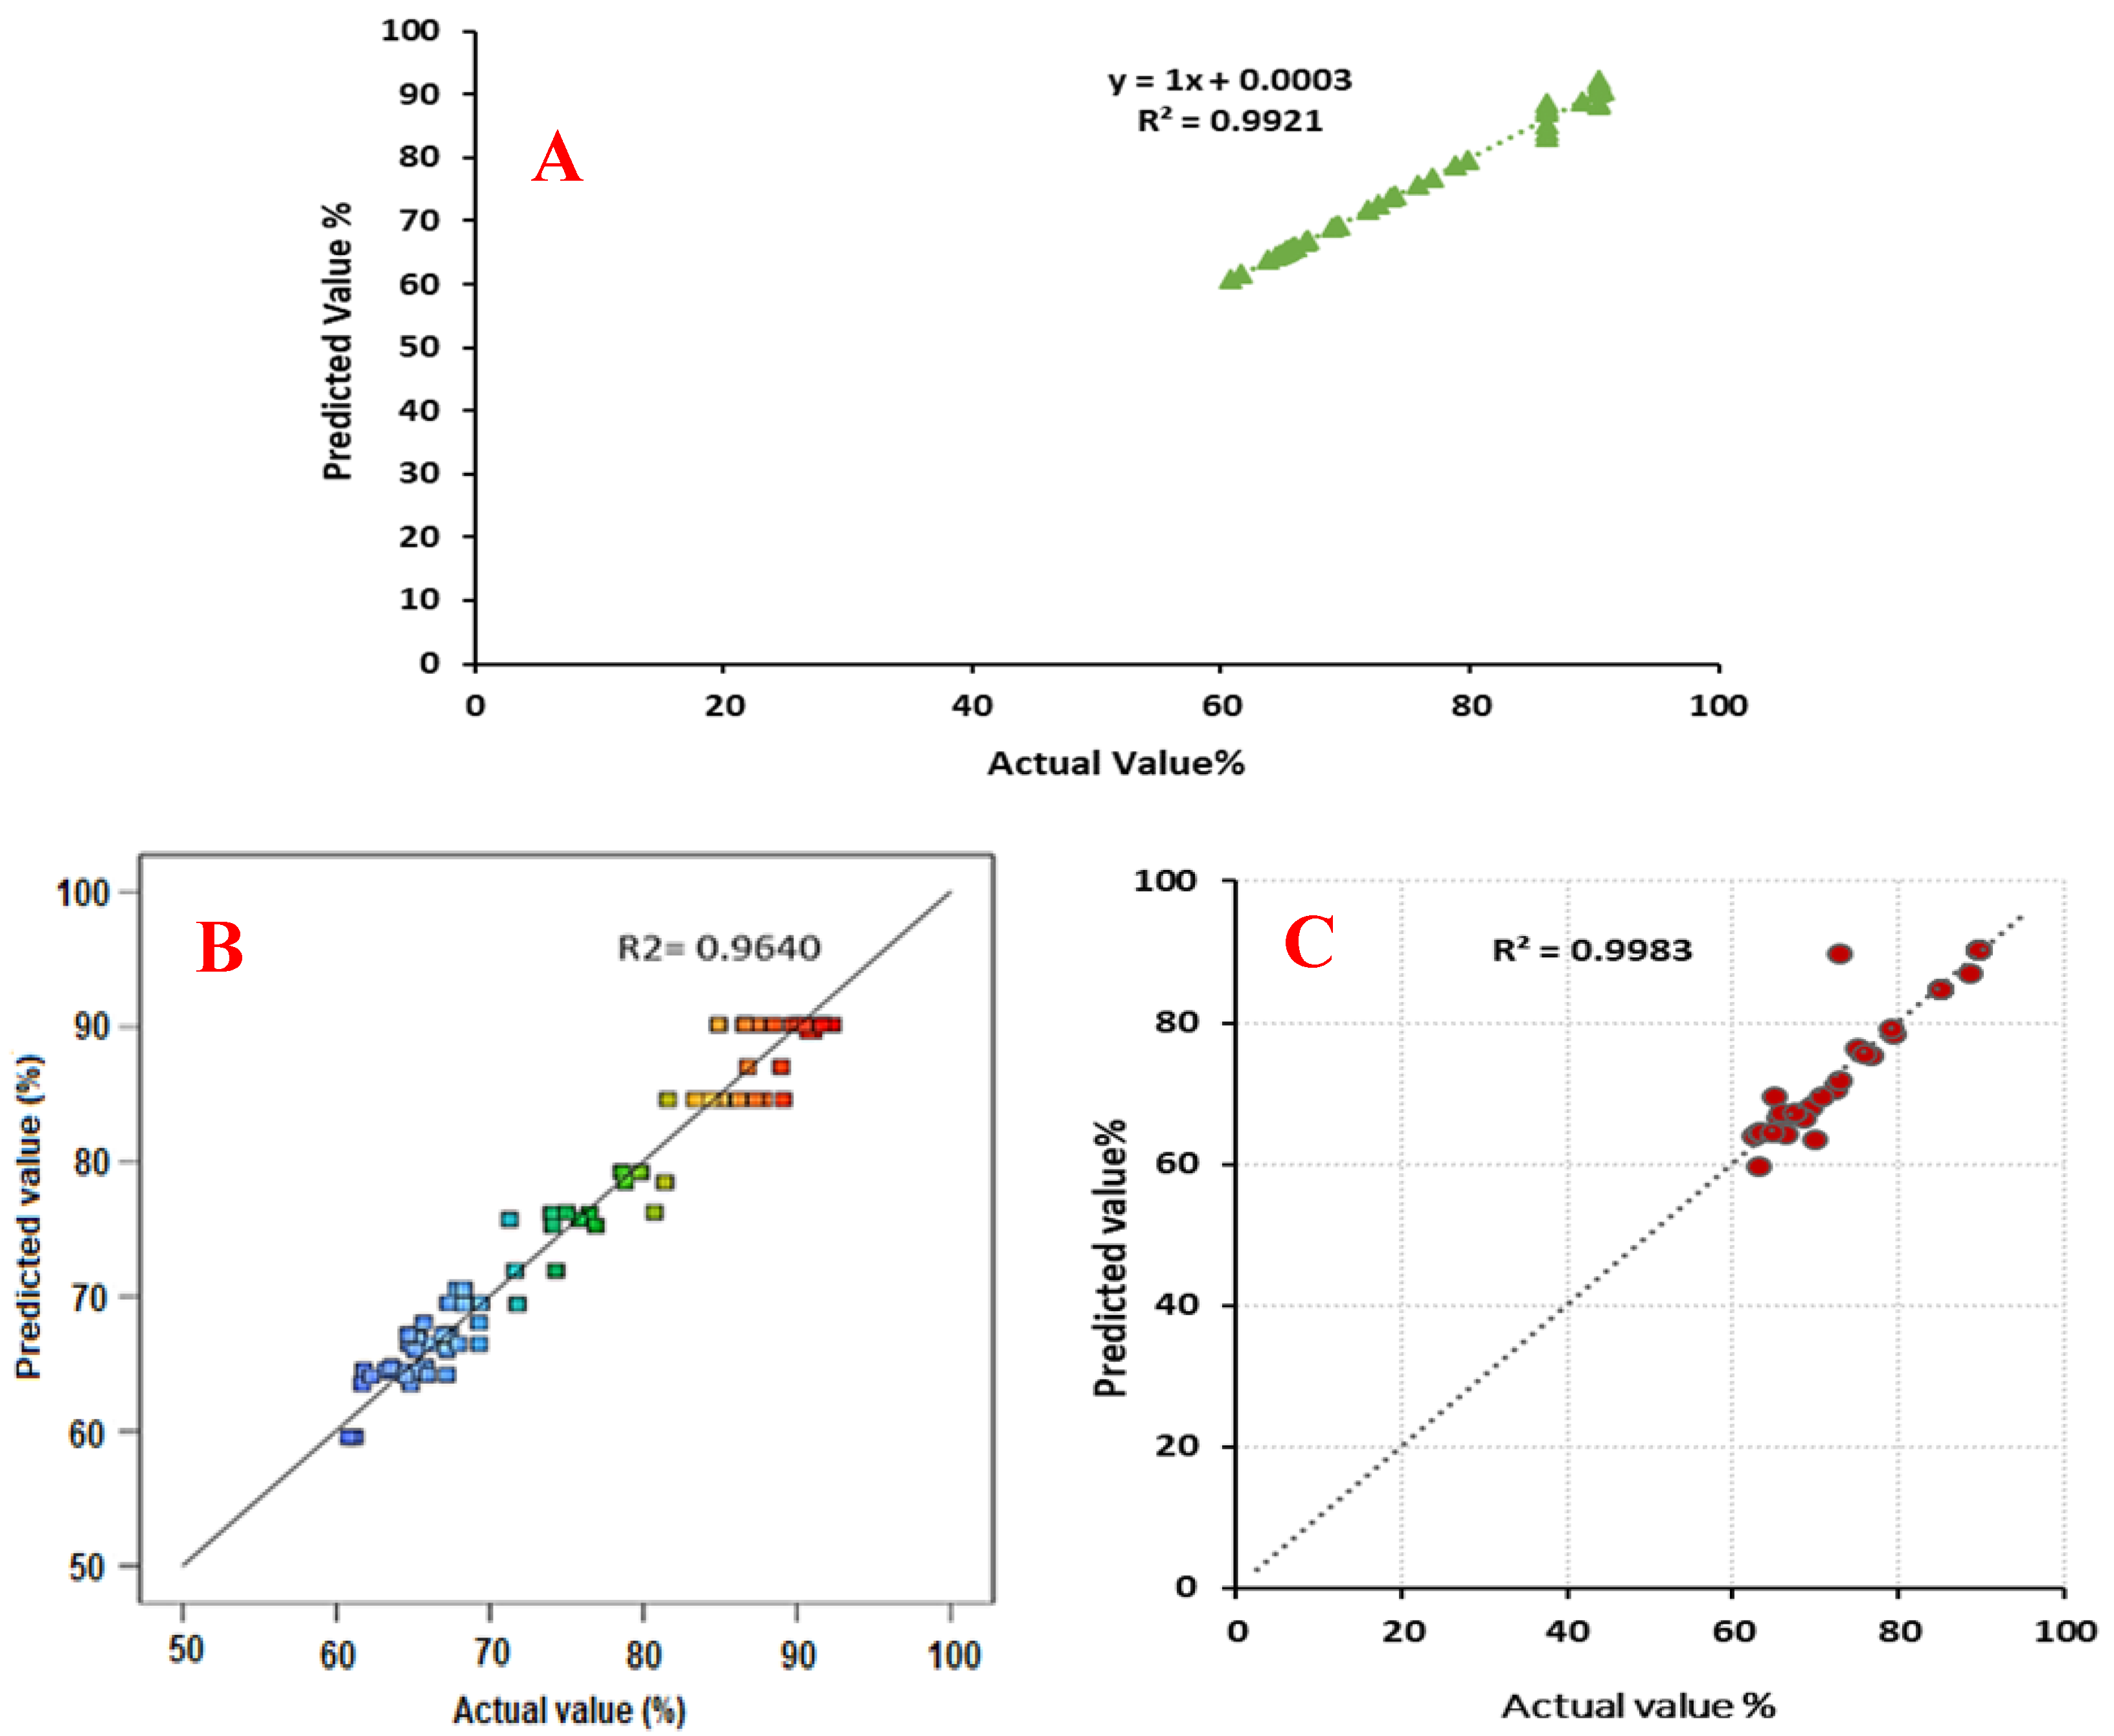
  • The CCD-RSM, ANN, and ANFIS algorithms have an acceptable accuracy in simulating the removal of CEX.
  • The ANFIS model has the best performance in predicting the removal of CEX by the electrocoagulation method.
  • According to the CCD-RSM and ANOVA results, the electrolysis time is the most important parameter in removing CEX.
  • The best removal of CEX was 93.87% achieved at a CEX concentration of 30.16 mg/L, electrolysis time of 34.62 min, pH of 6.14 and application of insulated electrodes.
For future studies, the authors recommend conducting kinetic studies for the removal of CEX by the electrocoagulation method. Additionally, the mechanism and pathway of CEX by the electrocoagulation method should be studied.

Author Contributions

Methodology, M.A. and M.G.F.; software, M.A. and M.G.F.; validation, M.A. and M.G.F.; formal analysis, M.A. and M.G.F.; investigation, M.A. and M.G.F.; writing—original draft preparation, K.H., M.A. and M.G.F.; writing—review and editing, K.H.; funding acquisition, K.H. All authors have read and agreed to the published version of the manuscript.

Funding

This research received no external funding.

Conflicts of Interest

The authors declare no conflict of interest.

References

  1. Lieberman, J.M. Appropriate antibiotic use and why it is important: The challenges of bacterial resistance. Pediatric Infect. Dis. J. 2003, 22, 1143–1151. [Google Scholar] [CrossRef] [PubMed]
  2. Vieno, N.M.; Tuhkanen, T.; Kronberg, L. Analysis of neutral and basic pharmaceuticals in sewage treatment plants and in recipient rivers using solid phase extraction and liquid chromatography–tandem mass spectrometry detection. J. Chromatogr. A 2006, 1134, 101–111. [Google Scholar] [CrossRef] [PubMed]
  3. Ahmed, M.J.; Theydan, S.K. Adsorption of cephalexin onto activated carbons from Albizia lebbeck seed pods by microwave-induced KOH and K2CO3 activations. Chem. Eng. J. 2012, 211, 200–207. [Google Scholar] [CrossRef]
  4. Nazari, G.; Abolghasemi, H.; Esmaieli, M. Batch adsorption of cephalexin antibiotic from aqueous solution by walnut shell-based activated carbon. J. Taiwan Inst. Chem. Eng. 2016, 58, 357–365. [Google Scholar] [CrossRef]
  5. Rodayan, A.; Segura, P.A.; Yargeau, V. Ozonation of wastewater: Removal and transformation products of drugs of abuse. Sci. Total Environ. 2014, 487, 763–770. [Google Scholar] [CrossRef] [PubMed] [Green Version]
  6. Ziylan, A.; Ince, N.H. The occurrence and fate of anti-inflammatory and analgesic pharmaceuticals in sewage and fresh water: Treatability by conventional and non-conventional processes. J. Hazard. Mater. 2011, 187, 24–36. [Google Scholar] [CrossRef]
  7. Gabet-Giraud, V.; Miege, C.; Choubert, J.; Ruel, S.M.; Coquery, M. Occurrence and removal of estrogens and beta blockers by various processes in wastewater treatment plants. Sci. Total Environ. 2010, 408, 4257–4269. [Google Scholar] [CrossRef]
  8. Ali, I.; Alharbi, O.M.; Alothman, Z.A.; Badjah, A.Y. Kinetics, thermodynamics, and modeling of amido black dye photodegradation in water using Co/TiO2 nanoparticles. Photochem. Photobiol. 2018, 94, 935–941. [Google Scholar] [CrossRef]
  9. Basheer, A.A. Advances in the smart materials applications in the aerospace industries. Aircr. Eng. Aerosp. Technol. 2020, 92, 1027–1035. [Google Scholar] [CrossRef]
  10. Leili, M.; Fazlzadeh, M.; Bhatnagar, A. Green synthesis of nano-zero-valent iron from Nettle and Thyme leaf extracts and their application for the removal of cephalexin antibiotic from aqueous solutions. Environ. Technol. 2018, 39, 1158–1172. [Google Scholar] [CrossRef]
  11. Shirani, Z.; Song, H.; Bhatnagar, A. Efficient removal of diclofenac and cephalexin from aqueous solution using Anthriscus sylvestris-derived activated biochar. Sci. Total Environ. 2020, 745, 140789. [Google Scholar] [CrossRef] [PubMed]
  12. Alwash, R.S.M. Treatment of Highly Polluted Water with Phosphate using BAPPP-Nanoparticles. Master’s Thesis, University of Technology, Baghdad, Iraq, 2017. [Google Scholar]
  13. Abdulhadi, B.A.; Kot, P.; Hashim, K.S.; Shaw, A.; Khaddar, R.A. Influence of current density and electrodes spacing on reactive red 120 dye removal from dyed water using electrocoagulation/electroflotation (EC/EF) process. In Proceedings of the First International Conference on Civil and Environmental Engineering Technologies (ICCEET), Najaf, Iraq, 23–24 April 2019; pp. 12–22. [Google Scholar]
  14. Abdulhadi, B.; Kot, P.; Hashim, K.; Shaw, A.; Muradov, M.; Al-Khaddar, R. Continuous-flow electrocoagulation (EC) process for iron removal from water: Experimental, statistical and economic study. Sci. Total Environ. 2021, 760, 143417. [Google Scholar] [CrossRef] [PubMed]
  15. Hashim, K.S.; Shaw, A.; AlKhaddar, R.; Kot, P.; Al-Shamma’a, A. Water purification from metal ions in the presence of organic matter using electromagnetic radiation-assisted treatment. J. Clean. Prod. 2021, 280, 124427. [Google Scholar] [CrossRef]
  16. Coimbra, E.C.L.; Mounteer, A.H.; do Carmo, A.L.V.; Michielsen, M.J.F.; Tótola, L.A.; Guerino, J.P.F.; Gonçalves, J.G.A.N.; da Silva, P.R. Electrocoagulation of kraft pulp bleaching filtrates to improve biotreatability. Process Saf. Environ. Prot. 2021, 147, 346–355. [Google Scholar] [CrossRef]
  17. Wagle, D.; Lin, C.-J.; Nawaz, T.; Shipley, H.J. Evaluation and optimization of electrocoagulation for treating Kraft paper mill wastewater. J. Environ. Chem. Eng. 2020, 8, 103595. [Google Scholar] [CrossRef]
  18. Gondudey, S.; Kumar, C.P.; Dharmadhikari, S.; Singh, T.R. Treatment of sugar industry effluent using electrocoagulation process: Process optimization using response surface methodology. J. Serb. Chem. Soc. 2020, 85, 1357–1369. [Google Scholar] [CrossRef]
  19. Gönder, Z.B.; Balcıoğlu, G.; Vergili, I.; Kaya, Y. An integrated electrocoagulation–nanofiltration process for carwash wastewater reuse. Chemosphere 2020, 253, 126713. [Google Scholar] [CrossRef]
  20. Morales-Rivera, J.; Sulbarán-Rangel, B.; Gurubel-Tun, K.J.; del Real-Olvera, J.; Zúñiga-Grajeda, V. Modeling and Optimization of COD Removal from Cold Meat Industry Wastewater by Electrocoagulation Using Computational Techniques. Processes 2020, 8, 1139. [Google Scholar] [CrossRef]
  21. Sharifi, S.; Nabizadeh, R.; Akbarpour, B.; Azari, A.; Ghaffari, H.R.; Nazmara, S.; Mahmoudi, B.; Shiri, L.; Yousefi, M. Modeling and optimizing parameters affecting hexavalent chromium adsorption from aqueous solutions using Ti-XAD7 nanocomposite: RSM-CCD approach, kinetic, and isotherm studies. J. Environ. Health Sci. Eng. 2019, 17, 873–888. [Google Scholar] [CrossRef]
  22. Xu, L.; Xu, X.; Cao, G.; Liu, S.; Duan, Z.; Song, S.; Song, M.; Zhang, M. Optimization and assessment of Fe–electrocoagulation for the removal of potentially toxic metals from real smelting wastewater. J. Environ. Manag. 2018, 218, 129–138. [Google Scholar] [CrossRef]
  23. Witek-Krowiak, A.; Chojnacka, K.; Podstawczyk, D.; Dawiec, A.; Pokomeda, K. Application of response surface methodology and artificial neural network methods in modelling and optimization of biosorption process. Bioresour. Technol. 2014, 160, 150–160. [Google Scholar] [CrossRef] [PubMed]
  24. Sabour, M.R.; Amiri, A. Comparative study of ANN and RSM for simultaneous optimization of multiple targets in Fenton treatment of landfill leachate. Waste Manag. 2017, 65, 54–62. [Google Scholar] [CrossRef] [PubMed]
  25. Gadekar, M.R.; Ahammed, M.M. Modelling dye removal by adsorption onto water treatment residuals using combined response surface methodology-artificial neural network approach. J. Environ. Manag. 2019, 231, 241–248. [Google Scholar] [CrossRef] [PubMed]
  26. Valente, G.; Mendonça, R.; Pereira, J.; Felix, L. Artificial neural network prediction of chemical oxygen demand in dairy industry effluent treated by electrocoagulation. Sep. Purif. Technol. 2014, 132, 627–633. [Google Scholar] [CrossRef]
  27. Belkacem, S.; Bouafia, S.; Chabani, M. Study of oxytetracycline degradation by means of anodic oxidation process using platinized titanium (Ti/Pt) anode and modeling by artificial neural networks. Process Saf. Environ. Prot. 2017, 111, 170–179. [Google Scholar] [CrossRef]
  28. Viana, D.F.; Salazar-Banda, G.R.; Leite, M.S. Electrochemical degradation of Reactive Black 5 with surface response and artificial neural networks optimization models. Sep. Sci. Technol. 2018, 53, 2647–2661. [Google Scholar] [CrossRef]
  29. Zhang, L.; Ding, W.; Qiu, J.; Jin, H.; Ma, H.; Li, Z.; Cang, D. Modeling and optimization study on sulfamethoxazole degradation by electrochemically activated persulfate process. J. Clean. Prod. 2018, 197, 297–305. [Google Scholar] [CrossRef]
  30. Zarei, M.; Khataee, A.; Ordikhani-Seyedlar, R.; Fathinia, M. Photoelectro-Fenton combined with photocatalytic process for degradation of an azo dye using supported TiO2 nanoparticles and carbon nanotube cathode: Neural network modeling. Electrochim. Acta 2010, 55, 7259–7265. [Google Scholar] [CrossRef]
  31. Salari, D.; Niaei, A.; Khataee, A.; Zarei, M. Electrochemical treatment of dye solution containing CI Basic Yellow 2 by the peroxi-coagulation method and modeling of experimental results by artificial neural networks. J. Electroanal. Chem. 2009, 629, 117–125. [Google Scholar] [CrossRef]
  32. da Silva Ribeiro, T.; Grossi, C.D.; Merma, A.G.; dos Santos, B.F.; Torem, M.L. Removal of boron from mining wastewaters by electrocoagulation method: Modelling experimental data using artificial neural networks. Miner. Eng. 2019, 131, 8–13. [Google Scholar] [CrossRef]
  33. Khan, S.U.; Khan, H.; Anwar, S.; Khan, S.; Zanoni, M.V.B.; Hussain, S. Computational and statistical modeling for parameters optimization of electrochemical decontamination of synozol red dye wastewater. Chemosphere 2020, 253, 126673. [Google Scholar] [CrossRef] [PubMed]
  34. Walczak, S. Artificial neural networks. In Encyclopedia of Information Science and Technology, 4th ed.; IGI Global: Hershey, PA, USA, 2018; pp. 120–131. [Google Scholar]
  35. Elazzouzi, M.; El Kasmi, A.; Haboubi, K.; Elyoubi, M. A novel electrocoagulation process using insulated edges of Al electrodes for enhancement of urban wastewater treatment: Techno-economic study. Process Saf. Environ. Prot. 2018, 116, 506–515. [Google Scholar] [CrossRef]
  36. Kayri, M. Predictive abilities of bayesian regularization and Levenberg–Marquardt algorithms in artificial neural networks: A comparative empirical study on social data. Math. Comput. Appl. 2016, 21, 20. [Google Scholar] [CrossRef]
  37. Taheri, M.; Moghaddam, M.R.A.; Arami, M. Improvement of the/Taguchi/design optimization using artificial intelligence in three acid azo dyes removal by electrocoagulation. Environ. Prog. Sustain. Energy 2015, 34, 1568–1575. [Google Scholar] [CrossRef]
  38. Nasr, M.; Ateia, M.; Hassan, K. Artificial intelligence for greywater treatment using electrocoagulation process. Sep. Sci. Technol. 2016, 51, 96–105. [Google Scholar] [CrossRef]
  39. Maleki, A.; Daraei, H.; Shahmoradi, B.; Razee, S.; Ghobadi, N. Electrocoagulation efficiency and energy consumption probing by artificial intelligent approaches. Desalination Water Treat. 2014, 52, 2400–2411. [Google Scholar] [CrossRef]
Figure 1. Experimental set-up of the used electrocoagulation system.
Water 14 00344 g001
Figure 2. ANN Architecture.
Water 14 00344 g002
Figure 3. The structure of the ANFIS model.
Water 14 00344 g003
Figure 4. Response surface plot illustrating the effect of operating parameters on the CEX removal efficiency (a) non-insulated electrode (b) insulated electrode (I) initial CEX concentration and electrolysis time, (II) initial CEX concentration and initial pH, (III) initial electrolysis time and pH.
Water 14 00344 g004
Figure 5. Regression diagram of data used in training, validation and test sets.
Water 14 00344 g005
Figure 6. Sensitivity Analysis of ANN Input Variables.
Water 14 00344 g006
Figure 7. (A) Regression plot for ANFIS model (actual vs. predicted), (B) regression plot (actual vs. predicted) for ANN model, (C) regression plot (actual vs. predicted) for RSM model.
Water 14 00344 g007
Table 1. Independent parameters and ranges based on CCD.
FactorsExperimental Field
−2−1012
CEX Initial Conc. (mg/L)1523.13546.8955
Electrolysis Time (min)2024.053035.9440
Initial pH34.6279.3811
Electrode TypeNon-InsulatedInsulated
Table 2. Formula, Parameters, and Description of Descriptive Statistical indicators.
Statistical IndicatorFormulationParametersDescription
R2 1 i = 1 n ( y i , cal y i , exp ) 2 ( y avg , exp y i , exp ) 2 n: Number of data
yi,cal: observed values,
yi,exp: predicted values,
yavg,exp: predicted average values.
Coefficient of Determination. The average squared difference between the estimated values and the actual value.
MSE i = 1 n | y i , cal y i , exp | n n: Number of data,
yi,cal: observed values,
yi,exp: Predicted values.
Mean Absolute Error
The average of all absolute errors or a measure of prediction accuracy of a forecasting method
RMSE 1 n i = 1 n ( y i , cal y i , exp ) 2 n: Number of data,
yi,cal: observed values,
yi,exp: Predicted values.
Root Mean Square error. The difference between the values predicted by the model and the recorded data
Table 3. Analysis of Variance (ANOVA) for the RSM Model of the percentage of CEX Removal.
FactorSum of SquaresMean SquareF-Ratiop-Value (Prob > F)
Model8053.85671.15147.27<0.0001
Init. CEX Conc.169.21169.2137.13<0.0001
B- electrolysis time990.47990.47217.33<0.0001
C- pH427.54427.5493.81<0.0001
D- electrode type615.33615.33135.02<0.0001
AB177.57177.5738.96<0.0001
AC34.3634.367.540.0077
AD181.83181.8339.90<0.0001
BC37.8437.848.300.0053
BD188.08188.0841.27<0.0001
CD0.02010.02010.00660.6360
A22867.872867.87629.28<0.0001
B21294.091294.09283.95<0.0001
C22057.402057.40451.44<0.0001
Residual305.344.56--
Lack of fit111.226.541.690.0777
Pure error194.123.88
Table 4. Performance evaluation in ANN selection.
No. of Neurons in the Hidden LayerNo. of Layers
1 Hidden Layer2 Hidden Layer
R2MSERMSER2MSERMSE
50.9185310.433.22950.9657510.77533.28257
60.985874.0632.001570.98314.2692.06615
70.9419225.98045.097090.932914.27332.06719
80.9480419.29634.39270.9675315.55053.94341
90.971122.05341.432960.986155.31682.30581
100.984667.97972.824830.983227.66282.76817
110.98163.47591.864370.957110.19923.19361
120.9370712.00463.464760.981724.33212.08136
130.8669716.01694.002110.984942.85481.68961
140.98413.23131.797580.984443.80911.95169
150.97914.41442.101040.966244.01832.00456
160.931555.64922.37680409556115.24223.90412
170.9433717.87114.227420.954684.29712.07294
180.951135.41892.327850.983375.78742.40570
190.981867.01442.648470.985974.92962.22027
200.96976.76752.601440.985244.05652.01407
Table 5. The adjustable network parameters.
Input layer to Hidden Layer Weights
W1 (Input 1)W1 (Input 2)W1 (Input 3)W1 (Input 4)Bias
PE1−0.021−0.9654.3732.237−4.117
PE2−7.369−3.2840.6867.401−4.524
PE3−9.2144.76421.94913.6868.786
PE42.7782.2771.1783.869−1.082
PE51.645−1.559−1.661−0.131−1.134
Hidden Layer to Output Layer Weights
W2PE1W2PE2W2PE3W2PE4W2PE5Bias
−0.7190.249−0.6760.660−0.786−0.737
Publisher’s Note: MDPI stays neutral with regard to jurisdictional claims in published maps and institutional affiliations.

