
Impacts of Land-Use Change, Associated Land-Use Area and Runoff on Watershed Sediment Yield: Implications from the Kaduna Watershed

 , ,
, , 
Abstract
:1. Introduction
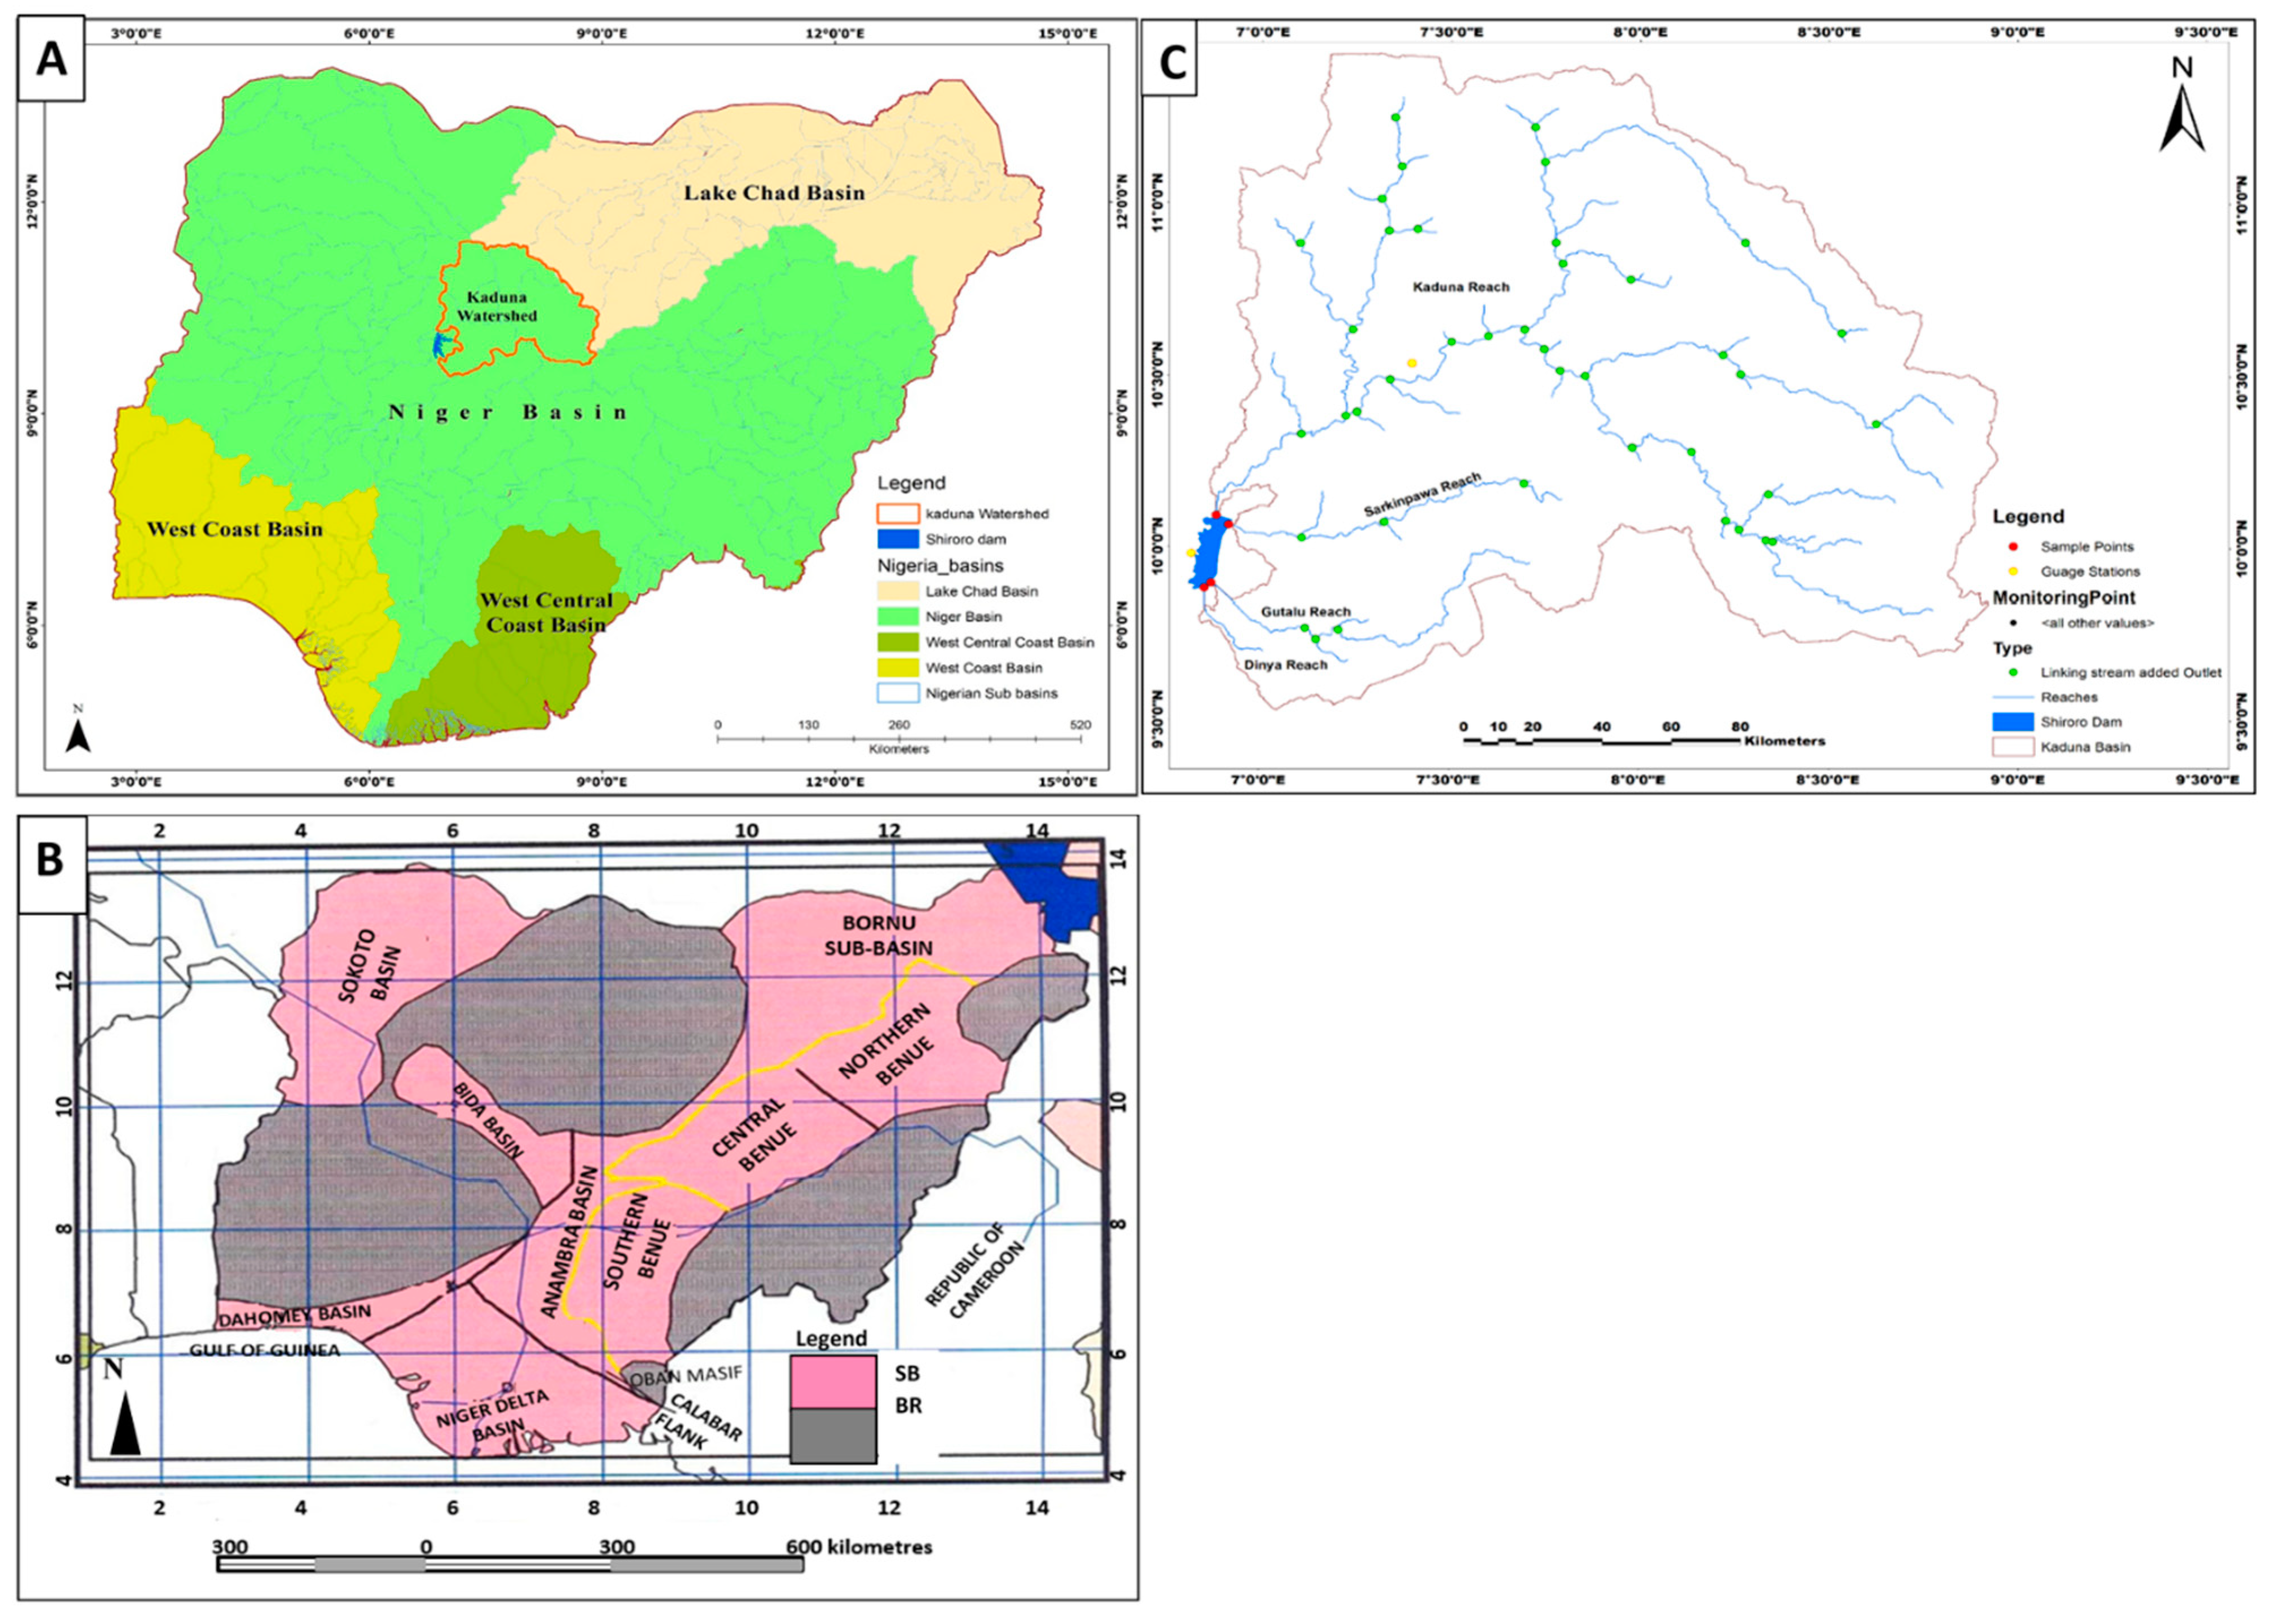
2. Study Location
3. Materials and Methods
3.1. Data Collection
3.2. Methodology
Calibration and Validation
4. Results and Discussion
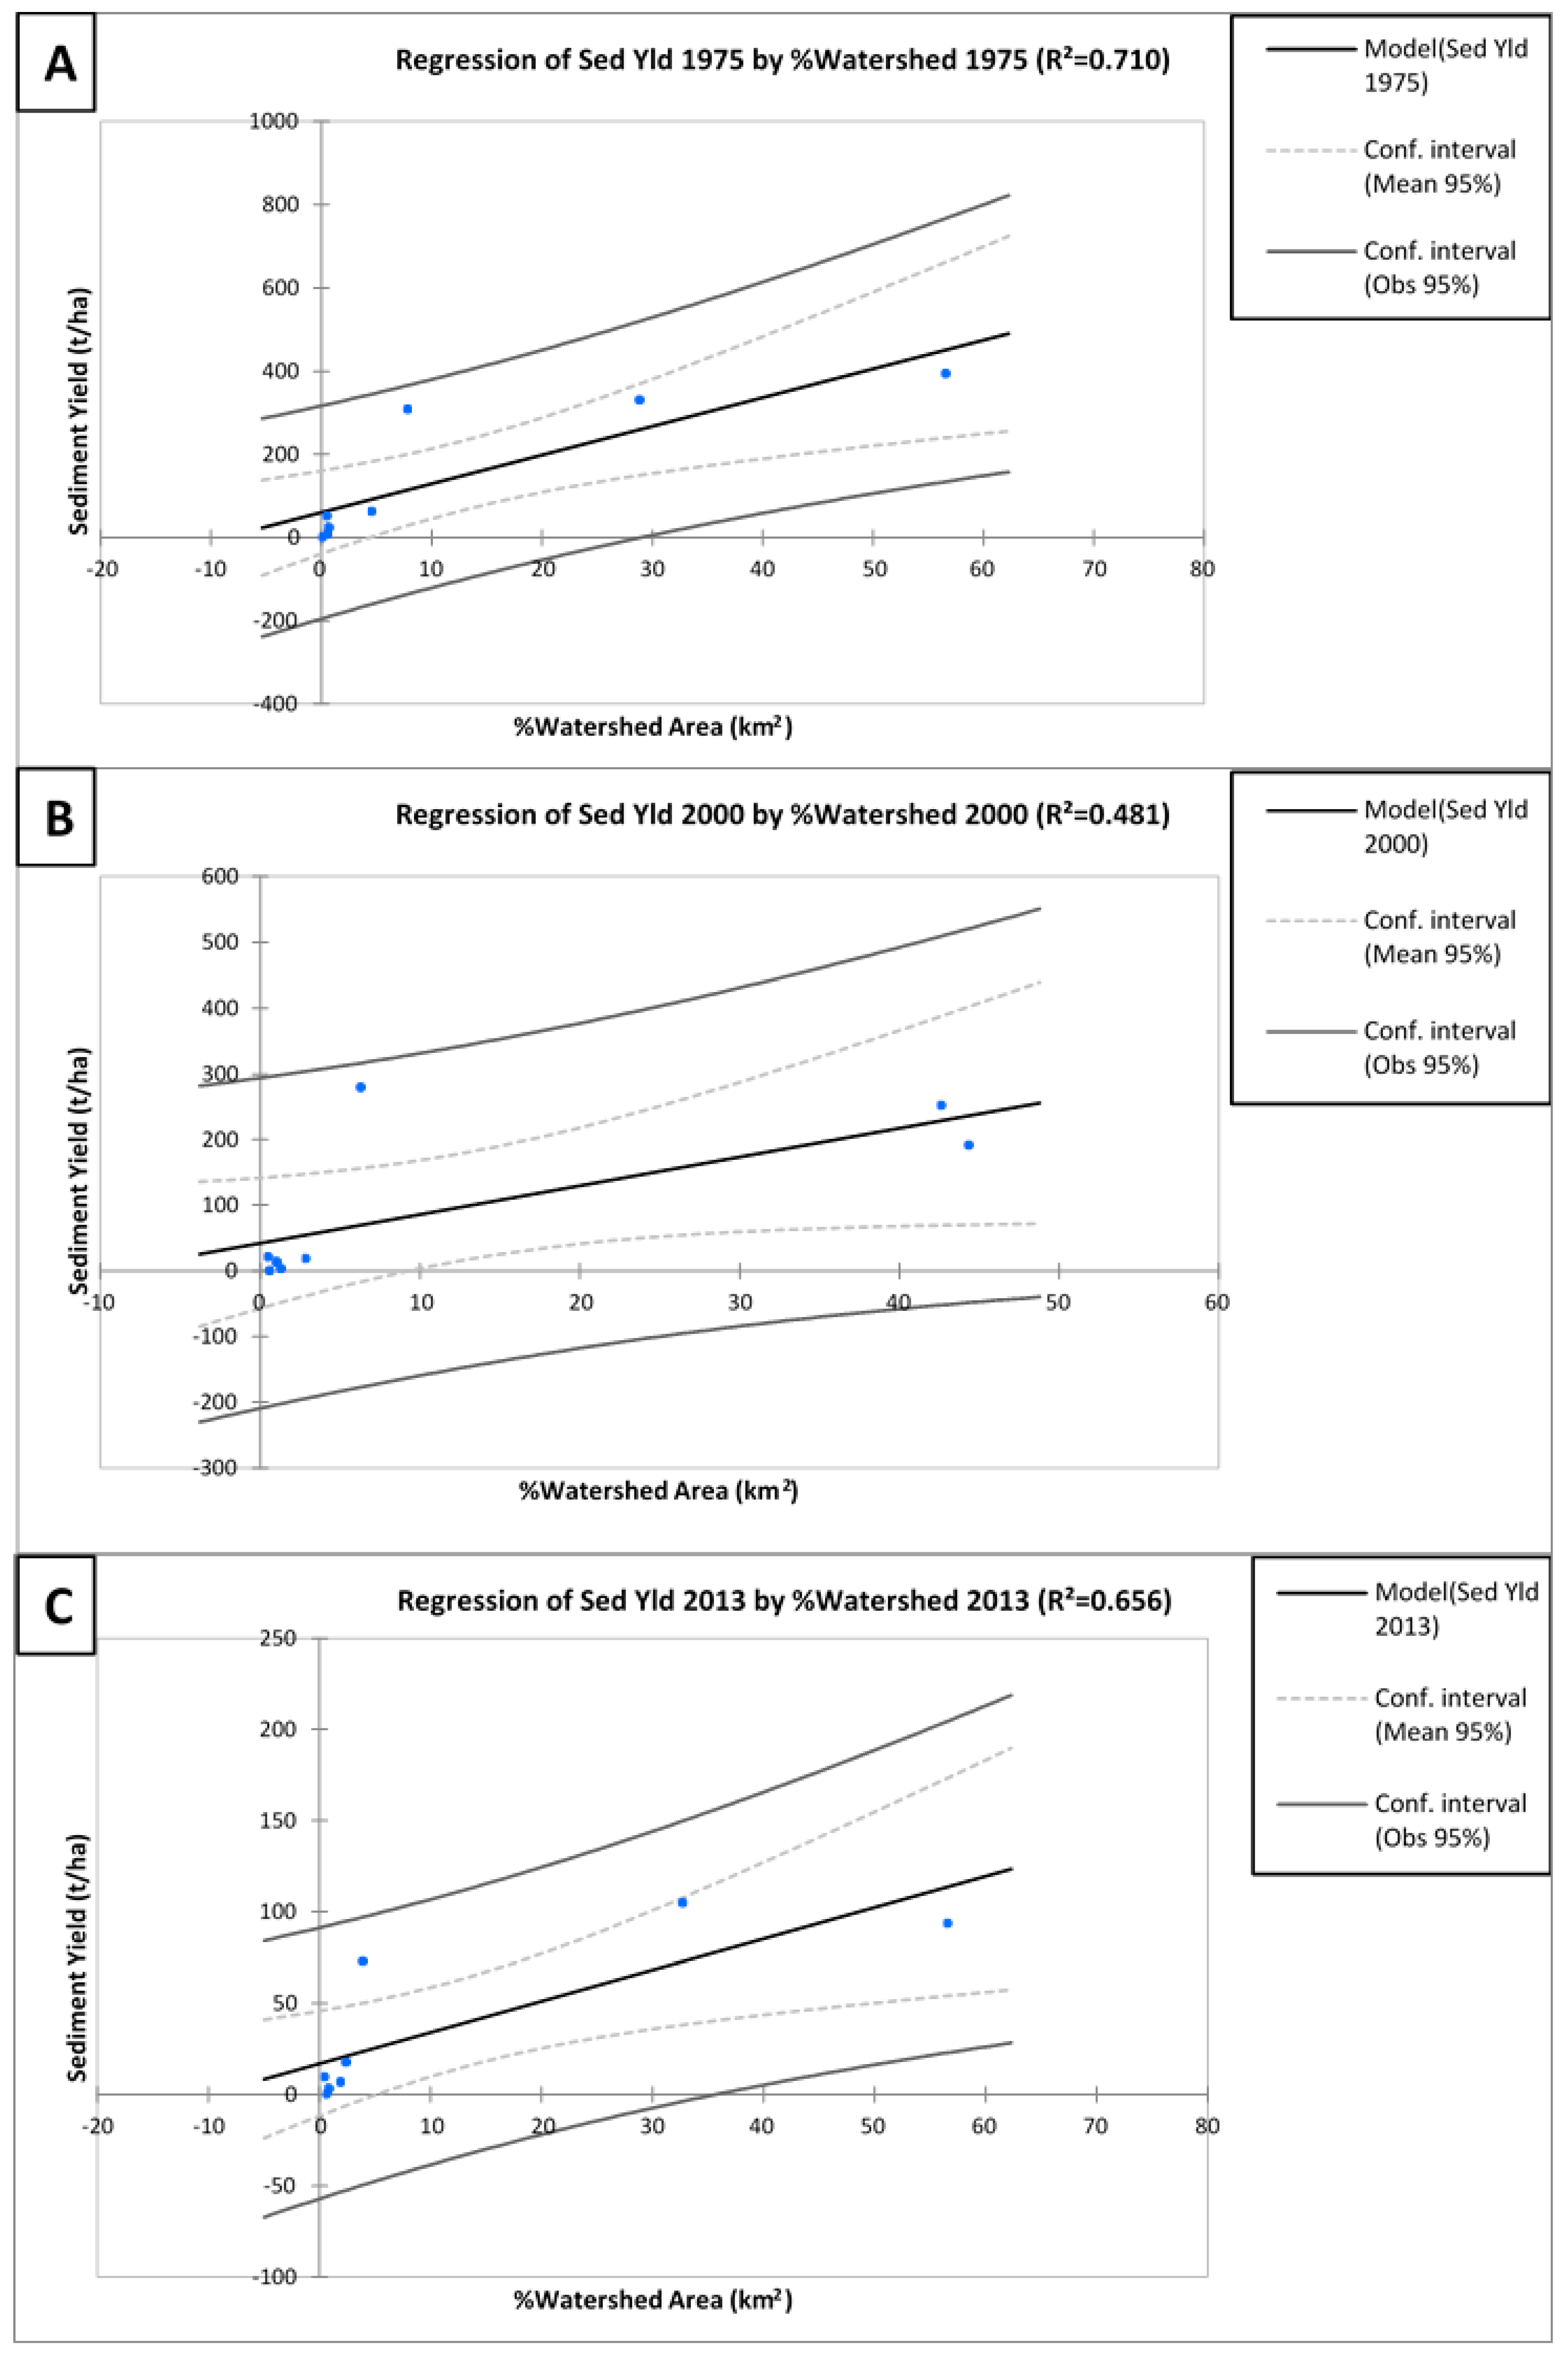
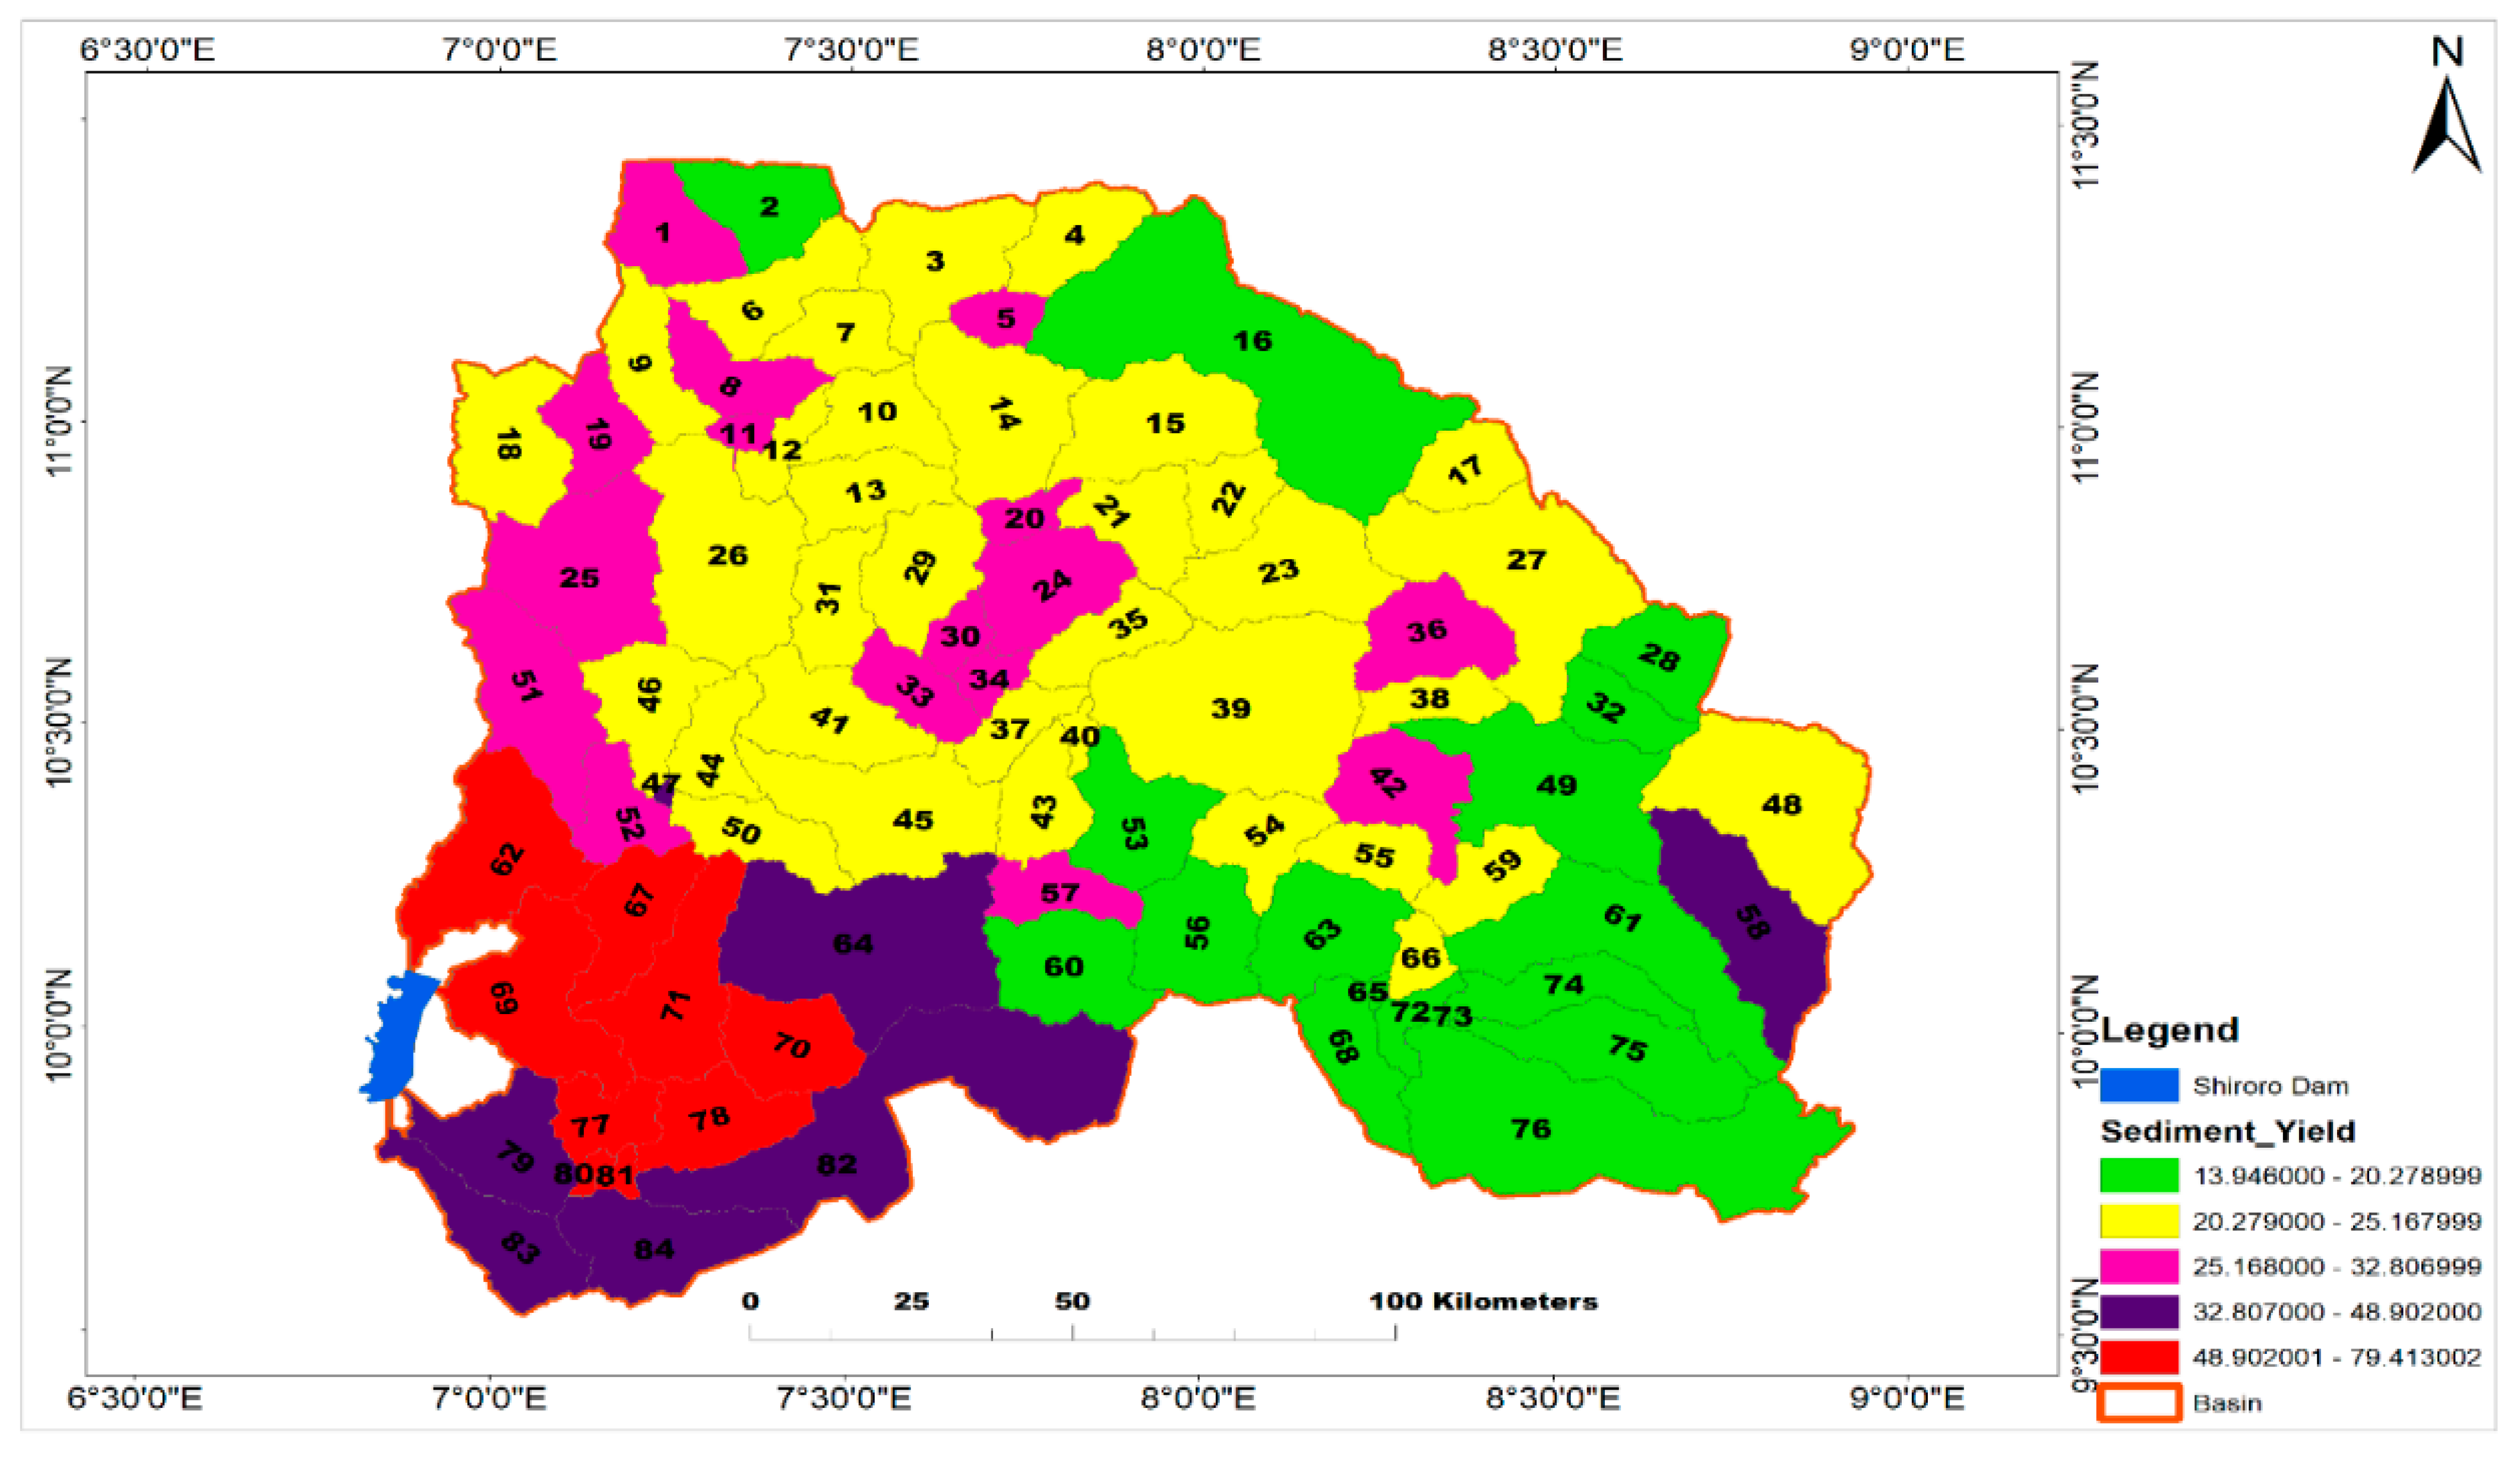
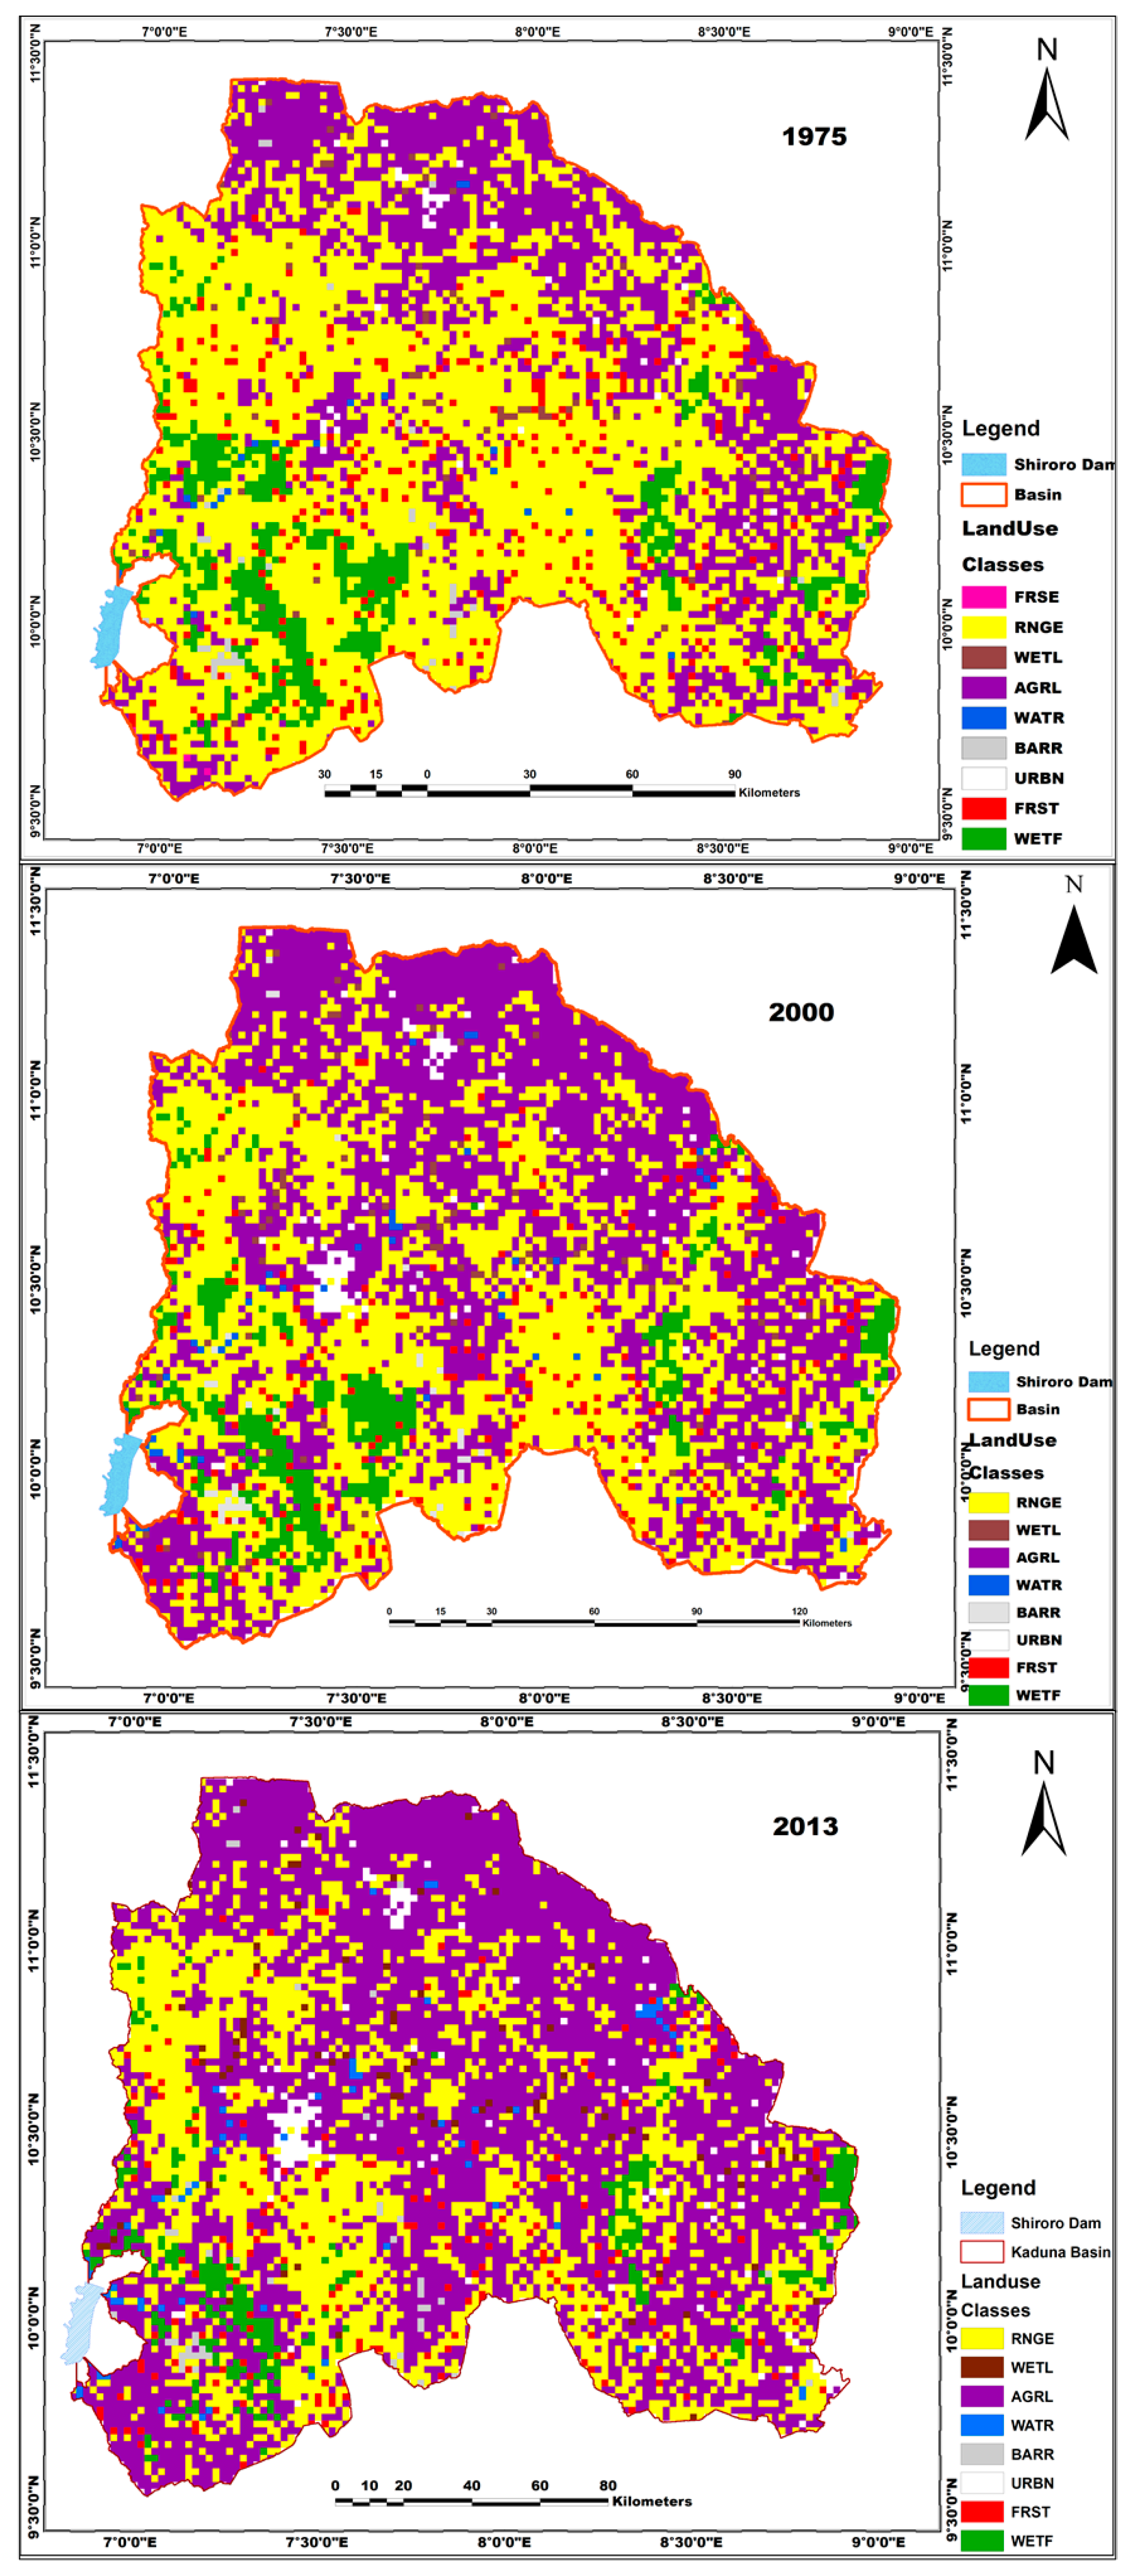
4.1. Relationship between Land-Use Change and Land-Use Area Size
4.2. Interplay of Land Use Change, Land Use Area Size, Runoff and Sediment Yield
4.3. Sensitivity Analysis, Calibration, and Validation Datasets
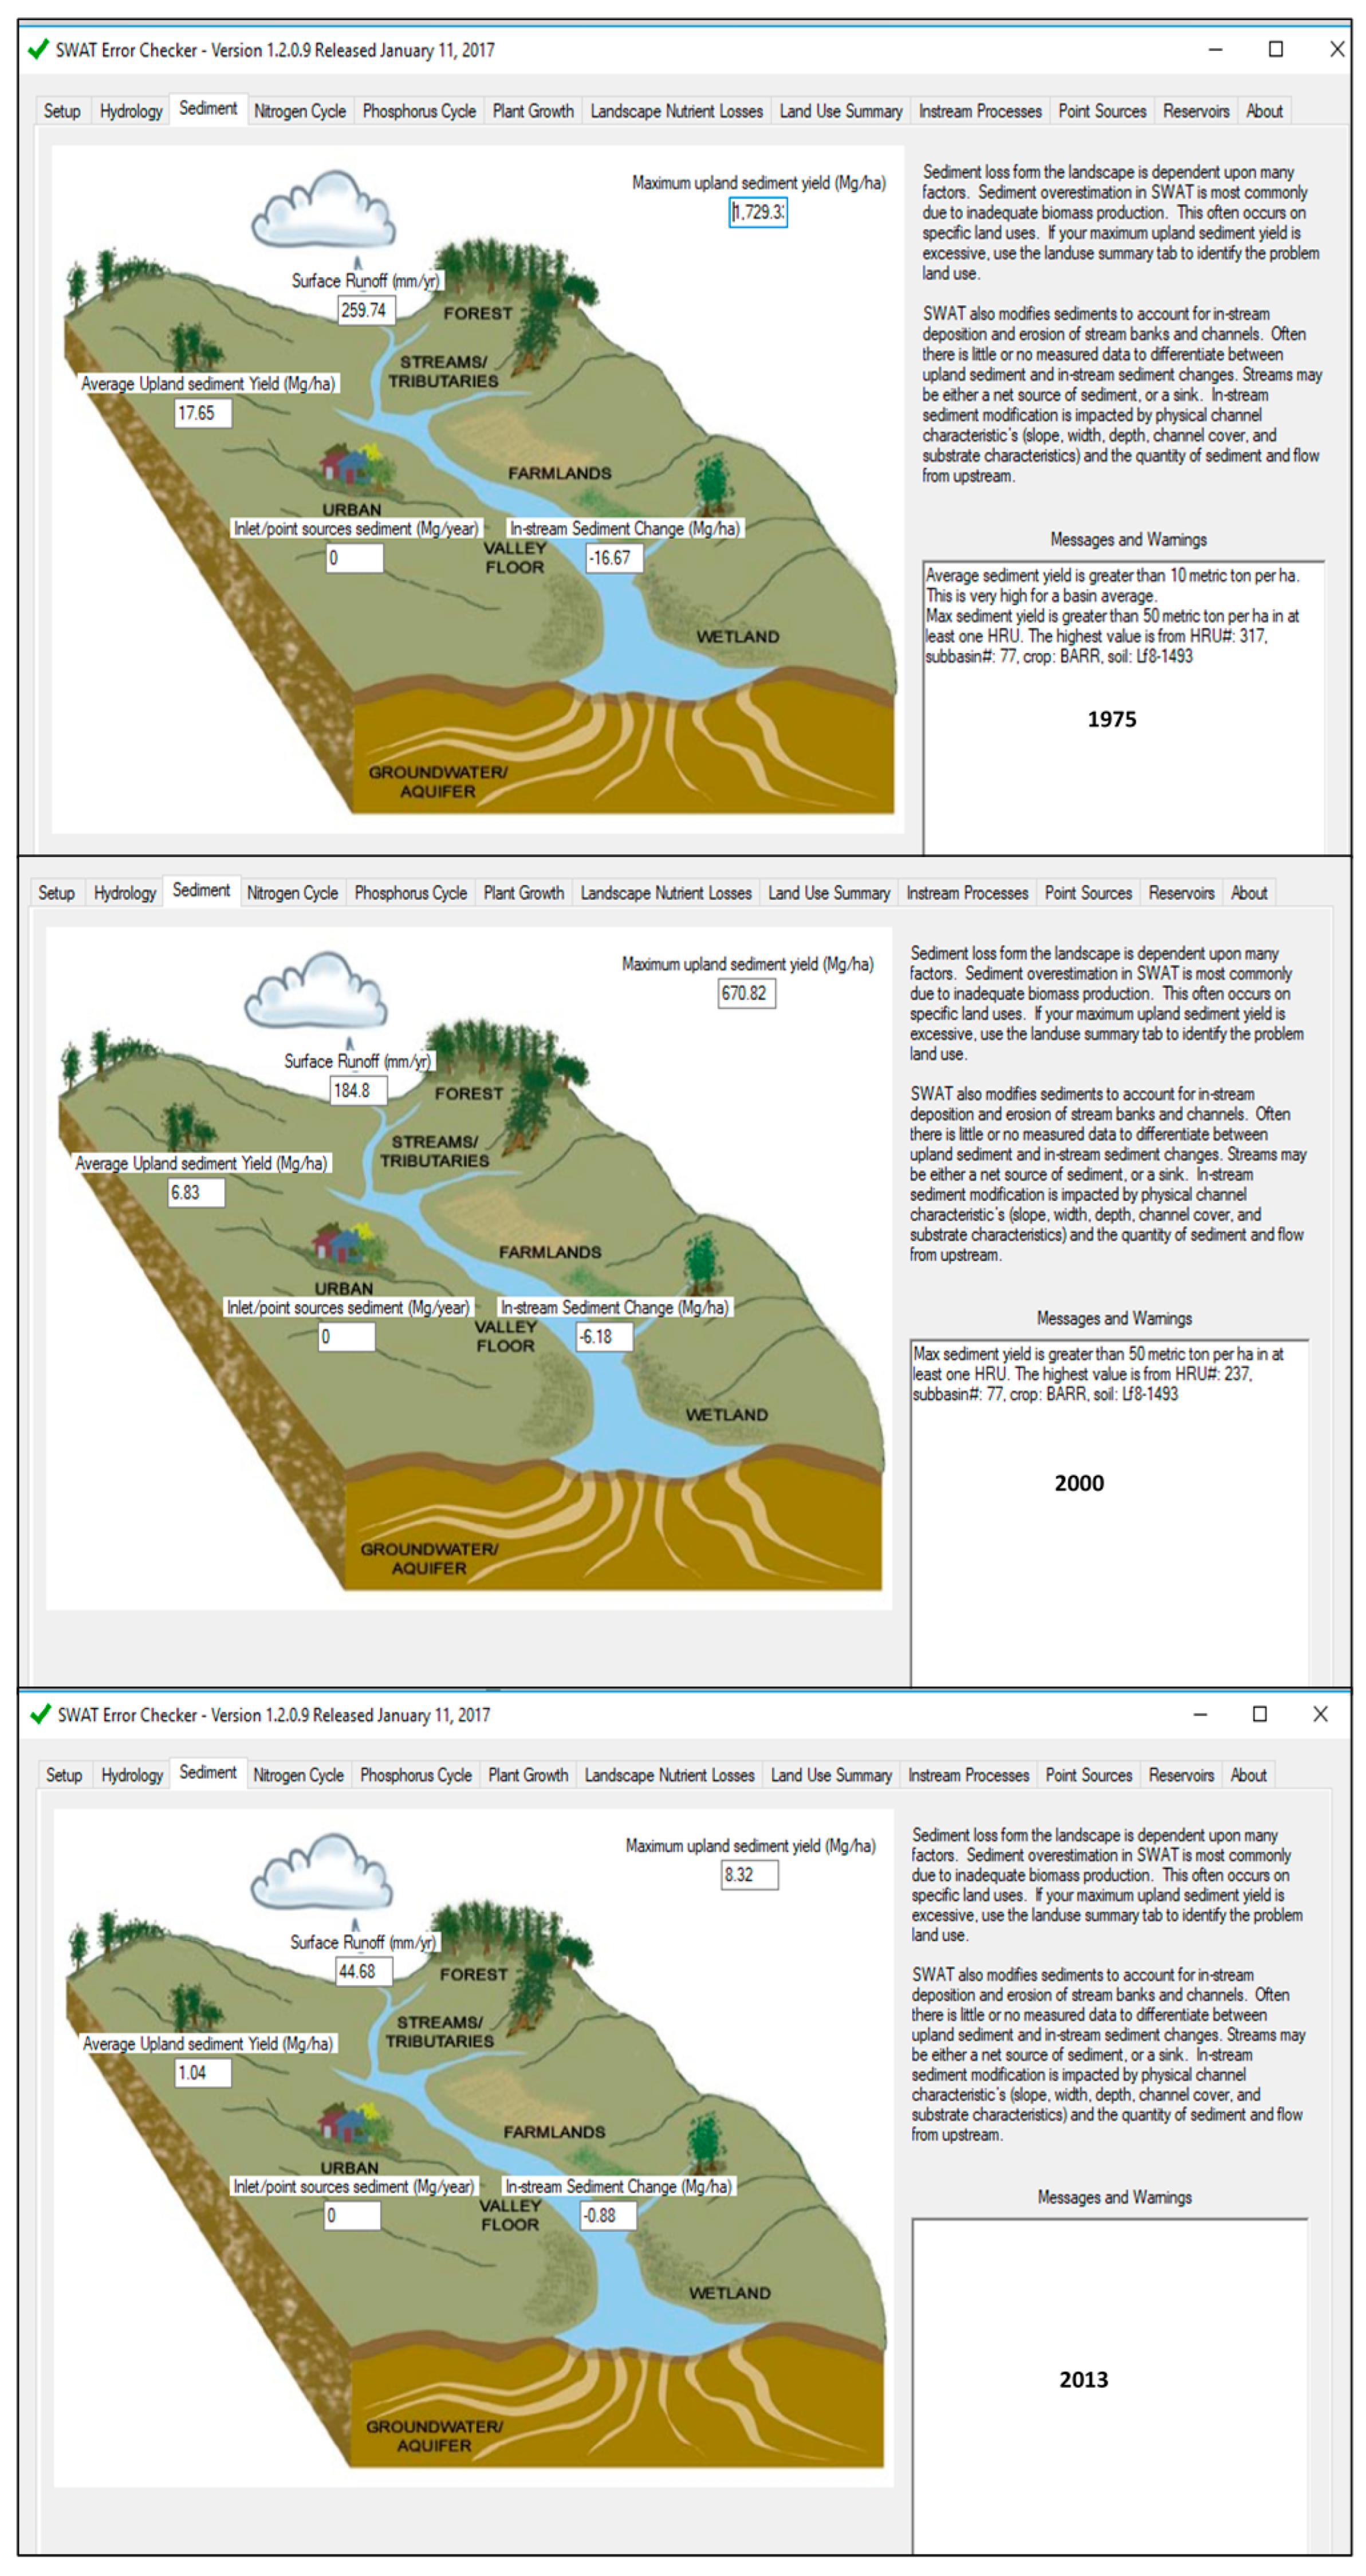
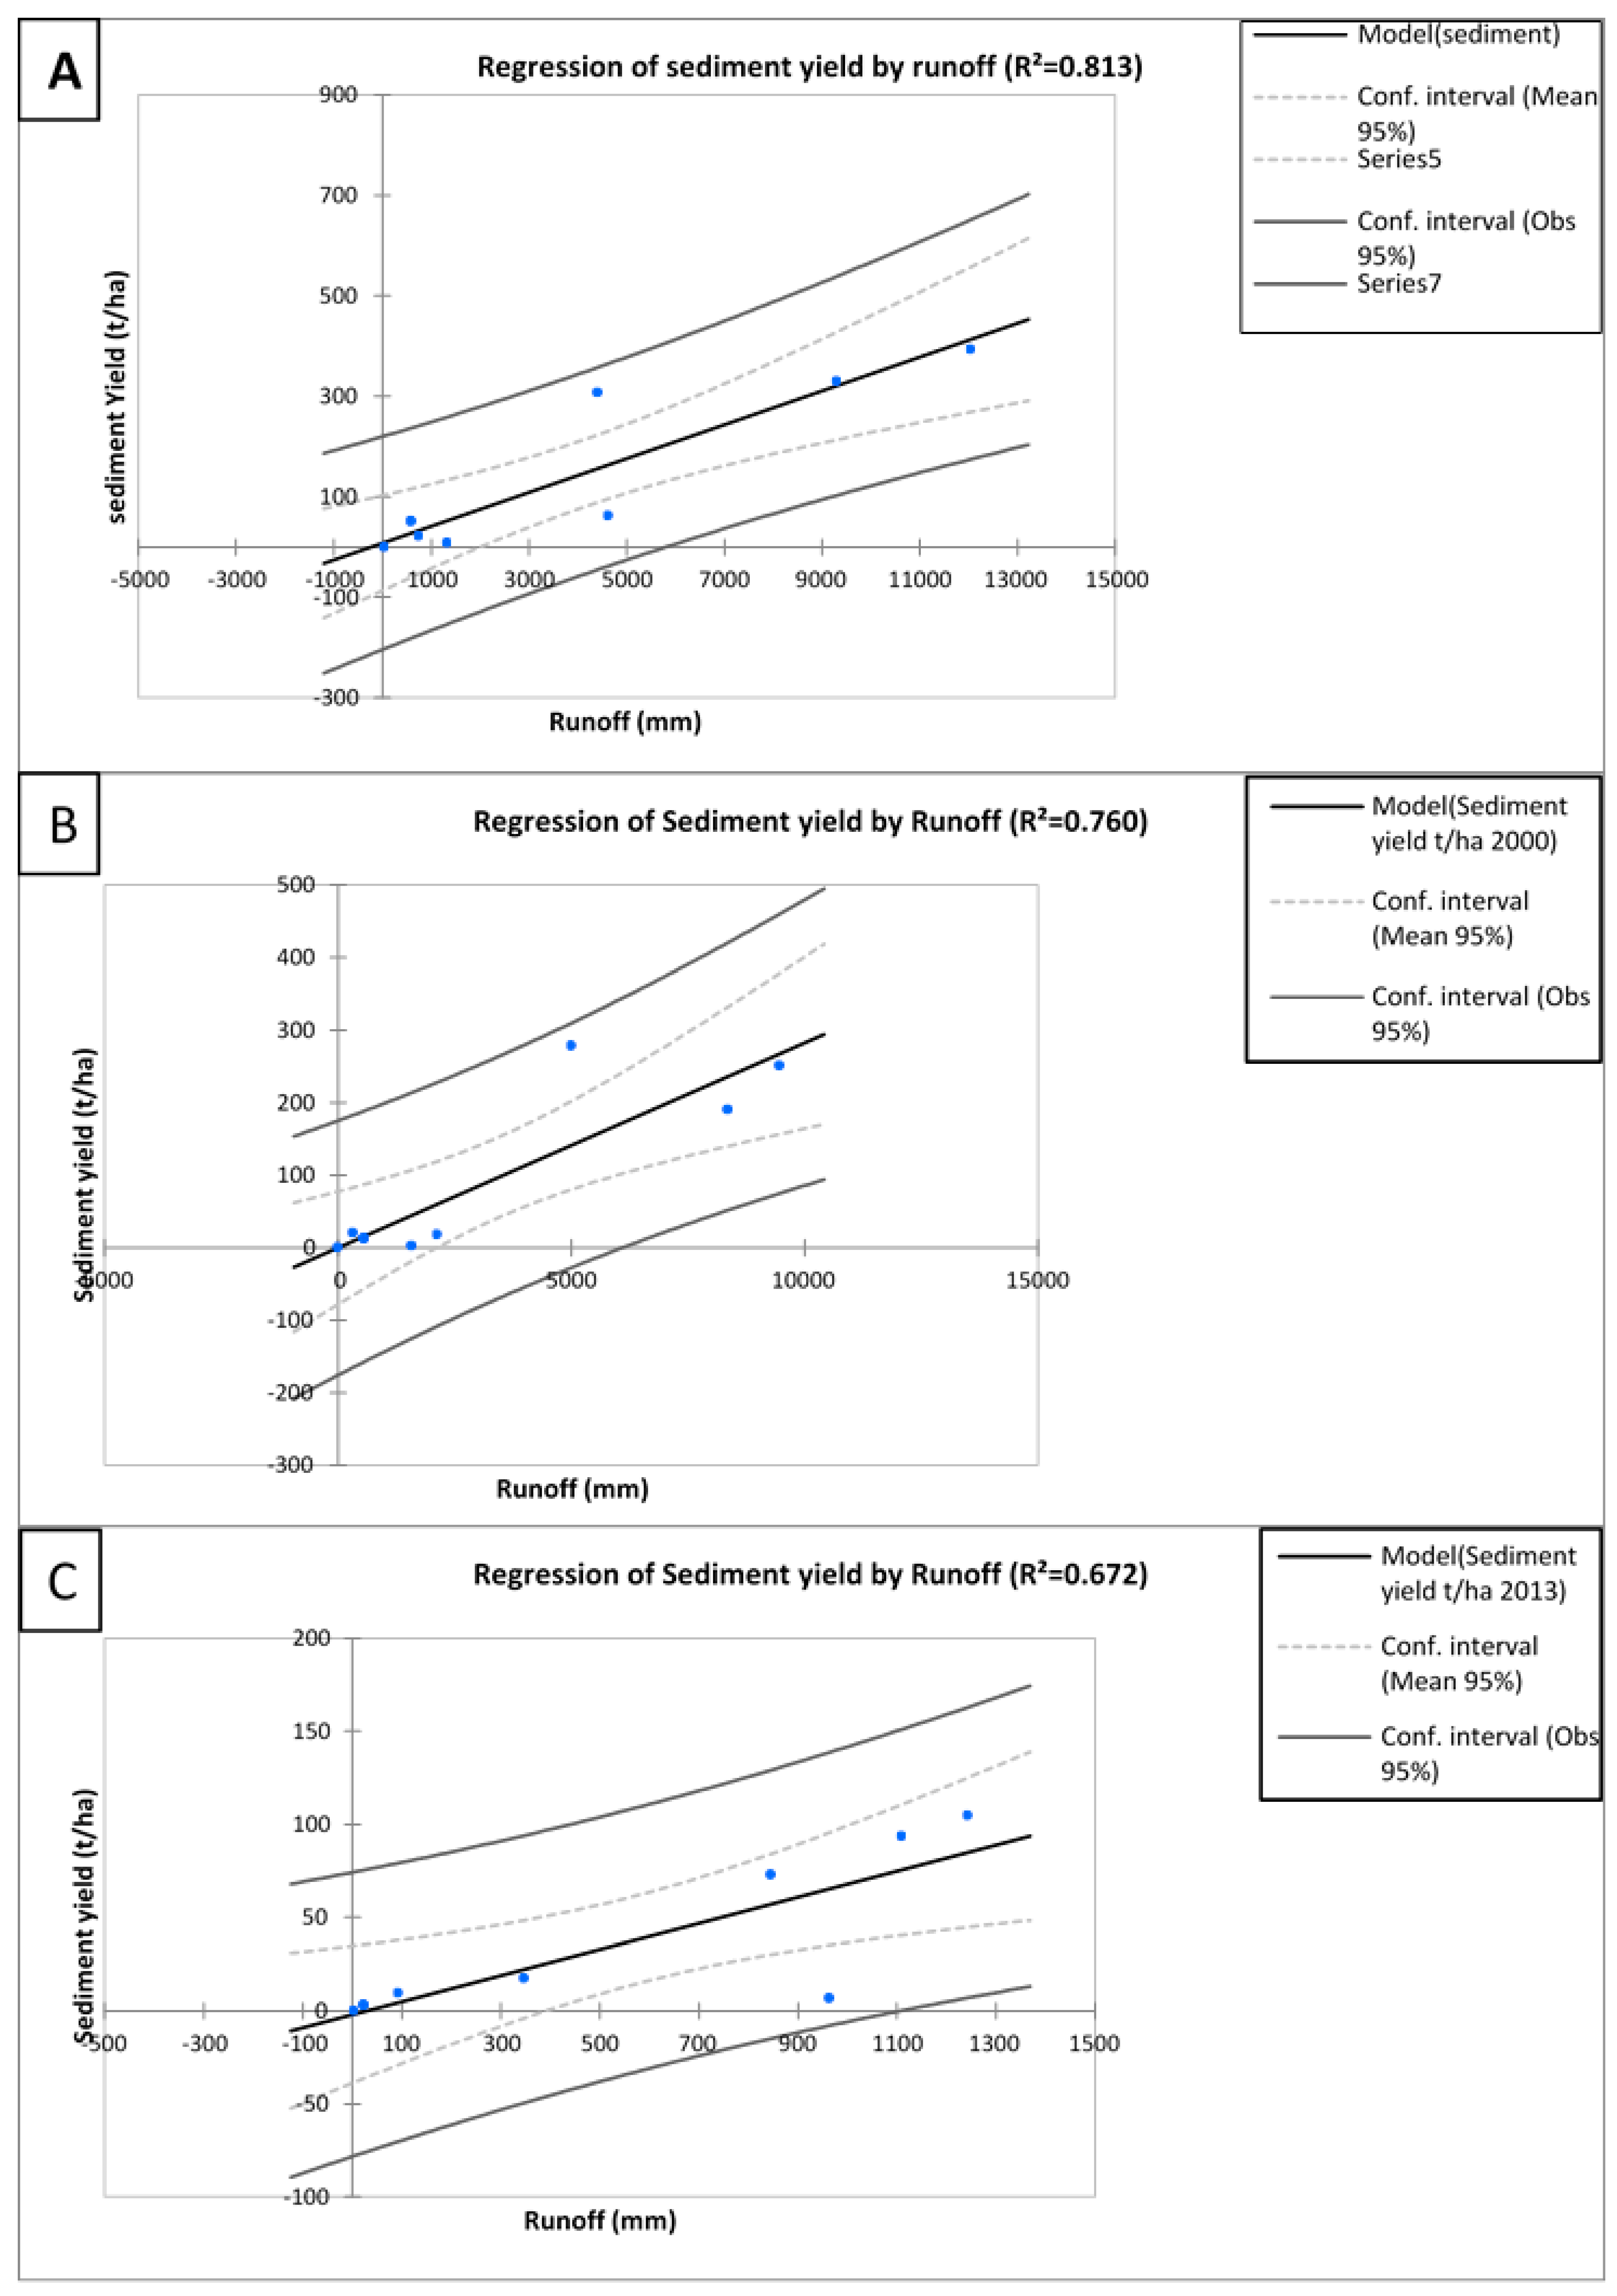
4.4. Surface Runoff and Sediment Yield
4.5. Implications for Land Use Policy and Dam Management
5. Conclusions
Author Contributions
Funding
Institutional Review Board Statement
Informed Consent Statement
Data Availability Statement
Conflicts of Interest
Appendix A

| Year | Precipitation Shiroro | Precipitation Kaduna |
|---|---|---|
| 1990 | 1747.4 | 1036.1 |
| 1991 | 1368.981 | 1371.063 |
| 1992 | 1419.7 | 1096.1 |
| 1993 | 1352.5 | 1244.5 |
| 1994 | 749.673 | 1066.9 |
| 1995 | 1662.787 | 1151.6 |
| 1996 | 1151.309 | 1217.2 |
| 1997 | 1209.984 | 1293.6 |
| 1998 | 899.542 | 1109.4 |
| 1999 | 841.598 | 1286.1 |
| 2000 | 1150.32 | 1232.8 |
| 2001 | 1341.28 | 1188.2 |
| 2002 | 1169.6 | 1315.4 |
| 2003 | 1344.72 | 1418.05 |
| 2004 | 1014.81 | 1379.3 |
| 2005 | 1080.246 | 1011.3 |
| 2006 | 1536.8 | 898.7 |
| 2007 | 1403.1 | 865 |
| 2008 | 1371.2 | 827.9 |
| 2009 | 1365.9 | 1217.9 |
| 2010 | 1215.9 | 1276.3 |
| 2011 | 1236.5 | 1096.4 |
| 2012 | 1659.81 | 1491.57 |
| 2013 | 1039.1 | 1169.94 |
| 2014 | 1450.9 | 1246.24 |
| 2015 | 1219.62 | 966.942 |
| 2016 | 1487.3 | 1352.004 |
| 2017 | 1176.9 | 1220.293 |
| 2018 | 1579.72 | 1266.539 |
| Grand Total | 40,553.10 | 37,722.16 |
| Year | Month | R. Kaduna Streamflow | R. Sarkinpawa Streamflow | R. Gutalu Streamflow | R. Dinya Streamflow |
|---|---|---|---|---|---|
| 2015 | January | 1.261 | 0.174 | 0.147 | 0.147 |
| 2015 | February | 1.141 | 0.145 | 0.155 | 0.155 |
| 2015 | March | 10.009 | 1.754 | 2.543 | 2.543 |
| 2015 | April | 2.332 | 0.328 | 0.881 | 0.881 |
| 2015 | May | 46.249 | 4.343 | 5.276 | 5.276 |
| 2015 | June | 127.252 | 7.77 | 8.587 | 8.587 |
| 2015 | July | 226.248 | 14.337 | 12.786 | 12.786 |
| 2015 | August | 260.275 | 31.854 | 28.738 | 28.738 |
| 2015 | September | 583.377 | 32.654 | 28.409 | 28.409 |
| 2015 | October | 173.073 | 7.888 | 7.523 | 7.523 |
| 2015 | November | 8.091 | 0.517 | 0.583 | 0.583 |
| 2015 | December | 3.188 | 0.314 | 0.201 | 0.201 |
| 2016 | January | 2.049 | 0.213 | 0.149 | 0.149 |
| 2016 | February | 1.414 | 0.16 | 0.111 | 0.111 |
| 2016 | March | 19.827 | 2.812 | 3.314 | 3.314 |
| 2016 | April | 22.519 | 7.668 | 15.698 | 15.698 |
| 2016 | May | 25.835 | 8.091 | 7.854 | 7.854 |
| 2016 | June | 23.956 | 16.174 | 18.245 | 18.245 |
| 2016 | July | 29.26 | 21.984 | 16.947 | 16.947 |
| 2016 | August | 32.213 | 32.311 | 30.153 | 30.153 |
| 2016 | September | 35.778 | 24.993 | 25.956 | 25.956 |
| 2016 | October | 38.52 | 5.706 | 8.735 | 8.735 |
| 2016 | November | 12.291 | 2.612 | 1.652 | 1.652 |
| 2016 | December | 1.764 | 0.311 | 0.232 | 0.232 |
| 2017 | January | 1.278 | 0.223 | 0.158 | 0.158 |
| 2017 | February | 0.968 | 0.169 | 0.127 | 0.127 |
| 2017 | March | 1.858 | 0.193 | 0.114 | 0.114 |
| 2017 | April | 23.061 | 2.83 | 3.404 | 3.404 |
| 2017 | May | 196.363 | 13.968 | 14.689 | 14.689 |
| 2017 | June | 269.649 | 21.016 | 25.299 | 25.299 |
| 2017 | July | 176.03 | 10.245 | 12.205 | 12.205 |
| 2017 | August | 485.275 | 29.387 | 33.053 | 33.053 |
| 2017 | September | 421.122 | 28.471 | 31.818 | 31.818 |
| 2017 | October | 124.441 | 3.69 | 4.205 | 4.205 |
| 2017 | November | 2.976 | 0.395 | 0.467 | 0.467 |
| 2017 | December | 1.901 | 0.289 | 0.223 | 0.223 |
| Month | Sarkinpawa | Kaduna | Dinya | Gutalu |
|---|---|---|---|---|
| March | 17.5 | 14.5 | 53.5 | 13.5 |
| April | 15.5 | 13.5 | 64 | 11.5 |
| May | 42 | 76 | 58 | 52 |
| June | 116 | 136 | 178 | 125 |
| July | 283 | 268 | 368 | 386 |
| August | 1374.5 | 1366 | 1452.5 | 1196 |
| September | 590 | 515 | 350 | 370 |
| October | 405 | 500 | 255 | 340 |
| Total | 3844 | 3889 | 3781.5 | 3444 |
References
- Getachew, H.E.; Melesse, A.M. The impact of land use change on the hydrology of the Angereb watershed, Ethiopia. Int. J. Water Sci. 2013, 1, 1–7. [Google Scholar]
- de Oliveira Serrão, E.A.; Silva, M.T.; Ferreira, T.R.; de Ataide, L.C.P.; dos Santos, C.A.; de Lima, A.M.M.; da Silva, V.D.P.R.; de Sousa, F.D.A.S.; Gomes, D.J.C. Impacts of land use and land cover changes on hydrological processes and sediment yield determined using the SWAT model. Int. J. Sediment Res. 2021, 37, 54–69. [Google Scholar] [CrossRef]
- Yehayis, E. Predicting Runoff and Sediment Yield Using Swat Model for Ija Galma Waqo Spate Irrigation Project. Master’s Thesis, Institute of Technology, School of Natural Resource and Environmental Engineering Haramaya University, Dire Dewa, Ethiopia, 2010. [Google Scholar]
- Ferreira, L.M.R.; Esteves, L.S.; de Souza, E.P.; dos Santos, C.A.C. Impact of the Urbanisation Process in the Availability of Ecosystem Services in a Tropical Ecotone Area. Ecosystems 2019, 22, 266–282. [Google Scholar] [CrossRef] [Green Version]
- Worldometers. Population of Nigeria (2020 and Historical). Available online: https://www.worldometers.info/population/world/ (accessed on 18 September 2020).
- Ola, P.S.; Adepehin, E.J. Sedimentological interpretation of coastal ditch cuttings: Implications for subsurface geology and provenance in Dahomey Basin, Nigeria. Arab. J. Geosci. 2017, 10, 65. [Google Scholar] [CrossRef]
- Hairsine, P.B. Controlling Sediment and Nutrient Movement Within Catchments; Industry Report. Report 97/9; Cooperative Research Centre for Catchment Hydrology: Canberra, Australia, 1997; Available online: http://www-civil.eng.monash.edu.au/centres/crcch/ (accessed on 15 July 2018).
- Morris, G.; Fan, J. Reservoirs Sedimentation Handbook: Design and Management of Dams, Reservoirs and Watershed for Sustainable Use; McGrawHill Book Company: New York, NY, USA, 1998. [Google Scholar]
- Abbaspour, K.C.; Rouholahnejad, E.; Vaghefi, S.; Srinivasan, R.; Yang, H.; Klove, B. A continental-scale hydrology and water quality model for Europe: Calibration and uncertainty of a high-resolution large-scale SWAT model. J. Hydrol. 2015, 524, 733–752. [Google Scholar] [CrossRef] [Green Version]
- Sheikh, D.A.; Aliyu, M. Examining Sediment Accumulation in Goronyo Reservoir, Sokoto State, Nigeria. IOSR J. Humanit. Soc. Sci. (IOSR-JHSS) 2017, 22, 60–65. [Google Scholar]
- Poff, N.L.; Hart, D.D. How dams vary and why it matters for the emerging science of dam removal: An ecological classification of dams is needed to characterize how the tremendous variation in the size, operational mode, age, and number of dams in a river basin influences the potential for restoring regulated rivers via dam removal. BioScience 2002, 52, 659–668. [Google Scholar]
- Porto, M.; La Laina Porto, R.; Azevedo, L.G.T. A participatory approach to watershed management: The Brazilian system 1. Jawra J. Am. Water Resour. Assoc. 1999, 35, 675–683. [Google Scholar] [CrossRef]
- Swallow, B.M.; Garrity, D.P.; Van Noordwijk, M. The effects of scales, flows, and filters on property rights and collective action in watershed management. Water Policy 2002, 3, 457–474. [Google Scholar] [CrossRef] [Green Version]
- Batchelor, C.H.; Rama Mohan Rao, M.S.; Manohar Rao, S. Watershed development: A solution to water shortages in semi-arid India or part of the problem? Land Use Water Resour. Res. 2003, 3, 1–10. [Google Scholar] [CrossRef]
- Lantican, M.A.; Guerra, L.C.; Bhuiyan, S.I. Impacts of soil erosion in the upper Manupali watershed on irrigated lowlands in the Philippines. Paddy Water Environ. 2003, 1, 19–26. [Google Scholar] [CrossRef]
- Daramola, J.; Ekhwan, T.M.; Adepehin, E.J.; Mokhtar, J.; Lam, K.C.; Er, A.C. Seasonal quality variation and environmental risks associated with the consumption of surface water: Implication from the Landzun Stream, Bida Nigeria. Heliyon 2019, 5, e02121. [Google Scholar] [CrossRef] [Green Version]
- Abbott, M.B.; Bathurst, J.C.; Cunge, J.A.; O’connell, P.E.; Rasmussen, J. An introduction to the European Hydrological System—Systeme Hydrologique European, "SHE", 2: Structure of a physically-based, distributed modelling system. J. Hydrol. 1986, 87, 61–77. [Google Scholar] [CrossRef]
- Vinogradov, Y.B. River Runoff Modeling. Hydrological Cycle in Encyclopedia of Life Support Systems (EOLSS); State Hydrological Institute: St. Petersburg, Russia, 2009; Volume III, p. 115. [Google Scholar]
- Strayer, D.L.; Beighley, R.E.; Thompson, L.C.; Brooks, S.; Nilsson, C.; Pinay, G.; Naiman, R.J. Effects of land cover on stream ecosystems: Roles of empirical models and scaling issues. Ecosystems 2003, 6, 407–423. [Google Scholar] [CrossRef]
- Rao, K.D.; Kumar, D.S. Spatial decision support system for watershed management. Water Resour. Manag. 2004, 18, 407–423. [Google Scholar] [CrossRef]
- Jha, M.K.; Paudel, R.C. Erosion Predictions by Empirical Models in a Mountainous Watershed in Nepal. J. Spat. Hydrol. 2010, 10, 89–102. [Google Scholar]
- Spruill, C.A.; Workman, S.R.; Taraba, J.L. Simulation of daily and monthly stream discharge from small watersheds using the SWAT model. Trans. ASAE 2000, 43, 1431. [Google Scholar] [CrossRef]
- Neitsch, S.L.; Arnold, J.G.; Kiniry, J.R.; Williams, J.R. Soil and Water Assessment Tool Theoretical Documentation Version 2009; Texas Water Resources Institute: College Station, TX, USA, 2011. [Google Scholar]
- Williams, J.R.; Arnold, J.G.; Kiniry, J.R.; Gassman, P.W.; Green, C.H. History of model development at Temple, Texas. Hydrol. Sci. J. 2008, 53, 948–960. [Google Scholar] [CrossRef] [Green Version]
- Abbaspour, K.C. SWAT-CUP, SWAT Calibration and Uncertainty Programs User Manual; Swiss Federal Institute of Aquatic Science and Technology: Eawag, Switzerland, 2015. [Google Scholar]
- Gashaw, T.; Tulu, T.; Argaw, M.; Worqlul, W. Modelling the hydrological impacts of land use/land cover changes in the Andassa watershed, Blue Nile Basin, Ethiopia. Sci. Total Environ. 2018, 619–620, 1394–1408. [Google Scholar] [CrossRef] [PubMed]
- Adie, D.B.; Ismail, A.; Muhammad, M.M.; Aliyu, U.B. Analysis of the water resources potential and useful life of the Shiroro Dam, Nigeria. Niger. J. Basic Appl. Sci. 2012, 20, 341–348. [Google Scholar]
- Abam, T.K.S. Regional hydrological research perspectives in the Niger Delta. Hydrol. Sci. J. 2001, 46, 13–25. [Google Scholar] [CrossRef]
- Adeogun, A.G.; Sule, B.F.; Salami, A.W. Cost-effectiveness of sediment management strategies for mitigation of sedimentation at Jebba hydropower reservoir, Nigeria. J. King Saud Univ.-Eng. Sci. 2018, 30, 141–149. [Google Scholar] [CrossRef] [Green Version]
- Lukman, S.; Otun, J.A.; Adie, D.B.; Ismail, A.; Oke, I.A. A Brief Assessment of a Dam and Its Failure Prevention. J. Fail. Anal. Prev. 2011, 11, 97–109. [Google Scholar] [CrossRef]
- Areola OAhmed KLeong, G.C.; Irueghe, O.I.; Ikwuyatum, G.O.; Adeleke, B.O. Comprehensive Certificate Geography for Senior Secondary Schools (Physical, Human and Regional Geography with Map Reading); University Press PLC: Ibadan, Nigeria, 2014. [Google Scholar]
- Adeleye, D.R. Origin of ironstones, an example from the middle Niger Valley, Nigeria. J. Sediment. Res. 1973, 43, 709–727. [Google Scholar] [CrossRef]
- Nwajide, C.S. Geology of Nigeria’s Sedimentary Basin; CSS Bookshops Limited: Lagos, Nigeria, 2013; p. 565. [Google Scholar]
- Daramola, J.; Ekhwan, T.M.; Mokhtar, J.; Lam, K.C.; Adeogun, G.A. Estimating sediment yield at Kaduna watershed, Nigeria using soil and water assessment tool (SWAT) model. Heliyon 2019, 5, e02106. [Google Scholar] [CrossRef] [PubMed] [Green Version]
- USGS-EROS. U.S. Geological Survey Earth Resources Observation and Science Database. Available online: https://www.usgs.gov/centers/eros (accessed on 18 September 2020).
- Princeton Climate Analytics. African Flood and Drought Monitor Platform. 2019. Available online: platform.princetonclimate.com (accessed on 22 November 2019).
- Liu, X.F.; Xiang, L.; Zhai, J.Q. Quantitative study of impacts for environmental change on runoff in Luanhe River basin. J. Nat. Resour. 2013, 28, 244–252. [Google Scholar]
- Bagnold, R.A. Bedload Transport in Natural Rivers. J. Water Resour. Res. 1977, 13, 303–312. [Google Scholar] [CrossRef]
- Arnold, J.G.; Moriasi, D.N.; Gassman, P.W.; Abbaspour, K.C.; White, M.J. SWAT: Model use, calibration, and validation. Biological Systems Engineering: Papers and Publications; American Society of Agricultural and Biological Engineers: St. Joseph, MI, USA, 2012; p. 406. Available online: https://digitalcommons.unl.edu/biosysengfacpub/406 (accessed on 27 February 2021).
- Arnold, J.G.; Moriasi, D.N.; Gassman, P.W.; Abbaspour, K.C.; White, M.J.; Srinivasan, R.; Santhi, C.; Harmel, R.D.; van Griensven, A.; Van Liew, M.W.; et al. SWAT; Model use, calibration, and validation. Trans. ASABE 2012, 55, 1491–1508. [Google Scholar] [CrossRef]
- Arnold, J.G.; Kiniry, J.R.; Srinivasan, R.; Williams, J.R.; Haney, E.B.; Neitsch, S.L. Soil and Water Assessment Tool Input-Output File Documentation; Soil and Water Research Laboratory, Agricultural Research Service, Grassland: Temple, TX, USA, 2011. [Google Scholar]
- Arnold, J.G.; Williams, J.R.; Maidment, D.R. Continuous-time Water and Sediment routing Model for Large Basins. J. Hydraul. Eng. 1995, 121, 171–183. [Google Scholar] [CrossRef]
- Winchell, M.; Srinivasan, R.; Di luzio, M.; Arnold, J. ArcAWAT Interface for SWAT2009, User’s Guide. 2010. Available online: https://swat.tamu.edu/media/33774/swat2010-proceedings.pdf (accessed on 23 May 2017).
- Shingal, H.S.S.; Joshi, G.C.; Verma, R.S. Sediment Sampling in Rivers and Canals. Erosion and Sediment Transport Measurement; IAHS Special Publication: Wallingford, UK, 1981; Volume 133, pp. 169–175. [Google Scholar]
- Engel, B.; Storm, D.; White, M.; Arnold, J.; Arabi, M. A hydrologic/water quality model application protocol. J. Am. Water Resour. Assoc. 2007, 43, 1223–1236. [Google Scholar] [CrossRef]
- Eckhardt, K.; Arnold, J.G. Automatic calibration of a distributed catchment model. J. Hydrol. 2001, 251, 103–109. [Google Scholar] [CrossRef]
- Van Liew, M.W.; Garbrecht, J. Hydrologic simulation of the little Washita river experimental watershed using SWAT 1. J. Am. Water Resour. Assoc. 2003, 39, 413–426. [Google Scholar] [CrossRef]
- Krause, P.; Boyle, D.P.; Base, F. Comparison of different efficiency criteria for hydrological model assessment. Adv. Geosci. 2005, 5, 89–97. [Google Scholar] [CrossRef] [Green Version]
- Cao, W.; Bowden, W.B.; Davie, T.; Fenemor, A. Multi-variable and multi-site calibration and validation of SWAT in a large mountainous catchment with high spatial variability. Hydrol. Processes Int. J. 2006, 20, 1057–1073. [Google Scholar] [CrossRef]
- Parajuli, P.B.; Nelson, N.O.; Frees, L.D.; Mankin, K.R. Comparison of AnnAGNPS and SWAT model simulation results in USDA-CEAP agricultural watersheds in south-central Kansas. Hydrol. Processes Int. J. 2009, 23, 748–763. [Google Scholar] [CrossRef]
- Ejemeyovwi, D.O. Landuse and Land cover mapping and land use pattern in Abraka. J. Environ. Res. Policies 2009, 4, 68–77. [Google Scholar]
- Ezeomedo, I.C.; Igboke, J.I. Mapping and Analysis of Land Use and Land Cover for a Sustainable Development Using Medium Resolution Satellite Images and GIS. Int. J. Eng. Manag. Sci. 2012, 3, 519. [Google Scholar]
- CILSS. Landscapes of West Africa. A Window on a Changing World; U.S. Geological Survey EROS: Garretson, SD, USA, 2016. [Google Scholar]
- Abbas, I.I.; Bello, O.M.; Abdullahi1, H. Mapping and analyzing the land use—land cover of Nigeria between 2001 and 2009. MOJ Eco Environ. Sci. 2018, 3, 197–205. [Google Scholar]
- Arowolo, A.O.; Deng, X. Land use/land cover change and statistical modelling of cultivated land change drivers in Nigeria. Reg. Environ. Chang. 2018, 18, 247. [Google Scholar] [CrossRef]
- Adeniyi, P.O.; Omojola, A. Landuse landcover change evaluation in Sokoto-Rima Basin of North-Western Nigeria based on Archival Remote Sensing and GIS Techniques. In Geoinformation Technology Applications for Resource and Environmental Management in Africa; Wura-Kay Prints: Lagos, Portugal, 1999; pp. 143–172. [Google Scholar]
- Atubi, A.O. The application of remote sensing in monitoring urban land dynamics in Victoria Island, Lagos, Nigeria. J. Empir. Res. 2004, 1, 57–64. [Google Scholar]
- Atubi, A.O.; Awaritefe, D.O.; Toyon, A.B. Analysis of land use and land cover change characteristics in Warri metropolis. Niger. Int. J. Dev. Sustain. 2018, 7, 1143–1168. [Google Scholar]
- Alaci, D.S.A.; Amujabi, F.A.; Baba, A.N.; Daniel, O. Spatial Growth Assessment with Remote Sensing Data for Central Nigeria. J. Agric. Soc. Sci. 2011, 7, 1–6. [Google Scholar]
- Aruofor, R. Forestry Outlook Studies in Africa (FOSA); Food and Agriculture Organization of the United Nation: New York City, NY, USA, 2001; Available online: http://www.fao.org/forestry/FON/FONS/outlook/Africa/AFRhom-e.stm (accessed on 22 January 2019).
- FAO. Climate Change and Food Security: A Framework Document; Food and Agriculture Organization of the United Nations: Rome, Italy, 2008; Available online: http://www.fao.org/forestry/15538-079b31d45081fe9c3dbc6ff34de4807e4.pdf (accessed on 18 December 2018).
- Davin, E.L.; de Noblet-Ducoudré, N. Climatic impact of global-scale deforestation: Radiative versus nonradiative processes. J. Clim. 2010, 23, 97–112. [Google Scholar] [CrossRef]
- Nema, P.; Nema, S.; Roy, P. An overview of global climate changing in current scenario and mitigation action. Renew. Sustain. Energy Rev. 2012, 16, 2329–2336. [Google Scholar] [CrossRef]
- Duque, A.; Feeley, K.J.; Cabrera, E.; Callejas, R.; Idarraga, A. The dangers of carbon-centric conservation for biodiversity: A case study in the Andes. Trop. Conserv. Sci. 2014, 7, 178–191. [Google Scholar] [CrossRef]
- Boucher, D.; Elias, P.; Lininger, K.; May-Tobin, C.; Roquemore, S.; Saxon, E. Cattle and pasture. In The Root of the Problem: What’s Driving Tropical Deforestation Today; Union of Concerned Scientists: Cambridge, MA, USA, 2011. [Google Scholar]
- Baccini, A.G.S.J.; Goetz, S.J.; Walker, W.S.; Laporte, N.T.; Sun, M.; Sulla-Menashe, D.; Hackler, J.; Beck, P.S.A.; Dubayah, R.; Friedl, M.A.; et al. Estimated carbon dioxide emissions from tropical deforestation improved by carbon-density maps. Nat. Clim. Chang. 2012, 2, 182. [Google Scholar] [CrossRef]
- Saleh, Y.; Badr, A.M.; El Banna, F.; Shahata, A. Agricultural Land-Use Change and Disappearance of Farmlands in Kaduna Metropolis-Nigeria. Sci. World J. 2014, 9, 1–7. Available online: www.scienceworldjournal.org (accessed on 15 March 2021). [CrossRef]
- Griffiths, P.G.; Hereford, R.; Webb, R.H. Sediment yield and runoff frequency of small drainage basins in the Mojave Desert. U.S.A. Geomorphology 2006, 74, 232–244. [Google Scholar] [CrossRef]
- Oyebande, L. Sediment transport and river basin management in Nigeria. In Tropical Agricultural Hydrology; Lai, R., Russell, E.W., Eds.; Wiley: Chichester, UK, 1981; pp. 201–255. [Google Scholar]
- Daramola, J.; Lam, K.C.; Mohd, E.T.; Mokhtar, J. Relationships between basin area and sediment yield upstream Shiroro reservoir, north-central Nigeria. Geogr.-Malays. J. Soc. Space 2020, 16, 26–44. [Google Scholar] [CrossRef]
- Umit, D. Modeling Sediment yield and Deposition Using the SWAT Model: A Case Study of Cubuk I and Cubuk II Reservoirs, Turkey. Ph.D. Thesis, University Fort Collins, CO, USA, 2015. [Google Scholar]
- Milliman, J.D.; Syvitski, J.P.M. Geomorphic tectonic control of sediment discharge to the ocean: The importance of small mountainous rivers. J. Geol. 1992, 100, 525–544. [Google Scholar] [CrossRef]
- Birkinshaw, S.J.; Bathurst, J.C. Model study of the relationship between sediment yield and river basin area. Earth Surf. Processes Landf. 2006, 31, 750–761. [Google Scholar] [CrossRef]
- Ichim, I. The Relationship between Sediment Delivery Ratio and Stream Order: A Romanian Case Study. 1990, pp. 79–86. Available online: https://www.cabdirect.org/cabdirect/welcome/?target=%2fcabdirect%2fabstract%2f19911951468 (accessed on 18 December 2018).
- Zyl, A.V.; Lorentz, S. Predicting the Impact of Farming Systems on Sediment Yield in the Context of Integrated Catchment Management; Report to the Water Research Commission; Agricultural Research Council in Association with University of Natal: Pretoria, South Africa, 2003. [Google Scholar]
- Alibuyog, N.R.; Ella, V.B.; Reyes, M.R.; Srinivasan, R.; Heatwole, C.T.; Dillaha, T. Predicting the effects of land-use change on runoff and Sediment yield in Manupali river sub-watersheds using the SWAT Model. Int. Agric. Eng. J. 2009, 18, 15–25. [Google Scholar]
- Ndulue, E.L.; Mbajiorgu, C.C.; Ugwu, S.N.; Ogwo, V.; Ogbu, K.N. Assessment of land use/cover impacts on runoff and sediment yield using hydrologic models: A review. J. Ecol. Nat. Environ. 2015, 7, 46–55. [Google Scholar] [CrossRef] [Green Version]
- Guzhaa, A.C.; Rufinoa, M.C.; Okothb, S.; Jacobs, S.; Nóbregae, R.L.B. Impacts of land use and land cover change on surface runoff, discharge and low flows: Evidence from East Africa. J. Hydrol. Reg. Stud. 2018, 15, 49–67. [Google Scholar] [CrossRef]
- Farley, K.A.; Jobbágy, E.G.; Jackson, R.B. Effects of afforestation on water yield: A global synthesis with implications for policy. Glob. Chang. Biol. 2005, 11, 1565–1576. [Google Scholar] [CrossRef]
- Mohammed, S.Y. Surface Runoff Responses to Rainfall Variability over the Bida Basin, Nigeria. J. Environ. Earth Sci. 2014, 4, 2224–3216. [Google Scholar]
- Adediji, A.; Fashae, O.A. Sediment dynamics in a small, 2nd order urban river Awba catchment, Ibadan, Nigeria. J. Environ. Geogr. 2014, 7, 23–28. [Google Scholar] [CrossRef] [Green Version]
- Roudier, P.; Ducharne, A.; Feyen, L. Climate change impacts on runoff in West Africa: A review. Hydrol. Earth Syst. Sci. 2014, 18, 2789–2801. [Google Scholar] [CrossRef] [Green Version]
- Phan, D.B.; Wu, C.C.; Hsieh, S.C. Land-use change effects on discharge and sediment yield of Song Cau Catchment in Northern Vietnam. J. Environ. Sci. Eng. 2011, 5, 92–101. [Google Scholar]
- Awosika, L.F.; French, G.T.; Nicholls, R.J.; Ibe, C.E. The impact of Sea-level Rise on the Coastline of Nigeria. In Proceedings of the IPCC Symposium on the Rising Challenges of the Sea, Magaritta, Venezuela, 9–13 March 1992. [Google Scholar]
- Idowu, A.A.; Ayoola, S.O.; Opele, A.I.; Ikenweiwe, N.B. Impact of Climate Change in Nigeria. Iran. J. Energy Environ. 2011, 2, 145–152. [Google Scholar]
- Dixon, A.B.; Wood, A.P. Wetland cultivation and hydrological management in eastern Africa: Matching community and hydrological needs through sustainable wetland use. Nat. Resour. Forum 2003, 27, 117–129. [Google Scholar] [CrossRef]
- Ogilvie, A.; Mahé, G.; Ward, J.; Serpantié, G.; Lemoalle, J.; Morand, P.; Barbier, B.; Diop, A.M.; Caron, A.; Namarra, R.; et al. Water, agriculture, and poverty in the Niger River basin. Water Int. 2010, 35, 594–622. [Google Scholar] [CrossRef]
- Chien, H.; Yeh, P.J.; Knouft, J.H. Modeling the potential impacts of climate change on streamflow in agricultural watersheds of the Midwestern United States. J. Hydrol. 2013, 491, 73–88. [Google Scholar] [CrossRef]
- Motsumi, S.; Magole, L.; Kgathi, D. Indigenous knowledge and land use policy: Implications for livelihoods of flood recession farming communities in the Okavango Delta, Botswana. Phys. Chem. Earth 2012, 50–52, 185–195. [Google Scholar] [CrossRef]
- Odjugo, A.O.O. An Analysis of Rainfall and its Implication in Nigeria. Glob. J. Environ. Sci. 2005, 4, 139–145. [Google Scholar]
- Zhang, L.; Cheng, L.; Chiew, F.; Fu, B. Understanding the impacts of climate and landuse change on water yield. Curr. Opin. Environ. Sustain. 2018, 33, 167–174. [Google Scholar] [CrossRef]
- Troy, A.R.; Grove, J.M.; O’Neil-Dunne, J.P.; Pickett, S.T.; Cadenasso, M.L. Predicting opportunities for greening and patterns of vegetation on private urban lands. Environ. Manag. 2007, 40, 394–412. [Google Scholar] [CrossRef]
- Gabiri, G.; Leemhuis, C.; Diekkruger, B.; Naschen, K.; Steinbach, S.; Thonfeld, F. Modelling the impact of land use management on water resources in a tropical inland valley catchment of central Uganda, East Africa. Sci. Total Environ. 2019, 653, 1052–1066. [Google Scholar] [CrossRef]
- Fournier, F. Climate Erosion; Presses Universitaires de France: Paris, France, 1960. [Google Scholar]
- Fournier, F. Use of hydrological basins for the study of soil erosion. Bull. Assoc. Geogr. Fr. 1966, 349, 49–52. [Google Scholar] [CrossRef]
- Jansen, J.M.L.; Painter, R.B. Predicting sediment yield from climate and topography. J. Hydrol. 1974, 21, 371–380. [Google Scholar] [CrossRef]
- Moriasi, D.N.; Arnold, J.G.; Van Liew MWBingner RLHarmel, R.D.; Veith, T.L. Model Evaluation Guidelines for Systematic Quantification of Accuracy in Watershed Simulations. Trans. ASABE 2007, 50, 885–900. [Google Scholar] [CrossRef]
- Adeogun, G.A.; Sule, F.B.; Salami, W.A. Simulation of sediment yield at the upstream watershed of Jebba lake in Nigeria using swat model. Malays. J. Civ. Eng. 2015, 27, 25–40. [Google Scholar]
- FAO. World Review: The Situation in Sub-Saharan Africa, Women in Developing Agriculture; FAO Agriculture Series No. 16; FAO: Rome, Italy, 1983; Available online: https://www.fao.org/3/ap663e/ap663e.pdf (accessed on 18 December 2018).
- MacEachern, S. The prehistory of the northern Mandara Mountains and surrounding plains. In Metals in Mandara Mountains’ Society and Culture; David, N., Ed.; Red Sea Press: Trenton, NJ, USA, 2012; pp. 29–67. [Google Scholar]
- Schellenberg, G.; Donnelly, C.R.; Holder, C.; Ahsan, R. Dealing with Sediment: Effects on Dams and Hydropower Generation. Hydro Rev. Worldw. 2017, 25. Available online: https://www.hydroreview.com/2017/02/22/dealing-with-sediment-effects-on-dams-and-hydropower-generation/#gref (accessed on 15 April 2020).
- Evans, J.E.; Mackey, S.D.; Gottgens, J.F.; Gill, W.M. Lessons from a Dam Failure. Ohio J. Sci. 2000, 100, 121–131. [Google Scholar]
- Kummu, M.; Varis, O. Sediment-related impacts due to upstream reservoir trapping, the Lower Mekong River. Geomorphology 2007, 85, 275–293. [Google Scholar] [CrossRef]
- DiFrancesco, K.; Woodruff, K. Global Perspectives on Large Dams: Evaluating the State of Large Dam Construction and Decommissioning across the World; Forestry & Environmental Studies Publications Series; Yale School of Forestry & Environmental Studies: New Haven, CT, USA, 2007; Available online: https://elischolar.library.yale.edu/fes-pubs/33 (accessed on 15 April 2020).
- Annandale, G.W. Reservoir sedimentation. Encyclopedia of Hydrological Sciences; Wiley Online Library: Hoboken, NJ, USA, 2006. [Google Scholar] [CrossRef]


| Data Type | Description | Resolution | Source |
|---|---|---|---|
| Weather | Precipitation, Min. and Max. Temperature, Relative Humidity, Wind and Solar Radiation | Daily | Shiroro Dam Meteorological station and NIMET Kaduna |
| Topography | Digital Elevation Model | 30 m | Shuttle Radar Topography Mission (SRTM) |
| Land Cover Map | Land cover classification | 20 m | The European Space Agency (ESA) Sentinel-2 Satellite Observations |
| Land Cover Map | Land cover classification | 2 km | U.S. Geological Survey Earth Resources Observation and Science (USGS EROS) |
| Soil Map | Soil types and texture | 1 km | FAO Digital Soil database map of the World |
| Streamflow | Monthly | 2015–2017 | African Flood and Drought Monitor |
| S/n | Reach Name | Latitude | Longitude | Data Details |
|---|---|---|---|---|
| 1. | Kaduna | 10.100509 | 6.883008 | Flow/Rainfall/SSC |
| 2. | Sarkinpawa | 10.062851 | 6.934190 | Flow/Rainfall/SSC |
| 3. | Gutalu | 9.902773 | 6.883824 | Flow/Rainfall/SSC |
| 4. | Dinya | 9.893015 | 6.853076 | Flow/Rainfall/SSC |
| Sampling Points | Flow Calibration | Sampling Points | Flow Validation | ||||||
| NS | r2 | p-Factor | r-Factor | NS | r2 | p-Factor | r-Factor | ||
| Kaduna (69) | 0.62 | 0.67 | 0.97 | 4.70 | Sarkinpawa (69) | 0.71 | 0.80 | 0.86 | 5.50 |
| Gutalu (83) | −0.30 | 0.40 | 0.61 | 0.73 | Dinya (83) | −0.37 | 0.43 | 0.61 | 0.77 |
| Sampling Points | Sediment Calibration | Sampling Points | Sediment Validation | ||||||
| NS | r2 | p-Factor | r-Factor | NS | r2 | p-Factor | r-Factor | ||
| Sarkinpawa (69) | 0.01 | 0.53 | 0.88 | 2.25 | Gutalu (79) | −0.11 | 0.06 | 0.88 | 2.96 |
| Dinya (83) | 0.91 | 0.93 | 1.00 | 7.57 | Kaduna (62) | 0.47 | 0.82 | 0.63 | 1.49 |
| Land-Use Types | Land-Use Code | Area [ha] 1975 | % Watershed 1975 | Area [ha] 2000 | % Watershed 2000 | Area [ha] 2013 | % Watershed 2013 |
|---|---|---|---|---|---|---|---|
| Forest—Evergreen | FRSE | 999.45 | 0.03 | 0.00 | 0.00 | 0.00 | 0.00 |
| Range—Grasses | RNGE | 1,819,805.49 | 56.65 | 0.00 | 42.72 | 1,051,344.00 | 32.73 |
| Wetlands—Mixed | WETL | 26,519.36 | 0.83 | 35,061.07 | 1.09 | 32,286.05 | 1.01 |
| Agricultural Land—Generic | AGRL | 928,049.86 | 28.89 | 0.00 | 44.40 | 0.00 | 56.70 |
| Water | WATR | 8847.52 | 0.28 | 19,708.46 | 0.61 | 25,980.97 | 0.81 |
| Barren | BARR | 19,069.08 | 0.59 | 18,628.46 | 0.58 | 19,593.87 | 0.61 |
| Residential | URBN | 16,950.01 | 0.53 | 42,377.78 | 1.32 | 57,211.34 | 1.78 |
| Forest—Mixed | FRST | 144,708.67 | 4.50 | 95,345.63 | 2.97 | 78,382.10 | 2.44 |
| Wetlands—Forested | WETF | 247,513.44 | 7.70 | 202,678.84 | 6.31 | 126,353.30 | 3.93 |
| Land Use Landcover | 1975–2000 % Watershed Land Area | 2000–2013 % Watershed Land Area | Total % Watershed Land Area | % Balance 2013 | Remark | ||||
|---|---|---|---|---|---|---|---|---|---|
| Types | Code | Loss | Gain | Loss | Gain | Gain | Loss | ||
| Forest—Evergreen | FRSE | 0.03 | 0.00 | 0.00 | 0.00 | 0.00 | 0.03 | 0.00 | Lost |
| Range—Grasses | RNGE | 13.93 | 0.00 | 10.00 | 0.00 | 0.00 | 23.92 | 32.73 | Lost |
| Wetlands–Mixed | WETL | 0.00 | 0.26 | 0.08 | 0.00 | 0.18 | 0.08 | 1.01 | Gain |
| Agricultural Land | AGRL | 0.00 | 15.51 | 0.00 | 12.30 | 27.81 | 0.00 | 56.70 | Gain |
| Water | WATR | 0.00 | 0.33 | 0.00 | 0.20 | 0.53 | 0.00 | 0.81 | Gain |
| Barren | BARR | 0.01 | 0.00 | 0.00 | 0.03 | 0.02 | 0.01 | 0.61 | Gain |
| Residential | URBN | 0.00 | 0.79 | 0.00 | 0.46 | 1.25 | 0.00 | 1.78 | Gain |
| Forest—Mixed | FRST | 1.53 | 0.00 | 0.53 | 0.00 | 0.00 | 2.06 | 2.44 | Lost |
| Wetlands—Forested | WETF | 1.39 | 0.00 | 2.38 | 0.00 | 0.00 | 3.77 | 3.93 | Lost |
| Land Use | 1975 AREA (km2) | 2000 AREA (km2) | 2013 AREA (km2) | 1975 Runoff (mm) | 2000 Runoff (mm) | 2013 Runoff (mm) | 1975 SYLD (T/ha) | 2000 SYLD (T/ha) | 2013 SYLD (T/ha) |
|---|---|---|---|---|---|---|---|---|---|
| AGRL | 113,790.10 | 179,463.80 | 229,492.70 | 9271.20 | 8343.40 | 1106.50 | 329.80 | 190.70 | 93.50 |
| BARR | 1015.10 | 1053.0 | 1052.00 | 611.30 | 328.50 | 94.50 | 50.90 | 20.60 | 9.50 |
| URBN | 849.00 | 2925.30 | 3324.60 | 1281.30 | 1569.70 | 963.70 | 7.80 | 2.60 | 6.70 |
| FRST | 12,623.30 | 4983.80 | 4660.70 | 4642.50 | 2148.90 | 347.10 | 62.30 | 17.90 | 17.40 |
| RNGE | 226,716.0 | 172,722.40 | 132,990.10 | 12,022.20 | 9466.60 | 1244.60 | 393.00 | 251.30 | 104.70 |
| WATR | 152.70 | 153.00 | 1086.30 | 0.00 | 0.00 | 0.00 | 0.00 | 0.00 | 0.00 |
| WETF | 29,920.20 | 23,680.20 | 12,531.40 | 4409.80 | 5019.10 | 845.70 | 307.0 | 278.90 | 72.80 |
| WETL | 428.90 | 514.10 | 357.90 | 712.90 | 546.30 | 23.70 | 22.30 | 12.80 | 2.90 |
| r2 | 81.00% | 76.00% | 67.00% |
| Item | 1975 | 2000 | 2013 | 1975–2000 % < or > | 2000–2013 % < or > | Total % < or > |
|---|---|---|---|---|---|---|
| Precipitation (mm) | 1225.20 | 1198.10 | 1174.40 | <2.20% | <2.00% | <4.20 |
| Surface runoff q (mm) | 86.21 | 60.31 | 44.68 | <30.00% | <26.00% | <56.00% |
| Lateral soil q | 1.81 | 1.63 | 1.55 | <10.00% | <5.00% | <15.00% |
| Groundwater (shal aq) q (mm) | 489.86 | 321.71 | 341.04 | <34.00% | >6.00% | <30.00% |
| Groundwater (deep aq) q (mm) | 25.79 | 16.82 | 0.00 | <35.00% | <100.00% | <100.00% |
| Revap (shal aq soil/plants) (mm) | 43.51 | 28.67 | 28.54 | <34.00% | <0.50% | <34.5% |
| Deep aq recharge (mm) | 25.78 | 16.94 | 0.00 | <34.00% | <100.00% | <100.00 |
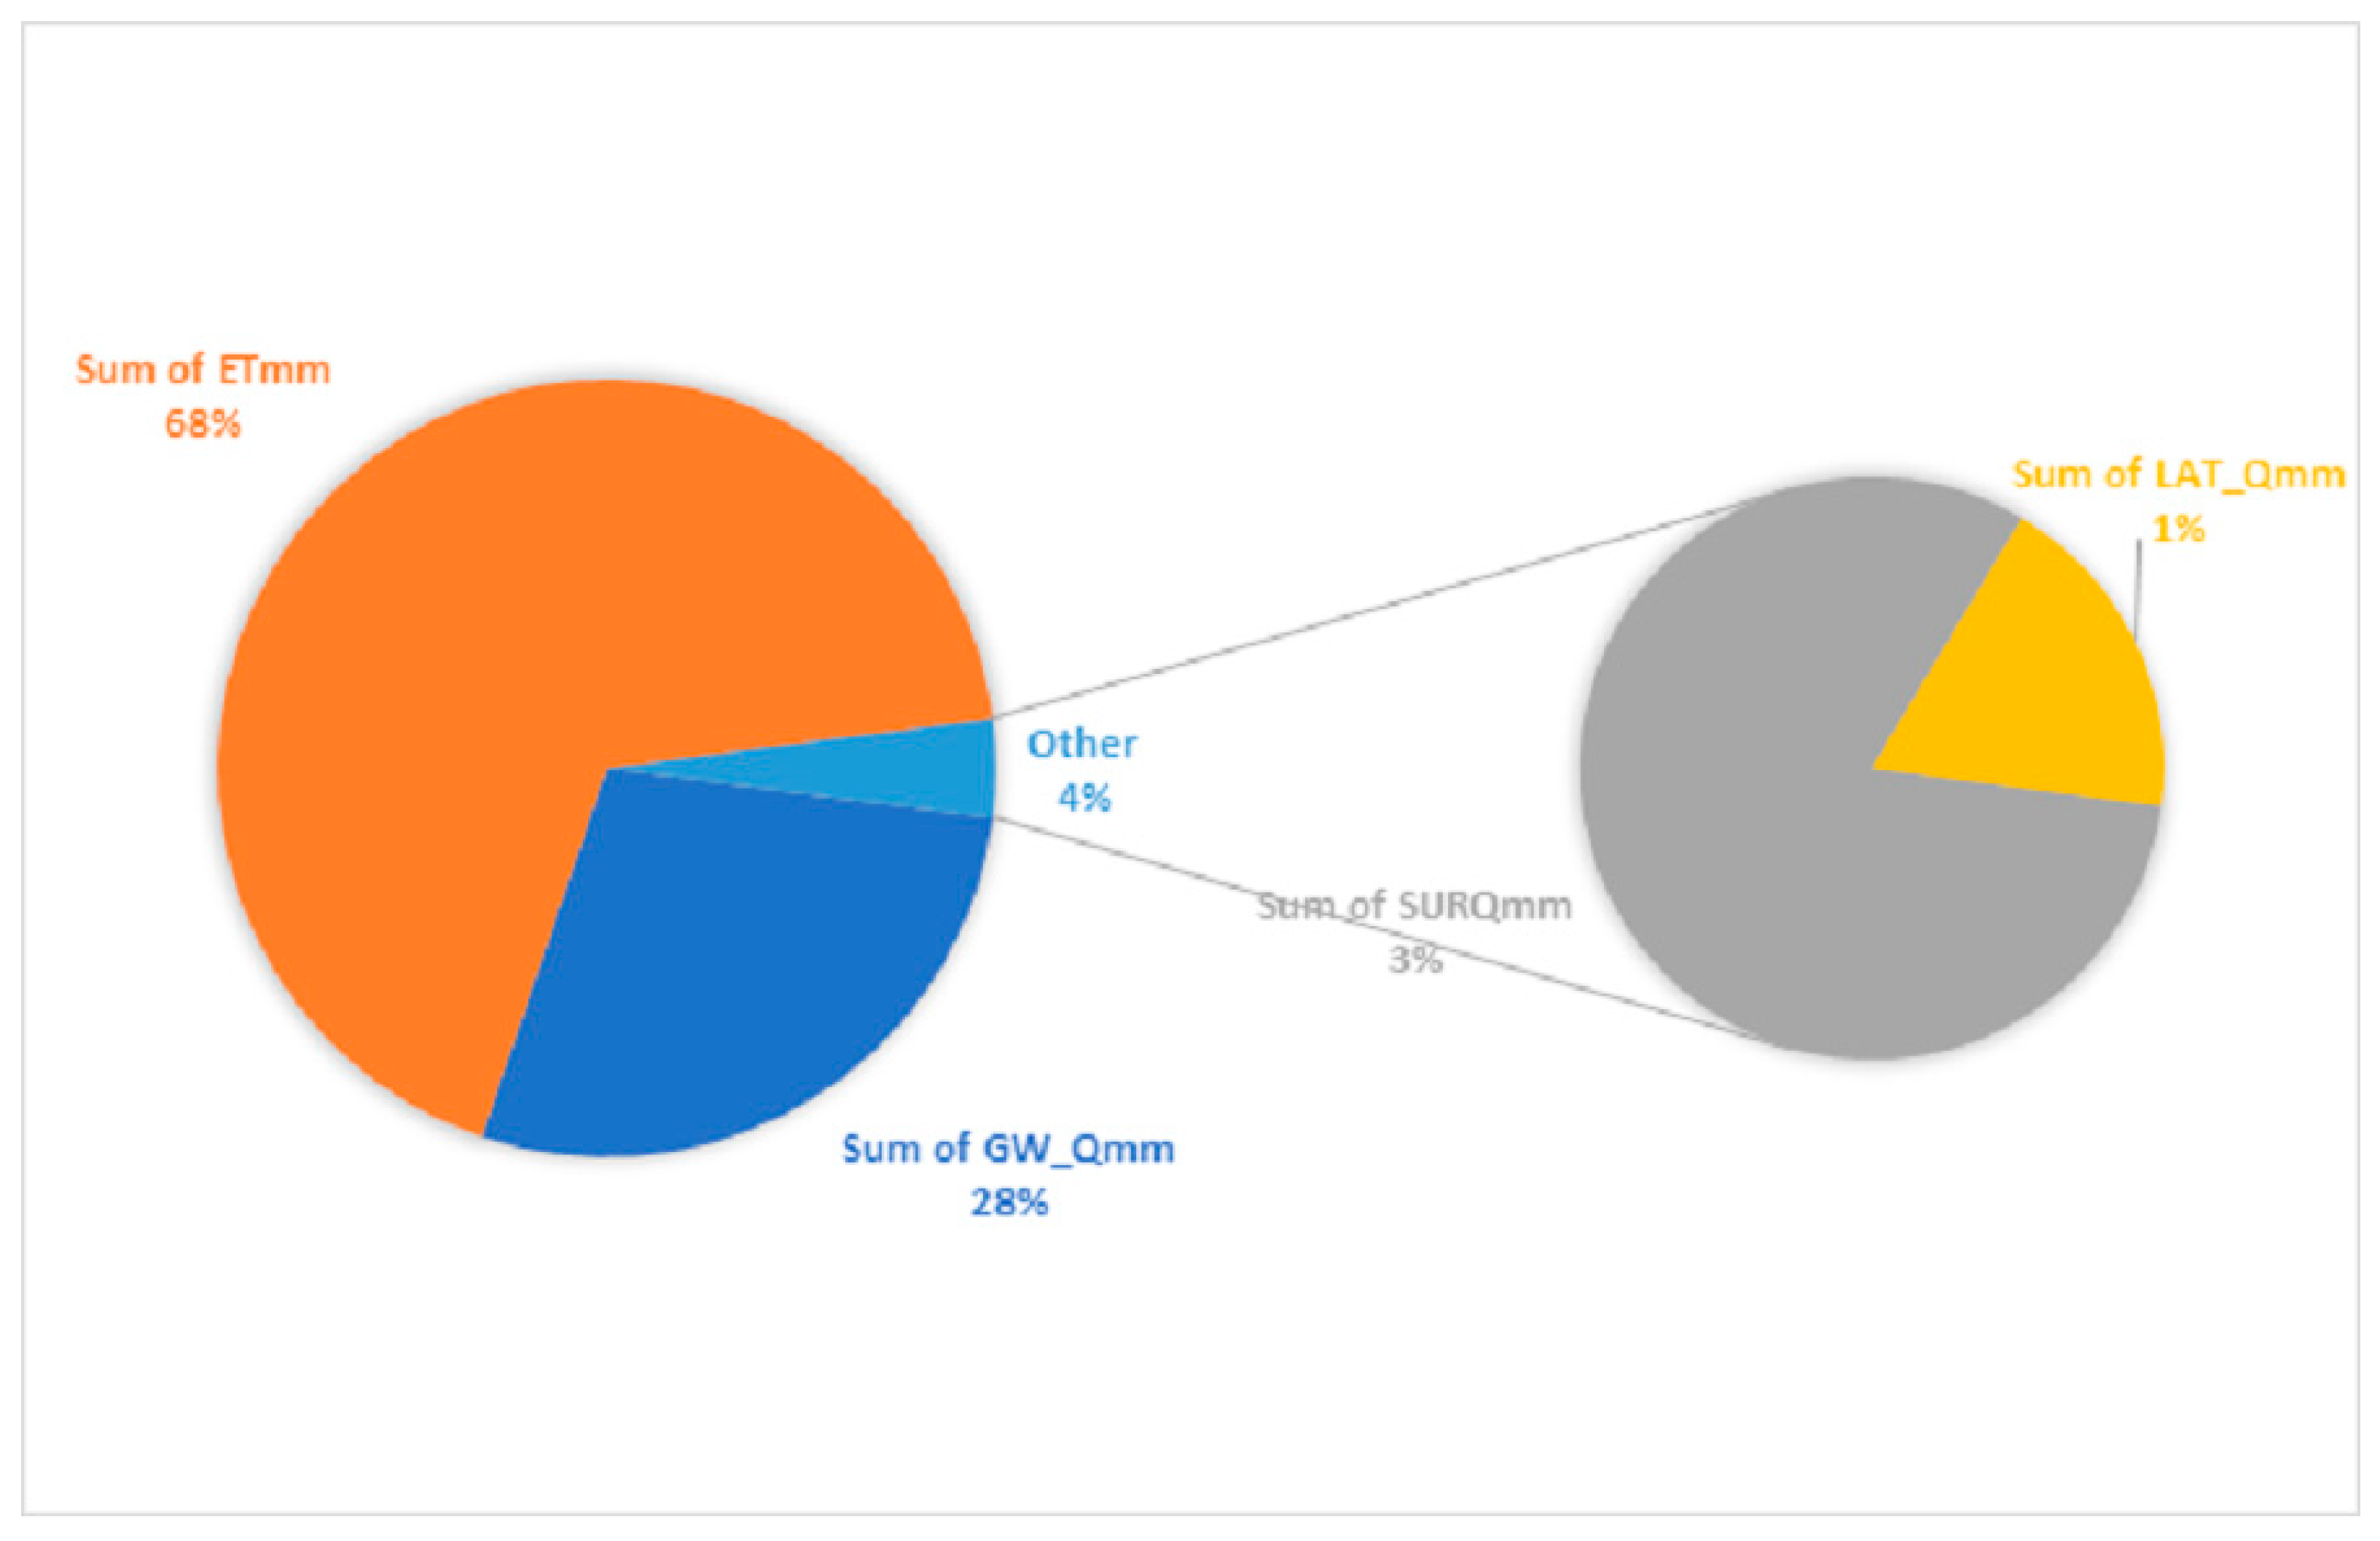
| Total aq recharge (mm) | 515.61 | 338.79 | 341.01 | <34.00% | >0.70% | <34.70% |
| Total water yld (mm) | 603.67 | 400.48 | 387.27 | <34.00% | <3.3% | <37.30% |
| Percolation out of soil (mm) | 513.02 | 351.43 | 338.37 | <31.00% | <3.70% | <34.70 |
| ET (mm) | 624.10 | 785.40 | 796.30 | >21.00% | >1.40% | >22.40% |
| PET (mm) | 2196.60 | 2933.30 | 2860.90 | >25.00% | <2.50% | >23.00% |
Publisher’s Note: MDPI stays neutral with regard to jurisdictional claims in published maps and institutional affiliations. |
© 2022 by the authors. Licensee MDPI, Basel, Switzerland. This article is an open access article distributed under the terms and conditions of the Creative Commons Attribution (CC BY) license (https://creativecommons.org/licenses/by/4.0/).
Share and Cite
Daramola, J.; Adepehin, E.J.; Ekhwan, T.M.; Choy, L.K.; Mokhtar, J.; Tabiti, T.S. Impacts of Land-Use Change, Associated Land-Use Area and Runoff on Watershed Sediment Yield: Implications from the Kaduna Watershed. Water 2022, 14, 325. https://doi.org/10.3390/w14030325
Daramola J, Adepehin EJ, Ekhwan TM, Choy LK, Mokhtar J, Tabiti TS. Impacts of Land-Use Change, Associated Land-Use Area and Runoff on Watershed Sediment Yield: Implications from the Kaduna Watershed. Water. 2022; 14(3):325. https://doi.org/10.3390/w14030325
Chicago/Turabian StyleDaramola, Japheth, Ekundayo J. Adepehin, Toriman M. Ekhwan, Lam K. Choy, Jaafar Mokhtar, and Tabiti S. Tabiti. 2022. "Impacts of Land-Use Change, Associated Land-Use Area and Runoff on Watershed Sediment Yield: Implications from the Kaduna Watershed" Water 14, no. 3: 325. https://doi.org/10.3390/w14030325
APA StyleDaramola, J., Adepehin, E. J., Ekhwan, T. M., Choy, L. K., Mokhtar, J., & Tabiti, T. S. (2022). Impacts of Land-Use Change, Associated Land-Use Area and Runoff on Watershed Sediment Yield: Implications from the Kaduna Watershed. Water, 14(3), 325. https://doi.org/10.3390/w14030325