
Water Quality Characteristics and Source Analysis of Pollutants in the Maotiao River Basin (SW China)


Abstract
:1. Introduction
2. Materials and Methods
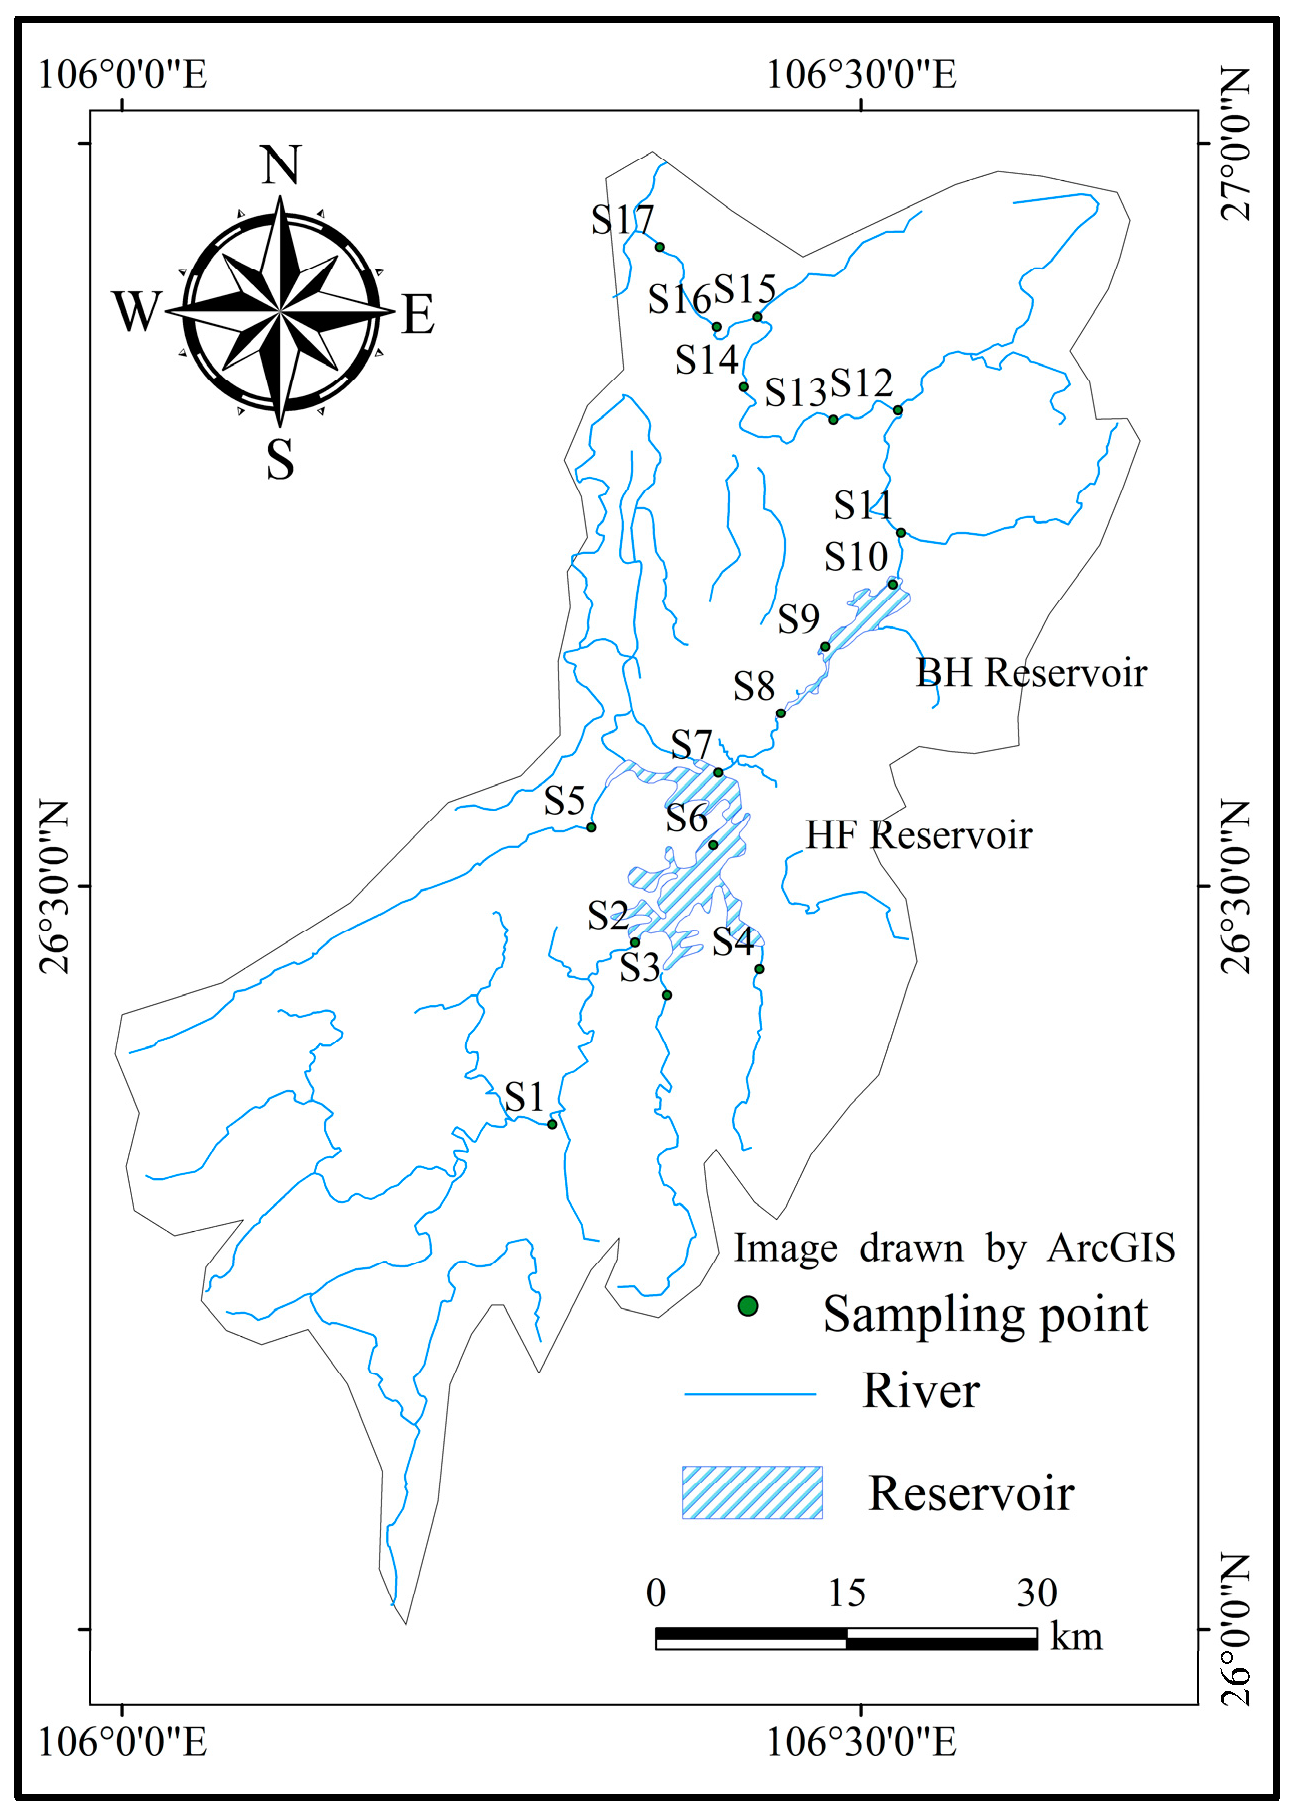
2.1. Study Area
2.2. Sampling and Analysis
2.3. Statistical Analysis Method
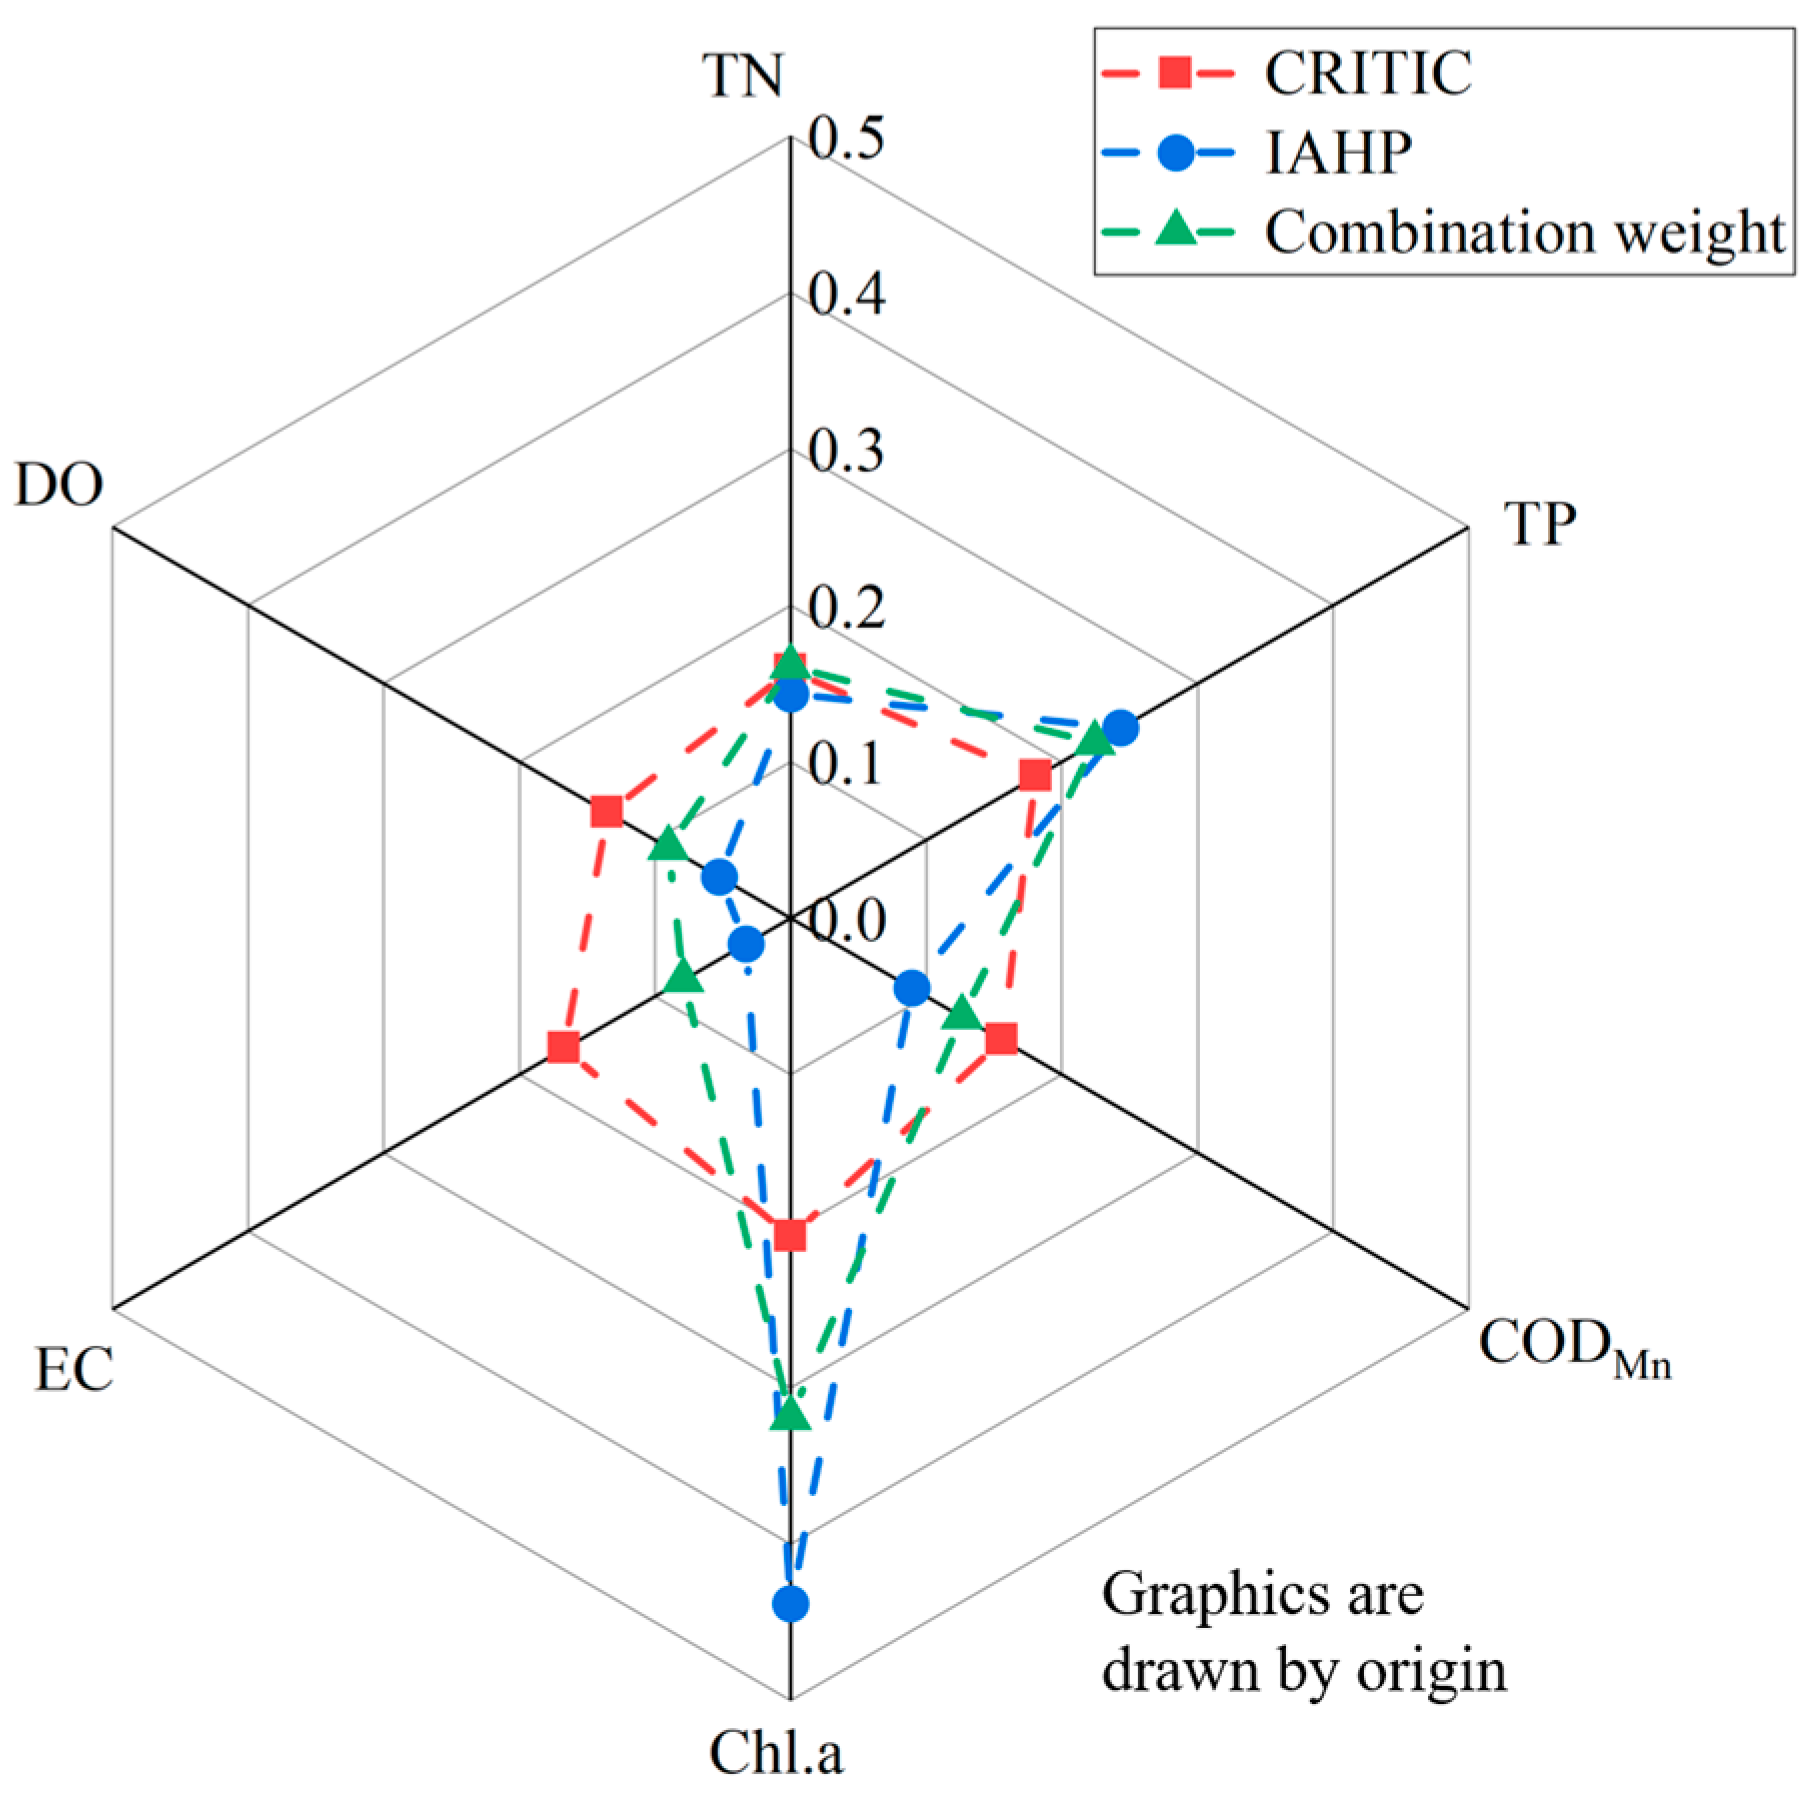
2.3.1. Weight Calculation
2.3.2. Fuzzy Matter-Element–VIKOR Model
2.3.3. Geodetector Model
3. Results
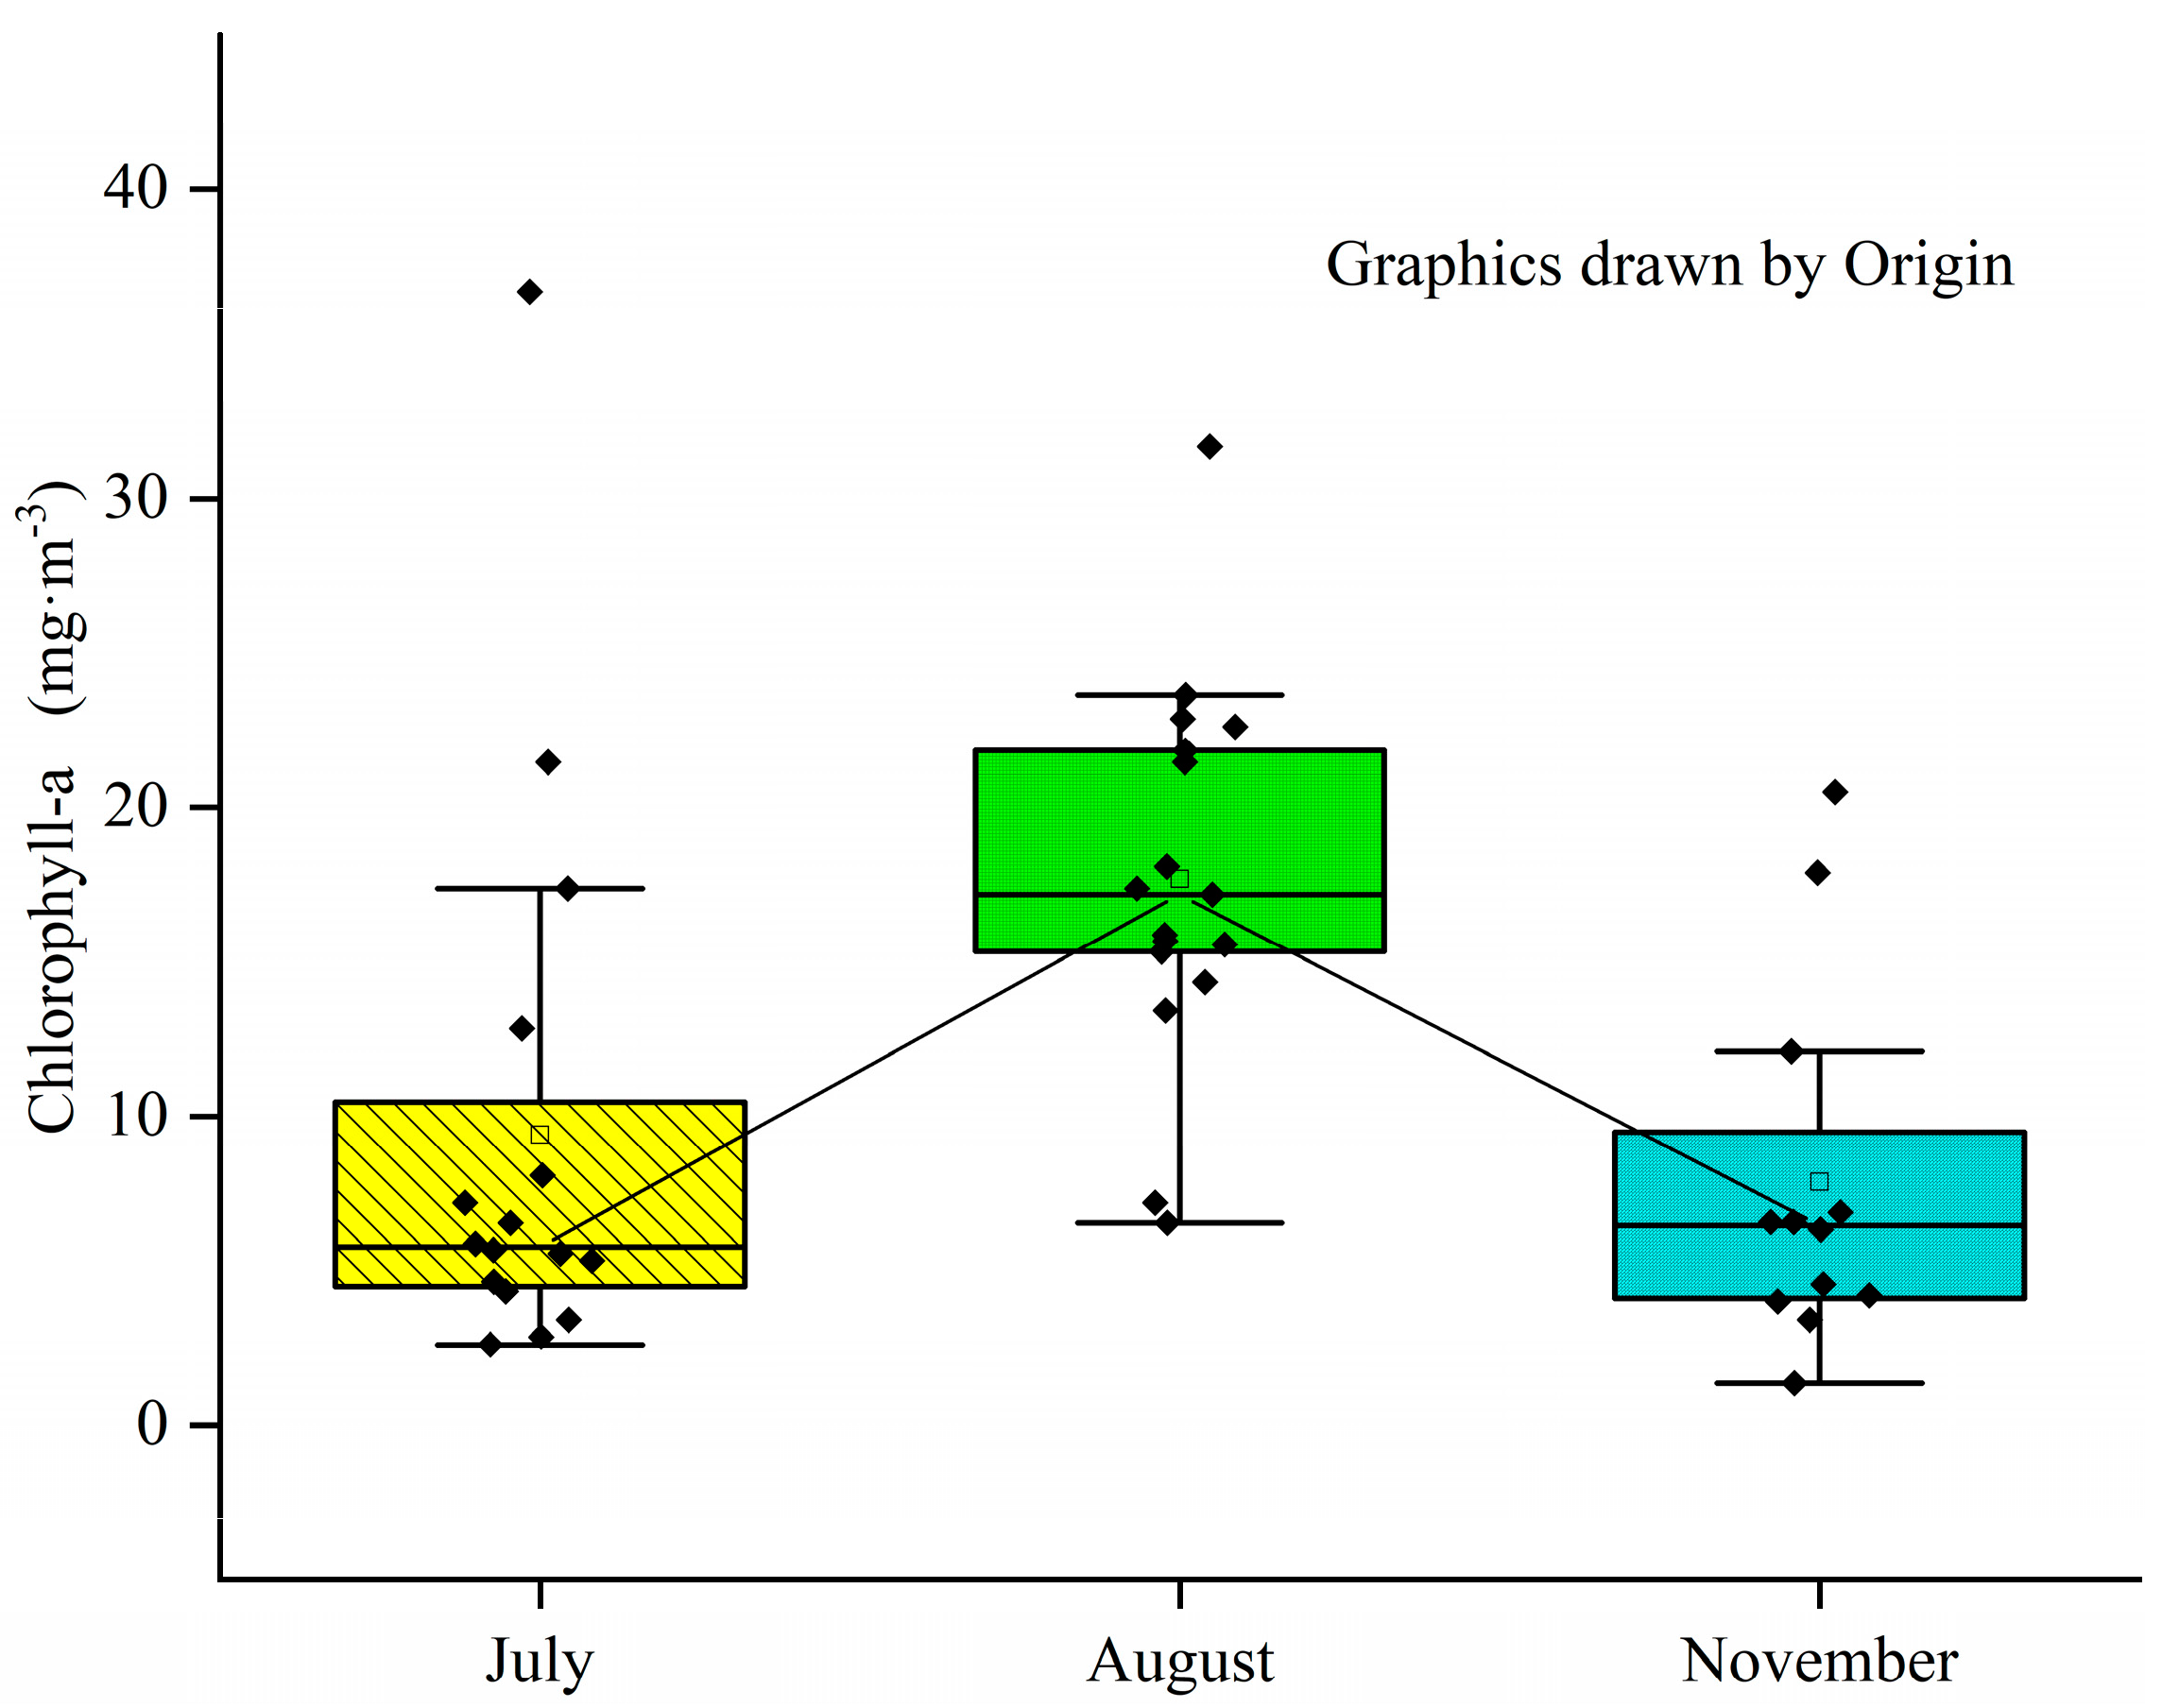
3.1. Spatiotemporal Characteristics of Water Quality Parameters
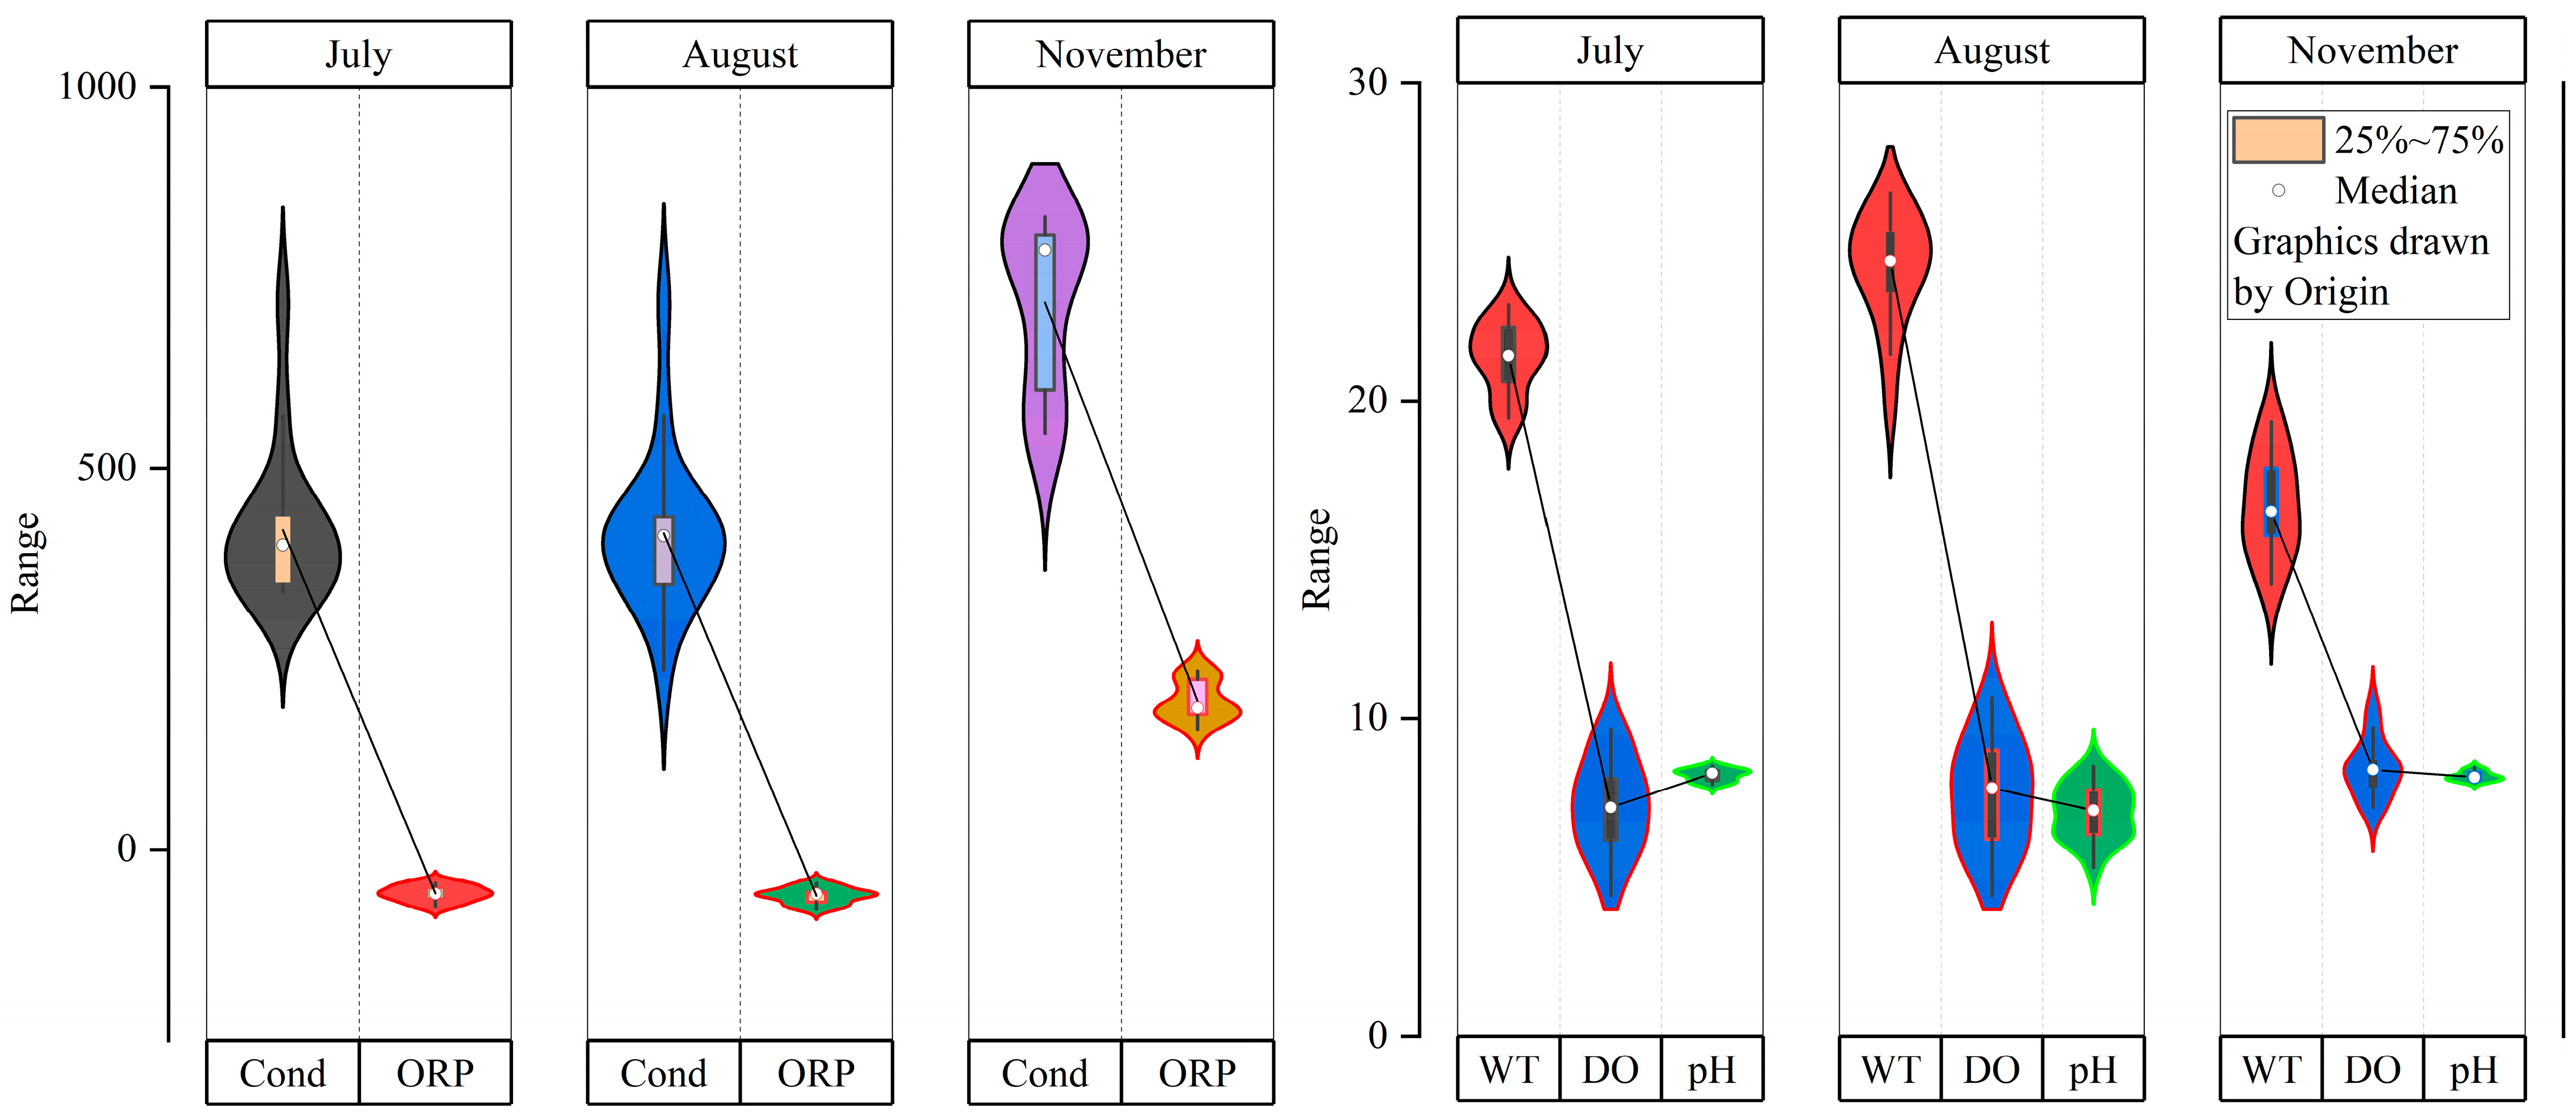
3.1.1. Physical Parameters
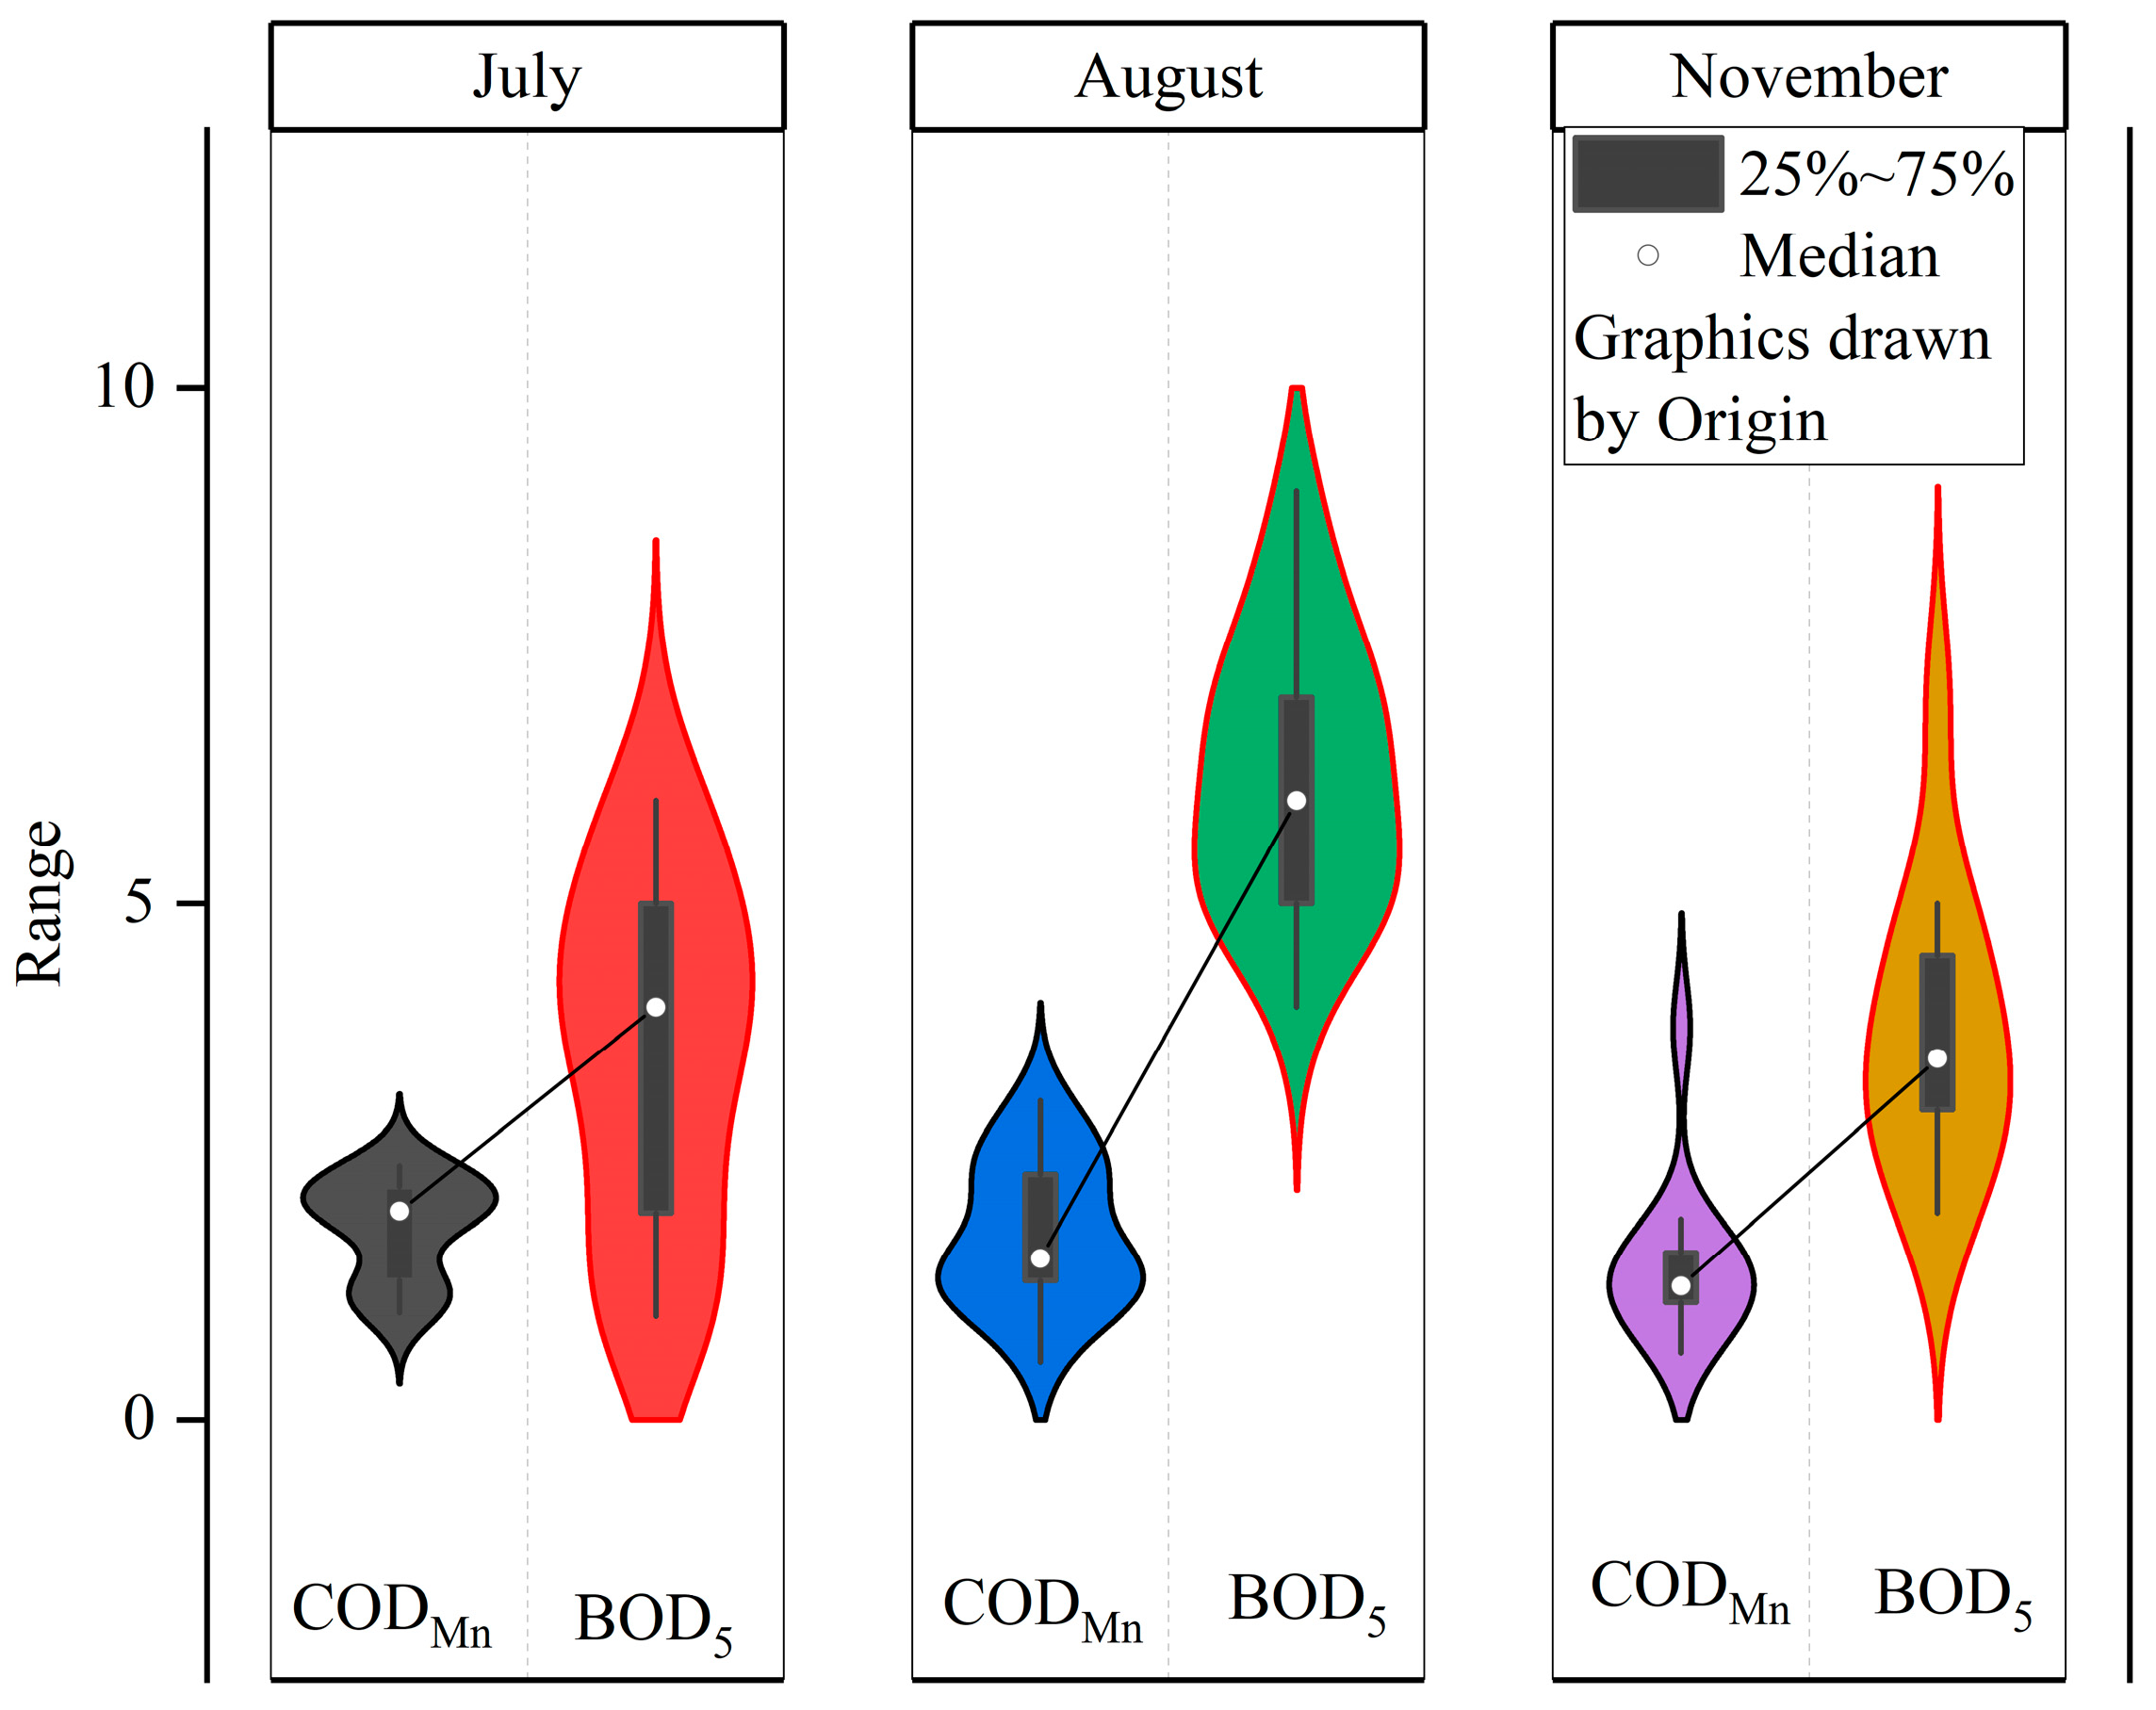
3.1.2. Particulate and Dissolved Organic Material
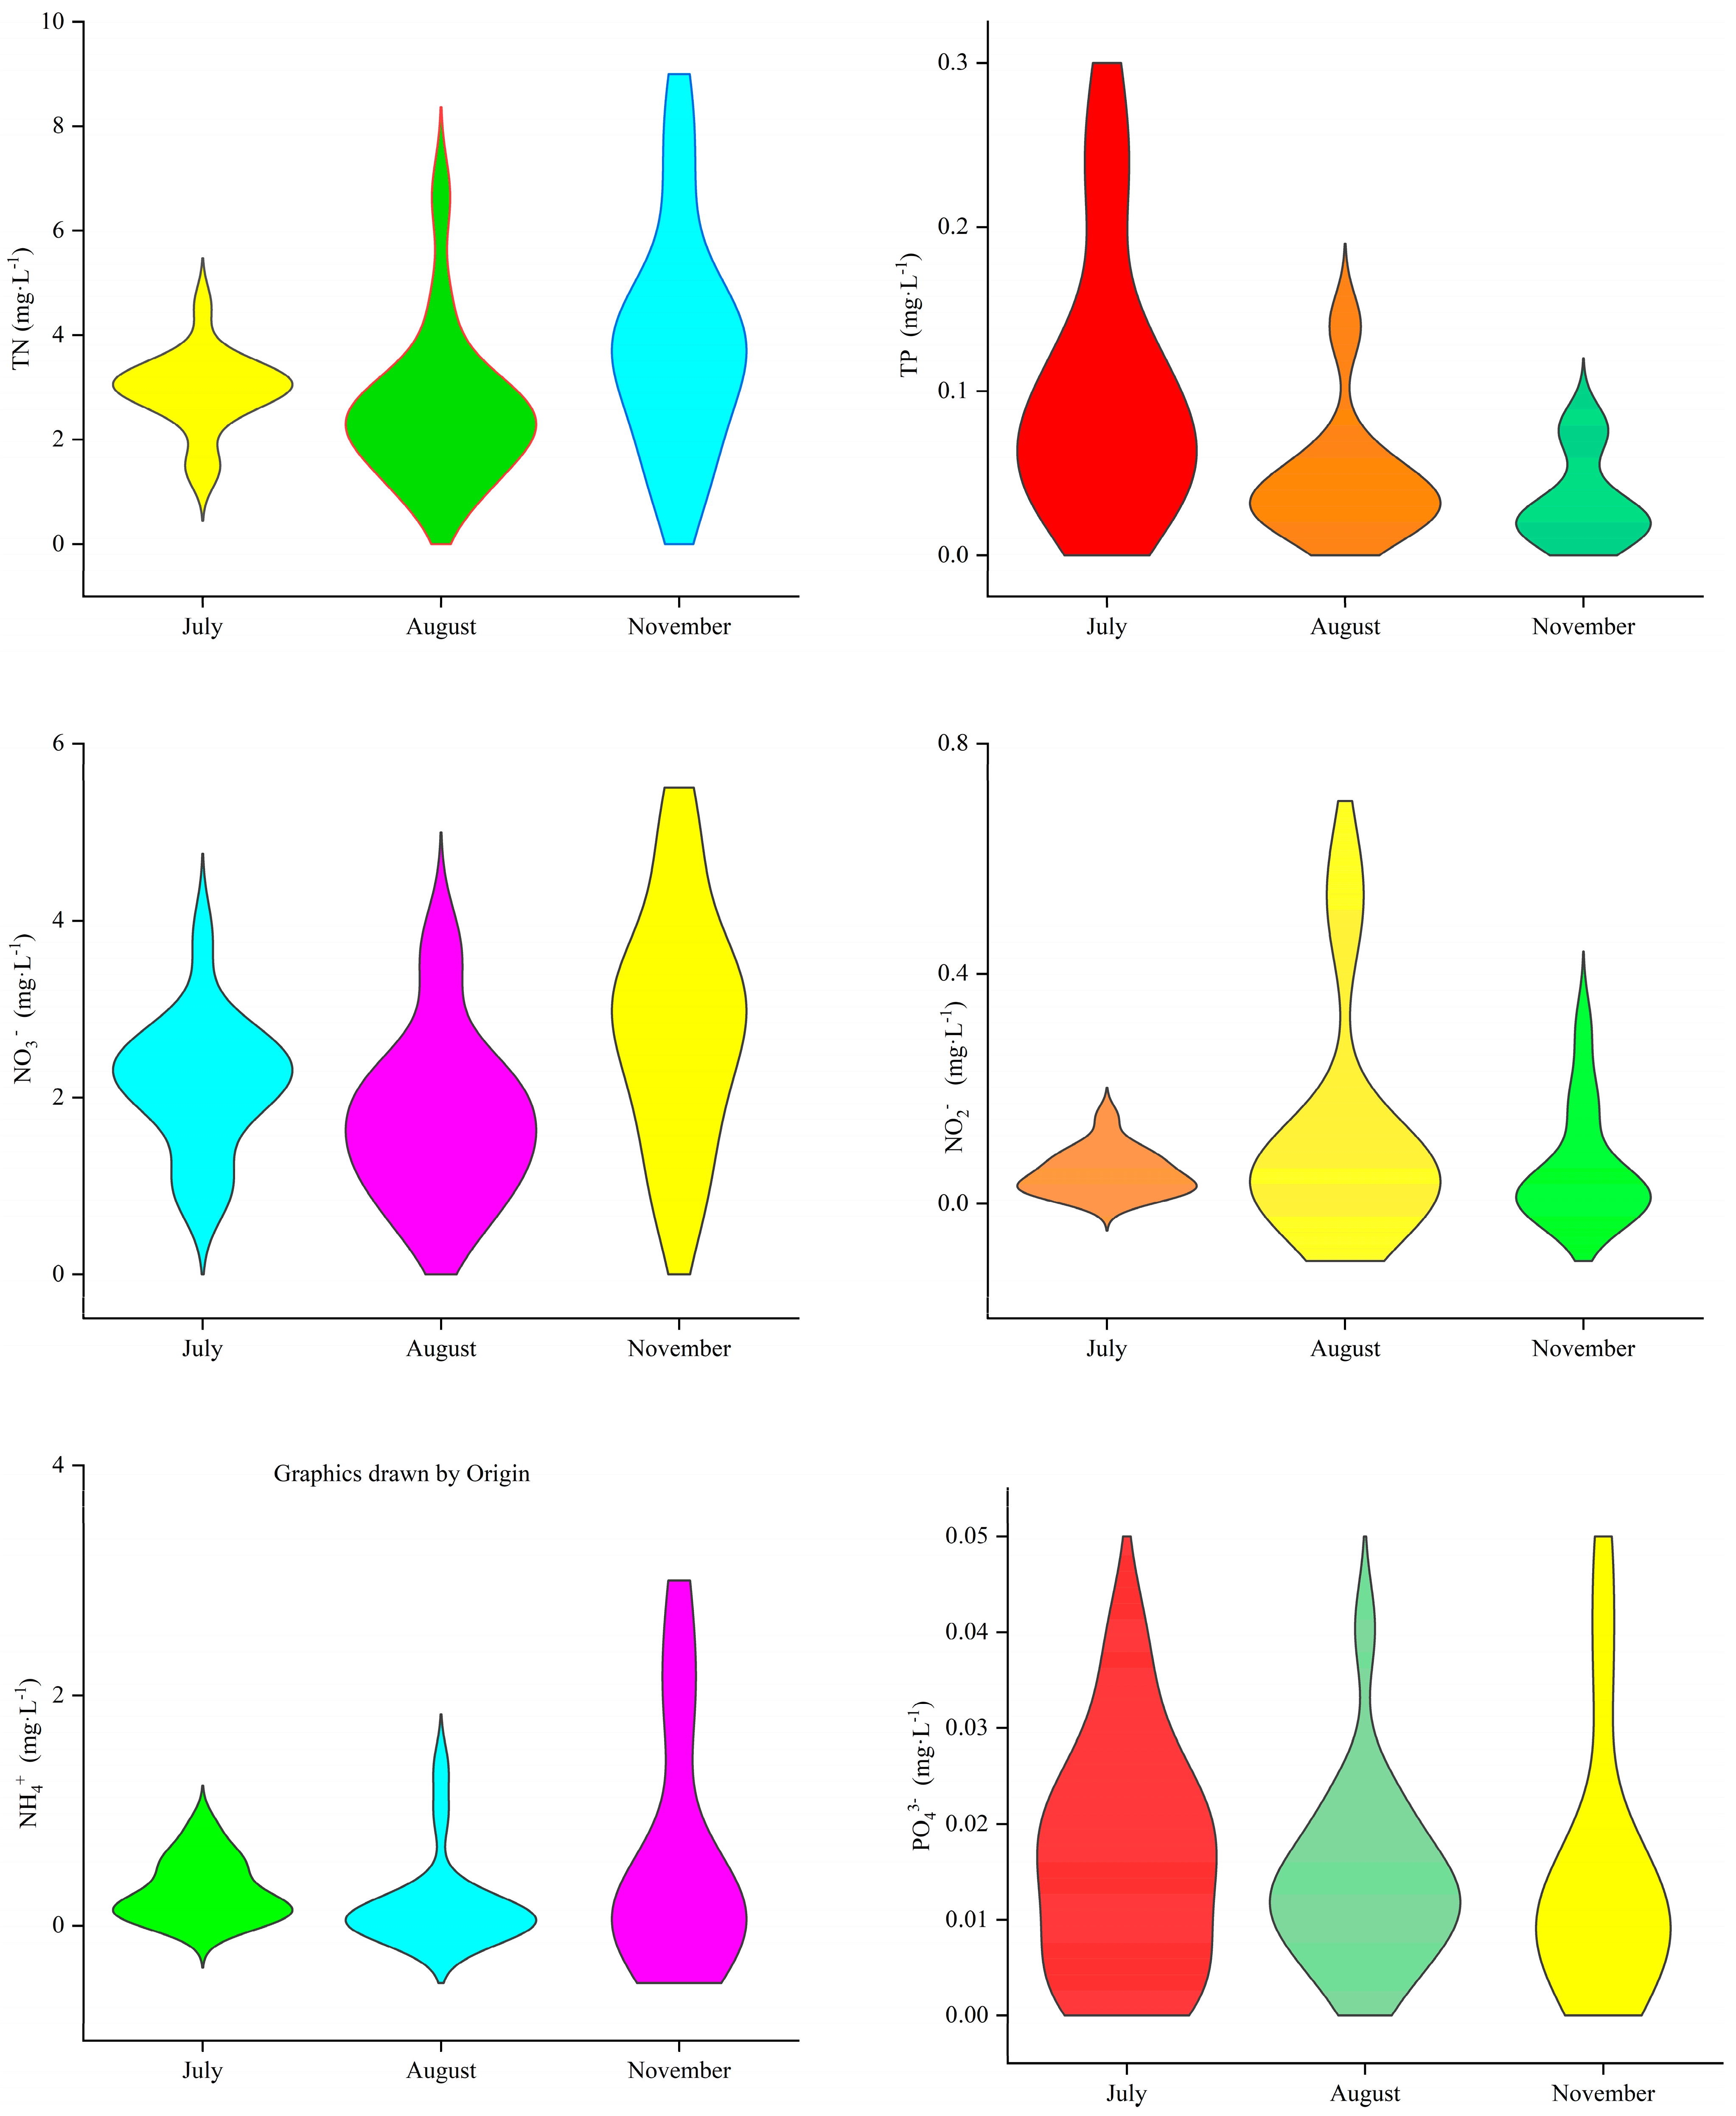
3.1.3. Nutrients
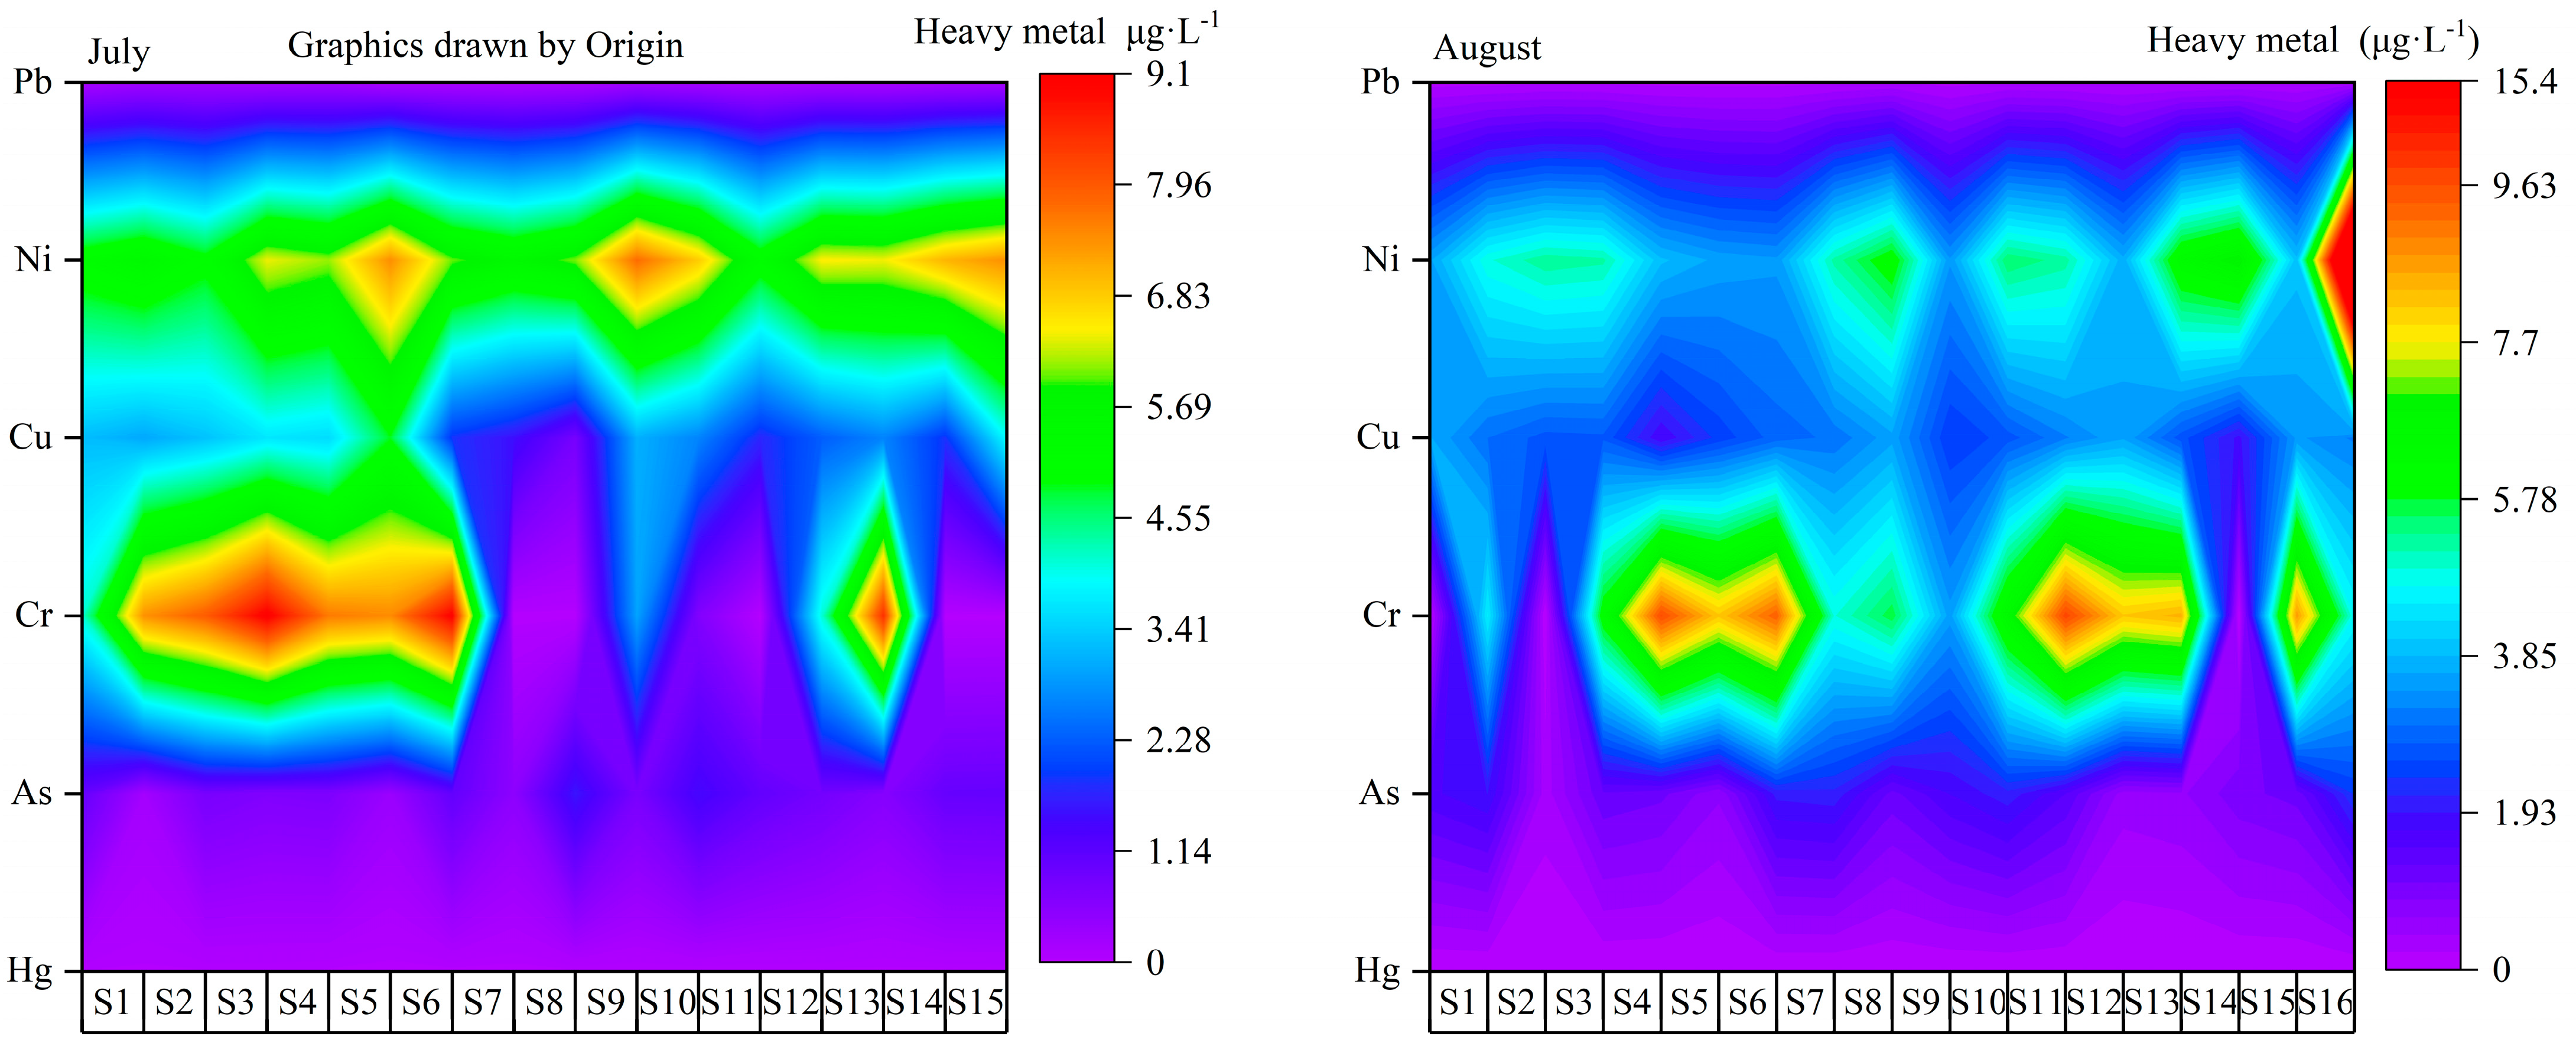
3.1.4. Heavy Metals
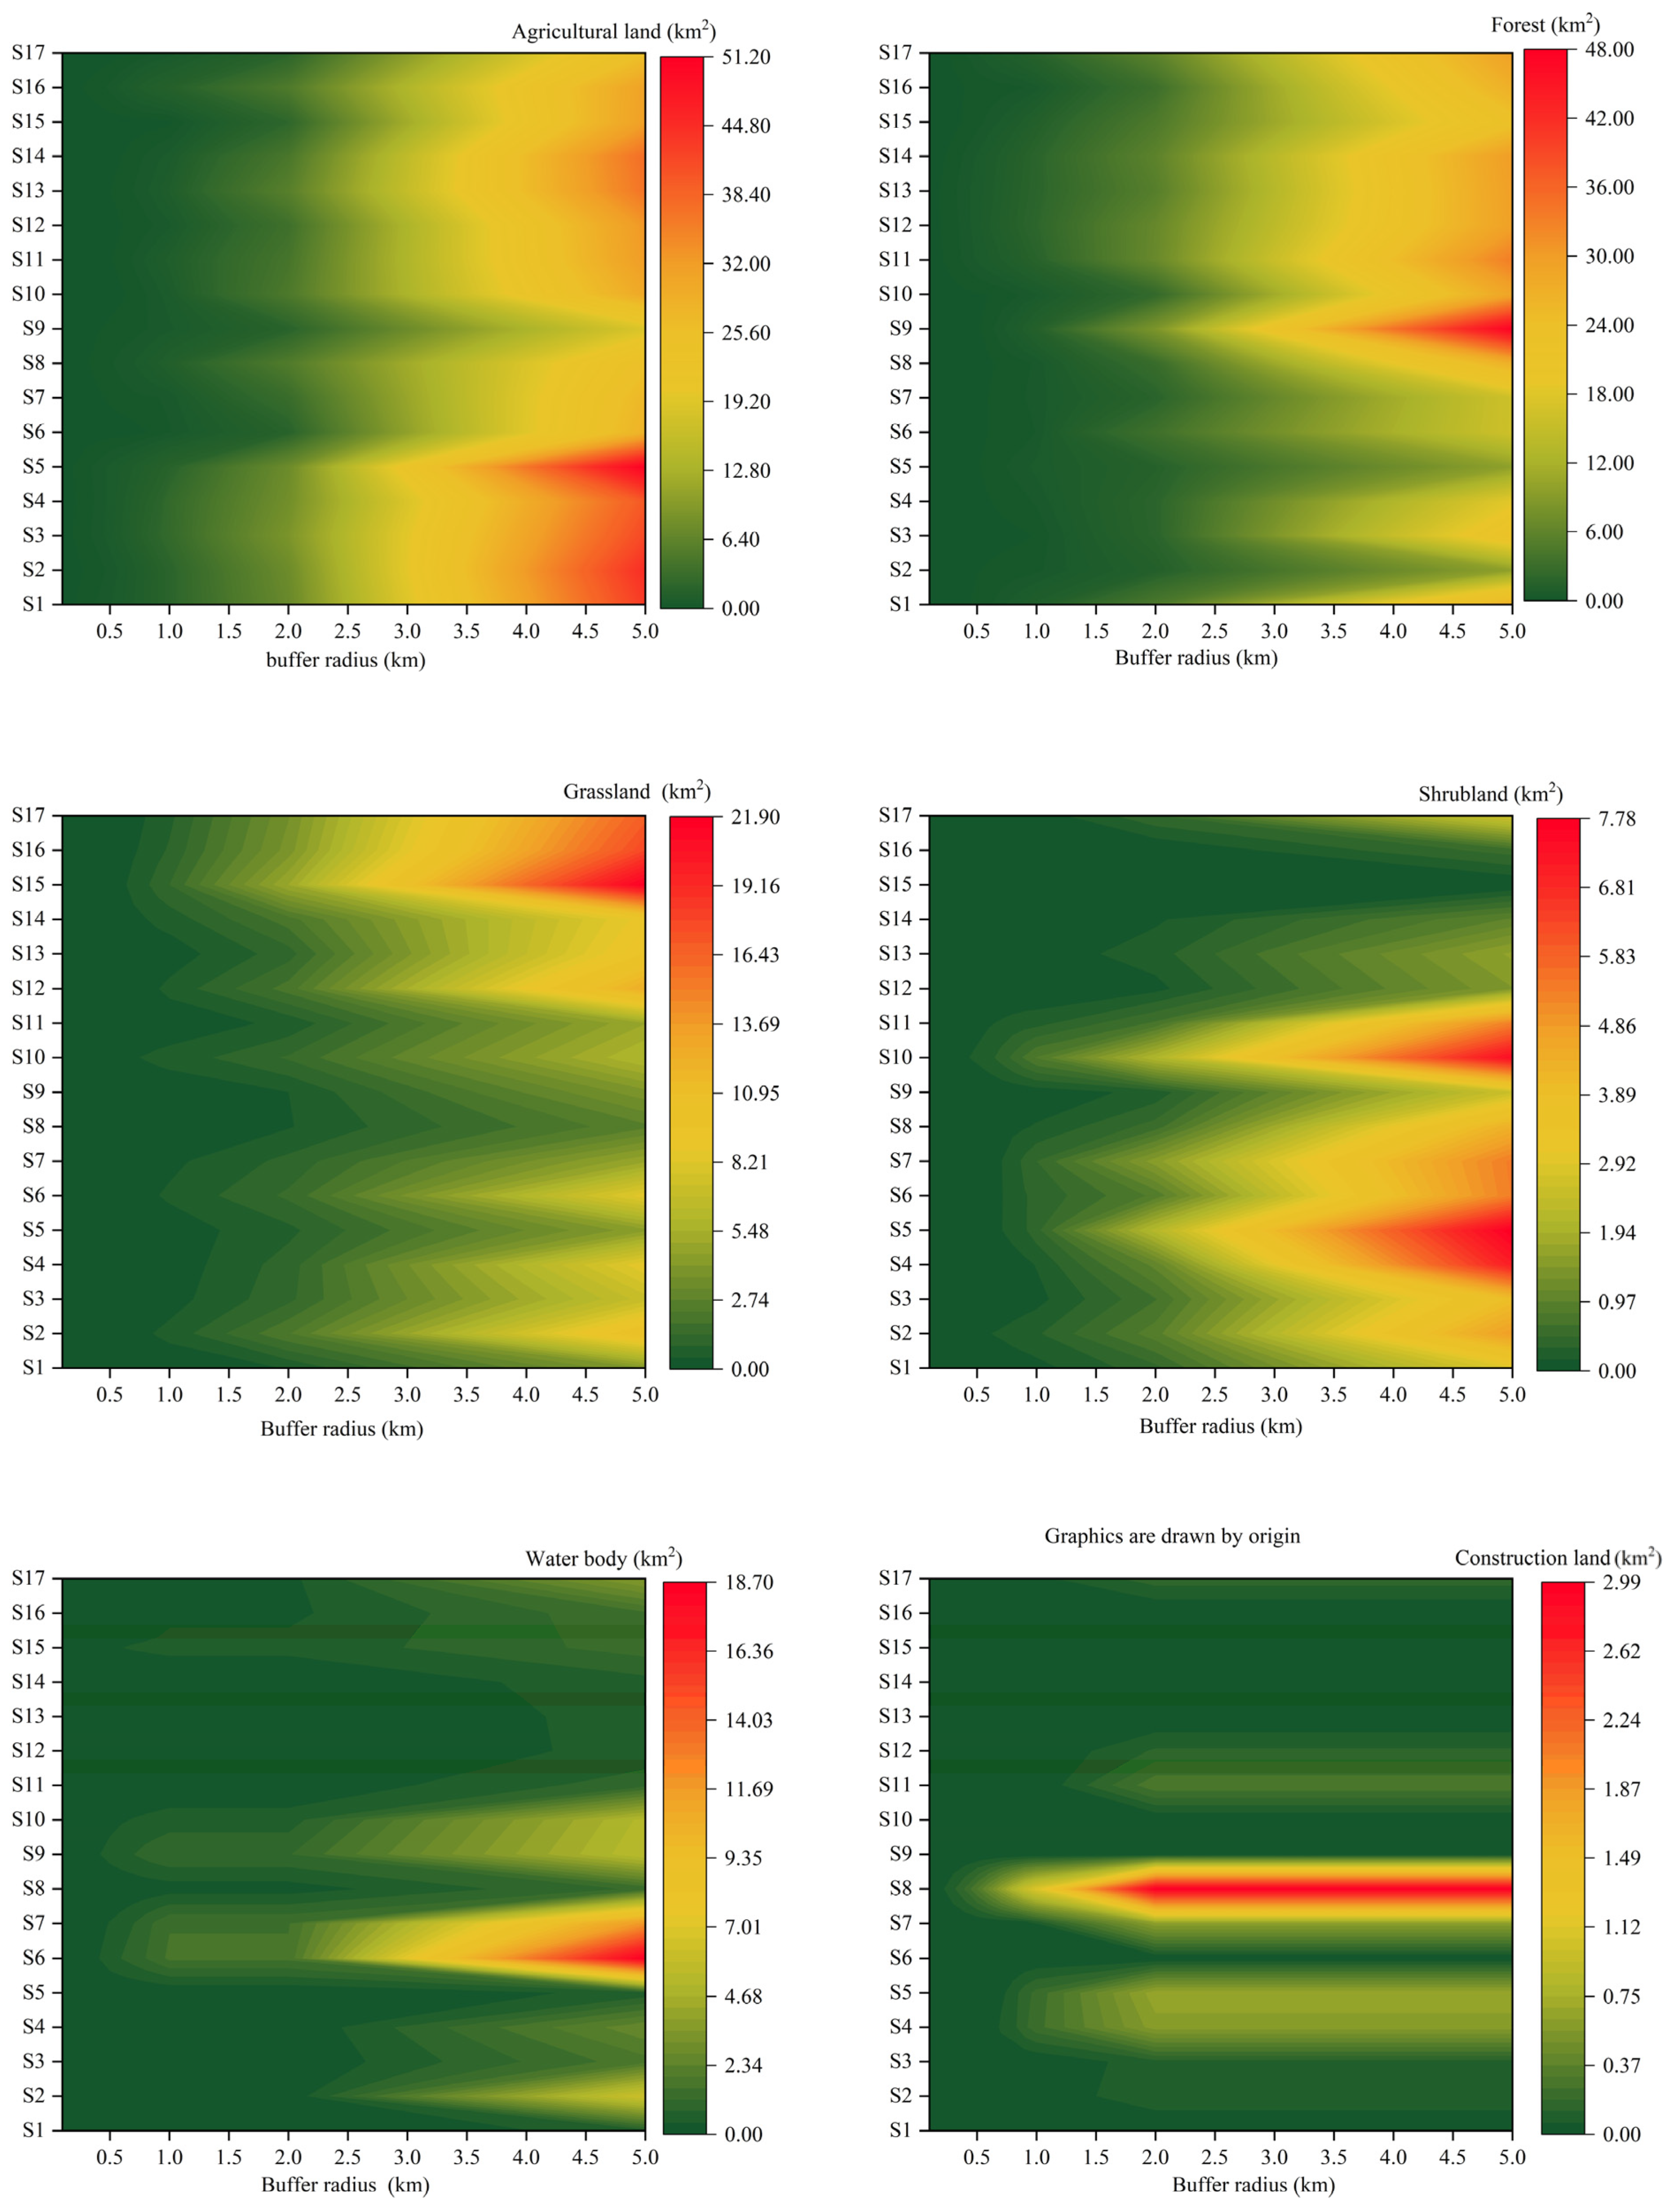
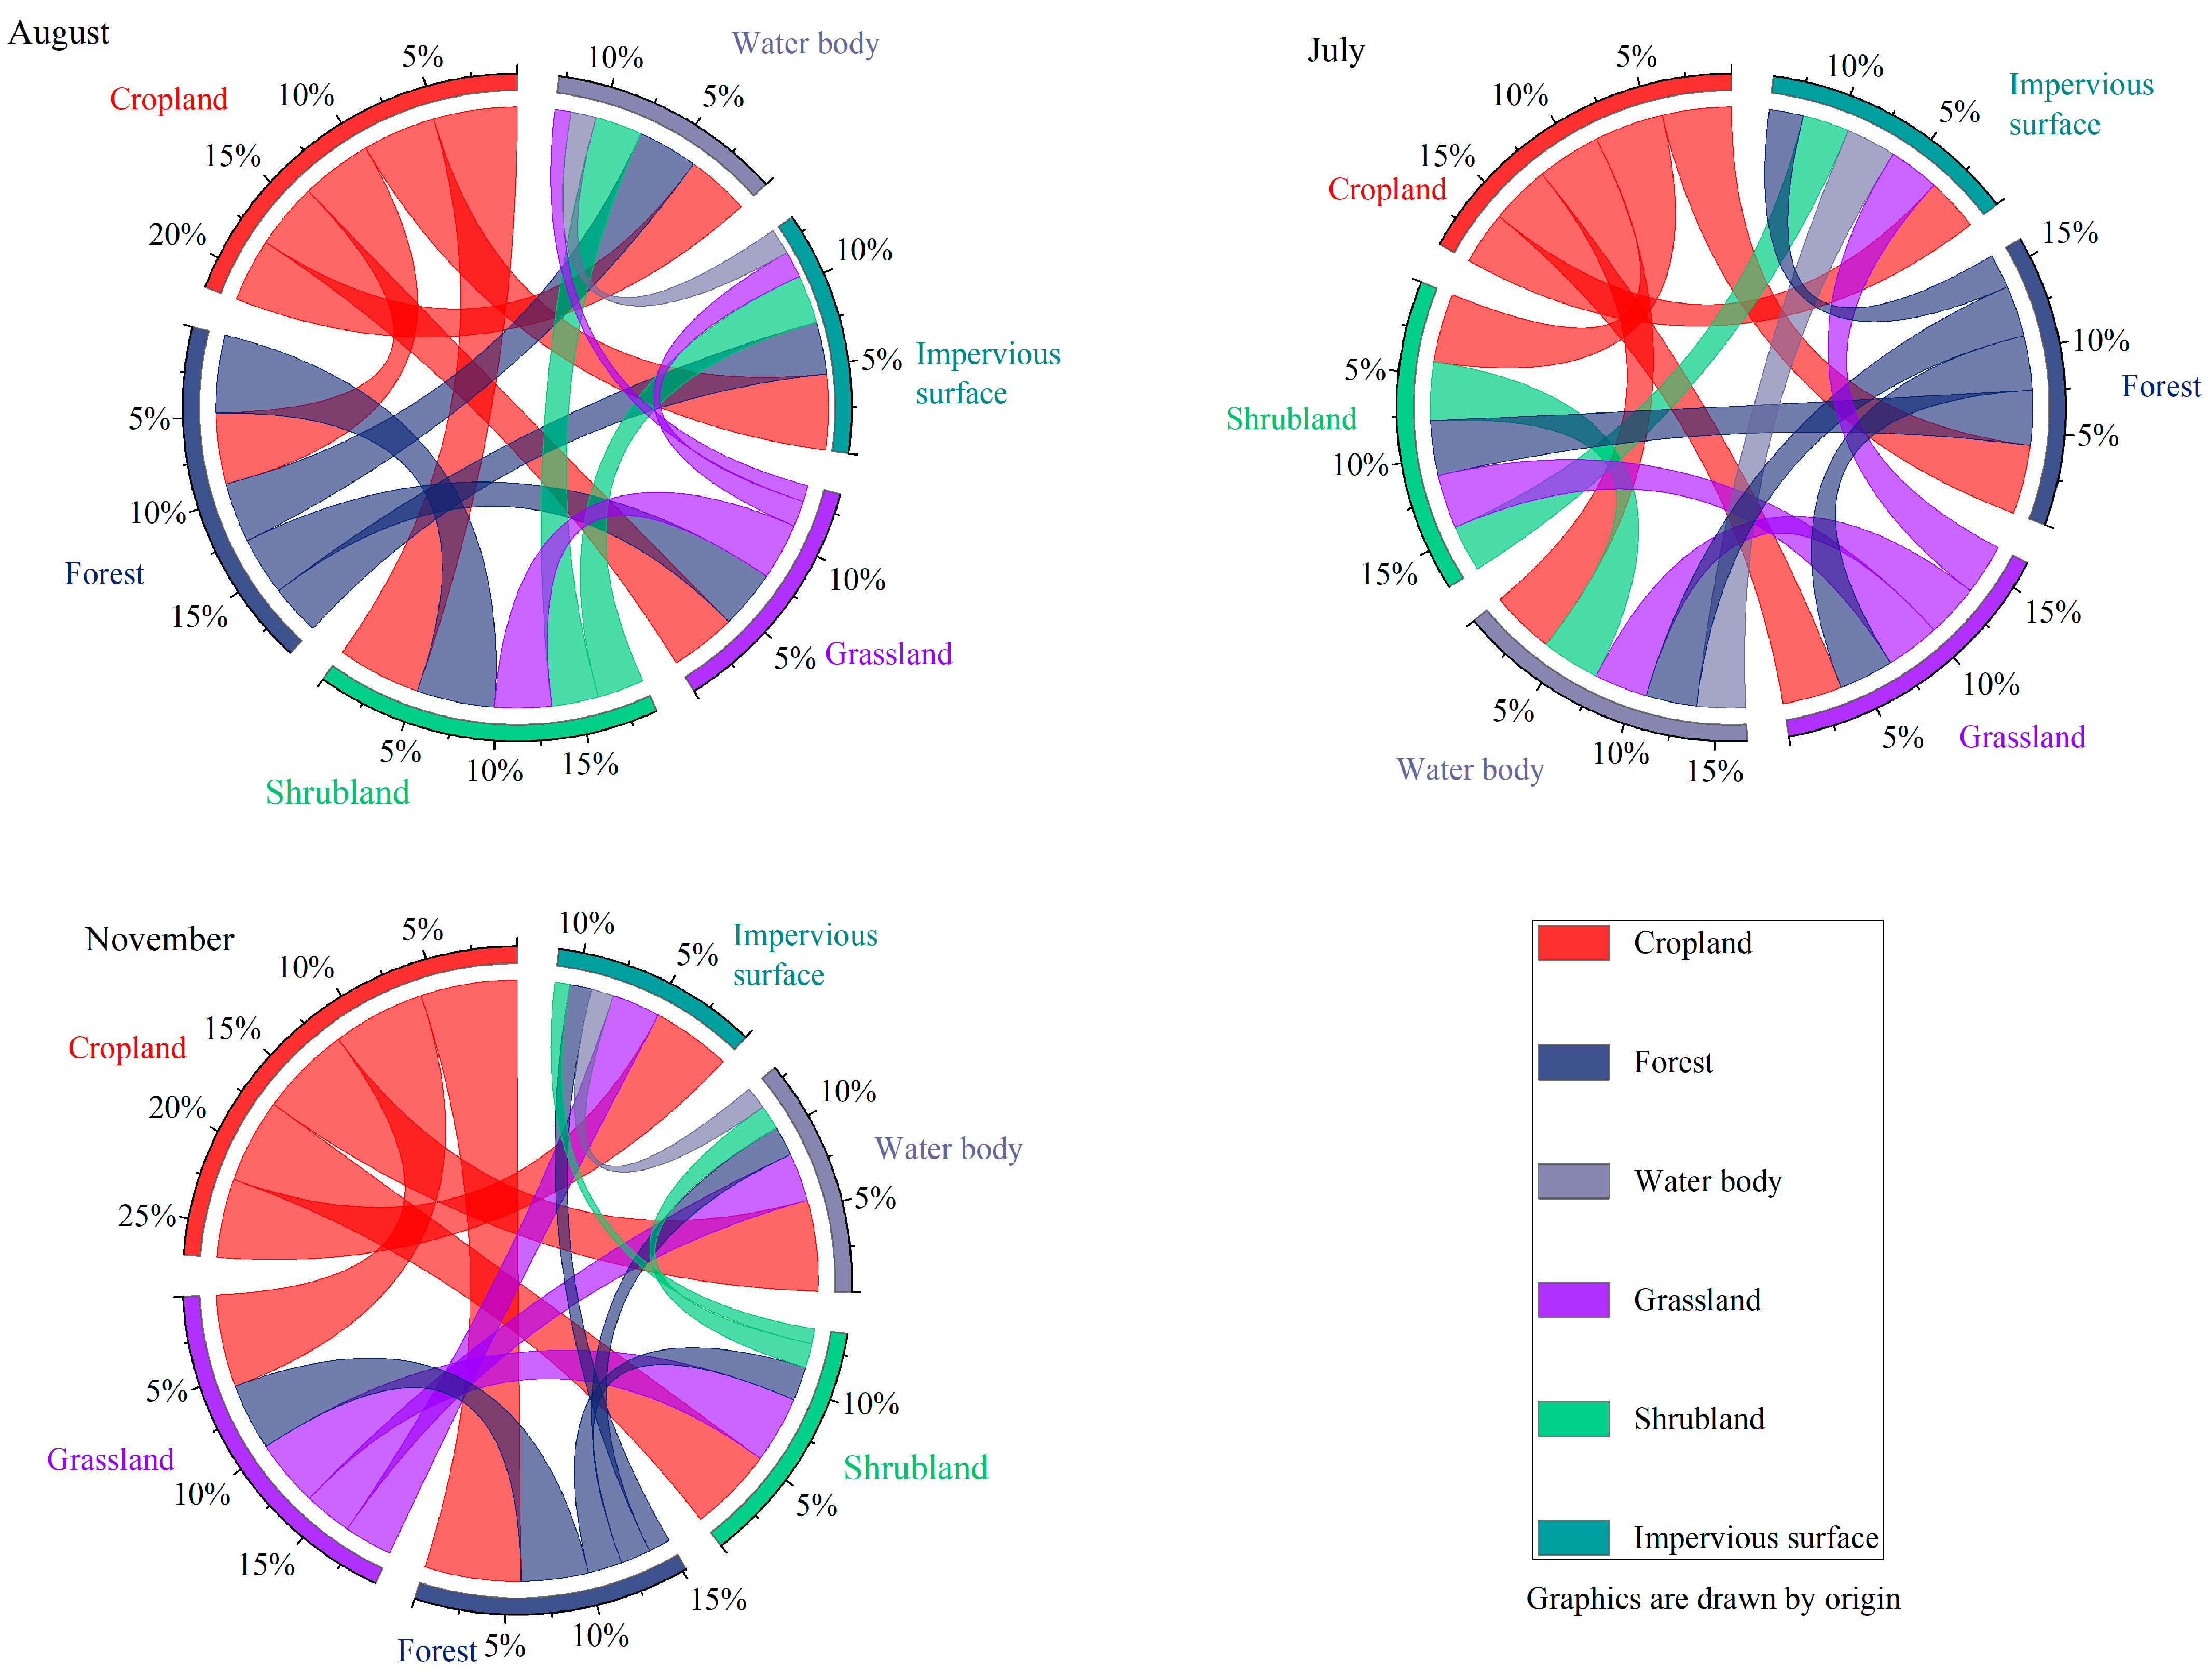
3.2. Spatial Distribution of Land Use Structures
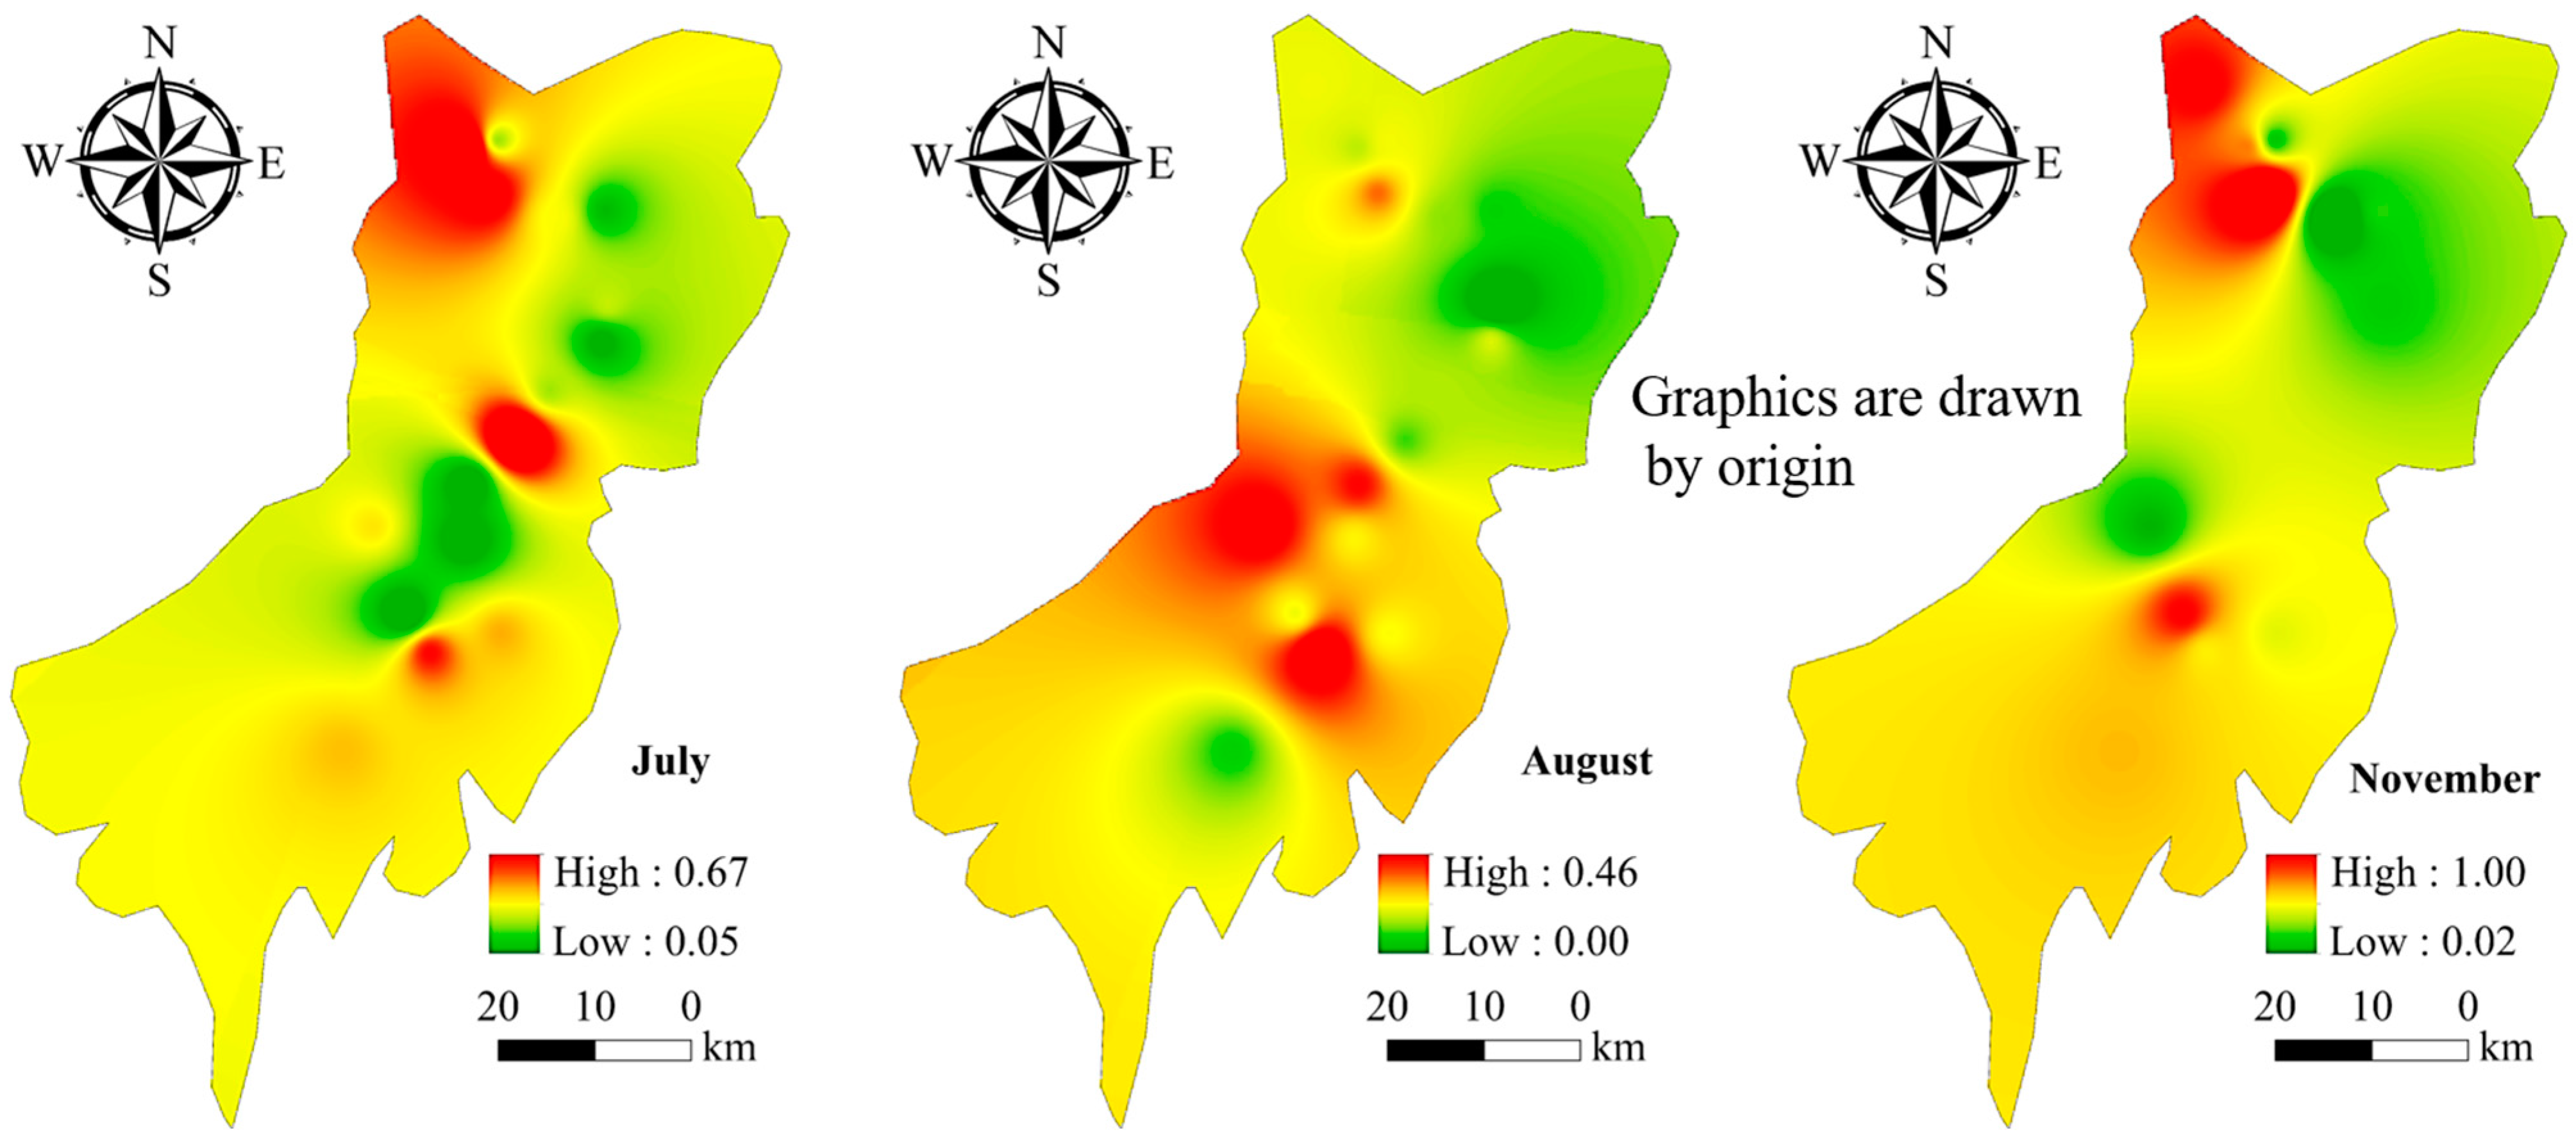
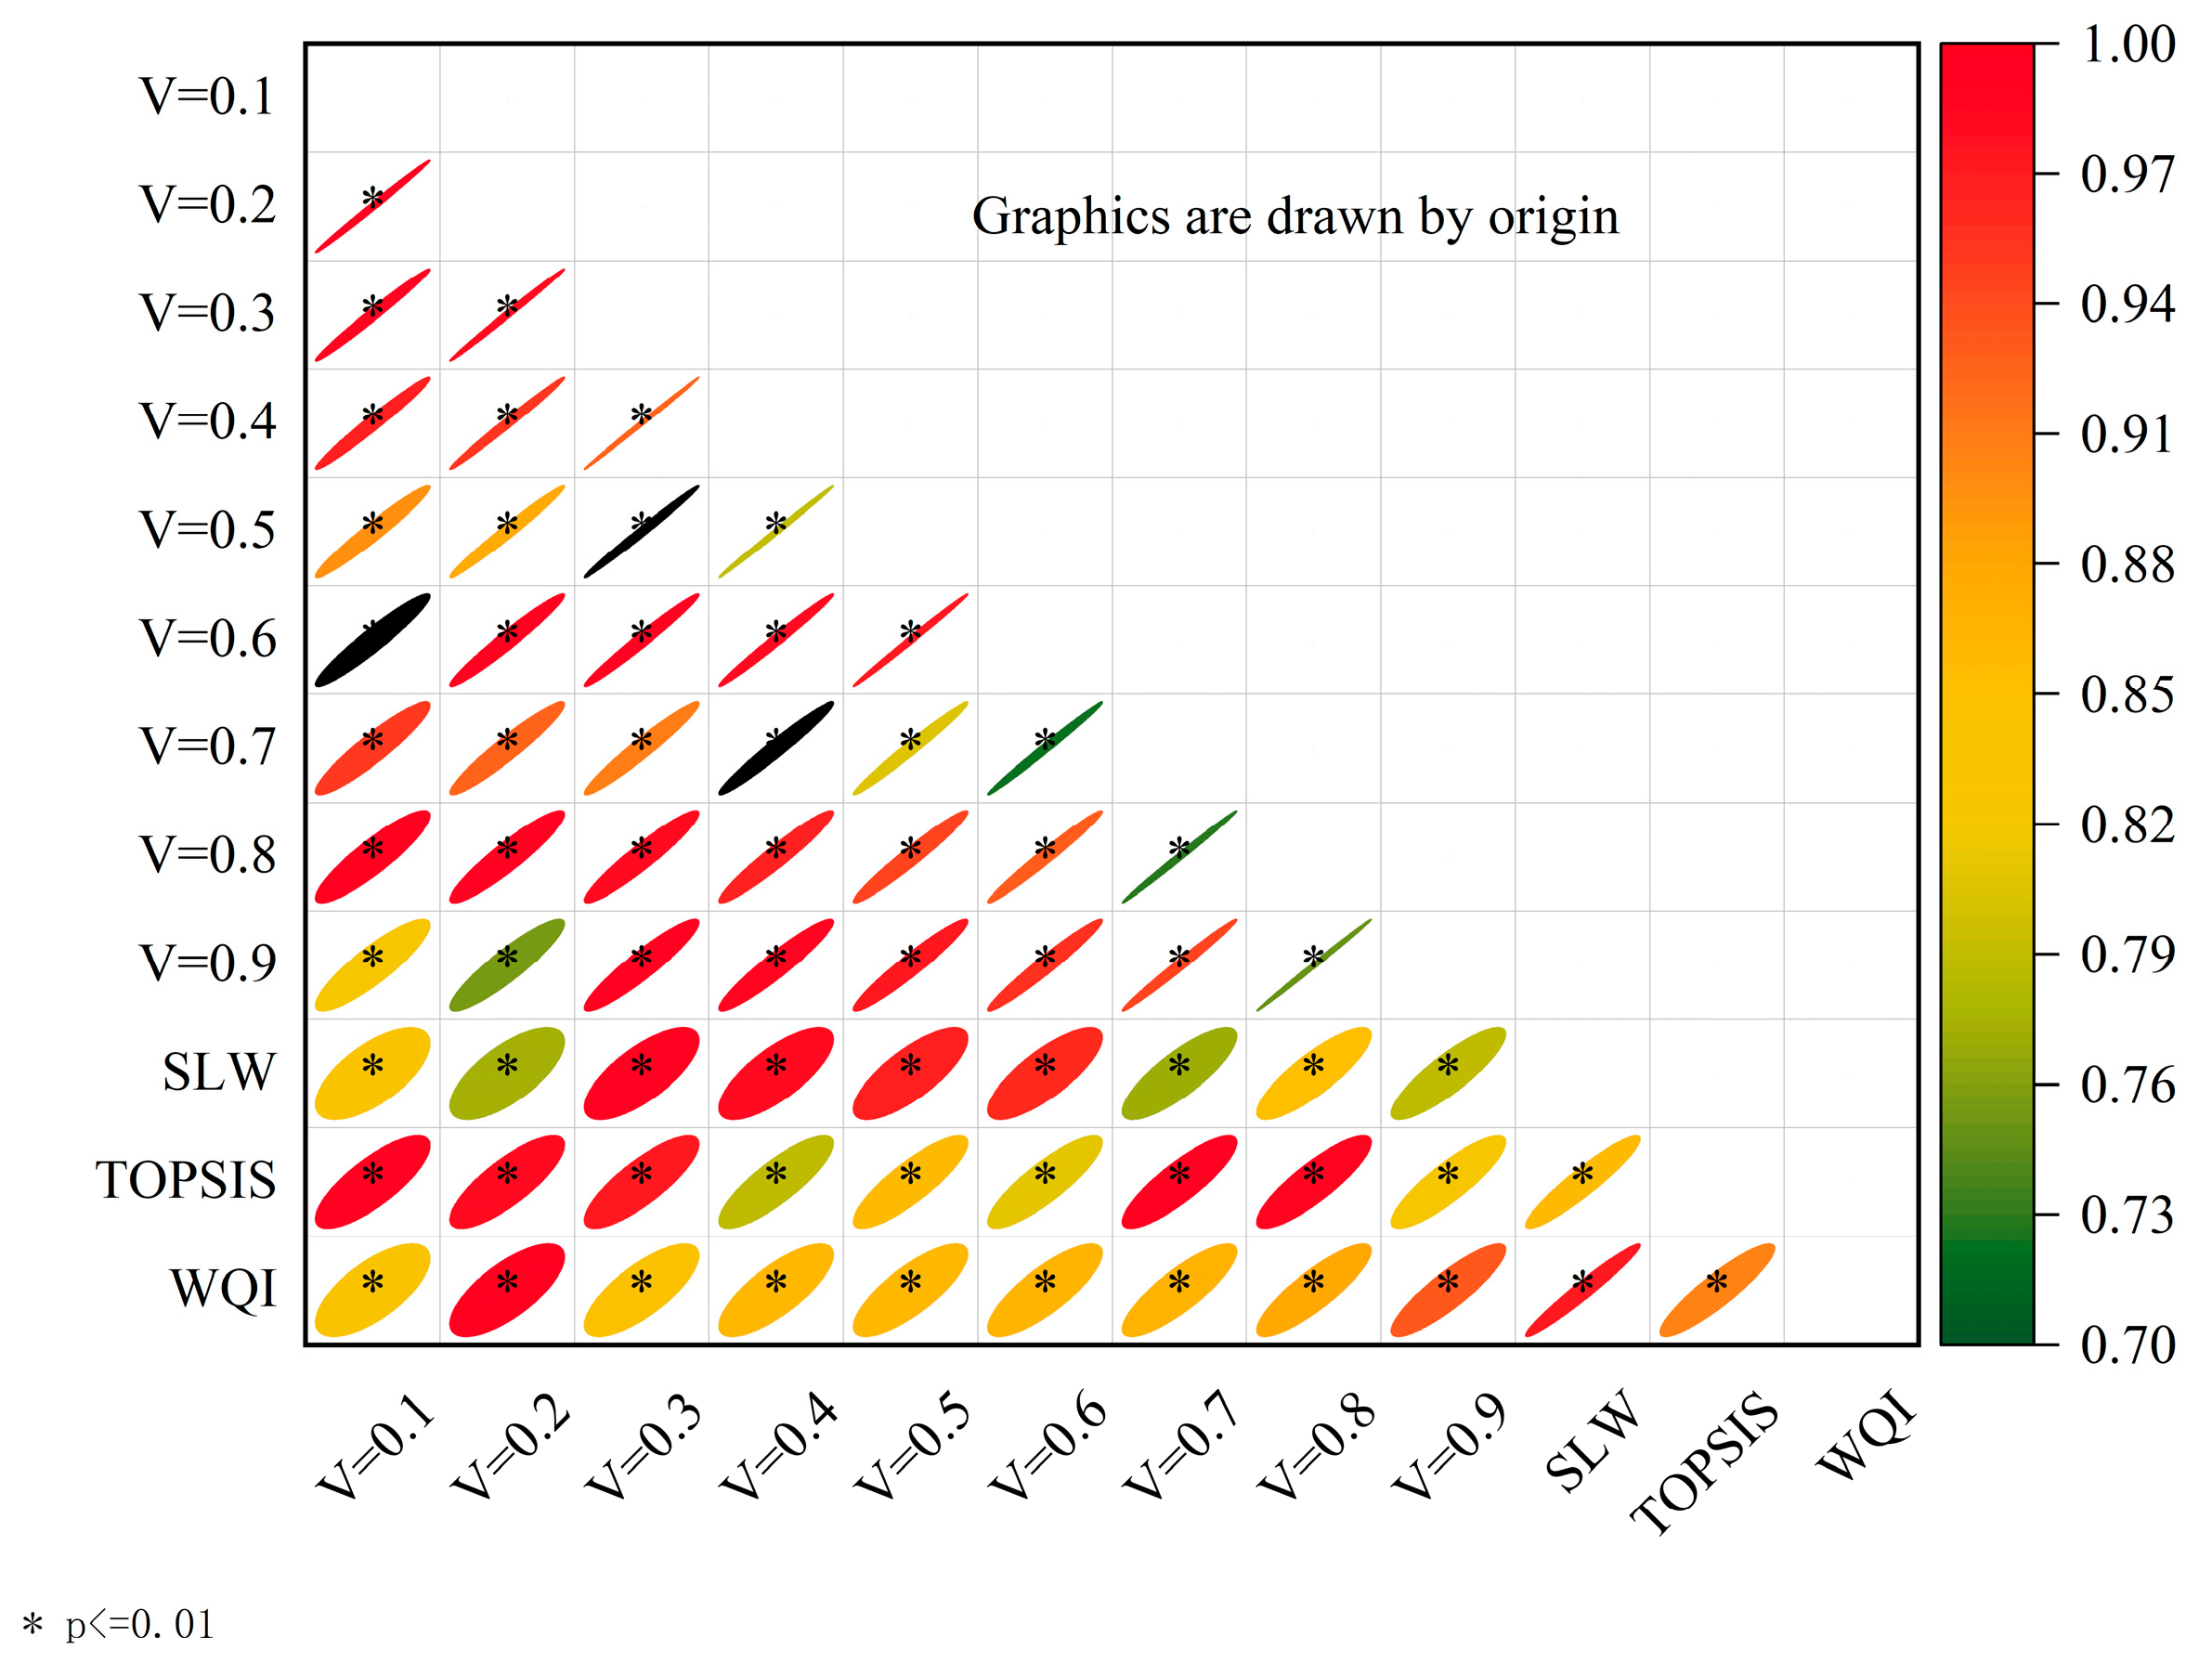
3.3. Comprehensive Evaluation of Water Quality Based on the Fuzzy Matter-Element-VIKOR Model
3.4. Relationships between Land Cover and Water Quality
3.4.1. Factor Detector
3.4.2. Interaction Detector
3.5. Sensitivity Analysis
4. Discussion
5. Conclusions
Author Contributions
Funding
Data Availability Statement
Conflicts of Interest
References
- Soriano, C. On the Anthropocene formalization and the proposal by the Anthropocene Working Group. Geol. Acta 2020, 18, 1–10. [Google Scholar] [CrossRef] [Green Version]
- Zając, Z.; Sędzikowska, A.; Maślanko, W.; Woźniak, A.; Kulisz, J. Occurrence and Abundance of Dermacentor reticulatus in the Habitats of the Ecological Corridor of the Wieprz River, Eastern Poland. Insects 2021, 12, 96. [Google Scholar] [CrossRef]
- Yang, C.Y.; Zhou, Y.; Chen, Y.; Wang, L.W. Practice exploration of ecological protection and restoration of mountains, rivers, forests, fields, lakes and grasses based on NbS. Earth Sci. Front. 2021, 28, 25–34. [Google Scholar]
- Bi, Y.j.; Zhao, J.; Zhang, W.G.; Zhao, Y. Simulation of hydrological cycle for mountain-water-forest-cropland-lake-grass system in Hetao region, Inner Mongolia of China by WACM4.0 model. Trans. Chin. Soc. Agric. Eng. (Trans. CSAE) 2020, 36, 148–158. [Google Scholar] [CrossRef]
- Ouyang, J.; Zhang, K.Z.; Wen, B.; Lu, Y. Top-Down and Bottom-Up Approaches to Environmental Governance in China: Evidence from the River Chief System (RCS). Int. J. Environ. Res. Public Health 2020, 17, 7058. [Google Scholar] [CrossRef]
- Zhou, L.; Li, L.-Z.; Huang, J.-K. The river chief system and agricultural non-point source water pollution control in China. J. Integr. Agric. 2021, 20, 1382–1395. [Google Scholar] [CrossRef]
- Wu, C.; Ju, M.; Wang, L.; Gu, X.; Jiang, C. Public Participation of the River Chief System in China: Current Trends, Problems, and Perspectives. Water 2020, 12, 3496. [Google Scholar] [CrossRef]
- Shen, K.R.; Jin, G. The Policy Effects of the Environmental Governance of Chinese Local Governments: A Study Based on the Progress of the River Chief System. Soc. Sci. China 2020, 41, 87–105. [Google Scholar]
- Tang, Y.; Zhao, X.; Jiao, J. Ecological security assessment of Chaohu Lake Basin of China in the context of River Chief System reform. Environ. Sci. Pollut. Res. 2020, 27, 2773–2785. [Google Scholar] [CrossRef]
- Liu, H.; Chen, Y.D.; Liu, T.; Lin, L. The River Chief System and River Pollution Control in China: A Case Study of Foshan. Water 2019, 11, 1606. [Google Scholar] [CrossRef] [Green Version]
- Petesse, M.L.; Siqueira-Souza, F.K.; Freitas, C.E.D.C.; Petrere, M. Selection of reference lakes and adaptation of a fish multimetric index of biotic integrity to six amazon floodplain lakes. Ecol. Eng. 2016, 97, 535–544. [Google Scholar] [CrossRef]
- Hering, D.; Feld, C.K.; Moog, O.; Ofenböck, T. Cook book for the development of a Multimetric Index for biological condition of aquatic ecosystems: Experiences from the European AQEM and STAR projects and related initiatives. In The Ecological Status of European Rivers: Evaluation and Intercalibration of Assessment Methods; Springer: Dordrecht, The Netherlands, 2006. [Google Scholar]
- Zhang, X.; Meng, Y.; Xia, J.; Wu, B.; She, D. A combined model for river health evaluation based upon the physical, chemical, and biological elements. Ecol. Indic. 2018, 84, 416–424. [Google Scholar] [CrossRef]
- Lin, L.; Wang, F.; Chen, H.; Fang, H.; Zhang, T.; Cao, W. Ecological health assessments of rivers with multiple dams based on the biological integrity of phytoplankton: A case study of North Creek of Jiulong River. Ecol. Indic. 2021, 121. [Google Scholar] [CrossRef]
- WFD. The EU Water Framework Directive—Integrated River Basin Management for Europe. European Commission. 2020. Available online: http://ec.europa.eu/environment/water/water-framework/index_en.html (accessed on 23 October 2000).
- Deng, X.; Xu, Y.; Han, L.; Yu, Z.; Yang, M.; Pan, G. Assessment of river health based on an improved entropy-based fuzzy matter-element model in the Taihu Plain, China. Ecol. Indic. 2015, 57, 85–95. [Google Scholar] [CrossRef]
- Yang, Z.; Wang, Y. The cloud model based stochastic multi-criteria decision making technology for river health assessment under multiple uncertainties. J. Hydrol. 2020, 581, 124437. [Google Scholar] [CrossRef]
- Qin, Z.; Li, H.; Liu, Z. Multi-objective comprehensive evaluation approach to a river health system based on fuzzy entropy. Math. Struct. Comput. Sci. 2014, 24, E240515. [Google Scholar] [CrossRef]
- Xue, C.; Shao, C.; Chen, S. SDGs-Based River Health Assessment for Small- and Medium-Sized Watersheds. Sustainability 2020, 12, 1846. [Google Scholar] [CrossRef] [Green Version]
- Wan, X.; Yang, T.; Zhang, Q.; Yan, X.; Hu, C.; Sun, L.; Zheng, Y. A novel comprehensive model of set pair analysis with extenics for river health evaluation and prediction of semi-arid basin—A case study of Wei River Basin, China. Sci. Total. Environ. 2021, 775, 145845. [Google Scholar] [CrossRef] [PubMed]
- Guo, W.; Wang, H. Application of TOPSIS Model Based on AHP Weight to Beiyun River Ecosystem Health Assessment. Energy Procedia 2011, 11, 3899–3904. [Google Scholar] [CrossRef]
- Seyedmohammadi, J.; Sarmadian, F.; Jafarzadeh, A.A.; Ghorbani, M.A.; Shahbazi, F. Application of SAW, TOPSIS and fuzzy TOPSIS models in cultivation priority planning for maize, rapeseed and soybean crops. Geoderma 2018, 310, 178–190. [Google Scholar] [CrossRef]
- Zhao, Y.W.; Zhou, L.Q.; Dong, B.Q.; Dai, C. Health assessment for urban rivers based on the pressure, state and response framework—A case study of the Shiwuli River. Ecol. Indic. 2019, 99, 324–331. [Google Scholar] [CrossRef]
- Zeng, S.; Chen, S.-M.; Fan, K.-Y. Interval-valued intuitionistic fuzzy multiple attribute decision making based on nonlinear programming methodology and TOPSIS method. Inf. Sci. 2020, 506, 424–442. [Google Scholar] [CrossRef]
- Duckstein, L.; Opricovic, S. Multiobjective optimization in river basin development. Water Resour. Res. 1980, 16, 14–20. [Google Scholar] [CrossRef]
- Opricovic, S.; Tzeng, G.-H. Compromise solution by MCDM methods: A comparative analysis of VIKOR and TOPSIS. Eur. J. Oper. Res. 2004, 156, 445–455. [Google Scholar] [CrossRef]
- Liu, D.; Zhang, G.; Li, H.; Fu, Q.; Li, M.; Faiz, M.A.; Ali, S.; Li, T.; Khan, M.I. Projection pursuit evaluation model of a regional surface water environment based on an Ameliorative Moth-Flame Optimization algorithm. Ecol. Indic. 2019, 107, 105674. [Google Scholar] [CrossRef]
- Zhang, Q.; Xu, P.; Qian, H. Groundwater Quality Assessment Using Improved Water Quality Index (WQI) and Human Health Risk (HHR) Evaluation in a Semi-arid Region of Northwest China. Expo. Health 2020, 12, 487–500. [Google Scholar] [CrossRef]
- Xu, Y.; Luo, D.; Peng, J. Land use change and soil erosion in the Maotiao River watershed of Guizhou Province. J. Geogr. Sci. 2011, 21, 1138–1152. [Google Scholar] [CrossRef]
- American Public Health Association. Standard Methods for the Examination of Water and Wastewater, 19th ed.; American Public Health Association: Washington, DC, USA, 1998. [Google Scholar]
- Abrahamsen, E.B.; Milazzo, M.F.; Selvik, J.T.; Asche, F.; Abrahamsen, H.B. Prioritising investments in safety measures in the chemical industry by using the Analytic Hierarchy Process. Reliab. Eng. Syst. Saf. 2020, 198, 106811. [Google Scholar] [CrossRef]
- Wang, J.F.; Zhang, T.L.; Fu, B.J. A measure of spatial stratified heterogeneity. Ecol. Indic. 2016, 67, 250–256. [Google Scholar] [CrossRef]
- Gu, H.; Fan, W.; Liu, K.; Qingwu, J.; Li, X.; Jiang, J.; Chen, E.; Zhou, Y.; Jiang, Q. Spatio-temporal variations of typhoid and paratyphoid fevers in Zhejiang Province, China from 2005. Sci. Rep. 2017, 7, 1–11. [Google Scholar] [CrossRef]
- Zhang, J.; Mu, G.; Zhang, Z.; Huang, X.; Fang, H. Speciation Variation and Bio-Activation of Soil Heavy Metals (Cd and Cr) in Rice-Rape Rotation Lands in Karst Regions. Int. J. Environ. Res. Public Health 2021, 18, 1364. [Google Scholar] [CrossRef] [PubMed]
- Luo, X.L.; Wang, S.J.; Bai, X.Y.; Tan, Q.; Ran, C.; Chen, H.; Xi, H.P.; Chen, F.; Cao, Y.; Wu, L.H.; et al. Analysis on the spatio-temporal evolution process of rocky desertification in Southwest Karst area. Acta Ecol. Sin. 2021, 41, 680–693. [Google Scholar]
- Du, Z.; Gao, B.; Ou, C.; Du, Z.; Yang, J.; Batsaikhan, B.; Dorjgotov, B.; Yun, W.; Zhu, D. A Quantitative Analysis of Factors Influencing Organic Matter Concentration in the Topsoil of Black Soil in Northeast China Based on Spatial Heterogeneous Patterns. ISPRS Int. J. Geo-Inf. 2021, 10, 348. [Google Scholar] [CrossRef]
- Huang, X.-G.; Zhao, J.-B.; Cao, J.-J.; Song, Y.-Y. Spatial-temporal Variation of Ozone Concentration and Its Driving Factors in China. Huan Jing Ke Xue Huanjing Kexue 2019, 40, 1120–1131. [Google Scholar]
- Li, Q.H.; Han, L.B.; Ma, Y.M.; Liu, Y.L. The relationship between and cyanobacterial composition characteristics environmental factors in Hongfeng Reservoir of Guizhou Plateau. J. Guizhou Norm. Univ. (Nat. Sci. Ed.) 2021, 39, 1–7. [Google Scholar] [CrossRef]
- Akram, M.; Kahraman, C.; Zahid, K. Group decision-making based on complex spherical fuzzy VIKOR approach. Knowl.-Based Syst. 2021, 216, 106793. [Google Scholar] [CrossRef]
- Zhang, H.; Lu, M.; Ke, X.; Yu, S.; Zhao, J.; Wu, Y.; Cheng, L.; Li, X. Evaluation model of black-start schemes based on optimal combination weights and im-proved VIKOR method. Int. J. Electr. Power Energy Syst. 2021, 129, 106762. [Google Scholar] [CrossRef]
- Zhao, J.; Lin, L.; Yang, K.; Liu, Q.; Qian, G. Influences of land use on water quality in a reticular river network area: A case study in Shanghai, China. Landsc. Urban Plan. 2015, 137, 20–29. [Google Scholar] [CrossRef]
- Shehab, Z.N.; Jamil, N.R.; Aris, A.Z.; Shafie, N.S. Spatial variation impact of landscape patterns and land use on water quality across an urbanized watershed in Bentong, Malaysia. Ecol. Indic. 2021, 122, 107254. [Google Scholar] [CrossRef]
- Huang, W.; Mao, J.; Zhu, D.; Lin, C. Impacts of Land Use and Land Cover on Water Quality at Multiple Buffer-Zone Scales in a Lakeside City. Water 2019, 12, 47. [Google Scholar] [CrossRef] [Green Version]
- Huang, B.S.; Li, S.L.; Qiu, J.; Hu, P.; Liu, D. The theory of dirty basin—A new method of surface water resources evaluation considering influence of river and lake water quality. J. Hydraul. Eng. 2021, 52, 150–157. [Google Scholar]
- Yu, S.; Xu, Z.; Wu, W.; Zuo, D. Effect of land use types on stream water quality under seasonal variation and topographic characteristics in the Wei River basin, China. Ecol. Indic. 2016, 60, 202–212. [Google Scholar] [CrossRef]
- Fang, H. Effect of soil conservation measures and slope on runoff, soil, TN, and TP losses from cultivated lands in northern China. Ecol. Indic. 2021, 126, 107677. [Google Scholar] [CrossRef]
- Wu, J.; Lu, J. Spatial scale effects of landscape metrics on stream water quality and their seasonal changes. Water Res. 2021, 191, 116811. [Google Scholar] [CrossRef] [PubMed]
- Dunea, D.; Bretcan, P.; Tanislav, D.; Serban, G.; Teodorescu, R.; Iordache, S.; Petre, B.; Tuchiu, E. Evaluation of Water Quality in Ialomita River Basin in Relationship with Land Cover Patterns. Water 2020, 12, 735. [Google Scholar] [CrossRef] [Green Version]
- Lei, C.; Wagner, P.D.; Fohrer, N. Effects of land cover, topography, and soil on stream water quality at multiple spatial and seasonal scales in a German lowland catchment. Ecol. Indic. 2021, 120, 106940. [Google Scholar] [CrossRef]
- Liu, X.; Zhang, Y.; Li, Z.; Li, P.; Xu, G.; Cheng, Y.; Zhang, T. Response of water quality to land use in hydrologic response unit and riparian buffer along the Dan River, China. Environ. Sci. Pollut. Res. 2021, 28, 28251–28262. [Google Scholar] [CrossRef]
- Song, Y.; Song, X.; Shao, G.; Hu, T. Effects of Land Use on Stream Water Quality in the Rapidly Urbanized Areas: A Multiscale Analysis. Water 2020, 12, 1123. [Google Scholar] [CrossRef] [Green Version]
- Gu, Q.; Hu, H.; Ma, L.; Sheng, L.; Yang, S.; Zhang, X.; Zhang, M.; Zheng, K.; Chen, L. Characterizing the spatial variations of the relationship between land use and surface water quality using self-organizing map approach. Ecol. Indic. 2019, 102, 633–643. [Google Scholar] [CrossRef]
- Zhou, P.; Huang, J.; Robert, R.G., Jr.; Hong, H. New insight into the correlations between land use and water quality in a coastal watershed of China: Does point source pollution weaken it? Sci. Total. Environ. 2016, 543, 291–600. [Google Scholar] [CrossRef] [PubMed]

| Scale Value | Meaning |
|---|---|
| 1 | Equally important |
| 1.2 | Slightly important |
| 1.4 | Strongly important |
| 1.6 | Obviously important |
| 1.8 | Absolutely important |
| Agriculture | Forest | Grassland | Shrub Land | Water Bodies | Impervious Surfaces | |
|---|---|---|---|---|---|---|
| July | 0.724 | −0.062 | −0.491 | −0.493 | −0.693 | 0.381 |
| August | 0.600 | −0.325 | 0.104 | 0.498 | 0.086 | −0.242 |
| November | 0.798 | −0.137 | 0.452 | −0.076 | −0.119 | −0.054 |
Publisher’s Note: MDPI stays neutral with regard to jurisdictional claims in published maps and institutional affiliations. |
© 2022 by the authors. Licensee MDPI, Basel, Switzerland. This article is an open access article distributed under the terms and conditions of the Creative Commons Attribution (CC BY) license (https://creativecommons.org/licenses/by/4.0/).
Share and Cite
Li, Y.; Li, Q.; Jiao, S.; Liu, C.; Yang, L.; Huang, G.; Zhou, S.; Han, M.; Brancelj, A. Water Quality Characteristics and Source Analysis of Pollutants in the Maotiao River Basin (SW China). Water 2022, 14, 301. https://doi.org/10.3390/w14030301
Li Y, Li Q, Jiao S, Liu C, Yang L, Huang G, Zhou S, Han M, Brancelj A. Water Quality Characteristics and Source Analysis of Pollutants in the Maotiao River Basin (SW China). Water. 2022; 14(3):301. https://doi.org/10.3390/w14030301
Chicago/Turabian StyleLi, Yinjiu, Qiuhua Li, Shulin Jiao, Chen Liu, Liuying Yang, Guojia Huang, Si Zhou, Mengshu Han, and Anton Brancelj. 2022. "Water Quality Characteristics and Source Analysis of Pollutants in the Maotiao River Basin (SW China)" Water 14, no. 3: 301. https://doi.org/10.3390/w14030301
APA StyleLi, Y., Li, Q., Jiao, S., Liu, C., Yang, L., Huang, G., Zhou, S., Han, M., & Brancelj, A. (2022). Water Quality Characteristics and Source Analysis of Pollutants in the Maotiao River Basin (SW China). Water, 14(3), 301. https://doi.org/10.3390/w14030301