Article

Assessment of Regional Spatiotemporal Variations in Drought from the Perspective of Soil Moisture in Guangxi, China

1
School of Water Conservancy and Hydropower, Hebei University of Engineering, Handan 056038, China
2
Guangxi Key Laboratory of Water Engineering Materials and Structures, Guangix Hydraulic Research Institute, Nanning 530023, China
3
College of Civil Engineering and Architecture, Guangxi University, Nanning 530004, China
4
Key Laboratory of Disaster Prevention and Structural Safety of Ministry of Education, Guangxi University, Nanning 530004, China
5
Guangxi Key Laboratory of Disaster Prevention and Engineering Safety, Guangxi University, Nanning 530004, China
6
Water Safety and Intelligent Operation Engineering Research Center of Karst Areas of Guangxi Zhuang Autonomous Region, Nanning 530004, China
*
Author to whom correspondence should be addressed.
Water 2022, 14(3), 289; https://doi.org/10.3390/w14030289
Submission received: 16 November 2021 / Revised: 5 January 2022 / Accepted: 10 January 2022 / Published: 19 January 2022
(This article belongs to the Topic Water Management in the Era of Climatic Change)

Abstract

:
Understanding the changes in regional droughts is important for promoting overall sustainable development. However, the spatiotemporal dynamics of soil droughts in Guangxi under the background of global warming and regional vegetation restoration have not been studied extensively, and the potential causes are scarcely understood. Here, using TerraClimate soil moisture data, we constructed a monthly standardized soil moisture index (SSMI), analyzed the seasonal and annual spatiotemporal distribution of droughts from the perspective of soil moisture, and studied past soil drought events in Guangxi. Migration methods of drought centroid, trend analysis, and principal component decomposition were used. In the interannual dynamics, the overall SSMI increased, indicating that the soil drought situation was gradually alleviated in Guangxi. Further, the frequency of extreme and severe droughts decreased with time, mainly in autumn and winter. During early drought stages, the migration path was short, which extended as the droughts progressed. Ocean temperature and soil moisture were strongly correlated, indicating that abnormal ocean surface temperature may drive soil moisture. This study provides scientific guidance for the early warning, prevention, and mitigation of losses associated with soil droughts in Guangxi and serves as valuable reference for understanding the impacts of large-scale climate anomalies on soil moisture.

1. Introduction

Drought is a major natural disaster severely affecting the ecosystem and humans [1,2,3]. It is generally represented by soil water shortage and has long periods, wide range, occurs frequently, and affects large populations [4]. China is largely an agricultural country facing frequent droughts, which cause huge economic losses [5,6,7]. Therefore, strengthening drought monitoring, especially on a large scale with high spatiotemporal continuity, is necessary, and it can facilitate real-time dynamic capturing of drought occurrence and its development process and provide a reference for decision making to undertake timely and effective mitigation measures.
Previously, studies have been conducted on methods to monitor and evaluate droughts objectively, accurately, and quantitatively [1]. Generally, several drought assessment indicators are constructed using observation factors, such as precipitation, temperature, evaporation, and runoff [1,8]. However, these indicators do not consider the hydrological problems of subsurface soil and further divide the integrity of the water cycle to some extent. Soil moisture is a key physical quantity in climate studies [9,10,11]. It not only regulates the balance between material and energy exchange during land–air interactions [12], but it is also the most direct water source for natural ecosystems. Vegetation growth and development is extremely sensitive to changes in soil moisture [13,14], which can change the water–energy balance between land and air by affecting the surface albedo, soil thermal parameters, evaporation, and transpiration [12], and change the structure of the atmospheric boundary layer. Thus, soil moisture can both cause climate change and can be affected by climate change [13]. Soil droughts are mostly caused by a lack of soil moisture. The soil moisture content has a crucial relationship with the drought intensity in any region [15] and has a further direct impact on vegetation growth and agricultural production [14]. Therefore, considering soil moisture during drought monitoring using remote sensing is necessary.
Many direct methods, such as the gravimetric method, are accurate but expensive and are used to estimate soil moisture [15,16]. Additionally, indirect estimates based on microwave [8,17] or near-infrared band remote sensing data are also efficient approaches to estimate soil moisture. Some highly advanced soil moisture remote sensing products, such as Soil Moisture Active Passive [18] and Soil Moisture and Ocean Salinity [19] by the National Aeronautics and Space Administration, and European Space Agency’s Climate Change Initiative Soil Moisture [20] have been developed and widely used globally for drought studies. However, some studies have indicated that the accuracy of soil moisture estimates can be enhanced by combining microwave and optical remote sensing [5].
Currently, TerraClimate, a dataset of high-spatial resolution (~4-km, 1/24°) monthly climatic water balance for regional and global terrestrial surfaces during 1958–2018 [21], provides new types of soil moisture assimilation data, which have been previously applied to monitor soil droughts [22]. Considering the regional and seasonal dependence, the ability of TerraClimate data to capture soil moisture anomalies and their variabilities corresponds to other properties used to characterize the soil conditions [21]. The subsequent results can support TerraClimate as an indicator of soil water status; additionally, it can be used to develop new indicators of soil drought.
The present study was conducted in the Guangxi Zhuang Autonomous Region (hereinafter referred to as Guangxi). The shallow soil layer and its poor water holding capacity in Guangxi results in a complex runoff generation and confluence, thereby causing frequent regional floods and droughts for many years [23]. Studying the characteristics and risks of regional droughts in this region is thus urgently required. To study the impacts of climate change on soil droughts, soil moisture as an indicator of soil drought should be considered. Presently, little research has been conducted on the point-scale measurement of soil moisture; therefore, high-resolution distribution data of soil moisture are required for agriculture management, water management, and drought and flood monitoring in Guangxi.
In this study, we calculated the standardized soil moisture index (SSMI) based on the precipitation and temperature data of Guangxi for 1990–2018 and analyzed its variations, period, frequency, and other characteristics. Later, we analyzed the spatial variation characteristics of two typical droughts. Finally, we discussed the correlation between soil moisture anomaly and ocean temperature, which provides scientific reference for drought monitoring and early warning in Guangxi. The main aims of this study were: (1) to study the long-term trends and seasonal differences in soil droughts in Guangxi, (2) to discuss the spatial variation characteristics of soil droughts, and (3) to preliminarily explore the teleconnection factors affecting soil drought dynamics.

2. Materials and Methods
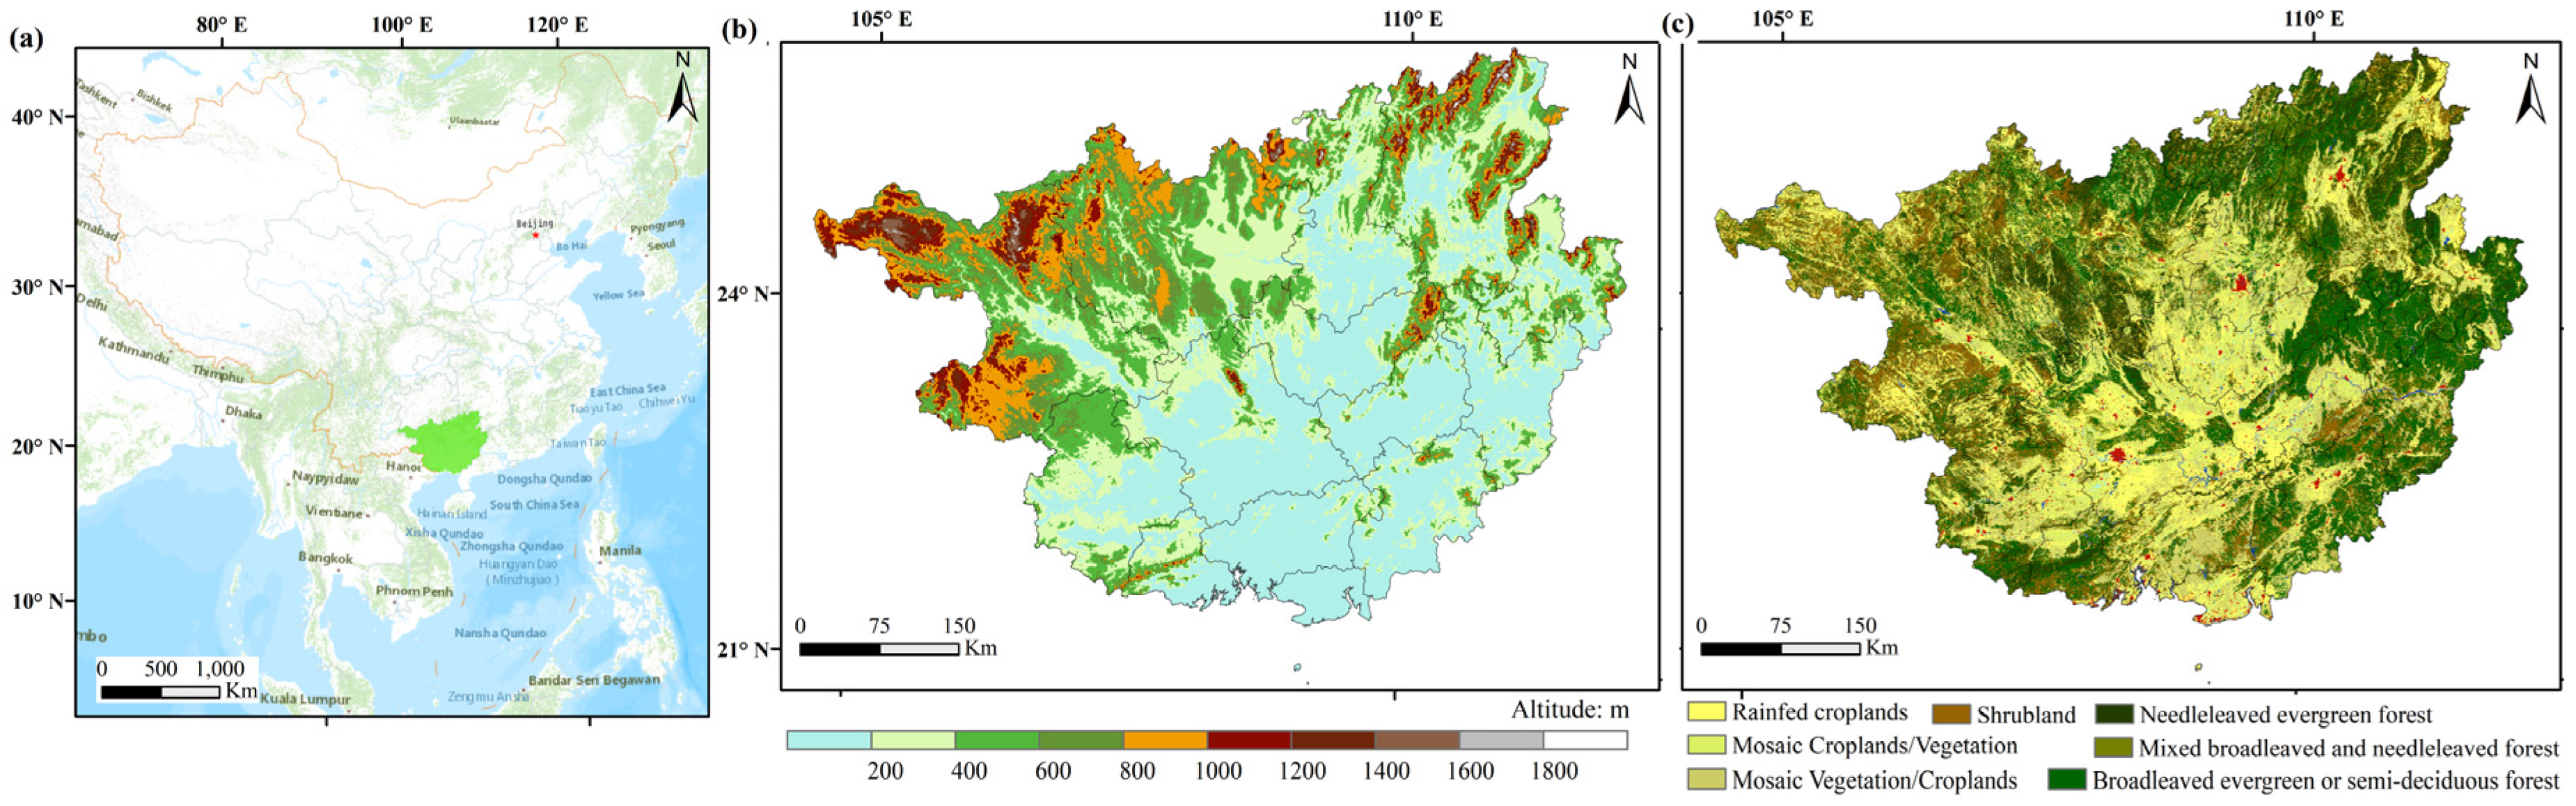
2.1. Study Area

Guangxi (extending from 20°54′ N–26°24′ N to 104°26′ E–112°04′ E) is located in South China (Figure 1) and to the southeast of the Yunnan–Guizhou Plateau, west of the Guangdong and Guangxi hills, and south of the North Bay. The terrain of this region is flat in the middle and south areas, which are in turn surrounded by mountains and plateaus, and the average altitude of the area is 802 m. An inclining trend is observed in the entire terrain from northwest to southeast. As a typical subtropical monsoon humid area, the annual precipitation in Guangxi is abundant (range 1500~2000 mm), with uneven spatiotemporal distribution, and the average annual temperature is relatively high, between 16~23 °C. Furthermore, karst developed hills and depressions are widely distributed [9]. Due to the special geological environment of karst areas in Guangxi, atmospheric precipitation can easily leak into the deep underground layer and become deeply buried groundwater, forming a pattern of water and soil separation, resulting in drought on the surface due to soil water shortage. At present, the development of rocky desertification in karst areas in Guangxi has become the most serious eco-environmental problem, restricting the sustainable development of Southwest China, and soil humidity is the key factor Therefore, the study of soil moisture in Guangxi has become an important measure for the ecological restoration and reconstruction of the region.

2.2. Soil Moisture Data

Monthly TerraClimate precipitation data from January 1990 to November 2018 were used in this study. The data spatial resolution was 1/24° (~4-km). TerraClimate includes the requisite variables for calculating energy-based reference potential evapotranspiration and a water balance model [21]. TerraClimate uses satellite and climatic data that can be integrated and has the characteristics of high accuracy, a wide detectable range, and high spatiotemporal resolution [21]. In this study, the soil moisture mentioned includes all water below the surface except groundwater, rather than only plant root or surface soil water. Further, soil moisture data were acquired from TerraClimate: Monthly Climate and Climatic Water Balance for Global Terrestrial Surfaces, http://www.climatologylab.org/terraclimate (accessed on 11 August 2019).

2.3. Standardized Soil Drought Index

SSMI is a standardized anomaly of remotely sensed soil moisture data from 1990 to 2018. We used soil moisture data in TerraClimate to calculate the SSMI to characterize agricultural drought.
SSMI i , j = S M i , j S M j ¯ j .  
Here, i is the observation year from 1990 to 2018, j is the observation month from January to December, and S M j ¯ and j are the average and standard deviation of soil humidity in month j, respectively. A detailed description of the this method can be found in the previous studies [24,25]. SSMI is dimensionless and is used to detect drought. When SSMI is greater than 0, it can be considered that it is wetter than that in the same period of many years; otherwise, it is drier. In this study, the drought situation levels, including slight (SSMI range: −0.5 to 0), moderate (−1 to −0.5), severe (−1.5 to −1), and extreme droughts (−2 to −1.5). If the SSMI value is lower than −1.5 in a certain month from 1990 to 2018, it represents an extreme drought event.

2.4. Drought Frequency

Drought frequency is defined as the number of droughts that exceeds a certain risk threshold per unit time. In this study, the drought frequency was defined as a ratio of the total number of drought months with different grades to the number of the total months of the study period (totally 468 months). For example, from 1990 to 2018, the number of months with SSMI lower than −1.5 for each grid cell was 10, and the frequency of extreme drought was 10/468, or 2.13%. The spatial frequency of droughts with different grades was calculated. Subsequently, the spatial frequency of different drought levels in spring (March–May), summer (June–August), autumn (September–November), and winter (December–February) were calculated to discuss the seasonal dynamics of soil drought frequency.

2.5. Migration Path of Droughts

The center of mass used to study the migration of matter and energy is an important method to study the geographical distribution [26]. In this study, the centroid model was used to study the spatiotemporal migration characteristics of soil dryness, and the distance of centroid movement reflects the spatial difference of the differentiation degree of SSMI change. Further, we used the migration of drought centers to describe the spatiotemporal evolution of soil drought. Initially, we used the statistical analysis box (mean center tool) of ArcGIS 10.0 software to obtain the spatial centroid of the SSMI drought index and plotted the centroid migration of two extreme soil drought events to describe the spatiotemporal evolution of soil drought better. The drought centers were then connected to record the track, path length, direction, and velocity characteristics of the droughts.

2.6. Empirical Orthogonal Function Decomposition

Empirical orthogonal function (EOF) decomposition, also known as eigenvector analysis, is a method to analyze the structural features of matrix data and extract the main data features [27]. Feature vector corresponds to space vector, also known as space feature vector or space mode, which reflects the spatial distribution characteristics of the factor field to a certain extent. The principal component (PC), also known as the time coefficient, corresponds to the time variation, which reflects the weight variation of the corresponding spatial mode with time. To investigate the causes of soil dryness in Guangxi, we further analyzed the correlation between the main variation model of SSMI (EOF-1) and its corresponding principal component (PC-1) and sea surface temperature (SST) from the perspective of remote correlation.

3. Results

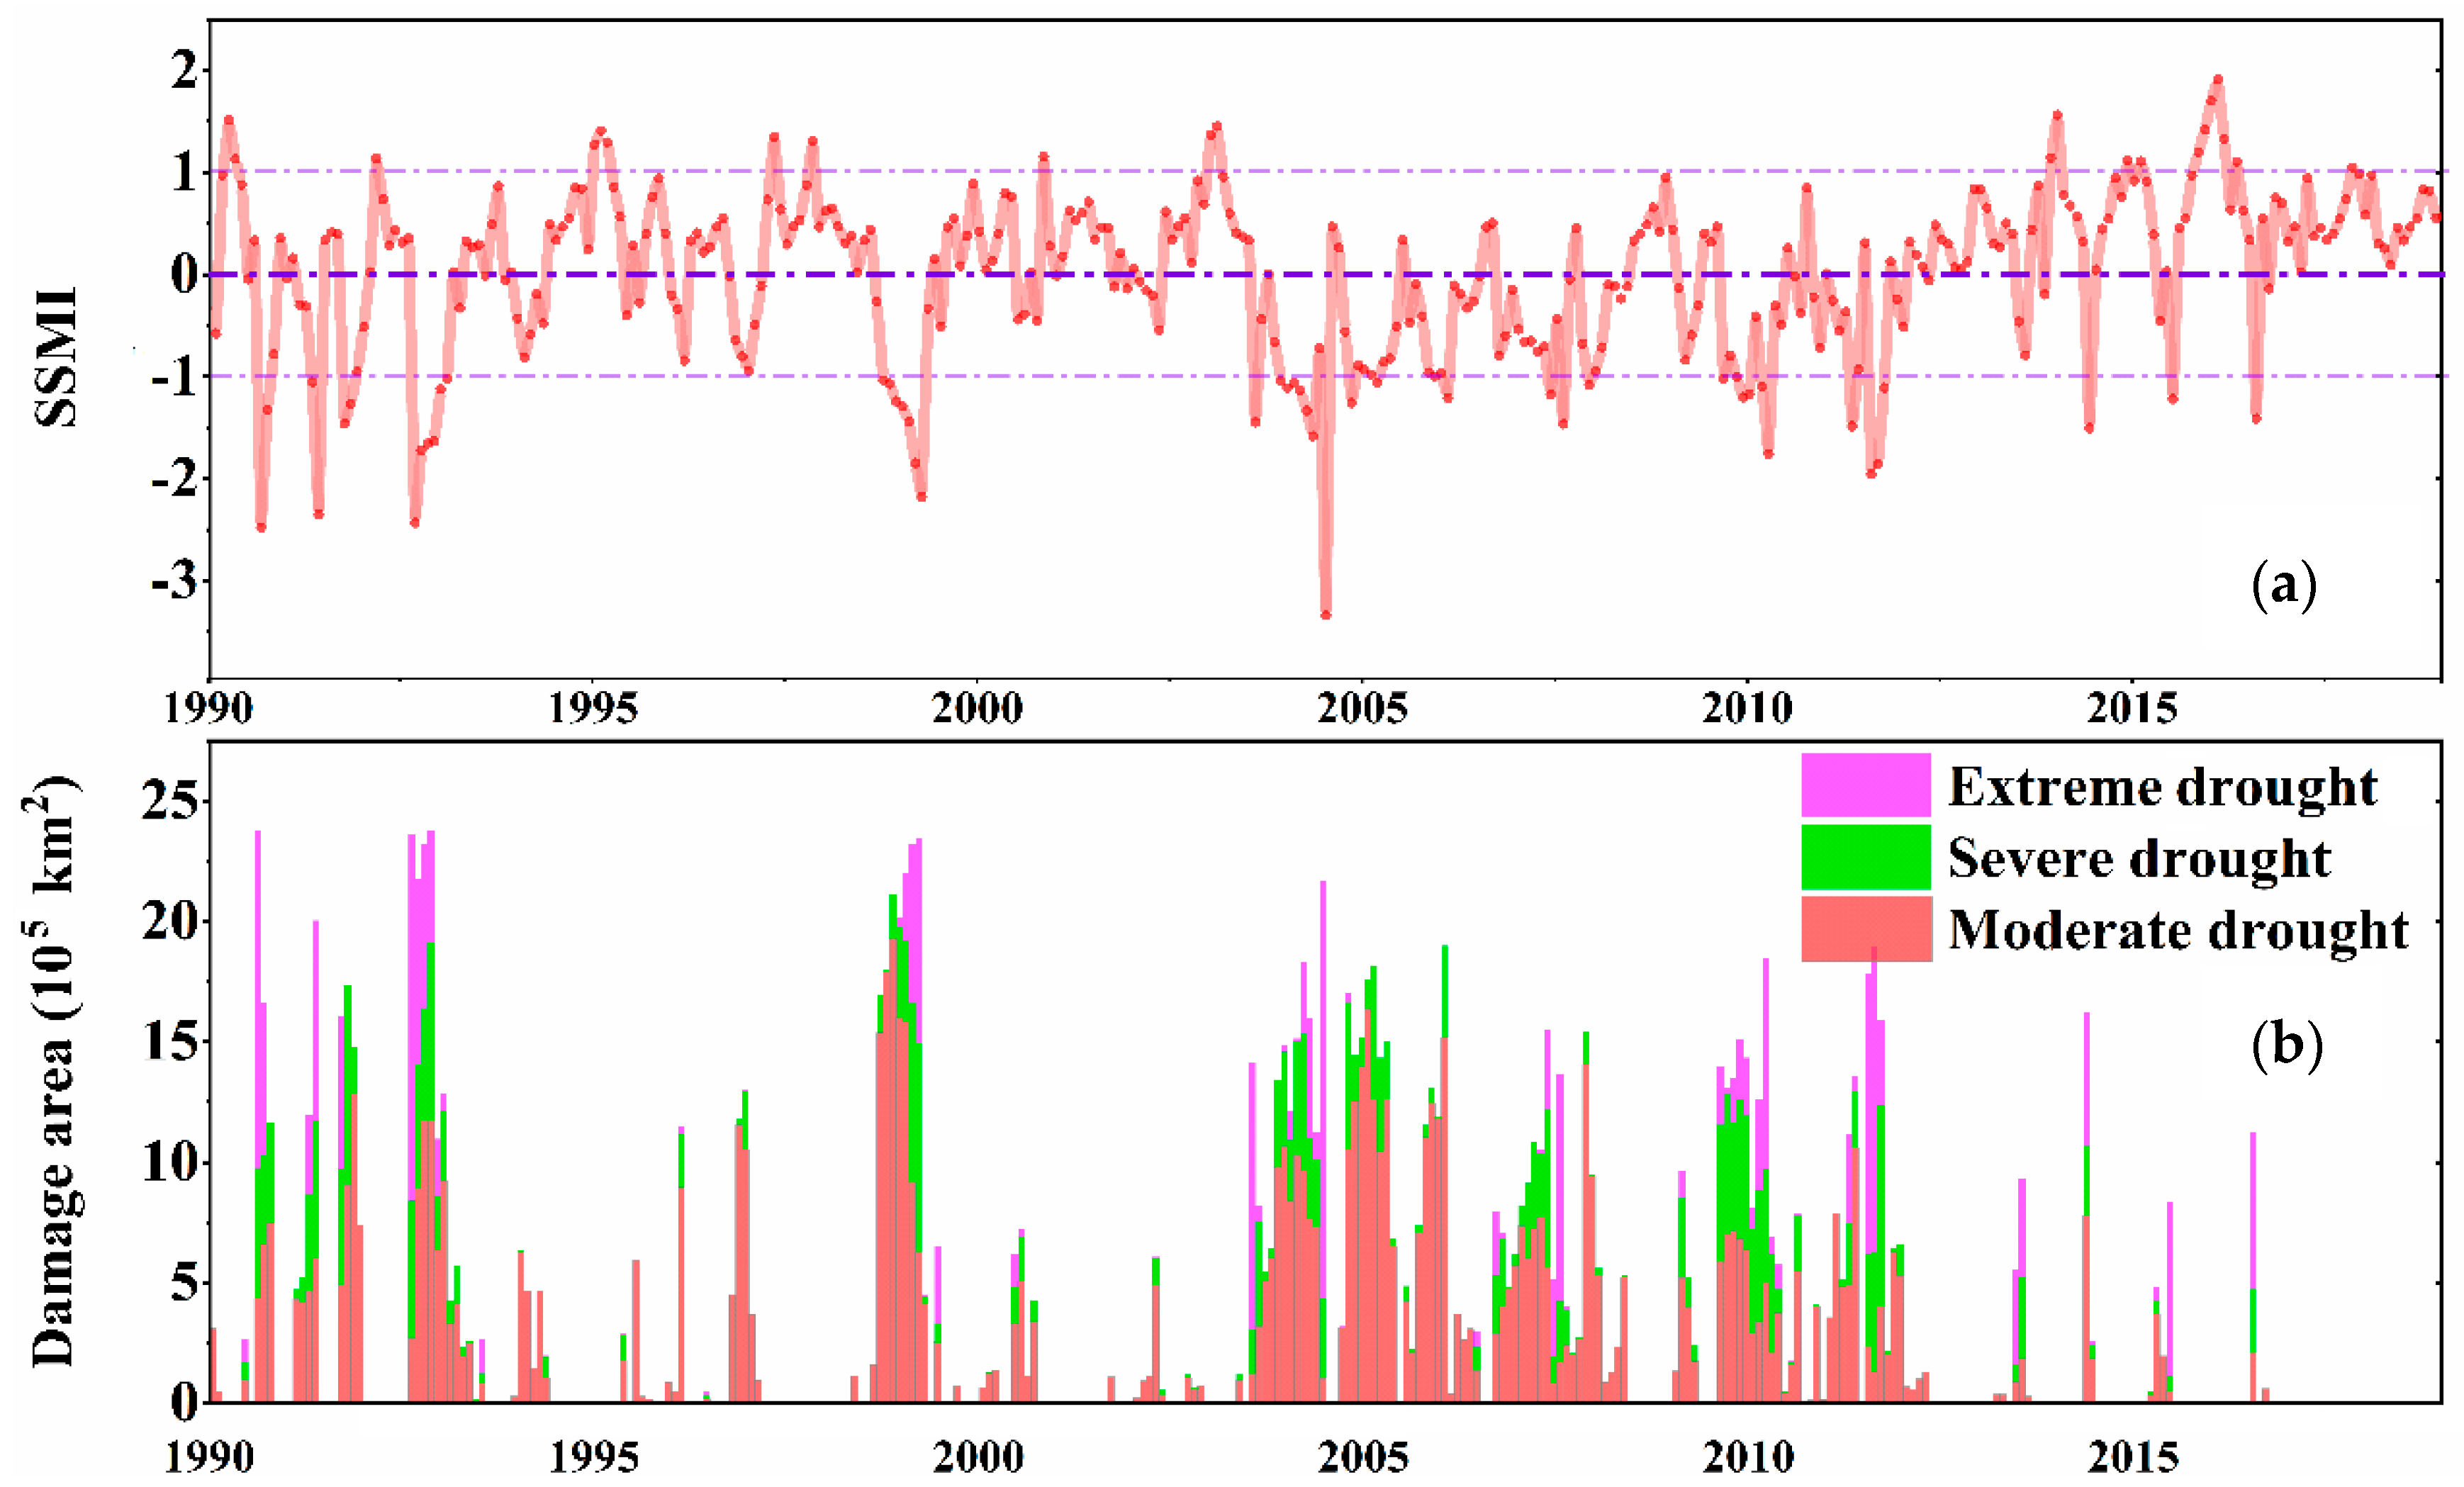
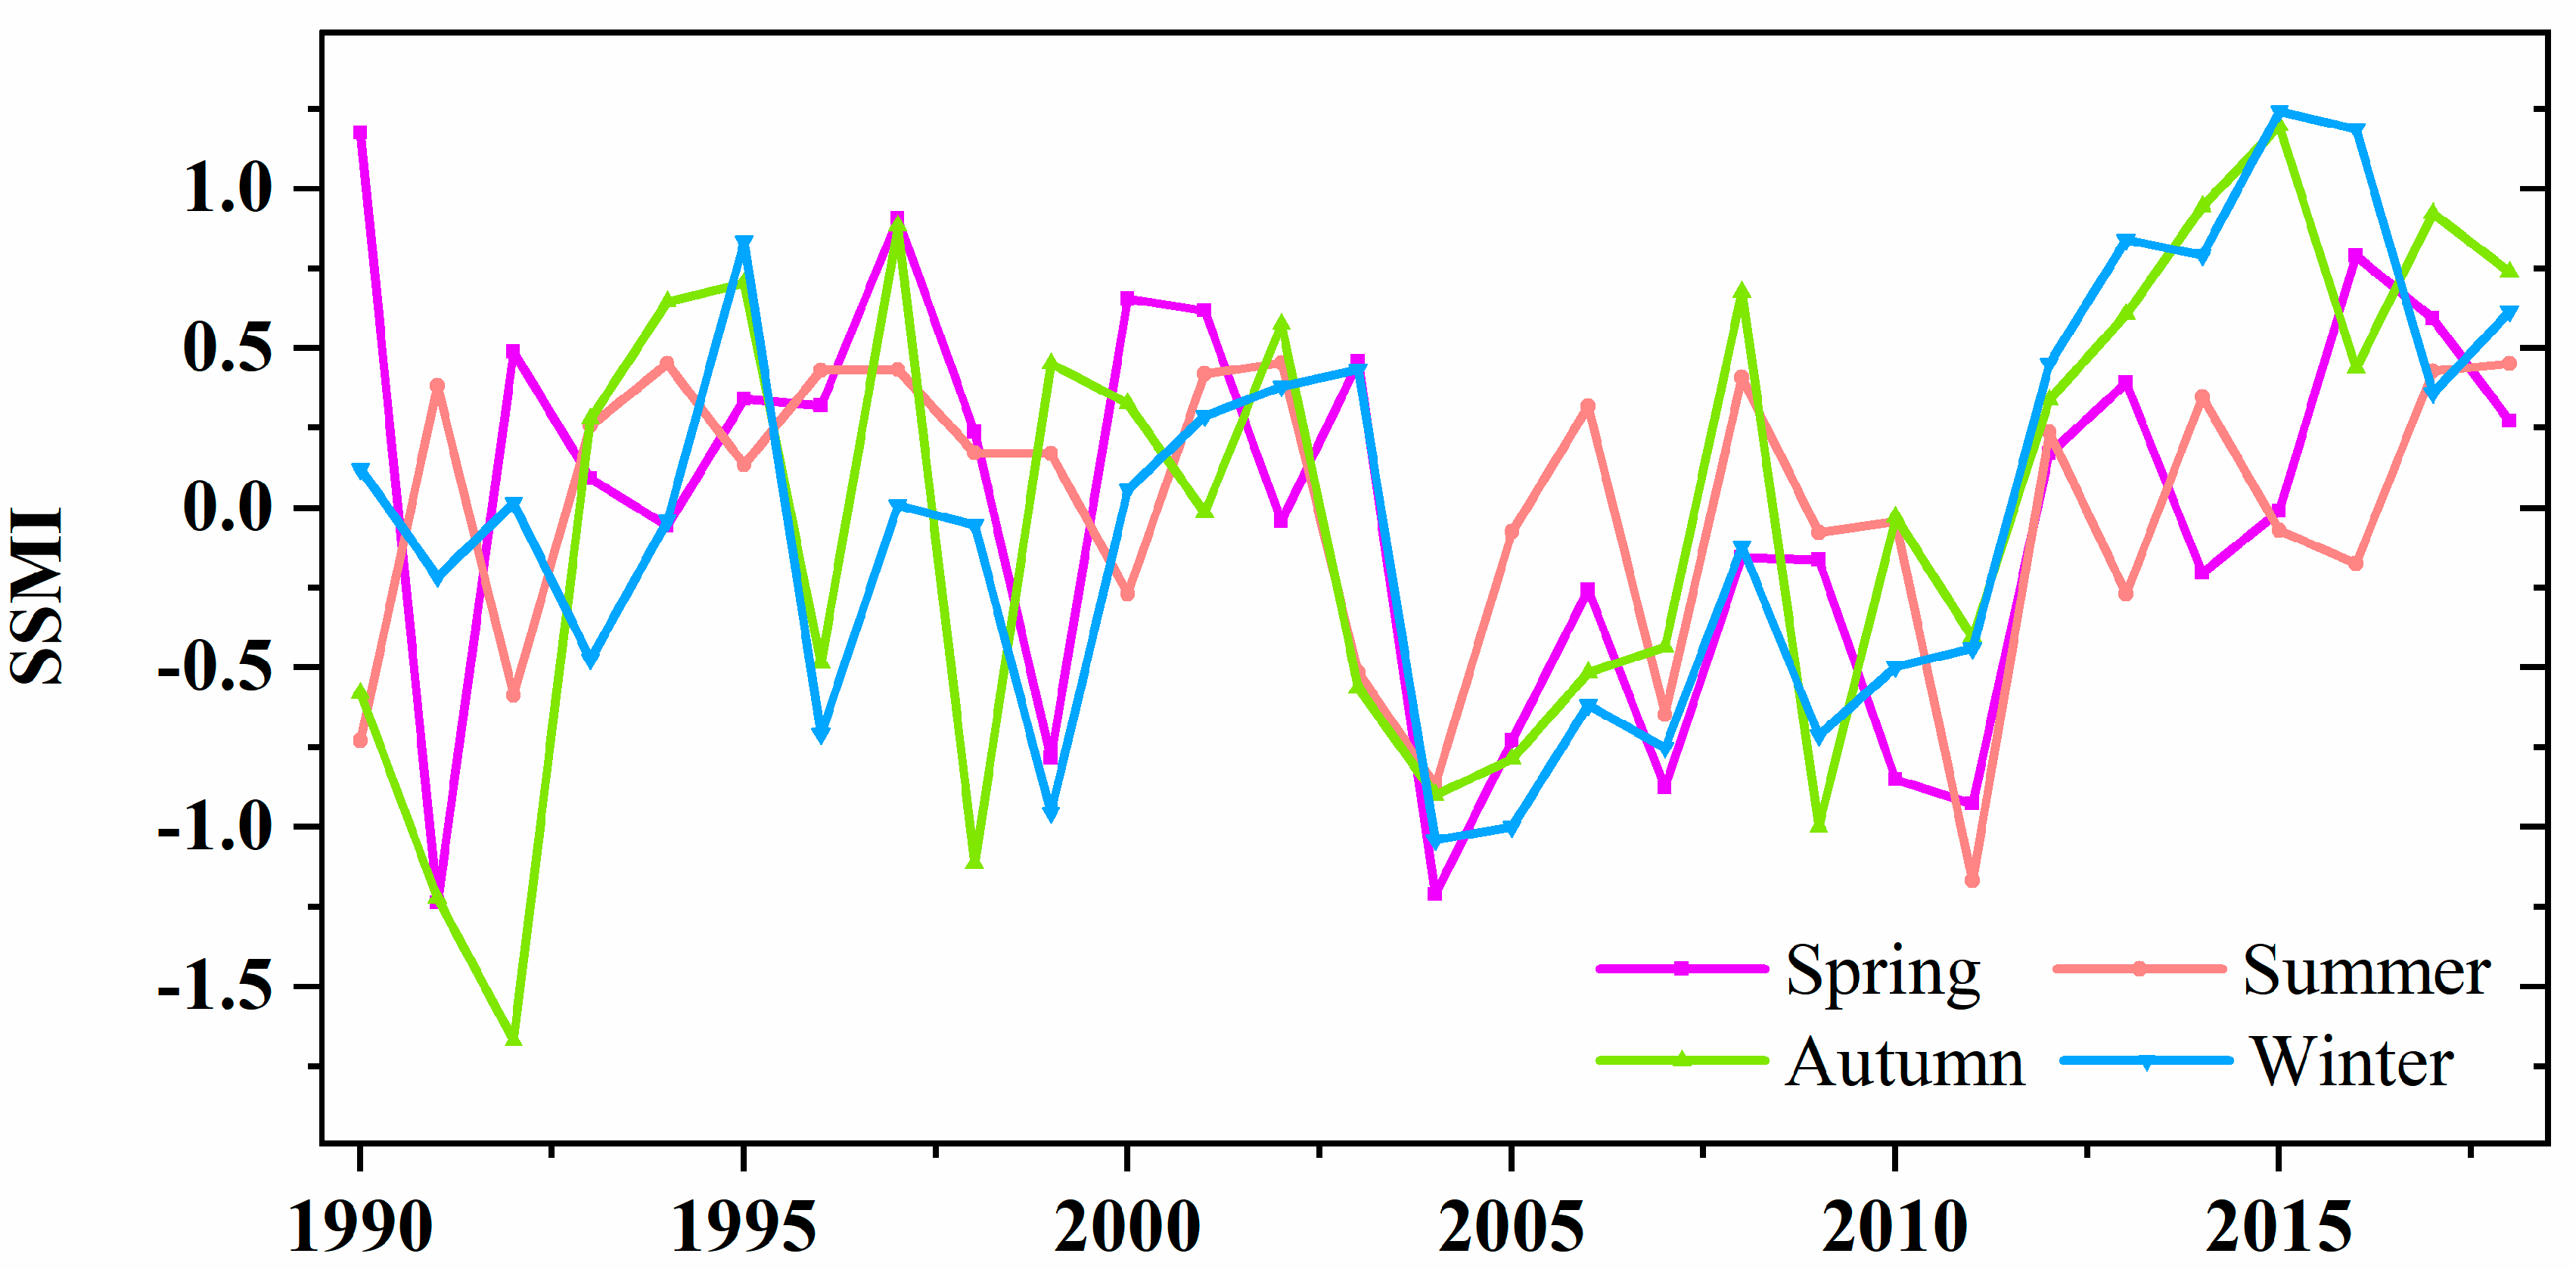
3.1. Identification of Variation Characteristics of Soil Drought

Figure 2 shows that, since 1990, drought and flood disasters occurred alternately in Guangxi, with slight or serious droughts and floods occurring almost every year; additionally, the temporal distribution of different types of droughts and floods is evident from the figure. Serious soil drought occurred every five to six years on average in Guangxi, with multiple droughts observed in 1993, 1998, and 2004. In general, Guangxi experienced many soil droughts during 1990–2018, with the drought duration and intensity being generally heavy. After 2000, the soil droughts in arid areas decreased (Figure 2).
Further, the SSMI showed evident seasonal characteristics in Guangxi (Figure 3), with the magnitude of variation being the highest in autumn. Serious soil droughts were observed in the autumns of 1992 and 1998, but none have occurred since 2010. However, the SSMI trends in winter and spring were similar. Overall, the seasonal soil moisture dynamics in Guangxi showed similar changes with the interannual dynamics. After 2012, the observed loss of soil moisture in each season was alleviated.

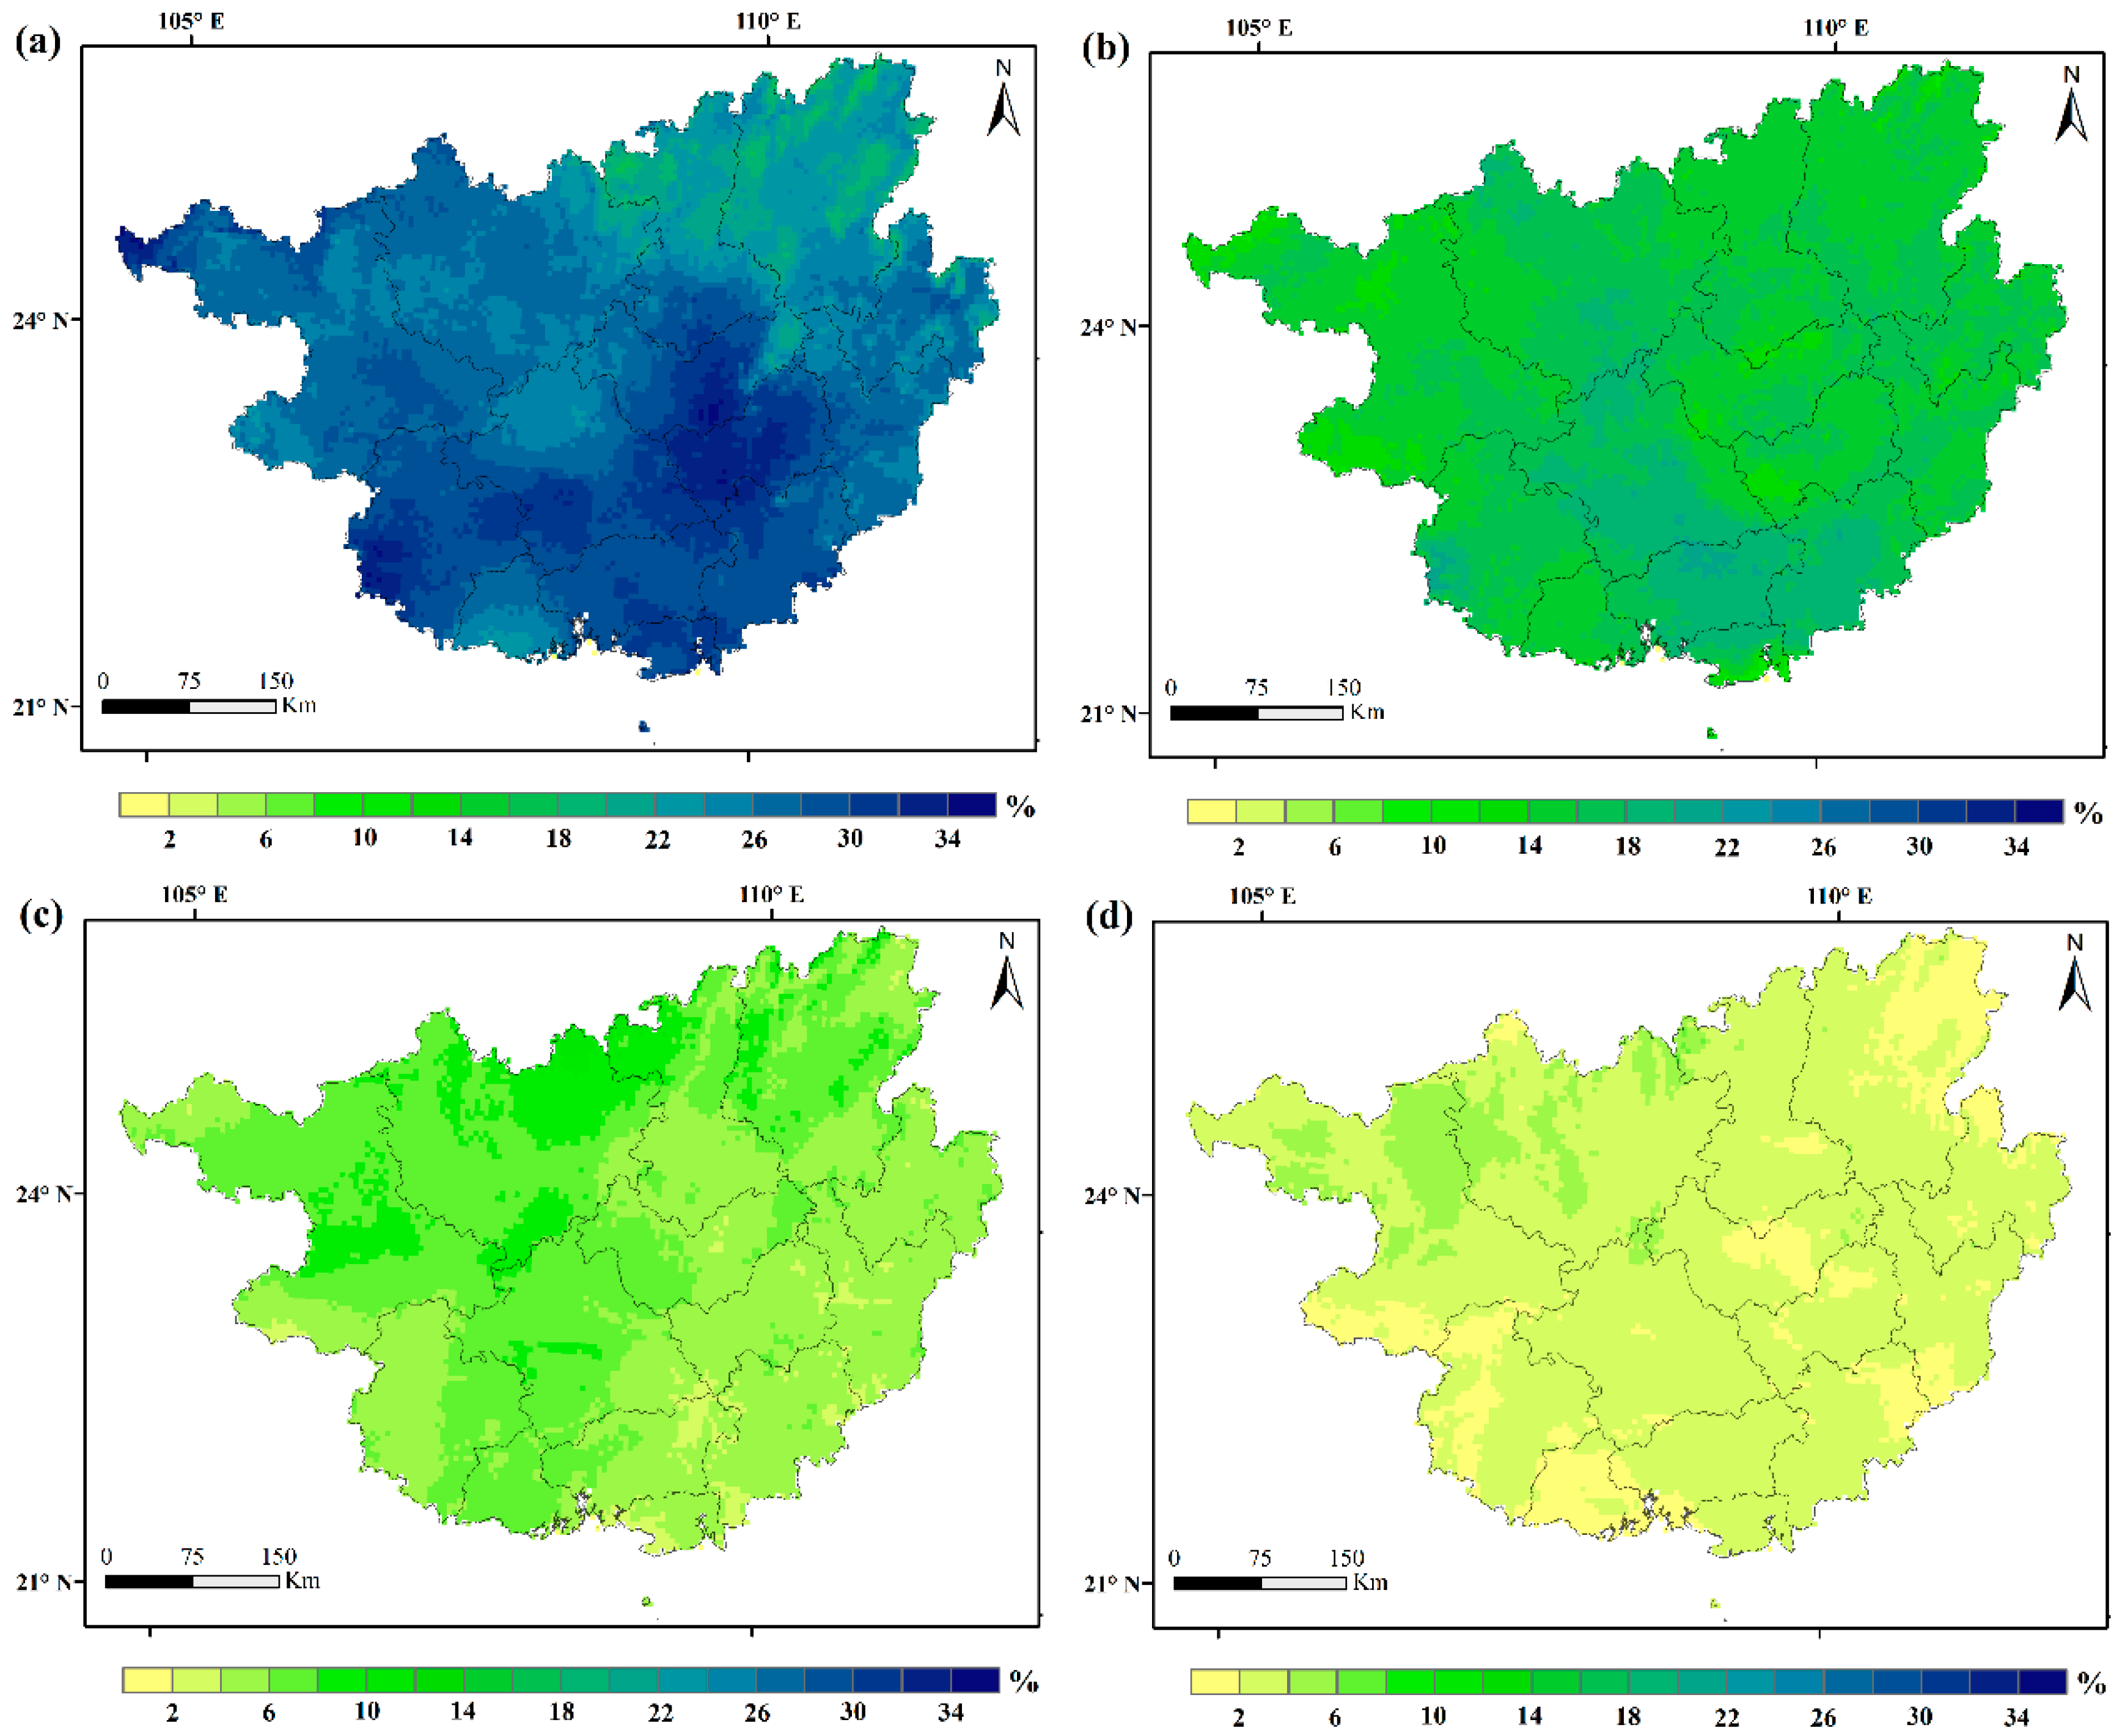
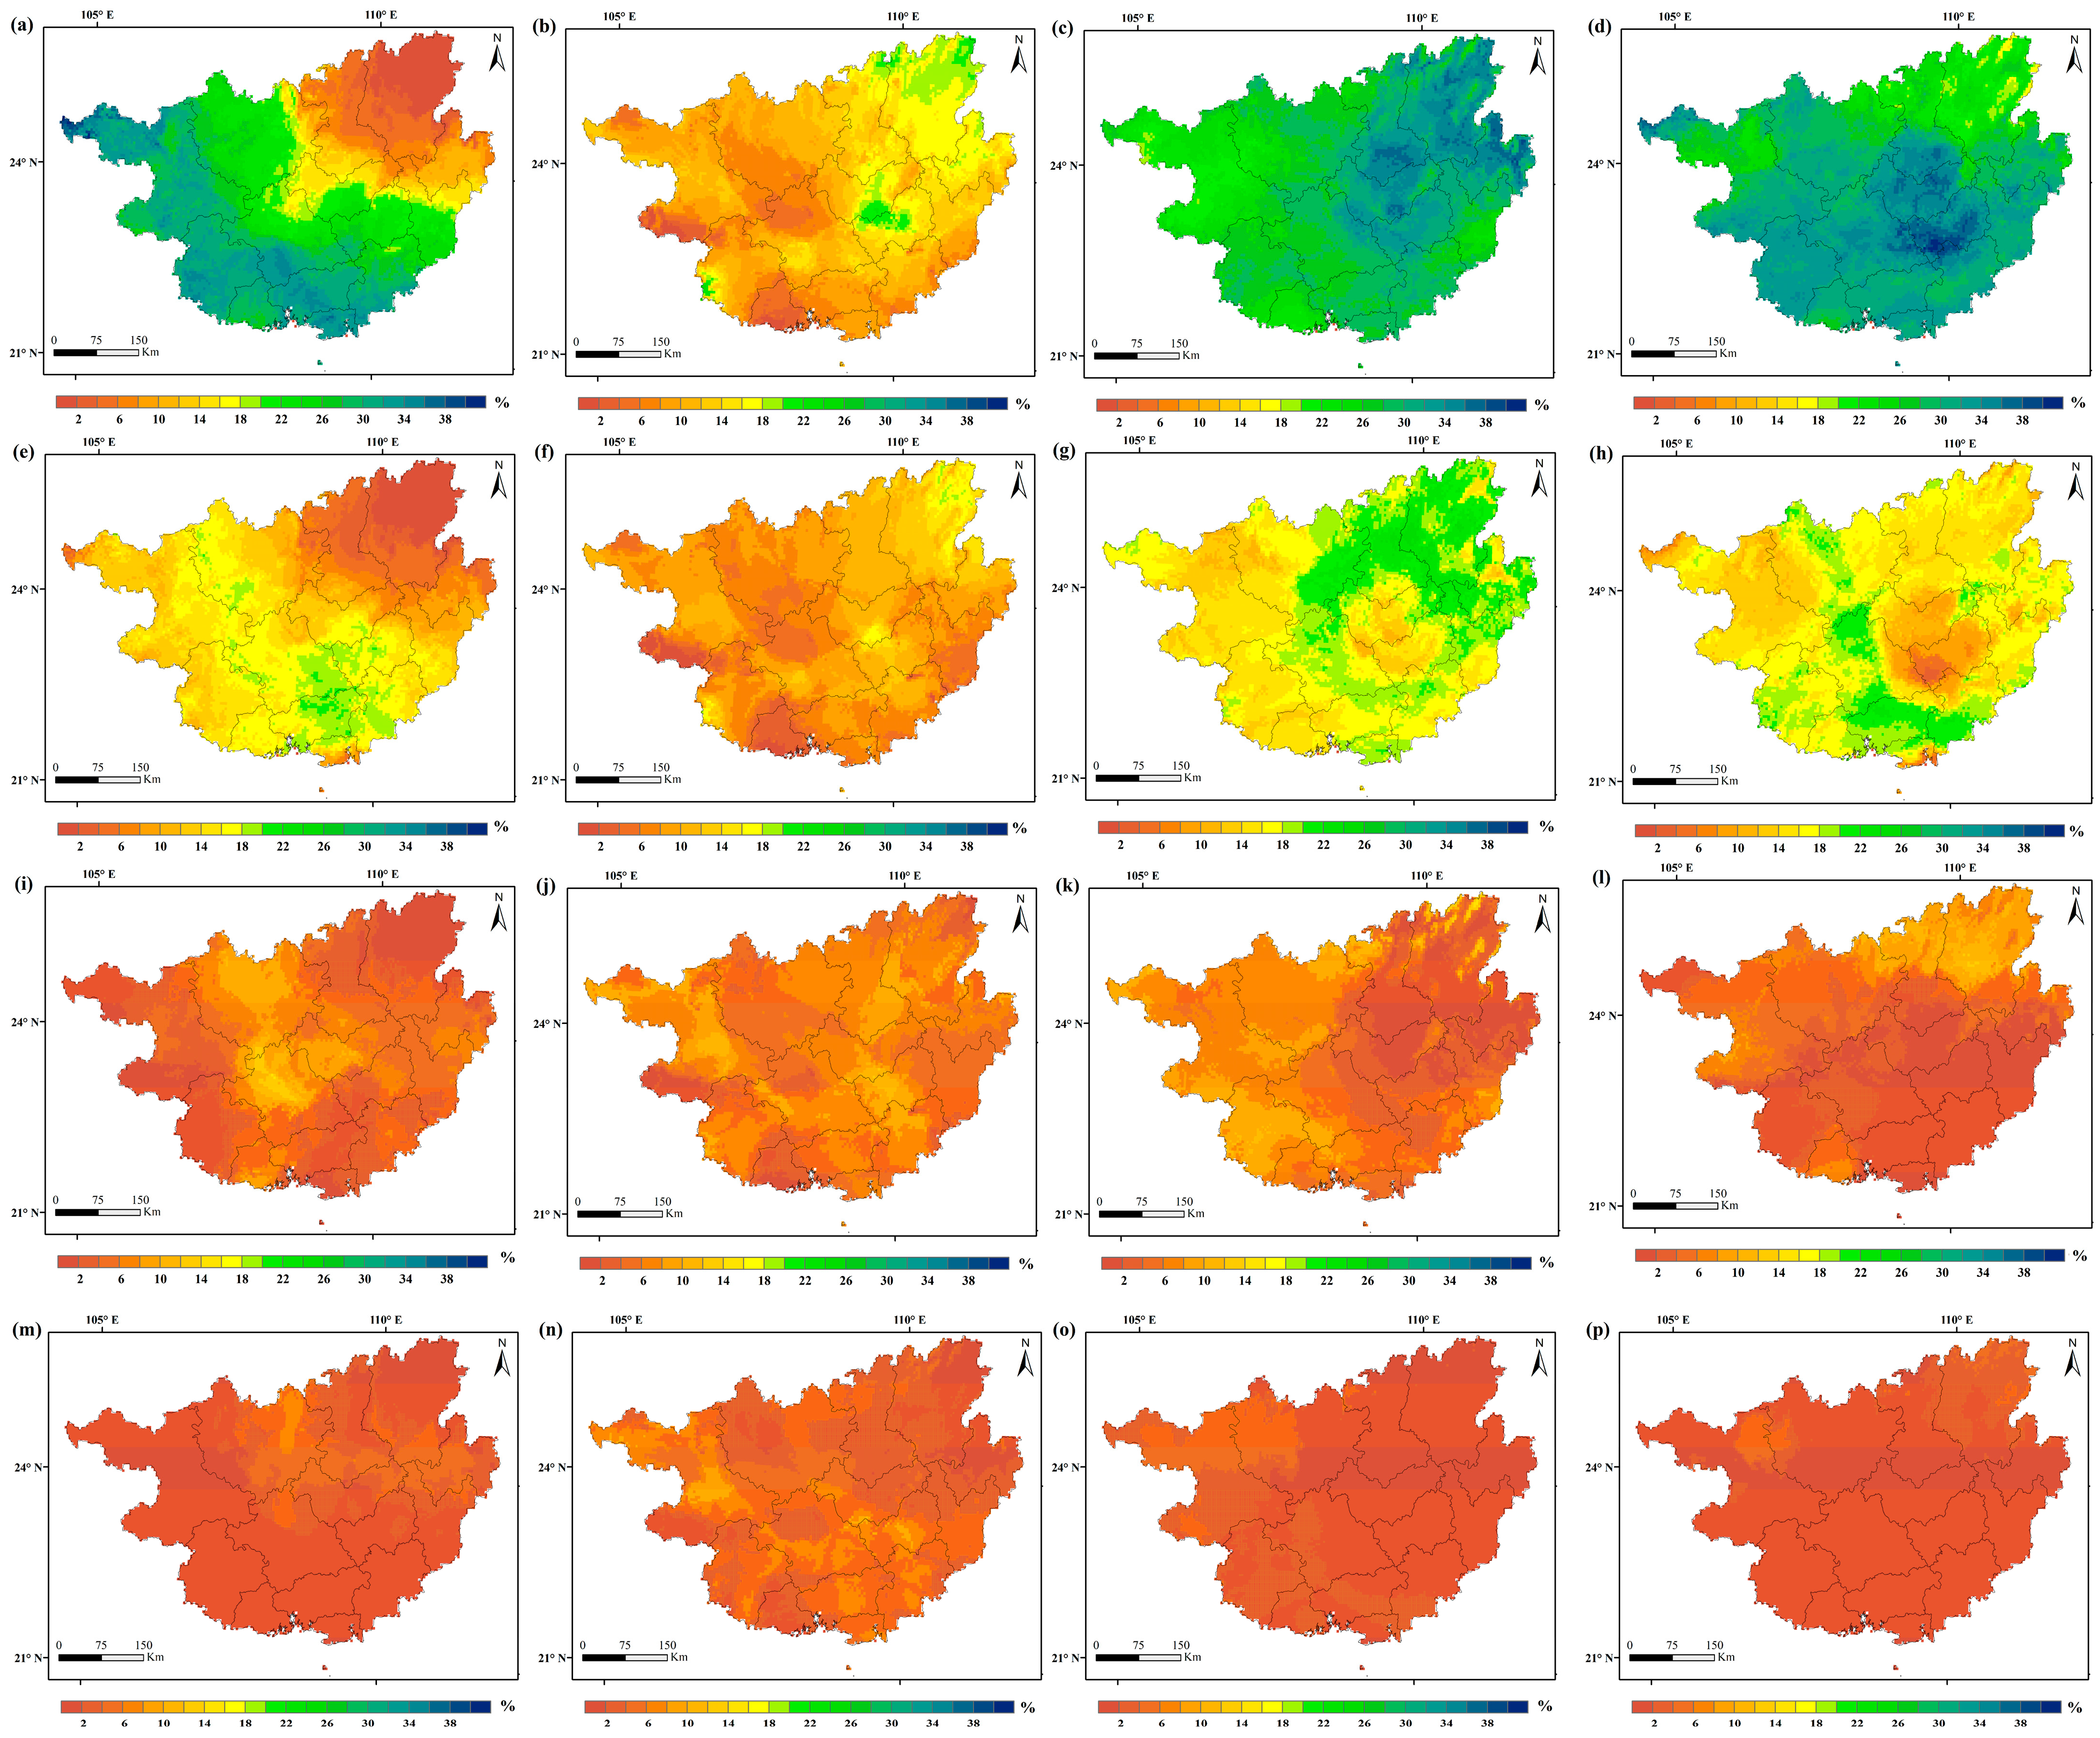
3.2. Statistics of Drought Frequency

The results of the frequency of slight to extreme drought occurrence (Figure 4) indicated that the frequency of slight droughts in Guangxi was 16.37–34.77%, of which the frequency in central Guangxi was the highest, followed by the southern region. The frequency of slight droughts in most other areas was less than 30%. The frequency of moderate droughts was 10.63–21.84%, while it was less than 18% in most areas. The frequency of severe droughts was less than 5% in most areas, with the lowest frequency being 2.29%. The frequency of extreme droughts was extremely low (0–6%), with the value being less than 2% for most areas. The order of the average frequency of different drought levels (Figure 4) was light drought > (26.84%) > moderate drought (16.15%) > severe drought (6.11%) > extreme drought (2.64%) in Guangxi. Overall, no significant geographical difference was observed in the soil droughts.
Figure 5 shows that slight droughts mostly occurred in autumn and winter, lasting for more than 20 months. During spring, the probability of mild weather in the southwest was higher than that in the southeast. During summer, soil droughts occurred for a smaller number of months. The spatial variation of moderate droughts was similar to that of slight droughts, with soil droughts occurring in autumn and winter. Further, the number of months of severe and extreme droughts was relatively small, and the number of months of sudden droughts in each season was mostly less than five months. The underlying surface in Guangxi is relatively uniform, and the water and heat redistribution of this region do not allow for evident regional drought differences, thereby resulting in no spatial heterogeneity. However, severe and extreme droughts occurred in the least number of months. These trends are significantly important factors that affect crop production and carbon accumulation.

3.3. Spatial Evolution Characteristics of Two Extremely Severe Soil Droughts

Two extreme soil drought events, which occurred in 1998 and 2003, were selected from the period 1990–2018 using the drought migration method (Figure 6). The migration direction of drought cores indicated that the two droughts were mainly concentrated in central Guangxi. The 1998 and 2003 soil drought followed a similar northeast to southwest trajectory. The migration paths of the two soil droughts were longer at the initial stage of formation and later extended with the aggravation of drought duration.

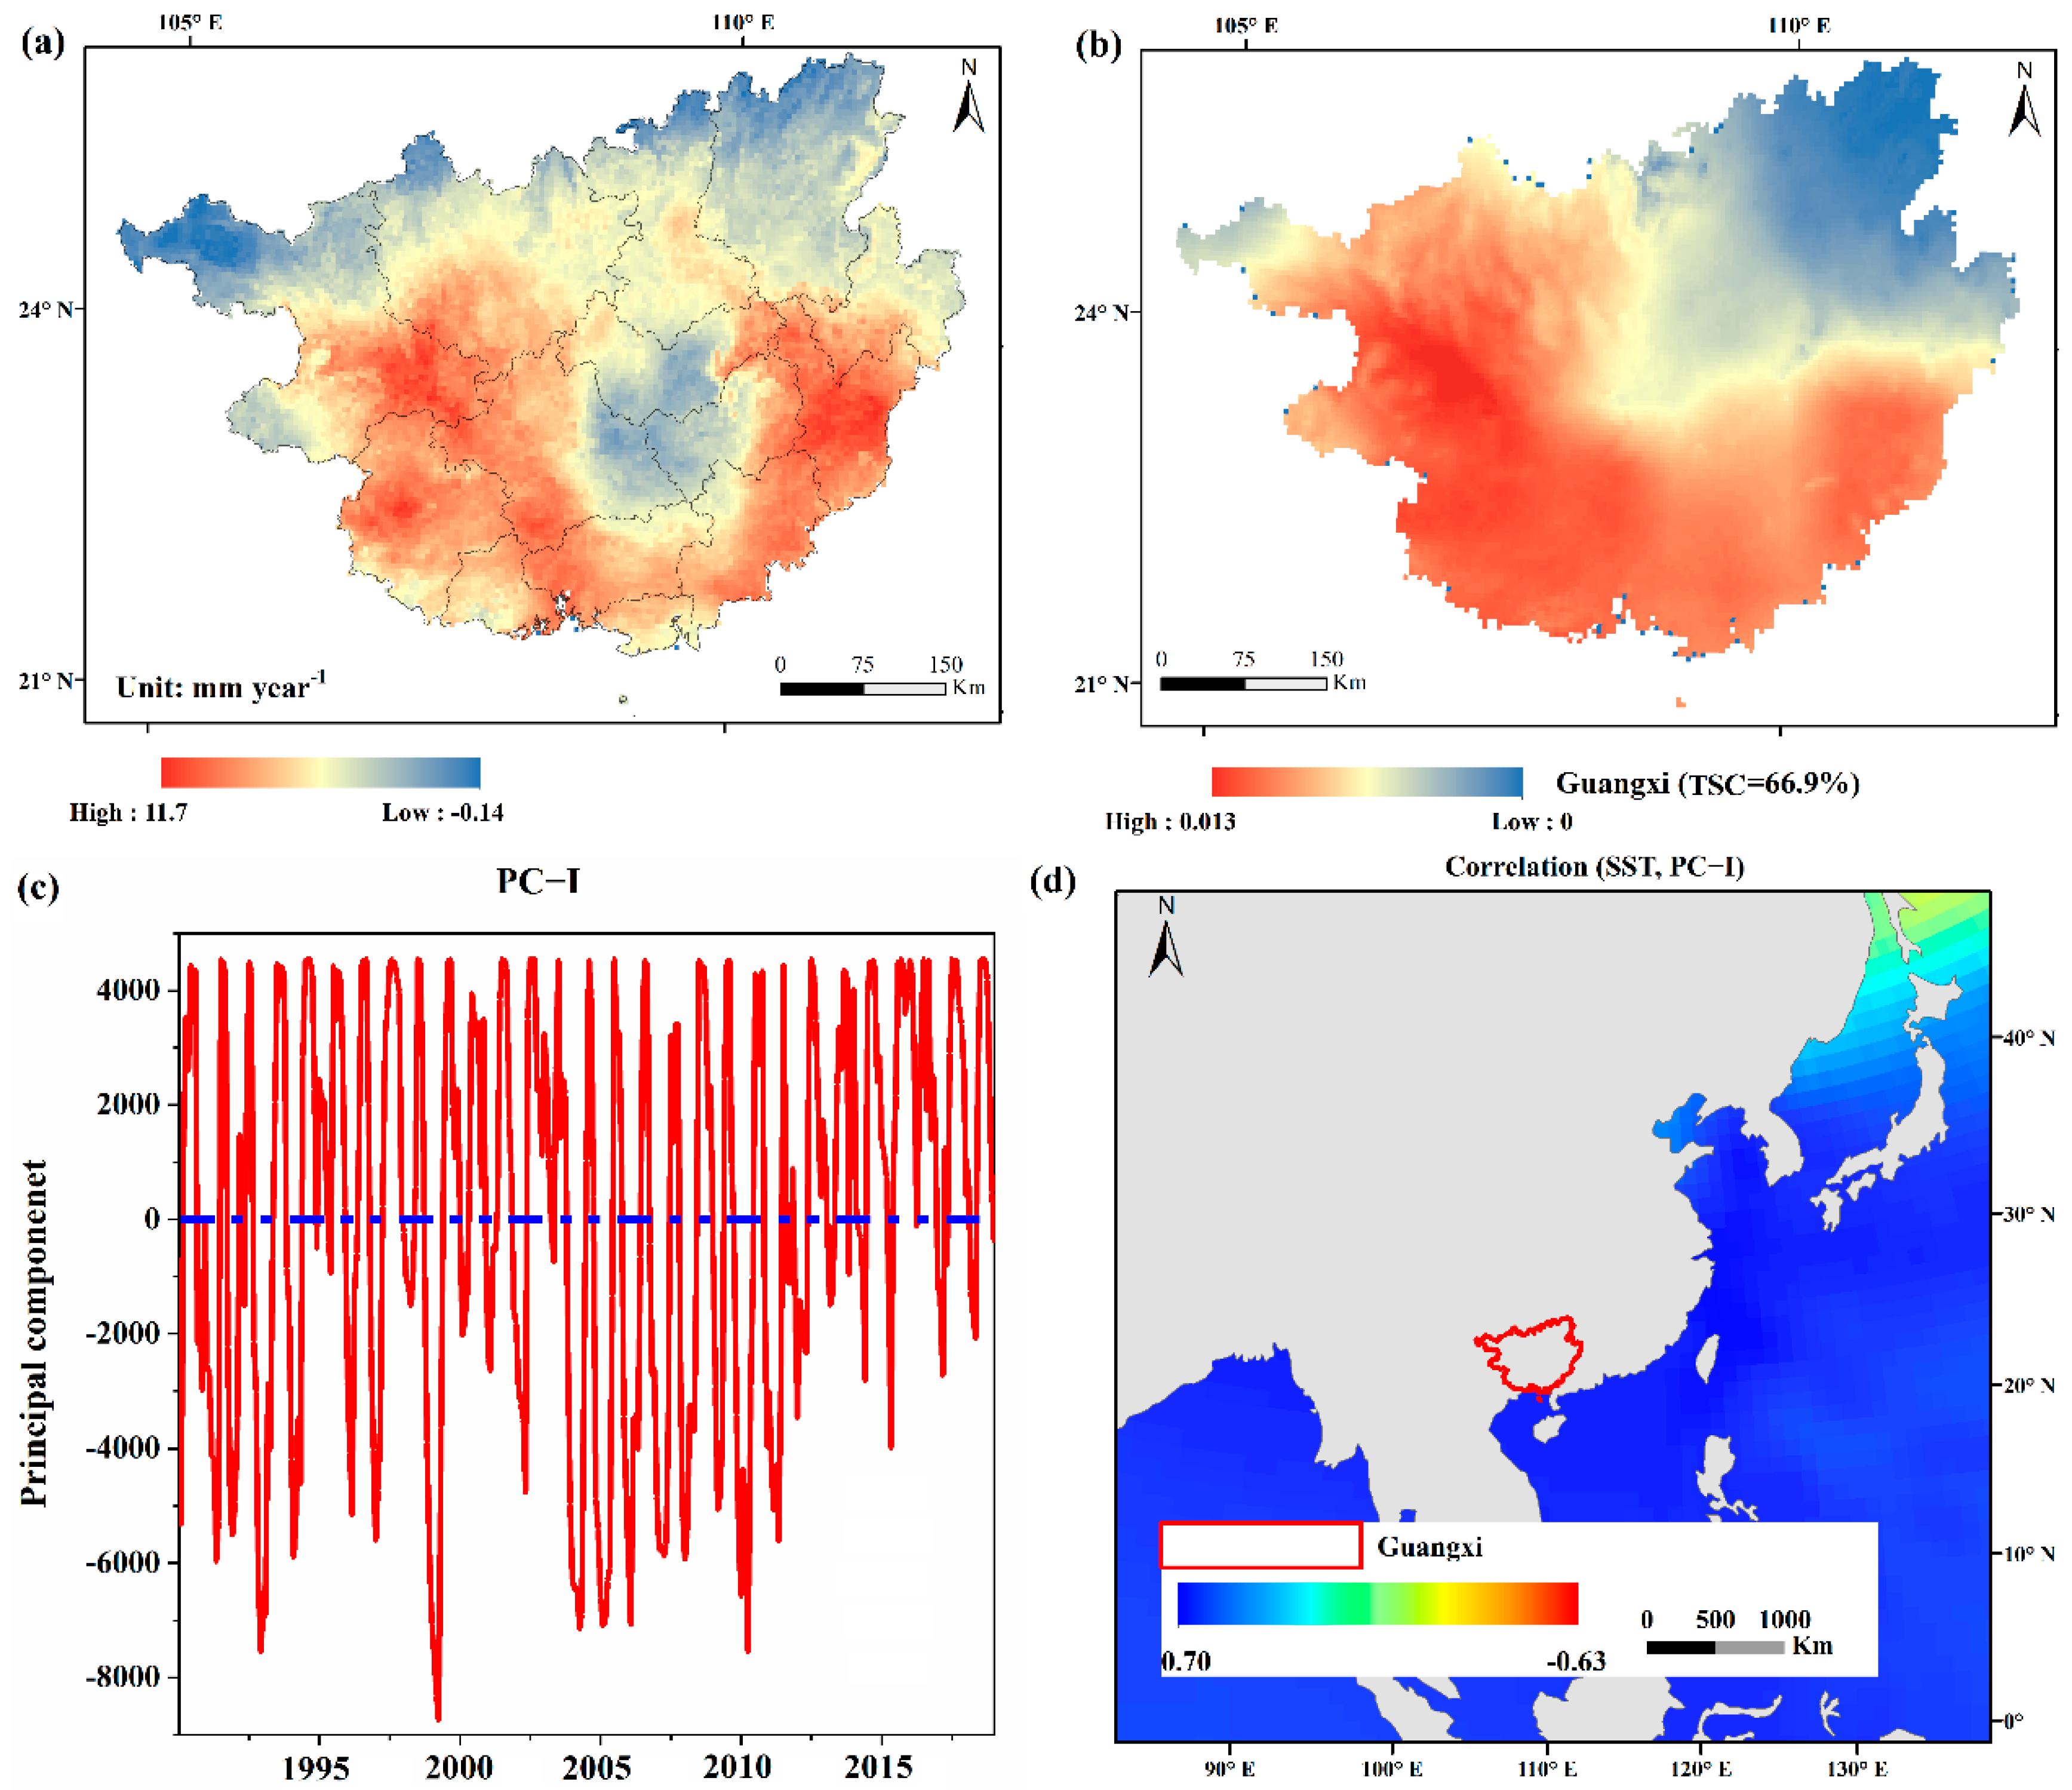
3.4. Correlation between Soil Moisture Anomaly and Ocean Surface Temperature

The soil moisture anomaly is regulated by precipitation, and the main reasons for precipitation differences are caused by anomalies in the ocean temperature [28,29]. Therefore, to understand the importance of atmospheric circulation caused by SST anomaly to soil moisture in Guangxi, we compared the teleconnection between soil moisture and ocean temperature (Figure 7). The spatial variation of the dominant pattern (EOF-1) obtained from EOF analysis was similar to the soil moisture trend during 1990–2018, accounting for 66.9% of the total square covariance of Guangxi. Overall, the PC-1 showed that the soil moisture in Guangxi showed an increasing trend over time. Correlation analysis showed that PC-1 and SST were significantly positively correlated (p < 0.05), suggesting that SST might be an important teleconnection factor affecting soil moisture in Guangxi.

4. Discussion

As soil moisture plays an important role in drought research, an assimilation data product is a useful alternative method in the absence of long-term consistent soil moisture observational data at the national scale [15,30,31]. In this study, TerraClimate soil moisture product was used to construct the SSMI. The soil drought index derived from the data set was ideal to monitor regional droughts, and it accurately describe the spatiotemporal characteristics of regional soil water addition and loss. Using this index, we observed that the drought types in Guangxi are mainly light drought and moderate drought, and the occurrence of severe and extreme drought is relatively low, which is basically once in five years. Spatially, the occurrence frequency is low in the middle and high in the east and west. The majority of the soil droughts in Guangxi evolved from moderate droughts, and the probability of sudden, short, and strong droughts was low. This provides additional time for early warning and prevention from the beginning of droughts to the beginning of abnormal droughts, which further helps to reduce negative implications of droughts.
According to the different disaster seasons, soil droughts can be divided into spring, summer, autumn and winter droughts [15]. The drought pattern in Guangxi differed under the influence of monsoon circulation and tropical cyclone, and the frequency of autumn droughts was the highest, followed by winter droughts, while that of spring and summer droughts was low. Spring droughts refer to the droughts between March and May [32]. During spring, crops bloom, grow, and develop in Guangxi; moreover, it is the sowing and emergence season for spring plants. Spring precipitation in Guangxi is relatively less, and precipitation less than the usual intensity can cause serious droughts that not only affect summer vegetation productivity, but also cause bad spring sowing conditions and affect the growth and harvest of autumn crops and carbon accumulation. Summer affects vegetation productivity and ecosystem operation [33] and is most vulnerable to monsoon. The frequency of droughts in Guangxi in summer was extremely low, possibly due to the location of Guangxi in the monsoon region. In summer, the strong East Asian monsoon brings in a large water mass from the ocean, and the rain-forming clouds over Guangxi lead to abundant regional precipitation, which improves the soil water content. During autumn, autumn harvest plants mature and overwintering plants sprout and are sown. Autumn droughts occur between September and November. They may not only affect the autumn vegetation productivity of the current year, but also the summer vegetation productivity of the next year [34]. Autumn droughts occur almost once every two years in Guangxi, with slight droughts being more common. The frequency of these droughts was higher in the middle-eastern regions than of that in the western regions. Moreover, the frequency of moderate, severe, and extreme droughts in this season was also significantly higher than of that in other seasons. In addition, autumn is generally characterized by water storage, long-term droughts, and less rain. Subsequently, the reductions in runoff cause insufficient water reserves for water conservancy projects, thereby creating difficulties in using water during winter and spring. Winter droughts occur from December to February of the next year. In Guangxi, winter droughts occur once in two years, with slight droughts having a higher frequency in the central and southwest regions than in in the northeast regions. Overall, the frequency of soil droughts in autumn and winter in Guangxi was relatively high. Among these droughts, most were slight and moderate droughts. These findings suggested that the impact of autumn and winter soil droughts should be considered while assessing the impacts of droughts on regional crop production and ecosystem.
From the perspective of temporal characteristics, the two major soil droughts (1998 and 2003) in Guangxi lasted for more than six months. Every natural phenomenon has its own unique process of formation, occurrence, development, and extinction [15]. For example, floods tend to form quickly and can be formed in a few days or even hours [35]. Hurricanes form relatively faster, probably within hours, minutes, or seconds [36]. Contrastingly, the occurrence and development of soil droughts is much slower (several months and several seasons) [15]. Long-term soil water deficit affects the regional crop production and domestic and ecological water demand [13,30]. In addition, regarding the spatial scale, the two major soil droughts in Guangxi occurred extensively. Most areas in Guangxi are affected by the subtropical monsoon humid climate, which reduces the probability of soil droughts. However, once soil droughts occur, the soil moisture in the entire region is relatively reduced. Some studies predict that although Guangxi is a humid region, several measures to deal with soil water deficit under the background of frequent extreme climate events in the future will assist in reducing losses in agricultural production and other associated economic losses [37].
Regarding variability, as soil droughts are temporary phenomena, they are a direct reflection of the persistent anomalies in atmospheric circulation and major weather systems. The time and intensity of monsoon onset and retreat and the duration of monsoon interruption are directly related to soil drought [38]. The atmospheric circulation anomaly refers to the abnormal changes in the development, mutual configuration and interaction, and intensity and location of some atmospheric circulation systems, all of which directly cause large-scale droughts and floods [39,40]. The anomaly of monsoon circulation implies that the time, position, advance and retreat speed, and intensity of monsoon change considerably compare with those of normal years [41,42], which is often the reason for the frequent occurrence of soil droughts in the monsoon region. The abnormal atmospheric or monsoon circulation results in less precipitation in a certain area compared with the normal conditions. When the degree and duration of low precipitation reach a certain degree, meteorological droughts occurs [43]. As precipitation is the main source of water supply, meteorological droughts may induce soil droughts [15]. During the early stage of meteorological droughts, the soil moisture content will not decrease immediately due to the regulation and storage of soil moisture [44]. However, less precipitation is generally accompanied by a temperature increase, which further enhances evapotranspiration and excessive water consumption in the vadose zone. Under other constant conditions, when the meteorological droughts intensify and spread further, the precipitation and runoff may decrease, while the water in the vadose zone will continue to be consumed and not be supplemented, and thus, the soil water condition will further deteriorate [45,46]. Our findings indicated a strong positive correlation between the soil moisture in Guangxi and the ocean temperature in the surrounding sea area, which was in agreement with our assumption that the ocean surface temperature anomaly creates the atmospheric circulation anomaly or monsoon circulation anomaly, and later affects the rainfall and soil moisture anomaly in Guangxi.
This study makes up for the deficiency of previous studies on drought in Guangxi from the perspective of soil moisture, but the analysis results still have some uncertainties and deficiencies. First, this study only selects TerraClimate soil moisture products with high spatial resolution, but the applicability of this data in karst areas has not been fully evaluated. However, comparing the soil moisture products through model and reanalysis, TerraClimate soil moisture, which is more reliable and corrected by remote sensing and models, has been applied to the study of Guangxi for the first time. In addition, there are many factors affecting the dynamics of soil moisture in the driving force analysis. This study uses the most fundamental driving factor—ocean surface temperature, which may not fully explain the long-term evolution characteristics of soil drought in Guangxi.

5. Conclusions

In this study, the SSMI model was constructed using the TerraClimate soil moisture data; additionally, the applicability of SSMI in soil drought monitoring in Guangxi was evaluated. The following conclusions were drawn: (1) The annual autumn and winter soil droughts in Guangxi were moderate from 1990 to 2018, and the probability of moderate and higher-grade drought after 2005 is much lower than that before 2005. (2) The level of soil drought in Guangxi is mainly light drought and moderate drought, and the possibility of severe drought and extreme drought is relatively low. (3) Two severe soil droughts that occurred in 1998 and 2003 exhibited a large disaster-affected area and persisted for a long duration. (4) The principal component variables of ocean surface temperature and soil moisture showed a strong positive correlation, implying that the ocean surface temperature anomaly may be the root driving force of soil moisture variation in Guangxi. These findings provide scientific guidance for the early warning, prevention, and mitigation of social, ecological, and economic losses associated with soil droughts in Guangxi. Moreover, the results serve as a valuable reference for understanding the impacts of large-scale climate anomalies on soil moisture.

Author Contributions

Conceptualization, R.L. and W.W.; methodology, W.W.; software, R.L.; validation, R.L., W.W. and J.S.; formal analysis, J.S.; investigation, R.L.; resources, W.W.; data curation, J.S.; writing—original draft preparation, R.L.; writing—review and editing, R.L.; visualization, J.S.; supervision, R.L.; project administration, R.L.; funding acquisition, W.W. All authors have read and agreed to the published version of the manuscript.

Funding

This research received no external funding.

Data Availability Statement

Not applicable.

Acknowledgments

This work was funded partially by the National Natural Science Foundation of China (no. 52079033), and Guangxi Key R&D Program (Guike AB19259015) assisted with data presentation.

Conflicts of Interest

All individuals included in this section have consented to the acknowledgement.

References

  1. Dai, A.G. Drought under global warming: A review. Wiley Interdiscip. Rev.-Clim. Chang. 2011, 2, 45–65. [Google Scholar] [CrossRef] [Green Version]
  2. Reichstein, M.; Bahn, M.; Ciais, P.; Frank, D.; Mahecha, M.D.; Seneviratne, S.I.; Zscheischler, J.; Beer, C.; Buchmann, N.; Frank, D.C.; et al. Climate extremes and the carbon cycle. Nature 2013, 500, 287–295. [Google Scholar] [CrossRef] [PubMed]
  3. Xu, C.; McDowell, N.G.; Fisher, R.A.; Wei, L.; Sevanto, S.; Christoffersen, B.O.; Weng, E.; Middleton, R.S. Increasing impacts of extreme droughts on vegetation productivity under climate change. Nat. Clim. Chang. 2019, 9, 948–953. [Google Scholar] [CrossRef] [Green Version]
  4. Anderegg, W.R.L.; Konings, A.G.; Trugman, A.T.; Yu, K.; Bowling, D.R.; Gabbitas, R.; Karp, D.S.; Pacala, S.; Sperry, J.S.; Sulman, B.N.; et al. Hydraulic diversity of forests regulates ecosystem resilience during drought. Nature 2018, 561, 538–541. [Google Scholar] [CrossRef] [PubMed] [Green Version]
  5. Hao, C.; Zhang, J.H.; Yao, F.M. Combination of multi-sensor remote sensing data for drought monitoring over Southwest China. Int. J. Appl. Earth Obs. Geoinf. 2015, 35, 270–283. [Google Scholar] [CrossRef]
  6. Liu, Q.; Zhang, S.; Zhang, H.R.; Bai, Y.; Zhang, J.H. Monitoring drought using composite drought indices based on remote sensing. Sci. Total Environ. 2020, 711, 10. [Google Scholar] [CrossRef] [PubMed]
  7. Barriopedro, D.; Gouveia, C.M.; Trigo, R.M.; Wang, L. The 2009/10 Drought in China: Possible Causes and Impacts on Vegetation. J. Hydrometeorol. 2012, 13, 1251–1267. [Google Scholar] [CrossRef] [Green Version]
  8. Zhang, A.Z.; Jia, G.S. Monitoring meteorological drought in semiarid regions using multi-sensor microwave remote sensing data. Remote Sens. Environ. 2013, 134, 12–23. [Google Scholar] [CrossRef]
  9. Li, X.Z.; Xu, X.L.; Liu, W.; He, L.; Zhang, R.F.; Xu, C.H.; Wang, K.L. Similarity of the temporal pattern of soil moisture across soil profile in karst catchments of southwestern China. J. Hydrol. 2017, 555, 659–669. [Google Scholar] [CrossRef]
  10. Xiao, Z.Q.; Jiang, L.M.; Zhu, Z.L.; Wang, J.D.; Du, J.Y. Spatially and Temporally Complete Satellite Soil Moisture Data Based on a Data Assimilation Method. Remote Sens. 2016, 8, 49. [Google Scholar] [CrossRef] [Green Version]
  11. Wei, X.; Zhou, Q.; Cai, M.; Wang, Y. Effects of Vegetation Restoration on Regional Soil Moisture Content in the Humid Karst Areas—A Case Study of Southwest China. Water 2021, 13, 321. [Google Scholar] [CrossRef]
  12. Humphrey, V.; Berg, A.; Ciais, P.; Gentine, P.; Jung, M.; Reichstein, M.; Seneviratne, S.I.; Frankenberg, C. Soil moisture–atmosphere feedback dominates land carbon uptake variability. Nature 2021, 592, 65–69. [Google Scholar] [CrossRef] [PubMed]
  13. Green, J.K.; Seneviratne, S.I.; Berg, A.M.; Findell, K.L.; Hagemann, S.; Lawrence, D.M.; Gentine, P. Large influence of soil moisture on long-term terrestrial carbon uptake. Nature 2019, 565, 476–479. [Google Scholar] [CrossRef] [PubMed]
  14. Liu, L.; Gudmundsson, L.; Hauser, M.; Qin, D.; Li, S.; Seneviratne, S.I. Soil moisture dominates dryness stress on ecosystem production globally. Nat. Commun. 2020, 11, 4892. [Google Scholar] [CrossRef] [PubMed]
  15. Han, Z.; Huang, Q.; Huang, S.; Leng, G.; Bai, Q.; Liang, H.; Wang, L.; Zhao, J.; Fang, W. Spatial-temporal dynamics of agricultural drought in the Loess Plateau under a changing environment: Characteristics and potential influencing factors. Agric. Water Manag. 2021, 244, 106540. [Google Scholar] [CrossRef]
  16. Liu, Q.; Reichle, R.H.; Bindlish, R.; Cosh, M.H.; Crow, W.T.; de Jeu, R.; De Lannoy, G.J.M.; Huffman, G.J.; Jackson, T.J. The Contributions of Precipitation and Soil Moisture Observations to the Skill of Soil Moisture Estimates in a Land Data Assimilation System. J. Hydrometeorol. 2011, 12, 750–765. [Google Scholar] [CrossRef]
  17. Wang, Z.D.; Guo, P.; Wan, H.; Tian, F.Y.; Wang, L.J. Integration of Microwave and Optical/Infrared Derived Datasets from Multi-Satellite Products for Drought Monitoring. Water 2020, 12, 1504. [Google Scholar] [CrossRef]
  18. Colliander, A.; Jackson, T.J.; Bindlish, R.; Chan, S.; Das, N.; Kim, S.B.; Cosh, M.H.; Dunbar, R.S.; Dang, L.; Pashaian, L.; et al. Validation of SMAP surface soil moisture products with core validation sites. Remote Sens. Environ. 2017, 191, 215–231. [Google Scholar] [CrossRef]
  19. Piles, M.; Camps, A.; Vall-Llossera, M.; Corbella, I.; Panciera, R.; Rudiger, C.; Kerr, Y.H.; Walker, J. Downscaling SMOS-Derived Soil Moisture Using MODIS Visible/Infrared Data. IEEE Trans. Geosci. Remote Sens. 2011, 49, 3156–3166. [Google Scholar] [CrossRef]
  20. de Figueiredo, T.; Royer, A.C.; Fonseca, F.; Schütz, F.; Hernández, Z. Regression Models for Soil Water Storage Estimation Using the ESA CCI Satellite Soil Moisture Product: A Case Study in Northeast Portugal. Water 2020, 13, 37. [Google Scholar] [CrossRef]
  21. Abatzoglou, J.; Dobrowski, S.; Parks, S.; Hegewisch, K. TerraClimate, a high-resolution global dataset of monthly climate and climatic water balance from 1958–2015. Sci. Data 2018, 5, 170191. [Google Scholar] [CrossRef] [Green Version]
  22. Abdi, O. Climate-Triggered Insect Defoliators and Forest Fires Using Multitemporal Landsat and TerraClimate Data in NE Iran: An Application of GEOBIA TreeNet and Panel Data Analysis. Sensors 2019, 19, 3965. [Google Scholar] [CrossRef] [PubMed] [Green Version]
  23. Zhou, Q.W.; Sun, Z.Y.; Liu, X.L.; Wei, X.C.; Peng, Z.; Yue, C.W.; Luo, Y.X. Temporal Soil Moisture Variations in Different Vegetation Cover Types in Karst Areas of Southwest China: A Plot Scale Case Study. Water 2019, 11, 1423. [Google Scholar] [CrossRef] [Green Version]
  24. Zhao, M.; Aa, G.; Velicogna, I.; Kimball, J. A Global Gridded Dataset of GRACE Drought Severity Index for 2002–14: Comparison with PDSI and SPEI and a Case Study of the Australia Millennium Drought. J. Hydrometeorol. 2017, 18, 2117–2129. [Google Scholar] [CrossRef] [Green Version]
  25. McKee, T.; Doesken, N.; Kleist, J. The Relationship of Drought Frequency and Duration to Time Scales. In Proceedings of the 8th Conference on Applied Climatology, Anaheim, CA, USA, 17–22 January 1993; Volume 17. [Google Scholar]
  26. Friedman, M. On the analysis and solution of certain geographical optimal covering problems. Comput. OR 1976, 3, 283–294. [Google Scholar] [CrossRef]
  27. Lyons, S. Empirical Orthogonal Function Analysis of Hawaiian Rainfall. J. Appl. Meteorol. 1982, 21, 1713–1729. [Google Scholar] [CrossRef] [Green Version]
  28. Liu, Y.; Zhang, Y.; Cai, J.; Tsou, J.Y. Analyzing the Effects of Sea Surface Temperature (SST) on Soil Moisture (SM) in Coastal Areas of Eastern China. Remote Sens. 2020, 12, 2216. [Google Scholar] [CrossRef]
  29. Yoon, J.-H.; Leung, L. Assessing the relative influence of surface soil moisture and ENSO SST on precipitation predictability over the contiguous United States: IMPORTANCE OF SOIL MOISTURE MEMORY. Geophys. Res. Lett. 2015, 42, 5005–5013. [Google Scholar] [CrossRef]
  30. Kedzior, M.; Zawadzki, J. Comparative study of soil moisture estimations from SMOS satellite mission, GLDAS database, and cosmic-ray neutrons measurements at COSMOS station in Eastern Poland. Geoderma 2016, 283, 21–31. [Google Scholar] [CrossRef]
  31. Samaniego, L.; Thober, S.; Kumar, R.; Wanders, N.; Rakovec, O.; Pan, M.; Zink, M.; Sheffield, J.; Wood, E.F.; Marx, A. Anthropogenic warming exacerbates European soil moisture droughts. Nat. Clim. Chang. 2018, 8, 421–426. [Google Scholar] [CrossRef]
  32. Gao, T.; Wulan, W.L.; Yu, X.; Yang, Z.L.; Gao, J.; Hua, W.Q.; Yang, P.; Si, Y.B. A seasonal forecast scheme for the Inner Mongolia spring drought part-II: A logical reasoning evidence-based method for spring predictions. Theor. Appl. Climatol. 2019, 136, 703–715. [Google Scholar] [CrossRef]
  33. Wei, Y.Q.; Jin, J.L.; Jiang, S.M.; Ning, S.W.; Cui, Y.; Zhou, Y.L. Simulated Assessment of Summer Maize Drought Loss Sensitivity in Huaibei Plain, China. Agronomy-Basel 2019, 9, 78. [Google Scholar] [CrossRef] [Green Version]
  34. Doroszewski, A.; Zylowska, K.; Nierobca, A.; Berbec, T. Agricultural autumn drought and crop yield in 2011 in Poland. Idojaras 2018, 122, 361–374. [Google Scholar] [CrossRef]
  35. Zhang, T.; Wang, W.; Tanguang, G.; Baosheng, A. Simulation and Assessment of Future Glacial Lake Outburst Floods in the Poiqu River Basin, Central Himalayas. Water 2021, 13, 1376. [Google Scholar] [CrossRef]
  36. Goldenberg, S.B.; Landsea, C.W.; Mestas-Nunez, A.M.; Gray, W.M. The recent increase in Atlantic hurricane activity: Causes and implications. Science 2001, 293, 474–479. [Google Scholar] [CrossRef] [PubMed] [Green Version]
  37. Qin, N.X.; Wang, J.N.; Gao, L.; Hong, Y.; Huang, J.L.; Lu, Q.Q. Observed trends of different rainfall intensities and the associated spatiotemporal variations during 1958–2016 in Guangxi, China. Int. J. Climatol. 2021, 41, E2880–E2895. [Google Scholar] [CrossRef]
  38. Wang, H.J.; Chen, Y.N.; Pan, Y.P.; Li, W.H. Spatial and temporal variability of drought in the arid region of China and its relationships to teleconnection indices. J. Hydrol. 2015, 523, 283–296. [Google Scholar] [CrossRef]
  39. Bombardi, R.J.; Moron, V.; Goodnight, J.S. Detection, variability, and predictability of monsoon onset and withdrawal dates: A review. Int. J. Climatol. 2020, 40, 641–667. [Google Scholar] [CrossRef]
  40. Zhang, Y.X.; Wu, M.X.; Li, D.L.; Liu, Y.G.; Li, S.C. Spatiotemporal Decompositions of Summer Drought in China and Its Teleconnection with Global Sea Surface Temperatures during 1901–2012. J. Clim. 2017, 30, 6391–6412. [Google Scholar] [CrossRef]
  41. Qiu, J.Z.; Wang, Y.P.; Xiao, J. Spatiotemporal Distribution of Droughts in the Xijiang River Basin, China and Its Responses to Global Climatic Events. Water 2017, 9, 265. [Google Scholar] [CrossRef] [Green Version]
  42. Bombardi, R.J.; Kinter, J.L.; Frauenfeld, O.W. A Global Gridded Dataset of the Characteristics of the Rainy And Dry Seasons. Bull. Amer. Meteorol. Soc. 2019, 100, 1315–1328. [Google Scholar] [CrossRef]
  43. Deng, S.L.; Chen, T.; Yang, N.; Qu, L.; Li, M.C.; Chen, D. Spatial and temporal distribution of rainfall and drought characteristics across the Pearl River basin. Sci. Total Environ. 2018, 619, 28–41. [Google Scholar] [CrossRef] [PubMed]
  44. Varikoden, H.; Revadekar, J.V. Relation Between the Rainfall and Soil Moisture During Different Phases of Indian Monsoon. Pure Appl. Geophys. 2018, 175, 1187–1196. [Google Scholar] [CrossRef]
  45. Haiyan, D.A.I.; Haimei, W. Influence of rainfall events on soil moisture in a typical steppe of Xilingol. Phys. Chem. Earth 2021, 121, 5. [Google Scholar] [CrossRef]
  46. Jadidoleslam, N.; Mantilla, R.; Krajewski, W.F.; Goska, R. Investigating the role of antecedent SMAP satellite soil moisture, radar rainfall and MODIS vegetation on runoff production in an agricultural region. J. Hydrol. 2019, 579, 10. [Google Scholar] [CrossRef] [Green Version]
Figure 1. Geographical location of Guangxi. (a) The position of Guangxi in China, the green area in the picture is Guangxi; (b) altitude map; (c) land-use types derived from the European Space Agency.
Water 14 00289 g001
Figure 2. Variation curve of soil moisture in Guangxi. (a) Changes in SSMI monthly time series. (b) Damaged areas affected by soil drought. Damaged area is defined as the ratio between the number of pixels with a certain level of drought and the total number of pixels in this area, and then the ratio is multiplied by the total area of Guangxi to obtain the regional drought damage area.
Water 14 00289 g002
Figure 3. Seasonal variations in SSMI in Guangxi.
Water 14 00289 g003
Figure 4. Frequency of different soil drought levels. (a) Slight droughts, (b) moderate droughts (c) severe droughts, and (d) extreme droughts.
Water 14 00289 g004
Figure 5. Spatial variations in the frequency of drought months in different seasons in Guangxi. (ad) Frequency of slight droughts in each season ((ad) represent spring, summer, autumn, and winter, respectively); (eh) frequency of moderate droughts in each season; (i–l) frequency of severe droughts in each season; (mp) frequency of extreme droughts in each season.
Water 14 00289 g005
Figure 6. Spatial migration process of soil droughts. The direction of the black arrow indicates the migration direction of droughts in the next month. The green and red circles indicate the comprehensive drought index of the current month. (a) Average SSMI from September 1998 to March 1999, (b) spatial migration of the 1998 soil drought from September 1998 to March 1999, (c) average SSMI value from November 2003 to April 2004, and (d) spatial migration of the 2003 soil drought from November 2003 to April 2004.
Water 14 00289 g006
Figure 7. Relationship between SSMI and sea surface temperature in Guangxi during 1990–2018. (a) Spatial trend of soil moisture, (b) main transformer mode calculated using an empirical orthogonal function (EOF-1), (c) main transformer mode (EOF-1) corresponding to the monthly change in the principal component (PC-1), and (d) correlation between ocean temperature and PC-1 (corresponding to EOF-1).
Water 14 00289 g007
Publisher’s Note: MDPI stays neutral with regard to jurisdictional claims in published maps and institutional affiliations.

