Article

Effectiveness and Characterization of Novel Mineral Clay in Cd2+ Adsorption Process: Linear and Non-Linear Isotherm Regression Analysis

1
Environmental Science Department, Sapientia Hungarian University of Transylvania, Calea Turzii. No. 4, 400193 Cluj-Napoca, Romania
2
Lithosphere Fluid Research Laboratory, Department of Petrology and Geochemistry, Institute of Geography and Earth Sciences, Eötvös Loránd University, 1117 Budapest, Hungary
3
Institute of Environmental Science and Technology, University of Szeged, Tisza Lajos krt. 103, 6720 Szeged, Hungary
4
Department of Horticulture, Faculty of Technical and Human Sciences, Sapientia Hungarian University of Transylvania, 400112 Cluj-Napoca, Romania
5
Department of Mass Spectrometry, Chromatography and Applied Physics, National Institute for Research and Development of Isotopic and Molecular Technologies, 67-103 Donath Street, 400293 Cluj-Napoca, Romania
6
Department of Genetics, Microbiology and Biotechnology, Hungarian University of Agriculture and Life Sciences, Páter Károly No. 1, 2100 Gödöllő, Hungary
*
Authors to whom correspondence should be addressed.
Water 2022, 14(3), 279; https://doi.org/10.3390/w14030279
Submission received: 20 December 2021 / Revised: 11 January 2022 / Accepted: 15 January 2022 / Published: 18 January 2022
(This article belongs to the Special Issue Solid/Liquid Adsorption in Water and Wastewater Treatment)

Abstract

:
The excellent adsorption properties of clay minerals make the optimization of heavy metal removal the subject of numerous research projects. In the present study, ASLAVITAL cosmetic clay (ACC) powder was applied for the removal of Cd2+ from water. The main deposit of ACC clay is the Pădurea Craiului Mountains in Romania. A wide range of morpho-structural approaches (SEM, EDX, FTIR, Raman, XRD) were used to characterize the morphology and elemental composition of the adsorbent. As expected for clay minerals, Al (Wt(%) = 11.4 ± 0.9) and Si (Wt(%) = 13.7 ± 1.4) are the main constituents of ACC. After adsorption, Wt(%) = 0.2 ± 0.01 Cd2+ was detected in the sample. As proved before, the initial metal concentration is the primary influencing factor; therefore, batch adsorption of 10–160 mg/L Cd2+ was investigated. After 190 min, an efficiency of 99% was reached, and the quantity in equilibrium increased from 1–8 mg/g. The best fit in linear form was obtained for the Langmuir II. model, where R2 = 0.954 (RL = 0.037–0.027). Based on linear isotherm models, physical bonds formed between ACC and Cd2+ during the favorable adsorption. For the non-linear fits, the Liu model proved to be the best R2 = 0.965, χ2 = 1.101. Pseudo-II-order kinetic model described the experimental data R2 = 0.988–0.999; qexp and qcalc were almost identical (the differences ranged 0.03–0.34).

Graphical Abstract

1. Introduction

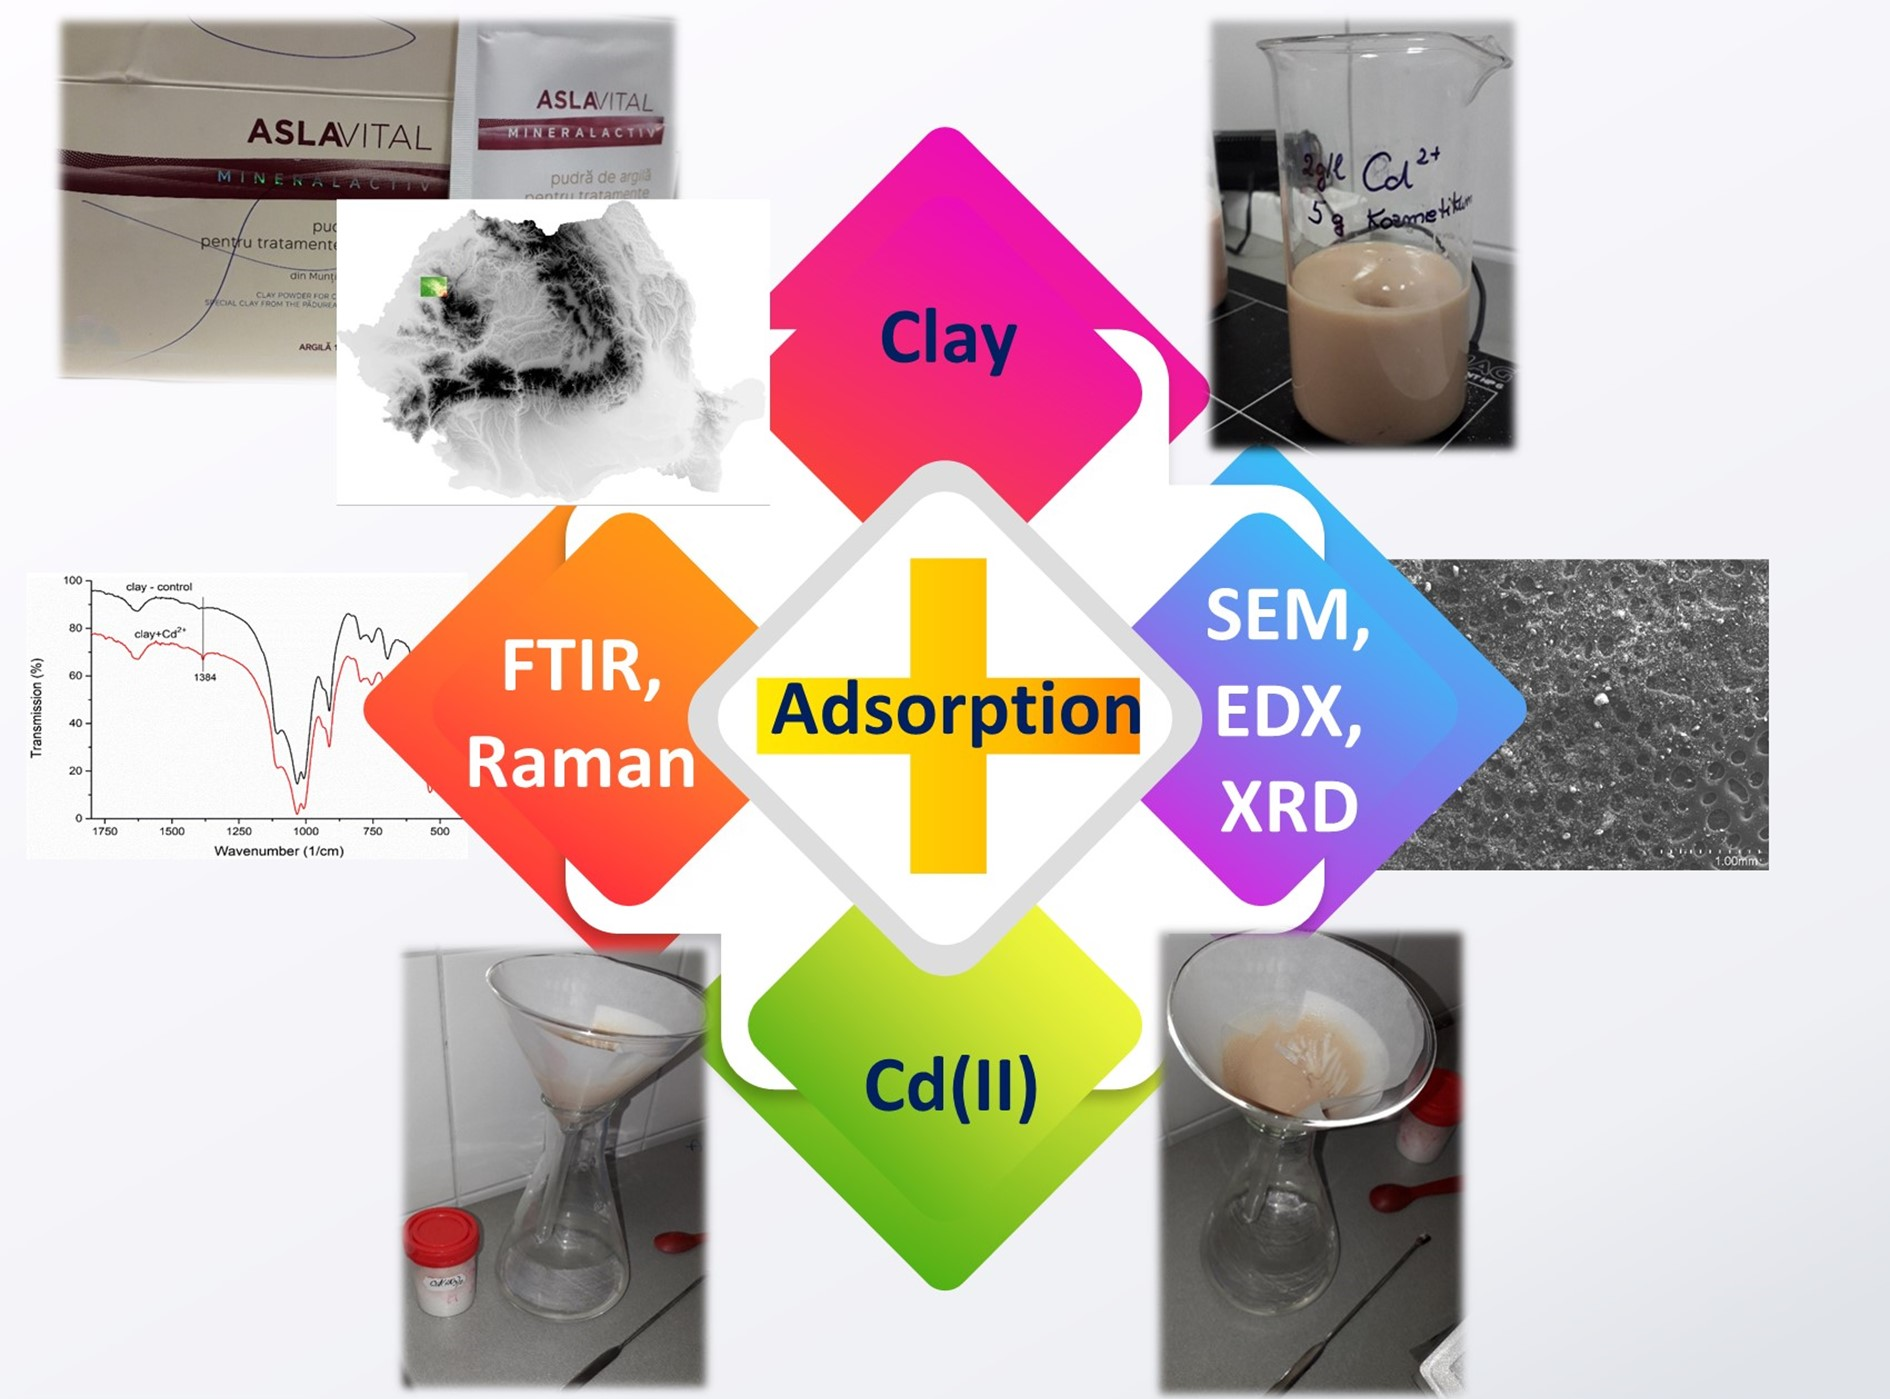
As a result of anthropogenic (industrial, agricultural) activities (mining, extracting, use of fertilizers) and (partly) geochemical natural processes (volcanic eruptions), pollution with heavy metals has increased in natural water bodies [1]. Heavy metal sources from natural and anthropogenic activities are shown in Figure 1.
Cadmium is a naturally occurring element of the heavy metal family that is present in the Earth’s crust at concentrations of approximately 0–11 mg/kg as a natural constituent of rocks [3]. Research has estimated that soils that are not directly contaminated by cadmium contamination may contain cadmium at concentrations of 0.06–1.1 mg/kg [3].
Cadmium pollution is known to be of great concern because of its high bioaccumulation and non-biodegrading properties [4]. Cadmium in drinking water should not exceed the limit value of 0.003 mg/L as recommended by the World Health Organization [5]. Moreover, from industrial, mining, and other activities, the discharged concentration should be lower than 2 mg/L [6]. Exceeding these values poses severe health effects by causing cadmium poisoning and itai-itai disease with bone degradation, which can negatively affect blood pressure and even cause cancer [7]. Cadmium also has a negative effect on plant development, reducing seed germination, growth and plant biomass, affecting photosynthetic activity, evapotranspiration rate, stomatal conductance, electrolyte leakage and relative water content [8,9].
Romania has a long history of mining and non-ferrous metallurgy [10]. As a result, heavy metals can accumulate in many areas, contaminating water and soil. It is estimated that 18% of Romanian population is at risk of serious pollution [11]. A study has investigated heavy metal soil contamination in 34 counties of Romania (near schools and kindergartens). Their results showed that cadmium levels in the soil were 0–0.86 mg/kg [12]. The cadmium content of Romanian soils and water bodies, as well as of various crop plants and fungi, has been studied in recent years [13,14,15,16,17,18].
A survey was carried out near the Baia Mare mining and metallurgical complex, where soil samples and grapes (Vitis vinifera L.) were collected, and their concentrations of heavy metals determined. Cadmium in soil was detected in two areas, with an average of 15.84 mg/kg Cd in the Baia Mare area and 26.84 mg/kg Cd in the Baia Sprie area. Examining the Cd content of different vine species in these areas, it was found that the roots of Feteasca regala from Baia Mare and Feteasca alba from Baia Sprie contained the highest levels of cadmium (7.09 ± 0.83 mg/kg and 3.07 ± 0.12 mg/kg, respectively). The cadmium content of the wine samples analyzed (0.02–0.06 mg/L Cd) exceeds the permitted limit (0.01 mg/L) [11].
Heavy metal pollution in water, sediment and fish meat was studied in Natura 2000 site “Buhuşi-Bacău-Bereşti”. The maximum concentration for water samples approved by the World Health Organization was exceeded in all studied areas with the measured cadmium concentration, 0.0521 mg/L, exceeding 10.42 times the permitted maximum value. In the case of fish samples, the Cd concentration in gills was 0.911 mg/kg and in the muscle reached 0.522 mg/kg, however, the maximum accepted concentration in the EU is 0.05 mg/kg [19].
In addition to the study of the cadmium content of certain plant foods and waters, it is essential to investigate the Cd removal from soil and water. Many physical and chemical methods have been used to remove heavy metals from soils and wastewaters [20,21,22,23,24,25,26,27].
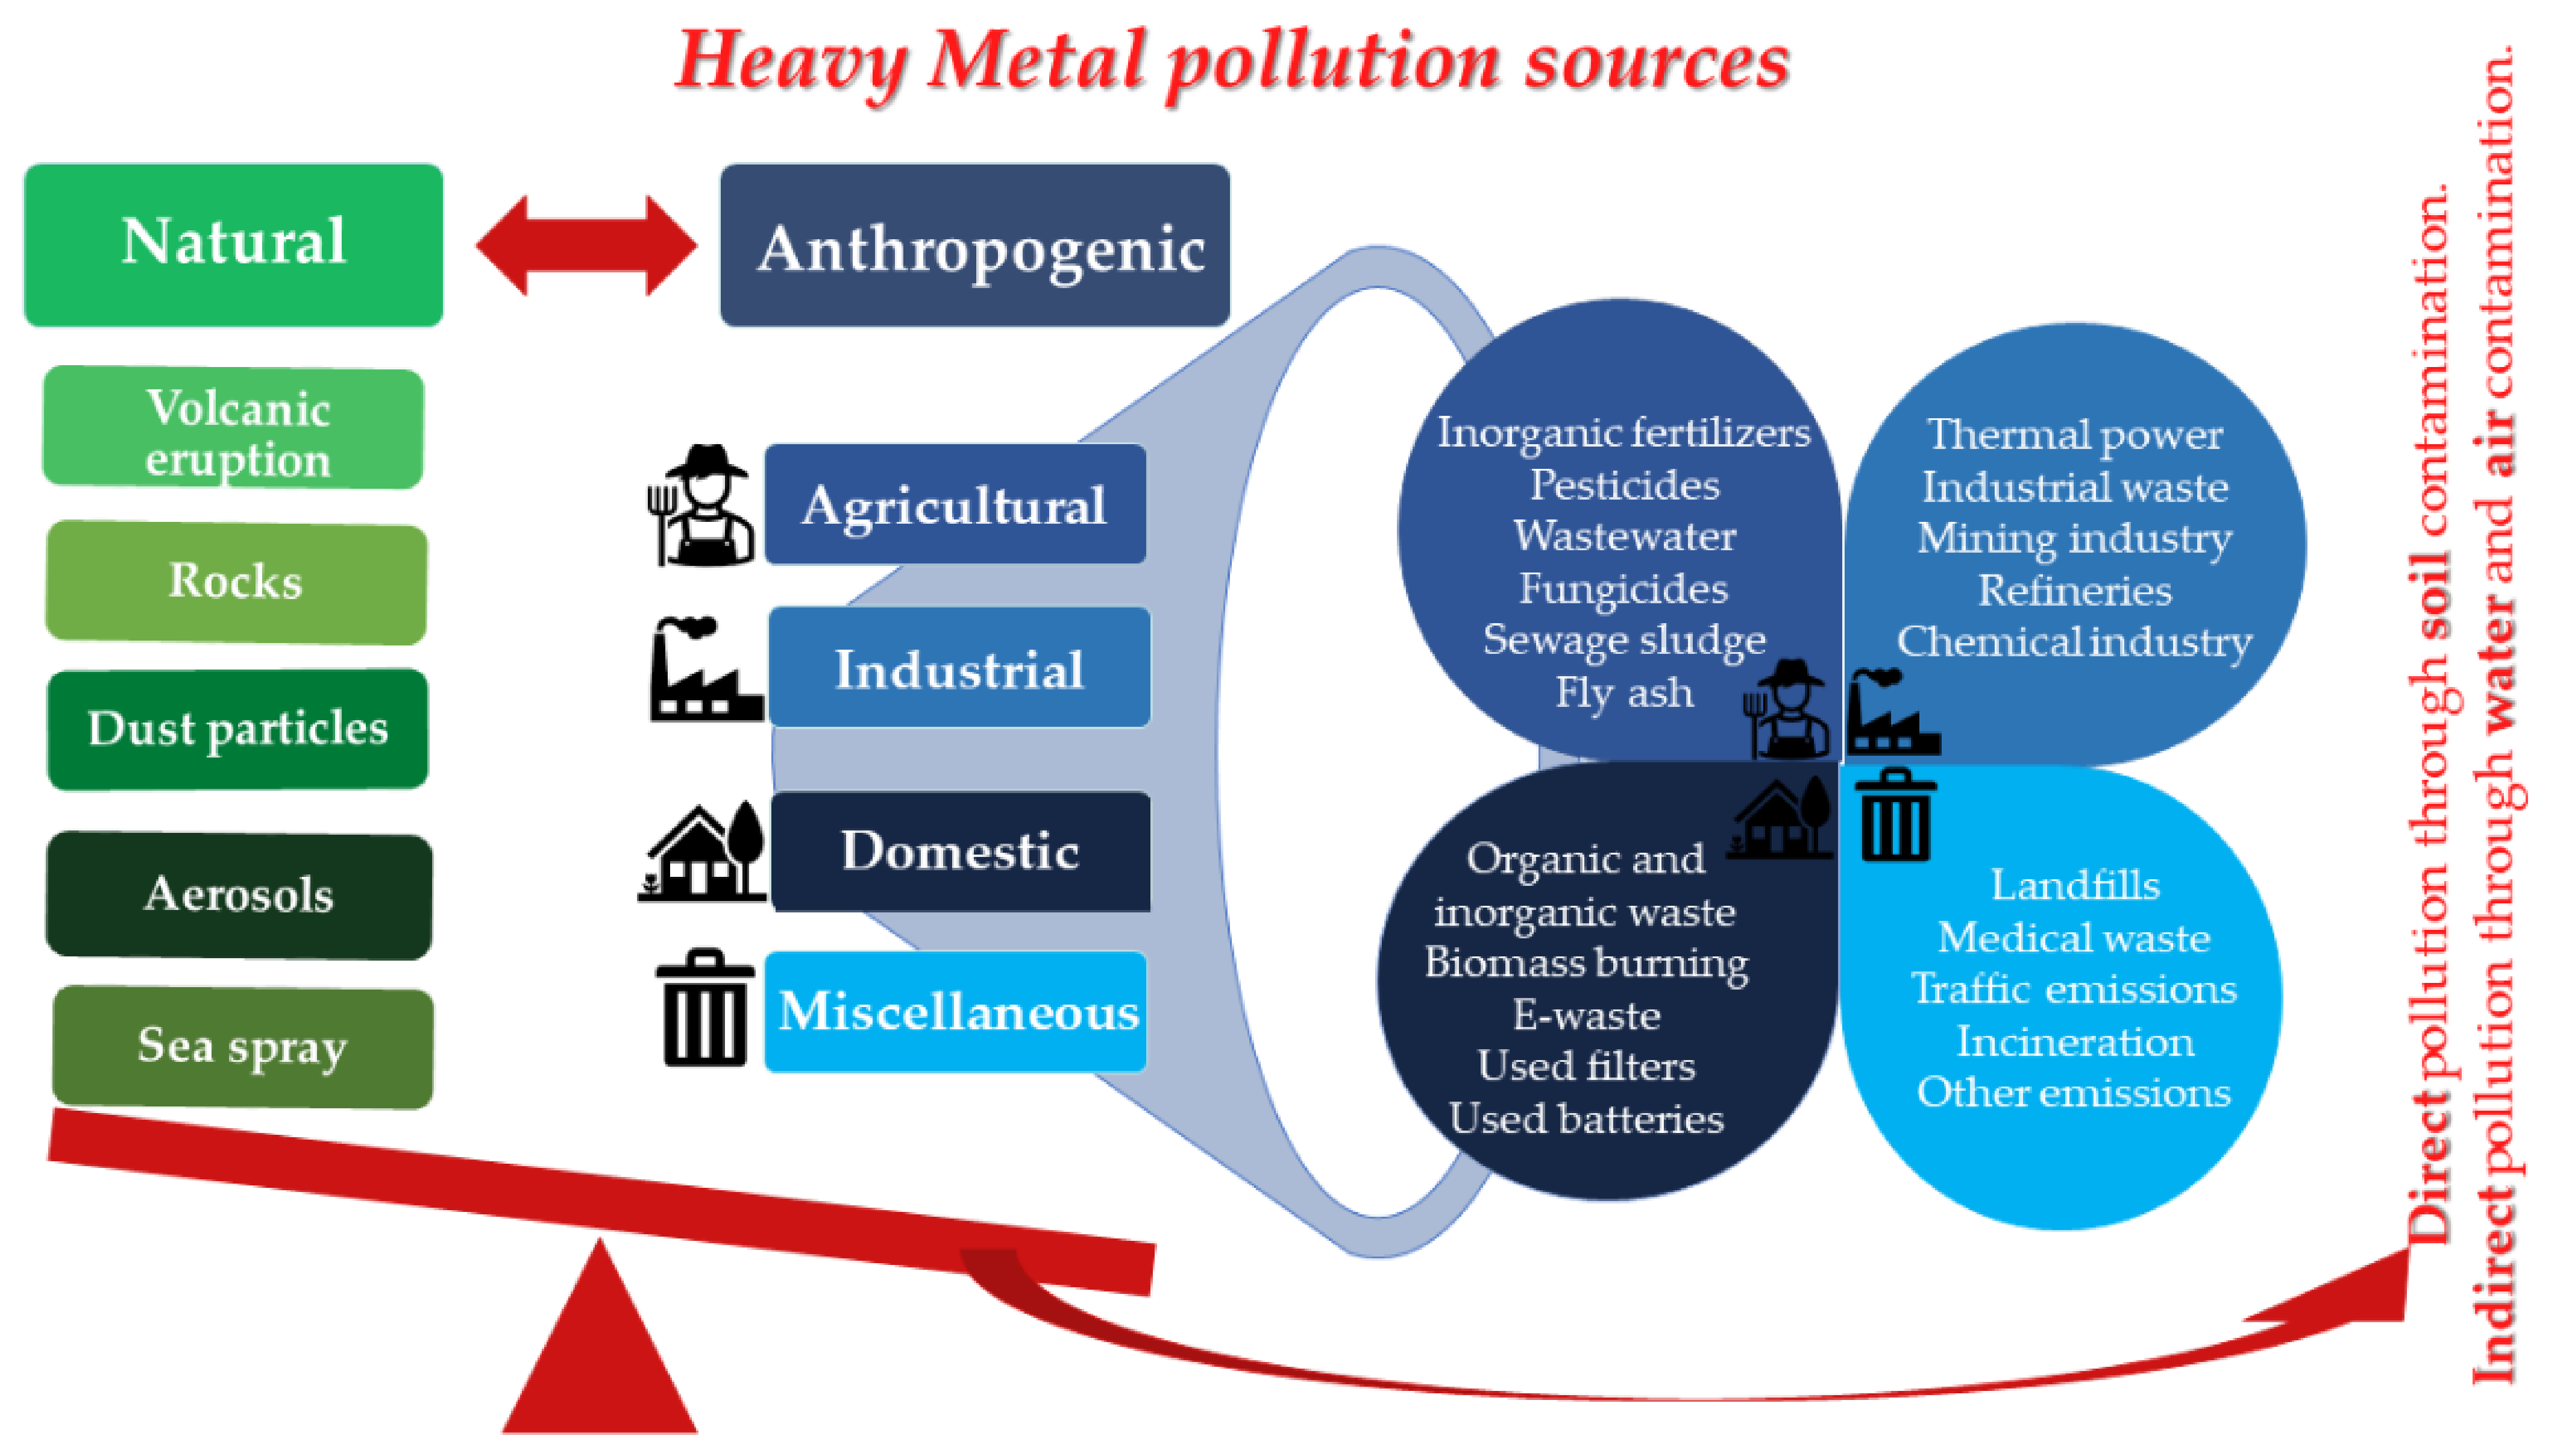
A comprehensive and critical review as its title suggests was written by Naef A.A. Qasem et al., where the authors enlisted a high range of heavy metal removal techniques from wastewaters [28]. They classify the discussed methods into five types: adsorption-, membrane-, chemical-, electric- and photocatalytic-based remediation treatments (Figure 2).
Adsorption technology is a widely accepted method because it is both simple to use and effective even at low concentrations [32]. Adsorption often has advantages over other processes due to its low start-up and installation costs, high selectivity, practicality, flexibility, ease of operation, low environmental risk, resistance to toxic components and significant potential for the removal of hazardous, unsafe contaminants [33,34]. Up until now, different materials have been used for the removal of Cd2+, such as brewery yeast [35], barley husks [36], brewed tea waste [33], nanocomposites [37,38], eggshell [39,40], sunflower [41], peanut shell [42], sugarcane bagasse [43], different clay materials [44,45,46,47,48,49], and minerals like montmorillonite, kaolinite, illite, zeolite, diatomite, vermiculite [50].
Clay materials, having a particle size of less than 2 µm, have a high specific surface area. These small particles can clog filters in fixed-bed adsorption. That is why in batch method and in membrane adsorption hybrid systems they can be suitable for heavy metal removal [51,52]. The naturally occurring materials are mainly composed of silica, alumina, and water. Furthermore, the surface of clay minerals can contain many exchangeable cations and anions on its surface [53], but in most cases the surface of the clay is negatively charged. The clay surface can contain Ca2+, Mg2+, H+, K+, NH4+, Na+, SO4 2−, Cl, PO4 3−, and NO3−. According to Rajani Srinivasan, these ions can be easily exchanged with other ions while the mineral structure of clay is not affected [53]. This property also contributes to being an excellent adsorbent for removing metal cations from water [54]. Compared to other adsorbents, its advantage is that its surface is very porous, resulting in a high attractive force and many active binding sites [55]. Hence, its binding performance is also higher [53,55,56,57].
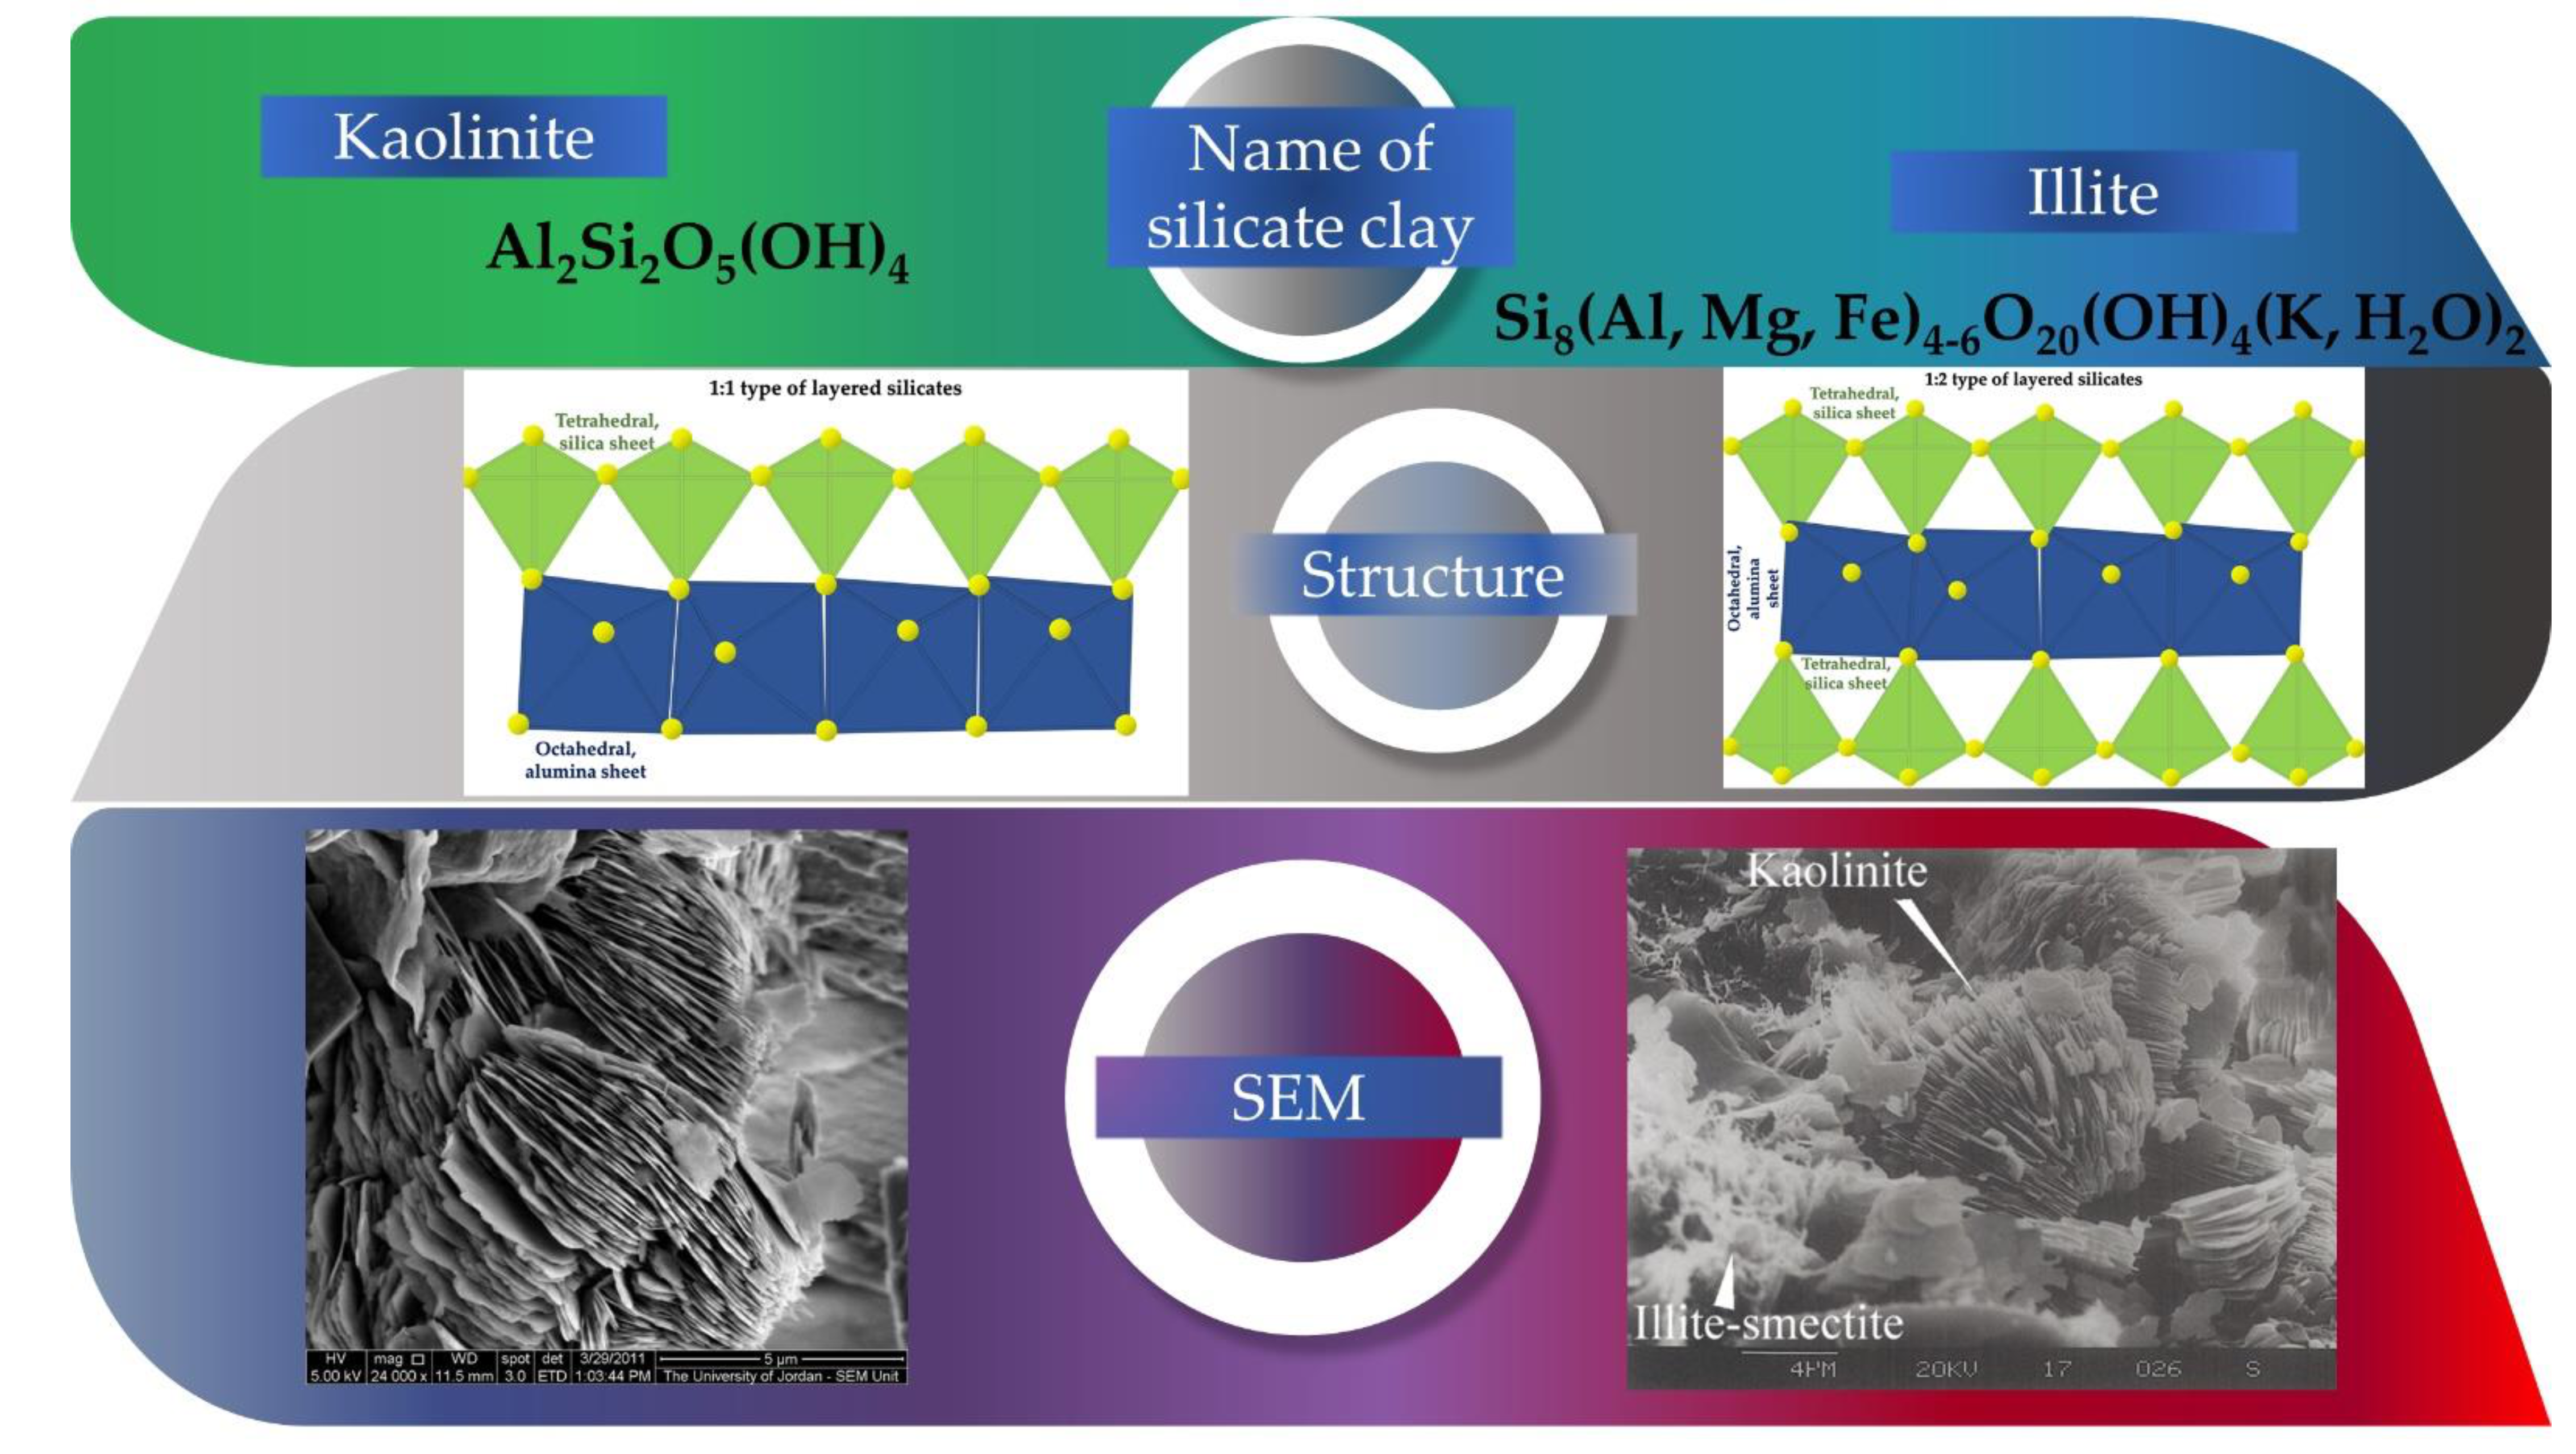
Clay minerals can be classified in various ways; however, these four types can also be divided: layer and chain silicates, sesquioxides, and other inorganic minerals. Layered silicates are the primary constituents of soils [58]. It consists of a planar octahedral layer, structurally the octahedral layer is attached to a tetrahedral layer both above and below. It is arranged in repeating intervals between the t-o-t layers [59]. Typical representatives include kaolinite (1:1 layered silicate) and illite (2:1 layered silicate) [60]. A literature review of the characteristic structure and properties of these two layered silicates is given in Section 3.1.5.
So far, many studies have investigated natural clay minerals as adsorbents because they are environmentally greener and more economical than conventional adsorbents [
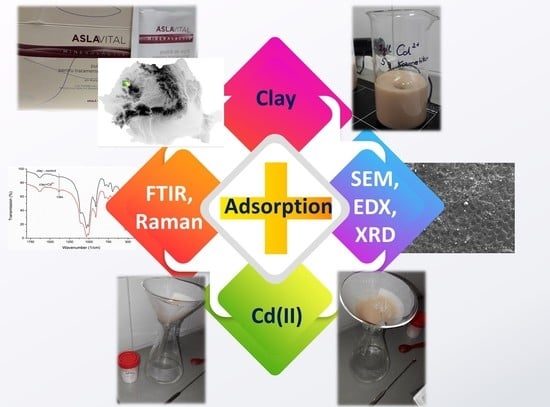
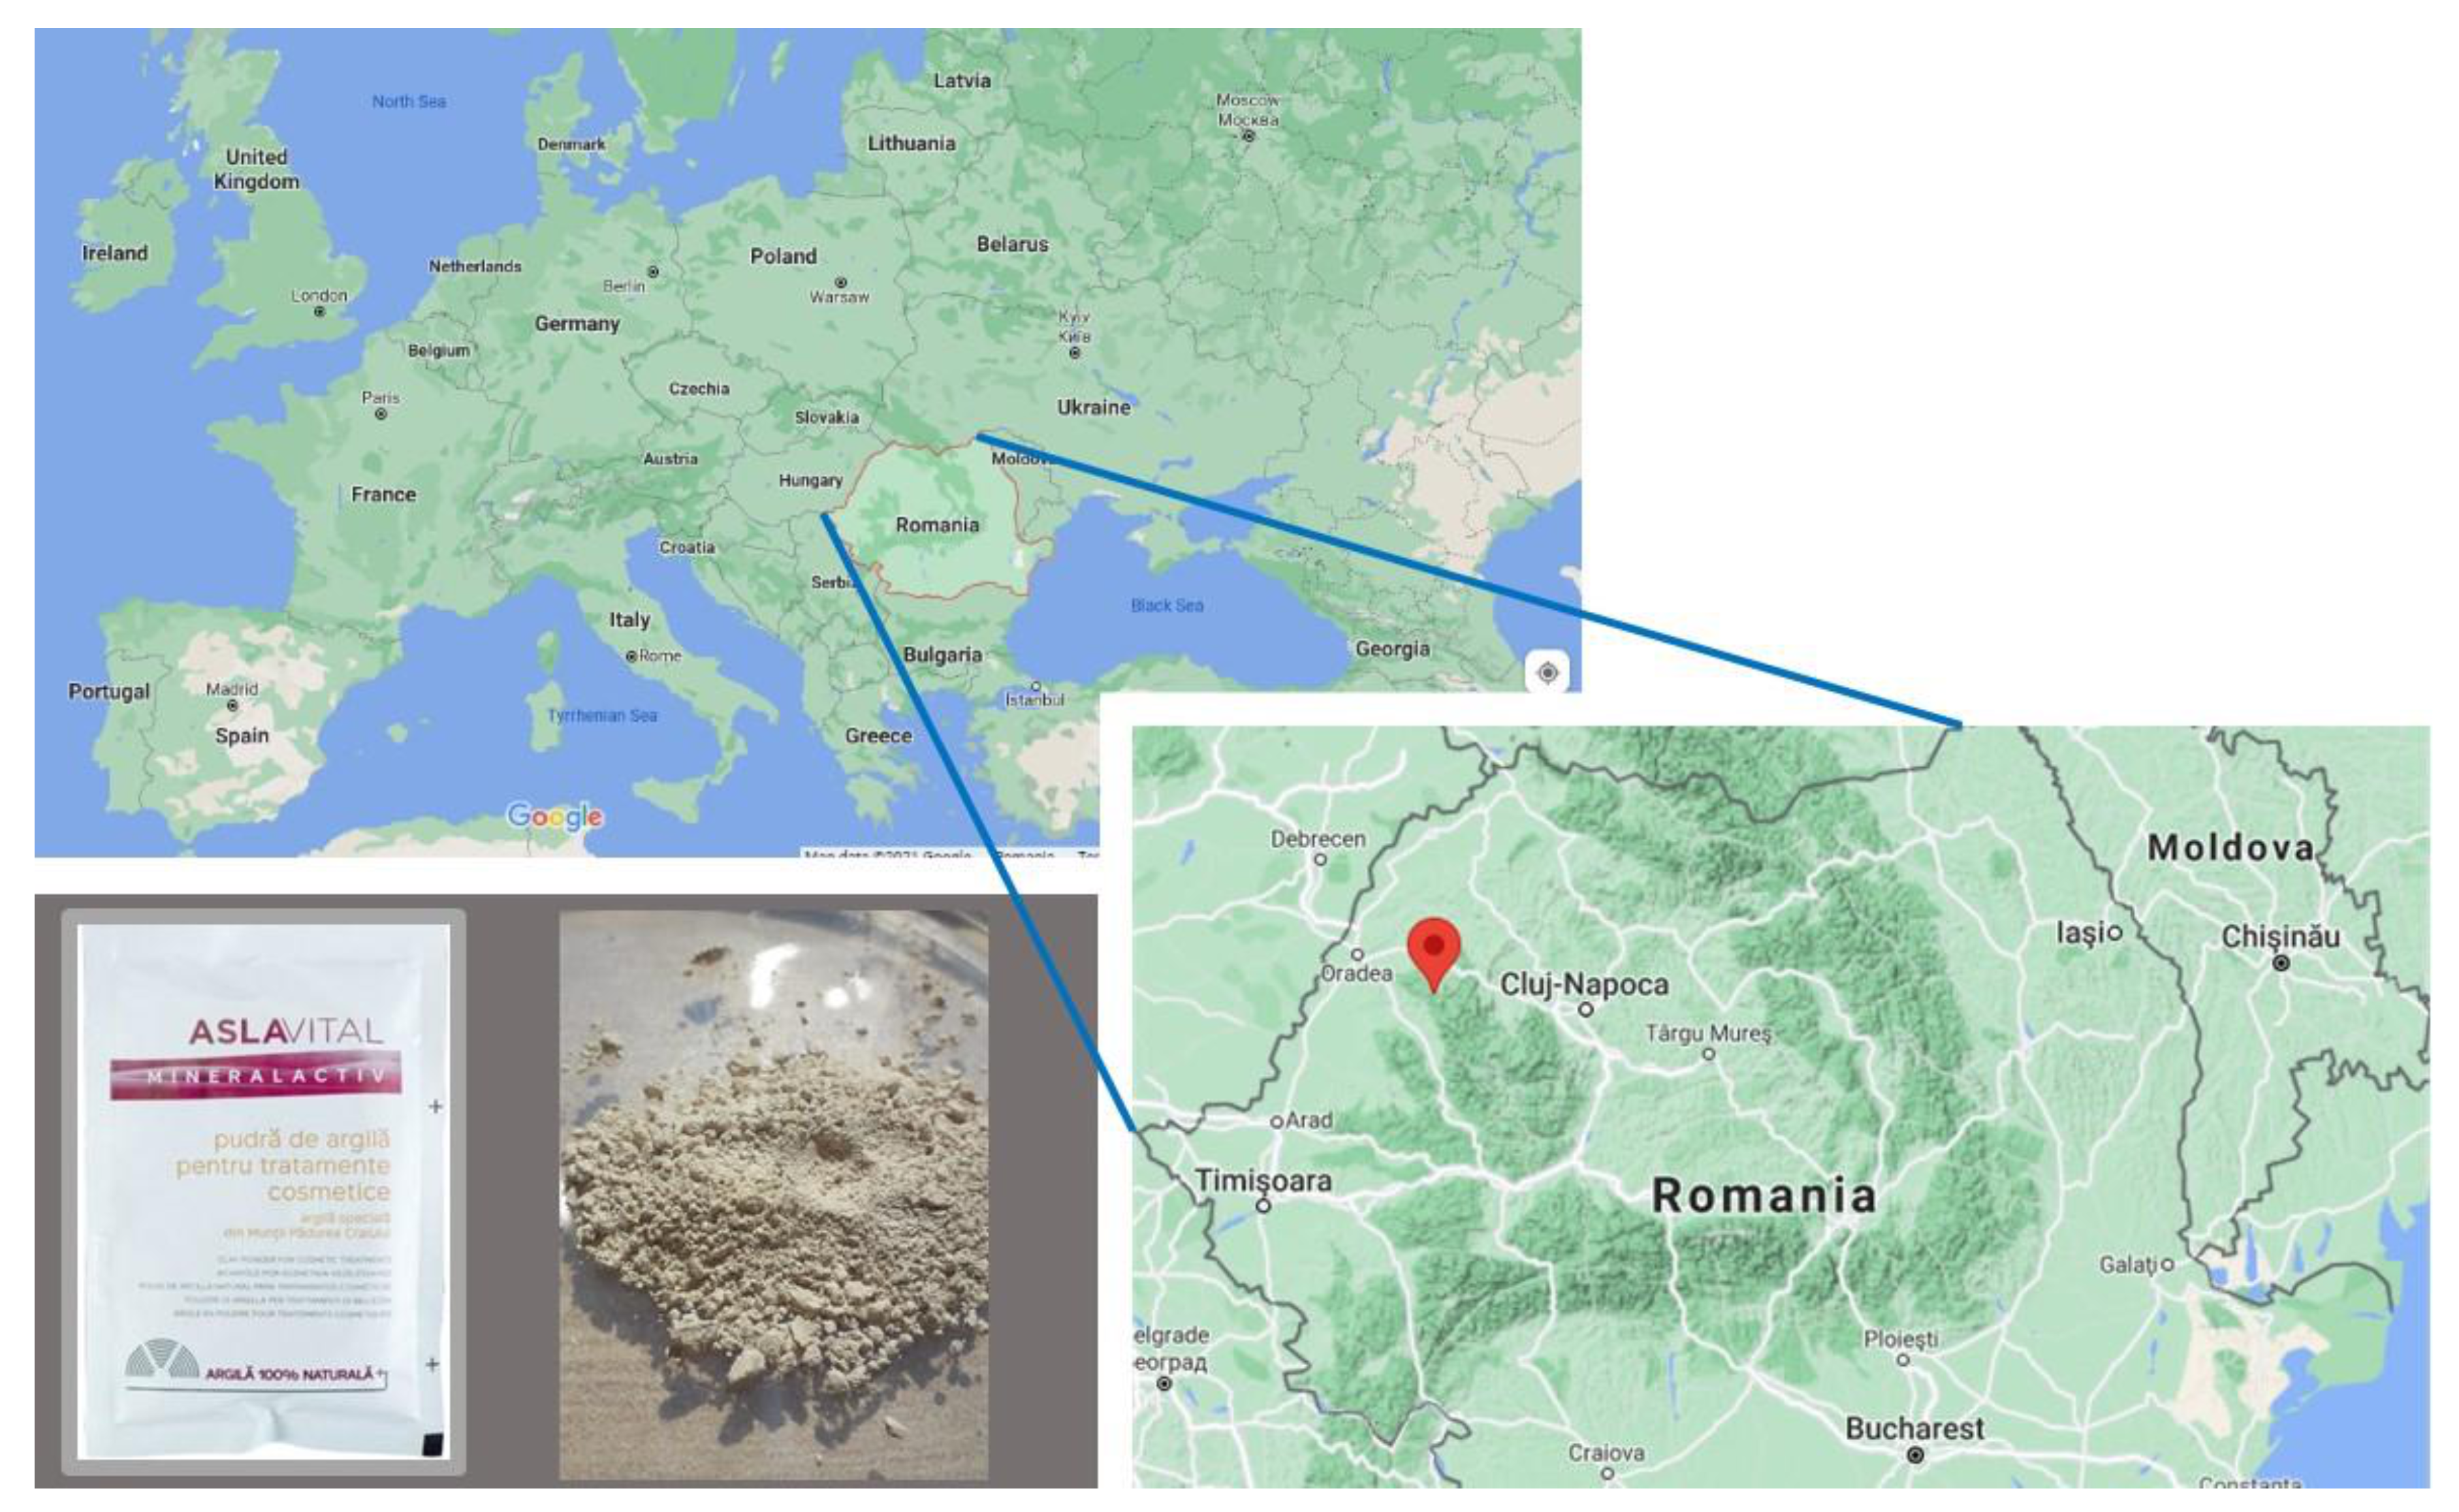
61]. Therefore, the aim of this study is to characterize ASLAVITAL cosmetical clay from the Romanian Pădurea Craiului Mountain (ACC) novel adsorbent and to study the effectiveness of Cd2+ removal (Figure 3). As up to our knowledge ACC has not yet been studied as an adsorbent. Batch adsorption studies were carried out, where the effects of initial metal concentration and contact time were investigated as these are the most influencing parameters. Moreover, the motive of this study is to make a morpho-structural characterization of the adsorbent with the help of scanning electron microscopy (SEM), energy dispersive spectroscopy (EDX), Fourier transform infrared spectroscopy (FTIR), X-ray diffraction analysis (XRD) and Raman measurements. We also seek to analyze the equilibrium results using linear (Langmuir, Freundlich, Tempkin and Dubinin–Raduchkevich) and non-linear (two-parameter Langmuir, Freundlich and Temkin, as well as the three-parameter Toth, Khan and Liu) isotherm models and to study the kinetics (pseudo-I and -II order) of the adsorption process and diffusion. After fitting with OriginPro 8.5 software, an error analysis was performed. In addition, we discussed the limitations of ACC novel adsorbent and compared the received adsorption capacity with clays used in previous studies.

2. Materials and Methods

2.1. Details about the Adsorbent

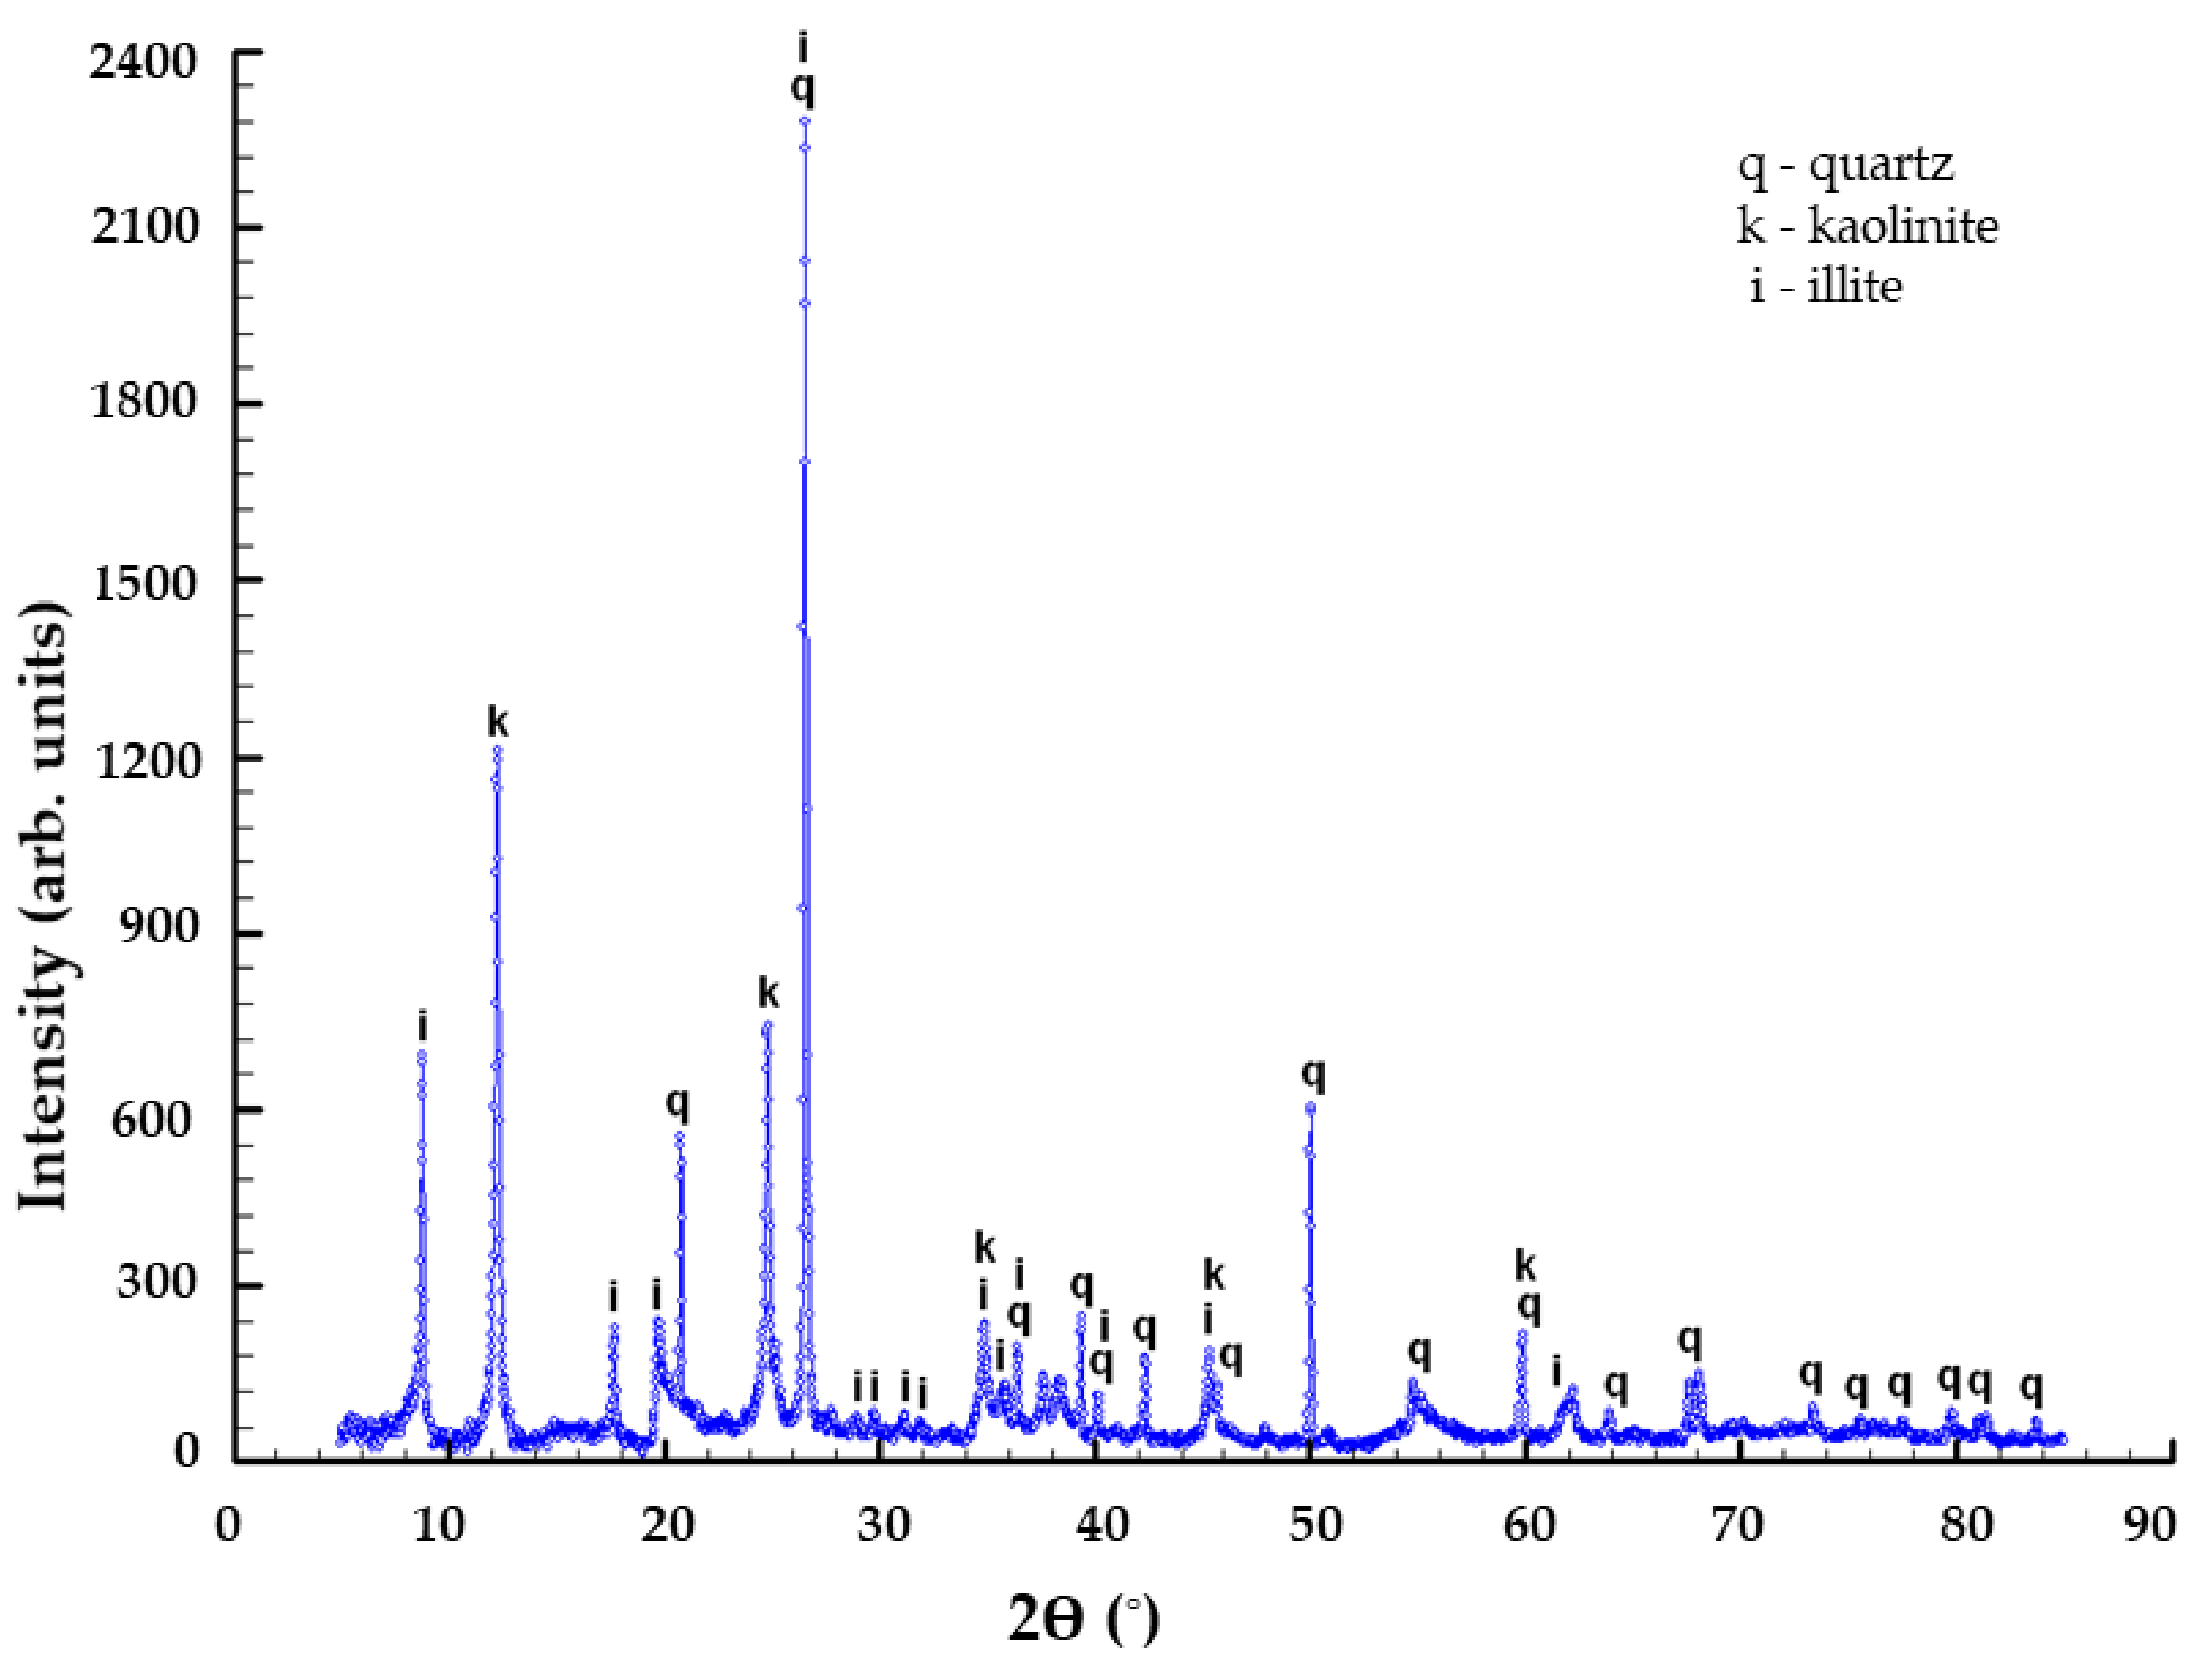
The sorbent (ACC) used in this research is a particular ASLAVITAL Diatomaceous earth (100% natural diatomaceous clay) manufactured and marketed by the Farmec S.A. It comes from the Pădurea Craiului Mountains, therefore, has a well-defined chemical and mineral composition. Moreover, it is not chemically treated. Deposits of Jurassic fire clays are well known within the Pădurea Craiului Mountains. Their compositions are dominated by kaolinite, with minor amounts of illite and quartz [62]. In the adsorption experiments ACC was used without any physical or chemical alteration.
According to patent 118259/2003 “Composition of a clay-based product and the method of treatment that can be carried out with it”, the mineral composition of the clay is 40–60% kaolinite, 22–30% illite, 4–10% quartz, 1–4% limonite. The chemical composition of the clay is 21–33% Al2O3, 52–59% SiO2, 2–3.8%, Fe2O3, 0.4–1.3% TiO2, 0.4–0.8% CaO, 0.1–1% MgO, 1.7–4% K2O + Na2O.

2.2. Metal Solution Preparation

The synthetic wastewater with different initial concentrations was diluted from 1 g/L stock solutions of the reagent cadmium nitrate tetrahydrate [Cd(NO3)2 ∗ 4H2O] of analytical grade. The as-prepared dilutions were: 10.83 mg/L, 61.67 mg/L, 99.17 mg/L, 120.83 mg/L, 156.57 mg/L.

2.3. Adsorption Experiments

Adsorption of Cd2+ on ASLAVITAL cosmetic clay (ACC) was carried out by the batch equilibrium method. One gram of adsorbent was added to the 100 mL artificial cadmium wastewater of desired concentration in 250 mL Erlenmeyer flasks. The solutions were stirred on a rotary shaker at 300 rpm until equilibrium was reached.
The Cd2+ concentration was investigated with the help of flame atomic absorption spectrophotometer. For this measurement we used SensAA Dual GBS Scientific Equipment, Australia. The unknown solution’s Cd2+ ion concentration was determined by calibration with a standard cadmium solution in the concentration range 0–2.5 mg/L, λ = 228.8 nm.
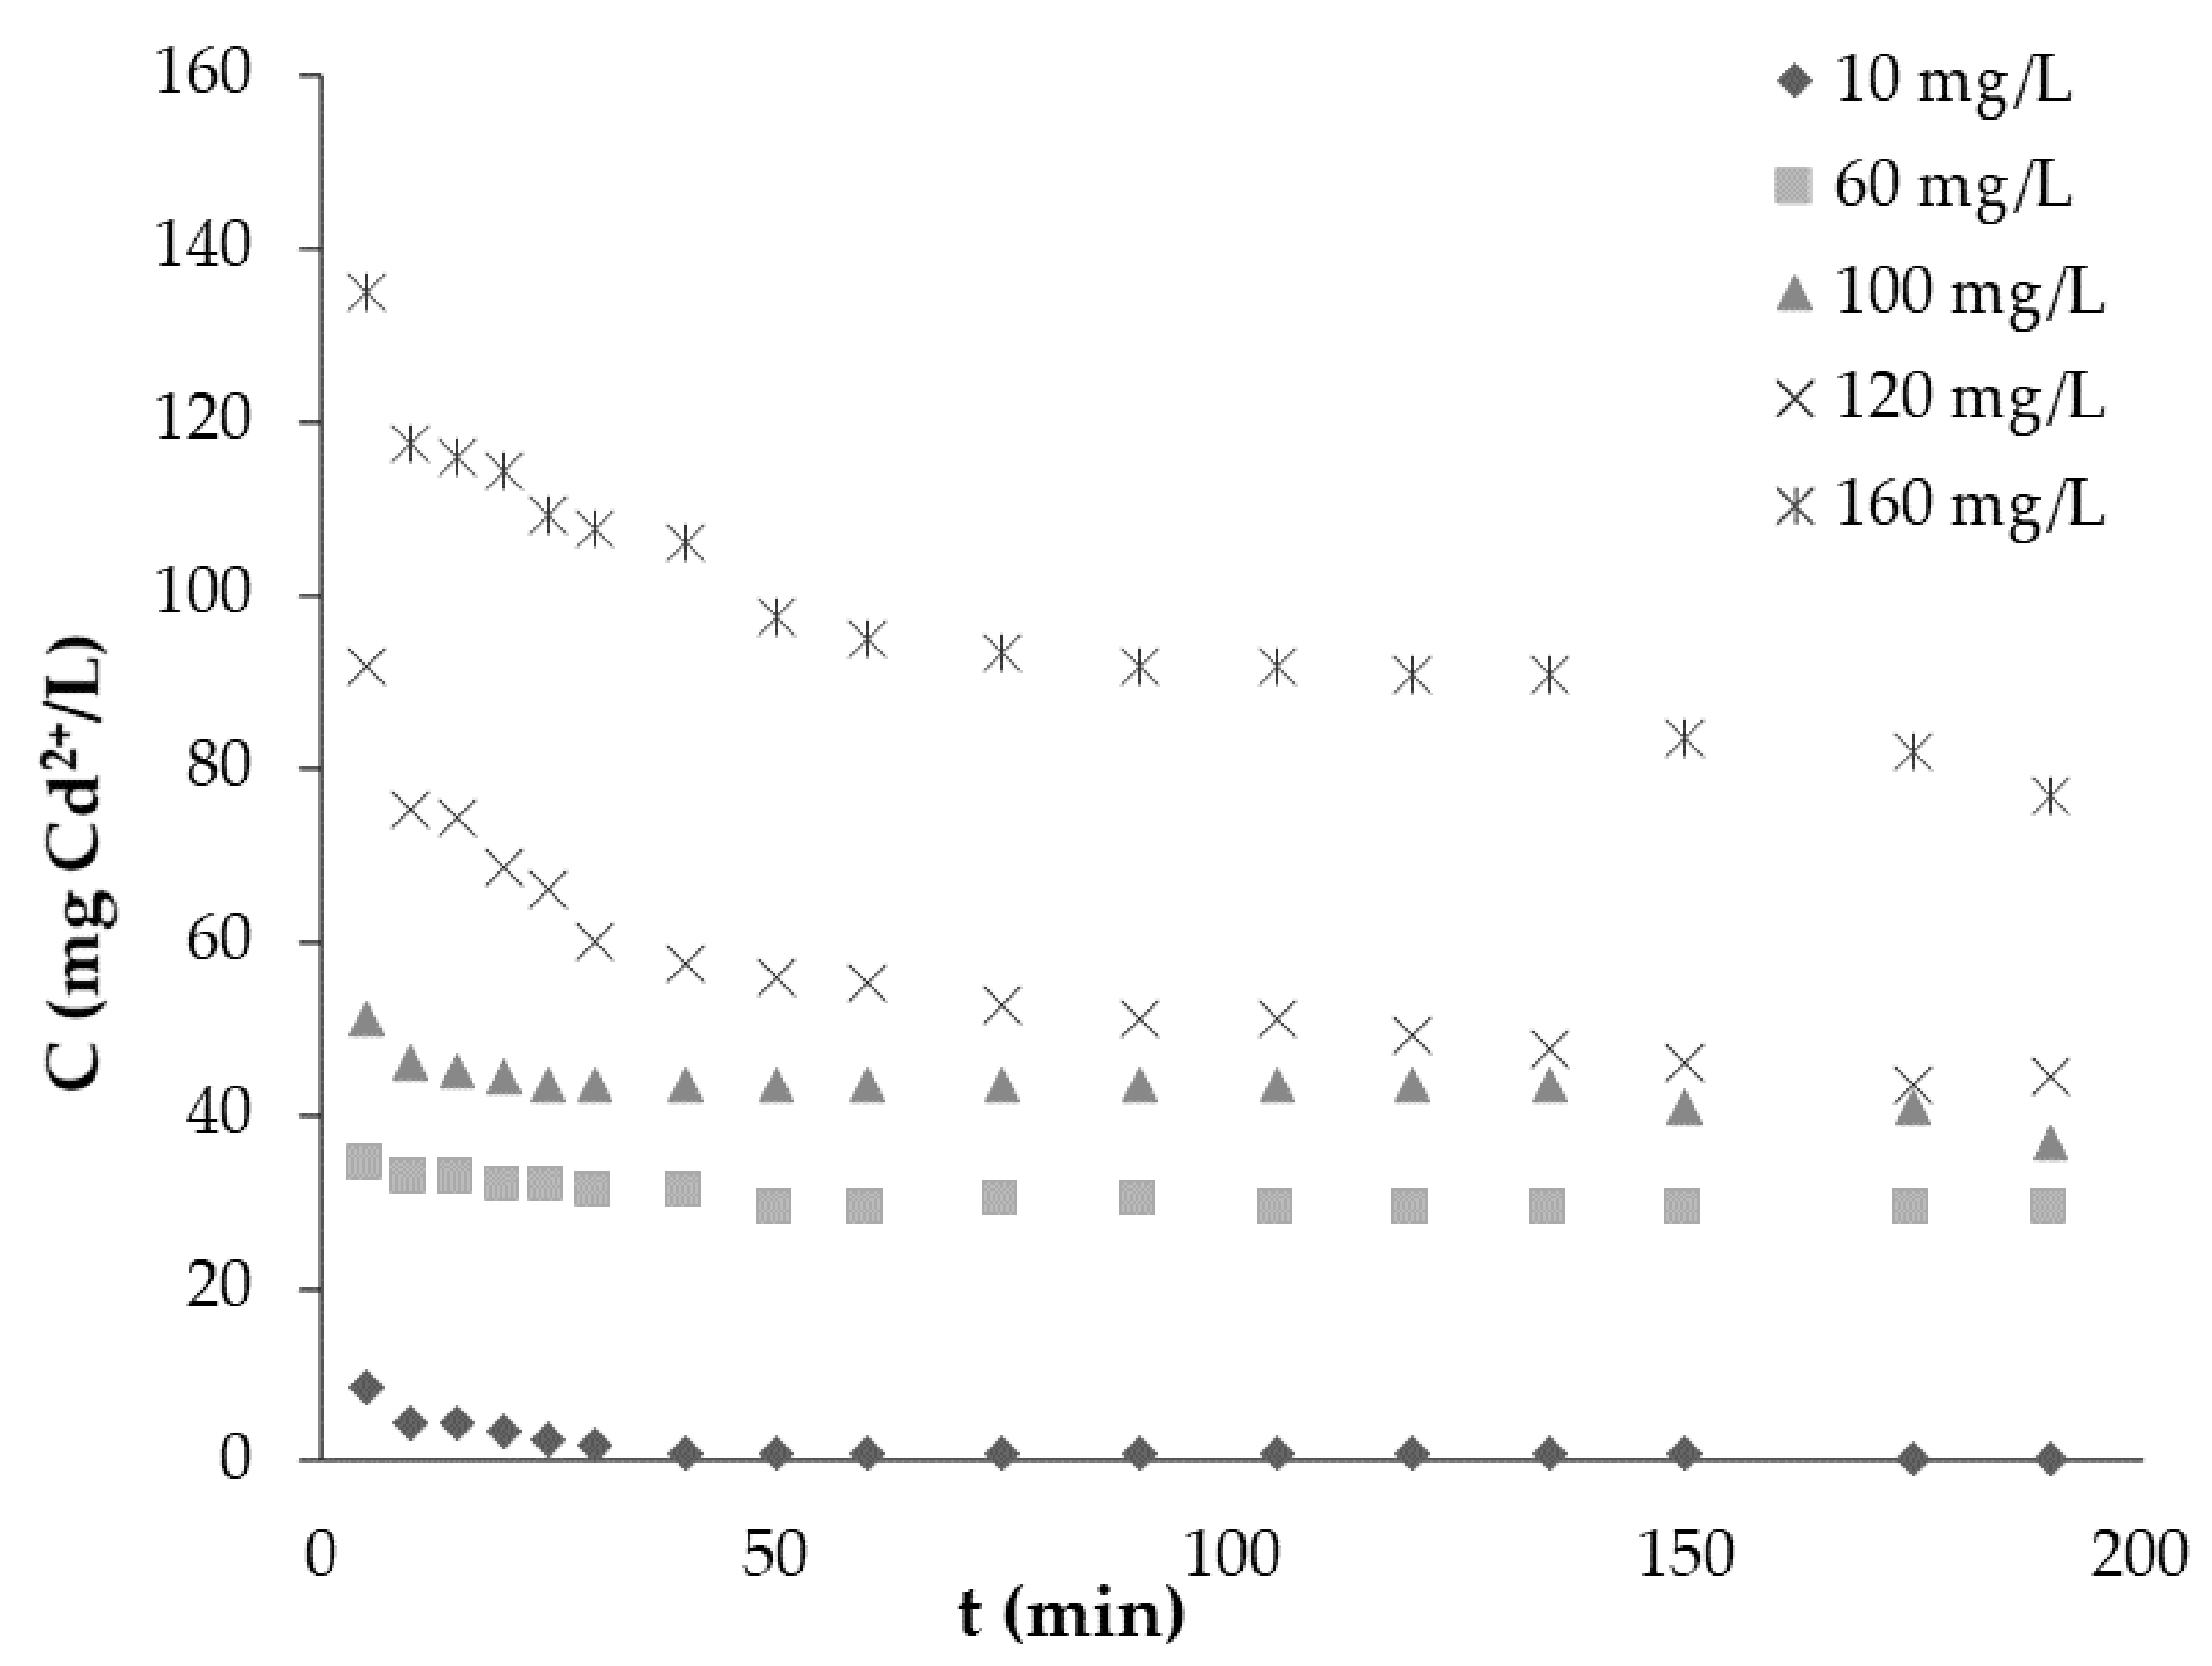
The effect of time on the adsorption of ACC and Cd2+ was determined by analyzing the residual metal ion concentration in the liquid after contact periods of 0, 5, 10, 15, 20, 30, 40, 50, 60, 75, 90, 105, 120, 135, 150, 175 and 190 min.
The effect of initial Cd2+ concentration was tested by varying the Cd2+ concentration in the range of 10–160 mg/L using a magnetic stirrer at room temperature (t = 20 °C) and fixed pH of 7.
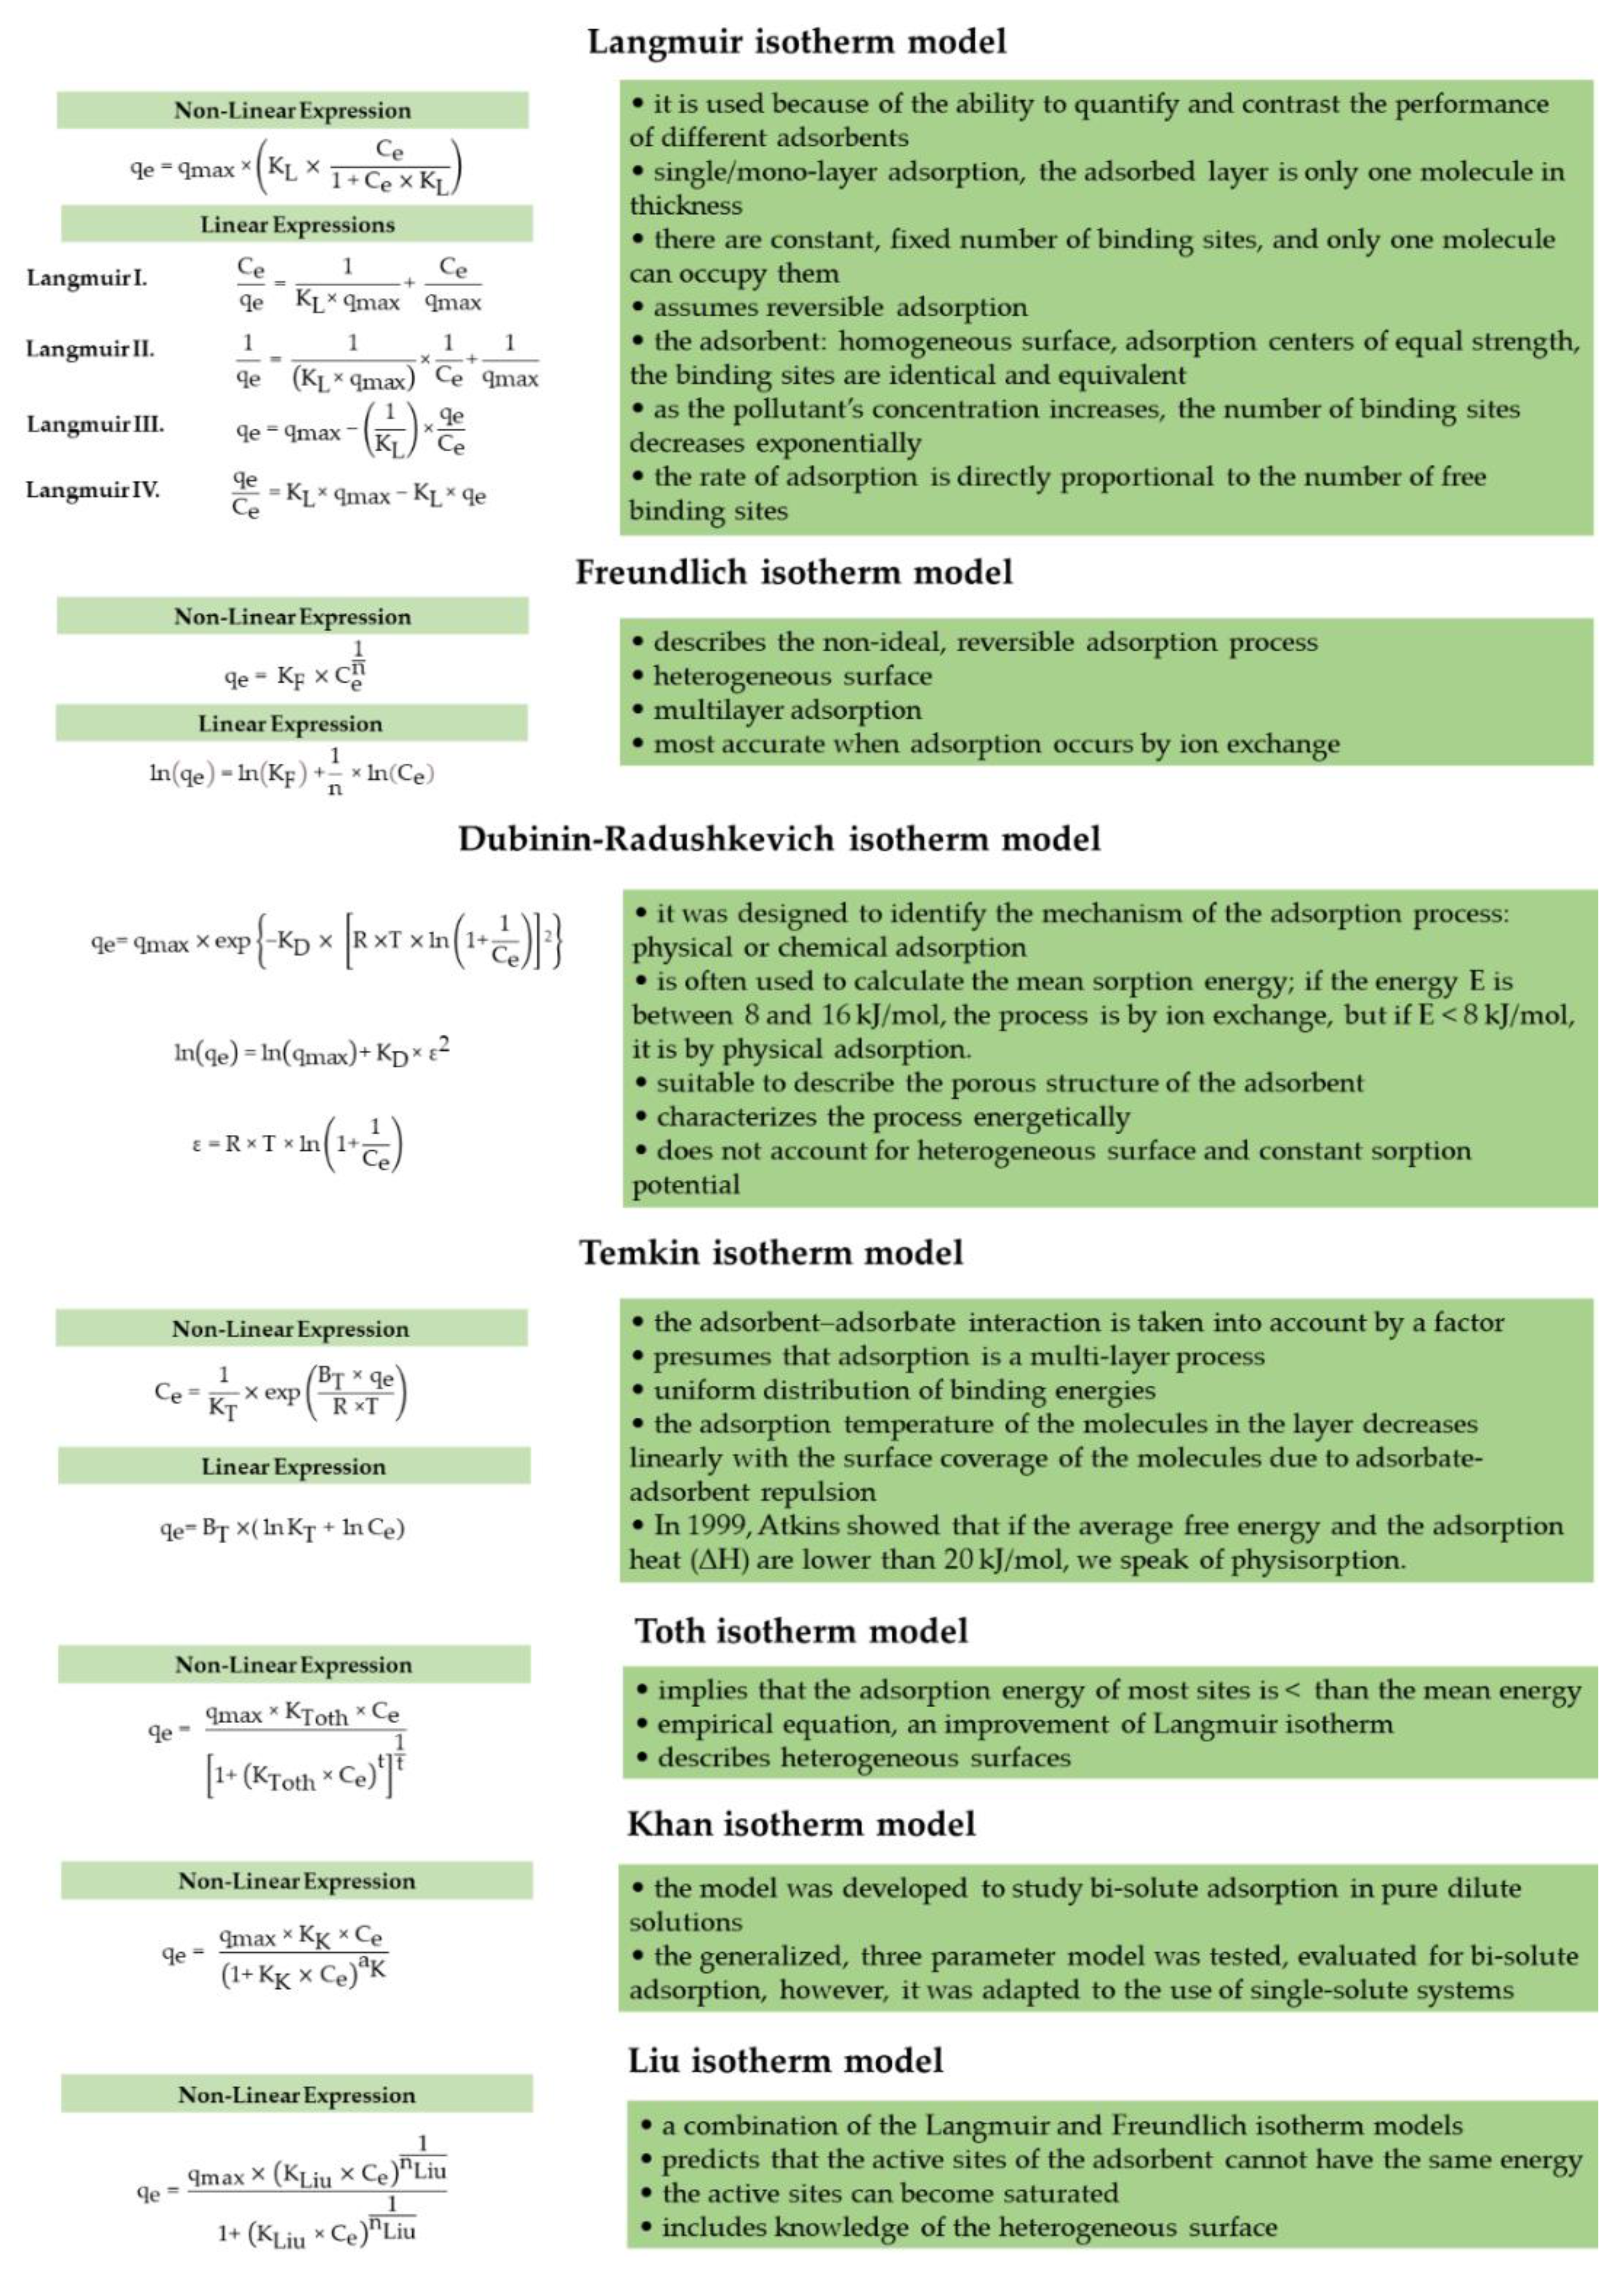
From the adsorption equilibrium data, the linearized Langmuir, Freundlich, Tempkin and Dubinin–Radushkevich models were determined (Figure 4).
Moreover, we studied the adsorption kinetic and diffusion models (Table 1).
Statistical biases can arise when the isothermal equations are linearized, as the linear fit depends on the method chosen, the data available and the errors of the experiment performed. During the evaluation of experimental data, the linear transformation changes the distribution of the error (either in the positive or negative direction). Data overestimation, data clumping or overweighing can occur during the transformation if the system is sensitive to extreme (too high or too low) experimental values. Often, regardless of the resulting high linear regression coefficient (R2) values, the model is not representative of the adsorption experimental behavior [66,67]. To avoid these limitations, the development of computer programs has made modelling and error analysis possible. Non-linear regression analyses of the two-parameter Langmuir, Freundlich and Temkin as well as the three-parameter Toth [68], Khan [65] and Liu [69] isotherm models were analyzed using OriginPro 8.5 software. We also determined the linear regression coefficient (R2), chi-square error (χ2), root mean square error (RMSE), and hybrid fractional error (HYBRID). The equations for these error analyses are given below [70,71,72]:
R 2 = 1 - n = 1 n ( q e , exp . q e , calc . ) 2 n = 1 n ( q e , exp . q e , calc . ¯ ) 2  
χ 2 = i = 1 n ( q e , calc . q e , exp . ) 2 q e , exp .  
RMSE = n = 1 n ( q e , exp . q e , calc . ) 2 n - p  
HYBRID = 100 n - p × i = 1 n ( q e , exp . q e , calc . q e , exp . )  
where n—the number of experiments performed; qe,exp. (mg/g)—the value of the maximum amount of substance bound in the equilibrium obtained in practice; qe,calc. (mg/g)—the calculated value of quantity equilibrium; qe,calc. (mg/g)—average of the calculated quantity equilibrium; p (polynomial model)—the number of parameters included in the isotherm models tested.

2.4. Instrumentation, Analytical Methods

The SEM, EDX, FTIR and XRD studies were carried out at National Institute for Research and Development of Isotopic and Molecular Technologies, INCDTIM Cluj-Napoca, Romania. Raman microspectroscopic measurements were carried out at the Research and Industrial Relations Center (RIRC) at the Faculty of Science, Eötvös Loránd University, Budapest.
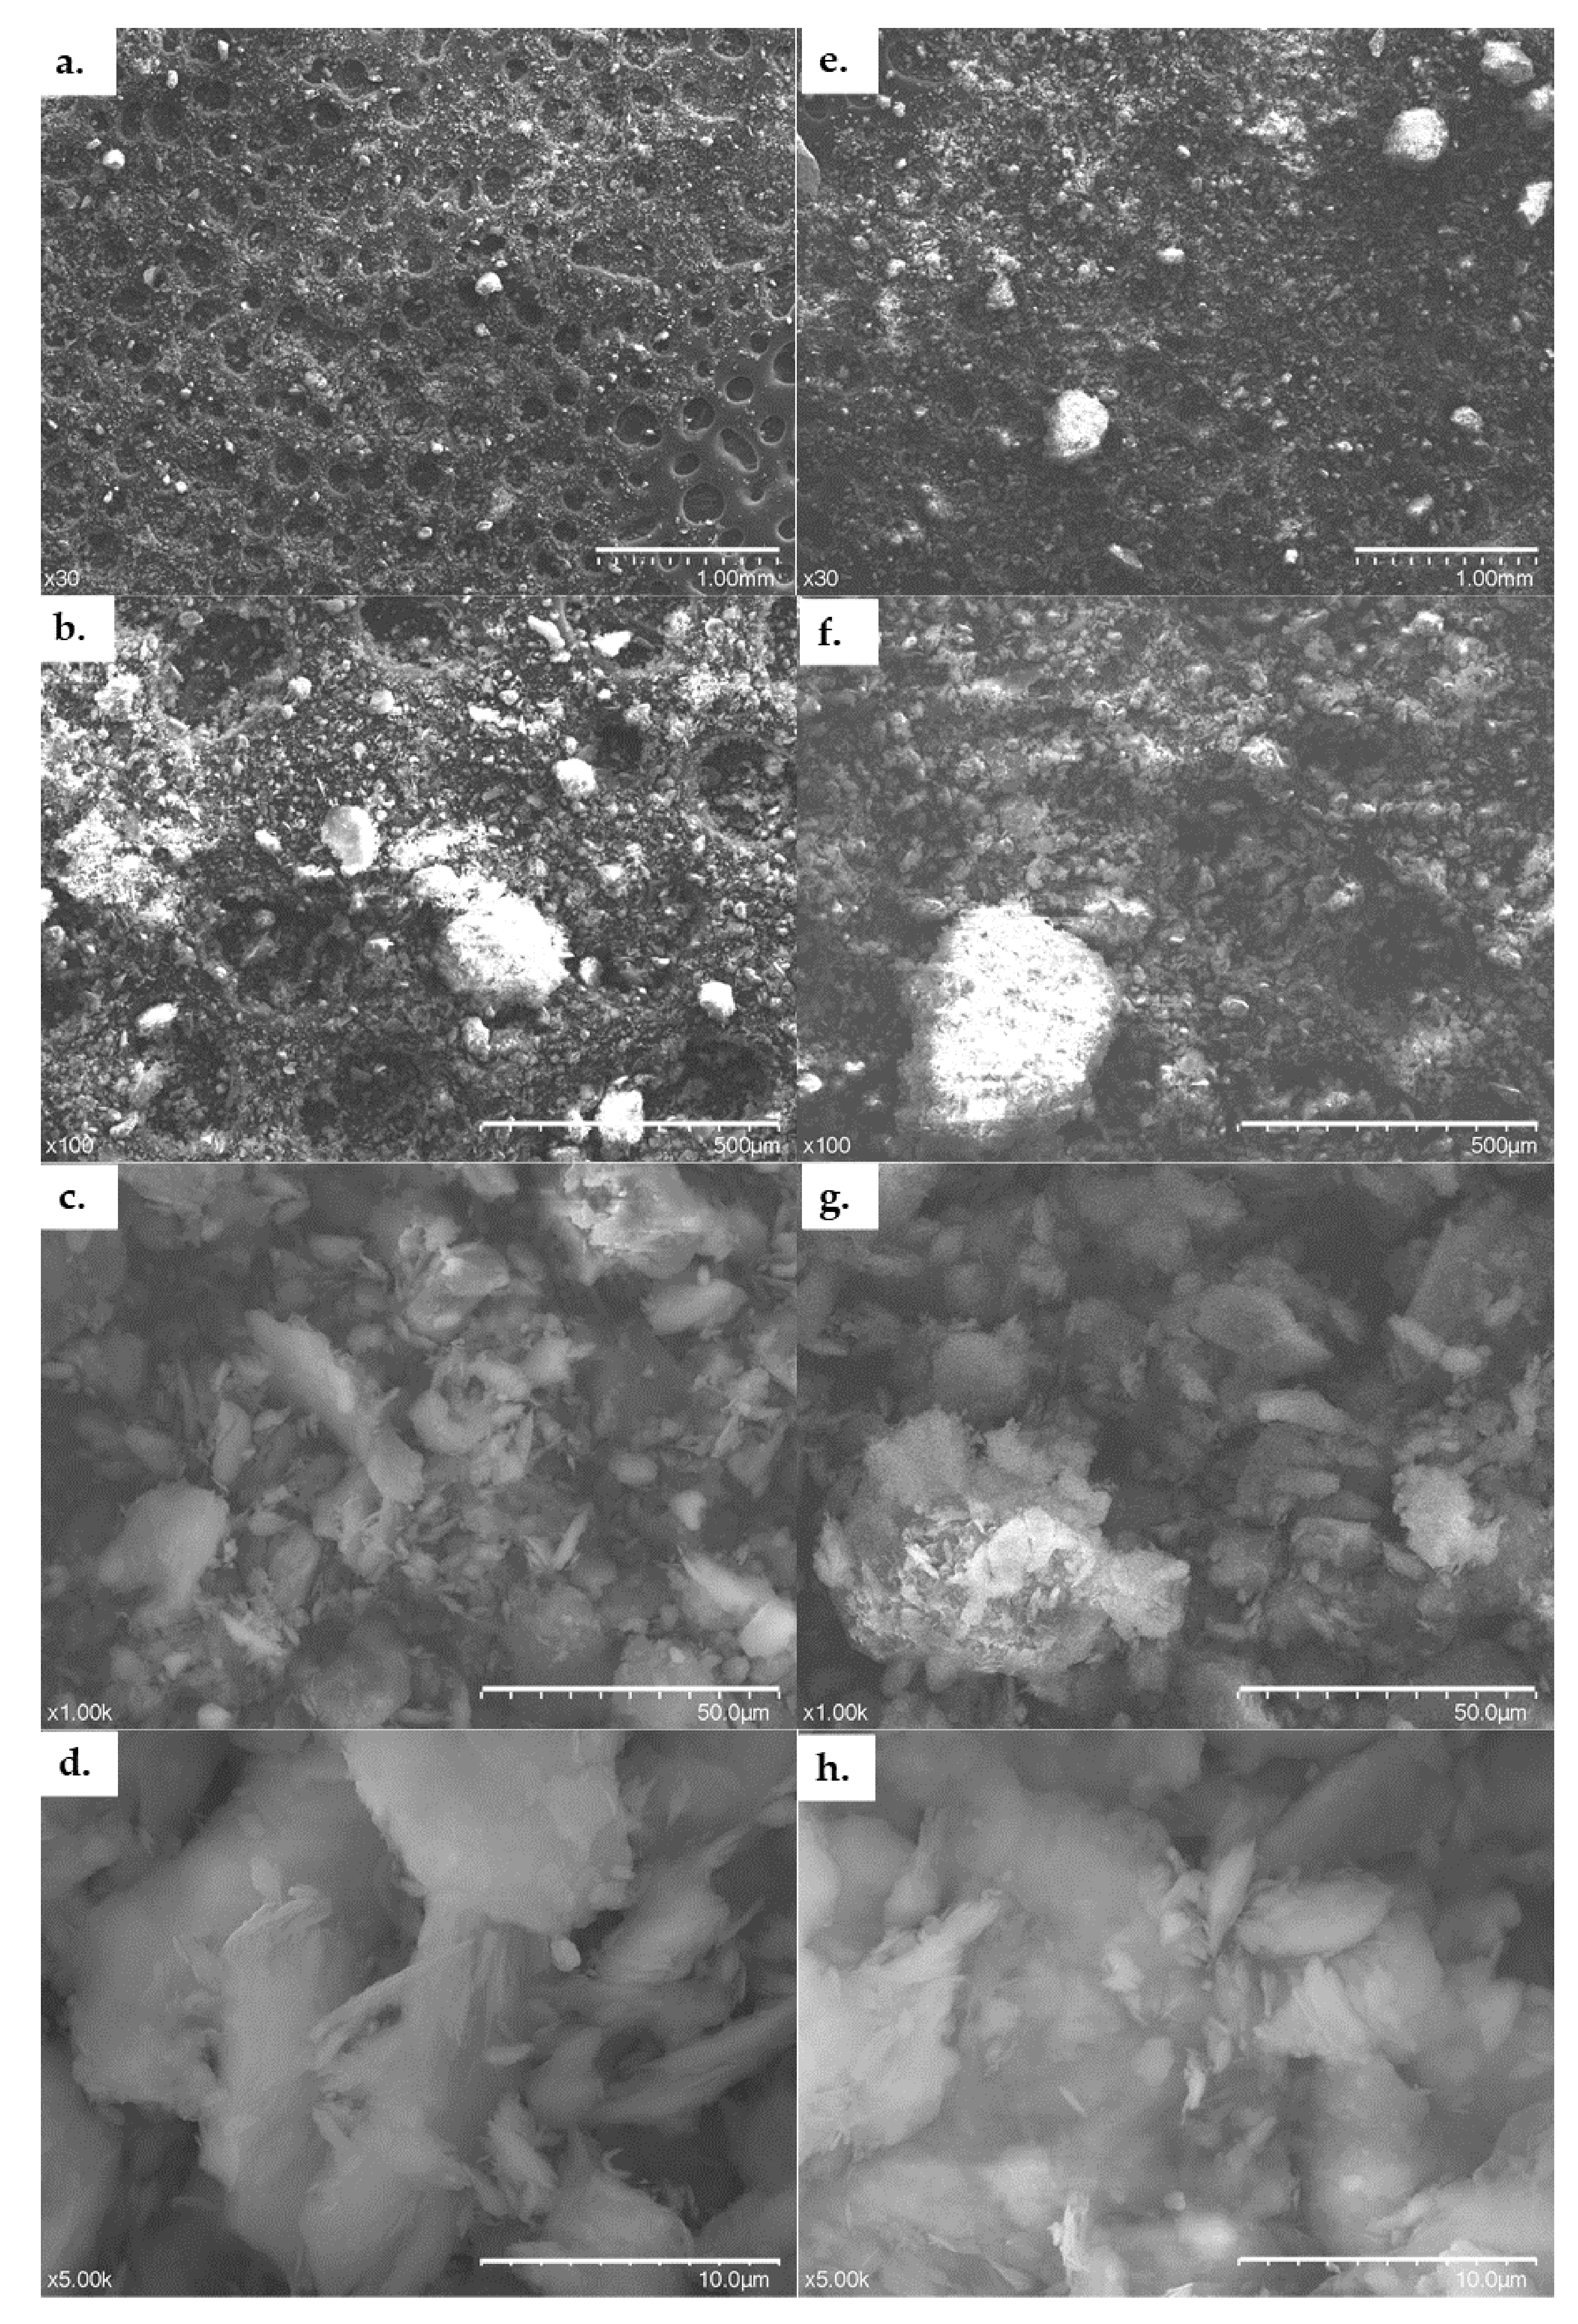
2.4.1. SEM and EDX

The texture and morphology of ACC before and after Cd2+ adsorption treatment were studied using Scanning electron microscopy (JEOL(USA)JSM5510 LV SEM), while the elemental composition determination was carried out using Energy dispersive spectroscopy.

2.4.2. FTIR

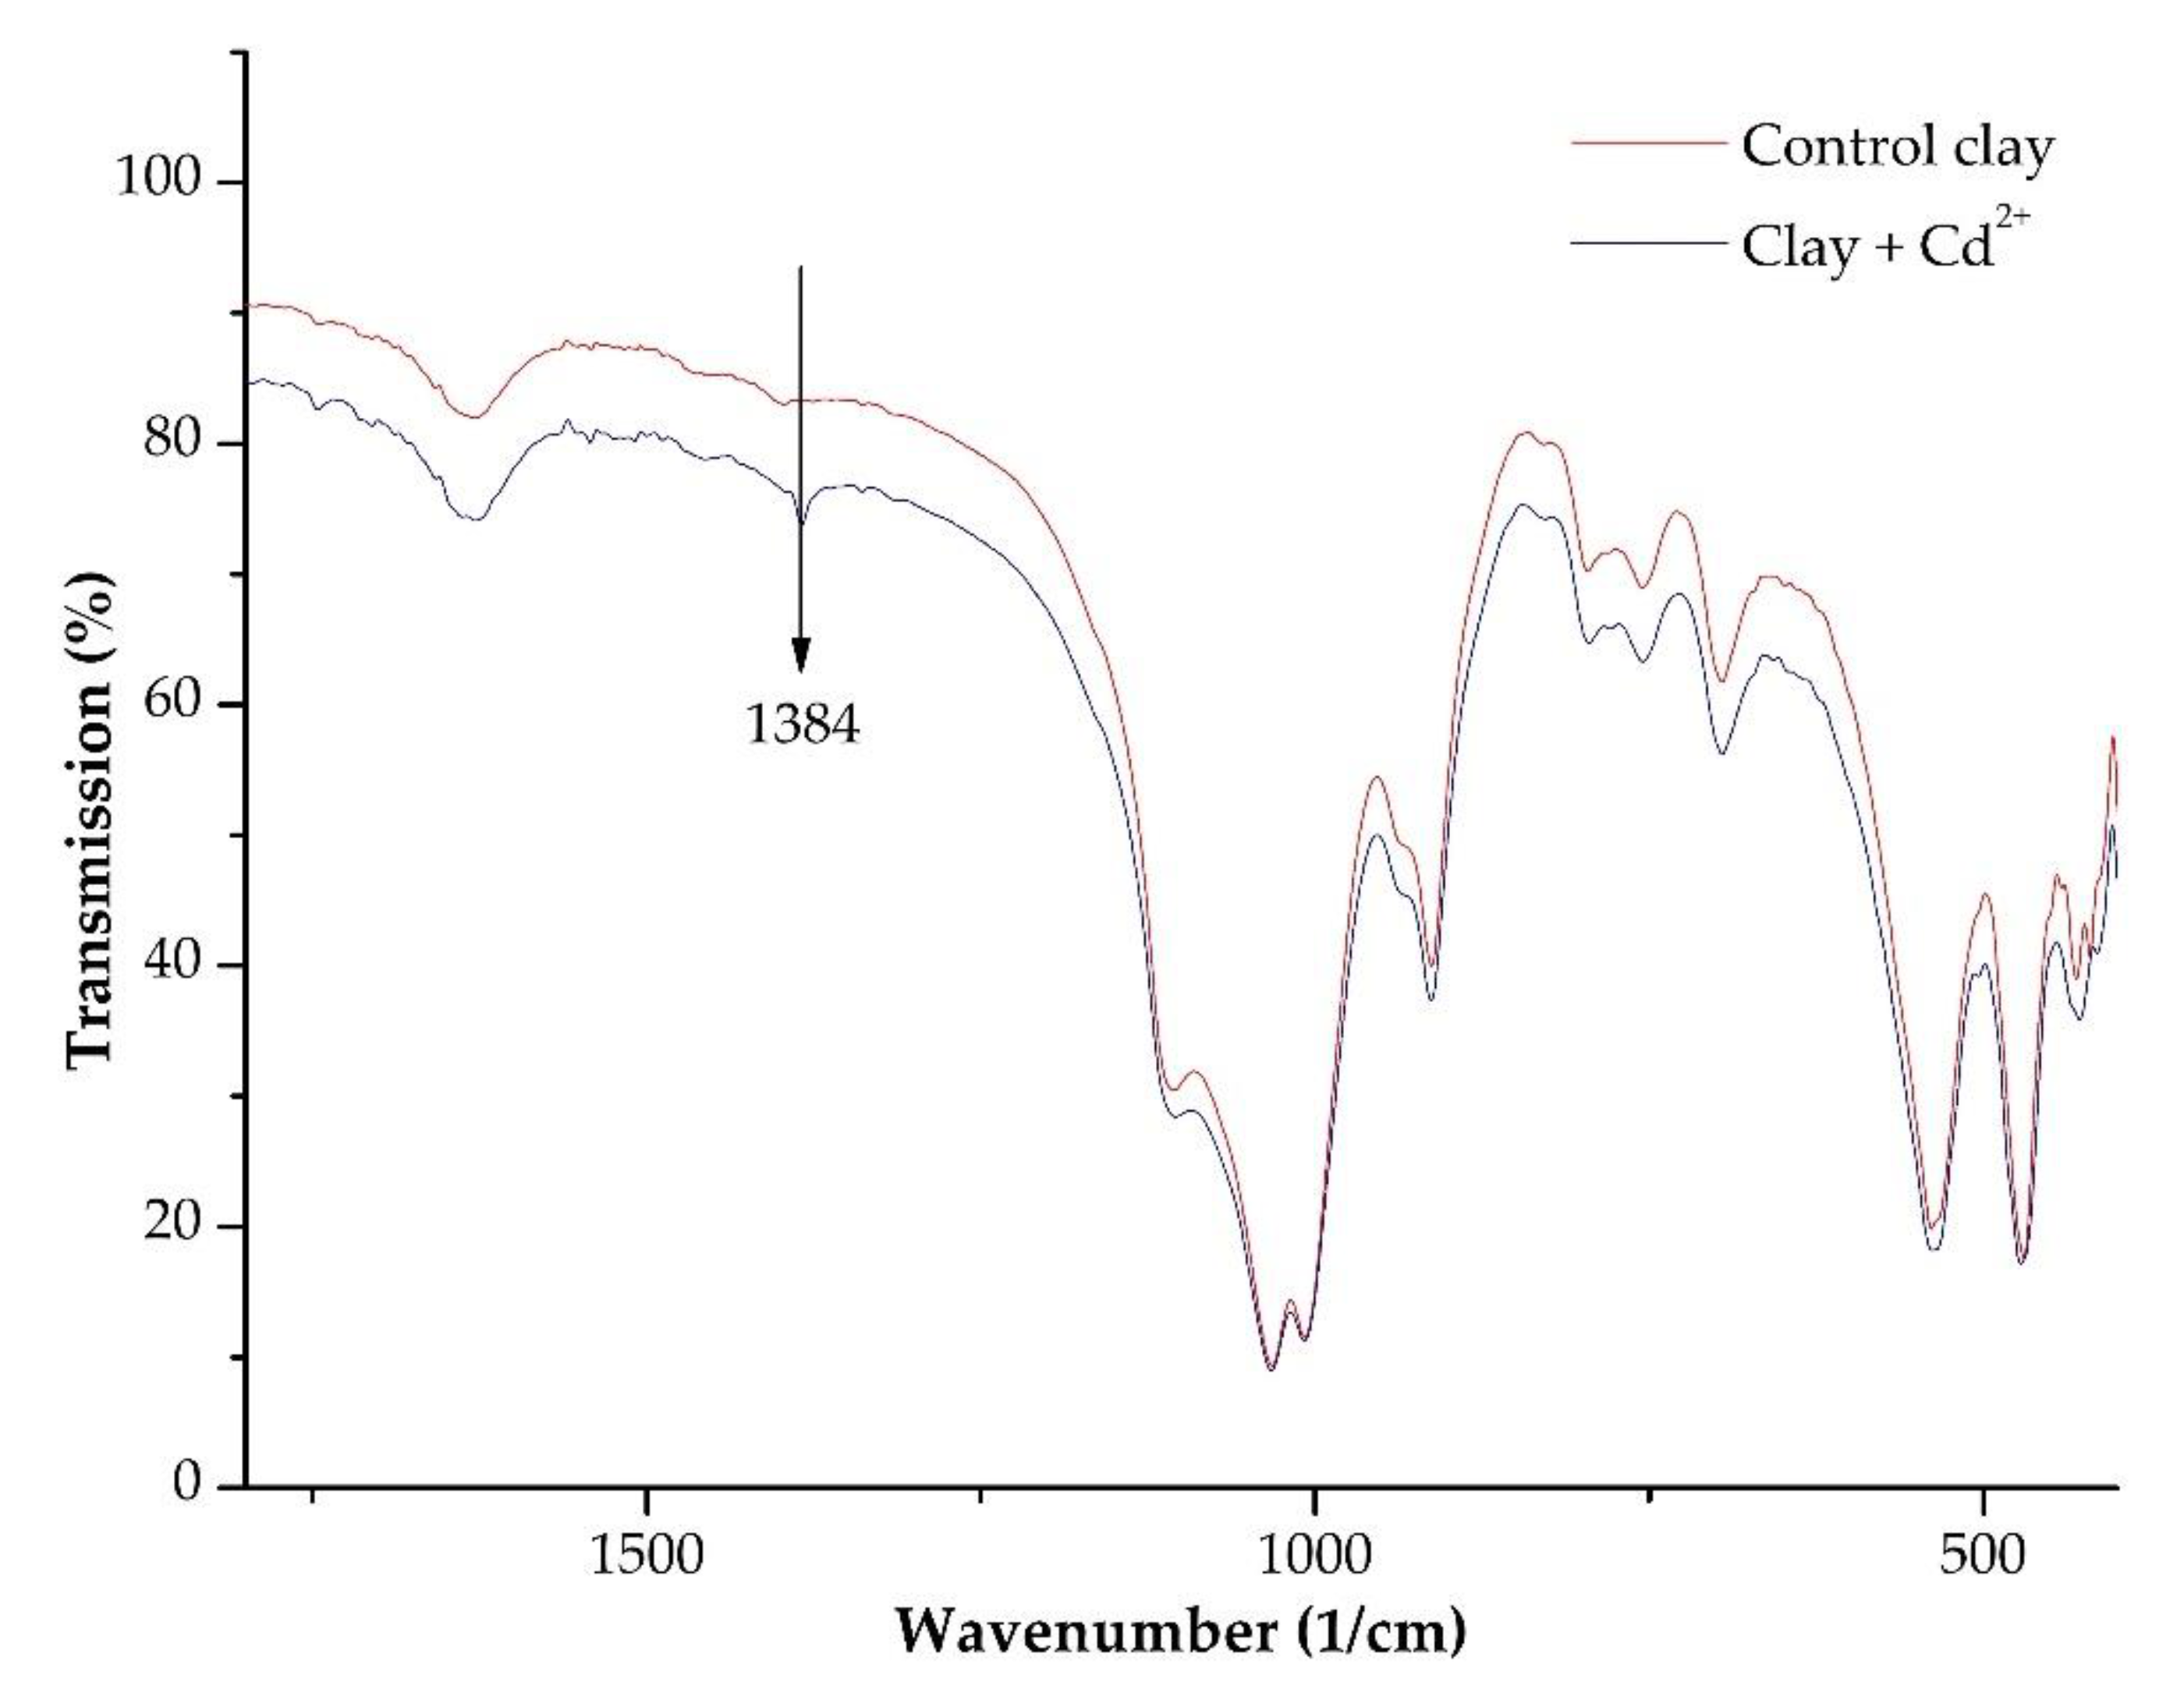
The functional groups of clay were characterized by the FTIR model before and after Cd2+ adsorption, with the help of JASCO 615FTIR at 500–4000 cm–1 wavelength.

2.4.3. XRD

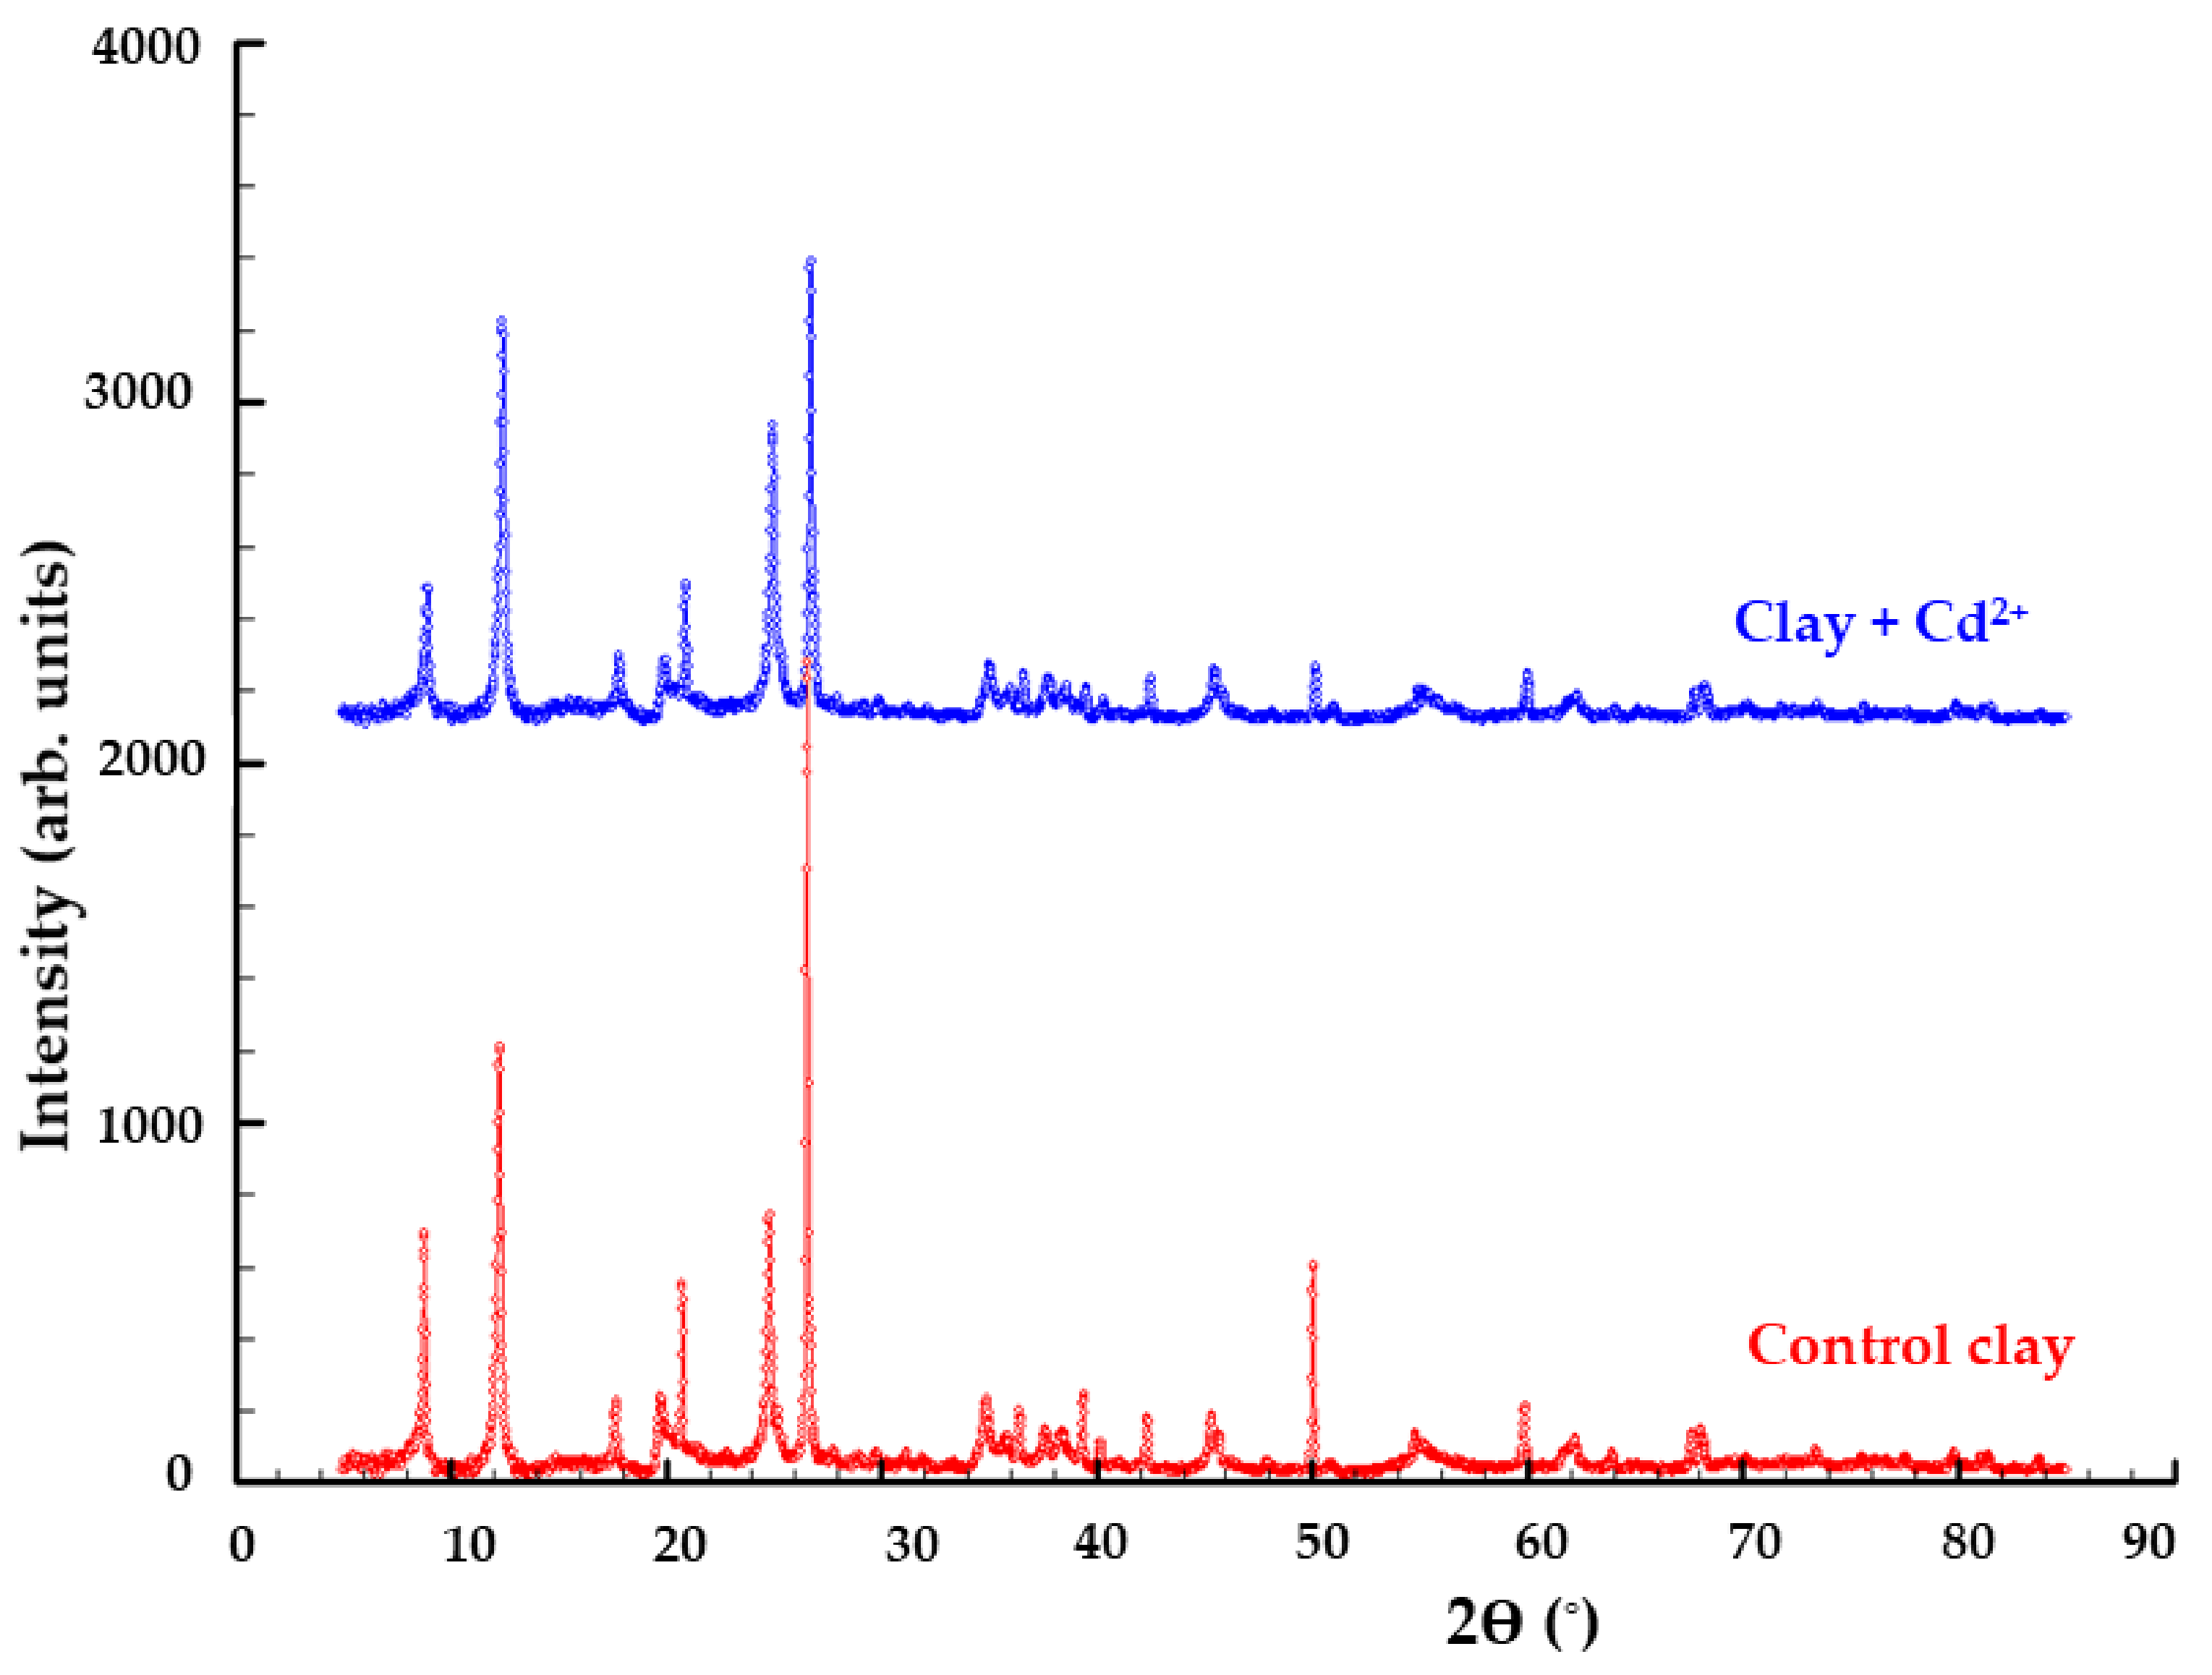
The X-ray powder diffraction patterns were obtained with a Bruker D8 Advance diffractometer using CuKα1 monochromatic radiation (λ = 1.5405980Å) obtained with a germanium (1:1:1) monochromator. The diffractometer is equipped with a LINXEYE detector and X-ray tube operates at 40 kV and 40 mA. DIFFRAC plus XRD Commander Program was used for data acquisition employing a scan rate of 0.05°/s in the angular domain 2θ = 5–85°.

2.4.4. Raman Microspectroscopy

A confocal HORIBA LabRAM HR800 spectrometer with Nd:YAG laser (λ = 532 nm) excitation and 600 grooves/mm optical grating was used. The laser was focused with an Olympus 100× objective (numerical aperture = 0.9) on the sample surface, where the laser power was 25 mW and the laser spot diameter was ~1.5 μm.

3. Results and Discussion

3.1. Characterization of Cosmetic Clay

3.1.1. SEM and EDX

Scanning electron microscopy was used to investigate the micromorphology and structural peculiarities of ACC. Figure 5 shows the ACC adsorbent before (Figure 5a–d) and after (Figure 5e–h) adsorption with Cd2+. The porous structure of ACC can be seen in Figure 5a, moreover, it shows that the surface of the adsorbent is filled with 10–300 µm holes. On the other hand, the SEM image of the sample that adsorbed Cd2+ shows slightly distinct morphology. The porous structure of ACC disappeared after adsorption, the surface is smoother, and some aggregates appear on the surface.
Table 2 summarizes the results of EDX investigations, calculated from three consecutive measurements both for control ACC adsorbent and Cd2+ adsorbed ACC. From the results below, we can conclude that ACC contains a relatively high percentage of Al (Wt(%) = 11.4 ± 0.9) and Si (Wt(%) = 13.7 ± 1.4), moreover Mg, K, Ti, and Fe in small quantities. Therefore, it can be affirmed that ACC is an alumina-silicate mineral. This result corresponds to the elemental composition described on the product packaging and in the patent. After the adsorption process, the clay adsorbed the Cd2+ ions from the polluted water. This can be seen from the EDX results, where Cd2+ appears in the sample (Wt(%) = 0.2 ± 0.01).
An example from another study, where H. Es-sahbany et al. studied the removal of Ni with the help of clay taken from the Ain Dorrij—Ouezzane region of Morocco. The results of elemental composition of the clay material contained Ca (20.65 ± 0.08%), Si (12.7 ± 1.9%), Al (8.3 ± 0.3%), Ti (0.34 ± 0.01%) and Fe (4.83 ± 0.02%). The used clay mainly consisted of kaolinite, chlorite phase and slight amount of quartz [44].
Table 2. Results of elemental composition calculated from three measurements.
ElementsWt(%) Content of The Control ClayWt(%) Content of the Clay Adsorption of Cd2+
C11.9 ± 3.49.1 ± 1.5
O60.5 ± 0.761.6 ± 0.7
Mg0.2 ± 0.010.2 ± 0.01
Al11.4 ± 0.912.0 ± 0.4
Si13.7 ± 1.414.4 ± 0.7
K1.5 ± 0.21.5 ± 0.1
Ti0.4 ± 0.030.5 ± 0.03
Fe0.6 ± 0.10.6 ± 0.1
Cd00.2 ± 0.01

3.1.2. FTIR

The FTIR could identify the functional groups of the material, provide information on the clay structure, and describe the interactions between the metal ion and the adsorbent.
FTIR spectrum of ACC presenting the peculiar bands is shown in Figure 6 between the range of 1800 cm−1 to 400 cm−1. The investigation of cosmetic clay as a suspension in deionized water presents many characteristic bands. First of all, two broad bands not represented on the figure were seen around 3697 and 3620 cm−1 attributed to hydroxyl stretching. However, spectral bands at 1105, 1031, and 1008 cm−1 according to [73] were assigned to Si-O-Si and Si-O stretching, and most of the silicate minerals contain them. Our study’s result is also in correspondence regarding the bond at 912 cm−1 with the literature, being assigned the deformation of the Al-OH bonds. At a lower spectral range, the bands are more complicated to define. Usually, the remaining bonds correspond to the vibration of the Si-O bond [74]. Bonds at 796 cm−1 could be assigned to a hydroxyl translation mode, while 754, 696, and 537 cm−1 could be ascribed to Si-O stretching and Al-O-H deformations and Si-O-Al translation mode. At the lower range, 472 and 420 cm−1 bands to ν6 (e) and ν3 (a1) modes of the SiO4 tetrahedra. Moreover, the band at 430 cm−1 could be attributed to O-Al-O bending with a minor contribution of O-Si-O bending [75,76,77,78].
After the adsorption with Cd2+ solution made from Cd(NO3)2 ∗ 4H2O salt, a particularly strong vibration was observed at 1384 cm−1 that can be attributed to NO3 asymmetric stretching [73,79,80,81].
Figure 6. FTIR control and 2 g/L Cd2+ adsorbed ASLAVITAL clay.
Water 14 00279 g006

3.1.3. XRD Investigations

Since soil, rocks, dust and clay samples contain various highly crystalline components, the XRD is a proper analysis that can be used to highlight the mineral composition of the studied ACC. Comparing the two patterns, namely Clay + Cd2+ and Control clay (Figure 7) shows a high similarity, with both samples having high crystallinity.
In order to highlight the existence of different crystalline phases contained in the samples (Figure 8), the diffraction patterns were investigated using the Match software, which has its incorporated database. In this sense, the analysis of Control clay revealed that the sample contains three major components. As expected, the sample being clay contains silicon oxide-SiO2 (in the form of quartz). The other two identified components are phyllosilicate minerals, based on silicate groups. One phase is Potassium Aluminium Silicate Hydroxide-(KH3O)Al2Si3AlO10(OH)2, known as a form of illite and Aluminium silicate hydroxide-Al2Si2O5(OH)4 known as kaolinite. Figure 8 (for Control clay sample) specified each diffraction line to which of the three phases it belongs by the following notations: q-quartz, i-illite and k stands for kaolinite. The following database reference codes were used in the actual identification: 99-201-2847 for quartz, 99-200-3858 for kaolinite and 00-026-0911 for illite.

3.1.4. Raman Spectroscopy

In the control sample (Figure 9), the most intense Raman band was detected around 146 cm−1. Weaker Raman bands were identified at around 130, 200, 260, 333, 398, 426, 467, 511, 634, 702, 792 and 909 cm−1. In the OH-region, Raman bands at ~3624, 3659, and 3702 cm−1 were detected.
The Raman spectra of the Cd-treated samples were identical to the control samples. The most intense Raman band was detected around 146 cm−1. Several weak bands were also recognized at around 130, 198, 259, 334, 398, 426, 467, 511, 638, 705, 791 and 910 cm−1. Additionally, at high frequencies, bands at 3624, 3658, and 3698 cm−1 were also identified.
Rarely crystals with intense bands around 126, 200, 464 cm−1, with weaker bands at 262, 365 cm−1 were also detected in both samples.
Based on the Raman spectra of the control and Cd-treated ACC powders, the following phases could be identified. The most intense Raman bands (~146, 200, 398, 511 and 638 cm−1) are characteristic of anatase (TiO2), which is a typical phase detected in kaolinite-bearing clays [82]. The weak Raman signals of kaolinite can be attributed to the observed bands at around 130, 259, 333, 426, 464, 704 m 791 and 910 cm−1 [83]. The characteristic bands of hydroxyl groups found in kaolinite could also be detected near 3624, 3658 and 3700 cm−1 [84]. Rare crystals of quartz with intense bands at 126, 200 and 464 cm−1 could also be detected. Illite could not be directly detected with Raman spectrometry since it has overlapping peaks [85] with both quartz (~464 cm−1) and kaolinite (~464 and ~705 cm−1). Raman band, which can be associated with the absorption band of NO3 (Cd solution was made from Cd(NO3)2 ∗ 4H2O salt) on the FTIR could not be detected.
Figure 9. Representative Raman spectra of the control and 2 g/L Cd2+ adsorbed ACC.
Water 14 00279 g009

3.1.5. A brief Literature Review of the Characteristics and Structural Properties of Kaolinite and Illite

Both kaolinite and illite belong to the group of layered silicates. Layer silicates are the primary constituents of the earth’s crust and have good impermeability.
Kaolinite is a 1:1 type of layered silicate, i.e., it contains a tetrahedral layer of silicon and an octahedral layer of aluminum, which are bonded together by oxygen (Figure 10). Hence, the layers have a triclinic symmetry, where a tetrahedral (SiO4) and an octahedral (AlO6) sheet alternate [53].
It is electrostatically neutral in its properties. It contains hydrogen bonding between the oxygen atoms and hydroxyl ions of the paired layers. The weak hydrogen bonding between the layers can result in frequent random movements. This results in kaolinite minerals of lower crystallinity as opposed to triclinic kaolinite. Kaolinite, with its ideal structure, is free of charges. Since the kaolinite mineral structure is fixed by hydrogen bonds, in aqueous media the layers do not expand and the shrink-swell capacity is low [55,60,86].
Due to its highly compacted structure, kaolinite gains are difficult to break down and kaolinite layers cannot be easily separated. the adsorption itself takes place on the surface and edges of the kaolinite, so this is the place, where the impurities, contaminants can be trapped [86].
The literature data suggest a low specific surface area (5–40 m2/g) compared to other clay minerals. Due to its low isomorphic substitution, kaolinite has a low ion adsorption capacity. Cation exchange capacity at pH 7, 3–15 mEq/100 g [60].
Figure 10. Structure of kaolinite and illite (Original figure, SEM images from [87,88]).
Water 14 00279 g010
In a study reported by Jorge C. Miranda-Trevino, the kaolinite samples contained some illite and that resulted in the increase in cation exchange capacity to 17.8 mEq/100 g (at pH = 7) [86]. In the meantime, the surface area was measured to be 16.41 m2/g.
The illite is also a layered silicate, but of the 2:1 type. This means that an octahedral sheet is enclosed by a tetrahedral sheet at the bottom and a tetrahedral sheet at the top (Figure 10). The tetrahedral sheet contains 20% aluminum atoms instead of silicon atoms, which have significant ion (isomorphic) substitution. The adsorption capacity, swelling and shrinkage capacity are lower than montmorillonite and vermiculite, but higher than kaolinite, in which interlayered sheets are present. Illite shows a higher cation exchange capacity than kaolinite, typically 10–40 mEq/100 g (pH = 7), while the specific surface area 10–100 m2/g [55,60].
Besides the structures of the layered silicates, Figure 10 contains SEM images of kaolinite and illite from the literature with 24K magnification.

3.2. Adsorption Experiments

Usually, the optimum of the operational parameters for an adsorption process is affected by many factors. However, one of the most important factors controlling adsorption performance could be the time when the Cd2+ ions are in contact with ACC adsorbent. Figure 11 shows the evolution in time of the Cd2+ removal from aqueous solution with the help of ASLAVITAL cosmetic clay. It can be observed that the initial concentration of contaminants decreases with time. All five concentrations exhibited a more rapid decrease rate initially, and then the adsorption rates tended to be flat. According to the literature, it is due to the rich number of active binding sites on the surface of the adsorbent [40,89].
For equilibrium and then kinetic studies, batch adsorption measurements were carried out. We can see that Cd2+ ions gradually occupied the porous, vacant sites of ACC surface. However, no significant variation in the residual Cd2+ was observed and equilibrium was reached as time passed.
Figure 11. Effect of contact time on the removal of Cd2+ ions (Ci = 10–160 mg/L, 0.1 g/L ACC, pH = 7, T = 20 ± 1 °C).
Water 14 00279 g011
The adsorption efficiency of Cd2+ ions on ACC were investigated at various initial concentrations between 10–160 mg/L via the batch adsorption method. In equilibrium, results showed (Figure 12) that the adsorption capacity (q) increased from 1.07 to 8 mg/g as the initial concentration increased from 10 to 160 mg/L. On the other hand, with the increase in concentration, the efficiency (E) decreased from 99 to 51%. This can happen because more cadmium ions were adsorbed at higher Cd2+ concentrations. However, as we have a fixed number of active sites available on the ACC surface, the efficiency decreases [36,40,90,91].
Table 3 contains clay adsorbent study results, where the examined initial parameters, efficiency or quantity in equilibrium results are also presented. Based on these studies we can conclude that clay minerals are wildly used in different forms as adsorbents in wastewater treatments from heavy metals.

3.3. Adsorption Isotherms, Kinetic and Diffusion Models

Both the adsorbent (ACC) and the adsorptive material (Cd2+ ions) are influencing factors of the adsorption system. Isotherm models in equilibrium showed that the adsorptive (in our case, the Cd2+ ions) are distributed between the liquid (water) and solid (ACC) phase and the relationship, performance and interaction between these (Cd2+ + liquid phase, Cd2+ + clay surface) could also be defined [33,44]. Langmuir, Freundlich, Temkin and Dubinin–Radushkevich linearized isotherm models were employed to investigate the interaction between the Cd2+ ions and clay using different initial concentrations of Cd2+ (10–160 mg/L), applying a constant temperature (20 °C) and adsorbent dosage (1 g). The results listed in Table 4 compared the regression correlation coefficients (R2) of these models. Based on the results, we established the order of correspondence of the applied isotherm models: Langmuir II. (R2 = 0.954) > Dubinin–Radushkevich (R2 = 0.933) > Freundlich (R2 = 0.885) > Temkin (R2 = 0.859) > Langmuir I. (R2 = 0.798) > Langmuir IV. (R2 = 0.744) > Langmuir III. (R2 = 0.605).
As the regression correlation coefficient was highest in the case of Langmuir isotherm, the error functions, separation factor was calculated for this model [33,98,99]. According to the literature, the value of RL can define the type and favorability properties of an isotherm model:
  • RL = 0 → irreversible and linear adsorption;
  • 0 < RL < 1 → favorable adsorption;
  • RL > 1 → unfavorable adsorption.
RL values calculated for Langmuir II. isotherm were in the range of 0.037–0.027; this result suggests that in our experimental conditions, the adsorption of Cd2+ ions was favorable but with a high tendency of irreversibility. According to the theoretical properties of Langmuir isotherm, the adsorption occurs on a homogenous surface, and only one layer is formed (monolayer adsorption) [91,100]. The precisely calculated isotherm parameters tell us about the nature and type of the adsorption. In our experimental conditions, these constants (B-Temkin: 1 × 10⁻⁴ J/mol < 20 kJ/mol; E-Energy: 3.16 kJ/mol < 8 kJ/mol) indicated that the adsorption is a physical one, where weak van der Waals bonds are formed on the ACCs monolayer surface. Moreover, the binding sites on ACC surface are equivalent.
In order to find the best adsorption equilibrium correlation, the isotherm models were also modelled in non-linear form using OriginPro 8.5 software. Based on the literature, nonlinear regression is the most feasible and accurate method for estimating the parameters of the isothermal models, as it uses the original equations rather than modified versions that may bias the results [101].
The parameters of the Langmuir, Freundlich and Temkin isotherms obtained after linear translation and non-linear fitting, we observed that the regression coefficient (R2) was found to be higher for linear fitting. The values of KL;F, qmax, nF, AT, and B also differ due to the bias in the fits (Table 4 and Table 5). Comparing the obtained linear regression coefficients (R2; the larger the better) and Chi-squared (χ2; the smaller the better), the degree of fit follows the following order: Liu (the best fit: R2 = 0.965, χ2 = 1.101) > Toth > Khan > Langmuir > Freundlich > Temkin (Table 5).
Under this isothermal model, which is considered optimal, the adsorption binding constant KLiu = 0.03 L/mg and the maximum amount of cadmium bound qLiu = 8.07 mg/g. Further study of the best-fit Liu isotherm parameters shows that qLiu (8.07 mg/g) is almost the same as the qexp. (8 mg/g) values for the 160 mg/L Cd2+ solution. Differences between the parameters calculated due to non-linear fitting of the isotherm models are observed. These differences are presumably due to the equations used, the accuracy of the fitting, the precision of the software used, the program package, the number of fitting iterations performed.
Kinetic models are used to determine the temporal effect of the adsorption process. They present information on the change in the experimental system over time, characterize the rate of adsorption uptake and binding at the solid-solution interface or during the sorption reaction [102,103,104]. In this study, pseudo-I-order (Lagergen) and pseudo-II-order (Ho and McKay) kinetic models were calculated when the initial concentration of Cd2+ was changed (between 11–157 mg/L). However, the temperature (20 °C) and adsorbent dosage (1 g) were constant. Table 6 contains the calculated results of kinetic models. Based on the obtained linear regression coefficient values, it can be observed that the adsorption system did not follow a pseudo-I-order model, as the value of R2 was higher in the case of the pseudo-II-order model. The values of qe(cal) also depicted a better fitness of the model since they were almost identical with the pseudo-II-order qe(exp) values, this model was better obeyed.
As shown above, one way to model kinetic data is to use pseudo-first-order and pseudo-second-order kinetic models. These models describe the interaction between the molecule or ion of the pollutant of interest (in our case Cd2+) and the active binding sites on the surface of the adsorbent (ACC). However, diffusion models are also necessary, as the kinetics of the process can often be influenced by diffusion within the particles [105].
The diffusion model (intra-particle, liquid film) assumes that the rate is determined by the diffusion steps, since the interaction between the pollutant and the active sites on the sorbent surface is more immediate [106]. The literature records suggest that four main steps occur during the adsorption mechanism of heavy metals onto binding sites [51,105]:
  • From the water-Cd2+-clay suspension, metal ions transport into the boundary layer of the clay adsorbent surface.
  • The metal ions diffuse through the boundary layer on the surface of the adsorbent. This process is called liquid-film or external-film diffusion.
  • Intraparticle surface diffusion, where the metal ions are diffused in the adsorbed state along the internal surface of a clay particle.
The metal ions adsorbed on the active binding sites of the adsorbent by physical or chemical bonds. The physical and chemical properties of the adsorbent and the surface properties can influence the extent of each step. It can therefore be said that the intraparticle particle diffusion rate or the liquid film diffusion rate can control the sorption of Cd2+ ions on the surface of the ACC. Table 7 summarizes the diffusion (intra-particle, liquid film) parameters calculated from the maximum equilibrium binding rates obtained in this study. In particular, the linear regression coefficients, the intersection points, the velocity values, and the particle diffusion coefficient (D) are given. The pore diffusion coefficients vary between 2.64 × 10⁻⁹ and 2.94 × 10⁻⁸ cm2/s with changing concentration. Our results show that the linear plots of intra-particle and liquid film diffusion do not cross the origin, indicating that boundary layer diffusion was involved in the adsorption process. Intra-particle diffusion and liquid film diffusion are thus not separate rate-determining steps. Thus, liquid film diffusion and intra-particle diffusion together control the adsorption process by which Cd2+ is removed from the aqueous solution by ACC [40,107].

3.4. Potential Limitations of Clay Adsorbents

The first and most important task in adsorption studies is the selection of an adsorbent that meets a number of parameters [108]. The comparison of individual sorbents is almost impossible due to the physical and chemical properties of the base materials of the adsorbents and the different impurities and processing conditions [98].
A review article published in 2017 summarizes the advantages of different clay minerals, listing arguments for their use as adsorbents [109]. Their arguments include that clay minerals:
  • Have strong sorption and complexing properties;
  • Low cost;
  • Are readily available;
  • Have a high specific surface area compared to other sorbents;
  • Non-toxic;
  • And have ion exchange potential.
Based on sources, clays costs about $0.005 to $0.46/kg. Montmorillonite costs about $0.04 to $0.12/kg, which costs 20 times less than activated carbon [53]. In Romania 0.34 kg activated carbon for fish aquarium cleaning costs around $10. For this reason, many clay minerals are widely used for their adsorption-desorption properties of organic molecules [109].
Apart from the advantages, as with all adsorbents, the use of clay minerals has disadvantages and limitations. The barriers of adsorbents are summarized by Naef A. A. A. Qasem et al. in a recent review [28]. A major obstacle to water treatment is that the ability to simultaneously remove different types of ions has not been investigated in most cases. Most studies are laboratory based and only investigate the removal of single component contaminants. This may also mean that most of the adsorbents cannot be used on an industrial scale as detailed and optimized technology has not been developed.
For industrial upgrading, high retention times, periodic cleaning or adsorbent regeneration or desorption, water after-treatment are also issues to be addressed. During the batch adsorption process, the sorbent may be further fragmented by agitation, and small particles or colloids may appear in the water, making sedimentation and sludge removal more difficult. Disposal and treatment of the resulting adsorbent waste, which can often be toxic, can be another obstacle. With all these advantages and disadvantages, adsorption technology has turned out to be the most considered process among all water treatment methods (Figure 2) in recent years.

4. Summary and Conclusions

In the present work, ACC—ASLAVITAL commercial cosmetic clay—was morphologically and elementally analyzed; moreover, it was successfully used to remove Cd2+ from water.
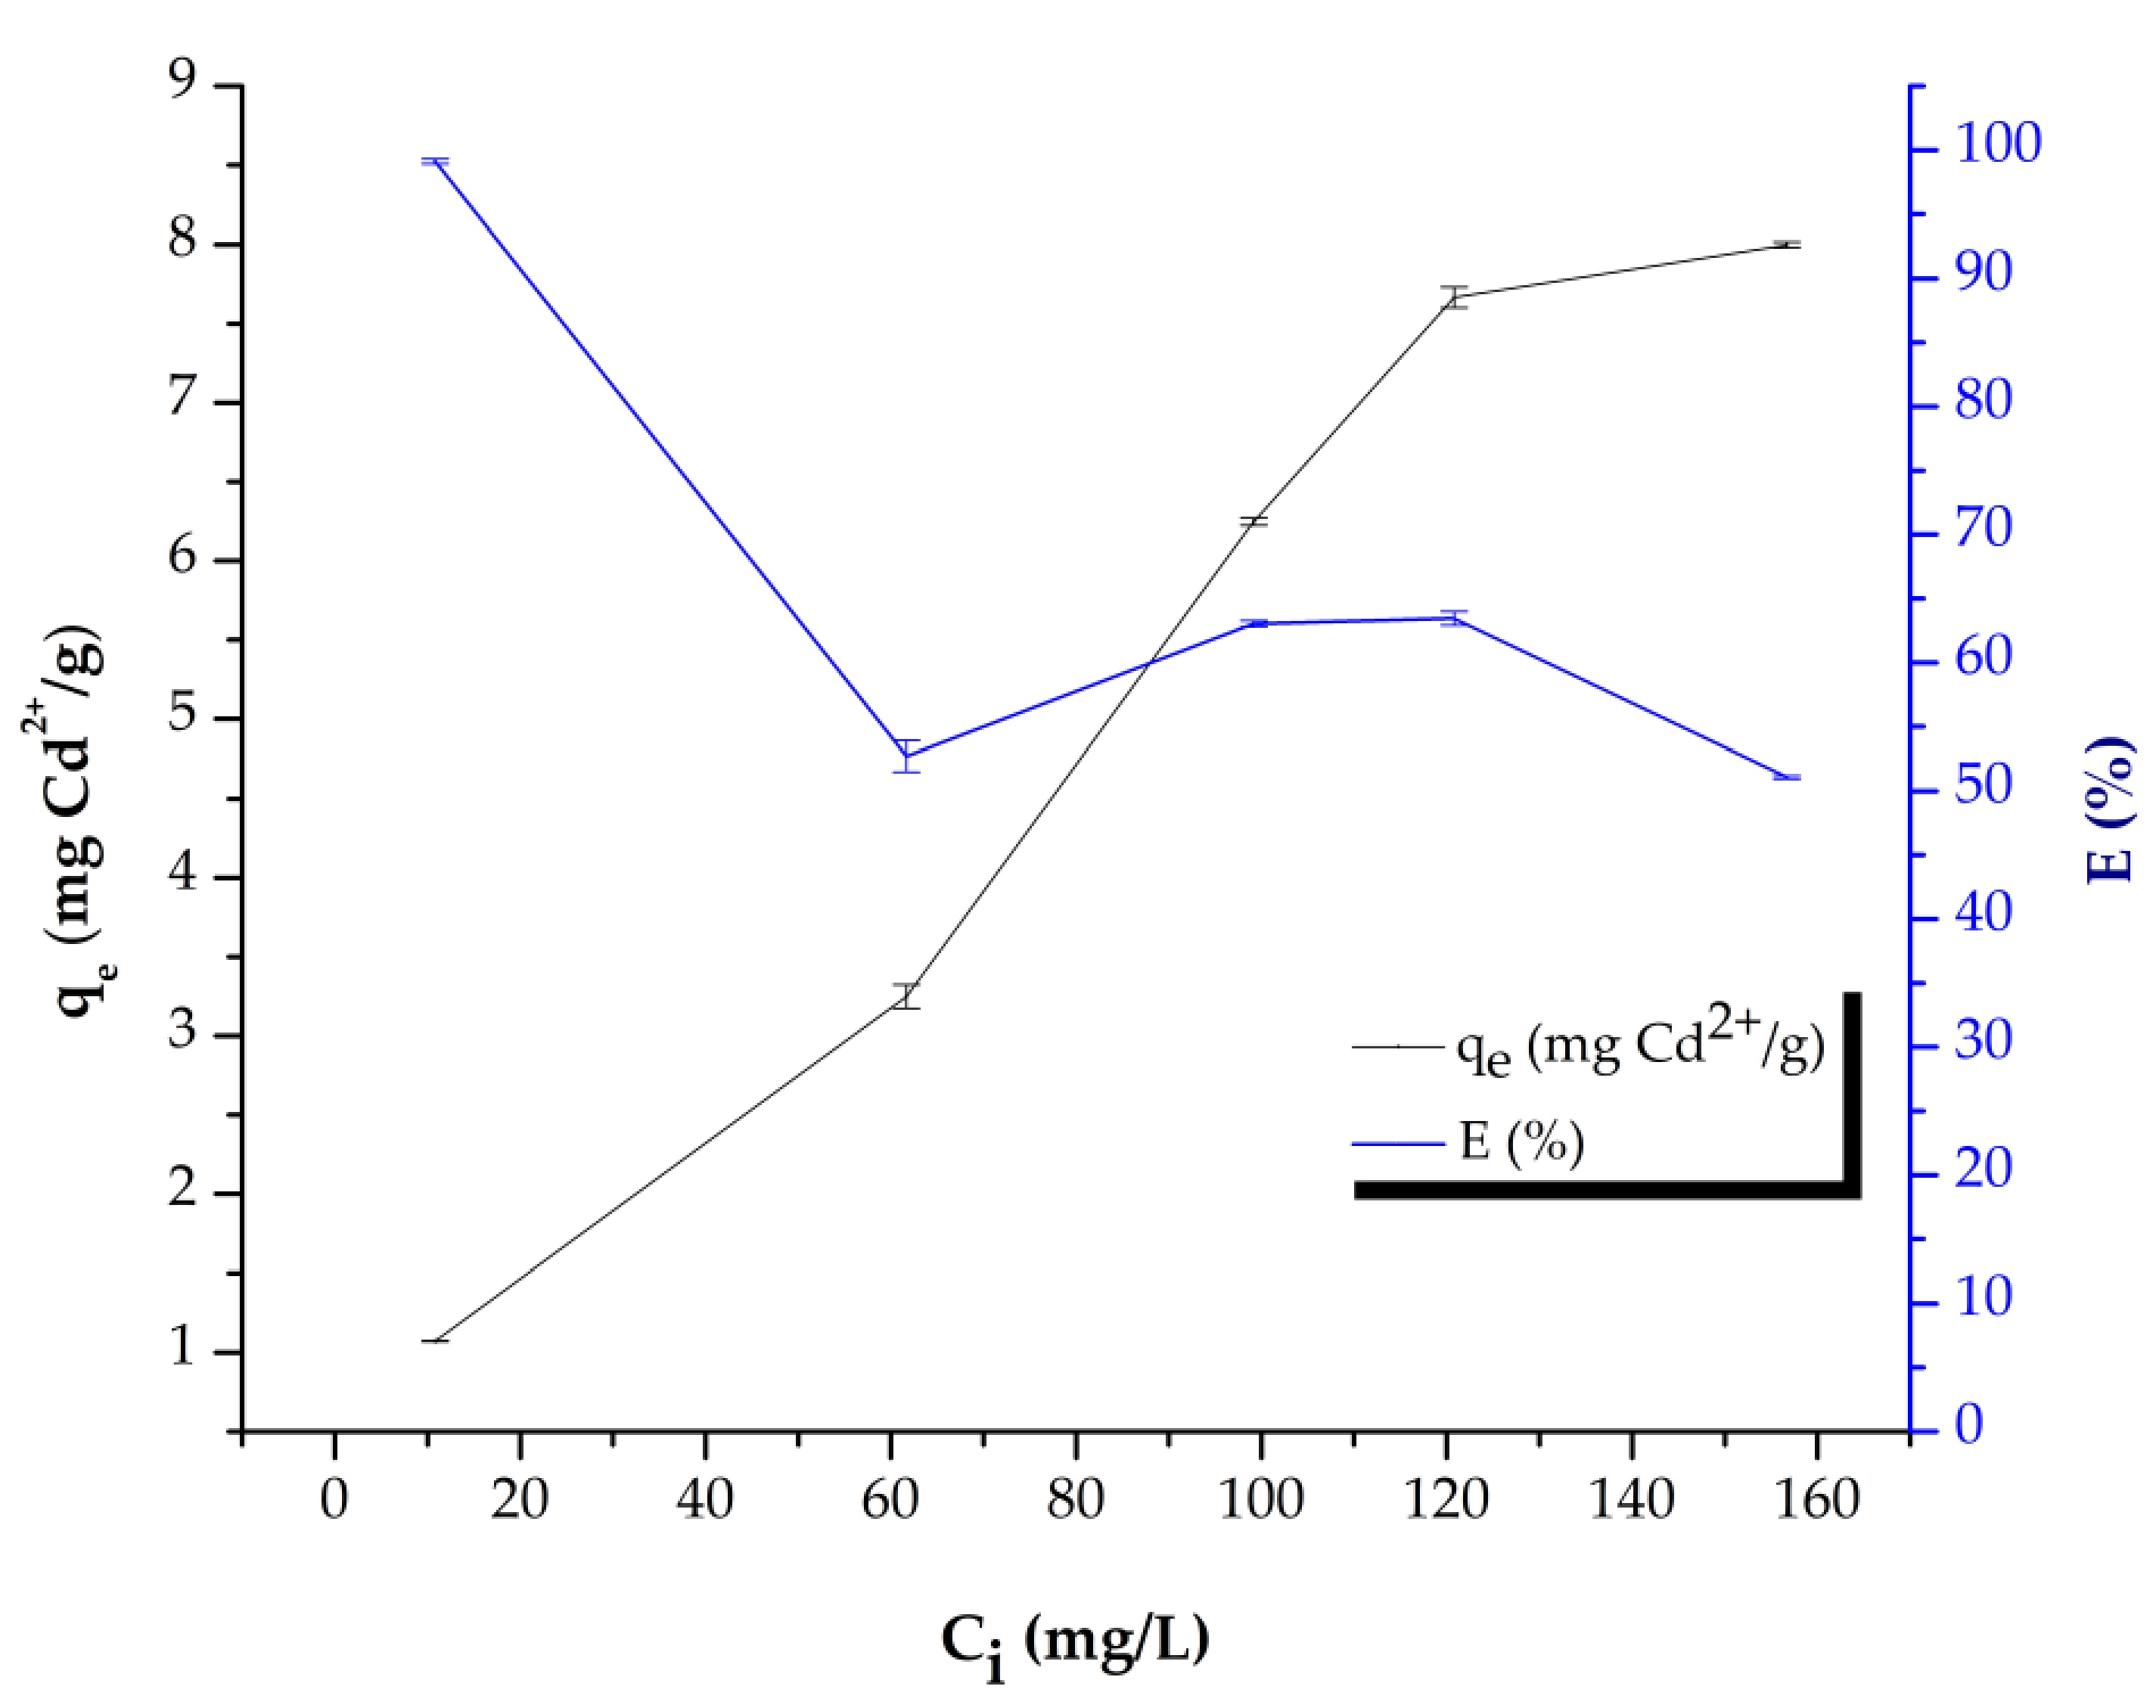
It was observed that the initial concentration of contaminants decreased with time, as all investigated concentrations exhibited a rapid decrease rate in the first part of the experiment. Then the adsorption rates tended to be flat. Quantity in equilibrium increased from 1–8 mg/g with the increase in initial Cd2+ concentration. Our hypothesis proved that ACC is an excellent adsorbent as 99% Cd2+ removal efficiency was reached within 190 min.
Adsorption equilibrium results were further analyzed with linear (Langmuir, Freundlich, Temkin, Dubinin–Radushkevich) and non-linear (Langmuir, Freundlich, Temkin, Toth, Khan, Liu) isotherm models with OriginPro 8.5 software. The best fit in linear form was obtained for the Langmuir. II model, where R2 = 0.954, while the RL values ranged between 0.037–0.027. The B-Temkin constant was smaller than 20 kJ/mol and the E-Energy was smaller than 8 kJ/mol. Results indicated that physical bonds form during the favorable adsorption. For the non-linear fits, the Liu model proved to be the best R2 = 0.965, χ2 = 1.101. Moreover, the investigations regarding the evaluation of linear regression coefficient values showed that the adsorption system had a higher linear regression coefficient (R2 = 0.988–0.999) value in the case of the pseudo-II-order model. The values of qe(cal) also showed a better fit with the model since they were almost identical with the pseudo-II-order qe(exp) values, (the differences ranged 0.03–0.34).
With the use of wide range of morpho-structural approaches, we studied the structure, texture, morphology and composition of the adsorbent. The morpho-structural investigations revealed that the clay mainly consists of kaolinite and illite in most considerable amounts. The elemental composition of the ACC contained Ca (20.65 ± 0.08%), Si (12.7 ± 1.9%), Al (8.3 ± 0.3%), Ti (0.34 ± 0.01%) and Fe (4.83 ± 0.02%). Using SEM investigations, it was observed that after adsorption, the surface is smoother, and some aggregates appeared on the clay surface.
The presence of clay-bound Cd2+ adsorbate was confirmed by analyzing the elemental contents (EDX) on the surface alongside spectral analysis (FTIR, Raman) and XRD. After adsorption, Wt(%) = 0.2 ± 0.01 Cd2+ was detected in the sample.

Author Contributions

S.T. and E.R. designed the work, carried out the experiments, analyses, interpreted all data received and wrote the manuscript; L.E.A. performed Raman spectroscopy measurements and interpreted the results, wrote the regarding part; G.K. helped in original draft preparation of the manuscript; A.T. performed the XRD analyses and results. All authors have read and agreed to the published version of the manuscript.

Funding

E.R. is grateful for the Sapientia Hungariae Foundations’ Collegium Talentum research scholarship program. We are grateful for the trust and support of the Sapientia Hungarian University of Transylvania and Hungarian Academy of Science. G.K. acknowledges the financial support by National Research, Development and Innovation, project ID: NKFI PD-125311. The work of L.E.A. was granted by the ELTE Institutional Material Science Excellence Program (TKP2020-IKA-05) financed by the Hungarian Ministry of Human Capacities.

Institutional Review Board Statement

Not applicable.

Informed Consent Statement

Not applicable.

Data Availability Statement

Not applicable.

Acknowledgments

This research would not have been possible without support and revision of Csaba Szabó. Special thanks to the researchers (Maria Suciu and Irina Kacso) of INCDTIM laboratory from Cluj-Napoca.

Conflicts of Interest

The authors declare no conflict of interest.

Sample Availability

Samples of the compounds are available from the authors.

References

  1. Mikhailenko, A.V.; Ruban, D.A.; Ermolaev, V.A.; van Loon, A.J. Cadmium Pollution in the Tourism Environment: A Literature Review. Geosciences 2020, 10, 242. [Google Scholar] [CrossRef]
  2. Rizvi, A.; Zaidi, A.; Ameen, F.; Ahmed, B.; AlKahtani, M.D.F.; Khan, M.S. Heavy Metal Induced Stress on Wheat: Phytotoxicity and Microbiological Management. RSC Adv. 2020, 10, 38379–38403. [Google Scholar] [CrossRef]
  3. Zhao, Y.; Deng, Q.; Lin, Q.; Zeng, C.; Zhong, C. Cadmium Source Identification in Soils and High-Risk Regions Predicted by Geographical Detector Method. Environ. Pollut. 2020, 263, 114338. [Google Scholar] [CrossRef] [PubMed]
  4. Long, X.; Chen, H.; Huang, T.; Zhang, Y.; Lu, Y.; Tan, J.; Chen, R. Removal of Cd(II) from Micro-Polluted Water by Magnetic Core-Shell Fe3O4@Prussian Blue. Molecules 2021, 26, 2497. [Google Scholar] [CrossRef]
  5. World Health Organization Preventing Disease through Healthy Environments-Exposure to Cadmium: A Major Public Health Concern. 2019. Available online: https://apps.who.int/iris/bitstream/handle/10665/329480/WHO-CED-PHE-EPE-19.4.3-eng.pdf (accessed on 10 December 2021).
  6. Basu, M.; Guha, A.K.; Ray, L. Adsorption Behavior of Cadmium on Husk of Lentil. Process Saf. Environ. Prot. 2017, 106, 11–22. [Google Scholar] [CrossRef]
  7. Peng, Y.; Li, Z.; Yang, X.; Yang, L.; He, M.; Zhang, H.; Wei, X.; Qin, J.; Li, X.; Lu, G.; et al. Relation between Cadmium Body Burden and Cognitive Function in Older Men: A Cross-Sectional Study in China. Chemosphere 2020, 250, 126535. [Google Scholar] [CrossRef]
  8. El Rasafi, T.; Oukarroum, A.; Haddioui, A.; Song, H.; Kwon, E.E.; Bolan, N.; Tack, F.M.G.; Sebastian, A.; Prasad, M.N.V.; Rinklebe, J. Cadmium Stress in Plants: A Critical Review of the Effects, Mechanisms, and Tolerance Strategies. Crit. Rev. Environ. Sci. Technol. 2020, 1–52. [Google Scholar] [CrossRef]
  9. Qin, S.; Liu, H.; Nie, Z.; Rengel, Z.; Gao, W.; Li, C.; Zhao, P. Toxicity of Cadmium and Its Competition with Mineral Nutrients for Uptake by Plants: A Review. Pedosphere 2020, 30, 168–180. [Google Scholar] [CrossRef]
  10. Cardos, E.; Roman, C.; Ponta, M.; Frentiu, T.; Rautiu, R. Evaluation of Soil Pollution with Copper, Lead, Zinc and Cadmium in the Mining Area Baia Mare. Rev. de Chim. 2007, 58, 1–5. [Google Scholar]
  11. Bora, F.D.; Bunea, C.I.; Chira, R.; Bunea, A. Assessment of the Quality of Polluted Areas in Northwest Romania Based on the Content of Elements in Different Organs of Grapevine (Vitis Vinifera L.). Molecules 2020, 25, 750. [Google Scholar] [CrossRef] [Green Version]
  12. Moldoveanu, A.M. Assessment of Soil Pollution with Heavy Metals in Romania; IntechOpen: London, UK, 2014; ISBN 978-953-51-1235-8. [Google Scholar]
  13. Iordache, M.; Branzoi, I.V.; Popescu, L.R.M.; Ioan, I. Evaluation of Heavy Metal Pollution into a Complex Industrial Area from Romania. Environ. Eng. Manag. J. 2016, 15, 389–394. [Google Scholar] [CrossRef]
  14. Zugravu, C.; Parvu, M.; Patrascu, D.; Stoian, A. Correlations between Lead and Cadmium Pollution of Honey and Environmental Heavy Metal Presence in Two Romanian Counties. Bull. UASVM Agric. 2009, 66, 230–233. [Google Scholar] [CrossRef]
  15. Radu, L.; Lacatusu, A.-R. Vegetable Food Quality within Heavy Metals Polluted Areas in Romania. Carpathian J. Earth Environ. Sci. 2008, 3, 115–129. [Google Scholar]
  16. Triebskorn, R.; Telcean, I.; Casper, H.; Farkas, A.; Sandu, C.; Stan, G.; Colărescu, O.; Dori, T.; Köhler, H.-R. Monitoring Pollution in River Mureş, Romania, Part II: Metal Accumulation and Histopathology in Fish. Environ. Monit. Assess. 2008, 141, 177–188. [Google Scholar] [CrossRef]
  17. Calmuc, V.A.; Calmuc, M.; Arseni, M.; Topa, C.M.; Timofti, M.; Burada, A.; Iticescu, C.; Georgescu, L.P. Assessment of Heavy Metal Pollution Levels in Sediments and of Ecological Risk by Quality Indices, Applying a Case Study: The Lower Danube River, Romania. Water 2021, 13, 1801. [Google Scholar] [CrossRef]
  18. Tóth, G.; Hermann, T.; Szatmári, G.; Pásztor, L. Maps of Heavy Metals in the Soils of the European Union and Proposed Priority Areas for Detailed Assessment. Sci. Total Environ. 2016, 565, 1054–1062. [Google Scholar] [CrossRef]
  19. Bontas, B.-I.; Mirila, D.-C.; Gritcu, G.; Nistor, I.-D.; Ureche, D. High Pollution with Heavy Metals NATURA 2000 Protected Area in Bacau County, Eastern Romania. Rev. Chim. 2020, 71, 154–169. [Google Scholar] [CrossRef]
  20. Hamid, Y.; Tang, L.; Hussain, B.; Usman, M.; Lin, Q.; Rashid, M.S.; He, Z.; Yang, X. Organic Soil Additives for the Remediation of Cadmium Contaminated Soils and Their Impact on the Soil-Plant System: A Review. Sci. Total Environ. 2020, 707, 136121. [Google Scholar] [CrossRef]
  21. Zhang, Y.; Zhang, Y.; Akakuru, O.U.; Xu, X.; Wu, A. Research Progress and Mechanism of Nanomaterials-Mediated in-Situ Remediation of Cadmium-Contaminated Soil: A Critical Review. J. Environ. Sci. 2021, 104, 351–364. [Google Scholar] [CrossRef]
  22. Riaz, U.; Aslam, A.; uz Zaman, Q.; Javeid, S.; Gul, R.; Iqbal, S.; Javid, S.; Murtaza, G.; Jamil, M. Cadmium Contamination, Bioavailability, Uptake Mechanism and Remediation Strategies in Soil-Plant-Environment System: A Critical Review. Curr. Anal. Chem. 2021, 17, 49–60. [Google Scholar] [CrossRef]
  23. Haider, F.U.; Liqun, C.; Coulter, J.A.; Cheema, S.A.; Wu, J.; Zhang, R.; Wenjun, M.; Farooq, M. Cadmium Toxicity in Plants: Impacts and Remediation Strategies. Ecotoxicol. Environ. Saf. 2021, 211, 111887. [Google Scholar] [CrossRef]
  24. Gul, I.; Manzoor, M.; Hashim, N.; Shah, G.M.; Waani, S.P.T.; Shahid, M.; Antoniadis, V.; Rinklebe, J.; Arshad, M. Challenges in Microbially and Chelate-Assisted Phytoextraction of Cadmium and Lead-A Review. Environ. Pollut. 2021, 287, 117667. [Google Scholar] [CrossRef]
  25. Hou, D.; O’Connor, D.; Igalavithana, A.D.; Alessi, D.S.; Luo, J.; Tsang, D.C.W.; Sparks, D.L.; Yamauchi, Y.; Rinklebe, J.; Ok, Y.S. Metal Contamination and Bioremediation of Agricultural Soils for Food Safety and Sustainability. Nat. Rev. Earth Environ. 2020, 1, 366–381. [Google Scholar] [CrossRef]
  26. Rosca, M.; Cozma, P.; Minut, M.; Hlihor, R.-M.; Bețianu, C.; Diaconu, M.; Gavrilescu, M. New Evidence of Model Crop Brassica Napus L. in Soil Clean-Up: Comparison of Tolerance and Accumulation of Lead and Cadmium. Plants 2021, 10, 2051. [Google Scholar] [CrossRef]
  27. Zhao, X.; Yu, X.; Wang, X.; Lai, S.; Sun, Y.; Yang, D. Recent Advances in Metal-Organic Frameworks for the Removal of Heavy Metal Oxoanions from Water. Chem. Eng. J. 2021, 407, 127221. [Google Scholar] [CrossRef]
  28. Qasem, N.A.A.; Mohammed, R.H.; Lawal, D.U. Removal of Heavy Metal Ions from Wastewater: A Comprehensive and Critical Review. Npj Clean Water 2021, 4, 1–15. [Google Scholar] [CrossRef]
  29. Gao, X.; Meng, X. Photocatalysis for Heavy Metal Treatment: A Review. Processes 2021, 9, 1729. [Google Scholar] [CrossRef]
  30. Crystal Quest© Water Filters What Is Ultrafiltration? Available online: https://crystalquest.com/pages/what-is-ultrafiltration (accessed on 23 October 2021).
  31. Zaimee, M.Z.A.; Sarjadi, M.S.; Rahman, M.L. Heavy Metals Removal from Water by Efficient Adsorbents. Water 2021, 13, 2659. [Google Scholar] [CrossRef]
  32. Kwikima, M.M.; Mateso, S.; Chebude, Y. Potentials of Agricultural Wastes as the Ultimate Alternative Adsorbent for Cadmium Removal from Wastewater. A Review. Sci. Afr. 2021, 13, e00934. [Google Scholar] [CrossRef]
  33. Çelebi, H.; Gök, G.; Gök, O. Adsorption Capability of Brewed Tea Waste in Waters Containing Toxic Lead(II), Cadmium(II), Nickel(II), and Zinc(II) Heavy Metal Ions. Sci. Rep. 2020, 10, 17570. [Google Scholar] [CrossRef]
  34. Pyrzynska, K. Removal of Cadmium from Wastewaters with Low-Cost Adsorbents. J. Environ. Chem. Eng. 2019, 7, 102795. [Google Scholar] [CrossRef]
  35. Tonk, S.; Nagy, B.; Török, A.; Indolean (Afloroaei), L.; Majdik, C. Cd(II), Zn(II) and Cu(II) Bioadsorption on Chemically Treated Waste Brewery Yeast Biomass: The Role of Functional Groups. Acta Chim. Slov. 2015, 62, 736–746. [Google Scholar] [CrossRef] [PubMed] [Green Version]
  36. Osasona, I.; Aiyedatiwa, K.; Johnson, J.; Faboya, O.L. Activated Carbon from Spent Brewery Barley Husks for Cadmium Ion Adsorption from Aqueous Solution. Indones. J. Chem. 2018, 18, 145–152. [Google Scholar] [CrossRef]
  37. He, Z.; Ren, B.; Hursthouse, A.; Wang, Z. Efficient Removal of Cd(II) Using SiO2-Mg(OH)2 Nanocomposites Derived from Sepiolite. Int. J. Environ. Res. Public Health 2020, 17, 2223. [Google Scholar] [CrossRef] [Green Version]
  38. Zhao, M.; Wang, S.; Wang, H.; Qin, P.; Yang, D.; Sun, Y.; Kong, F. Application of Sodium Titanate Nanofibers as Constructed Wetland Fillers for Efficient Removal of Heavy Metal Ions from Wastewater. Environ. Pollut. 2019, 248, 938–946. [Google Scholar] [CrossRef]
  39. Zadeh, B.S.; Esmaeili, H.; Foroutan, R. Cadmium(II) Removal from Aqueous Solution Using Microporous Eggshell: Kinetic and Equilibrium Studies. Indones. J. Chem. 2018, 18, 265–271. [Google Scholar] [CrossRef]
  40. Tonk, S.; Majdik, C.; Robert, S.; Suciu, M.; Rápó, E.; Nagy, B.; Niculae, A.G. Biosorption of Cd(II) Ions from Aqueous Solution Onto Eggshell Waste Kinetic and Equilibrium Isotherm Studies. Rev. Chim.-Buchar.-Orig. Ed. 2017, 68, 1951–1958. [Google Scholar] [CrossRef]
  41. Jain, M.; Garg, V.K.; Kadirvelu, K. Cadmium(II) Sorption and Desorption in a Fixed Bed Column Using Sunflower Waste Carbon Calcium-Alginate Beads. Bioresour. Technol. 2013, 129, 242–248. [Google Scholar] [CrossRef]
  42. da Gama, B.M.V.; do Nascimento, G.E.; Sales, D.C.S.; Rodríguez-Díaz, J.M.; de Menezes Barbosa, C.M.B.; Duarte, M.M.M.B. Mono and Binary Component Adsorption of Phenol and Cadmium Using Adsorbent Derived from Peanut Shells. J. Clean. Prod. 2018, 201, 219–228. [Google Scholar] [CrossRef]
  43. Harripersadth, C.; Musonge, P.; Isa, Y.M.; Morales, M.G.; Sayago, A. The Application of Eggshells and Sugarcane Bagasse as Potential Biomaterials in the Removal of Heavy Metals from Aqueous Solutions. S. Afr. J. Chem. Eng. 2020, 34, 142–150. [Google Scholar] [CrossRef]
  44. Es-sahbany, H.; Hachimi, M.L.E.; Hsissou, R.; Belfaquir, M.; Es-sahbany, K.; Nkhili, S.; Loutfi, M.; Elyoubi, M.S. Adsorption of Heavy Metal (Cadmium) in Synthetic Wastewater by the Natural Clay as a Potential Adsorbent(Tangier-Tetouan-Al Hoceima-Morocco Region). Mater. Today Proc. 2021, 45, 7299–7305. [Google Scholar] [CrossRef]
  45. Ghorbel-Abid, I.; Galai, K.; Trabelsi-Ayadi, M. Retention of Chromium(III) and Cadmium(II) from Aqueous Solution by Illitic Clay as a Low-Cost Adsorbent. Desalination 2010, 256, 190–195. [Google Scholar] [CrossRef]
  46. Samad, A.; Din, M.I.; Ahmed, M. Studies on Batch Adsorptive Removal of Cadmium and Nickel from Synthetic Waste Water Using Silty Clay Originated from Balochistan–Pakistan. Chin. J. Chem. Eng. 2020, 28, 1171–1176. [Google Scholar] [CrossRef]
  47. Zhou, Q.; Liu, Y.; Li, T.; Zhao, H.; Alessi, D.S.; Liu, W.; Konhauser, K.O. Cadmium Adsorption to Clay-Microbe Aggregates: Implications for Marine Heavy Metals Cycling. Geochim. Cosmochim. Acta 2020, 290, 124–136. [Google Scholar] [CrossRef]
  48. Rao, R.A.K.; Kashifuddin, M. Adsorption Studies of Cd(II) on Ball Clay: Comparison with Other Natural Clays. Arab. J. Chem. 2016, 9, S1233–S1241. [Google Scholar] [CrossRef] [Green Version]
  49. Cornelia, M.; Tfeil, H.O.; Mǎicǎneanu, A.; Indolean (Afloroaei), L.; Burcǎ, S.; Tonk, S.; Stanca, M. Fixed Bed Studies for Cd(II) Removal from Model Solutions Using Immobilized Bentonite/Yeast Mixtures. Studia Univ. Babes-Bolyai Chem. 2009, 54, 153–161. [Google Scholar]
  50. Zhao, Y.; Wang, W.; Yi, H. Mineral Adsorbents and Characteristics. In Adsorption at Natural Minerals/Water Interfaces; Song, S., Li, B., Eds.; Engineering Materials; Springer International Publishing: Cham, Switzerland, 2021; pp. 1–54. ISBN 978-3-030-54451-5. [Google Scholar]
  51. Usman, M.; Zarebanadkouki, M.; Waseem, M.; Katsoyiannis, I.A.; Ernst, M. Mathematical Modeling of Arsenic(V) Adsorption onto Iron Oxyhydroxides in an Adsorption-Submerged Membrane Hybrid System. J. Hazard. Mater. 2020, 400, 123221. [Google Scholar] [CrossRef]
  52. Usman, M.; Belkasmi, A.I.; Kastoyiannis, I.A.; Ernst, M. Pre-Deposited Dynamic Membrane Adsorber Formed of Microscale Conventional Iron Oxide-Based Adsorbents to Remove Arsenic from Water: Application Study and Mathematical Modeling. J. Chem. Technol. Biotechnol. 2021, 96, 1504–1514. [Google Scholar] [CrossRef]
  53. Srinivasan, R. Advances in Application of Natural Clay and Its Composites in Removal of Biological, Organic, and Inorganic Contaminants from Drinking Water. Adv. Mater. Sci. Eng. 2011, 2011, e872531. [Google Scholar] [CrossRef] [Green Version]
  54. Obaje, S.O.; Omada, J.I.; Dambatta, U.A. Clays and Their Industrial Applications: Synoptic Review. Int. J. Sci. Technol. 2013, 3, 264–270. [Google Scholar]
  55. Uddin, M.K. A Review on the Adsorption of Heavy Metals by Clay Minerals, with Special Focus on the Past Decade. Chem. Eng. J. 2017, 308, 438–462. [Google Scholar] [CrossRef]
  56. Velde, B. Composition and Mineralogy of Clay Minerals. In Origin and Mineralogy of Clays: Clays and the Environment; Velde, B., Ed.; Springer: Berlin/Heidelberg, Germany, 1995; pp. 8–42. ISBN 978-3-662-12648-6. [Google Scholar]
  57. Churchman, G.J.; Gates, W.P.; Theng, B.K.G.; Yuan, G. Chapter 11.1 Clays and Clay Minerals for Pollution Control. In Developments in Clay Science; Bergaya, F., Theng, B.K.G., Lagaly, G., Eds.; Handbook of Clay Science; Elsevier: Amsterdam, The Netherlands, 2006; Volume 1, pp. 625–675. [Google Scholar]
  58. Shainberg, I.; Levy, G.J. Flocculation and Dispersion. In Encyclopedia of Soils in the Environment; Hillel, D., Ed.; Elsevier: Oxford, UK, 2005; pp. 27–34. ISBN 978-0-12-348530-4. [Google Scholar]
  59. Arabmofrad, S.; Bagheri, M.; Rajabi, H.; Jafari, S.M. Nanoadsorbents and Nanoporous Materials for the Food Industry. In Handbook of Food Nanotechnology; Jafari, S.M., Ed.; Academic Press: Cambridge, MA, USA, 2020; pp. 107–159. ISBN 978-0-12-815866-1. [Google Scholar]
  60. Kumari, N.; Mohan, C. Basics of Clay Minerals and Their Characteristic Properties; IntechOpen: London, UK, 2021; ISBN 978-1-83969-564-3. [Google Scholar]
  61. Bandara, T.; Xu, J.; Potter, I.D.; Franks, A.; Chathurika, J.B.A.J.; Tang, C. Mechanisms for the Removal of Cd(II) and Cu(II) from Aqueous Solution and Mine Water by Biochars Derived from Agricultural Wastes. Chemosphere 2020, 254, 126745. [Google Scholar] [CrossRef]
  62. Gheorgehe, N. Neacşu Vasilica Fireclay and Kaolin Deposits in Romania. Acta Mineral.-Petrogr. 1980, 24, 39–45. [Google Scholar]
  63. Foo, K.Y.; Hameed, B.H. Insights into the Modeling of Adsorption Isotherm Systems. Chem. Eng. J. 2010, 156, 2–10. [Google Scholar] [CrossRef]
  64. Wang, J.; Guo, X. Adsorption Isotherm Models: Classification, Physical Meaning, Application and Solving Method. Chemosphere 2020, 258, 127279. [Google Scholar] [CrossRef] [PubMed]
  65. Khan, A.R.; Ataullah, R.; Al-Haddad, A. Equilibrium Adsorption Studies of Some Aromatic Pollutants from Dilute Aqueous Solutions on Activated Carbon at Different Temperatures. J. Colloid. Interface Sci. 1997, 194, 154–165. [Google Scholar] [CrossRef] [PubMed]
  66. González-López, M.E.; Laureano-Anzaldo, C.M.; Pérez-Fonseca, A.A.; Arellano, M.; Robledo-Ortíz, J.R. A Critical Overview of Adsorption Models Linearization: Methodological and Statistical Inconsistencies. Sep. Purif. Rev. 2021, 1–15. [Google Scholar] [CrossRef]
  67. López-Luna, J.; Ramírez-Montes, L.E.; Martinez-Vargas, S.; Martínez, A.I.; Mijangos-Ricardez, O.F.; González-Chávez, M.d.C.; Carrillo-González, R.; Solís-Domínguez, F.A.; Cuevas-Díaz, M.d.C.; Vázquez-Hipólito, V. Linear and Nonlinear Kinetic and Isotherm Adsorption Models for Arsenic Removal by Manganese Ferrite Nanoparticles. SN Appl. Sci. 2019, 1, 950. [Google Scholar] [CrossRef] [Green Version]
  68. Tóth, J. A Uniform Interpretation of Gas/Solid Adsorption. J. Colloid Interface Sci. 1981, 79, 85–95. [Google Scholar] [CrossRef]
  69. Liu, Y.; Xu, H.; Yang, S.-F.; Tay, J.-H. A General Model for Biosorption of Cd2+, Cu2+ and Zn2+ by Aerobic Granules. J. Biotechnol. 2003, 102, 233–239. [Google Scholar] [CrossRef]
  70. Ayawei, N.; Ebelegi, A.N.; Wankasi, D. Modelling and Interpretation of Adsorption Isotherms. J. Chem. 2017, 2017, 1–11. [Google Scholar] [CrossRef]
  71. Hossain, M.D.; Ngo, H.; Guo, W. Introductory of Microsoft Excel SOLVER Function-Spreadsheet Method for Isotherm and Kinetics Modelling of Metals Biosorption in Water and Wastewater. J. Water Sustain. 2013, 3, 223–237. [Google Scholar]
  72. Suwannahong, K.; Wongcharee, S.; Kreetachart, T.; Sirilamduan, C.; Rioyo, J.; Wongphat, A. Evaluation of the Microsoft Excel Solver Spreadsheet-Based Program for Nonlinear Expressions of Adsorption Isotherm Models onto Magnetic Nanosorbent. Appl. Sci. 2021, 11, 7432. [Google Scholar] [CrossRef]
  73. da Costa Gardolinski, J.E.F. Interlayer Grafting and Delamination of Kaolinite. Ph.D. Thesis, Faculty of Mathematics and Natural Sciences of the Christian-Albrechts-University, Kiel, Germany, 2005. [Google Scholar]
  74. Kostin, A.V.; Mostalygina, L.V.; Bukhtoyarov, O.I. The Mechanism of Adsorption of Zinc and Cadmium Ions onto Bentonite Clay. Prot. Met. Phys. Chem. Surf. 2015, 51, 773–778. [Google Scholar] [CrossRef]
  75. Johansson, U.; Holmgren, A.; Forsling, W.; Frost, R. Isotopic Exchange of Kaolinite Hydroxyl Protons: A Diffuse Reflectance Infrared Fourier Transform Spectroscopy Study. Analyst 1998, 123, 641–645. [Google Scholar] [CrossRef]
  76. Frost, R.L.; Vassallo, A.M. The Dehydroxylation of the Kaolinite Clay Minerals Using Infrared Emission Spectroscopy. Clays Clay Miner. 1996, 44, 635–651. [Google Scholar] [CrossRef]
  77. Frost, R.L.; Fredericks, P.M.; Bartlett, J.R. Fourier Transform Raman Spectroscopy of Kandite Clays. Spectrochim. Acta Part A Mol. Spectrosc. 1993, 49, 667–674. [Google Scholar] [CrossRef]
  78. Frost, R.L.; Tran, T.H.; Kristof, J. The Structure of an Intercalated Ordered Kaolinite-a Raman Microscopy Study. Clay Miner. 1997, 32, 587–596. [Google Scholar] [CrossRef]
  79. Niño, V.; Bello, Y.; Rios, C.; Fiallo, L. Application of Faujasite Synthesized from Illite to the Removal of Cr3+ and Ni2+ from Electroplating Wastewater. Rev. ION 2013, 26, 7–16. [Google Scholar]
  80. Chen, X.; Peng, S.; Wang, J. Retention Profile and Kinetics Characteristics of the Radionuclide 90-Sr(II) onto Kaolinite. J. Radioanal. Nucl. Chem. 2014, 303, 509–519. [Google Scholar] [CrossRef]
  81. Nekhlaoui, S.; Abdellaoui, H.; Marya, R.; Essabir, H.; Rodrigue, D.; Mohammed ouadi, B.; Bouhfid, R.; Qaiss, A. Assessment of Thermo-Mechanical, Dye Discoloration, and Hygroscopic Behavior of Hybrid Composites Based on Polypropylene/Clay(Illite)/TiO2. Int. J. Adv. Manuf. Technol. 2021, 113, 1–14. [Google Scholar] [CrossRef]
  82. Murad, E. Identification of Minor Amounts of Anatase in Kaolins by Raman Spectroscopy. Am. Mineral. 1997, 82, 203–206. [Google Scholar] [CrossRef]
  83. Michaelian, K.H. The Raman Spectrum of Kaolinite #9 at 21 °C. Can. J. Chem. 2011, 64, 285–294. [Google Scholar] [CrossRef] [Green Version]
  84. Frost, R.L.; Gaast, S.J. van der Kaolinite Hydroxyls-a Raman Microscopy Study. Clay Miner. 1997, 32, 471–484. [Google Scholar] [CrossRef]
  85. Liu, W. Modeling Description and Spectroscopic Evidence of Surface Acid–Base Properties of Natural Illites. Water Res. 2001, 35, 4111–4125. [Google Scholar] [CrossRef]
  86. Miranda-Trevino, J.C.; Coles, C.A. Kaolinite Properties, Structure and Influence of Metal Retention on PH. Appl. Clay Sci. 2003, 23, 133–139. [Google Scholar] [CrossRef]
  87. Macdonald, H. SEM of Kaolinite. Available online: https://serc.carleton.edu/details/images/13658.html (accessed on 18 December 2021).
  88. Anderson, M. Kaolinite Clay Sheets. Available online: https://www.fei.com/image-gallery/kaolinite-clay-sheets/#gsc.tab=0 (accessed on 18 December 2021).
  89. Lei, T.; Li, S.-J.; Jiang, F.; Ren, Z.-X.; Wang, L.-L.; Yang, X.-J.; Tang, L.-H.; Wang, S.-X. Adsorption of Cadmium Ions from an Aqueous Solution on a Highly Stable Dopamine-Modified Magnetic Nano-Adsorbent. Nanoscale Res. Lett. 2019, 14, 352. [Google Scholar] [CrossRef] [Green Version]
  90. Yusuff, A.S.; Popoola, L.T.; Babatunde, E.O. Adsorption of Cadmium Ion from Aqueous Solutions by Copper-Based Metal Organic Framework: Equilibrium Modeling and Kinetic Studies. Appl. Water Sci. 2019, 9, 106. [Google Scholar] [CrossRef] [Green Version]
  91. Nagy, B.; Tonk, S.; Indolean (Afloroaei), L.; Andrada, M.; Majdik, C. Biosorption of Cadmium Ions by Unmodified, Microwave and Ultrasound Modified Brewery and Pure Strain Yeast Biomass. Am. J. Anal. Chem. 2013, 4, 63–71. [Google Scholar] [CrossRef] [Green Version]
  92. Huang, R.; Lin, Q.; Zhong, Q.; Zhang, X.; Wen, X.; Luo, H. Removal of Cd(II) and Pb(II) from Aqueous Solution by Modified Attapulgite Clay. Arab. J. Chem. 2020, 13, 4994–5008. [Google Scholar] [CrossRef]
  93. Ozdes, D.; Duran, C.; Senturk, H.B. Adsorptive Removal of Cd(II) and Pb(II) Ions from Aqueous Solutions by Using Turkish Illitic Clay. J. Environ. Manag. 2011, 92, 3082–3090. [Google Scholar] [CrossRef] [PubMed]
  94. Abbou, B.; Lebkiri, I.; Ouaddari, H.; Kadiri, L.; Ouass, A.; Habssaoui, A.; Lebkiri, A.; Rifi, E.H. Removal of Cd(II), Cu(II), and Pb(II) by Adsorption onto Natural Clay: A Kinetic and Thermodynamic Study. Turk. J. Chem. 2021, 45, 362–376. [Google Scholar] [CrossRef] [PubMed]
  95. Chen, G.; Shi, L. Removal of Cd(II) and Pb(II) Ions from Natural Water Using a Low-Cost Synthetic Mineral: Behavior and Mechanisms. RSC Adv. 2017, 7, 43445–43454. [Google Scholar] [CrossRef] [Green Version]
  96. Chen, G.; Shah, K.J.; Shi, L.; Chiang, P.-C. Removal of Cd(II) and Pb(II) Ions from Aqueous Solutions by Synthetic Mineral Adsorbent: Performance and Mechanisms. Appl. Surf. Sci. 2017, 409, 296–305. [Google Scholar] [CrossRef]
  97. Sheikh, A.A.; Alsagabi, S.; Almeataq, M.; Alajyan, T.; Goumri-Said, S. Removal of Cd(II) from Industrial Wastewater Using Locally Available Bentonite Clay. E3S Web Conf. 2019, 117, 00008. [Google Scholar] [CrossRef]
  98. Rápó, E.; Aradi, L.E.; Szabó, Á.; Posta, K.; Szép, R.; Tonk, S. Adsorption of Remazol Brilliant Violet-5R Textile Dye from Aqueous Solutions by Using Eggshell Waste Biosorbent. Sci. Rep. 2020, 10, 8385. [Google Scholar] [CrossRef]
  99. Subramani, S.E.; Thinakaran, N. Isotherm, Kinetic and Thermodynamic Studies on the Adsorption Behaviour of Textile Dyes onto Chitosan. Process Saf. Environ. Prot. 2017, 106, 1–10. [Google Scholar] [CrossRef]
  100. Mustapha, S.; Shuaib, D.T.; Ndamitso, M.M.; Etsuyankpa, M.B.; Sumaila, A.; Mohammed, U.M.; Nasirudeen, M.B. Adsorption Isotherm, Kinetic and Thermodynamic Studies for the Removal of Pb(II), Cd(II), Zn(II) and Cu(II) Ions from Aqueous Solutions Using Albizia Lebbeck Pods. Appl. Water Sci. 2019, 9, 142. [Google Scholar] [CrossRef] [Green Version]
  101. Nagy, B.; Mânzatu, C.; Măicăneanu, A.; Indolean, C.; Barbu-Tudoran, L.; Majdik, C. Linear and Nonlinear Regression Analysis for Heavy Metals Removal Using Agaricus Bisporus Macrofungus. Arab. J. Chem. 2017, 10, S3569–S3579. [Google Scholar] [CrossRef] [Green Version]
  102. Giwa, A.A.; Bello, I.A.; Oladipo, M.A.; Adeoye, D.O. Removal of Cadmium from Waste-Water by Adsorption Using the Husk of Melon (Citrullus Lanatus) Seed. Int. J. Basic Appl. Sci. 2013, 2, 14. [Google Scholar]
  103. Rao, R.A.K.; Kashifuddin, M. Kinetics and Isotherm Studies of Cd(II) Adsorption from Aqueous Solution Utilizing Seeds of Bottlebrush Plant (Callistemon Chisholmii). Appl. Water Sci. 2014, 4, 371–383. [Google Scholar] [CrossRef] [Green Version]
  104. Zhang, R.; Li, D.; Sun, J.; Cui, Y.; Sun, Y. In Situ Synthesis of FeS/Carbon Fibers for the Effective Removal of Cr(VI) in Aqueous Solution. Front. Environ. Sci. Eng. 2020, 14, 68. [Google Scholar] [CrossRef]
  105. Pholosi, A.; Naidoo, E.B.; Ofomaja, A.E. Intraparticle Diffusion of Cr(VI) through Biomass and Magnetite Coated Biomass: A Comparative Kinetic and Diffusion Study. S. Afr. J. Chem. Eng. 2020, 32, 39–55. [Google Scholar] [CrossRef]
  106. Baraka, A. Investigation of Temperature Effect on Surface-Interaction and Diffusion of Aqueous-Solution/Porous-Solid Adsorption Systems Using Diffusion–Binding Model. J. Environ. Chem. Eng. 2015, 3, 129–139. [Google Scholar] [CrossRef]
  107. Oyelude, E.O.; Awudza, J.A.M.; Twumasi, S.K. Equilibrium, Kinetic and Thermodynamic Study of Removal of Eosin Yellow from Aqueous Solution Using Teak Leaf Litter Powder. Sci. Rep. 2017, 7, 12198. [Google Scholar] [CrossRef]
  108. Rápó, E.; Tonk, S. Factors Affecting Synthetic Dye Adsorption; Desorption Studies: A Review of Results from the Last Five Years (2017–2021). Molecules 2021, 26, 5419. [Google Scholar] [CrossRef]
  109. Adeyemo, A.A.; Adeoye, I.O.; Bello, O.S. Adsorption of Dyes Using Different Types of Clay: A Review. Appl. Water Sci. 2017, 7, 543–568. [Google Scholar] [CrossRef] [Green Version]
Figure 1. Main sources of Heavy Metal pollution (Edited and adapted based on [2]).
Water 14 00279 g001
Figure 2. Heavy metal removal techniques from wastewaters (Edited and adapted based on [28,29,30,31]).
Water 14 00279 g002
Figure 3. ASLAVITAL cosmetical clay from the Romanian Pădurea Craiului Mountain.
Water 14 00279 g003
Figure 4. Equations, theories, assumptions, and boundaries of adsorption isotherm models, where qe—the concentration of solid phase adsorbent at equilibrium (mg/g); qmax—single layer maximum adsorption or saturation capacity (mg/g); Ce—concentration of the contaminant solution at equilibrium (mg/L); b—adsorption equilibrium constant specific to the test substance; KL,F,D,T,Toth,Liu,Khan—are the concentration-dependent partition coefficients for the respective isotherms providing information on the adsorption capacity of the biosorbent; n—Freundlich and Liu constants, adsorption intensity; AT—Temkin’s isotherm equilibrium constant (L/g); bT—Temkin constant; B—constant (J/mol); R—ideal gas constant (8.314 mol/K); T—absolute temperature (K); ε—Dubinin–Radushkevich constant (mol2/J2); t—Liu constant; aK—Khan constant [63,64,65].
Water 14 00279 g004
Figure 5. SEM (ad) control and (eh) 2 g/L Cd2+ adsorbed ACC.
Water 14 00279 g005
Figure 7. X-ray powder diffraction comparison of the two samples.
Water 14 00279 g007
Figure 8. Diffraction pattern of ACC showing the crystalline phases (q-quartz, i-illite and k-kaolinite).
Water 14 00279 g008
Figure 12. Effect of initial concentrations, where q is the adsorption capacity, quantity in equilibrium and E is the efficiency of the adsorption process (Ci = 10–160 mg/L, 0.1 g/L ACC, pH = 7, T = 20 ± 1 °C).
Water 14 00279 g012
Table 1. Summary of kinetic and diffusion model equations.
Kinetic/Diffusion ModelsEquations Describing the Models Parameters
Non-Linear Form
Pseudo I-order kinetic model dq t dt = k 1 q e -   q t
  • qt—amount of Cd adsorbed during a given time interval (mg/g)
  • qe—equilibrium pollutant adsorption value (mg/g)
  • k1—equilibrium constant, first order adsorption rate constant (g/mg/min)
  • k2—equilibrium constant, constant of the second order adsorption rate (g/mg/min)
Pseudo II-order kinetic model dq t dt = k 2 q e -   q t 2
Linear forms
Pseudo II. Type I.Pseudo II. Type II.Pseudo II. Type III.
t q t = 1 k 2 , I   ×   q e 2 + 1 q e   × t 1 t = k 2 , II   ×   q e 2 × 1 q t   -   k 2 , II ×   q e 1 q t = 1 k 2 , III   ×   q e 2   ×   1 t + 1 q e
Pseudo II. Type IV.Pseudo II. Type V.Pseudo II. Type VI.
1 q e -   q t = 1 q e + k 2 , IV   × t q t t = - k 2 ; V   ×   q e   ×   q t + k 2 ; V   ×   q e 2 q t = q e   -   1 k 2 , VI   × q e   ×   q t t
Equation describing diffusionqt = xi+K√t
  • K—rate constant
  • xi—boundary layer thickness
  • qt—amount of Cd adsorbed on the ACC at time t
Table 3. Comparison of different clays in Cd2+ removal.
AdsorbentInitial ParametersEfficiency Range (%)Quantity in Equilibrium Range (qe mg/g)Reference
heat-treated attapulgite clay (T-ATP)Cd concentration 70 mg/L, contact time of 1440 min, adsorbent dosage of 2 g/L, mixing speed of 175 rpm, temperature of 298 K, pH = 2–6- 11.60–24.31 mg/g[92]
MgCl2-impregnated attapulgite clay (MgO-ATP)- 11.56 to 15.55 mg/g[92]
Turkish illitic clay1.0 g/L clay suspension, 50 mg/L Cd, pH 4.0, contact time of 240 min., at room temperature- 11.25 mg/g[93]
illitic clay collected from Marrakech region100 mg/L Cd- 5.12 mg/g[94]
low-cost synthetic mineral: potassium feldspar, wollastonite, gypsum, limestone and dolomite powder ratio of 1:1:1:6:3Cd concentration 40 mg/L, 5 g/L adsorbent, 25 °C, 30 min. contact time, pH = 2–449–99.4% - [95]
synthetic mineral adsorbent (SMA): illite, wollastonite, gypsum, limestone and dolomite powder at a ratio of 1:1:1:12:3Cd concentration 40 mg/L, adsorbent 2.5 g/L, 25 °C, 30 min. contact time, pH = 2–48.1–97.3%- [96]
bentonite clay extracted from Khulais region in western Saudi Arabia 300 mg/L Cd, bentonite dose 0.5 g, pH = 2–8 -110–140 mg/g[97]
ASLAVITAL cosmetical clay from the Romanian Pădurea Craiului MountainCd concentration 11–157 mg/L, 1 g clay, pH = 7, T = 20 ± 1 °C99–51%1.07–8 mg/g present study
Table 4. Calculated parameters of different linear isotherm models.
Langmuir I.Langmuir II.Langmuir III.Langmuir IV.
Plotting: Ce vs. Ce/qePlotting: 1/Ce vs. 1/qePlotting: qe/Ce vs. qePlotting: qe vs. qe/Ce
KL qmax R2KL qmax R2KL qmax R2KL qmax R2
(l/mg)(mg/g)(l/mg)(mg/g)(l/mg)(mg/g)(l/mg)(mg/g)
0.0112.030.7982.395.590.9542.056.360.6050.024.300.744
FreundlichDubinin–RadushkevichTemkin
Plotting: lnCe vs. lnqePlotting: ε2 vs. lnqePlotting: lnCe vs. qe
nKf R2βE R2AT B R2
(mg(1−1/n)l1/n/g)(mol2 kJ2)(kJ/mol)(l/g)(J/mol)
2.442.310.8855 × 10−83.160.9332.41 × 10−40.859
Table 5. Calculated parameters of different non-linear isotherm models.
Two Parameter Non-Linear Isotherm Fitting
Langmuir IsothermFreundlich IsothermTemkin Isotherm
qm (mg/g)15.80nF1.88bT0.92
KL (L/mg)0.02KF (mg(1−1/n)l1/n/g)0.84KT (L/mg)23.76
R20.831R20.824R20.705
χ22.136χ21.944χ22.770
RMSE1.419RMSE1.450RMSE1.875
HYBRID23.220HYBRID15.027HYBRID−8.773
Three Parameter Non-Linear Isotherm Fitting
Toth IsothermKhan IsothermLiu Isotherm
qm (mg/g)23.74qm (mg/g)4610.76qm (mg/g)8.07
KTH (L/mg)0.00KK (L/mg)4.71 × 10−5KLiu (L/mg)0.03
nTH4.47nK191.33nLiu0.14
R20.980R20.842R20.965
χ211.829χ22.103χ21.101
RMSE4.861RMSE1.372RMSE0.647
HYBRID−20.239HYBRID22.597HYBRID36.512
Table 6. Calculated parameters of kinetic models.
Pseudo-I-OrderPseudo-II-Order
Cqe (exp)k1qe (calc)R2k2qe (calc)R2
(mg/L)(mg/g)(1/min)(mg/g)(g/mg × min)(mg/g)
10.831.070.0212.170.6850.1311.070.995
61.673.250.0021.950.2850.1813.280.999
99.176.250.0131.910.3240.0545.960.996
120.837.670.0264.130.9420.0118.010.998
156.678.000.0145.620.8680.0078.120.988
Table 7. Calculated parameters of diffusion models.
Intra-Particle DiffusionLiquid-Film Diffusion
C (mg/L)D (cm2/s)kip (mg/g∙min1/2)InterceptR2ipkfd (1/min)InterceptR2fd
116.95 × 10−90.0450.5350.6180.014−1.2220.586
622.94 × 10−80.0372.8240.7620.019−2.0690.892
991.60 × 10−80.0605.1020.6180.004−1.9380.582
1204.52 × 10−90.3992.5000.9190.019−0.7640.951
1572.64 × 10−90.3313.6330.8530.012−0.5470.926
Publisher’s Note: MDPI stays neutral with regard to jurisdictional claims in published maps and institutional affiliations.

