Article

Assessment of Aquatic Ecosystem Health with Indices of Biotic Integrity (IBIs) in the Ganjiang River System, China

Institute of Ecology, Chinese Research Academy of Environmental Sciences, Beijing 100012, China
*
Author to whom correspondence should be addressed.
Water 2022, 14(3), 278; https://doi.org/10.3390/w14030278
Submission received: 23 November 2021 / Revised: 5 January 2022 / Accepted: 13 January 2022 / Published: 18 January 2022
(This article belongs to the Special Issue Freshwater Biophysical Ecosystem Health)

Abstract

:
Indices of biotic integrity (IBIs) are widely used to assess aquatic ecosystem health. However, there are few studies on their relationships. Based on fish, macroinvertebrate and plankton survey data collected in the Ganjiang River system from 2016 to 2017, redundancy analysis (RDA) and canonical correspondence analysis (CCA) were used to analyze how the community structures of these organisms respond to environmental variables. The fish IBI (F-IBI), benthic macroinvertebrate IBI (B-IBI), and phytoplankton IBI (P-IBI) were applied to evaluate the health status of the aquatic ecosystem. A Kruskal–Wallis test (p < 0.05) and Spearman’s correlation coefficient analysis were performed to evaluate the spatiotemporal heterogeneity of the results. Our results suggested that the F-IBI-, B-IBI-, and P-IBI-based assessments indicated good, fair, and healthy Ganjiang River system ecosystem health statuses, respectively, and significant differences existed among these indices (p < 0.05). The main environmental factors affecting F-IBI, B-IBI, and P-IBI were different. At the temporal scale, the F-IBI and B-IBI were stable, while the P-IBI fluctuated obviously. The consistency between the F-IBI and B-IBI results was better than that between each of these indices and the P-IBI results, and the consistency was better on a larger scale. These research results show that comprehensive assessments based on multiple groups rather than a single group can better characterize the impacts of environmental pressures on water ecosystems.

1. Introduction

Freshwater, the lifeblood of human existence, has no substitute. However, in recent decades, human activities have caused rapid declines in the biodiversity of freshwater ecosystems [1] and have introduced serious environmental and social problems [2,3,4]. Under these circumstances, systematic assessments of the health of freshwater ecosystems are urgently needed for sustainable ecological restoration and management [5,6,7].
The implementation of river health assessments began in Europe at the end of the 19th century, and they were initially focused on physical and chemical indicators [8,9]. However, biological indices have been more widely used because they can reduce the effort and cost of data collection and more accurately and completely reflect the health status of the system and the intensity of disturbances. Researchers have reported numerous experiences in developing multimetric indices based on different biological groups [10] over the years and throughout the world. For example, fish-based indices include the preliminary reservoir fish assemblage index (RFAI) [11], the regional pressure index (RPI) [12], and the Ohio River Fish Index (ORFIn) [13]; macroinvertebrate-based indices include the Indice Biotique Macroinvertébrés de Guyane (IBMG) [14], the Semi-quantitative Multimetric Index (SMI) [15], the multimetric index (I2M2) [16], the phytoplankton-based indices Phytoplankton Index of Biotic Integrity (P-IBI) [17], new multimetric Index [18], and Index of Size spectra Sensitivity of Phytoplankton (ISS-Phyto) [19]. Most of these indicators are targeted at specific regions and based on a single biological group, while lacking in an overall evaluation of the ecosystem, which may ignore the multiple sources of environmental pressure.
The index of biotic integrity (IBI), proposed by Karr [20], breaks through the limitation of evaluating the water environment quality by using a single biological index or a single biological group and can better reflect the river health status from an ecosystem perspective [21]. This index reflects the health status of an ecosystem by comparing the differences between selected measured biological parameter values and the standard values. As this research has progressed, this method has been extensively employed to include various groups in aquatic ecosystems, including fishes [22,23,24], periphytic algae [25], phytoplankton [26,27], zooplankton [28], benthic macroinvertebrates [29], microorganisms [30], vegetation [31], and aquatic insects [32]. Among these organisms, the three most commonly researched indicator elements are fishes, benthic macroinvertebrates, and phytoplankton.
Fish are usually long-lived and widely distributed, and they can reflect aquatic ecosystem information at the watershed scale and are good indicators of hydromorphological degradation and the connectivity of river systems on a larger scale. Fish have obvious morphological characteristics that enable their identification, also making them a good research object [33]. Benthic macroinvertebrates, the consumers of aquatic ecosystems, play important roles in material circulation and energy flow. Macroinvertebrates or benthic invertebrates are good indicators of hydromorphological degradation and pollution with quickly degradable (decaying) organic matter. Moreover, their high species diversity and weak migration ability enable them to reflect long-term environmental changes, making them the most widely used bioindicators [34]. Phytoplankton, the primary producers of aquatic ecosystems, form the bottom of the food chain and can efficiently respond to environmental changes; these species are especially sensitive to nitrogen and phosphorus changes [27]. The phytoplankton community is a good indicator of pollution with nutrients (nitrogen and phosphorous) in standing waters. Although phytoplankton have not been as widely applied as fish or benthic macroinvertebrates, they are still very promising bioindicators.
In previous studies, the IBI evaluation results obtained based on different groups have often shown inconsistencies in the same study area [35]. The application of IBIs often focuses on a single biological group. Under these research conditions, changes in some biological ecosystem conditions and the sources of environmental pressures that interfere with specific groups may be ignored. Nevertheless, only a few studies simultaneously based on different groups have been reported thus far [36,37]. To our knowledge, researchers have not reached a unified conclusion about the regularity of IBI evaluation results obtained based on different groups [38,39,40]. Studies of multiple groups can more comprehensively reflect the health status of aquatic ecosystems and provide guidance regarding the applicability of different methods.
The Ganjiang River provides the largest inflow to Poyang Lake (the largest freshwater lake in China) and the seventh-largest tributary of the Yangtze River [41]. The Ganjiang River has many tributaries and contains abundant aquatic organism resources. Aquatic organism surveys conducted since the 1950s have shown that with the development of the economy, human activities such as pollutant discharge, dam construction, sand mining, and urbanization have seriously damaged the habitats of aquatic organisms in this region, resulting in a reduction in diversity and the continuous deterioration of the ecological environment [42,43]. However, environmental protection measures have also been implemented in this area for many years. Health assessments of the Ganjiang River system play a significant role in maintaining and replenishing aquatic organism resources and environmental management in Poyang Lake and the Yangtze River [44].
The present work investigated the spatial and temporal variations in the abundance and composition patterns of fishes, benthic macroinvertebrates, and phytoplankton in the Ganjiang River system; analyzed the main environmental factors affecting the community structures of these three communities (fish, benthic macroinvertebrate, and phytoplankton communities); developed a fish index of biotic integrity (F-IBI), a benthic macroinvertebrate index of biotic integrity (B-IBI), and a phytoplankton index of biotic integrity (P-IBI) through a unified method and assessed the ecosystem health. We expected to verify that biological integrity is related to community structure and environmental factors, and that there is a regular pattern in the temporal and spatial heterogeneity of IBIs.

2. Materials and Methods

2.1. Study Area

The Ganjiang River system (24°29′ N–29°11′ N, 113°30′ E–116°40′ E; Figure 1) is located on the south bank of the middle and lower sections of the Yangtze River, covering a total catchment area of 82,809 km2 and accounting for 51% of the territory in Jiangxi Province in central China. The river originates in Shiliaodong in the Wuyi Mountains and drains over a total length of 823 km. The Ganjiang River system lies within a mid-subtropical humid climate zone with abundant rainfall; the annual precipitation averages approximately 1580 mm, and the inflow is recharged primarily by precipitation. The hypsography is high in the south and low-lying in the north, and the study area is primarily covered by hills.

2.2. Field Surveys and Environmental Variable Measurements

In this study, 27 fish sampling sites, 42 benthic macroinvertebrate sampling sites, and 45 phytoplankton sampling sites were selected based on the uniform grid method as accessibility allowed (Figure 1). The samples were collected quarterly in September–October (autumn) 2016, December–January (winter) 2016, March–April (spring) 2017, and July August (summer) 2017.
Fish sampling: In streams where humans can wade, an electrofisher was used for sampling, and a block was placed 10–15 m downstream for collection [38,45,46,47]. For river segments with depths greater than 1.5 m, gill nets were used for fishing [33]. In general, 1 or 2 replicates were collected for each river segment. All the fish were enumerated and identified to the species level.
Benthic macroinvertebrate sampling: A Peterson sediment sampler (0.025 m2) was used for quantitative sampling, and each site was collected 3–5 times [37,48,49,50]. Each sample was sieved on a 0.45 mm screen, sorted, enumerated, and identified to the lowest possible taxon (usually species or genus).
Phytoplankton sampling: Water samples were collected at the surface (0.5 m below the surface) using a 5 L water sampler and fixed with 15 mL of acid Lugol’s solution in situ [51,52,53]. After 48 h of sample resting, each sample was concentrated to 50 mL by siphon, and 4% formaldehyde solution was added for permanent storage [27,54]. Phytoplankton were enumerated and identified to the lowest possible taxon with the microscope.
Geographical information was collected with a global positioning system (GPS) portable orientation device (Garmin, China). The physicochemical properties of the water, including the water temperature (WT), pH, dissolved oxygen (DO), and conductivity (Cond), were measured with a multiparameter water quality detector (YSI Pro Plus, USA). Water samples were collected 0.5 m below the water level and transported to the laboratory to analyze the chemical permanganate index (CODMn), biochemical oxygen demand (BOD), dichromate oxidizability (CODCr), ammonia-nitrogen concentration (NH3-N), and total phosphorus (TP) concentration. All these parameters were measured according to the Environmental Quality Standards for Surface Water in China (4th edition).

2.3. Development of F-IBI, B-IBI, and P-IBI

2.3.1. Selection of Reference Sites

The study sites were classified into reference sites and impaired sites to develop the IBIs. In reference to previous research methods [45,50,53], for all three groups at each site, each season, the reference sites of the were distinguished based on the following principles: (1) Shannon–Wiener index (H’) ≥ 2; and (2) all the water quality indices based on chemical–physical parameters (see Section 2.2) had values above class II, according to the national Environmental Quality Standards for Surface Water (GB3838–2002, China).

2.3.2. Selection of Metrics

Regarding the diversity, abundance, composition, tolerance, and functional metrics of the three analyzed biological groups, 36 candidate metrics for fish [20,33,45,55], 39 candidate metrics for benthic macroinvertebrates [37,48,56,57], and 25 candidate metrics for phytoplankton [17,27,52,53,54,58] were identified as being sensitive to disturbances and were selected as candidate metrics (Table 1).
Three steps were performed to screen the candidate metrics to obtain the core metrics and establish the IBIs. First, metrics with median values of zero were eliminated due to their insufficient ranges. Second, the metrics were measured by box and whisker plot tests. The discriminatory ability of each metric was identified by the degree of interquartile overlap (IQ) in the boxplots between the impaired and reference sites. If the two boxes did not overlap, IQ = 3. If the interquartile ranges overlapped but the overlapping region did not reach the medians, IQ = 2. If only one median was within the interquartile range of the other box, IQ = 1. If both medians were within the range of the other box, IQ = 0. Through this method, metrics with high discriminatory abilities (IQ ≥ 2) were obtained. Lastly, metrics with high Spearman correlation (r > 0.75, p < 0.05) were considered redundant, and only independent metrics were retained.

2.3.3. Calculation of the IBI and Assessment of Ecosystem Health

The core metrics were standardized by using the ratio method. For metrics that decreased with a disturbance, the 95th-percentile metric value was defined as the upper expected limit, and standardization was performed according to the following formula:
standardized metric = site value/upper expected limit
For metrics that increased with a disturbance, the 5th-percentile metric value was defined as the lower expected limit, and standardization was performed according to the following formula:
standardized metric = (maximum value − site value)/(maximum value − lower expected limit).
The IBI was obtained for each sample site by aggregating individual standardized metrics.
The 25th-percentile IBI of the reference site was regarded as the ecosystem health assessment standard. Sample sites with IBI values higher than this standard were evaluated as healthy. Scores below this standard were divided into four intervals from high to low, corresponding to good, fair, poor, and extremely poor ecosystem health.

2.4. Statistical Analysis

In this study, the McNaughton dominance index was calculated for all species. Species with a dominance degree of greater than 0.2 were identified as dominant species, and the formula used to calculate the dominance degree was as follows: McNaughton dominance index = the number of individuals in each species/the number of individuals in all species × the frequency of occurrence of the species.
The Kruskal–Wallis test (p < 0.05) was performed to verify the differences in the IBI evaluation results among different sampling seasons and among the results obtained based on different biological groups.
Stepwise linear regression was applied to screen the main environmental factors affecting IBIs.
Spearman’s correlation coefficient was applied to test the consistency of the assessment results obtained for the 3 biological groups at different scales.
A constrained ordination was applied to analyze the relationships between environmental factors and community structures. A detrended correspondence analysis (DCA) of the fish, benthic macroinvertebrate and phytoplankton communities showed that the axis length of the fish community was less than 4, and a redundancy analysis (RDA) was thus more suitable for this community. The axis lengths of the benthic macroinvertebrate and phytoplankton communities were greater than 4, and a canonical correspondence analysis (CCA) was chosen for these communities. All the environmental factors were log transformed (log x + 1), and factors with strong collinearity as indicated by the variance inflation factor (VIF) were removed. Finally, forward selection and Monte Carlo permutation tests were performed to screen the environmental factors that were significantly related to the communities. All the analyses described above were completed in R 3.6.1.

3. Results

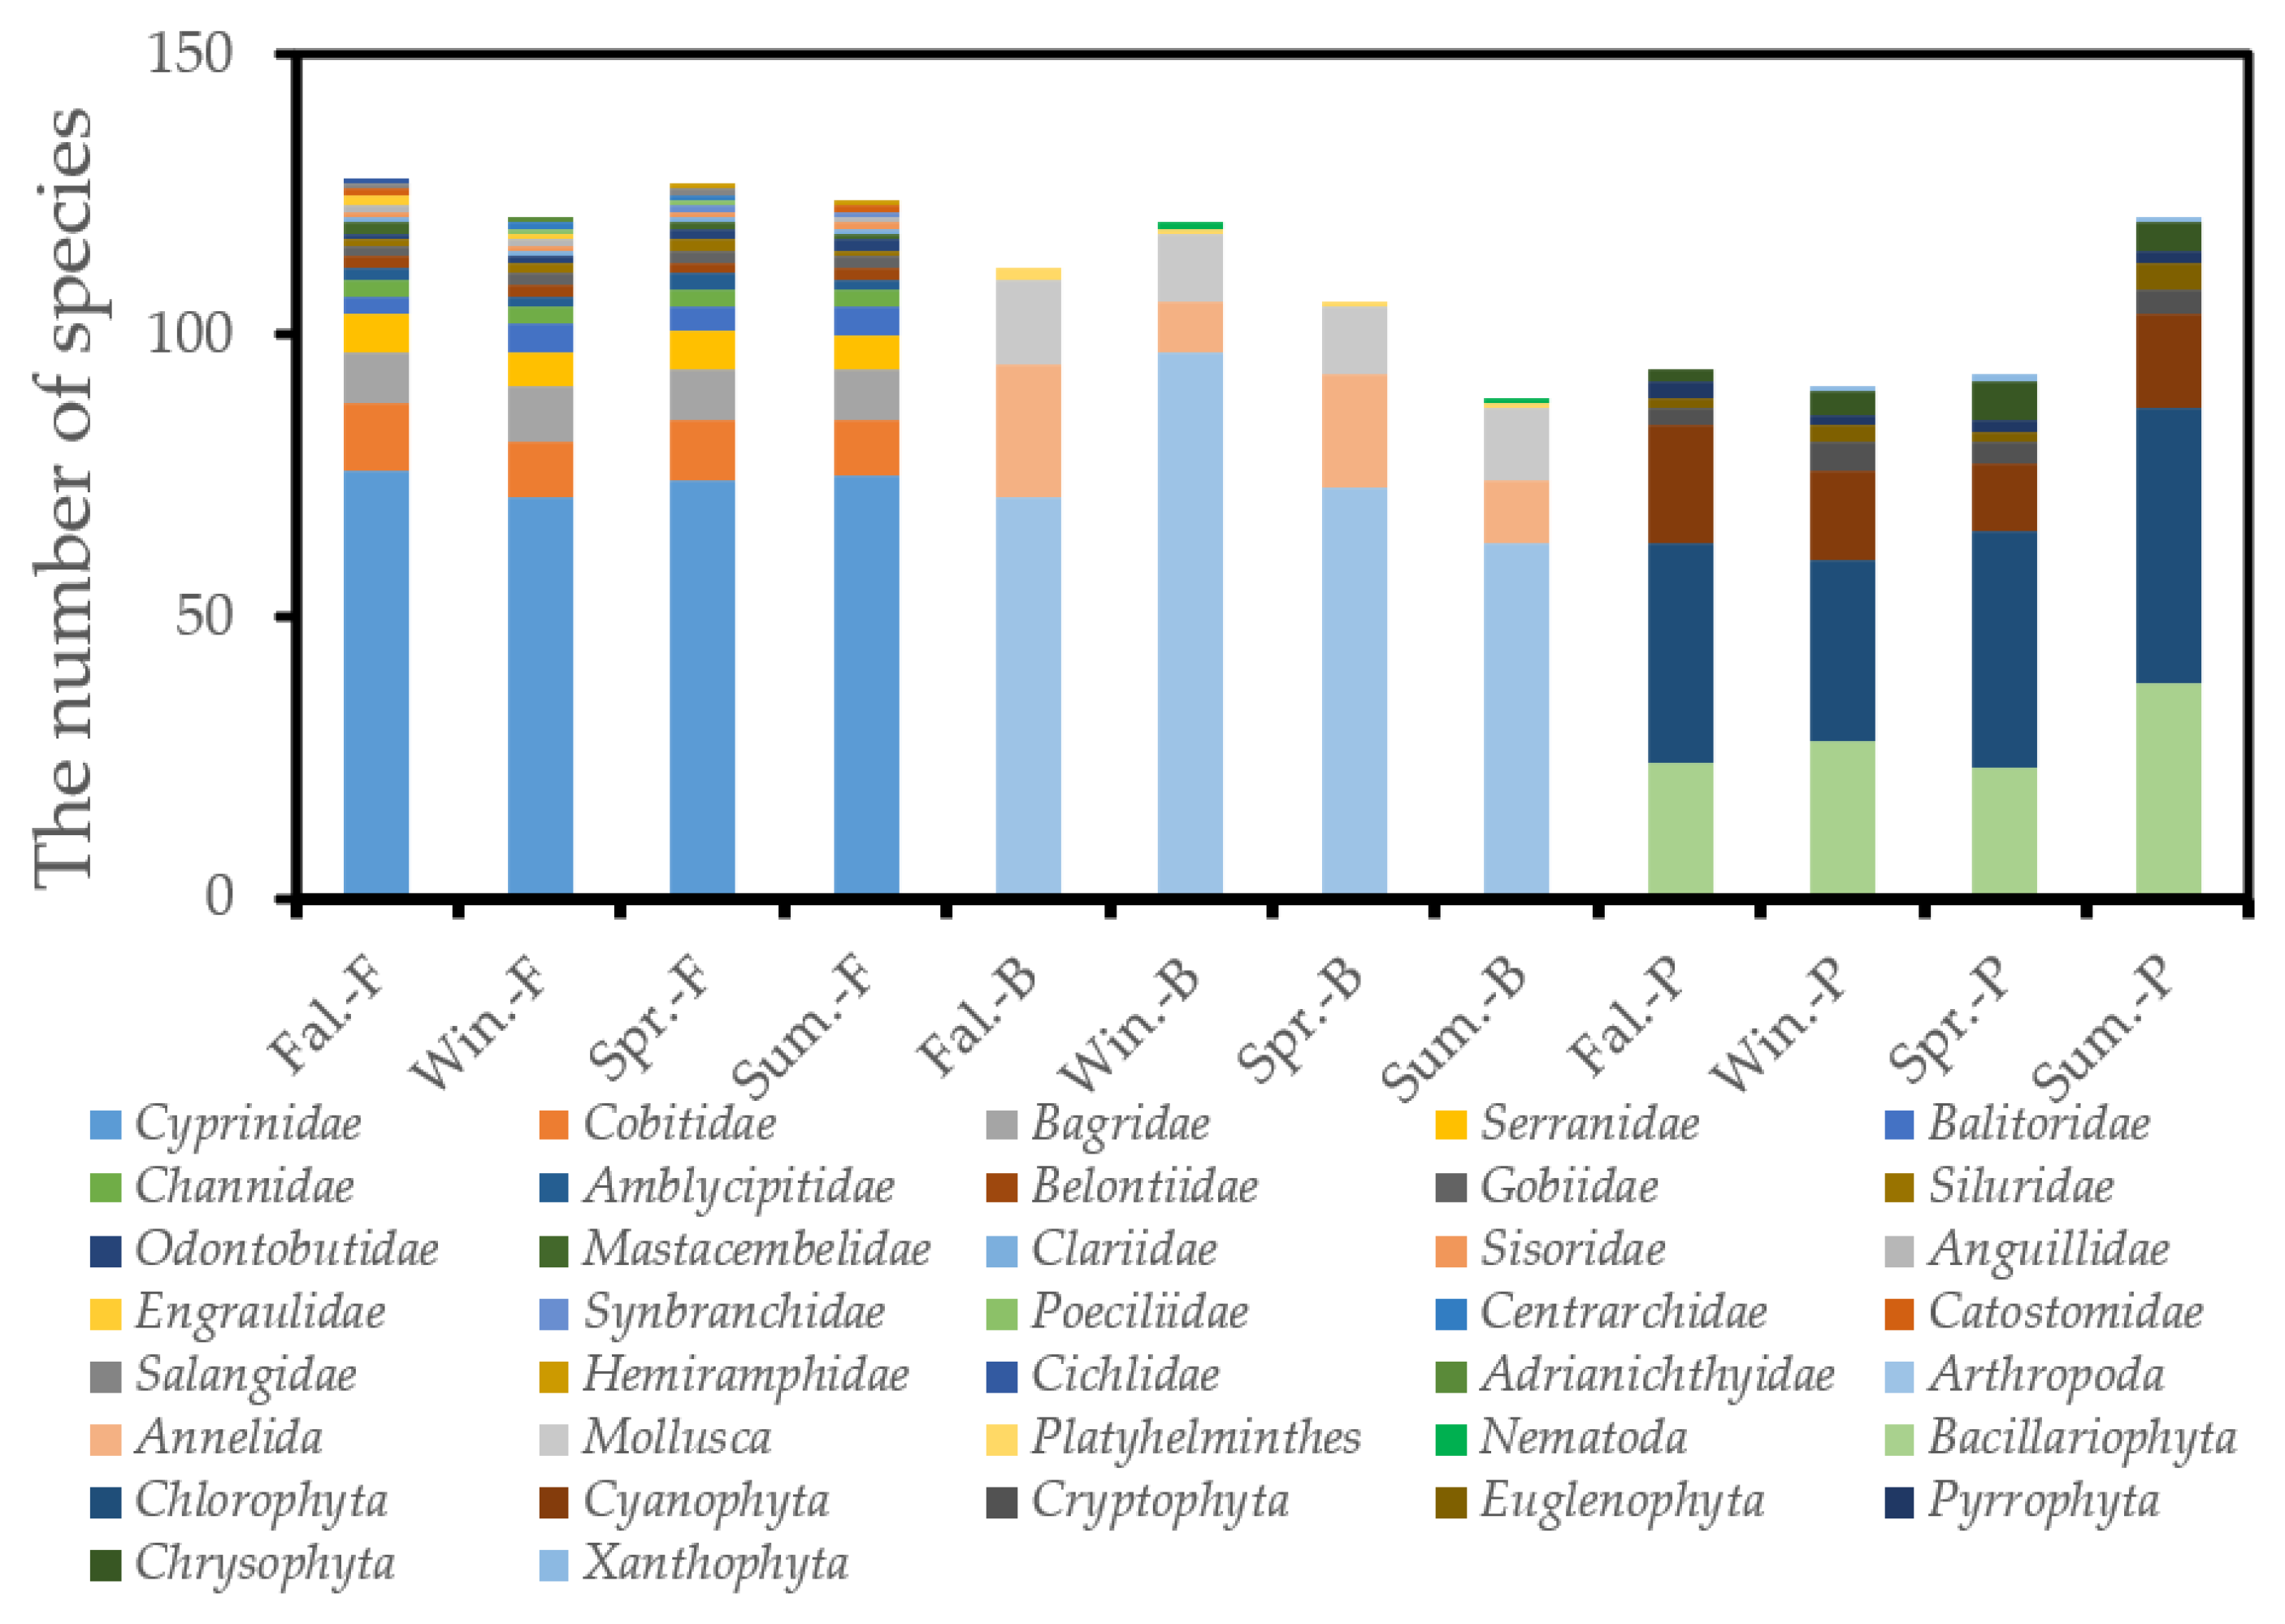
3.1. Community Structure

3.1.1. Fish Community Structure

In the Ganjiang River system, a total of 159 fish species were identified from 27 sampling sites, belonging to 9 orders, 24 families, and 87 genera. The species richness varied from 0 to 63 with an average of 20. Cyprinidae constituted the most dominant group. Among them, Acrossocheilus parallens, Saurogobio dabryi, and Squalidus argentatus were the dominant species (Table 2).
The numbers of species identified in autumn, winter, spring, and summer were similar, at 128, 121, 127, and 124, respectively. There were slight differences in the proportion of species of each family among different seasons (Figure 2).

3.1.2. Benthic Macroinvertebrate Community Structure

Altogether, 229 benthic macroinvertebrate species belonging to 5 phyla, 10 classes, 25 orders, and 81 families were recorded at the 42 sampling sites in the Ganjiang River system, of which were 163 species of Arthropoda, 40 species of Annelida, 23 species of molluscs, 2 species of Platyhelminths, and 1 species of Nematoda. The species richness varied from 0 to 31, with an average of 8. Arthropoda constituted the most dominant group. Limnodrilus hoffmeisteri and Corbicula fluminea were the dominant species (Table 2).
The numbers of species identified here reached 112, 120, 106, and 89 in autumn, winter, spring, and summer, respectively; that is, the species were the least abundant in summer and the most abundant in winter. Arthropoda accounted for the most species during the four seasons, and their proportion was the highest in winter (Figure 2).

3.1.3. Phytoplankton Community Structure

A total of 185 phytoplankton species belonging to 8 phyla were recorded at the 45 sampling sites. The species richness varied from 2 to 41, with an average of 16. Chlorophyta and Bacillariophyta constituted the most dominant groups. Among them, Navicula simplex, Ankistrodesmus angustus, Crucigenia apiculata, and Cyclotella meneghiniana were the dominant species (Table 2).
The numbers of species identified species reached 94, 91, 93, and 121 in autumn, winter, spring, and summer, respectively. In summer, both the number of total species and Bacillariophyta species were significantly higher than those during the other three seasons (Figure 2).

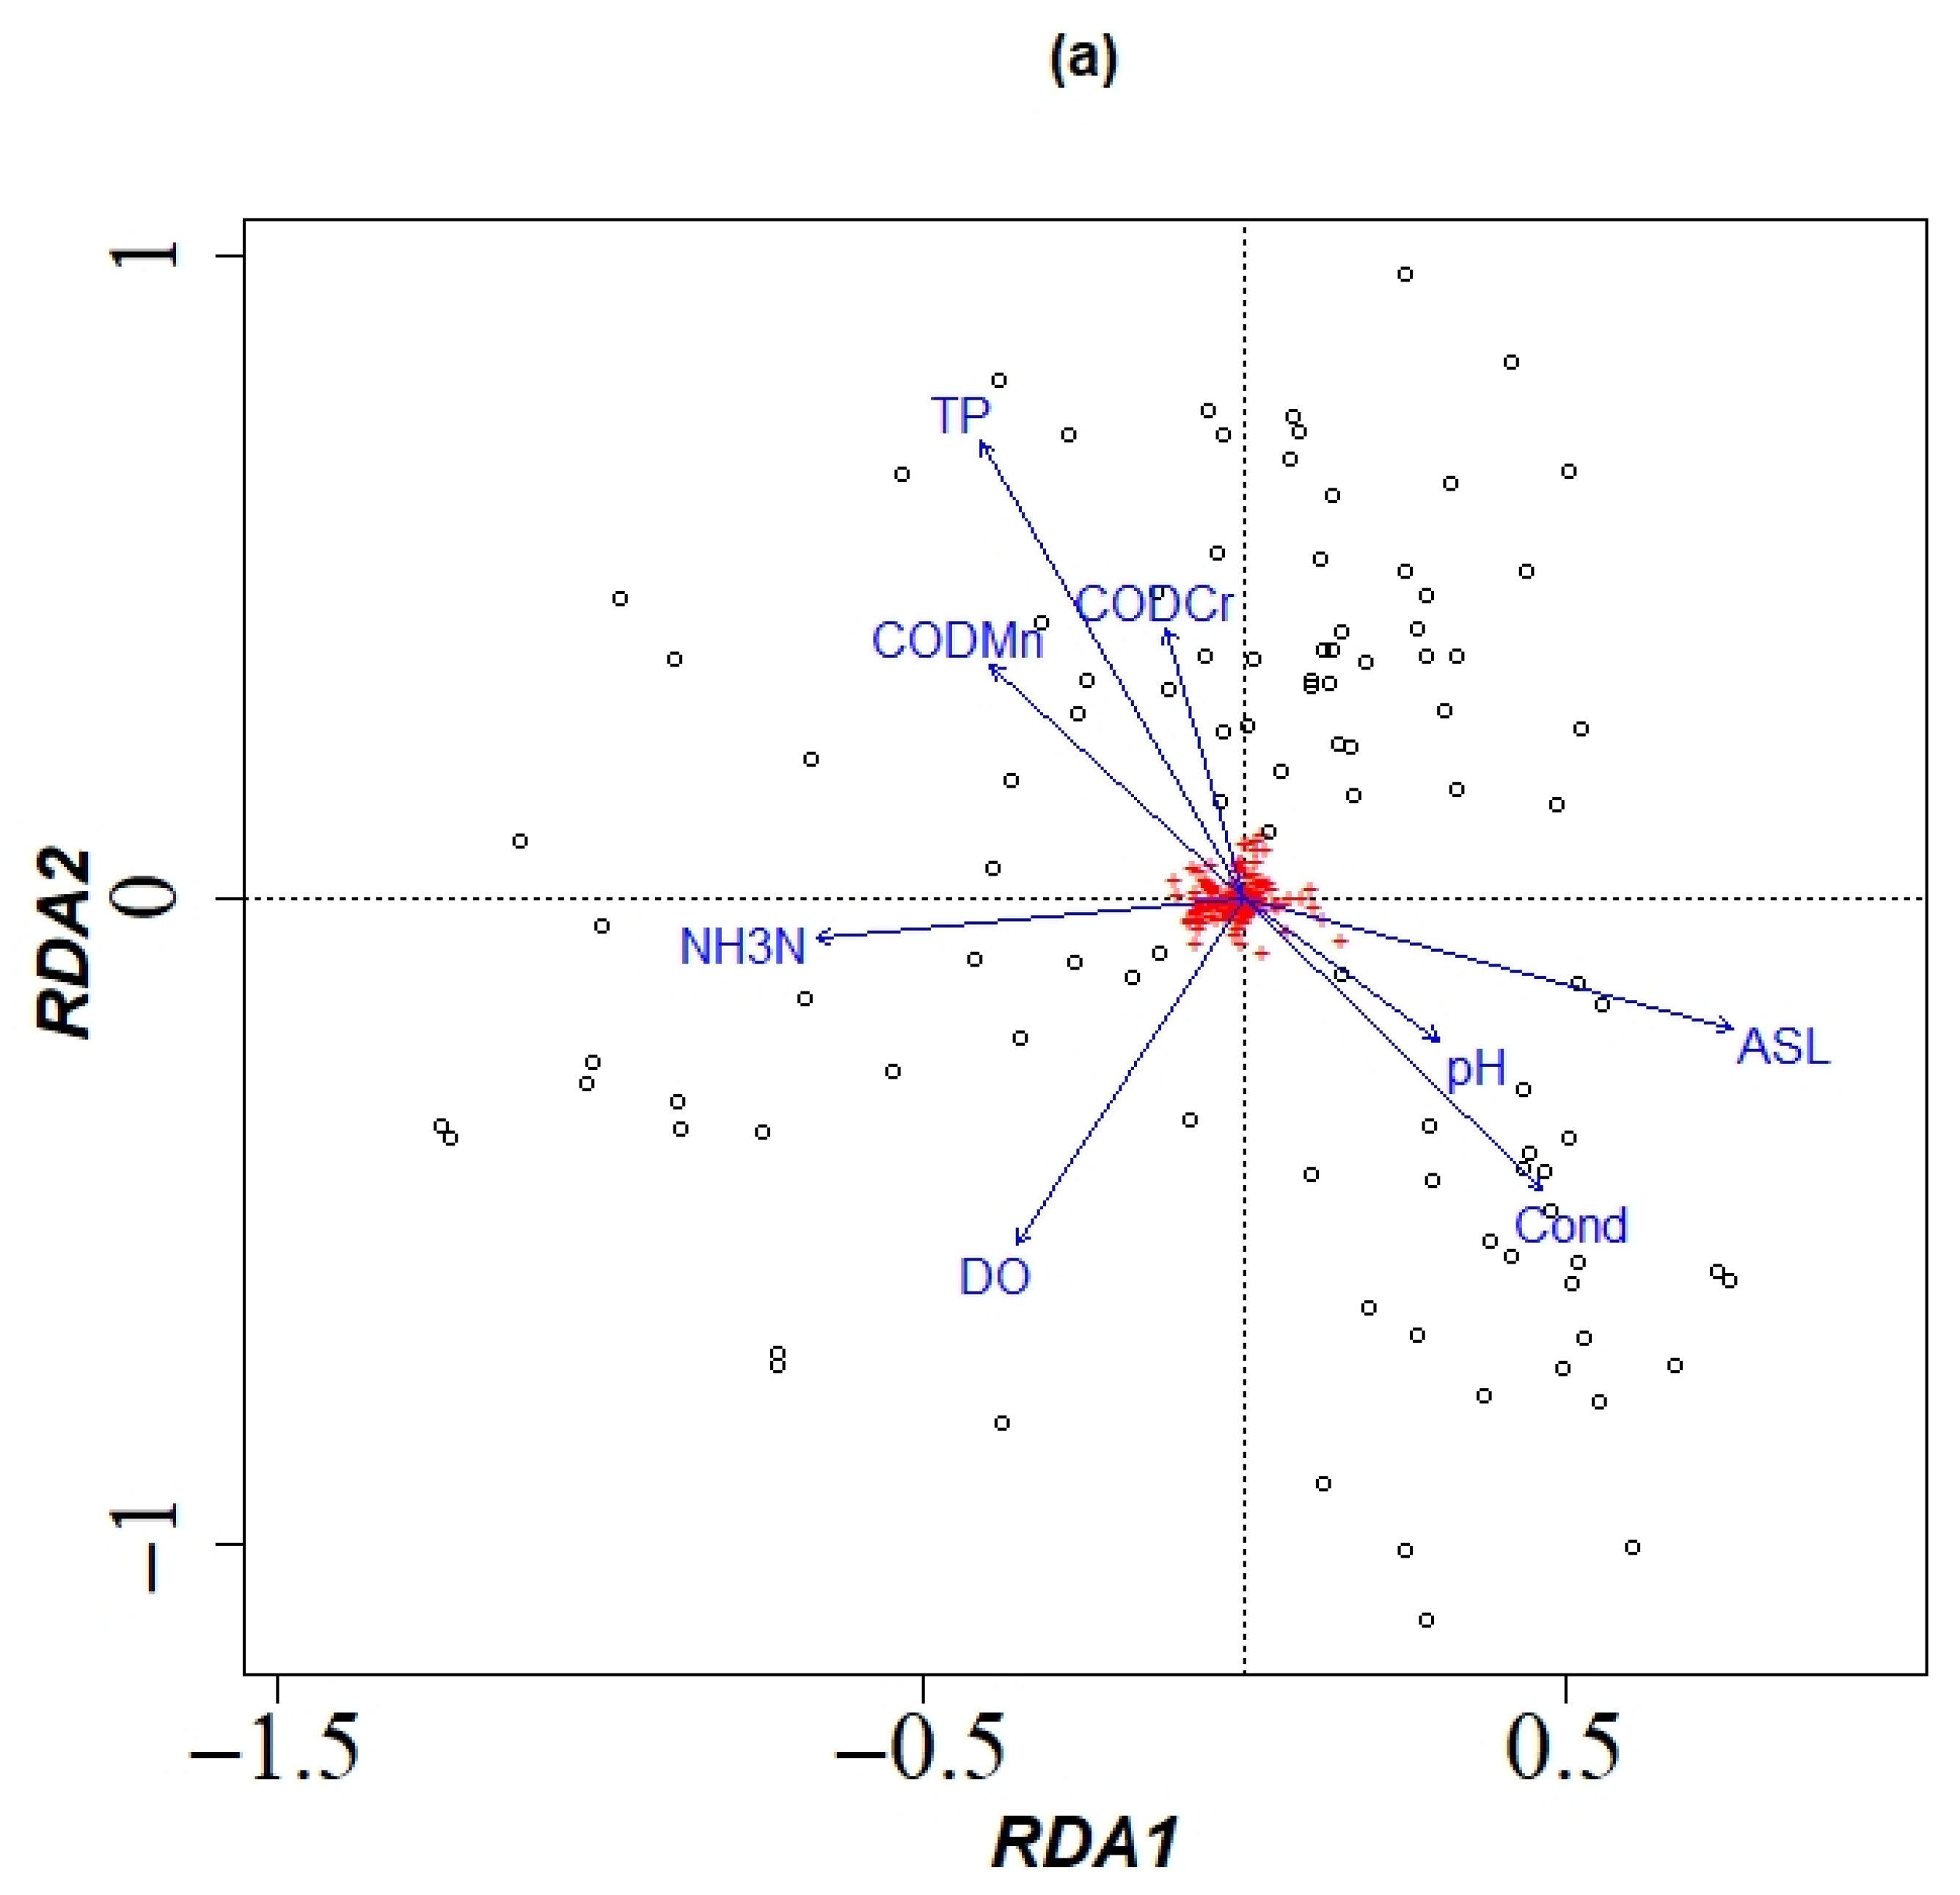
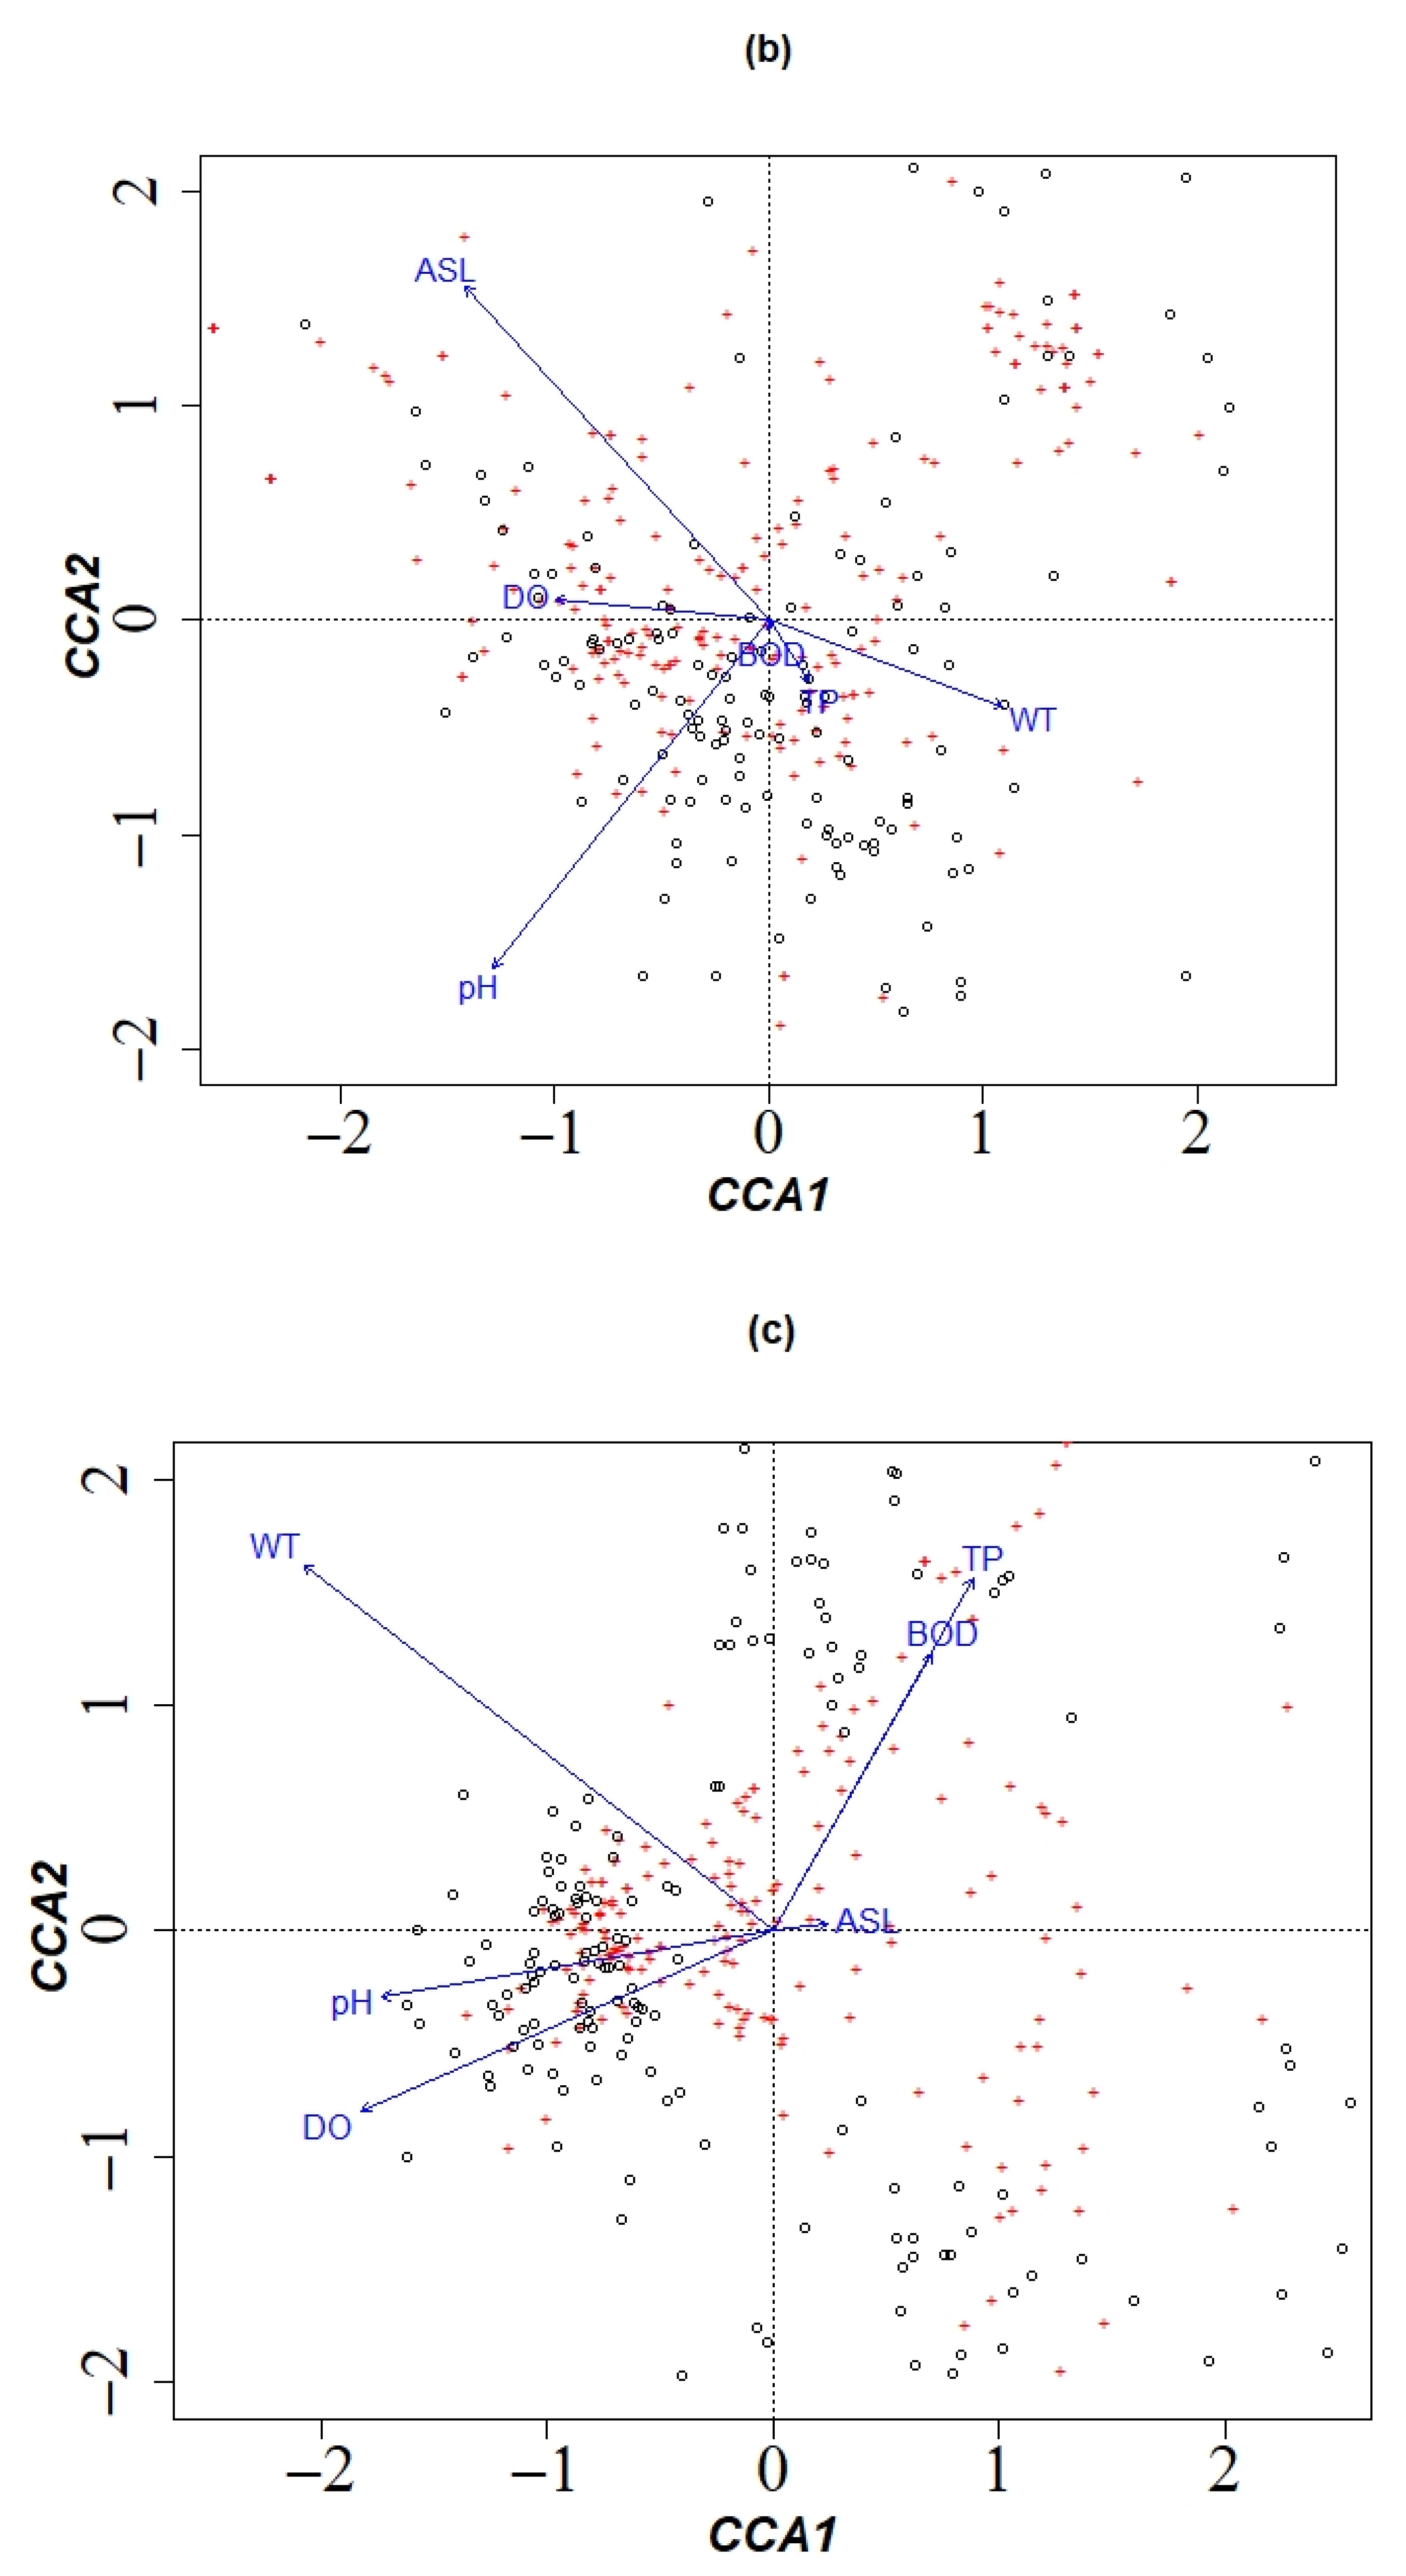
3.1.4. Dominant Environmental Factors Affecting Community Structure

There were significant differences in the above sea level (ASL), chemical permanganate index (CODMn), biochemical oxygen demand (BOD), ammonia-nitrogen concentration (NH3-N) and total phosphorus (TP) concentration among the four river sections (p < 0.05; Table 3). Most of the branches upstream and midstream are located in mountainous areas, and the altitude is significantly higher than that of the main stream and branches downstream. The chemical permanganate index, biochemical oxygen demand, ammonia-nitrogen concentration, and total phosphorus contents were the lowest in the upstream branches and the highest in the downstream branches. There was an environmental gradient in the Ganjiang River system.
The RDA and CCA results showed that the main environmental factors affecting the fish community structure were the elevation (m. a.s.l.), NH3-N, and DO (p < 0.05, Figure 3a), those affecting benthic macroinvertebrates were the elevation, pH, Cond, and DO (p < 0.05, Figure 3b), and those affecting phytoplankton were the WT, DO, BOD, and TP (p < 0.05, Figure 3c).

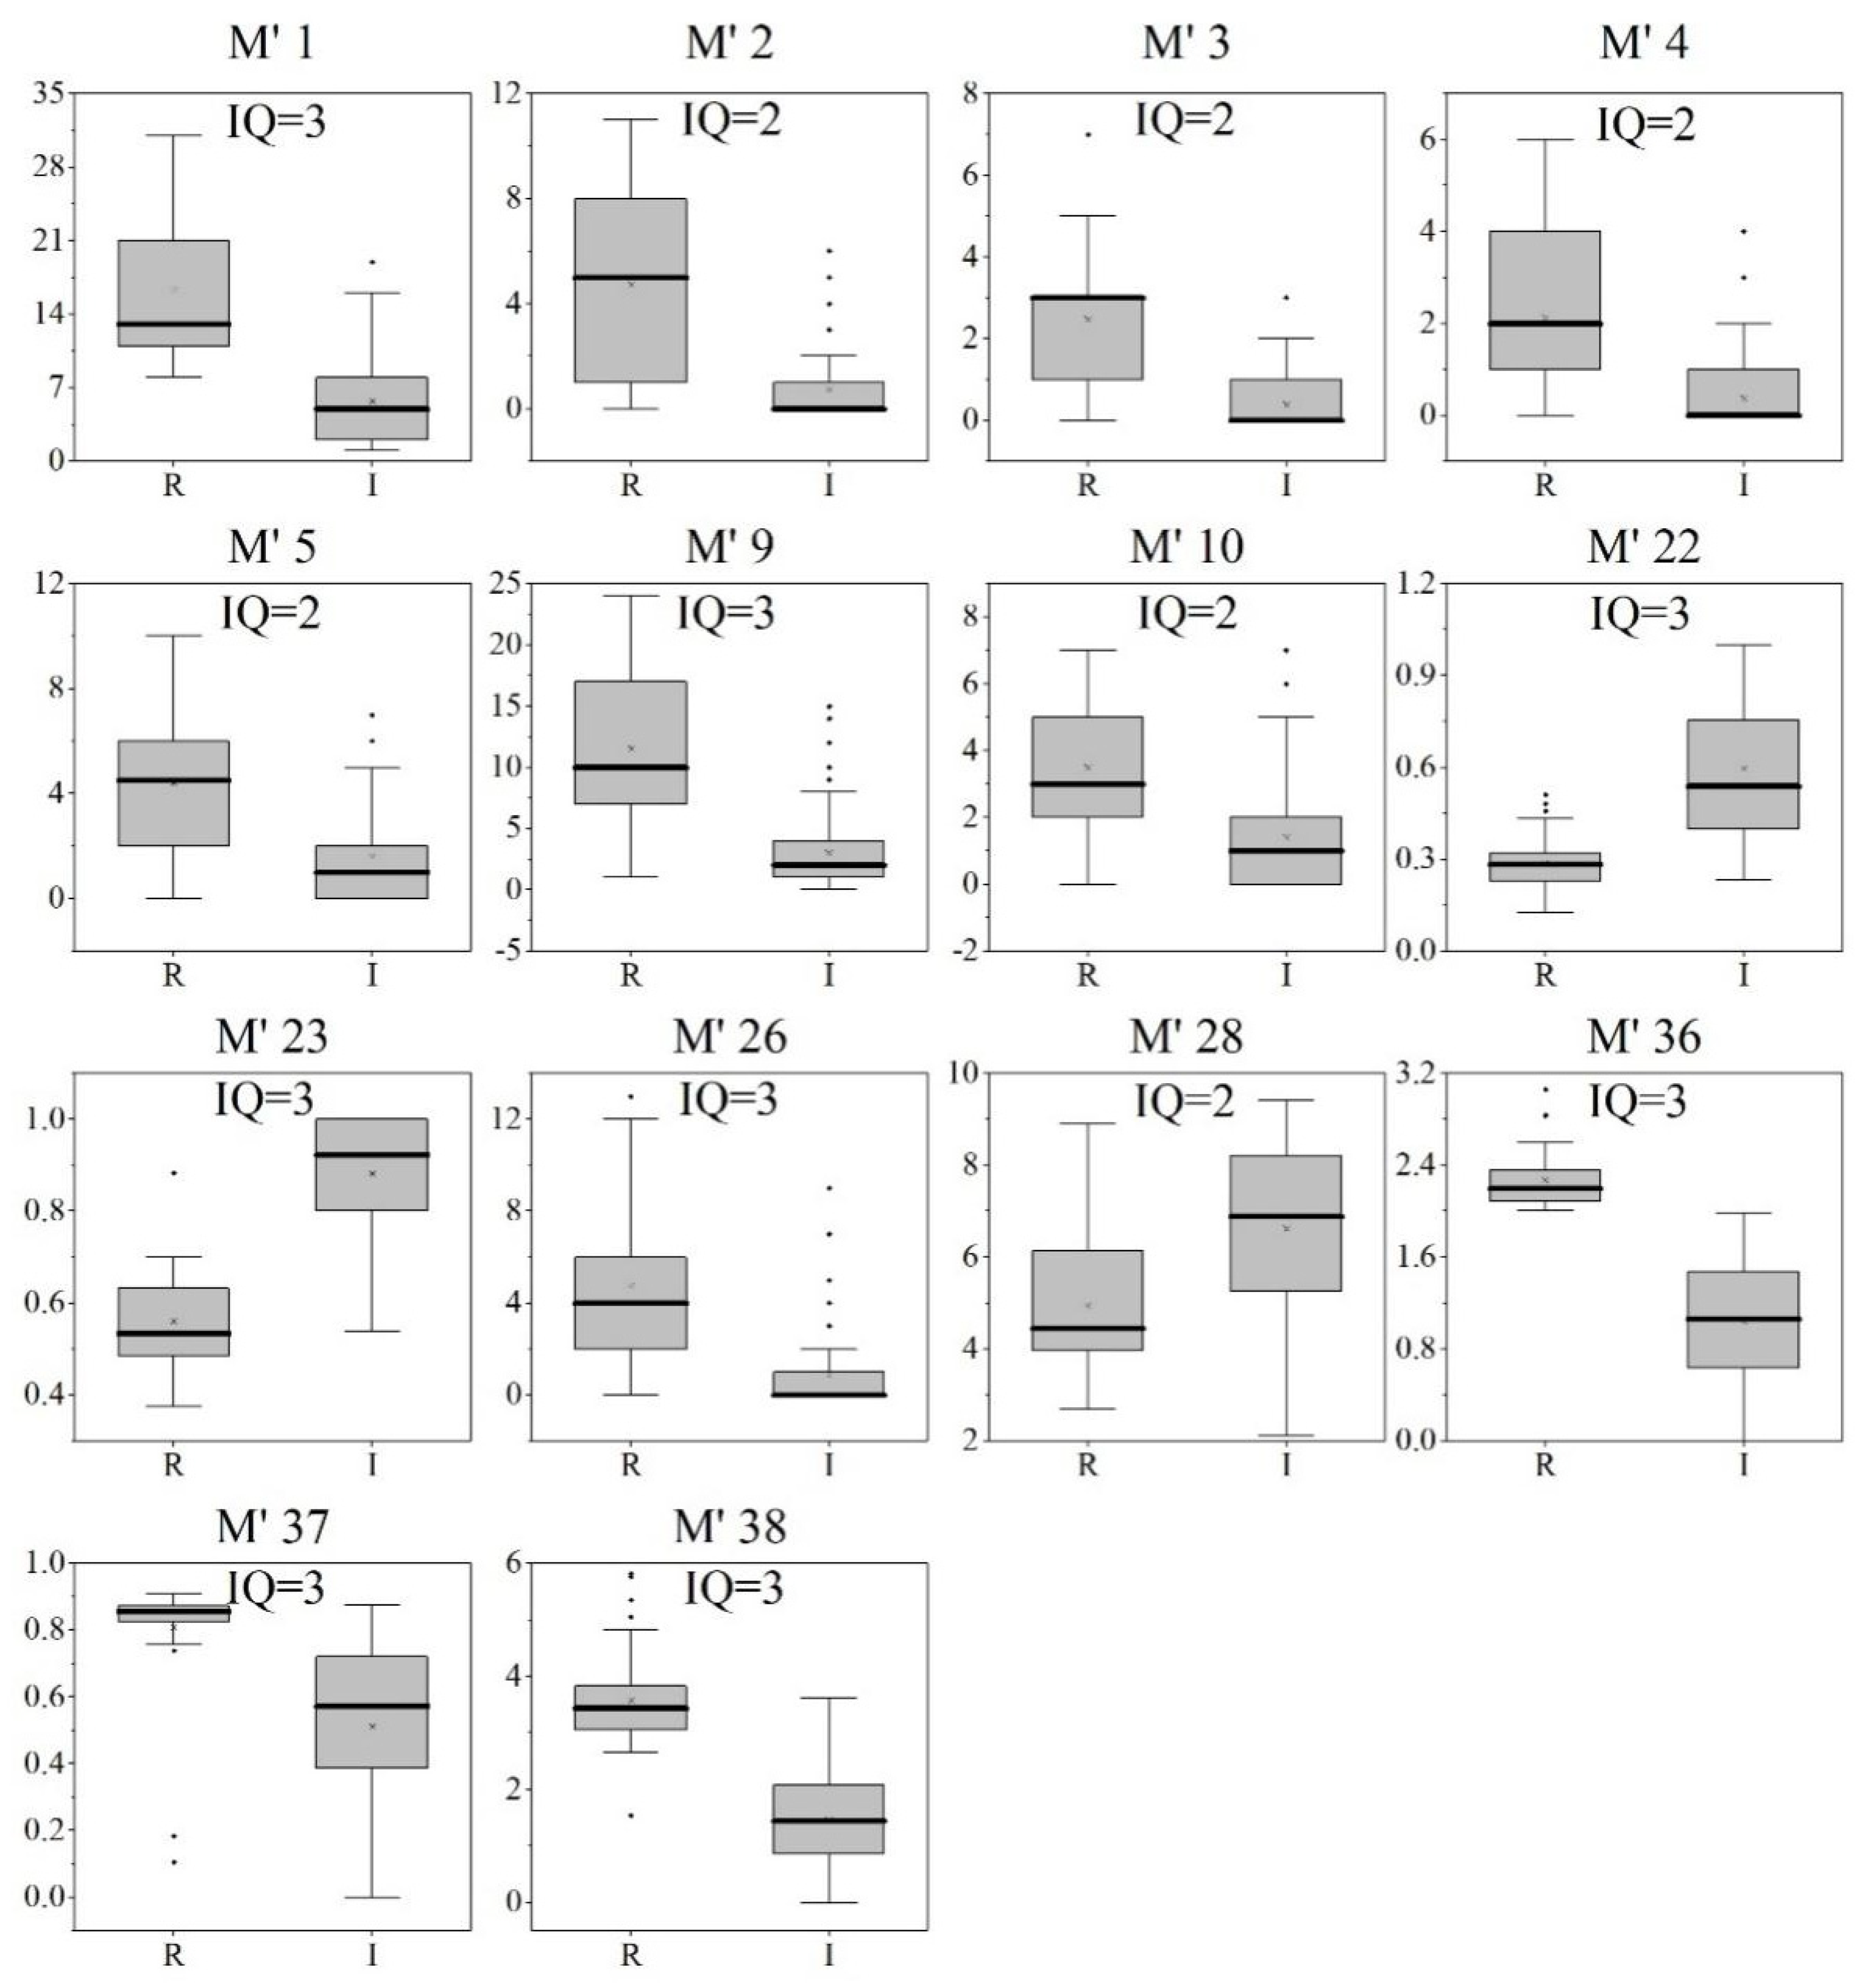
3.2. Selection of Core Metrics and Establishment of the F-IBI, B-IBI, and P-IBI

The F-IBI was obtained by adding the standardized M4 Gobioninae taxa, M20 herbivorous fishes, M23 fish species spawning drifting eggs, M30 individual number, M32 Simpson index, and M34 Pielou index. The boundary values delineating healthy from good, good from fair, fair from poor and poor from extremely poor sites were 3.14, 2.36, 1.57, and 0.79, respectively (Table 4).
A total of 14 of the 36 candidate metrics listed in Table 1 passed the discrimination power test with IQ ≥ 2 (Figure 4), and among these 14 metrics, 7 irredundant metrics were ultimately screened to obtain the core metrics. The B-IBI was obtained by adding the standardized M’3 Ephemeroptera taxa, M’4 Trichoptera taxa, M’10 Chironomidae taxa, M’22 dominant taxon %, M’28 BI index, and M’37 Simpson index. The boundary values delineating healthy from good, good from fair, fair from poor, and poor from extremely poor sites were 3.22, 2.42, 1.61, and 0.81, respectively (Table 4).
The P-IBI was obtained by adding the standardized M’’1 total taxa, M’’15 Simpson index, M’’17 Pielou index, and M’’19 Chlorophyta density. The boundary values delineating healthy from good, good from fair, fair from poor, and poor from extremely poor sites were 2.38, 1.79, 1.19, and 0.60, respectively (Table 4).
The annual average ecosystem health assessment results obtained for the Ganjiang River system based on the F-IBI, B-IBI, and P-IBI indicated good, fair, and healthy conditions, respectively.
The assessment results obtained based on the F-IBI indicated that more than half of the sites sampled during each quarter were healthy or in good health (Figure 5a–d). The Kruskal–Wallis test revealed no significant difference among the results obtained during different seasons (p > 0.05). The results of the main river stream were better than those of the tributaries, and the results obtained for the middle and downstream reaches were better than those obtained for the upstream region. Areas with poor or extremely poor assessment results primarily appeared in the upstream tributaries of the Zhang River and Shangyou River.
The assessment results obtained with the B-IBI indicated that more than half of the sites sampled during each quarter were in fair, poor, or extremely poor health (Figure 5e–h). The Kruskal–Wallis test revealed no significant difference among the results obtained during different seasons (p > 0.05). The results obtained for the main stream were worse than those obtained for the tributaries, and the upstream and middle reaches had better health than the downstream region.
Lastly, the assessment results obtained with the P-IBI indicated that most sites sampled during each quarter were healthy or in good health (Figure 5i–l). The Kruskal–Wallis test revealed significant differences among the results obtained during different seasons (p < 0.05), and the results in autumn and winter were significantly worse than those in spring and summer (the summer results were the best).
Stepwise linear regression results showed that the main environmental factor affecting the F-IBI was elevation (p < 0.05, Table 5); those affecting B-IBI were the elevation, WT, DO, and NH3-N (p < 0.05, Table 5); and those affecting phytoplankton were the WT, NH3-N, DO, CODCr, and TP (p < 0.05, Table 5).

4. Discussion

4.1. Community Structure Analysis

The Ganjiang River system had high fish, benthic macroinvertebrate, and phytoplankton diversity, but the statuses of these three groups differed. All three dominant fish species belonged to Cyprinidae; among these species, two are usually considered pollution-tolerant species, and the other is pollution sensitive [62,63]. The two dominant benthic macroinvertebrate species are both pollution tolerant, which typically indicates that the sampled ecosystem was in poor condition [49]. The four dominant phytoplankton are diatoms and green algae [64,65]; only one of them is pollution tolerant and the others are pollution sensitive, which usually indicates better conditions than the former two.
Different main environmental factors affected the community structures of the three groups. Fishes and benthic macroinvertebrates shared two explanatory variables, whereas phytoplankton shared only one variable with the above two groups. Inconsistent with phytoplankton, large-scale environmental factors, such as elevation, played significant roles in affecting fishes and benthic macroinvertebrates. The sensitivity of phytoplankton to environmental changes leads to the instability of phytoplankton communities [53], and this instability may mask the responses of phytoplankton to large-scale environmental factors. These factors can explain the differences in the observed community structures among the three groups. The differences indicate that conducting multigroup assessments of ecosystem health based on different groups is important.
Furthermore, the environmental factors collected in this study were insufficient, which may have affected the screening result. Factors such as biological interactions and spatial autocorrelations will be considered in further studies.

4.2. Evaluation of Assessment Results Obtained Based on the F-IBI, B-IBI, and P-IBI

The F-IBI for the Ganjiang River system comprised six metrics: Gobioninae taxa, herbivorous fishes, fish species spawning drifting eggs, individual number, Simpson index, and Pielou index. The B-IBI for the Ganjiang River system comprised six metrics: Ephemeroptera taxa, Trichoptera taxa, Chironomidae taxa, dominant taxon %, BI index, and Simpson index. The P-IBI for the Ganjiang River system comprised four metrics: Total taxa, Simpson index, Pielou index, and Chlorophyta density. The selection of appropriate metrics is key for the appropriate application of IBIs [57]. Disturbed rivers are often dominated by a few species, with low species richness and evenness. Clean water often contains few dominant species, and some sensitive organisms will be observed. The decline in herbivorous fishes, drift spawning fishes, Ephemeroptera taxa, Trichoptera taxa, and Chlorophyta density reflects reductions in intolerant populations, while increases in Gobioninae taxa and Chironomidae taxa reflect an increase in tolerant populations. All the above factors are good predictors of disturbances from human activities [20,34,66].
The various assessments performed based on different groups suggested different health conditions in the Ganjiang River system. The Kruskal–Wallis test revealed significant differences among the assessment results of the F-IBI, B-IBI, and P-IBI (p < 0.05). The results obtained based on phytoplankton were the best, those obtained based on fishes were the second best, and those obtained based on benthic macroinvertebrates were the worst. These results correspond well to the characteristics of the three communities (see Section 4.1), such as the species composition and the tolerance of dominant species, which further indicates that the biological metrics used to construct the IBIs in this study were appropriate.
Stepwise linear regression results showed that the main environmental factors affecting F-IBI, B-IBI, and P-IBI were different. The environmental factors explaining the community structure and IBIs are not completely consistent. Among them, the main environmental factors affecting the P-IBI are more similar to those affecting the community structure. Therefore, we believe that phytoplankton are more sensitive to environmental changes.

4.3. Temporal Heterogeneity of the F-IBI, B-IBI, and P-IBI

The stability of the results on the seasonal time scale also differed greatly among the three groups; neither the F-IBI nor the B-IBI showed obvious seasonal changes, while the P-IBI did (p < 0.05). The physiological characteristics and ecological adaptability of the three groups can partly explain this phenomenon. Fish have the longest life cycle, followed by benthos, and both of them can adapt to temperature changes to some extent. Notably, phytoplankton, which have the shortest life cycle, are extremely sensitive to changes in the water environment. In addition, the WT, which is the crucial environmental factor affecting the community structure of phytoplankton, changes most obviously with the season. It is widely known that phytoplankton blooms usually occur in summer [67,68,69].
Regarding the seasonal variation trend in the P-IBI results, Baek et al. [51] and Zhang et al. [54] believed that the evaluation results obtained in autumn and winter were better than those obtained in spring and summer, while Zhang et al. [52] believed that the evaluation results obtained in spring and summer were better than those obtained in autumn and winter. In this study, the P-IBI results obtained in summer were the best; the summer results were significantly better than those recorded in spring, and the springtime results were better than the autumn and winter results. Our results thus supported the latter of the two findings by Zhang et al. This contradiction was related to the main environmental pressure characteristics of different basins [58]. The species diversity of phytoplankton in the Ganjiang River system increased with increasing temperatures, but the community structure could be maintained in a good state without causing water blooms.
Based on the above analysis, the quarterly changes in the F-IBI and B-IBI are nonsignificant. For the F-IBI and B-IBI, the assessment results of one survey can represent ecosystem health throughout a whole year, while the strong seasonal fluctuation in the P-IBI indicates that this index may be more useful in real-time monitoring or continuous monitoring.

4.4. Spatial Heterogeneity of the F-IBI, B-IBI, and P-IBI

On the spatial scale, the B-IBI gradient was the largest, followed by the F-IBI gradient, while the P-IBI results were closest among the different sampling sites (Figure 5). These differences can also be reflected in biometrics. Fishes have the ability to migrate throughout a basin, and their communities are more coherent than benthic macroinvertebrate communities [37]; moreover, their communities are more similar at different sampling sites. Benthic macroinvertebrates have weak migration abilities [28,29,49,70], and the sites sampled in this study were nearly isolated habitats; thus, the river health assessment based on the B-IBI had the strongest basin-scale discrimination ability. The phytoplankton community is extremely unstable and has difficulty representing the long-term state of an ecosystem [27,38,53,68], thus affecting the performance of the P-IBI. In general, fishes can reflect ecosystem information on a large scale, benthic macroinvertebrates can reflect environmental gradients and long-term environmental changes, and plankton can sensitively indicate environmental changes.
When calculated on different scales (sampling point scale, tributary scale, or basin scale), the Spearman’s correlation coefficient revealed that the consistency of the F-IBI and B-IBI was better than that between either the F-IBI or the B-IBI and the P-IBI. Similar to the findings reported in previous studies [35,38,47], this consistency performed better on a larger scale, but different degrees of consistency could be observed at the same scale. The F-IBI and B-IBI were significantly correlated in the entire system (p < 0.05). However, significant concordance should not be equated with strong concordance [71], and randomization tests typically produce significant correlations even if the strength of the correlations is low. In this study, the F-IBI and B-IBI were significantly correlated in the entire basin, but their correlation coefficient was only 0.34.
In addition, the differences in the effects of different environmental factors on organisms are more easily reflected on a small scale [40]. An ample spread of sampling sites over a large area can capture a larger portion of the variability in biological communities, and highly diverse habitats may cause the effects of different factors to offset each other [36], so an increased sample extent may simply increase the correlations between community groups. However, if the study area is characterized by high habitat homogenization, the conclusion may be the opposite [38,39].

5. Conclusions

This study demonstrates that the ecosystem health assessments performed based on different biological groups exhibited significant differences (p < 0.05). The stepwise linear regression results showed that the main environmental factors affecting IBIs were different, and that the factor affecting F-IBI was elevation; those affecting B-IBI were the elevation, WT, DO, and NH3-N; and those affecting phytoplankton were the WT, NH3-N, DO, CODCr, and TP. It is thus necessary to perform multigroup-based assessments to evaluate the health statuses of aquatic ecosystems comprehensively. The CCA and RDA results revealed that the main environmental factors affecting the fish community structure were elevation, NH3-N and DO; those affecting benthic macroinvertebrates were elevation, pH, Cond, and DO; and those affecting phytoplankton were WT, DO, BOD, and TP. The different main environmental factors affecting the three biological groups help explain the sources of the differences in the ecosystem health assessment results obtained based on the F-IBI, B-IBI, and P-IBI. The stability of the F-IBI and B-IBI results, and the seasonal fluctuations observed in the P-IBI results indicated that fish and benthic macroinvertebrates were suitable for annual monitoring, while the P-IBI was more effective in real-time monitoring or continuous monitoring. The evaluation results of the F-IBI and B-IBI are more similar, while there are great differences between the P-IBI and the other two indices. The evaluation results of the P-IBI are healthier in a large area, which may have been related to the large variabilities in biological communities and the large-scale counteractions of environmental factors. The F-IBI, B-IBI, and P-IBI developed in this study can serve as tools for aquatic ecosystem health assessments and resource management in the Ganjiang River system.

Author Contributions

Conceptualization, X.H., X.G. and J.L.; methodology, X.H., B.L. and J.L.; validation, X.H.; formal analysis, X.H. and B.L.; resources, J.X. and J.L.; data curation, X.H. and J.X.; writing—original draft preparation, X.H.; writing—review and editing, J.X., X.G., B.L. and J.L.; visualization, X.H.; supervision, X.G. and J.L.; project administration, X.G. and J.L.; funding acquisition, J.L. All authors have read and agreed to the published version of the manuscript.

Funding

This work was funded by Basic Scientific Research Funds in National Nonprofit Institutes for Chinese Research Academy of Environmental Sciences (2021-ZX-KTNBHT-0042) and the Biodiversity Investigation of Major Projects of the Ministry of Ecology and Environment.

Data Availability Statement

All researchers involved approved the availability of the data.

Acknowledgments

We are grateful to the investigators of aquatic biodiversity in the Ganjiang River System for their hard work. Special and sincere thanks to the support of Basic Scientific Research Funds in National Nonprofit Institutes for Chinese Research Academy of Environmental Sciences (2021).

Conflicts of Interest

The authors declare no conflict of interest.

References

  1. Gonino, G.; Benedito, E.; Cionek, V.d.M.; Ferreira, M.T.; Oliveira, J.M. A fish-based index of biotic integrity for neotropical rainforest sandy soil streams—Southern Brazil. Water 2020, 12, 1215. [Google Scholar] [CrossRef]
  2. Carpenter, S.R.; Stanley, E.H.; Vander Zanden, M.J. State of the world’s freshwater ecosystems: Physical, chemical, and biological changes. Annu. Rev. Environ. Resour. 2011, 36, 75–99. [Google Scholar] [CrossRef] [Green Version]
  3. Park, Y.S.; Hwang, S.J. Ecological monitoring, assessment, and management in freshwater systems. Water 2016, 8, 324. [Google Scholar] [CrossRef] [Green Version]
  4. Veach, A.M.; Troia, M.J.; Cregger, M.A. Assessing biogeographic survey gaps in bacterial diversity knowledge: A global synthesis of freshwaters. Freshw. Biol. 2021, 66, 1595–1605. [Google Scholar] [CrossRef]
  5. Rapport, D.J.; Costanza, R.; McMichael, A.J. Assessing ecosystem health. Trends Ecol. Evol. 1998, 13, 397–402. [Google Scholar] [CrossRef]
  6. Costanza, R. Ecosystem health and ecological engineering. Ecol. Eng. 2012, 45, 24–29. [Google Scholar] [CrossRef] [Green Version]
  7. Pan, Z.; He, J.; Liu, D.; Wang, J.; Guo, X. Ecosystem health assessment based on ecological integrity and ecosystem services demand in the Middle Reaches of the Yangtze River Economic Belt, China. Sci. Total Environ. 2021, 774, 144837. [Google Scholar] [CrossRef]
  8. Wang, S.; Zhang, Q.; Yang, T.; Zhang, L.; Li, X.; Chen, J. River health assessment: Proposing a comprehensive model based on physical habitat, chemical condition and biotic structure. Ecol. Indic. 2019, 103, 446–460. [Google Scholar] [CrossRef]
  9. Norris, R.H.; Thoms, M.C. What is river health? Freshw. Biol. 1999, 41, 197–209. [Google Scholar] [CrossRef] [Green Version]
  10. Shan, C.; Dong, Z.; Lu, D.; Xu, C.; Wang, H.; Ling, Z.; Liu, Q. Study on river health assessment based on a fuzzy matter-element extension model. Ecol. Indic. 2021, 127, 107742. [Google Scholar] [CrossRef]
  11. de Oliveira Sanches, B.; Becker, B.; Hughes, R.M.; Petesse, M.L.; Ribeiro, J.R.; Santos, G.B. Fish-based multimetric index for evaluating land use effects on large neotropical reservoirs. J. Appl. Ichthyol. 2019, 35, 1129–1140. [Google Scholar] [CrossRef]
  12. Mostafavi, H.; Schinegger, R.; Melcher, A.; Moder, K.; Mielach, C.; Schmutz, S. A new fish-based multi-metric assessment index for cyprinid streams in the Iranian Caspian Sea Basin. Limnologica 2015, 51, 37–52. [Google Scholar] [CrossRef] [PubMed] [Green Version]
  13. Emery, E.B.; Simon, T.P.; McCormick, F.H.; Angermeier, P.L.; Deshon, J.E.; Yoder, C.O.; Sanders, R.E.; Pearson, W.D.; Hickman, G.D.; Reash, R.J.; et al. Development of a Multimetric Index for Assessing the Biological Condition of the Ohio River. Trans. Am. Fish. Soc. 2003, 132, 791–808. [Google Scholar] [CrossRef]
  14. Neachell, E. A multimetric macroinvertebrate index for the implementation of the European Water Framework Directive in French Guiana, East Amazonia. River Res. Applic. 2014, 30, 132–133. [Google Scholar] [CrossRef]
  15. Pallottini, M.; Goretti, E.; Selvaggi, R.; Cappelletti, D.; Dedieu, N.; Céréghino, R. An efficient semi-quantitative macroinvertebrate multimetric index for the assessment of water and sediment contamination in streams. Inl. Waters 2017, 7, 314–322. [Google Scholar] [CrossRef]
  16. Mondy, C.P.; Villeneuve, B.; Archaimbault, V.; Usseglio-Polatera, P. A new macroinvertebrate-based multimetric index (I 2M 2) to evaluate ecological quality of French wadeable streams fulfilling the WFD demands: A taxonomical and trait approach. Ecol. Indic. 2012, 18, 452–467. [Google Scholar] [CrossRef]
  17. Lacouture, R.V.; Johnson, J.M.; Buchanan, C.; Marshall, H.G. Phytoplankton index of biotic integrity for Chesapeake Bay and its tidal tributaries. Estuaries Coasts 2006, 29, 598–616. [Google Scholar] [CrossRef]
  18. Longphuirt, S.N.; McDermott, G.; O’Boyle, S.; Wilkes, R.; Stengel, D.B. Decoupling abundance and biomass of phytoplankton communities under different environmental controls: A new multi-metric index. Front. Mar. Sci. 2019, 6, 312. [Google Scholar] [CrossRef] [Green Version]
  19. Lugoli, F.; Garmendia, M.; Lehtinen, S.; Kauppila, P.; Moncheva, S.; Revilla, M.; Roselli, L.; Slabakova, N.; Valencia, V.; Dromph, K.M.; et al. Application of a new multi-metric phytoplankton index to the assessment of ecological status in marine and transitional waters. Ecol. Indic. 2012, 23, 338–355. [Google Scholar] [CrossRef]
  20. Karr, J.R. Assessment of Biotic Integrity Using Fish Communities. Fisheries 1981, 6, 21–27. [Google Scholar] [CrossRef]
  21. Borja, A.; Bricker, S.B.; Dauer, D.M.; Demetriades, N.T.; Ferreira, J.G.; Forbes, A.T.; Hutchings, P.; Jia, X.; Kenchington, R.; Marques, J.C.; et al. Overview of integrative tools and methods in assessing ecological integrity in estuarine and coastal systems worldwide. Mar. Pollut. Bull. 2008, 56, 1519–1537. [Google Scholar] [CrossRef]
  22. Mayon, N.; Bertrand, A.; Leroy, D.; Malbrouck, C.; Mandiki, S.N.M.; Silvestre, F.; Goffart, A.; Thomé, J.P.; Kestemont, P. Multiscale approach of fish responses to different types of environmental contaminations: A case study. Sci. Total Environ. 2006, 367, 715–731. [Google Scholar] [CrossRef]
  23. Azimi, S.; Rocher, V. Influence of the water quality improvement on fish population in the Seine River (Paris, France) over the 1990-2013 period. Sci. Total Environ. 2016, 542, 955–964. [Google Scholar] [CrossRef] [PubMed]
  24. Li, N.; Tang, G.; Zhao, P.; Hong, Y.; Gou, Y.; Yang, K. Statistical assessment and hydrological utility of the latest multi-satellite precipitation analysis IMERG in Ganjiang River basin. Atmos. Res. 2017, 183, 212–223. [Google Scholar] [CrossRef]
  25. Poikane, S.; Kelly, M.; Cantonati, M. Benthic algal assessment of ecological status in European lakes and rivers: Challenges and opportunities. Sci. Total Environ. 2016, 568, 603–613. [Google Scholar] [CrossRef]
  26. Wu, N.; Schmalz, B.; Fohrer, N. Development and testing of a phytoplankton index of biotic integrity (P-IBI) for a German lowland river. Ecol. Indic. 2012, 13, 158–167. [Google Scholar] [CrossRef]
  27. Wu, Z.; Kong, M.; Cai, Y.; Wang, X.; Li, K. Index of biotic integrity based on phytoplankton and water quality index: Do they have a similar pattern on water quality assessment? A study of rivers in Lake Taihu Basin, China. Sci. Total Environ. 2019, 658, 395–404. [Google Scholar] [CrossRef] [PubMed]
  28. Yao, N.; Feng, B.; Zhang, M.; He, L.; Zhang, H.; Liu, Z. Impact of industrial production, dam construction, and agriculture on the Z-IBI in river ecosystems: A case study of the wanan river basin in China. Water 2021, 13, 123. [Google Scholar] [CrossRef]
  29. Poikane, S.; Johnson, R.K.; Sandin, L.; Schartau, A.K.; Solimini, A.G.; Urbanič, G.; Arbačiauskas, K.S.; Aroviita, J.; Gabriels, W.; Miler, O.; et al. Benthic macroinvertebrates in lake ecological assessment: A review of methods, intercalibration and practical recommendations. Sci. Total Environ. 2016, 543, 123–134. [Google Scholar] [CrossRef] [PubMed]
  30. Niu, L.; Li, Y.; Wang, P.; Zhang, W.; Wang, C.; Li, J.; Wu, H. Development of a microbial community-based index of biotic integrity (MC-IBI) for the assessment of ecological status of rivers in the Taihu Basin, China. Ecol. Indic. 2018, 85, 204–213. [Google Scholar] [CrossRef]
  31. Yang, W.; You, Q.; Fang, N.; Xu, L.; Zhou, Y.; Wu, N.; Ni, C.; Liu, Y.; Liu, G.; Yang, T.; et al. Assessment of wetland health status of Poyang Lake using vegetation-based indices of biotic integrity. Ecol. Indic. 2018, 90, 79–89. [Google Scholar] [CrossRef]
  32. de paiva Silva, D.; De Marco, P.; Resende, D.C. Adult odonate abundance and community assemblage measures as indicators of stream ecological integrity: A case study. Ecol. Indic. 2010, 10, 744–752. [Google Scholar] [CrossRef]
  33. Li, T.; Huang, X.; Jiang, X.; Wang, X. Assessment of ecosystem health of the Yellow River with fish index of biotic integrity. Hydrobiologia 2018, 814, 31–43. [Google Scholar] [CrossRef]
  34. Lee, J.H.; An, K.G. Integrative restoration assessment of an urban stream using multiple modeling approaches with physical, chemical, and biological integrity indicators. Ecol. Eng. 2014, 62, 153–167. [Google Scholar] [CrossRef]
  35. Bae, M.J.; Li, F.; Kwon, Y.S.; Chung, N.; Choi, H.; Hwang, S.J.; Park, Y.S. Concordance of diatom, macroinvertebrate and fish assemblages in streams at nested spatial scales: Implications for ecological integrity. Ecol. Indic. 2014, 47, 89–101. [Google Scholar] [CrossRef]
  36. Young, S.S.; Yang, H.N.; Huang, D.J.; Liu, S.M.; Huang, Y.H.; Chiang, C.T.; Liu, J.W. Using benthic macroinvertebrate and fish communities as bioindicators of the Tanshui river basin around the greater Taipei area—Multivariate analysis of spatial variation related to levels of water pollution. Int. J. Environ. Res. Public Health 2014, 11, 7116–7143. [Google Scholar] [CrossRef] [PubMed] [Green Version]
  37. Wu, J.; Mao, R.; Li, M.; Xia, J.; Song, J.; Cheng, D.; Sun, H. Assessment of aquatic ecological health based on determination of biological community variability of fish and macroinvertebrates in the Weihe River Basin, China. J. Environ. Manag. 2020, 267, 110651. [Google Scholar] [CrossRef]
  38. Paavola, R.; Muotka, T.; Virtanen, R.; Heino, J.; Jackson, D.; Mäki-Petäys, A. Spatial scale affects community concordance among fishes, benthic macroinvertebrates, and bryophytes in streams. Ecol. Appl. 2006, 16, 368–379. [Google Scholar] [CrossRef]
  39. Johnson, R.K.; Daniel, H. Spatial congruency of benthic diatom, invertebrate, macrophyte, and fish assemblages in European streams. Ecol. Appl. 2010, 20, 978–992. [Google Scholar] [CrossRef]
  40. Dolph, C.L.; Huff, D.D.; Chizinski, C.J.; Vondracek, B. Implications of community concordance for assessing stream integrity at three nested spatial scales in Minnesota, U.S.A. Freshw. Biol. 2011, 56, 1652–1669. [Google Scholar] [CrossRef] [Green Version]
  41. Huang, Y.; Huang, B.; Qin, T.; Nie, H.; Wang, J.; Li, X.; Shen, Z. Assessment of hydrological changes and their influence on the aquatic ecology over the last 58 years in Ganjiang Basin, China. Sustainability 2019, 11, 4882. [Google Scholar] [CrossRef] [Green Version]
  42. Zhang, Q.; Sun, P.; Jiang, T.; Tu, X.; Chen, X. Patrons spatio-temporels des processus hydrologiques et de leurs réponses aux activités humaines dans le bassin du Lac Poyang, Chine. Hydrol. Sci. J. 2011, 56, 305–318. [Google Scholar] [CrossRef]
  43. Jiang, S.; Zhang, Z.; Huang, Y.; Chen, X.; Chen, S. Evaluating the TRMM Multisatellite Precipitation Analysis for Extreme Precipitation and Streamflow in Ganjiang River Basin, China. Adv. Meteorol. 2017, 2017, 2902493. [Google Scholar] [CrossRef]
  44. Guo, Q.; Liu, X.; Ao, X.; Qin, J.; Wu, X.; Ouyang, S. Fish diversity in the middle and lower reaches of the Ganjiang River of China: Threats and conservation. PLoS ONE 2018, 13, e0205116. [Google Scholar] [CrossRef] [PubMed] [Green Version]
  45. Lu, C.J.; Duan, J.J.; Junaid, M.; Cao, T.W.; Ding, S.M.; Pei, D.S. Recent status of fishes in the Yangtze river and its ecological health assessment. Am. J. Environ. Sci. 2016, 12, 86–93. [Google Scholar] [CrossRef]
  46. Capmourteres, V.; Rooney, N.; Anand, M. Assessing the causal relationships of ecological integrity: A re-evaluation of Karr’s iconic Index of Biotic Integrity. Ecosphere 2018, 9, e02168. [Google Scholar] [CrossRef] [Green Version]
  47. Griffith, M.B.; Hill, B.H.; McCormick, F.H.; Kaufmann, P.R.; Herlihy, A.T.; Selle, A.R. Comparative application of indices of biotic integrity based on periphyton, macroinvertebrates, and fish to southern Rocky Mountain streams. Ecol. Indic. 2005, 5, 117–136. [Google Scholar] [CrossRef]
  48. De-La-Ossa-Carretero, J.A.; Lane, M.F.; Llansó, R.J.; Dauer, D.M. Classification efficiency of the B-IBI comparing water body size classes in Chesapeake Bay. Ecol. Indic. 2016, 63, 144–153. [Google Scholar] [CrossRef]
  49. Pelletier, M.C.; Gold, A.J.; Heltshe, J.F.; Buffum, H.W. A method to identify estuarine macroinvertebrate pollution indicator species in the Virginian Biogeographic Province. Ecol. Indic. 2010, 10, 1037–1048. [Google Scholar] [CrossRef]
  50. Barbour, M.T.; Gerritsen, J.; Griffith, G.E.; Frydenborg, R.; Mccarron, E.; White, J.S.; Bastian, M.L. A framework for biological criteria for Florida streams using benthic macroinvertebrates. J. N. Am. Benthol. Soc. 1996, 15, 185–211. [Google Scholar] [CrossRef]
  51. Baek, S.H.; Son, M.; Kim, D.; Choi, H.W.; Kim, Y.O. Assessing the ecosystem health status of Korea gwangyang and jinhae bays based on a planktonic index of biotic integrity (P-IBI). Ocean. Sci. J. 2014, 49, 291–311. [Google Scholar] [CrossRef]
  52. Zhang, Y.; Ban, X.; Li, E.; Wang, Z.; Xiao, F. Evaluating ecological health in the middle-lower reaches of the Hanjiang River with cascade reservoirs using the Planktonic index of biotic integrity (P-IBI). Ecol. Indic. 2020, 114, 106282. [Google Scholar] [CrossRef]
  53. Kane, D.D.; Gordon, S.I.; Munawar, M.; Charlton, M.N.; Culver, D.A. The Planktonic Index of Biotic Integrity (P-IBI): An approach for assessing lake ecosystem health. Ecol. Indic. 2009, 9, 1234–1247. [Google Scholar] [CrossRef]
  54. Zhang, H.; Duan, Z.; Wang, Z.; Zhong, M.; Tian, W.; Wang, H.; Huang, H. Freshwater lake ecosystem health assessment and its response to pollution stresses based on planktonic index of biotic integrity. Environ. Sci. Pollut. Res. 2019, 26, 35240–35252. [Google Scholar] [CrossRef] [PubMed]
  55. Li, J.; Dong, S.; Peng, M.; Yang, Z.; Liu, S.; Li, X.; Zhao, C. Effects of damming on the biological integrity of fish assemblages in the middle Lancang-Mekong River basin. Ecol. Indic. 2013, 34, 94–102. [Google Scholar] [CrossRef]
  56. You, Q.; Yang, W.; Jian, M.; Hu, Q. A comparison of metric scoring and health status classification methods to evaluate benthic macroinvertebrate-based index of biotic integrity performance in Poyang Lake wetland. Sci. Total Environ. 2021, 761, 144112. [Google Scholar] [CrossRef]
  57. Karr, J.R. Defining and measuring river health. Freshw. Biol. 1999, 41, 221–234. [Google Scholar] [CrossRef] [Green Version]
  58. Zhu, H.; Hu, X.D.; Wu, P.P.; Chen, W.M.; Wu, S.S.; Li, Z.Q.; Zhu, L.; Xi, Y.L.; Huang, R. Development and testing of the phytoplankton biological integrity index (P-IBI) in dry and wet seasons for Lake Gehu. Ecol. Indic. 2021, 129, 107882. [Google Scholar] [CrossRef]
  59. Chutter, F.M. An empirical biotic index of the quality of water in south African streams and rivers. Water Res. 1972, 6, 19–30. [Google Scholar] [CrossRef] [Green Version]
  60. Wang, B.X.; Yang, L.F. A study on tolerance values of benthic macroinvertebrate taxa in Eastern China. Acta Ecol. Sin. 2004, 24, 2768–2775. [Google Scholar]
  61. Wang, J.; Huang, H.; Yang, M.; Tang, Z.; Zhao, F. Tolerance values of benthic macroinvertebrates and bioassessment of water quality in the Lushan Nature Reserve. Chin. J. Appl. Environ. Biol. 2003, 9, 279–284. [Google Scholar]
  62. Hurd, T.M.; Jesic, S.; Jerin, J.L.; Fuller, N.W.; Miller, D. Stable isotope tracing of trout hatchery carbon to sediments and foodwebs of limestone spring creeks. Sci. Total Environ. 2008, 405, 161–172. [Google Scholar] [CrossRef]
  63. Jyväsjärvi, J.; Immonen, H.; Högmander, P.; Högmander, H.; Hämäläinen, H.; Karjalainen, J. Can lake restoration by fish removal improve the status of profundal macroinvertebrate assemblages? Freshw. Biol. 2013, 58, 1149–1161. [Google Scholar] [CrossRef]
  64. Jindal, R.; Thakur, R.K.; Singh, U.B.; Ahluwalia, A.S. Phytoplankton dynamics and species diversity in a shallow eutrophic, natural mid-altitude lake in Himachal Pradesh (India): Role of physicochemical factors. Chem. Ecol. 2014, 30, 328–338. [Google Scholar] [CrossRef]
  65. Tornés, E.; Mor, J.R.; Mandaric, L.; Sabater, S. Diatom responses to sewage inputs and hydrological alteration in Mediterranean streams. Environ. Pollut. 2018, 238, 369–378. [Google Scholar] [CrossRef]
  66. Fausch, K.D.; Karr, J.R.; Yant, P.R. Regional Application of an Index of Biotic Integrity Based on Stream Fish Communities. Trans. Am. Fish. Soc. 1984, 113, 39–55. [Google Scholar] [CrossRef]
  67. Atkinson, A.; Siegel, V.; Pakhomov, E.; Rothery, P. Long-term decline in krill stock and increase in salps within the Southern Ocean. Nature 2004, 432, 100–103. [Google Scholar] [CrossRef]
  68. O’Neil, J.M.; Davis, T.W.; Burford, M.A.; Gobler, C.J. The rise of harmful cyanobacteria blooms: The potential roles of eutrophication and climate change. Harmful Algae 2012, 14, 313–334. [Google Scholar] [CrossRef]
  69. Paerl, H.W.; Otten, T.G. Harmful Cyanobacterial Blooms: Causes, Consequences, and Controls. Microb. Ecol. 2013, 65, 995–1010. [Google Scholar] [CrossRef] [PubMed]
  70. Stoddard, J.L.; Herlihy, A.T.; Peck, D.V.; Hughes, R.M.; Whittier, T.R.; Tarquinio, E. A process for creating multimetric indices for large-scale aquatic surveys. J. N. Am. Benthol. Soc. 2008, 27, 878–891. [Google Scholar] [CrossRef]
  71. Heino, J. Are indicator groups and cross-taxon congruence useful for predicting biodiversity in aquatic ecosystems? Ecol. Indic. 2010, 10, 112–117. [Google Scholar] [CrossRef]
Figure 1. Position of the study area within China and locations of the sampling sites in the Ganjiang River system. The yellow, red, and green dots indicate fish sites, benthic macroinvertebrate sites, and phytoplankton sites, respectively.
Water 14 00278 g001
Figure 2. Species composition of fish, benthic macroinvertebrates, and phytoplankton in the Ganjiang River system, 2016–2017.
Water 14 00278 g002
Figure 3. Ordination diagram of the RDA and CCA results obtained based on environmental factors (in Table 3) and communities of: (a) fishes, (b) benthic macroinvertebrates, and (c) phytoplankton. ASL indicates the above sea level, WT indicates water temperature, DO indicates dissolved oxygen, Cond indicates conductivity, CODMn indicates chemical permanganate index, BOD indicates biochemical oxygen demand, CODCr indicates dichromate oxidizability, NH3-N indicates ammonia-nitrogen concentration, and TP indicates total phosphorus.
Water 14 00278 g003aWater 14 00278 g003b
Figure 4. Box plots of the 14 candidate metrics for B-IBI with IQ ≥ 2 between the reference and impaired sites. In the graphs, R indicates reference sites, and I indicates impaired sites. M’1–M’38 correspond to M’1–M’38 in Table 1.
Water 14 00278 g004
Figure 5. Ecosystem health assessment results for the Ganjiang River system obtained using the F-IBI in: (a) autumn, (b) winter, (c) spring, and (d) summer; the B-IBI in (e) autumn, (f) winter, (g) spring, and (h) summer; and the P-IBI in (i) autumn, (j) winter, (k) spring, and (l) summer. The red, orange, yellow, light green, and green dots indicate extremely poor, poor, fair, good, and healthy sites, respectively.
Water 14 00278 g005
Table 1. Candidate metrics for IBIs and their responses to human disturbances.
Metrics and Groups
F-IBIB-IBIP-IBI
Species CompositionSpecies CompositionSpecies Composition
M1 Total taxa% (↓)M’1 Total taxa (↓)M’’1 Total taxa (↓)
M2 Cypriniformes taxa% (↑)M’2 EPT taxa (↓)M’’2 Cyanobacteria taxa (↑)
M3 Cyprinidae taxa% (↑)M’3 Ephemeroptera taxa (↓)M’’3 Chlorophyta taxa (↓)
M4 Gobioninae taxa% (↑)M’4 Trichoptera taxa (↓)M’’4 Bacillariophyta taxa (↑)
M5 Culterinae taxa% (↓)M’5 Diptera taxa (↓)M’’5 Except Bacillariophyta taxa (↓)
M6 Rhodeinae taxa% (↓)M’6 Coleoptera taxa (↓)
M7 Barbinae taxa% (↑)M’7 Plecoptera taxa (↓)M’’6 Total density (↓)
M8 Cobitidae taxa% (↑)M’8 Crustacea + Molluscs taxa (↓)Relative abundance
M9 Perciformes taxa% (↓)M’9 Aquatic insect taxa (↓)M’’7 Chlorophyta taxa% (↓)
M10 Serranidae taxa% (↓)M’10 Chironomidae taxa (↑)M’’8 Bacillariophyta taxa%
(↑)
M11 Siluriformes taxa% (↑)Relative abundance
M12 Bagridae taxa% (↓)M’11 EPT % (↓)M’’9 Achnanthes taxa% (↓)
Ecological typesM’12 EpheMeroptera % (↓)M’’10 Cymbella taxa% (↓)
M13 Migration fishes taxa% (↓)M’13 Trichoptera % (↓)M’’11 Nitzschia taxa% (↑)
M14 Freshwater fishes taxa% (↓)M’14 Diptera % (↑)M’’12 Naviculataxa% (↑)
M15 Settled fishes taxa% (↑)M’15 Coleoptera % (↓)M’’13 Cyanobacteria taxa%
(↑)
Nutrition structureM’16 Plecoptera % (↓)
M16 Epipelagic fishes% (↓)M’17 Chironomidae % (↑)Biodiversity Index
M17 Mesopelagic fishes% (↓)M’18 Crustacea + Molluscs % (↑)M’’14 Shannon–Wiener index (↓)
M18 Demersal fishes% (↓)M’19 Oligochaeta % (↑)M’’15 Simpson index (↓)
M19 Predatory fishes% (↓)M’20 Oligochaetes/Hirudinea (↑)M’’16 Margalef index (↓)
M20 Herbivorous fishes% (↓)M’21 Tubificidae % (↑)M’’17 Pielou index (↓)
M21 Omnivorous fishes% (↑)Dominant groupNutrition structure
Breeding groupM’22 Dominant taxon % (↑)M’’18 Cyanobacteria density% (↑)
M22 Fish species spawning adhesive eggs% (↑)M’23 Top 3 dominant taxon % (↑)
Pollution toleranceM’’19 Chlorophyta density%
(↓)
M23 Fish species spawning drifting eggs% (↓)M’24 Tolerant taxa (↑)
M’25 Tolerant % (↑)M’’20 Bacillariophyta density%
(↑)
M24 Fish species spawning demersal eggs% (↓)M’26 Intolerant taxa (↓)
M’27 Intolerant % (↓)M’’21Cyanobacteria+ Chlorophyta density% (↓)
M25 Fish species with special spawning types% (↓)M’28 Biotic index [59,60,61] (↑)
Functional feeding groupM’’22 Chlorophyta+ Bacillariophyta density% (↓)
Pollution toleranceM’29 Collect-Gatherers % (↑)
M26 Sensitive taxa% (↓)M’30 Filterers % (↑)M’’23 Diatom quotient (↓)
M27 Sensitive % (↓)M’31 Scrapers % (↓)M’’24 Cocconeis+ Nitzschia+ Synedra% (↑)
M28 Tolerant taxa% (↑)M’32 Predators % (↓)
M29 Tolerant% (↑)M’33 Shredders % (↓)Ecological types
Resources and health conditionHabitat qualityM’’25 Mobile diatom percentage (↑)
M30 Individual number (↓)M’34 Clingers taxa (↓)
M31 Shannon-Wiener index% (↓)M’35 Clingers % (↓)
M32 Simpson index (↓)Biodiversity Index
M33 Margalef index (↓)M’36 Shannon-Wiener index (↓)
M34 Pielou index (↓)M’37 Simpson index (↓)
M35 Alien species% (↑)M’38 Margalef index (↓)
M36 Deformity and disease% (↑)M’39 Pielou index (↓)
Note: ↓ signifies that the metrics increase with an increasing disturbance intensity; ↑ signifies that the metrics decrease with an increasing disturbance intensity; EPT stands for Ephemeroptera, Plecoptera and Trichoptera; Biotic index = tolerance values/Individual number; Diatom quotient = Centricae taxa/Pennatae taxa.
Table 2. Dominant (calculated by applying the McNaughton index) fish, benthic macroinvertebrate, and phytoplankton species in the Ganjiang River.
Dominant SpeciesDominance Index
Fish
Acrossocheilus parallens0.05
Saurogobio dabryi0.02
Squalidus argentatus0.05
Benthic macroinvertebrate
Limnodrilus hoffmeisteri0.05
Corbicula fluminea0.03
Phytoplankton
Navicula simplex0.06
Ankistrodesmus angustus0.03
Crucigenia apiculata0.02
Cyclotella meneghiniana0.02
Table 3. Mean value and standard deviations of local environmental variables in the Ganjiang River system.
Main StreamBranches of the UpstreamBranches of the MidstreamBranches of the DownstreamChi-Square Test (χ2)p
ASL(m)61.4 ± 42.3197.2 ± 49.1150.3 ± 15177.9 ± 8.8114.546<0.001 *
WT(℃)22.3 ± 6.822.4 ± 7.122.2 ± 722.7 ± 7.30.3460.951
pH8.14 ± 0.927.96 ± 0.728.07 ± 0.817.98 ± 0.831.0040.800
DO(mg/L)10.11 ± 1.599.95 ± 1.610.31 ± 1.29.73 ± 1.541.190.755
CODMn(mg/L)3.46 ± 2.652.9 ± 2.93.36 ± 2.723.82 ± 2.7422.23<0.001 *
BOD(mg/L)1.44 ± 0.570.89 ± 0.541.36 ± 0.432.03 ± 0.7550.339<0.001 *
NH3-N(mg/L)0.49 ± 0.490.24 ± 0.240.43 ± 0.370.76 ± 0.6821.356<0.001 *
TP(mg/L)0.09 ± 0.10.06 ± 0.090.09 ± 0.050.12 ± 0.0421.488<0.001 *
CODCr(mg/L)8.27 ± 6.186.57 ± 4.686.2 ± 4.097.93 ± 5.435.0960.165
Cond(s/cm)77.79 ± 43.9271.64 ± 50.5161.83 ± 36.3163.06 ± 34.047.030.071
* p < 0.05.
Table 4. Grades of health assessment using IBIs in the Ganjiang River system.
HealthyGoodFairPoorExtremely Poor
F-IBI≥3.142.36–3.141.57–2.360.79–1.57<1.57
B-IBI≥3.222.42–3.221.61–2.420.81–1.61<0.81
P-IBI≥2.381.79–2.381.19–1.790.60–1.19<0.60
Table 5. Stepwise linear regression results for F-IBI, B-IBI, and P-IBI in response to environmental factors (in Table 3) in the Ganjiang River system.
ConstantASLWTpHDOCODMnBODNH3-NTPCODCrCondp
F-IBI3.642−0.004 0.000
B-IBI−1.3480.006−0.059 0.447 2.318 0.000
P-IBI5.514 0.038 −0.163 −0.872.2370.064 0.000
Publisher’s Note: MDPI stays neutral with regard to jurisdictional claims in published maps and institutional affiliations.

